Submitted:
30 August 2024
Posted:
02 September 2024
You are already at the latest version
Abstract
Diabetic wound (DW) is the most devastating complication resulting in significant mortality and morbidity in diabetic patients. Although the pathophysiology of DWs is multifaceted, evidence revealed that prolonged inflammation with infections, extracellular matrix (ECM) degradation and unnecessary NETosis impair DW healing. This theoretical problem commands the necessity of developing a novel strategy focused on targeting the 'specific' molecular modalities of DW. The primary culprits, matrix metalloproteinase (MMP)-9 and protein kinase C (PKC)-βII, are responsible for impaired angiogenesis, NETosis, and ECM degradation. Thus, there is reinvigorated interest in identifying selective inhibitors for the effective management of DW. The current study exemplified human β-defensin-2 (HBD-2), a biological macromolecule as a dual-inhibitor of MMP-9 and PKC-βII using protein-protein docking and molecular dynamics simulation studies. Residue-residue interactions and binding affinity were investigated using Z-dock. Chemical bonding behavioral changes, structural dynamics, and functional changes were determined using GROMACS by analyzing RMSD, ROG, RMSF, SASA, FEL, and PCA. Overall, the data analysis revealed that HBD-2 possesses strong binding affinity and stability against MMP-9 and PKC-βII, which can be an ideal therapeutic for the accelerated healing of DW. The study provides valuable insights into the molecular mechanisms underlying hBD-2's potential therapeutic effects, offering new avenues for the development of innovative treatment strategies. The clinical relevance of our findings lies in their potential to inform the development of new approaches for diabetic wound management, addressing a significant healthcare concern.
Keywords:
Diabetic wound
; Human β-defensin-2
; Matrix metalloproteinase-9
; Protein kinase C-βII
; Protein-protein docking
; Molecular dynamics simulation studies
1. Introduction
The Diabetic wound (DW) is a late-stage complication of diabetes mellitus (DM) that emanates from interplay amongst inflammation, vasculopathy, neuropathy, and impaired tissue regeneration, all under the background of insulin resistance [1,2]. Although various therapeutic approaches such as pressure off-loading, debridement, and infection control, the management of DW is still in its infancy. The treatment of DW is complex because optimization of glycaemic control has little or no effect; hence, the unique etiopathogenic connotation between DM and DW becomes less relevant at later phases of disease progression [3]. This theoretical problem commands the necessity of developing a novel strategy focused on targeting the ‘specific’ molecular modalities of DW.
The major pathogenic manifestations of impaired healing of DW are an abnormal neutrophil response to the injury and insufficient vascular supply, causing prolonged inflammation and recurrent tissue damage [4]. In general, an extracellular trap (NET) is formed by the active neutrophils with proteins and chromatin granules to protect the wound from infection [5,6,7]. But, in DW, various pathological conditions desensitize neutrophils and favor cellular death by releasing nuclear materials within NETs (NETosis) [8,9].
Gratifyingly, many shreds of evidence exemplified that NETosis and angiogenesis are controlled by the single enzyme protein kinase C-βII (PKC-βII) [10,11,12,13]. Due to excess glycolytic and diacylglycerol production in diabetic conditions, PKC-βII levels are increased and its accumulation results in impaired NETosis and angiogenesis by desensitizing neutrophils and downregulating endothelial nitric oxide synthase, respectively [10,11,12,14,15].
In addition, one more culprit for the prolonged inflammation in DW is a matrix metalloproteinase (MMP)-9, which is highly expressed in inflammatory cells and wound cells [16]. Elevated levels of this enzyme degrade the formed ECM, which delays the DW healing [17,18].
In this scenario, inhibiting PKC-βII and MMP-9 with a single therapeutic agent might be more effective in targeting the multifaceted DW.
Antimicrobial peptides (AMPs) are a part of the innate immune system capable of fighting against infections [19,20]. AMPs have been presented as a potential new antimicrobial class, partly due to their lower susceptibility to bacterial resistance evolution. In addition, they have also been recognized for their potent wound healing activity [21,22]. Human beta defensins (HBDs) are well-categorized AMPs with broad-spectrum activity and are predominantly secreted from leukocytes and epithelial tissues. These are of six types: HBD-1, HBD-2, HBD-3, HBD-4, HBD-5, HBD-6. Among them, HBDs (1-4) are recognized in various parts of the human body, and HBDs (5&6) have been identified recently in human epididymis [23].
HBD-2 is a cationic, antimicrobial peptide discovered in the year 1976, which is a part of innate and adaptive immunity. It comprises 41 amino acids with a gene of 4kb, expressed mainly in the skin, epithelium, and mucous. In general, HBD-2 consists of six cysteine residues at positions 1-5, 2-4, and 3-6, united by three disulphide bridges [24,25,26]. The secondary structure of HBD-2 reveals the presence of an α-helix, three β-sheets organized in an antiparallel mode in N-terminal region and C-terminal region (Figure 1).
The basic folding of the peptide is possible by the disulphide bonds between the α-helix and first β-sheet, which possess a domain of Gly-X-CysIV. Though, the active site present in the N-terminal region, antimicrobial activity of the peptide is mainly because of the presence of cationic residues present in the C-terminal region of the peptide. Remaining biological properties of the peptide is dependent on specific conformation of N-terminal region of the HBD-2. Further, its amphipathic nature and the presence of disulphide bridges is responsible for resistance to degradation by proteases [27,28]. Hence, HBD-2 a biological macromolecule is selected as a ligand for the preliminary computational study with an anticipation to accelerate DW healing by inhibiting PKC-βII and MMP-9 enzymes.
2. Materials and Methods
2.1. Protein-Protein Docking Studies
The The protein 3D X-ray crystal structures of MMP-9 and PKC were retrieved from RCSB-PDB database with PDB IDs of 4XCT and 2I0E. Each receptor structure was validated using PROCHECK programs and ProSA-web [29,30]. Energy refinement was achieved by adding hydrogen atoms and assigning partial charges.
The 3D X-ray crystal structure of HBD-2 was retrieved from the database and considered as ligand in the docking studies. Protein-protein docking was performed by discovery studio using default parameters (2000 protein poses and 15 angular step size) Z-DOCK protocol (http://zdock.umassmed.edu/). Z-DOCK is usually a grid-based algorithm using novel shape-complementarity scoring function. To start the protocol, parallel processing was kept at “false” and Z-Rank at “True”.
2.2. Molecular Dynamics Simulation (MDS) Studies
The complex structures of MMP-9 and PKC-II with HBD-2 as a ligand protein identified from Z-Dock pose were subjected to MDS studies. When compared with docking studies, MDS studies provide better insights of ligand binding [31]. System preparation of both the complexes was carried out using the procedure reported by Gangadharappa et al., 2020 and Prasanth et al., 2021 [32,33]. GROMACS simulation package was utilized to analyze the simulated data of two complexes. Root mean square deviation (RMSD) and root mean square fluctuations (RMSF) were employed to analyze the backbone atoms and C-α fluctuations, respectively. Further, radius of gyration was computed to determine the “extendedness” of the protein residues. All these calculations were performed using various utilities like “gmxrms”, “gmxrmsf”, “gmx select”, and “gmx gyrate.”
2.3. Free Energy Calculation (MM-PBSA)
It is the method employed to obtain insights into the protein-protein interactions by calculating interaction free energies. The free energy was computed using the g_mmpbsa, utility of the gromacs [34]. To validate the MD result, the last 500-1000 ns of the MD trajectories were chosen to obtain free energy.
2.4. Principal Component (PC) and Free Energy Landscape (FEL) Analysis
PC was usually carried out to generate mass-weighted covariance matrix (CM) of the protein atom displacement, indicates the collective and dominant modes of the receptor throughout the simulation studies of the MD trajectory [35,36]. CM is diagonalized to extract a set of eigenvalues and eigenvectors using g_covar (GROMACS utility), which indicates the concerted molecule motion. In addition, eigenvectors were analyzed and plotted using g_anaeig tool, available in GROMACS [37,38]. Further, the results obtained from PC analysis were subjected to FEL analysis. The g_covar and g_anaeig utilities were employed to identify the changes in the motion patterns of both the complexes [39,40].
3. Results and Discussion
3.1. Protein-Protein Docking Studies
Protein-protein docking was performed for HBD-2 (PDB ID: IFD3) against two receptors MMP-9 (PDB ID: 4XCT) and PKC-βII (PDB ID: 2I0E) to recognize the potential ligand for accelerated healing of DW. Although so many conformations were generated (Table 1), the top scored conformation was given preference and used for the further analysis. PDBsum and Pymol visualization tools were used analyse protein-protein interactions. Depending on the binding interactions, two conformations were selected and has exhibited a significant Z-score -118.026 (4XCT) and -140.319 (2I0E).
3.2. Molecular Interaction Studies of Top-Ranked Complex HBD-2/4XCT.
The protein-protein interactions were tabulated in Table 2. The amino acid residues involved in the protein-protein interactions were obtained using the PDB sum of the 3D structure of the complex HBD-2/4XCT. From the analysis, it was clear that only 15 residues of HBD-2 (chain B) and 19 residues of 4XCT (chain A) (Figure 2a). It was observed that the complex exhibits a total of 6 hydrogen-bonding and 237 non-bonded interactions (Figure 2b). Amongst six hydrogen bonds, only two were found to be prominent as depicted in Figure 2c. The remaining hydrogen bonds were not visible as the distance is greater than 2.5 Å. The >C=O and -NH group of Tyr248 exhibited two hydrogen bonding interactions with -NH2 (>C=O⋯HN(H), 1.7 Å) and >C=O (-NH⋯O=C<, 2.2 Å) group of Lys279, respectively. Moreover, the complex was stabilized by the occurrence of non-bonded contacts between the residues.
3.3. Molecular Interaction Studies of Top-Ranked Complex HBD-2/2I0E.
The protein-protein interactions were depicted in Table 3. The protein-protein interacting residues were analysed using the PDBsum of the 3D structure of the top-ranked complex HBD-2/2I0E. During analysis, it was observed a total of 18 residues of HBD-2 (chain B) and 22 residues of 2I0E (chain A) were involved in the interactions (Figure 3a). Further the complex exhibited 2 hydrogen-bonding, 4 salt-bridge and 154 non-bonded contact interactions within the catalytic pocket of 2I0E (Figure 3b). The two hydrogen bonds were found to be prominent and was depicted in Figure 3c. The >C=O of Lys468 (chain A) showed a hydrogen bond with the side chain -NH2 group of Gln695 (chain B) (>C=O⋯HN(H), 1.5 Å). Another hydrogen bond was observed between the >C=O of Gly543 (Chain A) and -NH group of Lys679 (chain B) (-NH⋯O=C<, 2.1 Å). In addition, the complex was found to stabilized due the formation of non-bonded contacts and salt-bridge interactions between the residues.
3.4. Molecular Dynamics (MD) Simulation Analysis of Two Complexes HBD-2/4XCT and HBD-2/2I0E.
A 1000 ns MD simulation studies were performed for each of the docked complexes to explore the protein-protein complex stability and dynamic properties. Average values of every parameter of the two complexes HBD-2/4XCT and HBD-2/2I0E was calculated from their MD trajectories has been tabulated in Table 4. GROMACS simulation package was used to analyse the simulation data. Various gromacs utilities such as “gmxrms”, “gmx select”, “gmrmsf”, and gmx gyrate were used to compute RMSD (backbone atoms), RMSF (Cα) and radius of gyration, respectively.
RMSD images depicts the moving parts and spatial displacement rate of the protein model during MD simulation and also serves as a measure of receptor stability.
The lowers values of RMSD corresponds to protein stability during the simulation and the acceptable average value for a protein is ≤ 0.4 nm. It was observed that average RMSD values for both the complexes were less than 0.4 nm (Table 4). RMSD diagrams were plotted for 1000 ns of MD study with both the complexes HBD-2/4XCT (Figure 4a) and HBD-2/2I0E (Figure 4b). In both the complexes, the systems attained equilibrium after 200 ns. The average RMSD value of complex HBD-2/4XCT was found to 0.303±0.01 nm whereas for the complex HBD-2/2I0E, the value was 0.399±0.06 nm.
Further, RMSF was calculated to determine the dynamic behaviour of the Cα atoms and backbone flexibility of the protein, which in turn useful to investigate each motion that corresponds to the general motion of the protein. The higher values of RMSF correspond to the greater flexibility of the backbone residues during the simulation. RMSFs were plotted for both the complexes HBD-2/4XCT (Figure 5a) and HBD-2/2I0E (Figure 5b) for the 1000 ns MD study. The average RMSF values were found to be 0.338±0.098 nm and 0.451±0.330 nm for HBD-2/4XCT and HBD-2/2I0E, respectively (Table 4).
In case of HBD-2/4XCT, Asp185 to Pro310 lies in the catalytic pocket or protein-protein interface. A total of seven hydrogen bonding interactions were observed between the residues of HBD-2 and 4XCT (Figure 6a). Whereas, in the HBD-2/2I0E, protein-protein interface was occupied with residues Ile671 to Pro710. Approximately eight hydrogen bonding interactions were observed at the interface of MD trajectory pose of the complex HBD-2/2I0E (Figure 6b).
Radius of gyration (ROG) parameter depicts the protein structure compression or folding behaviour during MD simulation. The lower ROG values 1.633±0.034 nm and 2.063±0.024 nm was obtained for the HBD-2/4XCT and HBD-2/2I0E, respectively (Table 4) indicating no conformation of distortion and increased compactness during the MD study (Figure 7a,b).
Further, protein-protein solvent-accessible surface-area (SASA) was computed for both the complexes and represented in Figure 8a (HBD-2/4XCT) and 8b (HBD-2/2I0E). As SASA indicates the solvent replacement phenomenon, lower values indicate that the catalytic pocket is less solvent-exposed and the ligand retains within the catalytic site throughout the study. The average SASA values of 101.278±0.640 nm2 and 183.409±21.349 nm2 was obtained for the HBD-2/4XCT and HBD-2/2I0E, respectively (Table 4), indicating that the HBD-2 has been deeply resided within the binding pockets of 4XCT and 2I0E.
3.5. Binding Free Energy Calculations-MMPBSA Approach (∆Gbind)
The ∆Gbind was computed for both the complexes for each 100 ns of the last 500 ns MD trajectories. The average values of ∆Gbind, Van der Waals (Vdws), electrostatic (E), polar solvation (PS) and SASA energies were computed and tabulated in Table 5. The average ∆Gbind was found to be -2318.73±35.46 kJ/mol for HBD-2/4XCT and -2329.62±61.24 kJ.mol for HBD-2/2I0E complexes, indicating the greater stability of HBD-2 within the catalytic pocket of the both the residues. In addition, the complexes possess significant VdWs, E, SASA and PS, indicating complete burial of HBD-2 and affinity within the catalytic pockets of 4XCT and 2I0E.
3.6. Principal Component (PC) and Free Energy Landscape Analysis
PC analysis is a powerful approach to understanding the motion changes of complexes during MD simulation studies. Diagonalization of the covariance matrix of the Cα atom fluctuations can be analyzed through eigenvalues and was represented in Supp-Figure S1a and S1b, with eigenvector indices. In the case of both the complexes HBD-2/4XCT and HBD-2/2I0E first few eigenvalues relative to the concerted motions, define essential subspace, where the majority of the motions take place. In addition, the eigenvalues were observed to decrease in amplitude in order to reach the more localized fluctuation and constrained numbers (Figure 9a,b).
Further, the deviations found during PC analysis were assessed by computing free energy landscape (FEL) studies. FEL is mainly to evaluate the conformational changes in the biomolecule corresponding with the free energy obtained during the protein-protein interaction and complex formation. The blue regions (higher ∆Gbind) favor an unfolding state of protein whereas the red spots indicate the folding state of the protein. From the FEL plots, it is evident that the two complexes exhibited higher ∆Gbind values or blue spots (Figure 10a,b).
Furthermore, these complexes equilibrated with high coverage of eigenvectors. Almost >95% of total fluctuations were because of the residues in the protein-protein interface. These results can be correlated with the physiological condition as both complexes might be formed more frequently and have attained greater degrees of stability. To visualize a simple, conformational landscape, different frames with a similar conformation were analyzed. The RMSD to native bound structure is also calculated from the 1000 ns trajectory (Supp-Figure 2a and 2b).
4. Conclusions
In summary, the structural properties of interactions, stability and dynamic features of HBD-2 with MMP-9 and PKC β-II were characterized using computational strategies. The results suggest that the amino acid residues present in protein-protein interface which participated in the interactions are vital for the functional activity of the receptors. The docking results were astonishing as the both the top-ranked poses significant Z score. The binding affinity was supported by MD simulation studies. The RMSD, RMSF, SASA, ∆Gbind, PC analysis and FEL analysis clearly demonstrated the structural and behavioral changes of the residues during MD study, which can directly correlate to physiological behavior of proteins. Henceforth, HBD-2 can be directly used as dual-inhibitor of MMP-9 and PKC β-II and developed as a therapeutic for accelerating the DW healing.
Supplementary Materials
The following supporting information can be downloaded at: www.mdpi.com/xxx/s1, Figure S1: The plot of Eigenvalues and eigenvector index obtained through principal component analysis of (a) HBD-2/4XCT complex (b) HBD-2/2I0E complex; Figure S2: Free energy landscape built using the radius of gyration and RMSD to an average structure of (a) HBD-2/4XCT and (b) HBD-2/2I0E. Lower free energy corresponds to more populated regions of the landscape.
Author Contributions
Writing-Original Draft, Data Curation, Software, Validation, Vidyasrilekha. Sanapalli; Writing-Reviewing and editing, Formal Analysis, Dilep Kumar. Sigalapalli; Reviewing and editing, Afzal B. Shaik; Reviewing and editing, Funding Acquisition, Richie R. Bhandare; Writing-Reviewing and editing, Conceptualization, Supervision, Bharat Kumar Reddy. Sanapalli.
Funding
This research received no external funding.
Institutional Review Board Statement
Not applicable.
Informed Consent Statement
Not applicable.
Data Availability Statement
No new data were created.
Conflicts of Interest
The authors declare no conflicts of interest.
References
- Prentki, M.; Nolan, C.J. Islet β cell failure in type 2 diabetes. The Journal of clinical investigation 2006, 116, 1802–1812. [Google Scholar] [CrossRef] [PubMed]
- Anselmo, M.I.; Nery, M.; Parisi, M.C. The effectiveness of educational practice in diabetic foot: a view from Brazil. Diabetology & Metabolic Syndrome 2010, 2, 1–4. [Google Scholar]
- Jirkovska, A. Basic questions in therapy of the diabetic foot. Vnitrni Lekarstvi 2002, 48, 542–548. [Google Scholar] [PubMed]
- Lipsky, B.A.; Berendt, A.R.; Cornia, P.B.; Pile, J.C.; Peters, E.J.; Armstrong, D.G.; Deery, H.G.; Embil, J.M.; Joseph, W.S.; Karchmer, A.W. 2012 Infectious Diseases Society of America clinical practice guideline for the diagnosis and treatment of diabetic foot infections. Clinical infectious diseases 2012, 54, e132–e173. [Google Scholar] [CrossRef] [PubMed]
- Demidova-Rice, T.N.; Durham, J.T.; Herman, I.M. Wound healing angiogenesis: innovations and challenges in acute and chronic wound healing. Advances in wound care 2012, 1, 17–22. [Google Scholar] [CrossRef] [PubMed]
- Ryckman, C.; Gilbert, C.; de Médicis, R.; Lussier, A.; Vandal, K.; Tessier, P.A. Monosodium urate monohydrate crystals induce the release of the proinflammatory protein S100A8/A9 from neutrophils. Journal of leukocyte biology 2004, 76, 433–440. [Google Scholar] [CrossRef]
- Busso, N.; So, A. Gout. Mechanisms of inflammation in gout. Arthritis research & therapy 2010, 12, 1–8. [Google Scholar]
- Wong, S.L.; Demers, M.; Martinod, K.; Gallant, M.; Wang, Y.; Goldfine, A.B.; Kahn, C.R.; Wagner, D.D. Diabetes primes neutrophils to undergo NETosis, which impairs wound healing. Nature medicine 2015, 21, 815–819. [Google Scholar] [CrossRef]
- Fadini, G.P.; Menegazzo, L.; Rigato, M.; Scattolini, V.; Poncina, N.; Bruttocao, A.; Ciciliot, S.; Mammano, F.; Ciubotaru, C.D.; Brocco, E. NETosis delays diabetic wound healing in mice and humans. Diabetes 2016, 65, 1061–1071. [Google Scholar] [CrossRef]
- Wang, F.; Huang, D.; Zhu, W.; Li, S.; Yan, M.; Wei, M.; Li, J. Selective inhibition of PKCβ2 preserves cardiac function after myocardial infarction and is associated with improved angiogenesis of ischemic myocardium in diabetic rats. International journal of molecular medicine 2013, 32, 1037–1046. [Google Scholar] [CrossRef]
- Huang, D.; Wang, F.-B.; Guo, M.; Li, S.; Yan, M.-L.; Yu, T.; Wei, M.; Li, J.-B. Effect of combined treatment with rosuvastatin and protein kinase Cβ2 inhibitor on angiogenesis following myocardial infarction in diabetic rats. International Journal of Molecular Medicine 2015, 35, 829–838. [Google Scholar] [CrossRef] [PubMed]
- Gray, R.D.; Lucas, C.D.; MacKellar, A.; Li, F.; Hiersemenzel, K.; Haslett, C.; Davidson, D.J.; Rossi, A.G. Activation of conventional protein kinase C (PKC) is critical in the generation of human neutrophil extracellular traps. Journal of inflammation 2013, 10, 1–8. [Google Scholar] [CrossRef] [PubMed]
- Fadini, G.; Menegazzo, L.; Scattolini, V.; Gintoli, M.; Albiero, M.; Avogaro, A. A perspective on NETosis in diabetes and cardiometabolic disorders. Nutrition, Metabolism and Cardiovascular Diseases 2016, 26, 1–8. [Google Scholar] [CrossRef]
- DEKKER, L.V.; LEITGES, M.; ALTSCHULER, G.; MISTRY, N.; MCDERMOTT, A.; ROES, J.; SEGAL, A.W. Protein kinase C-β contributes to NADPH oxidase activation in neutrophils. Biochemical Journal 2000, 347, 285–289. [Google Scholar] [CrossRef]
- Neeli, I.; Radic, M. Opposition between PKC isoforms regulates histone deimination and neutrophil extracellular chromatin release. Frontiers in immunology 2013, 4, 38. [Google Scholar] [CrossRef]
- Jones, J.I.; Nguyen, T.T.; Peng, Z.; Chang, M. Targeting MMP-9 in diabetic foot ulcers. Pharmaceuticals 2019, 12, 79. [Google Scholar] [CrossRef]
- McLennan, S.; Yue, D.; Twigg, S. Molecular aspects of wound healing in diabetes. Primary Intention: The Australian Journal of Wound Management 2006, 14. [Google Scholar]
- Ambrozova, N.; Ulrichova, J.; Galandakova, A. Models for the study of skin wound healing. The role of Nrf2 and NF-κB. Biomedical Papers of the Medical Faculty of Palacky University in Olomouc 2017, 161. [Google Scholar] [CrossRef]
- Fjell, C.D.; Hiss, J.A.; Hancock, R.E.; Schneider, G. Designing antimicrobial peptides: form follows function. Nature reviews Drug discovery 2012, 11, 37–51. [Google Scholar] [CrossRef]
- Mohanty, T.; Alberius, P.; Schmidtchen, A.; Reiss, K.; Schröder, J.M.; Sørensen, O. Saliva induces expression of antimicrobial peptides and promotes intracellular killing of bacteria in keratinocytes by epidermal growth factor receptor transactivation. British Journal of Dermatology 2017, 176, 403–412. [Google Scholar] [CrossRef]
- Baroni, A.; Donnarumma, G.; Paoletti, I.; Longanesi-Cattani, I.; Bifulco, K.; Tufano, M.A.; Carriero, M.V. Antimicrobial human beta-defensin-2 stimulates migration, proliferation and tube formation of human umbilical vein endothelial cells. Peptides 2009, 30, 267–272. [Google Scholar] [CrossRef] [PubMed]
- Griffith, G.L.; Kasus-Jacobi, A.; Pereira, H.A. Bioactive antimicrobial peptides as therapeutics for corneal wounds and infections. Advances in wound care 2017, 6, 175–190. [Google Scholar] [CrossRef] [PubMed]
- Niyonsaba, F.; Nagaoka, I.; Ogawa, H.; Okumura, K. Multifunctional antimicrobial proteins and peptides: natural activators of immune systems. Current pharmaceutical design 2009, 15, 2393–2413. [Google Scholar] [CrossRef]
- Bruhn, O.; Grötzinger, J.; Cascorbi, I.; Jung, S. Antimicrobial peptides and proteins of the horse-insights into a well-armed organism. Veterinary research 2011, 42, 1–22. [Google Scholar] [CrossRef] [PubMed]
- Corrales-Garcia, L.; Ortiz, E.; Castañeda-Delgado, J.; Rivas-Santiago, B.; Corzo, G. Bacterial expression and antibiotic activities of recombinant variants of human β-defensins on pathogenic bacteria and M. tuberculosis. Protein expression and purification 2013, 89, 33–43. [Google Scholar] [CrossRef] [PubMed]
- Machado, L.R.; Ottolini, B. An evolutionary history of defensins: a role for copy number variation in maximizing host innate and adaptive immune responses. Frontiers in immunology 2015, 6, 115. [Google Scholar] [CrossRef]
- Hans, M.; Madaan Hans, V. Epithelial antimicrobial peptides: guardian of the oral cavity. International journal of peptides 2014, 2014. [Google Scholar] [CrossRef]
- Underwood, M.; Bakaletz, L. Innate immunity and the role of defensins in otitis media. Current allergy and asthma reports 2011, 11, 499–507. [Google Scholar] [CrossRef]
- Laskowski, R.A.; MacArthur, M.W.; Moss, D.S.; Thornton, J.M. PROCHECK: a program to check the stereochemical quality of protein structures. Journal of applied crystallography 1993, 26, 283–291. [Google Scholar] [CrossRef]
- Wiederstein, M.; Sippl, M.J. ProSA-web: interactive web service for the recognition of errors in three-dimensional structures of proteins. Nucleic acids research 2007, 35, W407–W410. [Google Scholar] [CrossRef]
- Schüttelkopf, A.W.; Van Aalten, D.M. PRODRG: a tool for high-throughput crystallography of protein–ligand complexes. Acta Crystallographica Section D: Biological Crystallography 2004, 60, 1355–1363. [Google Scholar] [CrossRef]
- Gangadharappa, B.S.; Sharath, R.; Revanasiddappa, P.D.; Chandramohan, V.; Balasubramaniam, M.; Vardhineni, T.P. Structural insights of metallo-beta-lactamase revealed an effective way of inhibition of enzyme by natural inhibitors. Journal of Biomolecular Structure and Dynamics 2020, 38, 3757–3771. [Google Scholar] [CrossRef] [PubMed]
- Prasanth, D.; Murahari, M.; Chandramohan, V.; Panda, S.P.; Atmakuri, L.R.; Guntupalli, C. In silico identification of potential inhibitors from Cinnamon against main protease and spike glycoprotein of SARS CoV-2. Journal of Biomolecular Structure and Dynamics 2021, 39, 4618–4632. [Google Scholar] [CrossRef] [PubMed]
- Kumari, R.; Kumar, R.; Consortium, O.S.D.D.; Lynn, A. g_mmpbsa A GROMACS tool for high-throughput MM-PBSA calculations. Journal of chemical information and modeling 2014, 54, 1951–1962. [Google Scholar] [CrossRef] [PubMed]
- Ringnér, M. What is principal component analysis? Nature biotechnology 2008, 26, 303–304. [Google Scholar] [CrossRef]
- Amadei, A.; Linssen, A.B.; Berendsen, H.J. Essential dynamics of proteins. Proteins: Structure, Function, and Bioinformatics 1993, 17, 412–425. [Google Scholar] [CrossRef]
- Maisuradze, G.G.; Leitner, D.M. Free energy landscape of a biomolecule in dihedral principal component space: Sampling convergence and correspondence between structures and minima. Proteins: Structure, Function, and Bioinformatics 2007, 67, 569–578. [Google Scholar] [CrossRef]
- Hess, B. Similarities between principal components of protein dynamics and random diffusion. Physical Review E 2000, 62, 8438. [Google Scholar] [CrossRef]
- Amadei, A.; Ceruso, M.A.; Di Nola, A. On the convergence of the conformational coordinates basis set obtained by the essential dynamics analysis of proteins' molecular dynamics simulations. Proteins: Structure, Function, and Bioinformatics 1999, 36, 419–424. [Google Scholar] [CrossRef]
- Pontiggia, F.; Colombo, G.; Micheletti, C.; Orland, H. Anharmonicity and self-similarity of the free energy landscape of protein G. Physical review letters 2007, 98, 048102. [Google Scholar] [CrossRef]
Figure 1.
Crystal structure of HBD-2 exposing first (Gly1) and terminal (Pro41) amino acid residues.
Figure 1.
Crystal structure of HBD-2 exposing first (Gly1) and terminal (Pro41) amino acid residues.
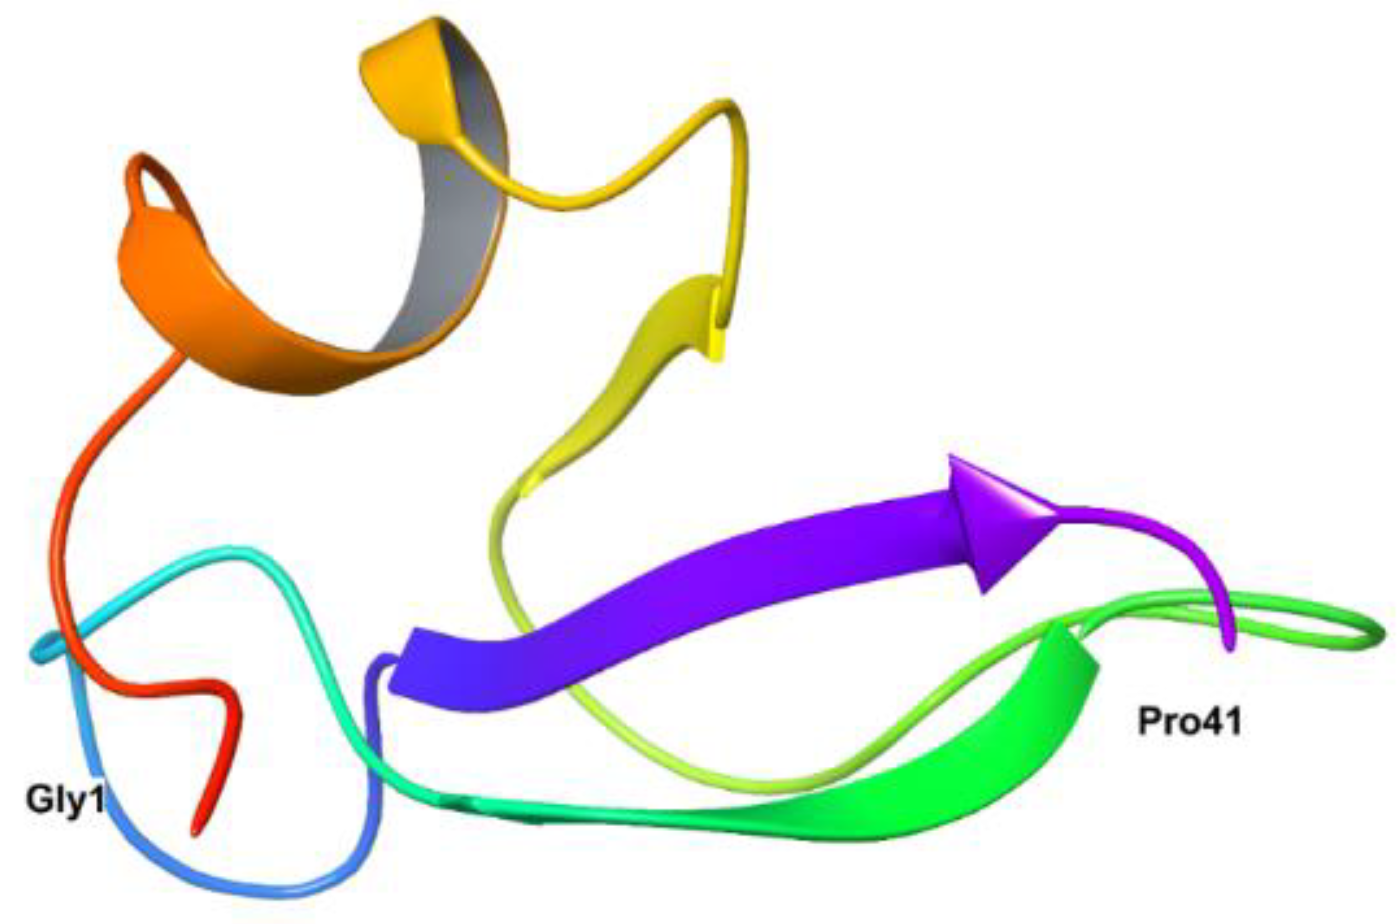
Figure 2.
(a) Protein-protein interactions between the chains. The area of each circle is relative to the surface area of chains A (4XCT) and B (HBD-2); (b) Residue-residue interactions across the protein-protein interface i.e., between chains A (4XCT) and B (HBD-2). Dashed line: non-bonded contact, Solid blue line: hydrogen bonds, Solid red line: salt bridges; (c) 3D interaction diagram depicting two hydrogen bonds across the interface of the HBD-2/4XCT complex.
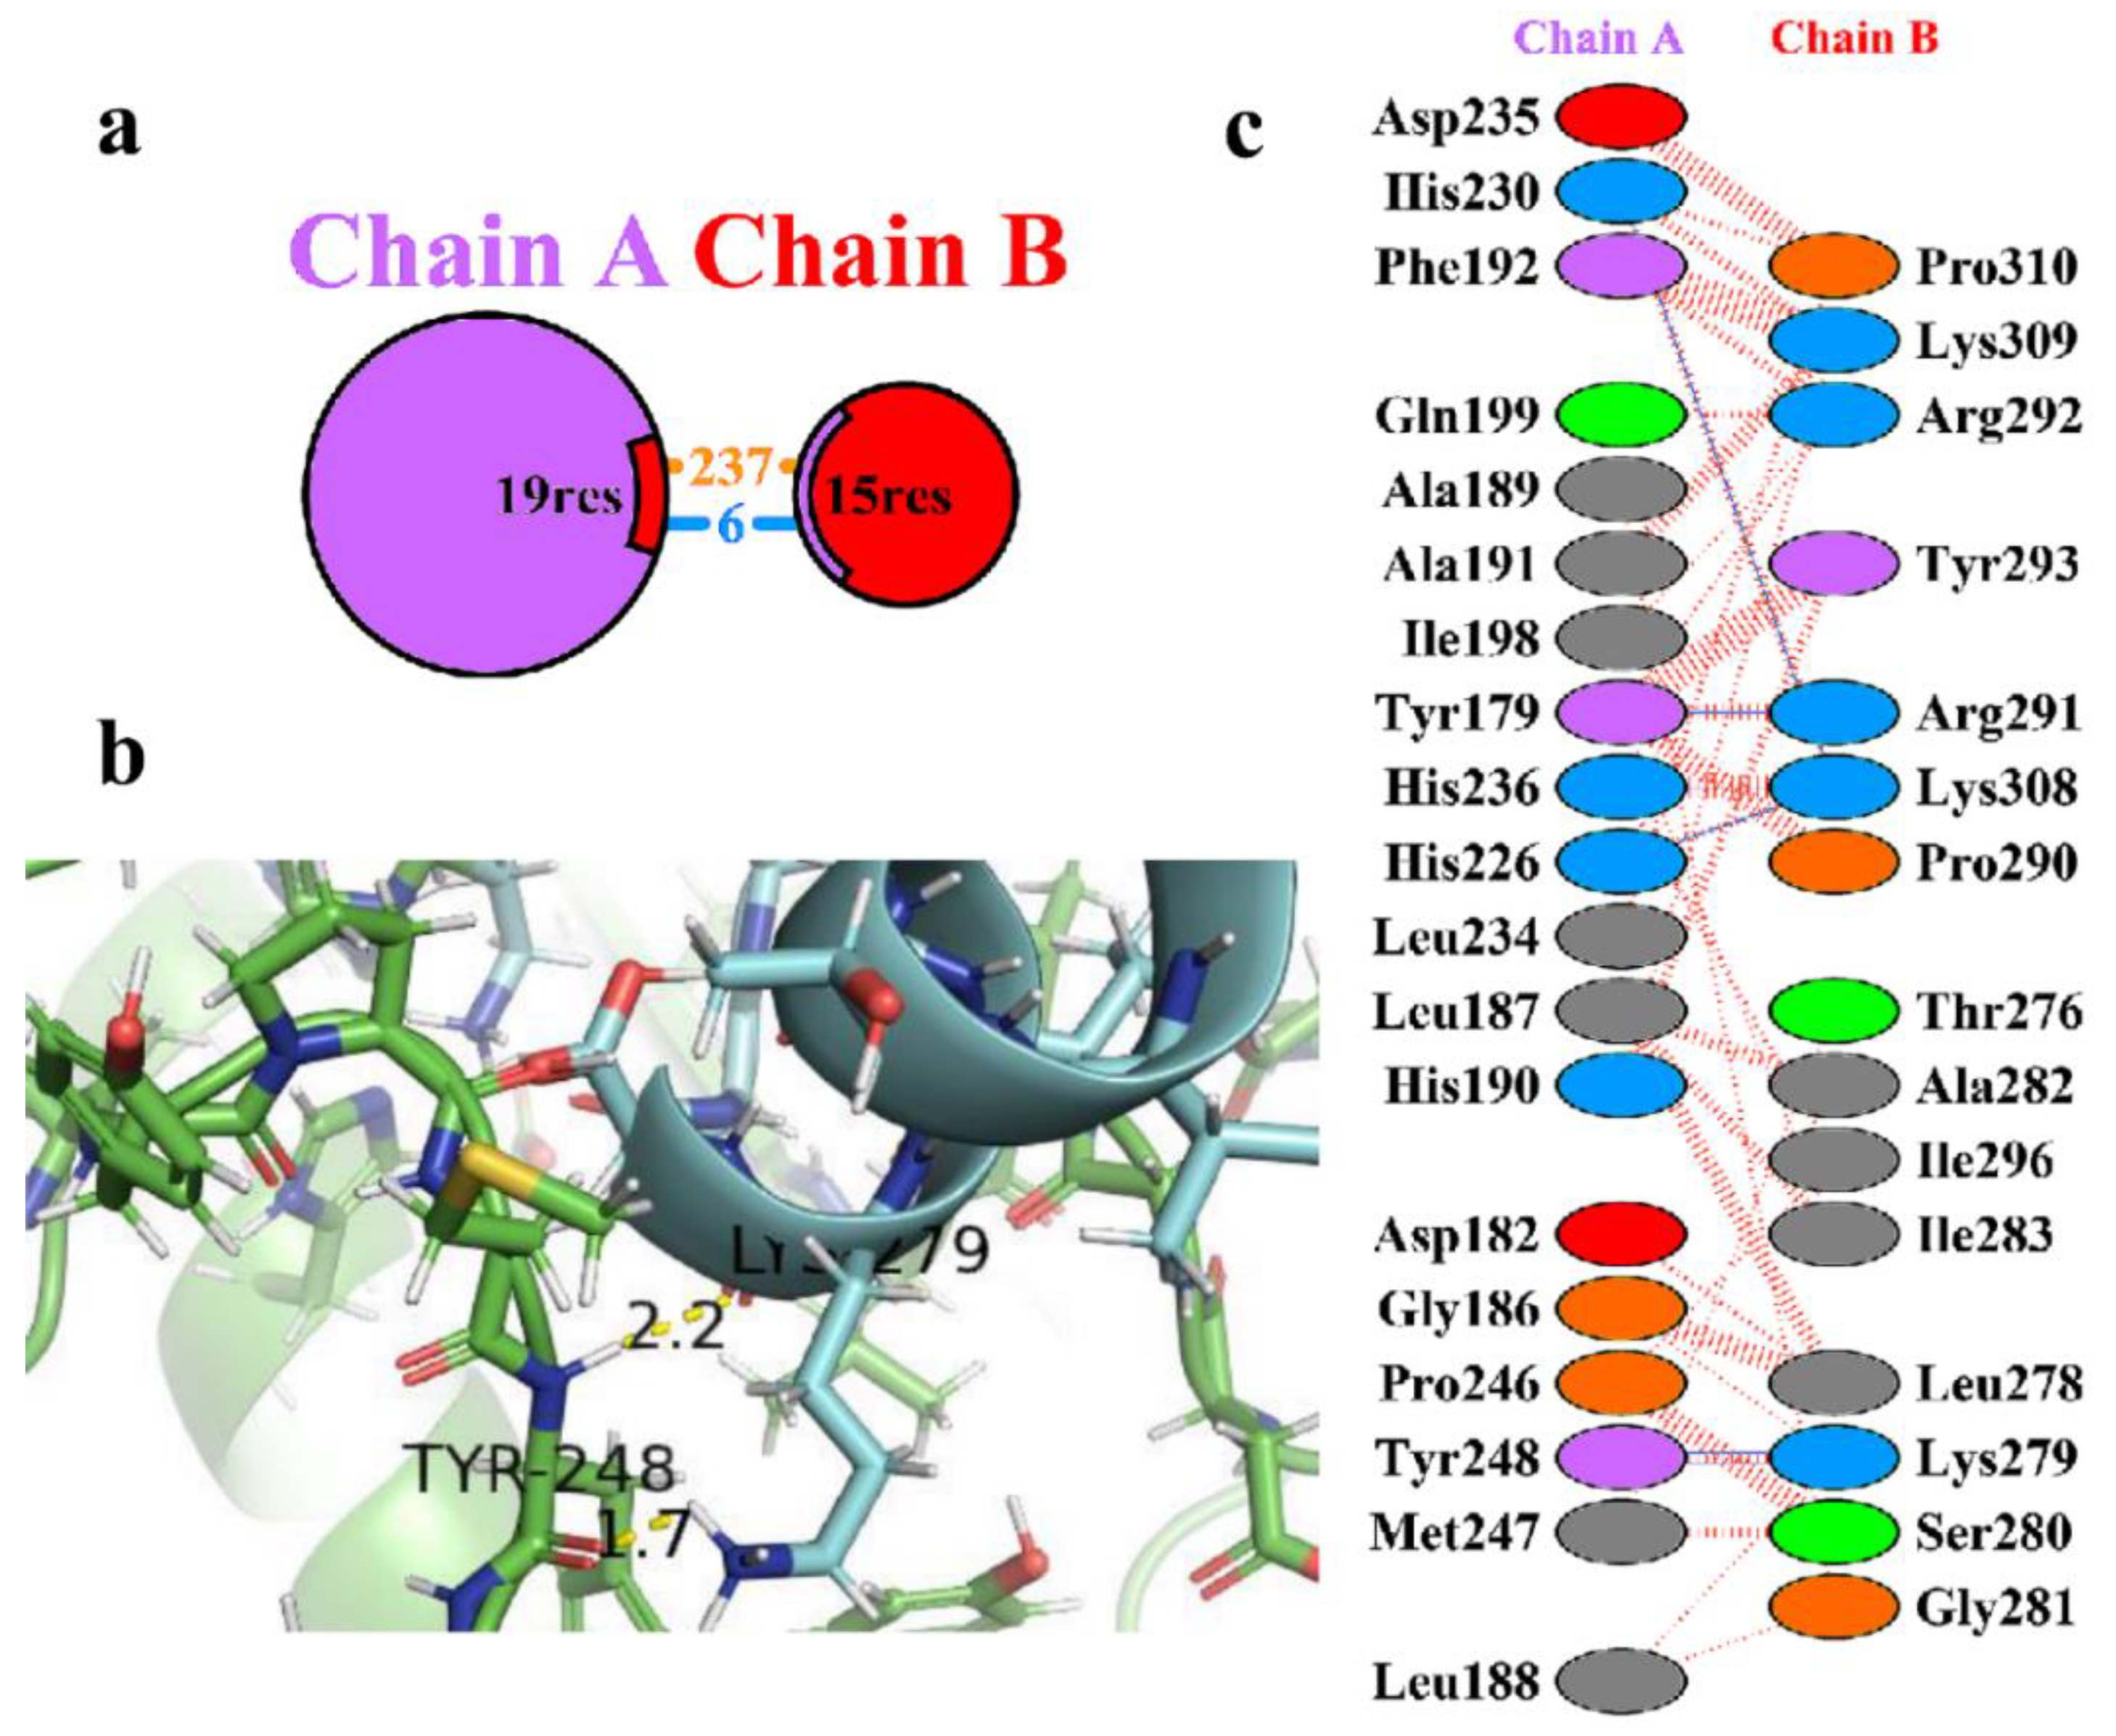
Figure 3.
(a) Protein-protein interactions between the chains. The area of each circle is relative to the surface area of chains A (2I0E) and B (HBD-2); (b) Residue-residue interactions across the protein-protein interface i.e., between chains A (2I0E) and B (HBD-2). Dashed line: non-bonded contact, Solid blue line: hydrogen bonds, Solid red line: salt bridges; (c) 3D interaction diagram depicting two hydrogen bonds across the interface of the HBD-2/2I0E complex.
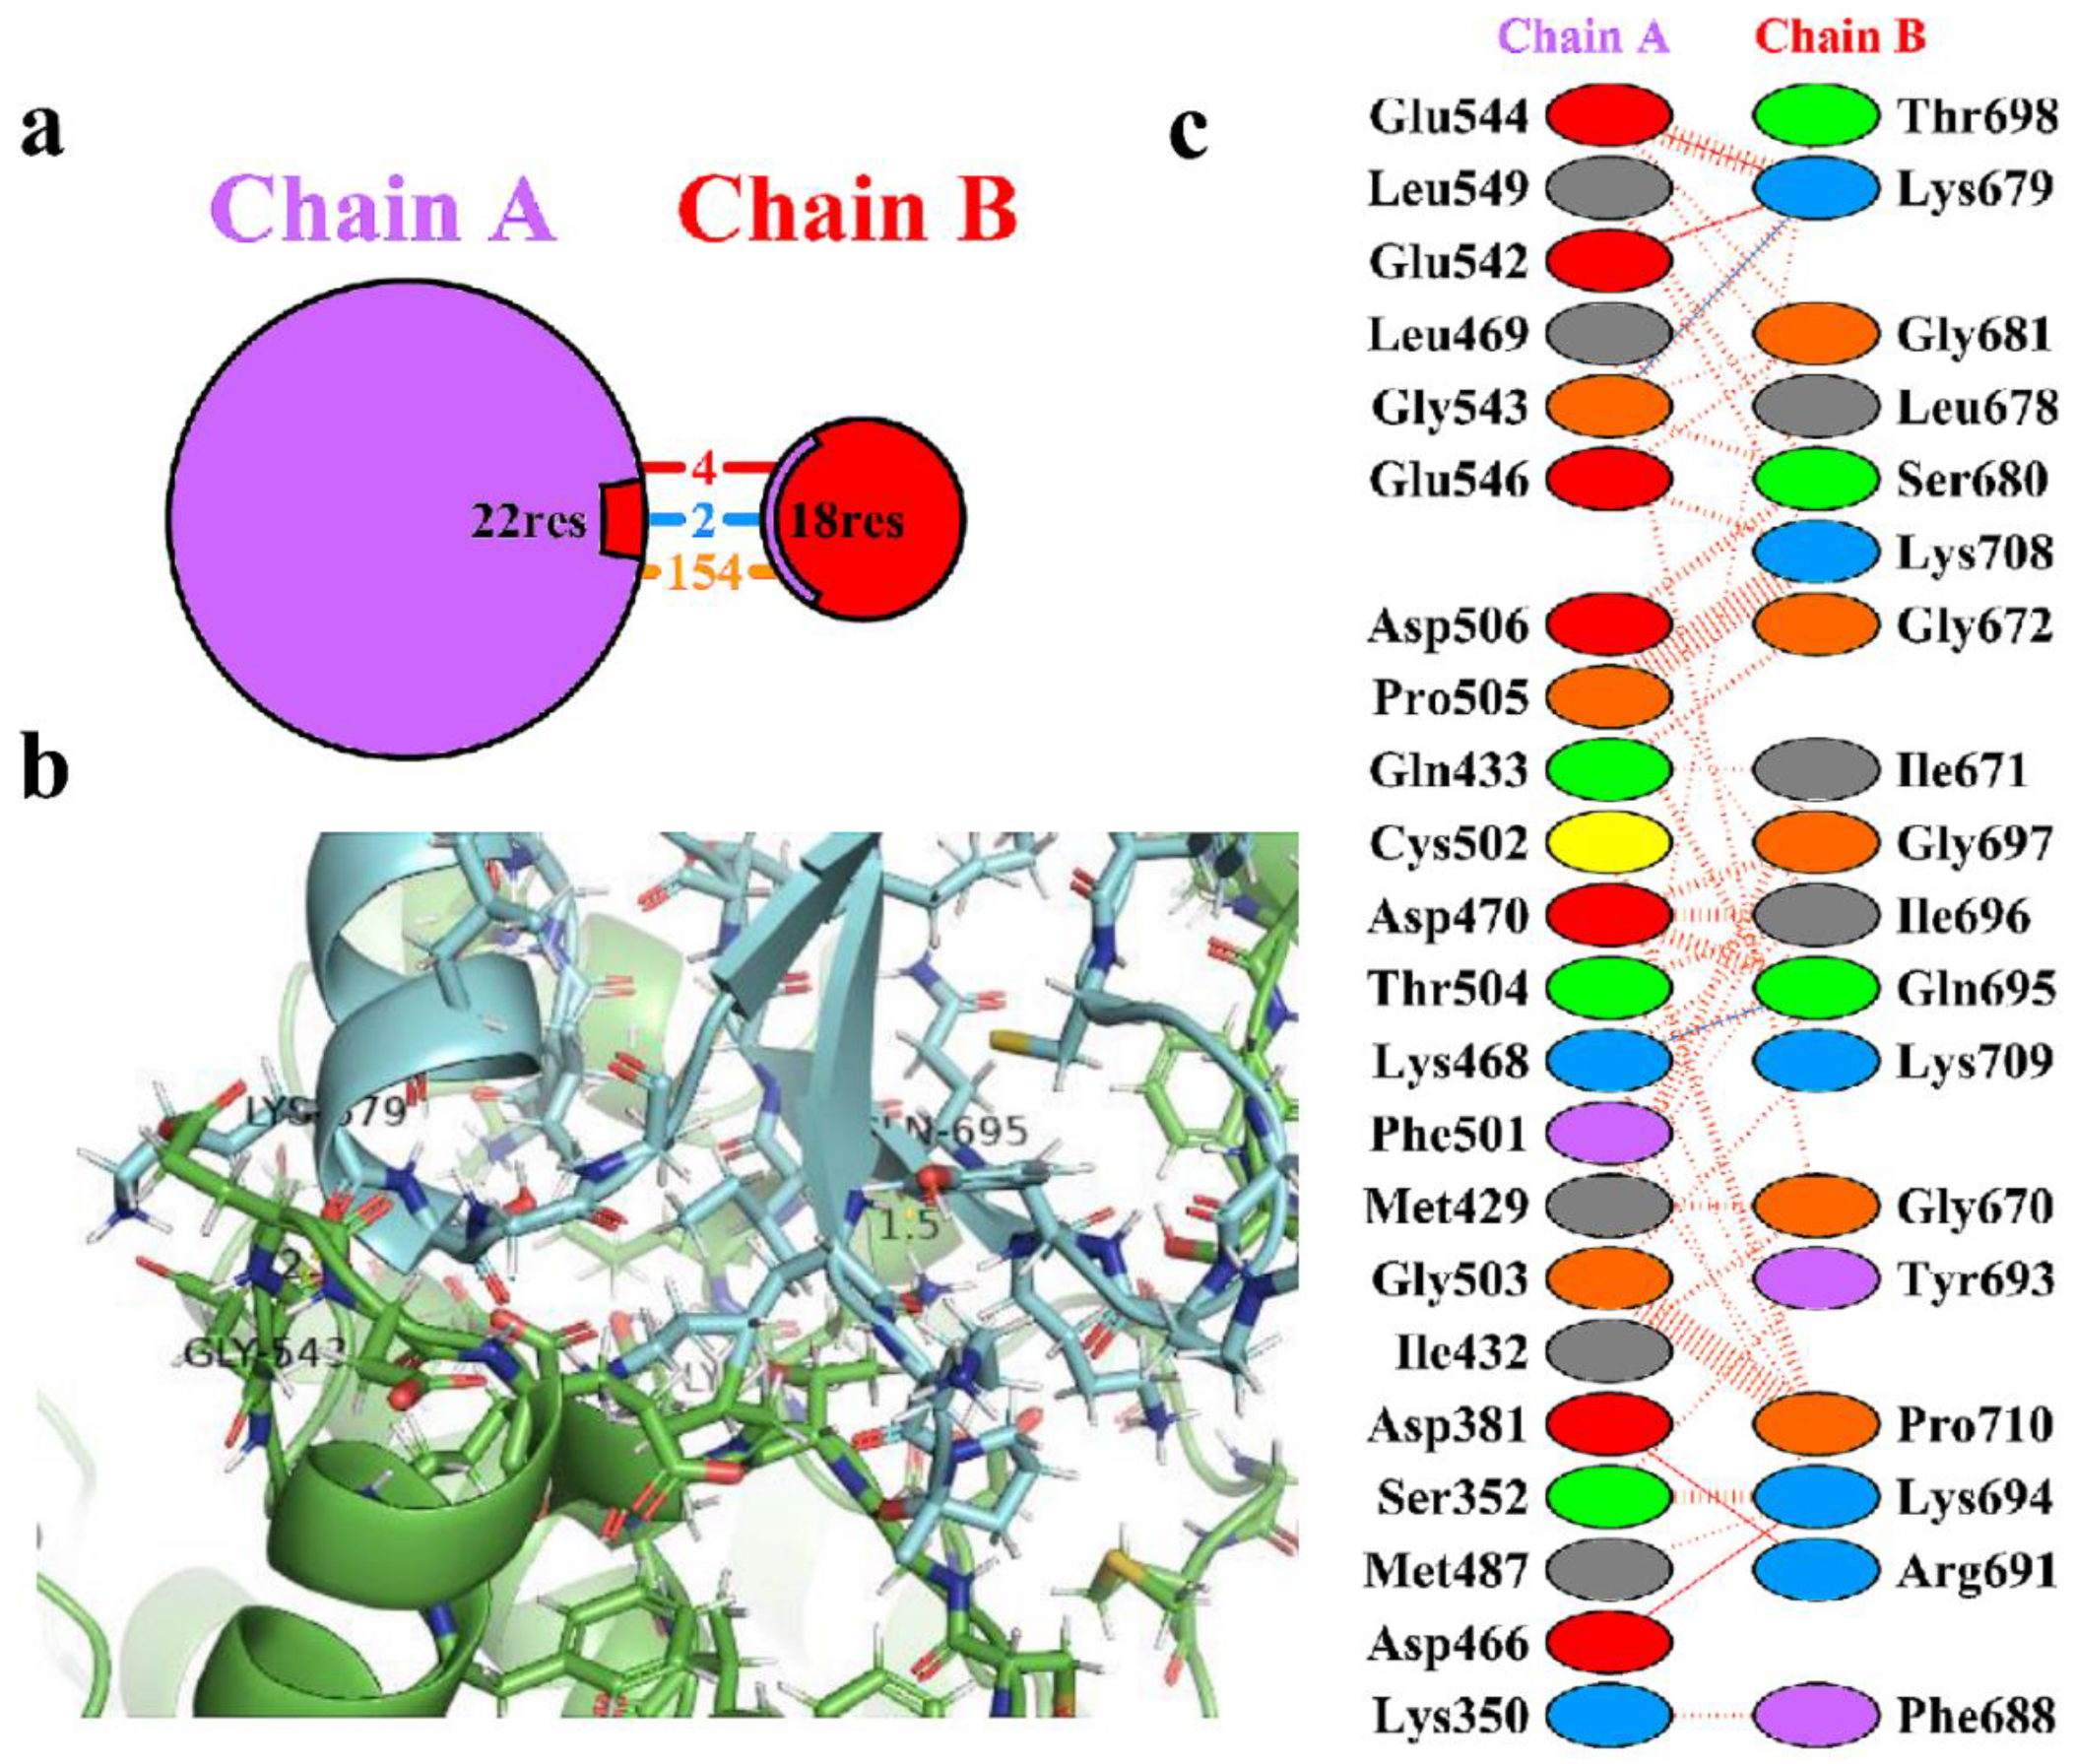
Figure 4.
RMSD plot of the complexes (a) HBD-2/4XCT (b) HBD-2/2I0E during 1000 ns MD simulation.
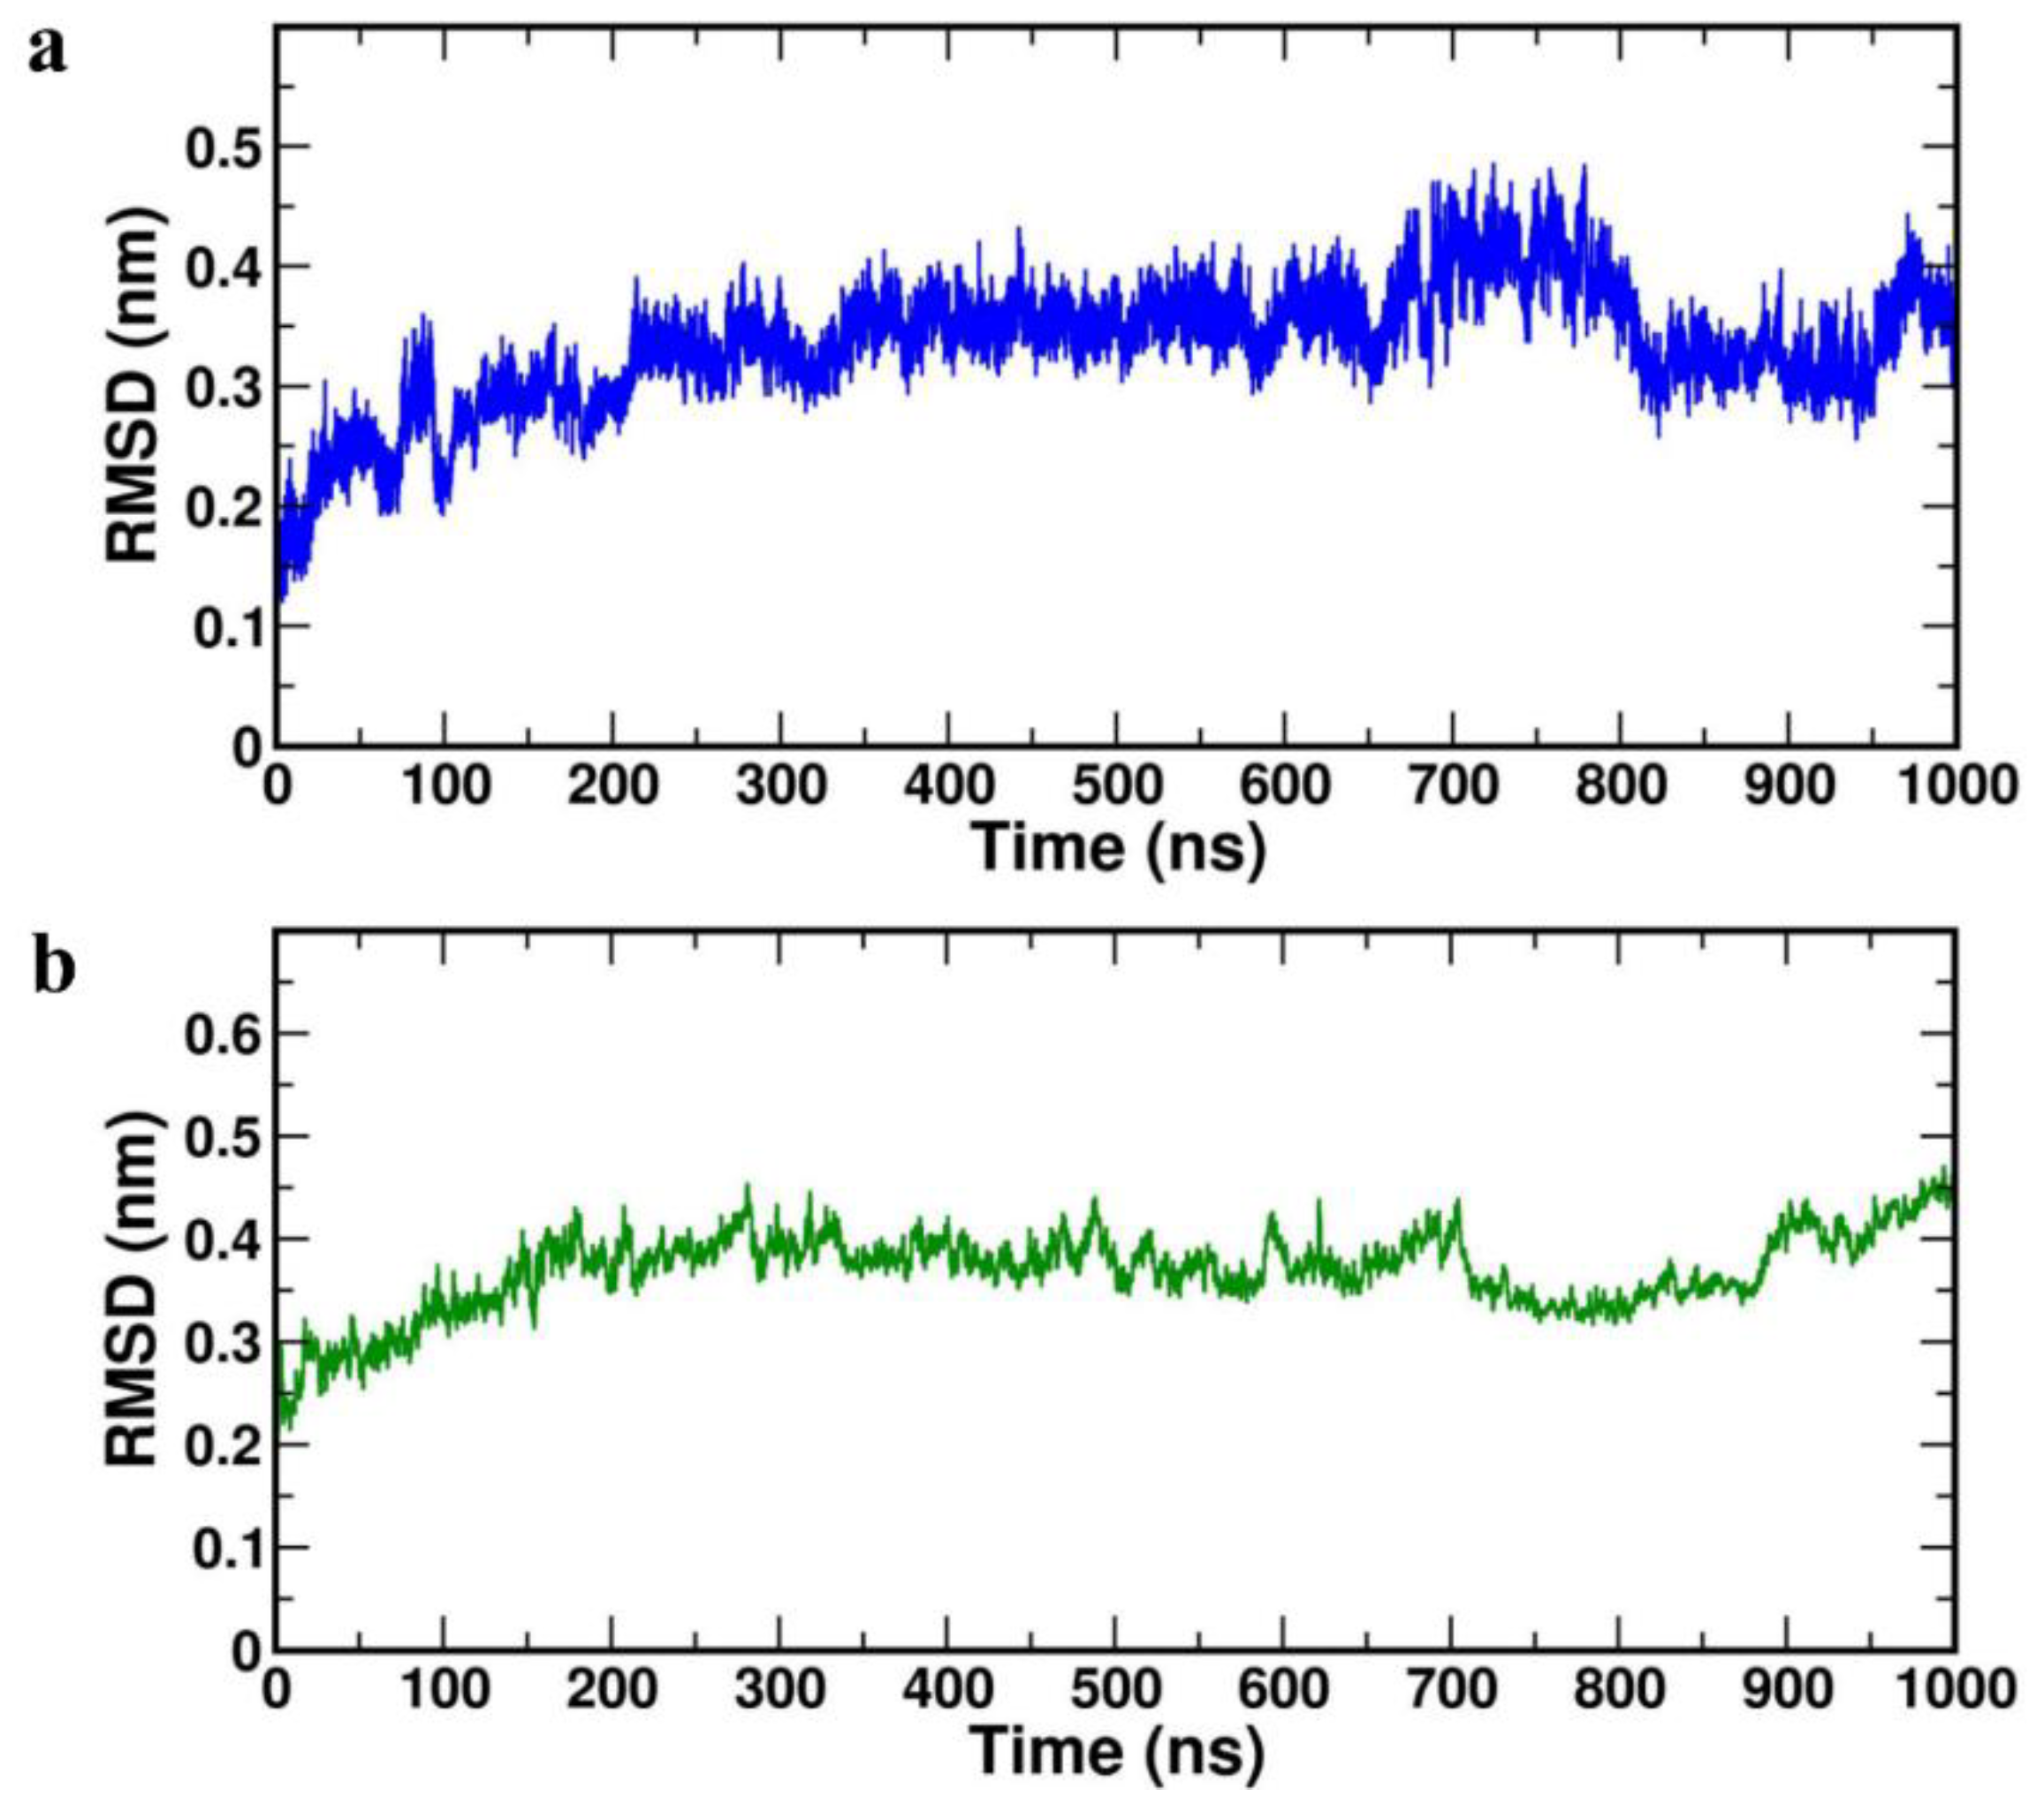
Figure 5.
RMSF plot of the complexes (a) HBD-2/4XCT (b) HBD-2/2I0E during 1000 ns MD simulation.
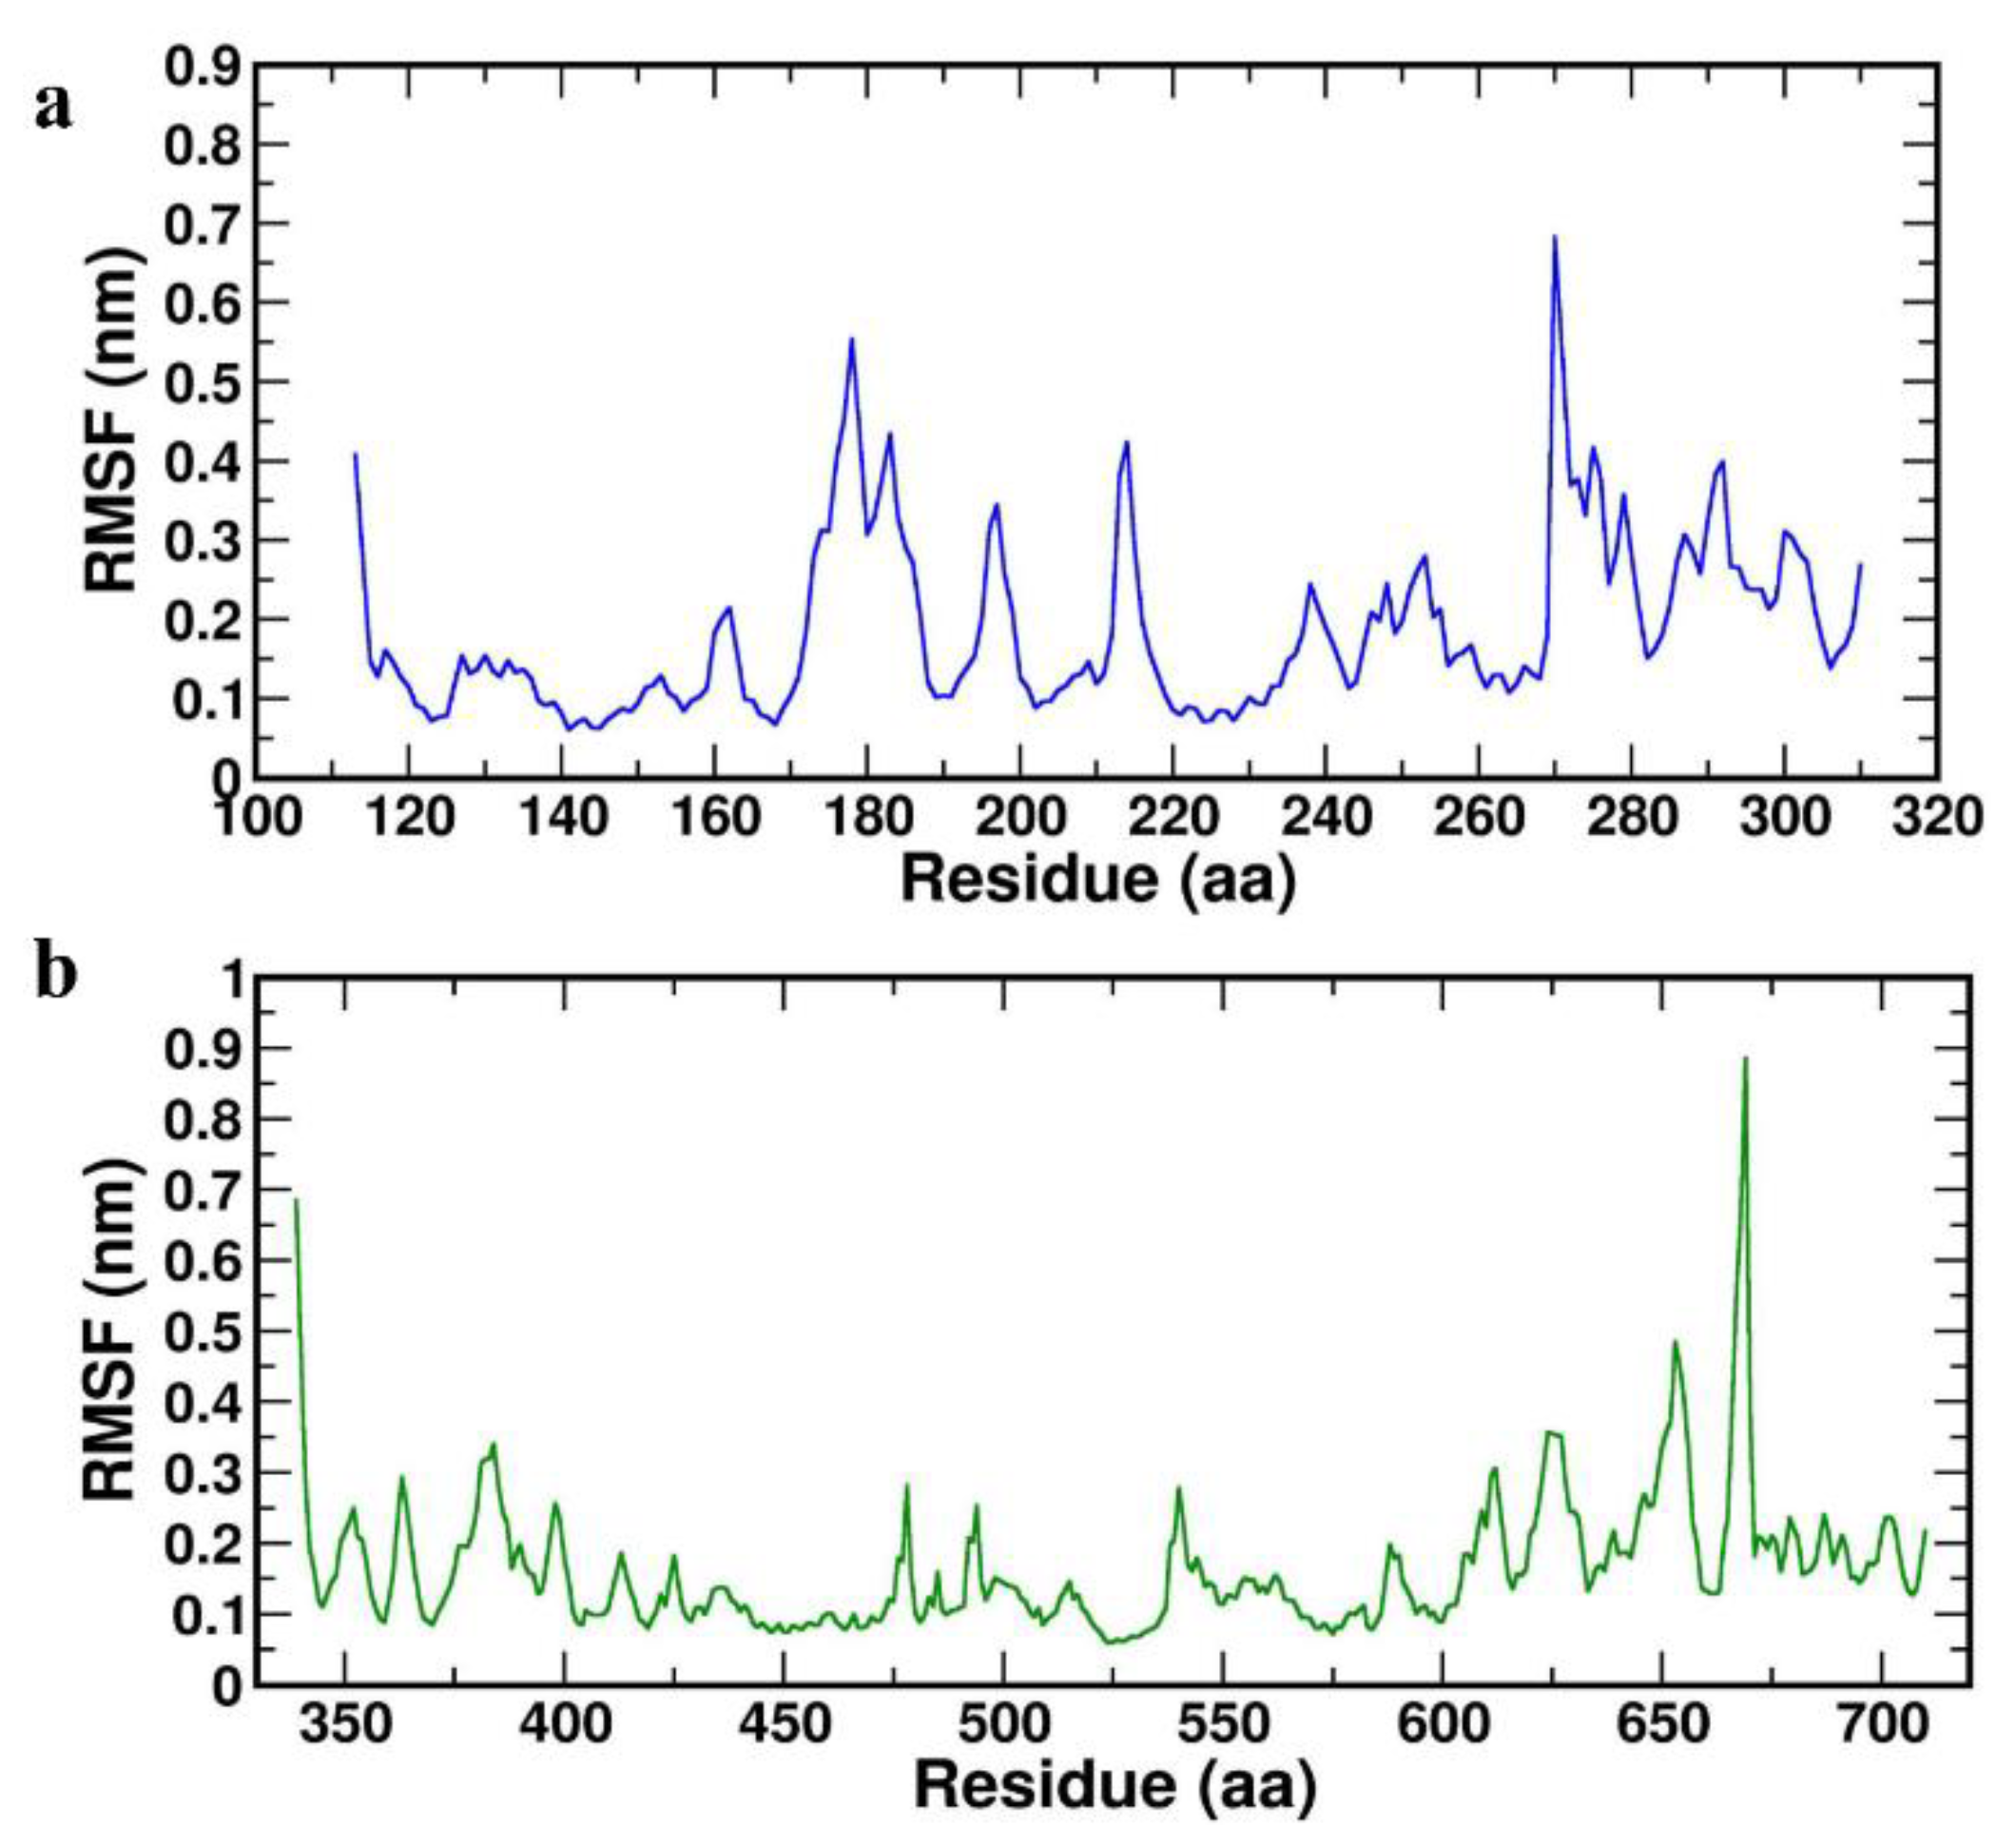
Figure 6.
Protein-protein interface exposing key interactions of the complexes (a) HBD-2/4XCT; (b) HBD-2/2I0E of 1000 ns MD simulation trajectories.
Figure 6.
Protein-protein interface exposing key interactions of the complexes (a) HBD-2/4XCT; (b) HBD-2/2I0E of 1000 ns MD simulation trajectories.
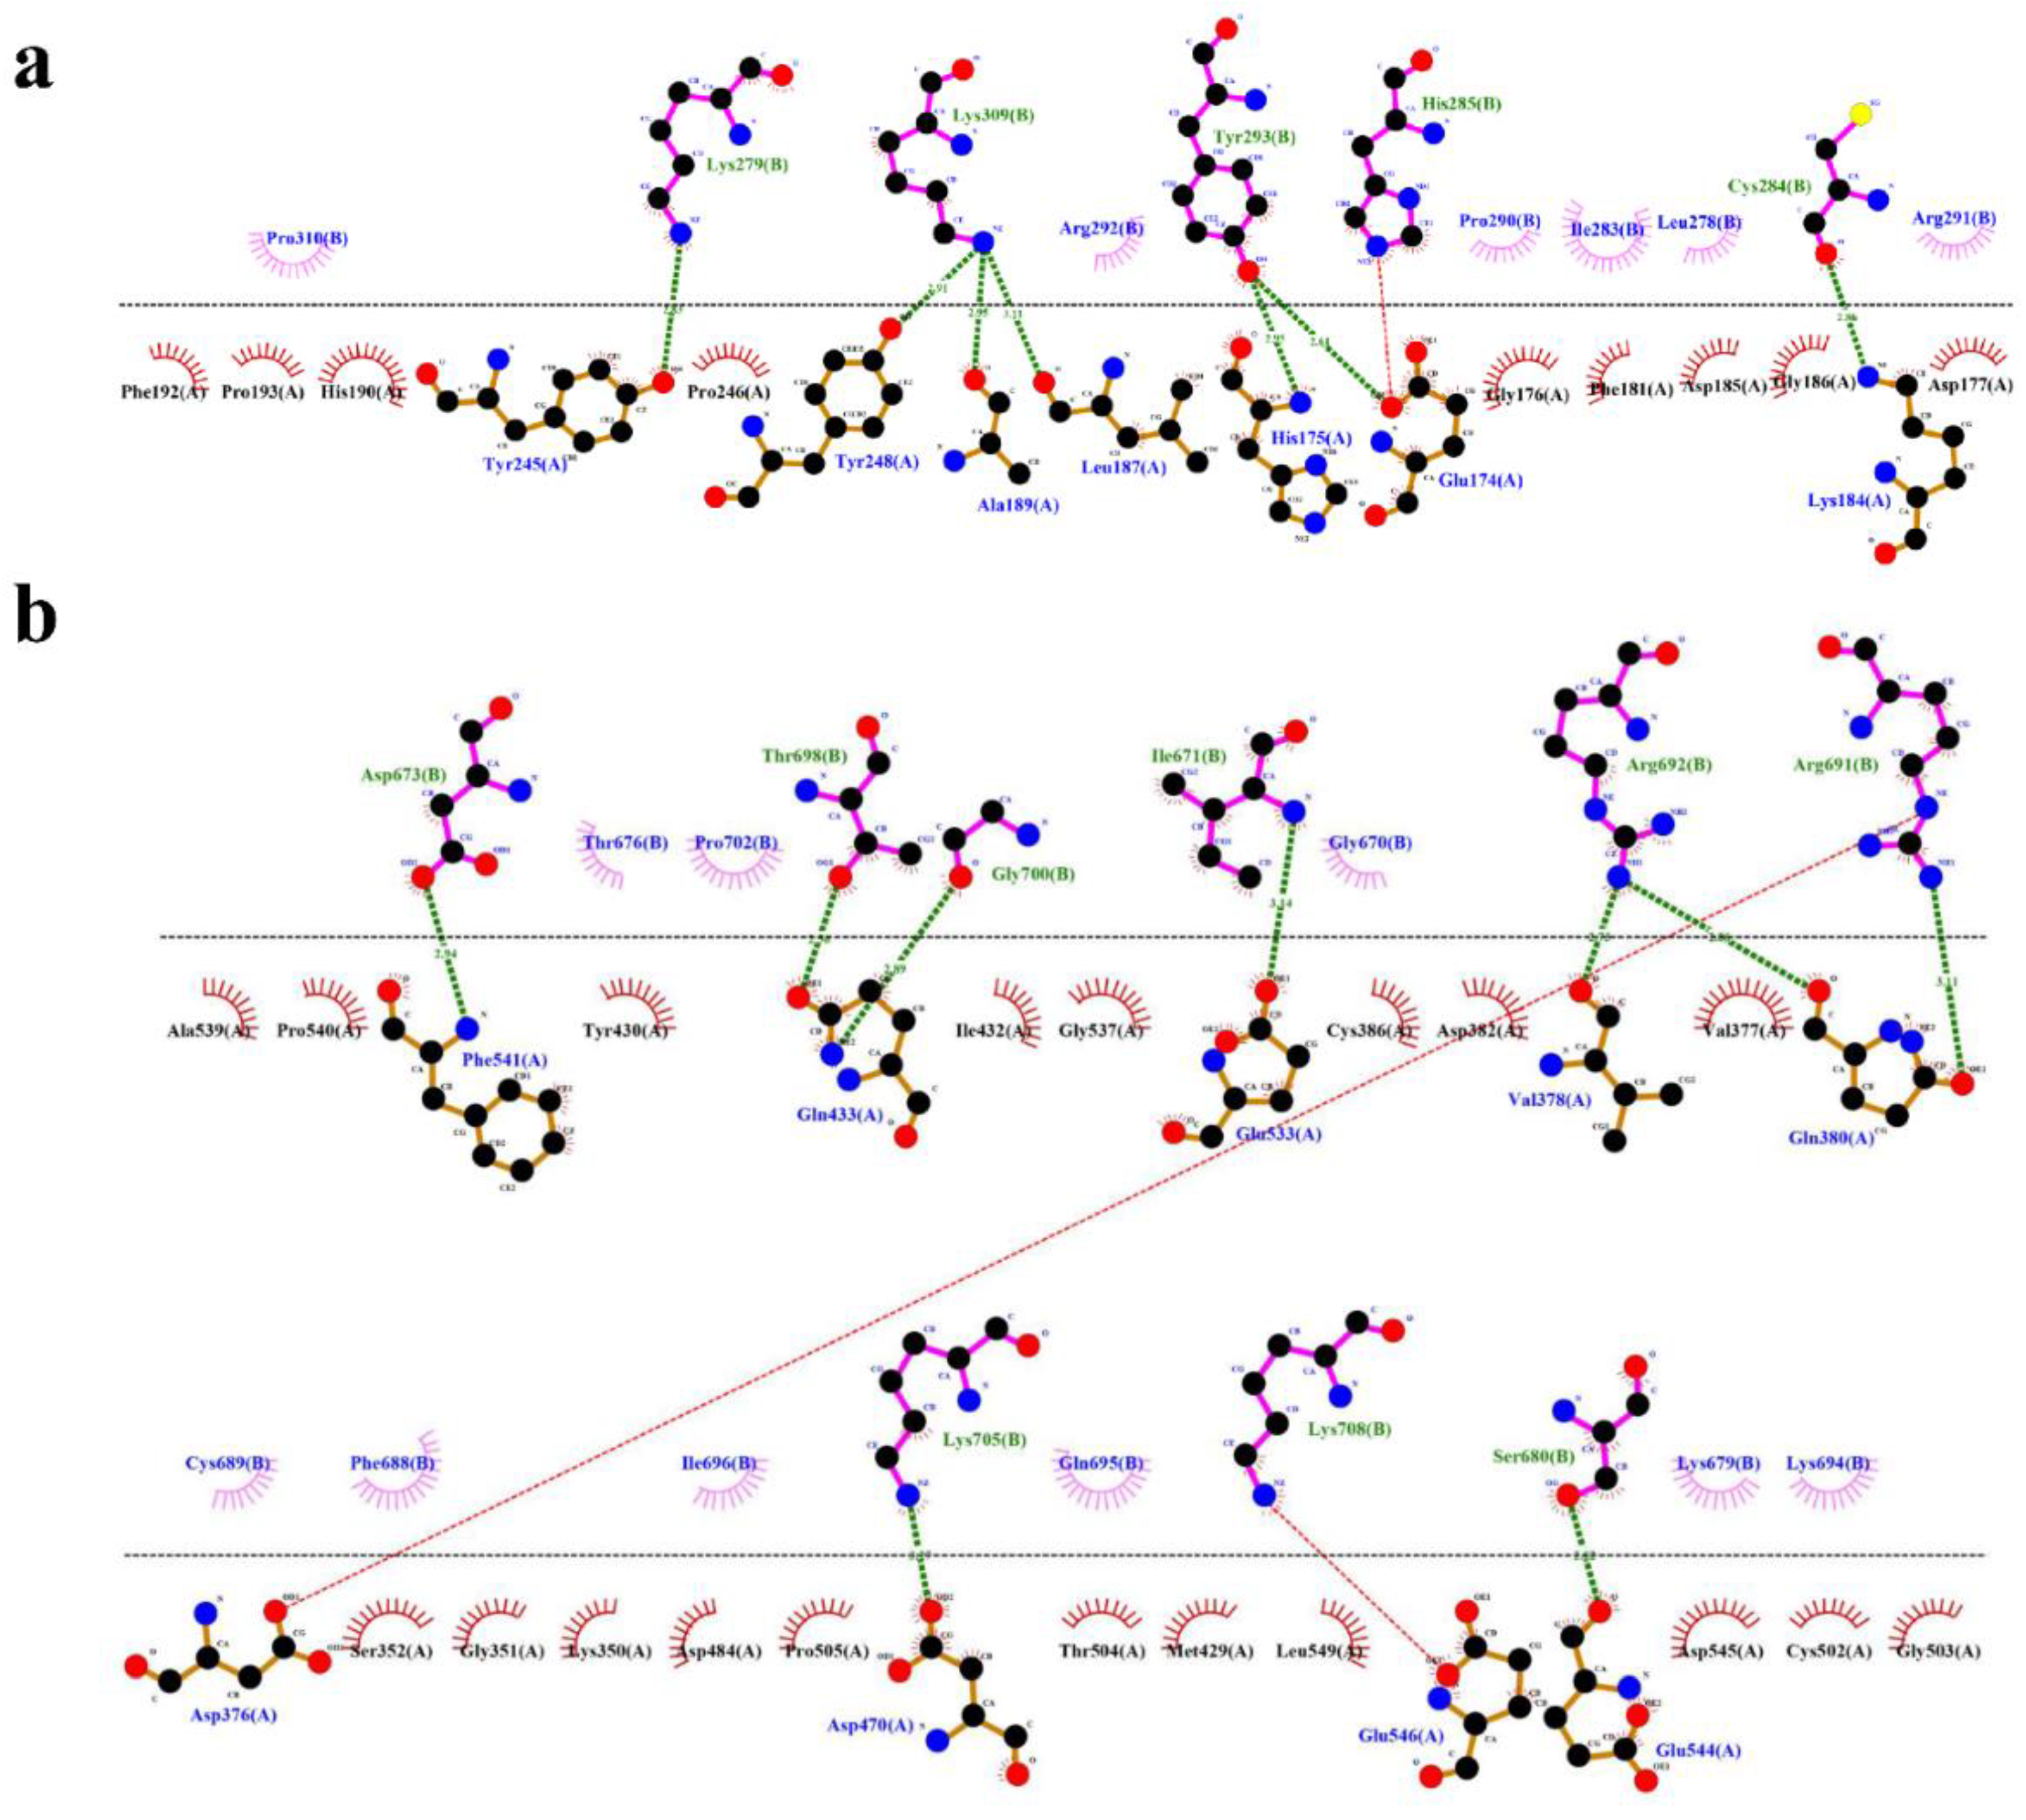
Figure 7.
Radius of gyration plot of the complexes (a) HBD-2/4XCT. (b) HBD-2/2I0E during 1000 ns MD simulation.
Figure 7.
Radius of gyration plot of the complexes (a) HBD-2/4XCT. (b) HBD-2/2I0E during 1000 ns MD simulation.
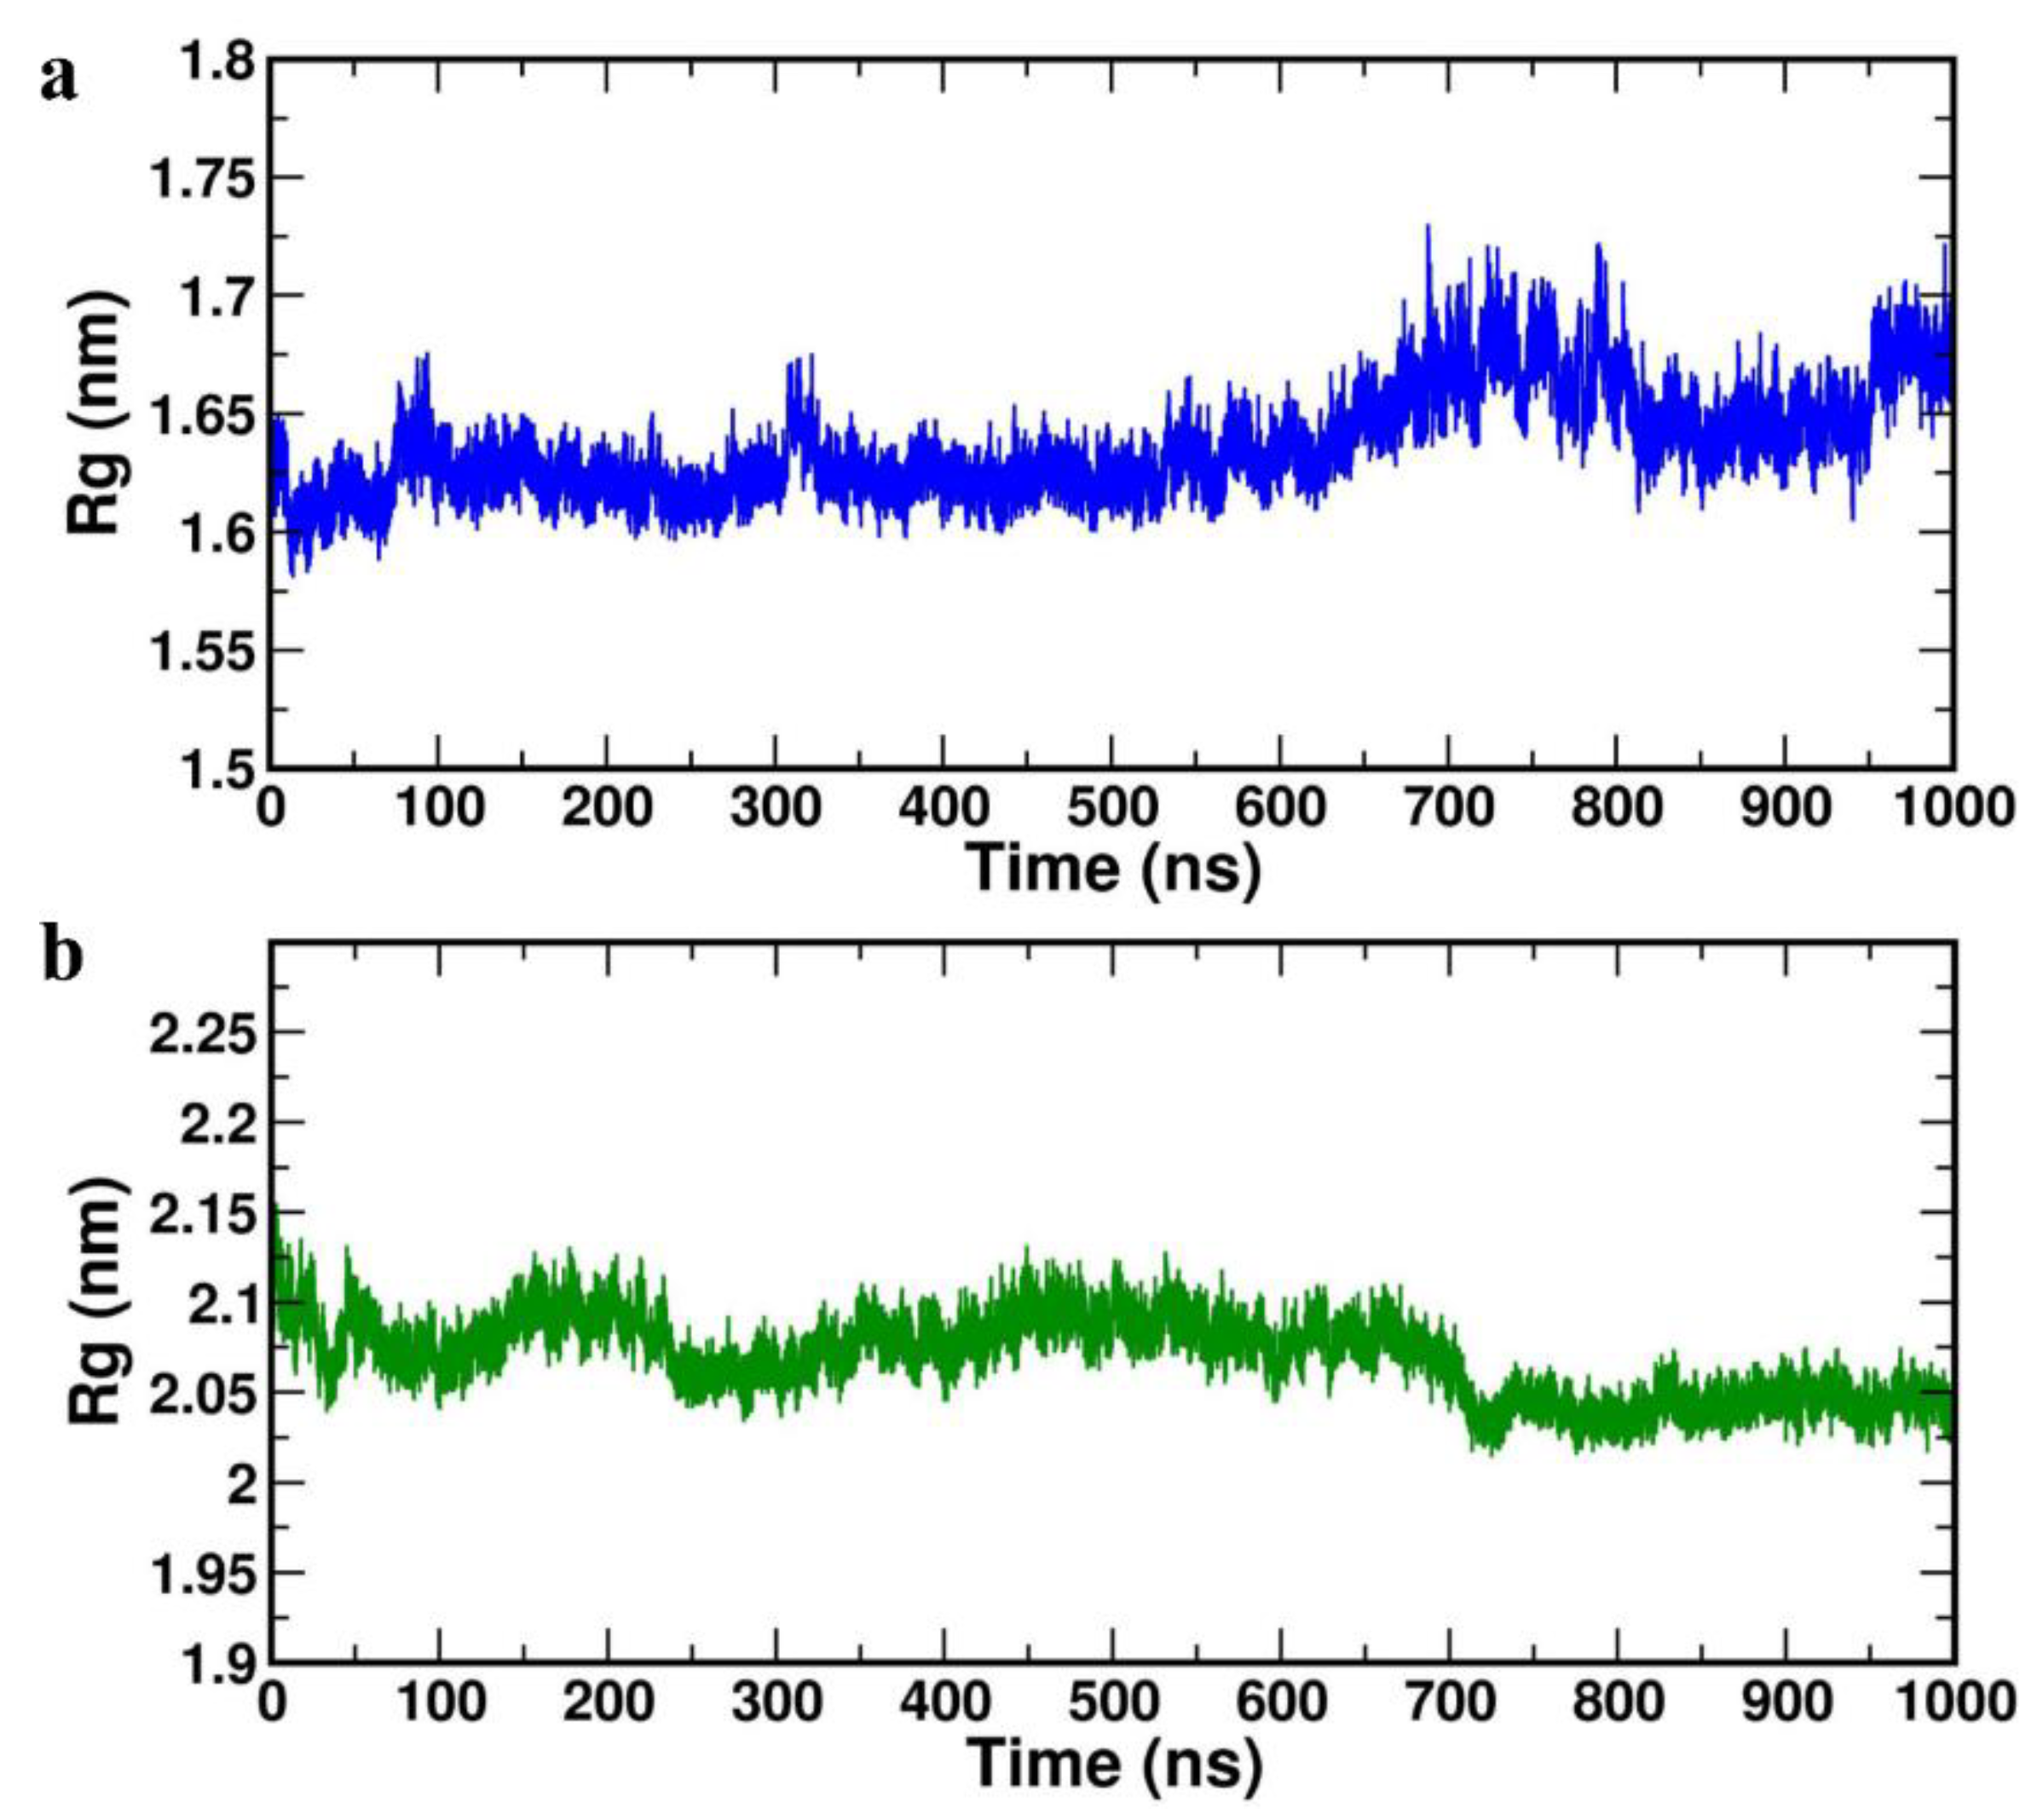
Figure 8.
Solvent accessible surface area of the complexes (a) HBD-2/4XCT. (b) HBD-2/2I0E during 1000 ns MD simulation.
Figure 8.
Solvent accessible surface area of the complexes (a) HBD-2/4XCT. (b) HBD-2/2I0E during 1000 ns MD simulation.
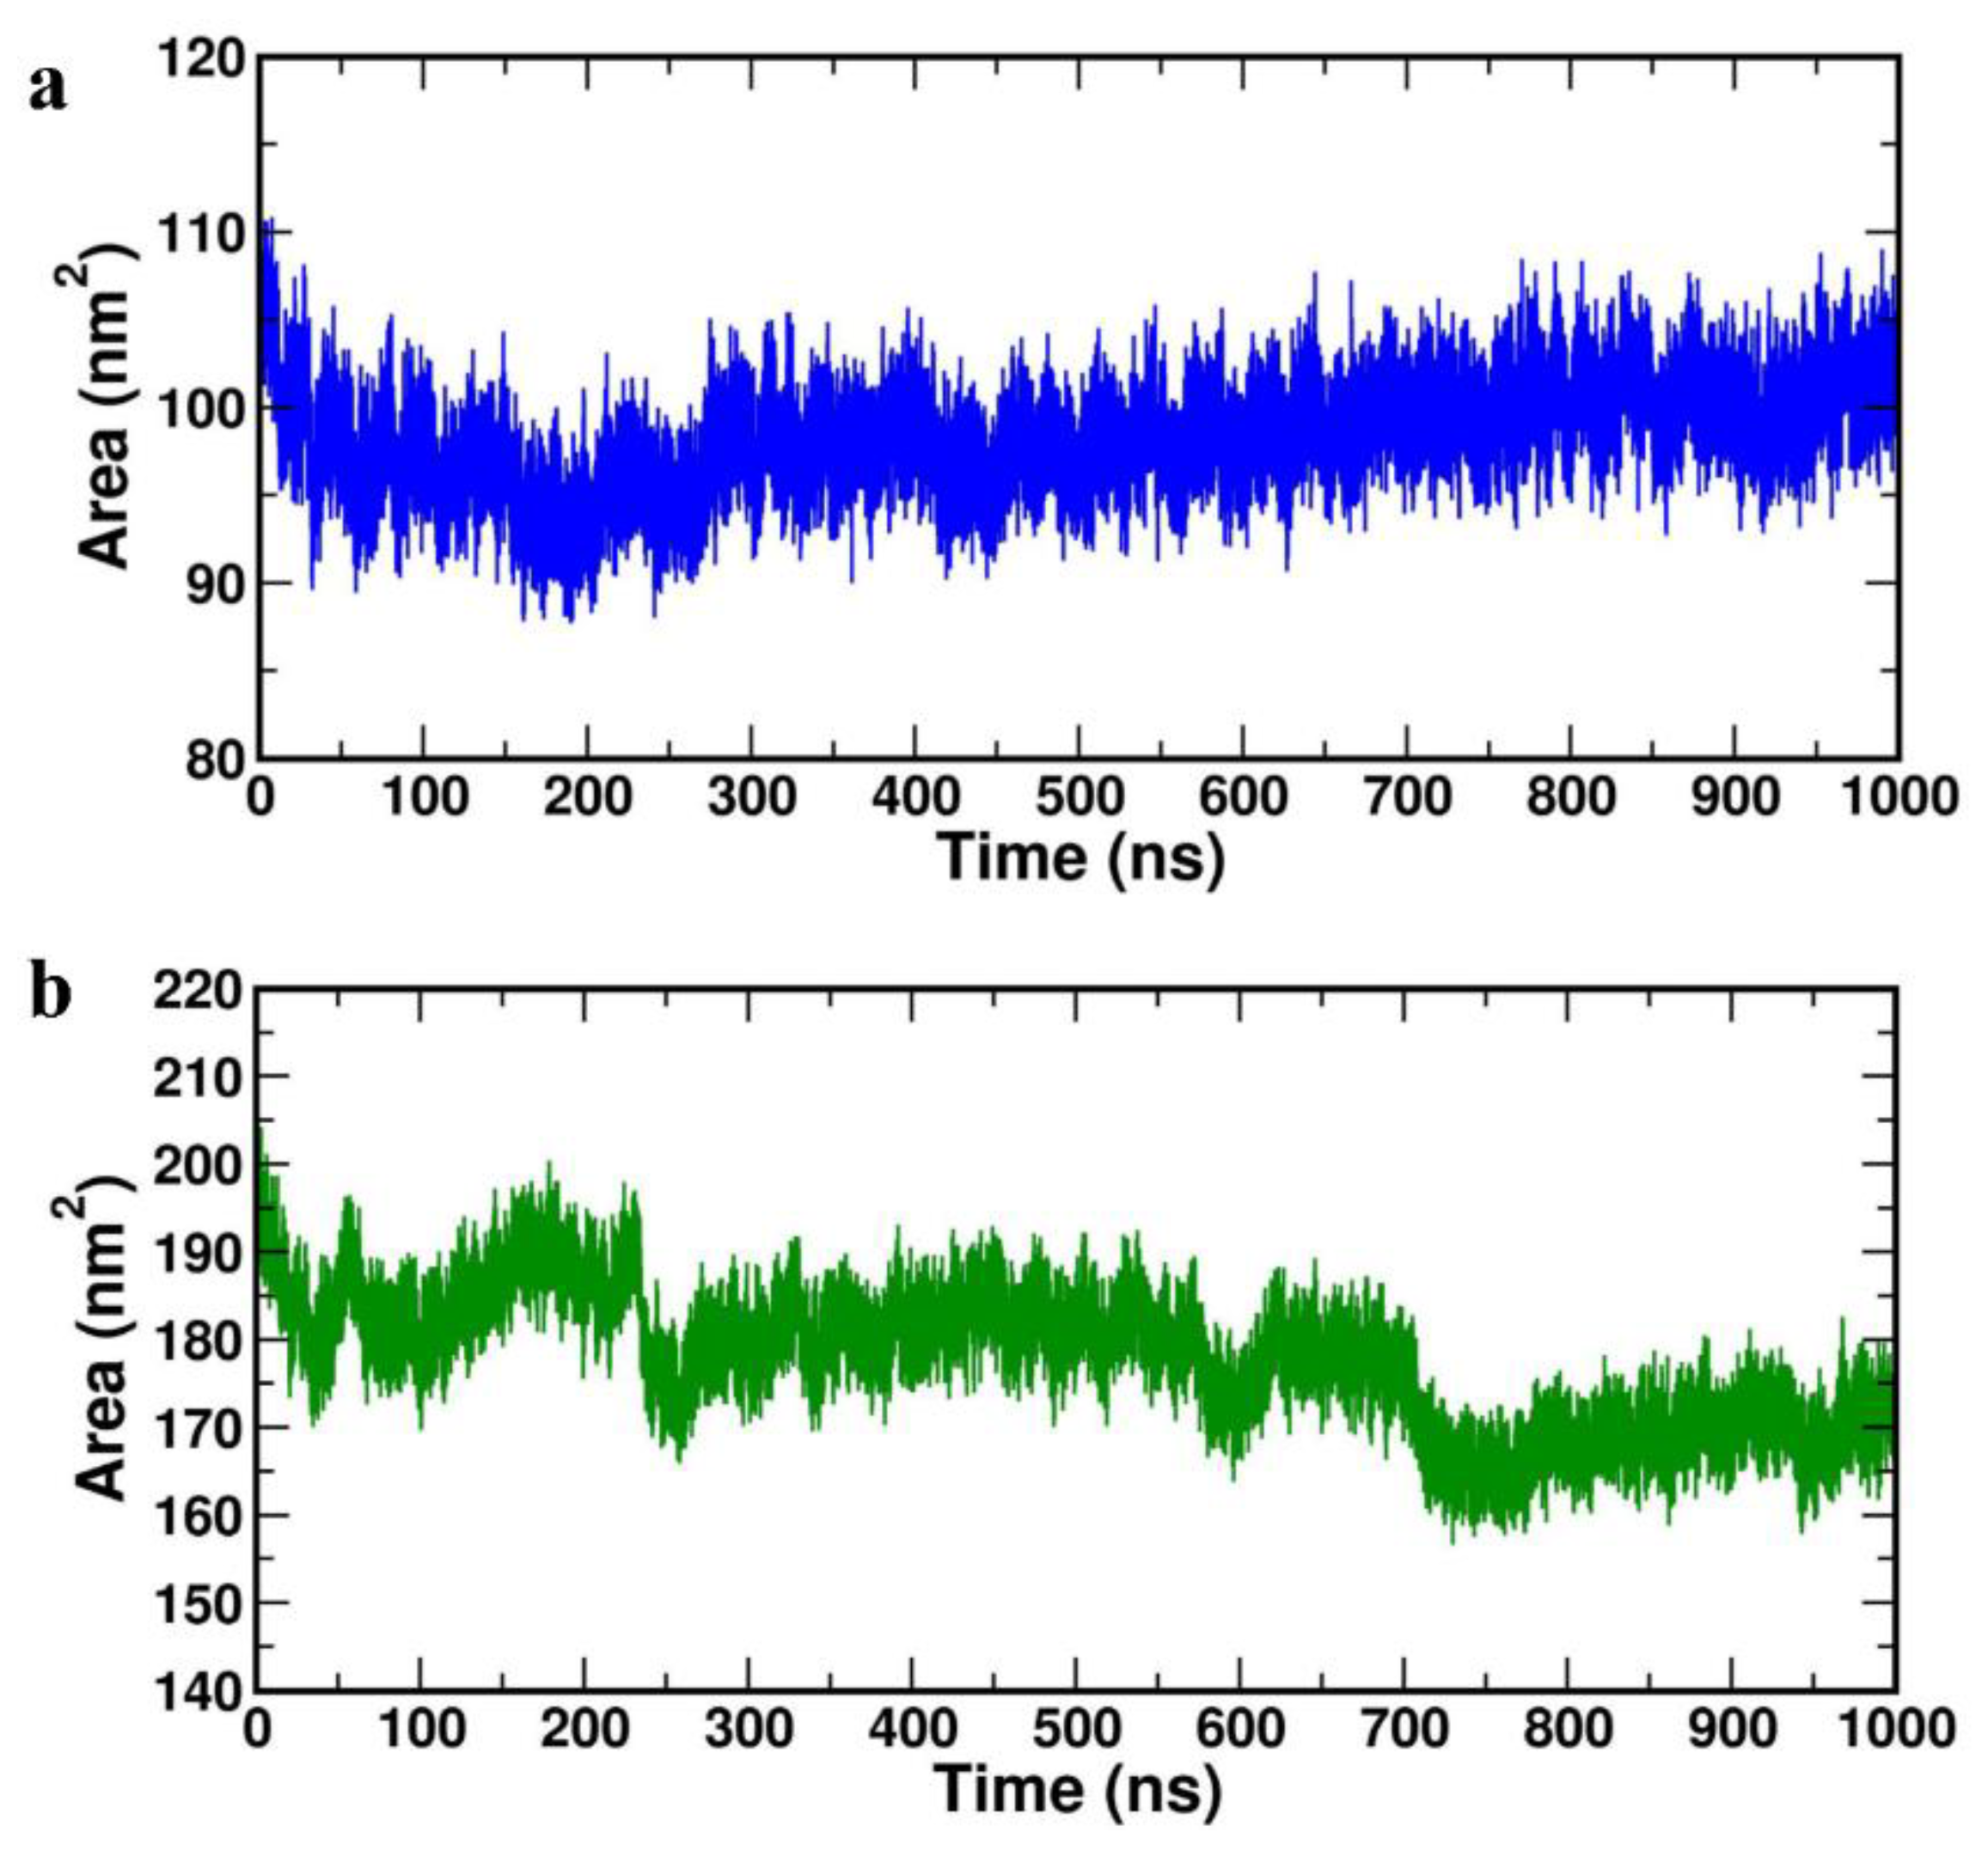
Figure 9.
Projection of the motion of proteins (a) 4XCT (b) 2I0E in phase space along the PC1 and PC2.
Figure 9.
Projection of the motion of proteins (a) 4XCT (b) 2I0E in phase space along the PC1 and PC2.
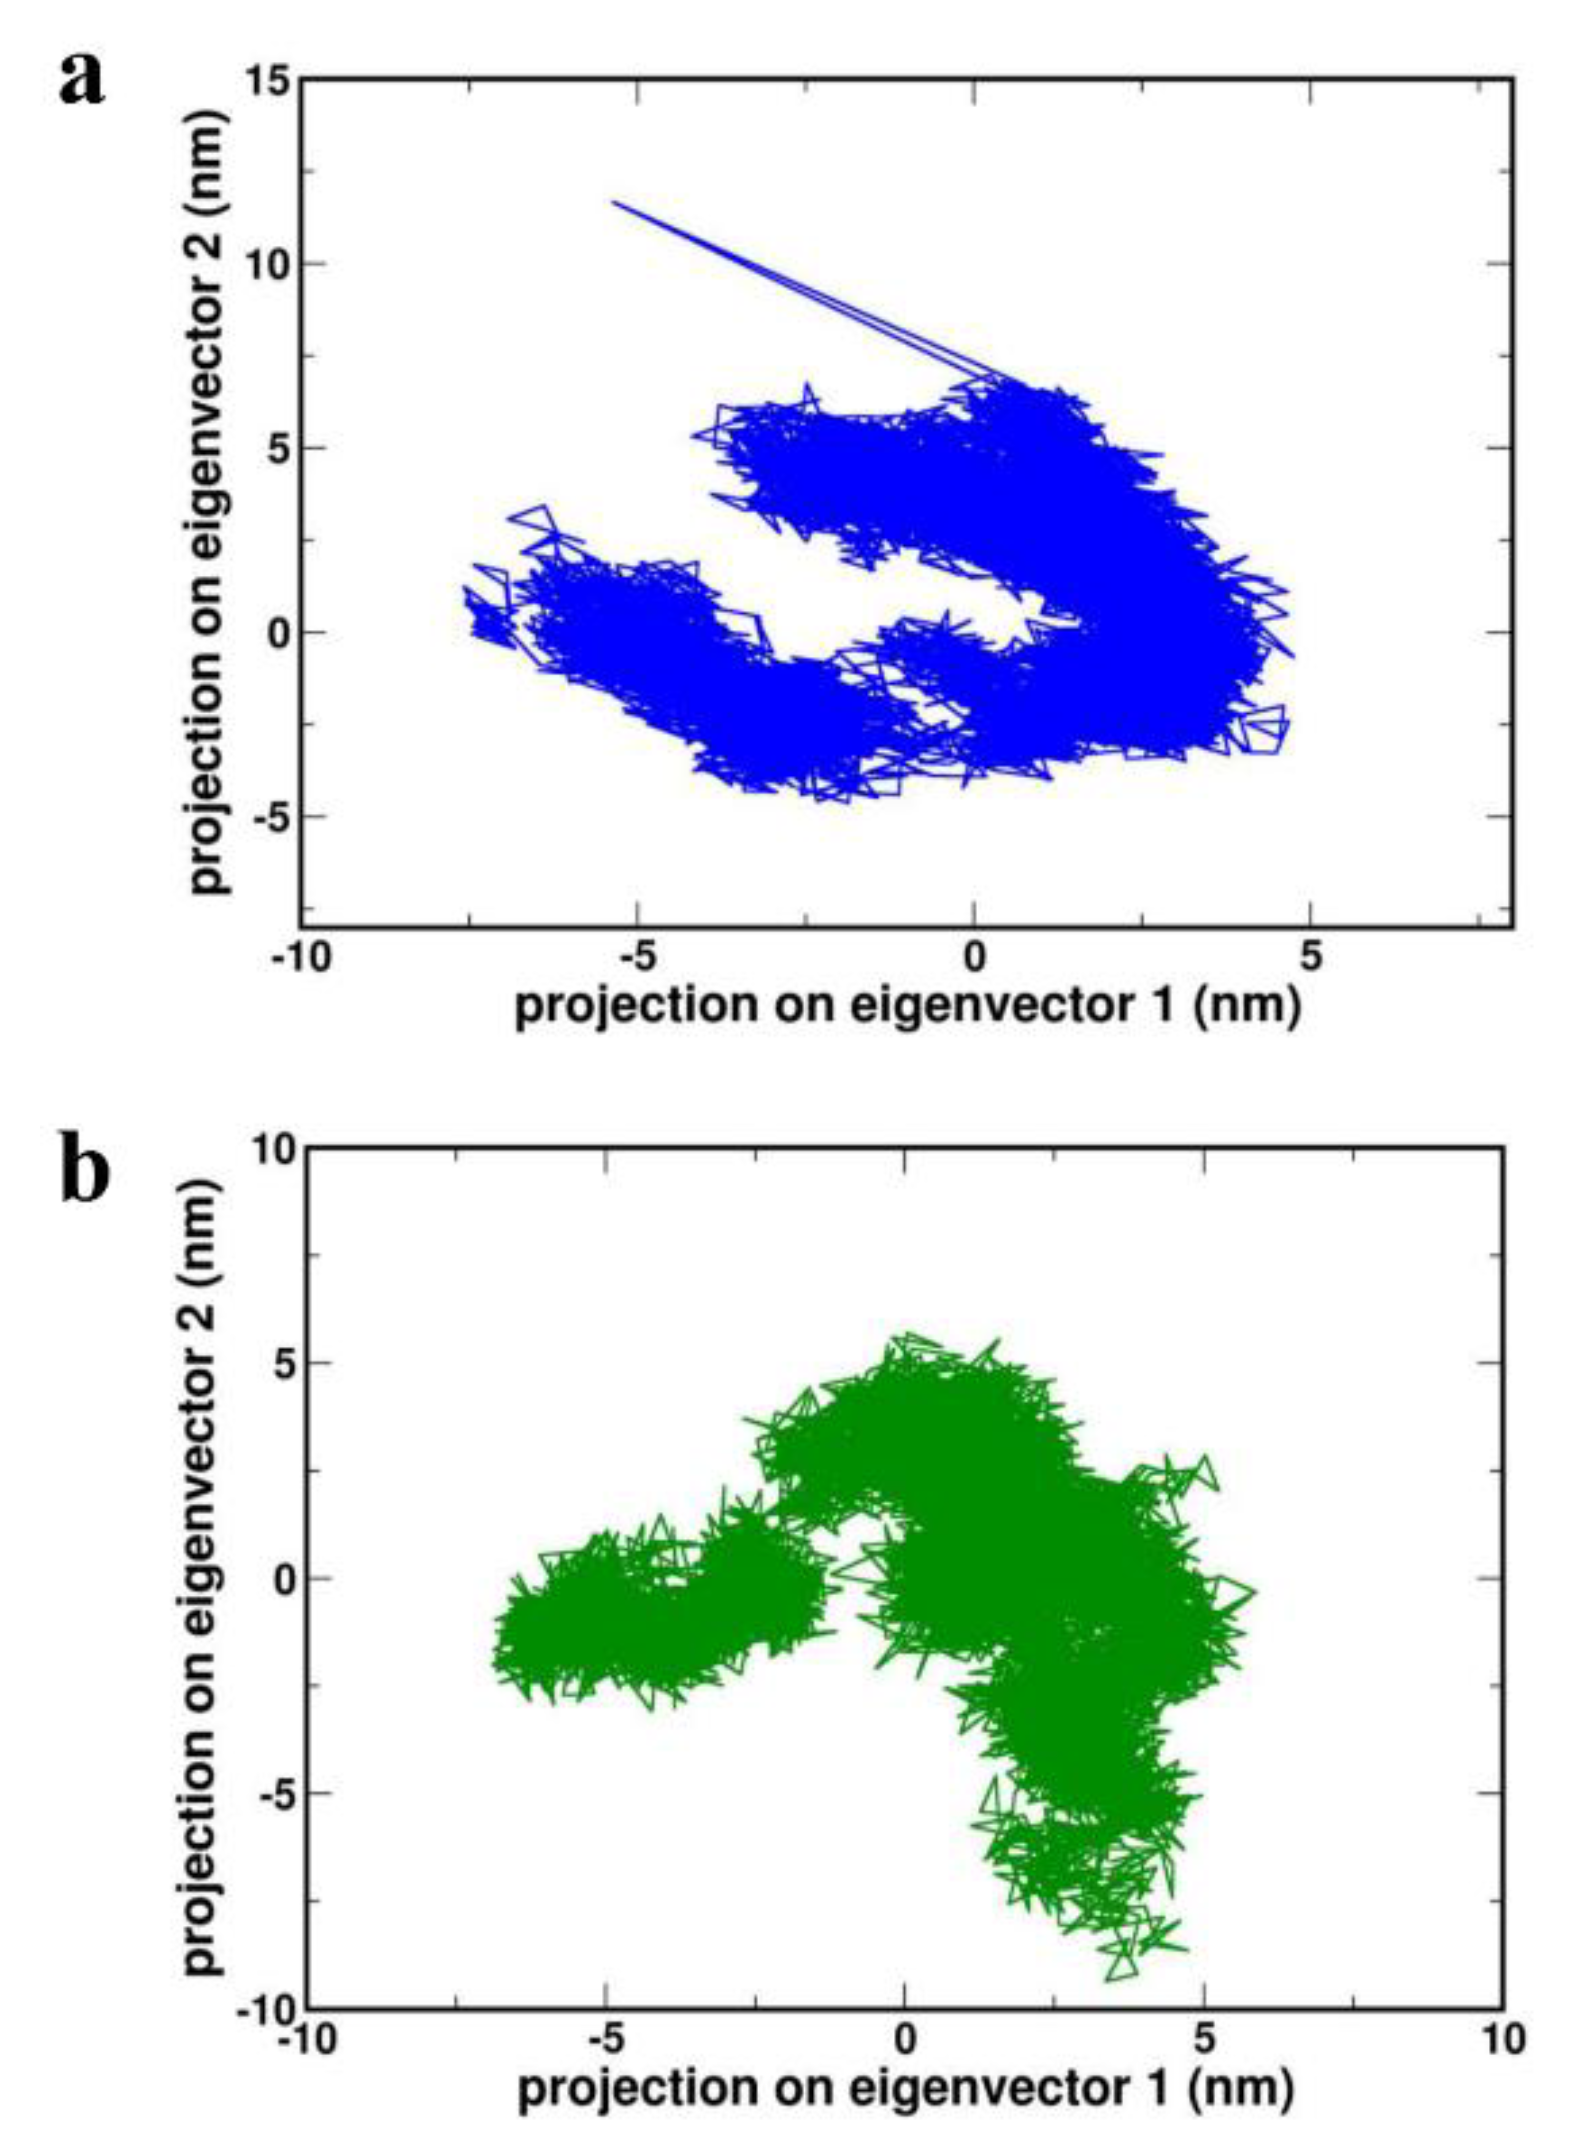
Figure 10.
Gibbs free energy landscape plot of (a) HBD-2/4XCT (b) HBD-2/2I0E.
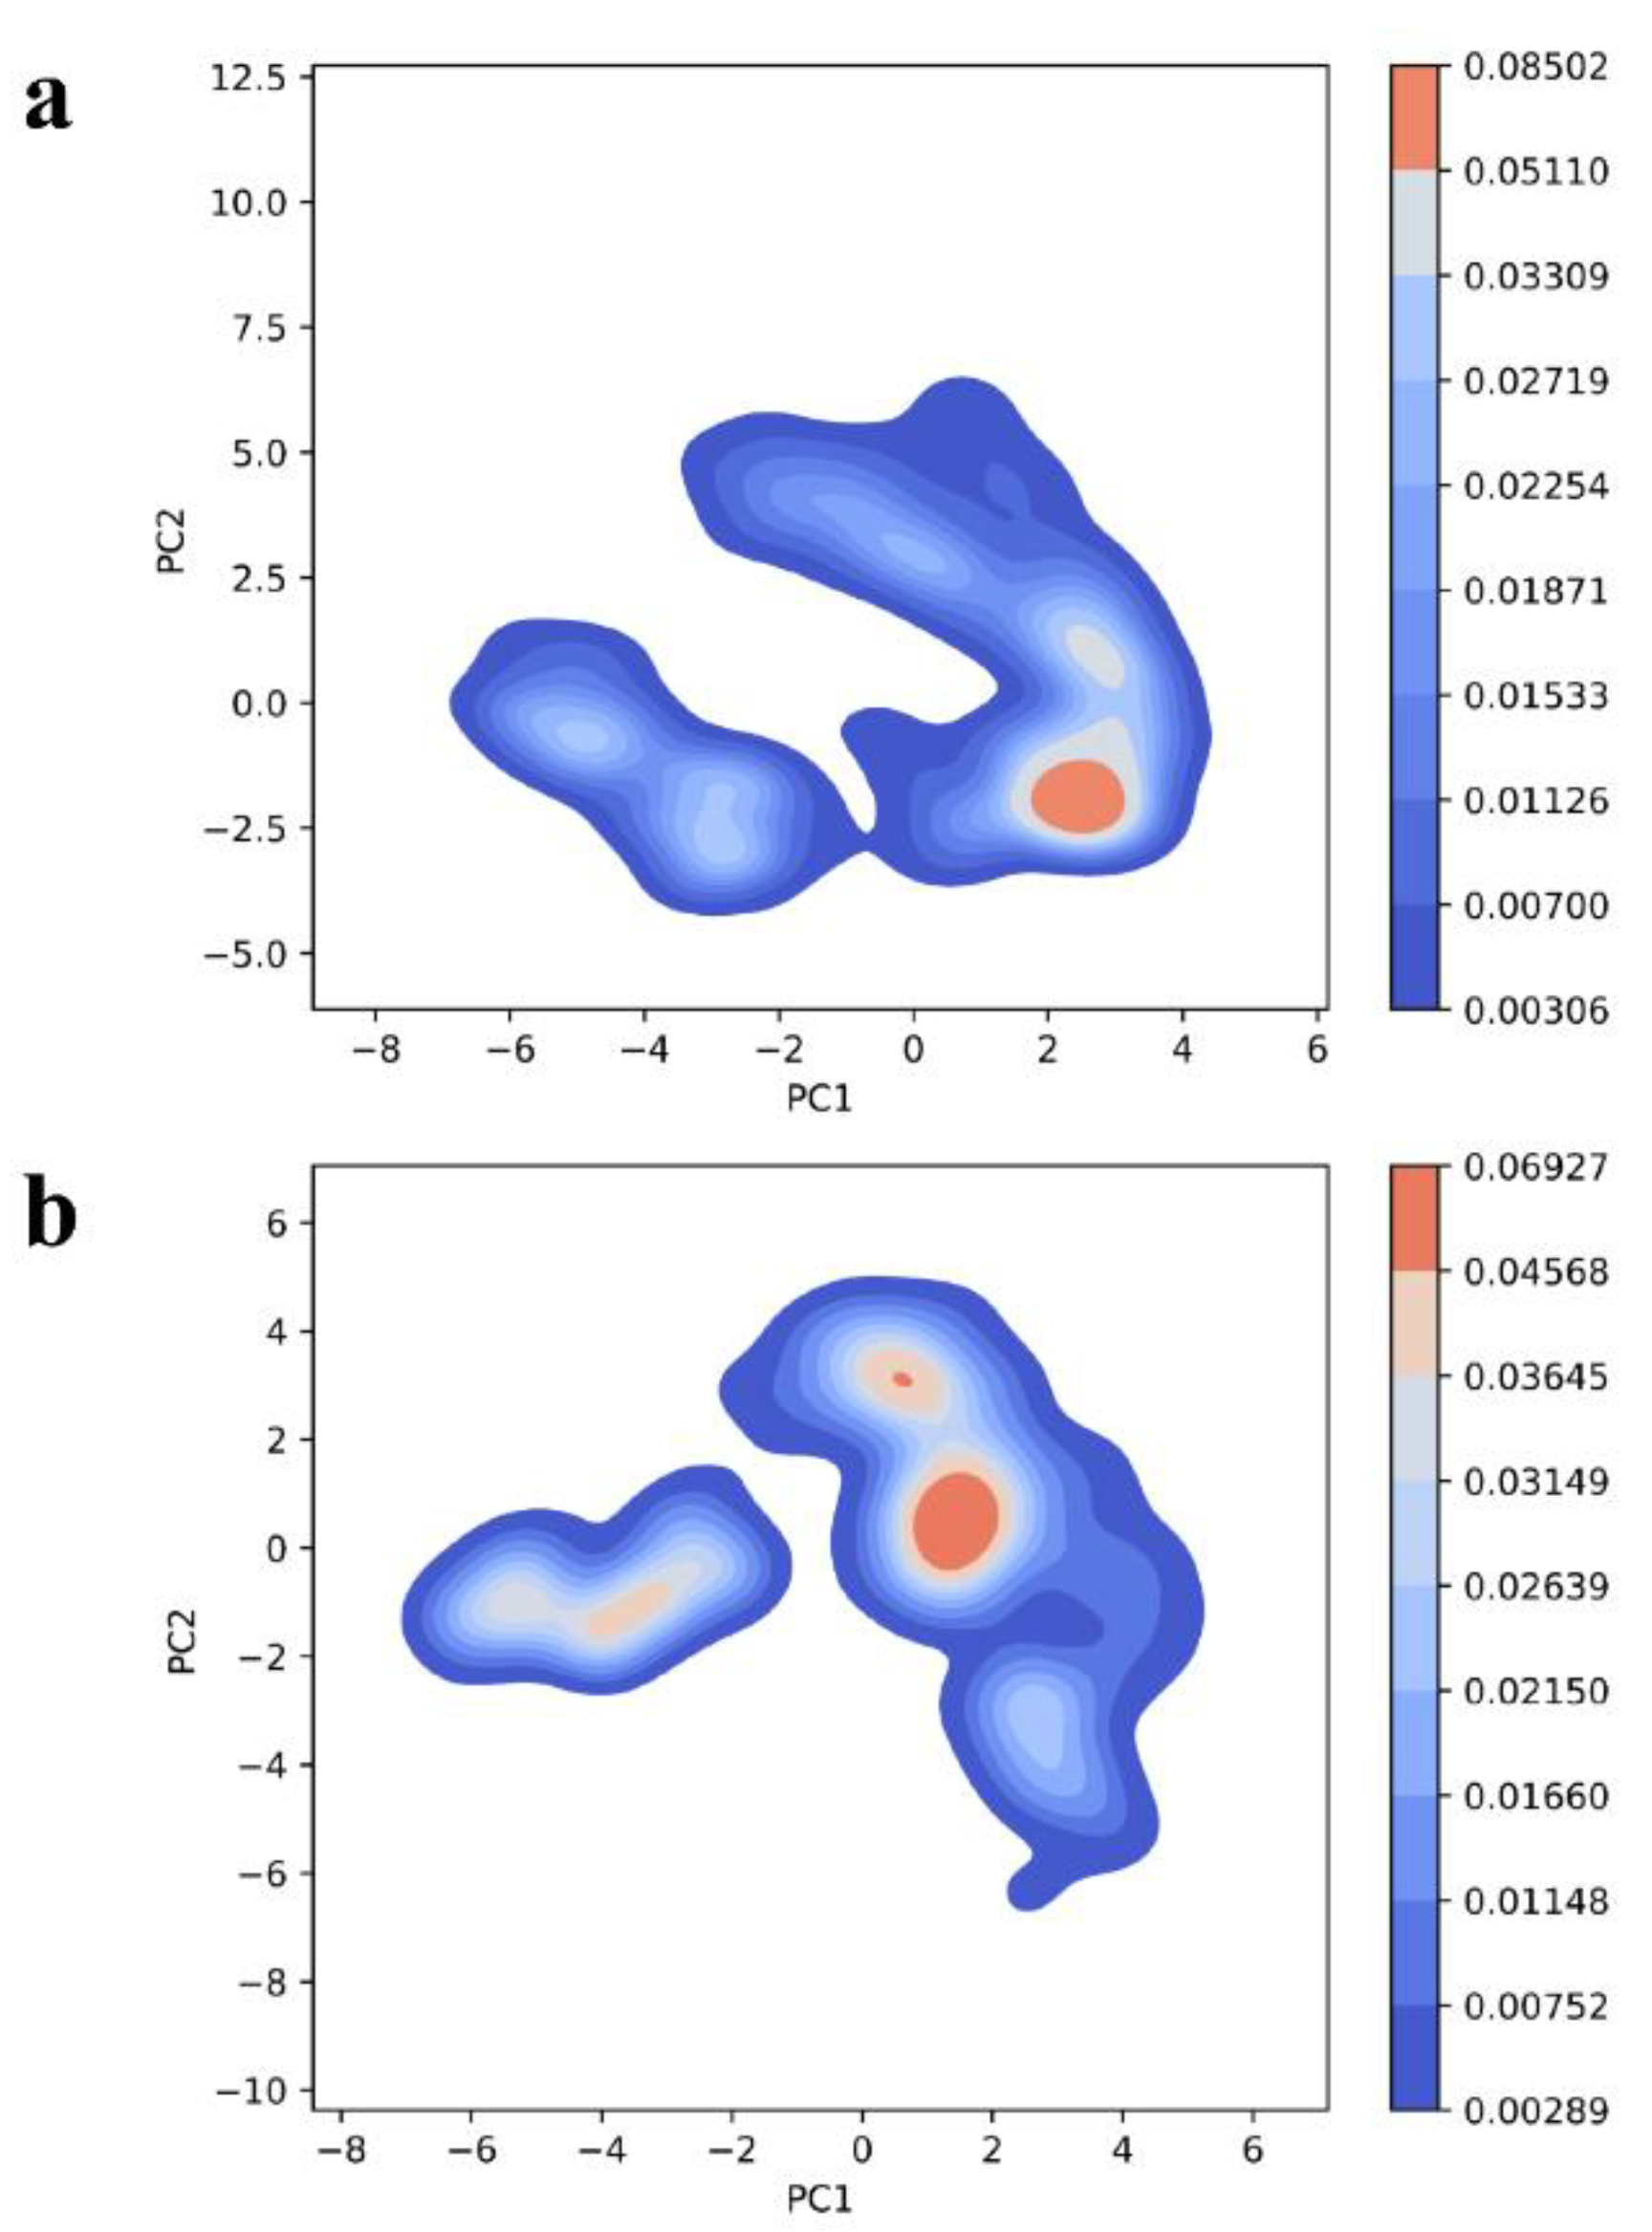

Table 1.
Zscore of the top 10 complexes for both the receptors 4XCT and 2I0E.
| S. No. | Poses | Z-score | |
|---|---|---|---|
| 4XCT | 2I0E | ||
| 1. | Pose 1 | -118.026 | -140.319 |
| 2. | Pose 2 | -115.232 | -132.052 |
| 3. | Pose 3 | -114.756 | -128.945 |
| 4. | Pose 4 | -113.711 | -128.348 |
| 5. | Pose 5 | -113.289 | -126.638 |
| 6. | Pose 6 | -113.257 | -126.389 |
| 7. | Pose 7 | -112.061 | -126.261 |
| 8. | Pose 8 | -111.632 | -124.635 |
| 9. | Pose 9 | -110.688 | -121.732 |
| 10. | Pose 10 | -109.346 | -120.367 |
Table 2.
Residue-Residue interactions (hydrogen bonds) and distance between the bonds across the protein-protein interface of the between chains A (4XCT) and B (HBD-2).
Table 2.
Residue-Residue interactions (hydrogen bonds) and distance between the bonds across the protein-protein interface of the between chains A (4XCT) and B (HBD-2).
| S. No. | Chain A (4XCT) | Chain B (HBD-2) | Distance (Å) |
|---|---|---|---|
| 1. | Tyr179 | Arg291 | 2.82 |
| 2. | His226 | Lys308 | 2.08 |
| 3. | His230 | Lys308 | 3.12 |
| 4. | His236 | Lys308 | 2.90 |
| 5. | Tyr248 | Lys279 | 2.24 |
| 6. | Tyr248 | Lys279 | 1.70 |
Table 3.
Residue-Residue interactions (hydrogen bonds and salt-bridge interactions) and distance between the bonds across the protein-protein interface of the between chains A (2I0E) and B (HBD-2).
Table 3.
Residue-Residue interactions (hydrogen bonds and salt-bridge interactions) and distance between the bonds across the protein-protein interface of the between chains A (2I0E) and B (HBD-2).
| S. No. | Chain A (4XCT) | Chain B (HBD-2) | Distance (Å) |
|---|---|---|---|
| Hydrogen bonding interactions | |||
| 1. | Lys468 | Gln695 | 1.5 |
| 2. | Gly543 | Lys679 | 2.1 |
| Salt-bridge interactions | |||
| 1. | Asp381 | Arg691 | 4.00 |
| 2. | Asp466 | Lys694 | 3.92 |
| 3. | Glu542 | Lys679 | 3.06 |
| 4. | Glu544 | Lys679 | 3.84 |
Table 4.
Average values of root-mean square-deviation (RMSD), root-mean square-fluctuation (RMSF), radius of gyration (ROG), solvent accessible surface area (SASA) was calculated from 1000 ns MD trajectories.
Table 4.
Average values of root-mean square-deviation (RMSD), root-mean square-fluctuation (RMSF), radius of gyration (ROG), solvent accessible surface area (SASA) was calculated from 1000 ns MD trajectories.
| S. No. | Complex | Average RMSD (nm) | Average RMSF (nm) | Average ROG (nm) |
Average SASA (nm2) |
|---|---|---|---|---|---|
| 1. | HBD-2/4XCT | 0.303±0.01 | 0.338±0.098 | 1.633±0.034 | 101.278±0.640 |
| 2. | HBD-2/2I0E | 0.399±0.06 | 0.451±0.330 | 2.063±0.024 | 183.409±21.349 |
Table 5.
Average values of molecular mechanics Poisson-Boltzmann surface area-based energy, Van der Waals energy, electrostatic energy, polar solvation energy, and SASA energy were calculated for every 100 ns of the last 500 ns MD simulation trajectories.
Table 5.
Average values of molecular mechanics Poisson-Boltzmann surface area-based energy, Van der Waals energy, electrostatic energy, polar solvation energy, and SASA energy were calculated for every 100 ns of the last 500 ns MD simulation trajectories.
| S. No. | Complex | Binding free energy (MMPBSA) (kJ/mol) | Van der Waal energy (kJmol) | Electrostatic energy (kJmol) | Polar solvation energy (kJmol) | SASA energy (kJmol) |
|---|---|---|---|---|---|---|
| 1. | HBD-2/4XCT | -2318.73±35.46 | -244.03±28.47 | -29.72.88±35.61 | 929.77±38.78 | -31.59±2.58 |
| 2. | HBD-2/2I0E | -2329.62±61.24 | -415.49±33.27 | -3448.1±171.41 | 1588.83±171.95 | -54.85±3.82 |
Disclaimer/Publisher’s Note: The statements, opinions and data contained in all publications are solely those of the individual author(s) and contributor(s) and not of MDPI and/or the editor(s). MDPI and/or the editor(s) disclaim responsibility for any injury to people or property resulting from any ideas, methods, instructions or products referred to in the content. |
© 2024 by the authors. Licensee MDPI, Basel, Switzerland. This article is an open access article distributed under the terms and conditions of the Creative Commons Attribution (CC BY) license (http://creativecommons.org/licenses/by/4.0/).
Copyright: This open access article is published under a Creative Commons CC BY 4.0 license, which permit the free download, distribution, and reuse, provided that the author and preprint are cited in any reuse.


