
Submitted:
29 August 2024
Posted:
30 August 2024
You are already at the latest version
Abstract
Background: The high global prevalence of prediabetes requires its early identification. Amino acids have emerged as potential predictors of prediabetes. This study aims to investigate the association between BCAAs and prediabetes in the Kazakh population. Materials and Methods: In this case-control study, plasma BCAAs levels were measured using the Trace GC 1310 gas chromatography system coupled with the TSQ 8000 triple quadrupole mass spectrometer (Thermo Scientific, Austin, TX, USA) followed by silylation with the BSTFA + 1% TMCS derivatization method. Biochemical parameters, including total cholesterol, HDL-C, LDL-C, triglycerides, fasting glucose, HbA1c, and creatinine, were assessed for each participant. Anthropometric and physical examinations, including blood pressure, heart rate measurements, and family history collection, were conducted by trained professionals. Results: The final analysis included data from 112 Kazakhs with prediabetes and 55 without prediabetes, aged 36-65 years. Of the thirteen AAs analyzed, only alanine showed a significant association with prediabetes risk. Our findings revealed an inverse relationship between alanine and aspartic acid levels, and direct association of lysine and prediabetes in Kazakh ethnicity. Conclusion: Lower plasma level of alanine and aspartic acid, and higher level of lysine may serve as predictive biomarkers for prediabetes in the Kazakh population. This research is funded by the Science Committee of the Ministry of Education and Science of the Republic of Kazakhstan (grant AP14871855).
Keywords:
prediabetes
; amino acids
; prediction
; Kazakh population
1. Introduction
The introduction should briefly place the study in a broad context and highlight why it is important. It should define the purpose of the work and its significance. The current state of the research field should be carefully reviewed and key publications cited. Please highlight controversial and diverging hypotheses when necessary. Finally, briefly mention the main aim of the work and highlight the principal conclusions. As far as possible, please keep the introduction comprehensible to scientists outside your particular field of research. References should be numbered in order of appearance and indicated by a numeral or numerals in square brackets—e.g., [1] or [2,3], or [4,5,6]. See the end of the document for further details on references.
2. Materials and Methods
This is a case-control study, conducted in five primary care centers (PHCs) in Semey city of Abay oblast located in the East Kazakhstan. We recruited participants during the period from December 2022 to March 2024.
Data collection and Measurement
Standardized questionnaires were employed to gather demographic information, including smoking status, family history, and hereditary predispositions to cardiovascular diseases (CVD) and hypertension (HT). A comprehensive physical examination was conducted to assess anthropometric parameters, which included measurements of weight, height, blood pressure, and waist circumference which performed in accordance with the guidelines established by the European Society of Cardiology (ESC) and the European Society of Hypertension (ESH). A standardized stadiometer was used for height assessment, while a calibrated scale was utilized for weight measurement. Blood pressure (BP) was measured utilizing the Korotkov method, in accordance with the ESH/ESC algorithm, with participants resting in a seated position during the assessment [17]. Two consecutive measurements were taken for each participant, and the average of these values was recorded. Body mass index (BMI) was calculated using the formula: weight (kg) divided by height (m²). Information regarding the history of comorbidities and any medications taken was obtained from medical records as well as through participant interviews. All collected information for each participant was compiled into an individualized file with coded personal data to ensure confidentiality.
Participants
Initially, a total of 253 candidates of Kazakh ethnicity were enrolled in the study, comprising 130 individuals diagnosed with prediabetes (cases) and 123 individuals with normal glycemia (controls) based on a simple random sampling.
Exclusion criteria included ethnicity other than Kazakhs, the presence of confirmed diabetes, history of stroke or myocardial infarction (MI), heart failure, thyrotoxicosis, hypothyroidism, and the use of statin therapy for less than six months prior to the initiation of the study.
During the laboratory phase, 62 samples were excluded due to storage issues. Additionally, at the data analysis stage, 24 participants were excluded following the diagnosis of new-onset T2DM. Consequently, data from 167 participants, 112 cases and 55 controls, were included in the final analysis (Figure 1).
Ethics Considerations
The research protocol received approval from the Ethics Committee of Semey Medical University (protocol #7, date of approval March 16, 2022). In adherence to ethical standards, confidentiality and privacy were rigorously maintained throughout the study. All personal data were anonymized and stored in a secure database, accessible solely to the project manager and two designated members of the research team. Before participation, all individuals were provided comprehensive information regarding the aims and objectives of the study. Participants were assured that their involvement was entirely voluntary, with the provision to withdraw from the study at any point without the requirement to provide a rationale, and without any associated penalties. Following this, informed consent was obtained from individuals who met the established inclusion criteria.
Diagnostic Criteria
Dysglycemia, encompassing impaired fasting glucose (IFG), impaired glucose tolerance (IGT), prediabetes, and diabetes, was defined in accordance with the current guidelines established by the American Diabetes Association (ADA) [18]. Glycemic status was classified based on HbA1c levels, with diabetes indicated by values ≥6.5% and prediabetes defined by values ranging from 5.7% to 6.4%. MS was diagnosed following the criteria outlined by the International Diabetes Federation [19,20], which requires the presence of abdominal obesity along with at least two of the following four clinical factors: systolic blood pressure >130 mmHg or diastolic blood pressure >85 mmHg, plasma triglycerides (TG) >1.7 mmol/L, high-density lipoprotein cholesterol (HDL-C) <1.03 mmol/L in men and <1.29 mmol/L in women, and plasma glucose levels >5.6 mmol/L.
Obesity was classified according to the WHO criteria based on BMI, with the following categories established: normal weight as <25 kg/m², overweight as 25-29.9 kg/m², and obesity as >30 kg/m².
Chemicals
Biochemistry
All blood samples were collected in the morning following a fasting period of at least twelve hours, utilizing intravenous venesection. The levels of total cholesterol (TC), low-density lipoprotein cholesterol (LDL-C), high-density lipoprotein cholesterol (HDL-C), triglycerides (TG), fasting glucose, HbA1c, and creatinine were quantified in the laboratory. AA concentrations were determined via gas chromatography-mass spectrometry (GC-MS). The targeted amino acids included lysine, tyrosine, alanine, valine, leucine, isoleucine, proline, serine, threonine, methionine, aspartic acid, glutamic acid, and phenylalanine.
Gas-Chromatography Mass-Spectrometry
High-performance liquid chromatography (HPLC) grade methanol was purchased from Sigma-Aldrich (St. Louis, MO, USA). BSTFA+1% TMCS (N, O-bis (trimethylsilyl) trifluoroacetamide with 1% trimethylchlorosilane for GC) (> 99.0% purity), methoxyamine hydrochloride (> 98.0% purity) and pyridine (> 99.8% purity), AAS-18 chemical standards of metabolites were commercially obtained from Sigma-Aldrich (St. Louis, MO, USA). AAS 18 mixed standard amino acid solution (Sigma-Aldrich, St. Louis, MO, USA).
Sample Preparation
Each 100 μL blood plasma sample was mixed with 400 μL methanol: acetone mixture (2:1, v:v) to precipitate the protein. Next, the mixture was vortex-mixed for 30 s and centrifuged for 10 min (15,000 rpm) at 4˚C. The 300 μL supernatant was transferred into a 2 mL eppendorf centrifugation tube and evaporated to dryness by N2 gas with sample concentrator (Miulab, NDK200-1N, Hangzhou, China). 100 μL methoxamine hydrochloride in pyridine (10 mg/mL) was added to the dried tube, and the mixture was mixed on a vortex for 30 s and incubated for 2 h at 37˚C. Finally, 100 μL of BSTFA derivatization agent was added to the mixture, vortexed for 30 s, and heated at 50˚C for 2 h. The final solution was taken for GC-MS analysis [21,22].
GC-MS Analysis
The plasma amino acid analysis was conducted on a Trace GC 1310 gas chromatography instrument coupled to TSQ 8000 triple quadrupole mass spectrometer (Thermo Scientific, Austin, TX, USA), and equipped with an autosampler AS 1310. The column used for all analyses was a Thermo Scientific TG-5SilMS column (30 m × 0.25 mm × 0.25 μm). The column temperature procedure was designed as follow: initially maintained at 50˚C for 5 min, programmed to 250˚C at a rate of 5˚C/min, and then held at 250˚C for 15 min. 99% pure helium was used as a carrier gas and the device was equipped with a triple helium gas filter (Thermo, Singapore) with a flow rate of 1.0 mL/min. The septum purge was switched on with a flow rate of 3 mL/min constantly. The injector temperature was set at 280˚C, MS transfer line temperature was set at 250˚C and the ion source temperature was 240˚C. The mass spectrometer was operated under electron ionization (EI) in full scan mode range varied from m/z 30 to 550 with a 0.2 s scan velocity, and the detector voltage was 0.96 kV. Ionization was achieved by a 70 eV electron beam. Instrument control, data acquisition, and data processing were performed by XCalibur software (Thermo Scientific, Austin, TX, USA). All of the detected peak features were identified by standards and the NIST Mass Spectral Search Program [23].
Quantitative Variables
The status of prediabetes, HT, hereditary predisposition to CVDs, and lipid profile parameters, including TC, LDL-C, HDL-C, and TG, were designated as binary variables based on NCEP ATP III [24]. Smoking status was categorized into three groups: nonsmokers, former smokers, and current smokers. BMI was classified as a ranked variable, with categories of normal weight, overweight, and obesity. Age was stratified into four groups: less than 39 years, 40-49 years, 50-59 years, and older than 60 years. Each AA was treated as a binary variable based on the 50th percentile cut-off. Preliminary statistical analyses were conducted to assess the normality of all continuous variables. For those variables exhibiting a highly skewed distribution to the right, a log transformation was applied, if provided the proportion of zero values was less than 2%.
Statistical Methods
Statistical analysis was conducted using STATA Statistical Software, release 15, College Station, TX; StataCorp LLC. Continuous variables were reported as means ± standard deviation (SD) if they followed a normal distribution, while categorical variables were presented as proportions expressed in percentages. For the primary analysis, chi-squared test and odds ratios (ORs) and Mantel-Haenszel ORs with 95% confidence intervals (CI) were calculated to examine the associations between categorical risk factors and the primary outcome of interest. The final statistical analysis employed a stepwise method with forward selection in a multiple binary logistic regression model, which included covariates demonstrating significance for the fitted final model. The adequacy of the model was evaluated through a likelihood ratio test (LRT). Receiver operating characteristic (ROC) analysis was performed to determine the area under the curve (AUC) for selected into the final logistic regression (LR) model targeted amino acids, specifically lysine, alanine, and aspartic acid. Cut-off levels for these amino acids were established with their corresponding sensitivity and specificity were determined using Liu’s test.
3. Results
3.1. Descriptive Data
In total, data from 75 Kazakh males and 95 females were included into final analysis. There were 112 individuals with prediabetes and 55 without prediabetes. Only quarter of participants had healthy weight and almost half met criteria of MS. Baseline characteristics and distribution of the potential risk factors for prediabetes are summarized in Table 1.
In a comparative analysis, individuals diagnosed with prediabetes exhibited a higher prevalence of unhealthy weight, smoking habits, hypertension, and dyslipidemia relative to control subjects. The study identified that 70.83% males and 64.21% females were classified as prediabetic. Among the female participants, the majority were non-smokers (85.26%), while nearly half of the male participants (44.44%) also refrained from smoking. Conversely, 8.42% of females and 36.11% of males were identified were identified as current smokers, with 6.32% of females and 19.44% of males classified as former smokers (p=0.0001). Notably, 76% of participants with confirmed hypertension were receiving regular antihypertensive therapy. There was strong evidence of a linear trend, with the proportion of cases with prediabetes increasing with age (p=0.005).
3.2. Amino Acids and Lipid Profile
Table 2 presents a summary of the association between AAs and parameters of the lipid profile. The analysis revealed that lower plasma level of alanine, serine, methionine, glutamic acid and phenylalanine were associated with a two-fold increase in healthy plasma HDL-C levels in both male and female subjects. Notably, adjusting for BMI did not significantly alter ORs for the associations. Additionally, lower plasma levels of threonine were linked to a three-fold increase in the odds of achieving healthy HDL-C levels. Similar to the previous findings, adjusting for BMI did not influence the strength of the association between threonine and HDL-C levels. Conversely, we found no significant associations between plasma concentrations of lysine, aspartic acid, valine, leucine, and isoleucine and any parameters of the lipid profile. Importantly, none of the AAs examined exhibited a relationship with LDL-C levels.
3.3. Amino Acids and the Risk of Prediabetes
We analyzed the association between AAs and the risk of prediabetes, as detailed in Table 3. Among the thirteen AAs examined, only alanine, lysine and aspartic acid exhibited significant associations with the risk of prediabetes. Alanine and aspartic acid were found to have an inverse relationship with the risk of prediabetes, indicating that higher plasma levels of these AAs corresponded to reduced likelihood of developing this condition. Conversely, elevated plasma levels of lysine were positively associated with the increased risk of prediabetes, suggesting a direct association.
We adjusted all AAs for potential confounding factors to elucidate the true associations between AAs and risk of prediabetes risk, as summarized in Table 4. The analysis revealed that only age and BMI served as significant confounding factors influencing the relationships between alanine, lysine and aspartic acid and risk of prediabetes. At fix values of covariates in the final binary logistic regression model alanine lower than 10.86 mmol/L, aspartic lower than 0.27 mmol/L. In case of lysine we found inverse association with prediabetes, higher plasma levels of lysine (above 2.57 mmol/L) was associated with prediabetes. Other variable, including smoking status, gender, lipid profile and history of hypertension did not have a significant impact on these associations. Notably, when controlling for age and BMI the strength of the association was enhanced for both alanine and lysine; however, this adjustment did not yield a similar effect for aspartic acid. Furthermore, the Likelihood Ratio Test (LRT) substantiated the significance for both age and BMI across all logistic regression models.
When assessing the odds of developing prediabetes at fixed values of the covariates in the final logistic regression model, individuals in older age groups exhibited odds ratios ranging from 2.52 to 5.83 compared to their younger counterparts. Additionally, those classified as overweight demonstrated 2.26-fold increased odds of developing prediabetes (95%CI 0.97;5.23; p=0.05), while individuals with obesity exhibited an even greater odds ratio of 4.87 when compared to individuals with a healthy weight (95% CI 1.77; 13.34; p = 0.02). These findings highlight the critical roles of age and BMI in elucidating the associations between specific amino acids and the risk of prediabetes.
3.4. AAs and Prediction of Prediabetes
To evaluate the predictive potential of alanine, lysine, and aspartic acid in the context of prediabetes, we conducted a ROC analysis utilizing both crude and fitted logistic regression models. These models assessed the associations between the aforementioned AAs and prediabetes, while adjusting for potential confounding variables, specifically age and BMI (refer to Table 5). Our analysis revealed that the inclusion of age and BMI significantly enhanced the predictive accuracy of alanine, lysine, and aspartic acid, with the area under the ROC curve (AUC) increasing from 0.47, 0.61, and 0.49 to 0.73, 0.74, and 0.76, respectively. Furthermore, we determined the optimal cut-off levels for these AAs to effectively predict prediabetes within the study population.
4. Discussion
In the present study, we investigated the association of thirteen AAs with the risk of prediabetes within the Kazakh population. Our findings indicate a significant relationship between alanine, lysine, and aspartic acid and the risk of prediabetes. Specifically, alanine and aspartic acid exhibited a negative association with prediabetes risk, while lysine demonstrated a positive correlation. Conversely, the remaining AAs - tyrosine, valine, leucine, isoleucine, proline, serine, threonine, methionine, glutamic acid, and phenylalanine - were not associated with prediabetes risk.
Emerging evidence suggests that dysregulated metabolism of AAs plays a crucial role in the mechanisms underlying altered gluconeogenesis and the pathogenesis of IR [25,26]. Disturbances in the metabolomic profile are evident in both prediabetes and T2DM [27] with most existing research focusing on the associations between AAs and clinically manifested T2DM, while fewer studies have addressed prediabetes specifically. Notably, BCAAs - including valine, leucine, and isoleucine - have been identified as potential biomarkers for the early detection of prediabetes and IR, as well as the subsequent risk of T2DM [28]. A recent meta-analysis encompassing 22 studies, including ten studies specifically examining prediabetes and AAs, revealed that tryptophan and BCAAs are directly associated with prediabetes and may serve as predictors of this condition [29].
Interestingly, our study identified lower plasma level of alanine as a significant predictor of prediabetes risk, a finding not previously reported in the context of prediabetes. However, a recent systematic review highlighted the strong positive predictive value of alanine and other AAs in relation to T2DM risk [30]. Our data further corroborate the notion that lower levels of alanine are associated with an increased risk of prediabetes. It has been suggested that lower alanine levels in obese individuals may be associated with reduced anaplerotic oxaloacetate formation and, hence, reduced efficiency of the tricarboxylic acid (TCA) cycle activity and reduced gluconeogenesis. Hepatic glucose production occurs through three primary pathways: glycogenolysis, gluconeogenesis from glycerol, and gluconeogenesis from lactate/pyruvate/AAs [31], with the latter being the predominant pathway during prolonged fasting, which is often disrupted [32,33] in the diabetic liver [34].
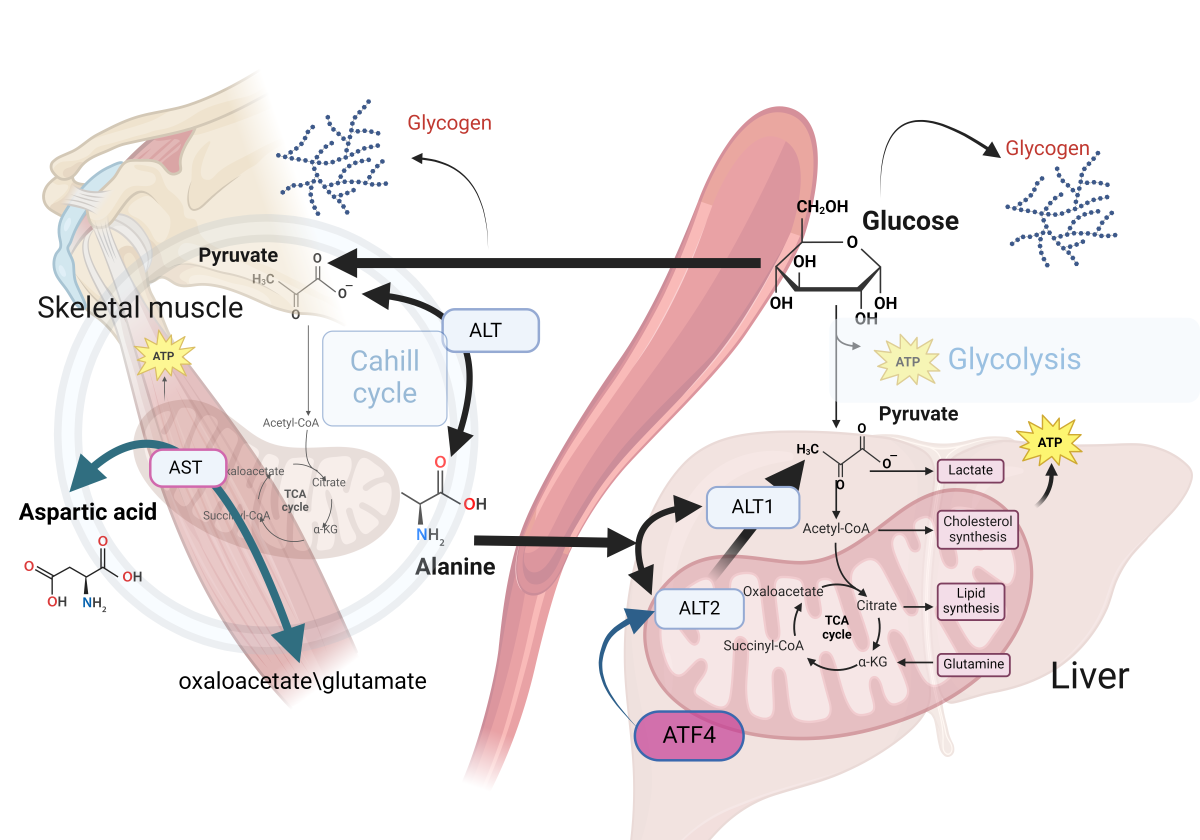
Alanine emerges as the principal amino acid catabolized by the liver in all mammals of all amino acids contributing to gluconeogenesis [35,36,37]. In muscle cells, pyruvate is converted to alanine through the catalytic action of alanine aminotransferase, (alanine transaminase, ALT) [38]. Alanine transports amino groups to the liver, where alanine is subsequently reconverted to pyruvate, enabling its entry into gluconeogenic pathways, providing energy during fasting or intense exercise [39]. Alanine undergoes transamination reactions by transferring its amino group to form pyruvate and glutamate [40]. Such processes serve to interconnect amino acid metabolism with the citric acid cycle and subsequent energy production in the liver, kidneys, and small intestine [41].
For gluconeogenesis to occur, alanine must be converted to pyruvate. This conversion is facilitated by two enzymes, ALT1 and ALT2, highly expressed in the liver. ALT1 is found in the cytosol, while ALT2 is located in the mitochondrial matrix [41]. While transamination can occur in the cytosol, recent investigations suggest that mitochondrial ALT2 plays a critical role in gluconeogenesis by facilitating the conversion of alanine to pyruvate within the mitochondrial matrix [42,43].
Increased expression of ALT2 has been observed in both obese humans and murine models [44]. ALT2 expression is regulated by activating transcription factor 4 (ATF4) in liver. Notably, silencing ALT2 in the liver of obese mice has been reported to diminish alanine-induced hyperglycemia while concurrently elevating plasma alanine levels, suggesting a regulatory feedback mechanism pertinent to alanine metabolism in obesity [45].
In muscle cells, the conversion of pyruvate to alanine is catalyzed by ALT. This transamination reaction facilitates the conversion of alanine and α-ketoglutarate into pyruvate and glutamate [46]. Alanine serves as a vehicle for the transport of amino groups from peripheral tissues to the liver, where alanine is reconverted to pyruvate facilitating its subsequent utilization in gluconeogenesis. This pathway is particularly vital during periods of fasting or intense physical exercise. While ALT is predominantly found in the liver, it is also present in other tissues including the kidneys, heart, and muscle cells, highlighting its importance in amino acid metabolism across different physiological contexts [47] (Figure 2).
This figure illustrates the role of alanine in gluconeogenesis, emphasizing the enzymatic conversion of alanine to pyruvate through the action of ALT isoenzymes, specifically ALT1 in the cytosol and ALT2 in the mitochondria The involvement of ALT2 in this metabolic pathway is critical for gluconeogenesis. Elevated expression levels of ALT2 have been observed in both obese human subjects and relevant animal models, which suggests a potential link between ALT2 activity and obesity-related metabolic alterations. The regulation of ALT2 expression by the transcription factor ATF4 underscores its significant role in the metabolic adaptation in obesity. Experimental evidence indicates that silencing ALT2 in the hepatic tissue of obese mice leads to a decrease in alanine-induced hyperglycemia and a concomitant increase in plasma alanine levels. These findings suggest the existence of a feedback mechanism governing alanine metabolism in obesity.
Aspartic acid metabolism plays a significant role in maintaining essential cellular functions, with a particular focus on the biochemical pathway leading to the synthesis of L-aspartic acid. L-aspartic acid is generated from the transamination reaction between oxaloacetate and glutamate, catalyzed by mitochondrial AST. In the context of diabetes, there is a significant decline in the synthesis of aspartic acid from oxaloacetate, which has been associated with decreased activity of AST and BCAAs dysregulation.
Our investigation also revealed a positive association between lysine levels and prediabetes risk, consistent with findings from studies conducted in Mexican populations. However, our results diverged from those studies regarding threonine and arginine, which were not found to be significant in our analysis [48]. Lysine, an essential amino acid, has been implicated in the progression of prediabetes and T2DM. Elevated levels of lysine and its metabolite, α-aminoadipic acid, have been observed in individuals with insulin resistance, indicating a potential link between lysine metabolism and the development of T2DM [49]. Additionally, L-homoarginine, a metabolite derived from lysine catabolism, may be associated with cardiovascular disease and T2DM through pathways involving arginine and nitric oxide production [50].
Ethnic disparities in AA metabolism are noteworthy. Recent data have highlighted the predictive role of aspartic acid (Asp) in prediabetes among European Americans, with a reported 2.7-fold increase in risk. Our findings, however, suggest an inverse association within the Kazakh population, and we did not confirm the predictive potential of histidine as reported in previous studies [51]. Asp metabolism is essential for various cellular processes, with L-aspartic acid synthesized from oxaloacetate and glutamate by mitochondrial aspartate aminotransferase. This amino acid plays critical roles in protein synthesis, gluconeogenesis, and neurotransmission, and contributes to NADH delivery and redox balance via the malate-aspartate shuttle [52]. Moreover, a high asparagine to Asp ratio has been associated with an elevated risk of T2DM, particularly in females or individuals over 50 years of age [53]. In diabetes, impaired Asp synthesis from oxaloacetate has been attributed to decreased mitochondrial aspartate aminotransferase activity and dysregulation of BCAAs [54].
The results of the present study indicate an inverse association between AAs and HDL-C. Conversely, a direct association was observed between AAs and TG for the AAs alanine, serine, threonine, glutamic acid, and phenylalanine. We hypothesize that under a high-fat diet, alanine metabolism becomes dysregulated, leading to the excessive generation of acetyl-CoA from pyruvate and subsequent deficits in energy metabolism. Previous studies have noted significant correlations between serine, alanine, and pyruvate levels, indicating that decreased serine levels may disrupt the acetyl-CoA pathway. Xiao-fan et al. observed that lower concentrations of specific AAs (alanine, serine, methionine, glutamic acid, and phenylalanine) correlated with higher [HDL-C] levels in hyperlipidemic rats subjected to a high-fat diet. Decreased threonine levels were associated with higher odds of achieving healthy HDL-C levels [55]. In contrast, elevated serum BCAA levels were positively correlated with TG and negatively with HDL-C in the entire population [56].
External factors and alterations in cellular metabolomes can trigger distinct glycogenesis pathways, resulting in changes in metabolite utilization. Mitochondrial aging is characterized by reduced TCA cycle efficiency and gluconeogenesis. Mitochondrial dysfunction in high metabolic rate tissues, such as the brain, liver, and heart, leads to decreased energy capacity and disrupted redox balance. This decline manifests as diminished TCA cycle efficiency due to reduced oxidative capacity, impaired oxidative phosphorylation, and decreased ATP production [57]. Furthermore, compromised glucose transport and TCA cycle function may contribute to increased alanine catabolism to pyruvate [58]. Hepatic insulin signaling can suppress gluconeogenesis while stimulating de novo lipogenesis, further complicating metabolic regulation [59]. The decline in mitochondrial capacity in liver and adipose tissues significantly impacts glucose and fatty acid metabolism, contributing to age-related metabolic disorders.
In the present study we have an attempt to determine optimal cutoff points for prediction prediabetes after controlling for potential confounding factors like age and BMI in Kazakh population. We estimated that for alanine the optimal cutoff level is 10.21 mmol/L (sensitivity 90%, specificity 37.74%), for lysine the optimal cutoff point is 2.51 mmol/L (sensitivity 79.01%,
Limitations
The study has its own limitations that warrant careful consideration. Firstly, the diagnosis of prediabetes in this study was exclusively based on fasting glucose and HbA1c levels, which represent only a subset of potential diagnostic criteria. Incorporating the glucose tolerance test (GTT) could enhance the precision and accuracy of the classification of prediabetes within our cohort. Secondly, the imbalance in the ratio of cases to controls presents a concern for diminished statistical power. To mitigate this issue, we increased the total sample size; however, this adjustment may not entirely offset the potential limitations imposed by the original case-control ratio. Thirdly, the findings of this study are primarily applicable to the Kazakh ethnicity, thereby limiting the generalizability of the results to broader populations. As such, caution should be exercised when attempting to extrapolate these findings to other ethnic groups.
5. Conclusions
Lower plasma levels of alanine and aspartic acid, alongside elevated levels of lysine, were significantly associated with an increased risk of prediabetes, particularly after controlling for age and BMI in the Kazakh population. These findings suggest a potential metabolic dysregulation that may contribute to the pathophysiology of prediabetes. However, to validate our conclusions and explore the underlying mechanisms, further studies with substantially larger sample sizes are warranted.
Author Contributions
Conceptualization, A.N., I.V.; methodology, A.N., M.T., I.V.; software, A.N., B.K., M.T.; validation, M.T., D.K., and A.D.; formal analysis, A.N., I.V., E.S.; investigation, A.N., M.T., I.V., B.K., D.D., K.K., E.S., and D.K.; writing – original draft preparation, A.N., I.V., B.K., M.T., D.D.; writing – review and editing, A.N., I.V., K.K., D.K.; supervision, A.N., A.D.; project administration, A.N., M.T., I.V., A.D. All authors have read and agreed to the published version of the manuscript.
Funding
This research is funded by the Science Committee of the Ministry of Education and Science of the Republic of Kazakhstan (Grant number AP14871855).
Institutional Review Board Statement
The study was conducted according to the guidelines of the Declaration of Helsinki, and approved by the Ethics Committee of Semey Medical University (protocol # 7,date of approval March 16,2022)
Informed Consent Statement
Informed consent was obtained from all subjects involved in the study.
Acknowledgments
The authors would like to thank all the participants of this study for their cooperation and the Ministry of Education and Science of Kazakhstan for their support and cooperation.
Conflicts of Interest
The Authors declare that they do not have any conflict of interest.
References
- Abate, N. , & Chandalia, M. ‘Ethnicity and type 2 diabetes: focus on Asian Indians.’. Journal of diabetes and its complications, 2001, 15(6), 320–327.
- Arora, P., Kumar, V. and Popli, P. Conceptual Overview of Prevalence of Prediabetes. Current Diabetes Reviews. 2024. [CrossRef]
- Kim, S.H. Reframing prediabetes: A call for better risk stratification and intervention. Journal of Internal Medicine, 2024, 295(6), pp.735-747. [CrossRef]
- Committee, T.I.E. International Expert Committee report on the role of the A1C assay in the diagnosis of diabetes. Diabetes care, 2009, 32(7), p.1327.
- Piller, C. Dubious diagnosis. 2019. [Google Scholar] [CrossRef]
- https://www.who.int/publications/i/item/definition-and-diagnosis-of-diabetes-mellitus-and-intermediate-hyperglycaemia.
- Genc, S. , Evren, B., AYDIN, M. and Sahin, I. Evaluation of prediabetes patients in terms of metabolic syndrome. European Review for Medical & Pharmacological Sciences, 2024, 28(7). [CrossRef]
- Xu, H. , Li, X., Adams, H., Kubena, K. and Guo, S. Etiology of metabolic syndrome and dietary intervention. International journal of molecular sciences, 2018, 20(1), p.128. [CrossRef]
- Standl, E. Aetiology and consequences of the metabolic syndrome. European Heart Journal Supplements, 2005, 7 (suppl_D), pp.D10-D13. [CrossRef]
- Davidson, M.B. The role of prediabetes in the metabolic syndrome: guilt by association. Metabolic Syndrome and Related Disorders, 2023, 21(4), pp.197-204. [CrossRef]
- Knezek, S. , Engelen, M. , Ten Have, G., Thaden, J. and Deutz, N. Prediabetes Is Associated with Specific Changes in Valine Metabolism. Current Developments in Nutrition, 2022, 6, p34. [Google Scholar] [CrossRef]
- Wang, S. , Jung, S. and Ko, K.S. Effects of amino acids supplementation on lipid and glucose metabolism in HepG2 cells. Nutrients, 2022, 14(15), p.3050. [CrossRef]
- Formagini, T. , Brooks, J. V., Roberts, A., Bullard, K.M., Zhang, Y., Saelee, R. and O’Brien, M.J. Prediabetes prevalence and awareness by race, ethnicity, and educational attainment among US adults. Frontiers in Public Health, 2023, 11, p1277657. [Google Scholar] [CrossRef]
- DING, Q. , LU, Y., HERRIN, J., ZHANG, T. and MARRERO, D.G. 1271-P: Associations of Combined Socioeconomic, Behavioral, and Metabolic Factors with Undiagnosed Diabetes and Prediabetes among Different Racial and Ethnic Groups. Diabetes, 2023, 72(Supplement_1). [CrossRef]
- Adjei, N.K. , Samkange-Zeeb, F. , Kebede, M., Saleem, M., Heise, T.L. and Zeeb, H. Racial/ethnic differences in the prevalence and incidence of metabolic syndrome in high-income countries: a protocol for a systematic review. Systematic reviews, 2020, 9, pp.1–5. [Google Scholar] [CrossRef]
- Seah, J.Y.H. , Hong, Y., Cichońska, A., Sabanayagam, C., Nusinovici, S., Wong, T.Y., Cheng, C.Y., Jousilahti, P., Lundqvist, A., Perola, M. and Salomaa, V. Circulating metabolic biomarkers consistently predict incident type 2 diabetes in Asian and European populations–a plasma metabolomics analysis of four ethnic groups. medRxiv, 2021, pp.2021-07.
- Mancia, G.; Fagard, R.; Narkiewicz, K.; Redon, J.; Zanchetti, A.; Böhm, M.; Christiaens, T.; Cifkova, R.; De Backer, G.; Dominiczak, A.; et al. 2013 ESH/ESC guidelines for the management of arterial hypertension: The task force for the management of arterial hypertension of the European Society of Hypertension (ESH) and of the European Society of Cardiology (ESC). Blood Press. 2013, 22, 193–278. [Google Scholar] [CrossRef] [PubMed]
- American Diabetes, A. 2. classification and diagnosis of diabetes: Standards of medical care in diabetes-2021. Diabetes Care (2021) 44(Suppl 1): S15–33. [CrossRef]
- International Diabetes Federation. The IDF Consensus Worldwide Definition of the Metabolic Syndrome. 2005. http://www.idf.org/webdata/docs/MetSyndrome_FINAL.pdf.
- Alberti KG, Zimmet P, Shaw J. Metabolic syndrome--a new world-wide definition. A Consensus Statement from the International Diabetes Federation. Diabet Med. 2006 May;23(5):469-80. [CrossRef] [PubMed]
- Alasmari, F. , Assiri, M.A., Ahamad, S.R., Aljumayi, S.R., Alotaibi, W.H., Alhamdan, M.M., Alhazzani, K., Alharbi, M., Alqahtani, F. and Alasmari, A.F. Serum metabolomic analysis of male patients with cannabis or amphetamine use disorder. Metabolites, 2022, 12(2), p.179. [CrossRef]
- Shi, S. , Yi, L., Yun, Y., Zhang, X. and Liang, Y. A combination of GC-MS and chemometrics reveals metabolic differences between serum and plasma. Analytical Methods, 2015, 7(5), pp.1751-1757. [CrossRef]
- Yao, H. , Shi, P., Zhang, L., Fan, X., Shao, Q. and Cheng, Y. Untargeted metabolic profiling reveals potential biomarkers in myocardial infarction and its application. Molecular BioSystems, 2010, 6(6), pp.1061-1070. [CrossRef]
- Expert Panel on Detection, Evaluation, and Treatment of High Blood Cholesterol in Adults. Executive Summary of The Third Report of The National Cholesterol Education Program (NCEP) Expert Panel on Detection, Evaluation, And Treatment of High Blood Cholesterol In Adults (Adult Treatment Panel III). JAMA. 2001 May 16;285(19):2486-97. [CrossRef] [PubMed]
- Yoon, MS. The emerging role of branched-chain amino acids in insulin resistance and metabolism. Nutrients 2016; 8:7.
- Lynch CJ, Adams SH. Branched-chain amino acids in metabolic signalling and insulin resistance. Nat Rev Endocrinol 2014; 10:723–36. [CrossRef]
- Tessari P, Cecchet D, Cosma A, et al. Insulin resistance of amino acid and protein metabolism in type 2 diabetes. Clin Nutr. 2011;30(3):267–72. [CrossRef]
- Gar C, Rottenkolber M, Prehn C, Adamski J, Seissler J, Lechner A. Serum and plasma amino acids as markers of prediabetes, insulin resistance, and incident diabetes. Crit Rev Clin Lab Sci. 2018 Jan;55(1):21-32. [CrossRef]
- Long J, Yang Z, Wang L, Han Y, Peng C, Yan C, Yan D. Metabolite biomarkers of type 2 diabetes mellitus and pre-diabetes: a systematic review and meta-analysis. BMC Endocr Disord. 2020 Nov 23;20(1):174. [CrossRef] [PubMed]
- Park JE, Lim HR, Kim JW, Shin KH. Metabolite changes in risk of type 2 diabetes mellitus in cohort studies: A systematic review and meta-analysis. Diabetes Res Clin Pract. 2018 Jun;140:216-227. [CrossRef] [PubMed]
- Nogueira-Ferreira, R. , Oliveira, P.F. and Ferreira, R. Liver metabolism: the pathways underlying glucose utilization and production. In Glycolysis, Academic Press. 2024, (pp. 141-156). [CrossRef]
- Gautier-Stein, A. , Chilloux, J. , Soty, M., Thorens, B., Place, C., Zitoun, C., Duchampt, A., Da Costa, L., Rajas, F., Lamaze, C. and Mithieux, G. A caveolin-1 dependent glucose-6-phosphatase trafficking contributes to hepatic glucose production. Molecular metabolism, 2023, 70, p101700. [Google Scholar]
- Burgess, S.C. , Leone, T.C., Wende, A.R., Croce, M.A., Chen, Z., Sherry, A.D., Malloy, C.R. and Finck, B.N. Diminished hepatic gluconeogenesis via defects in tricarboxylic acid cycle flux in peroxisome proliferator-activated receptor γ coactivator-1α (PGC-1α)-deficient mice. Journal of Biological Chemistry, 2006, 281(28), pp.19000-19008.
- Satapati, S. , Sunny, N.E., Kucejova, B., Fu, X., He, T.T., Méndez-Lucas, A., Shelton, J.M., Perales, J.C., Browning, J.D. and Burgess, S.C. Elevated TCA cycle function in the pathology of diet-induced hepatic insulin resistance and fatty liver [S]. Journal of lipid research, 2012, 53(6), pp.1080-1092. [CrossRef]
- Felig, P. , Pozefsk, T., Marlis, E. and Cahill, G.F. Alanine: key role in gluconeogenesis. Science, 1970, 167(3920), pp.1003-1004.
- Waterhouse, C. and Keilson, J. The contribution of glucose to alanine metabolism in man. The Journal of Laboratory and Clinical Medicine, 1978, 92(5), pp.803-812.
- Holeček, M. Origin and roles of Alanine and glutamine in Gluconeogenesis in the liver, kidneys, and small intestine under physiological and pathological conditions. International Journal of Molecular Sciences, 2024, 25(13), p.7037. [CrossRef]
- J Ryan, P. , Riechman, S.E., Fluckey, J.D. and Wu, G. Interorgan metabolism of amino acids in human health and disease. Amino Acids in Nutrition and Health: Amino Acids in Gene Expression, Metabolic Regulation, and Exercising Performance, 2021, pp.129-149. [CrossRef]
- Paulusma, C.C. , Lamers, W. H., Broer, S. and van de Graaf, S.F. Amino acid metabolism, transport and signalling in the liver revisited. Biochemical pharmacology, 2022, 201, p115074. [Google Scholar] [CrossRef]
- Yiew, N.K. , Vazquez, J. H., Martino, M.R., Kennon-McGill, S., Price, J.R., Allard, F.D., Yee, E.U., Layman, A.J., James, L.P., McCommis, K.S. and Finck, B.N. Hepatic pyruvate and alanine metabolism are critical and complementary for maintenance of antioxidant capacity and resistance to oxidative insult. Molecular Metabolism, 2023, 77, p101808. [Google Scholar]
- Yang, R.Z. , Park, S., Reagan, W.J., Goldstein, R., Zhong, S., Lawton, M., Rajamohan, F., Qian, K., Liu, L. and Gong, D.W. Alanine aminotransferase isoenzymes: molecular cloning and quantitative analysis of tissue expression in rats and serum elevation in liver toxicity. Hepatology, 2009, 49(2), pp.598-607. [CrossRef]
- DeRosa, G. and Swick, R.W. Metabolic implications of the distribution of the alanine aminotransferase isoenzymes. Journal of biological chemistry, 1975, 250(20), pp.7961-7967.
- McCommis, K.S. , Chen, Z., Fu, X., McDonald, W.G., Colca, J.R., Kletzien, R.F., Burgess, S.C. and Finck, B.N. Loss of mitochondrial pyruvate carrier 2 in the liver leads to defects in gluconeogenesis and compensation via pyruvate-alanine cycling. Cell metabolism, 2015, 22(4), pp.682-694. [CrossRef]
- Okun, J.G. , Rusu, P.M., Chan, A.Y., Wu, Y., Yap, Y.W., Sharkie, T., Schumacher, J., Schmidt, K.V., Roberts-Thomson, K.M., Russell, R.D. and Zota, A. Liver alanine catabolism promotes skeletal muscle atrophy and hyperglycaemia in type 2 diabetes. Nature metabolism, 2021, 3(3), pp.394-409. [CrossRef]
- Martino, M.R. , Gutiérrez-Aguilar, M., Yiew, N.K., Lutkewitte, A.J., Singer, J.M., McCommis, K.S., Ferguson, D., Liss, K.H., Yoshino, J., Renkemeyer, M.K. and Smith, G.I. Silencing alanine transaminase 2 in diabetic liver attenuates hyperglycemia by reducing gluconeogenesis from amino acids. Cell reports, 2022, 39(4). [CrossRef]
- Sherman, K.E. Alanine aminotransferase in clinical practice: a review. Archives of internal medicine, 1991, 151(2), pp.260-265.
- Liu, Z. , Que, S., Xu, J. and Peng, T. Alanine aminotransferase-old biomarker and new concept: a review. International journal of medical sciences, 2014,11(9), p.925.
- Zhao X, Han Q, Liu Y, Sun C, Gang X, Wang G. The Relationship between Branched-Chain Amino Acid Related Metabolomic Signature and Insulin Resistance: A Systematic Review. J Diabetes Res. 2016;2016:2794591. [CrossRef] [PubMed]
- Chang, A.Y. , Asokan, A.K., Lalia, A.Z., Sakrikar, D., Lanza, I.R., Petterson, X.M. and Nair, K.S. Insulin regulation of lysine and α-aminoadipic acid dynamics and amino metabolites in insulin-resistant and control women. Diabetes, 2024, p.db230977. [CrossRef]
- Razquin, C. , Ruiz-Canela, M. , Clish, C.B., Li, J., Toledo, E., Dennis, C., Liang, L., Salas-Huetos, A., Pierce, K.A., Guasch-Ferré, M. and Corella, D. Lysine pathway metabolites and the risk of type 2 diabetes and cardiovascular disease in the PREDIMED study: results from two case-cohort studies. Cardiovascular diabetology, 2019, 18, pp.1–12. [Google Scholar] [CrossRef]
- Owei I, Umekwe N, Stentz F, Wan J, Dagogo-Jack S. Amino acid signature predictive of incident prediabetes: A case-control study nested within the longitudinal pathobiology of prediabetes in a biracial cohort. Metabolism. 2019 Sep;98:76-83. [CrossRef] [PubMed]
- Ling, Z.N. , Jiang, Y.F., Ru, J.N., Lu, J.H., Ding, B. and Wu, J. Amino acid metabolism in health and disease. Signal Transduction and Targeted Therapy, 2023, 8(1), p.345. [CrossRef]
- Luo, H.H. , Feng, X. F., Yang, X.L., Hou, R.Q. and Fang, Z.Z. Interactive effects of asparagine and aspartate homeostasis with sex and age for the risk of type 2 diabetes risk. Biology of sex Differences, 2020, 11, pp.1–10. [Google Scholar]
- Holeček, M. The role of skeletal muscle in the pathogenesis of altered concentrations of branched-chain amino acids (valine, leucine, and isoleucine) in liver cirrhosis, diabetes, and other diseases. Physiological research, 2021, 70(3), p.293. [CrossRef]
- Wang, X.F. , Zhang, Y.X. and Ma, H.Y. Targeted profiling of amino acid metabolome in serum by a liquid chromatography-mass spectrometry method: application to identify potential markers for diet-induced hyperlipidemia. Analytical Methods, 2020, 12(18), pp.2355-2362. [CrossRef]
- Yang, P. , Hu, W. , Fu, Z., Sun, L., Zhou, Y., Gong, Y., Yang, T. and Zhou, H. The positive association of branched-chain amino acids and metabolic dyslipidemia in Chinese Han population. Lipids in health and disease, 2016, 15, pp.1–8. [Google Scholar] [CrossRef]
- Natarajan, V. , Chawla, R., Mah, T., Vivekanandan, R., Tan, S.Y., Sato, P.Y. and Mallilankaraman, K. Mitochondrial dysfunction in age-related metabolic disorders. Proteomics, 2020, 20(5-6), p.1800404. [CrossRef]
- Shahram, N. , Sungbo, C. and Eugeni, R. Alanine-specific appetite in slow growing chickens is associated with impaired glucose transport and TCA cycle. BMC Genomics (Web), 2022, 23(1), pp.1-16. [CrossRef]
- Onyango, A.N. Excessive gluconeogenesis causes the hepatic insulin resistance paradox and its sequelae. Heliyon, 2022, 8(12). [CrossRef]
Figure 1.
Flow diagram of participant selection.
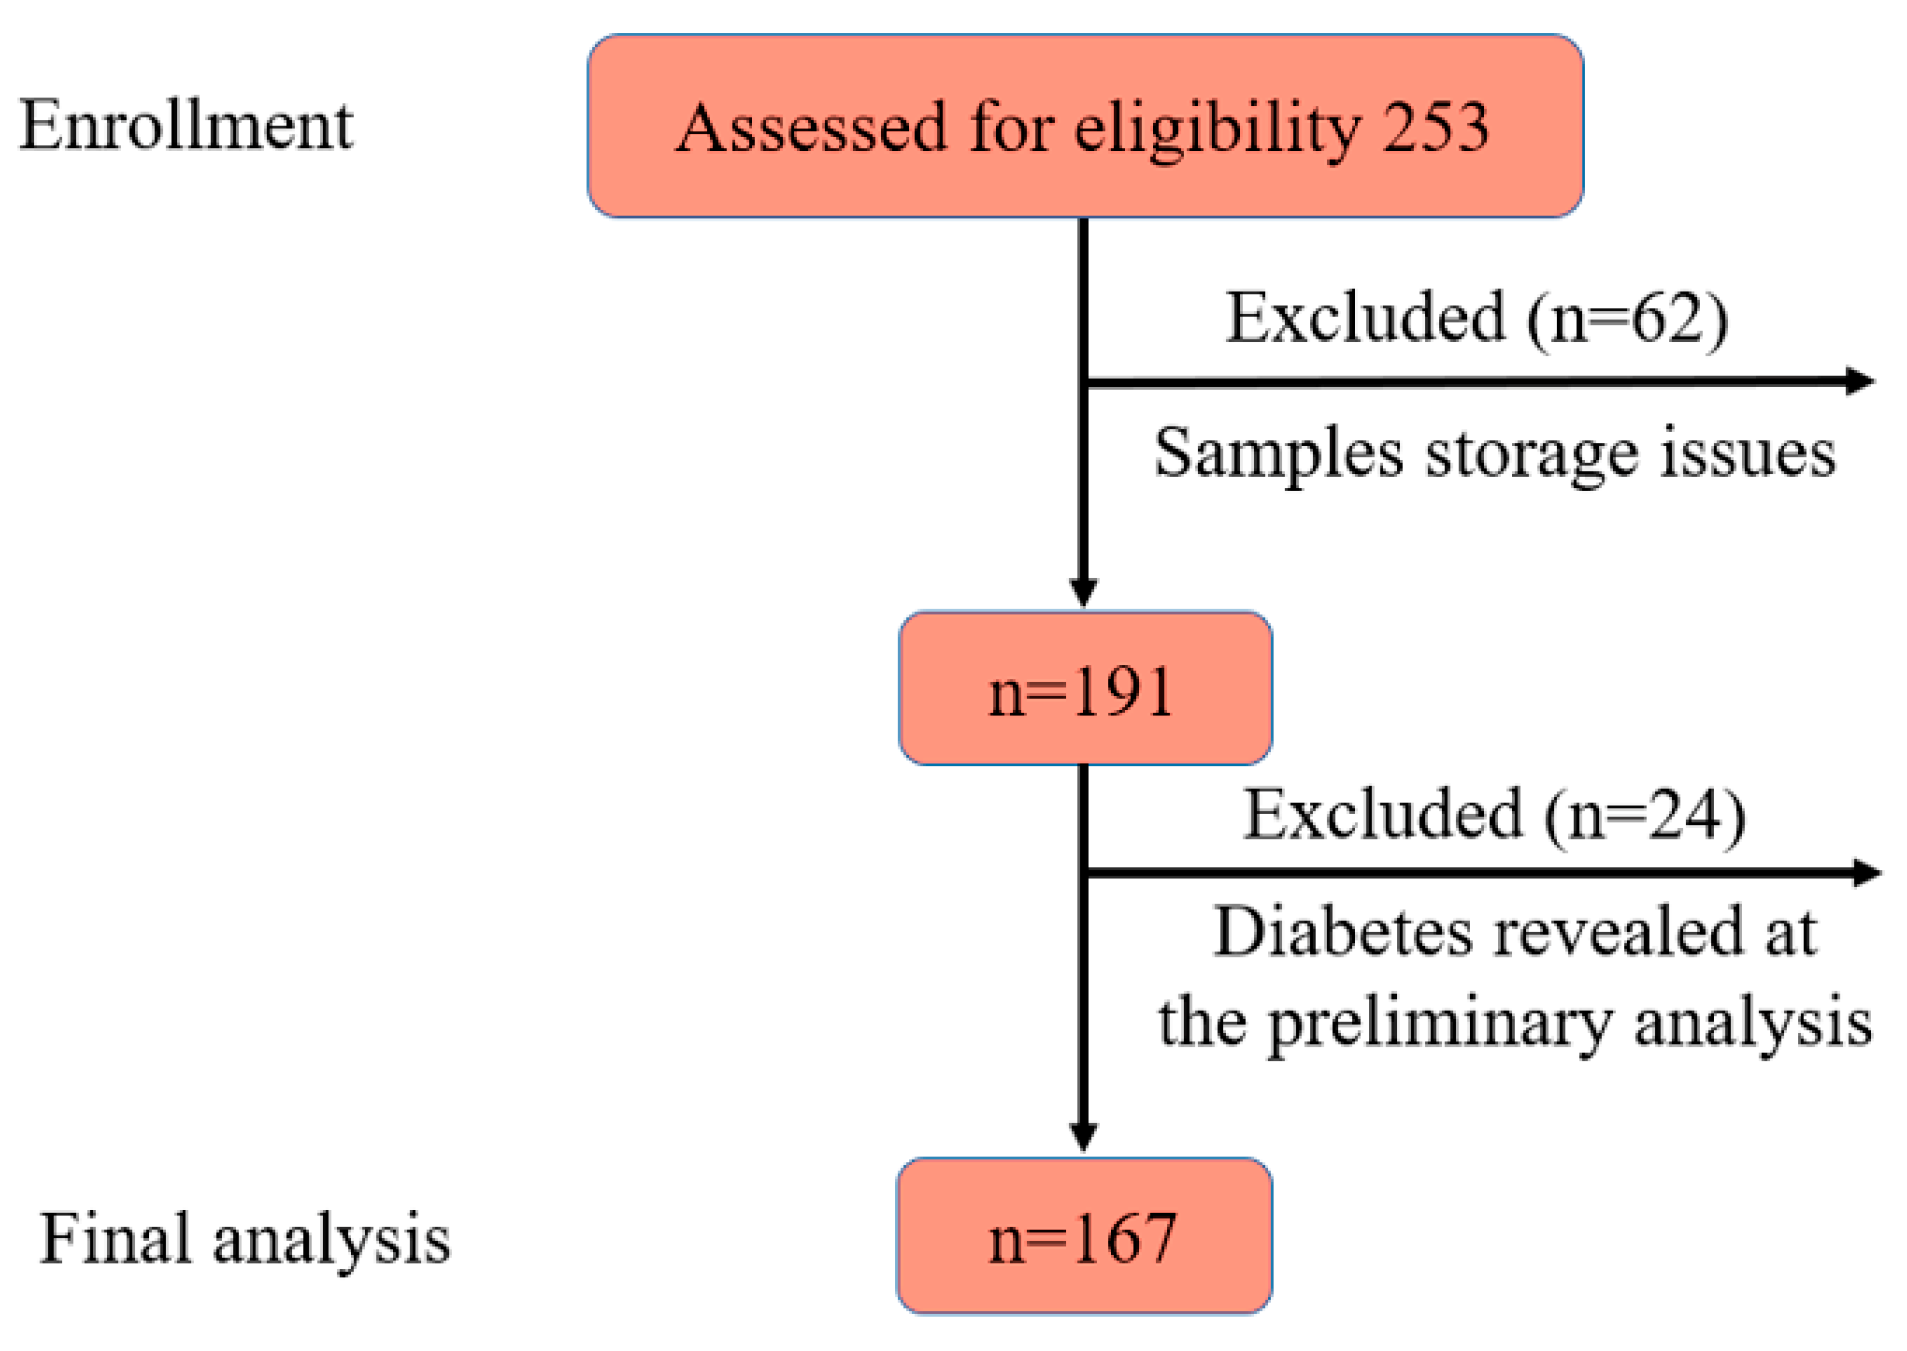
Figure 2.
Impact of Mitochondrial Metabolic Activity on Circulating Levels of Alanine and Aspartic Acid: Insights from the Cahill Cycle.
Figure 2.
Impact of Mitochondrial Metabolic Activity on Circulating Levels of Alanine and Aspartic Acid: Insights from the Cahill Cycle.
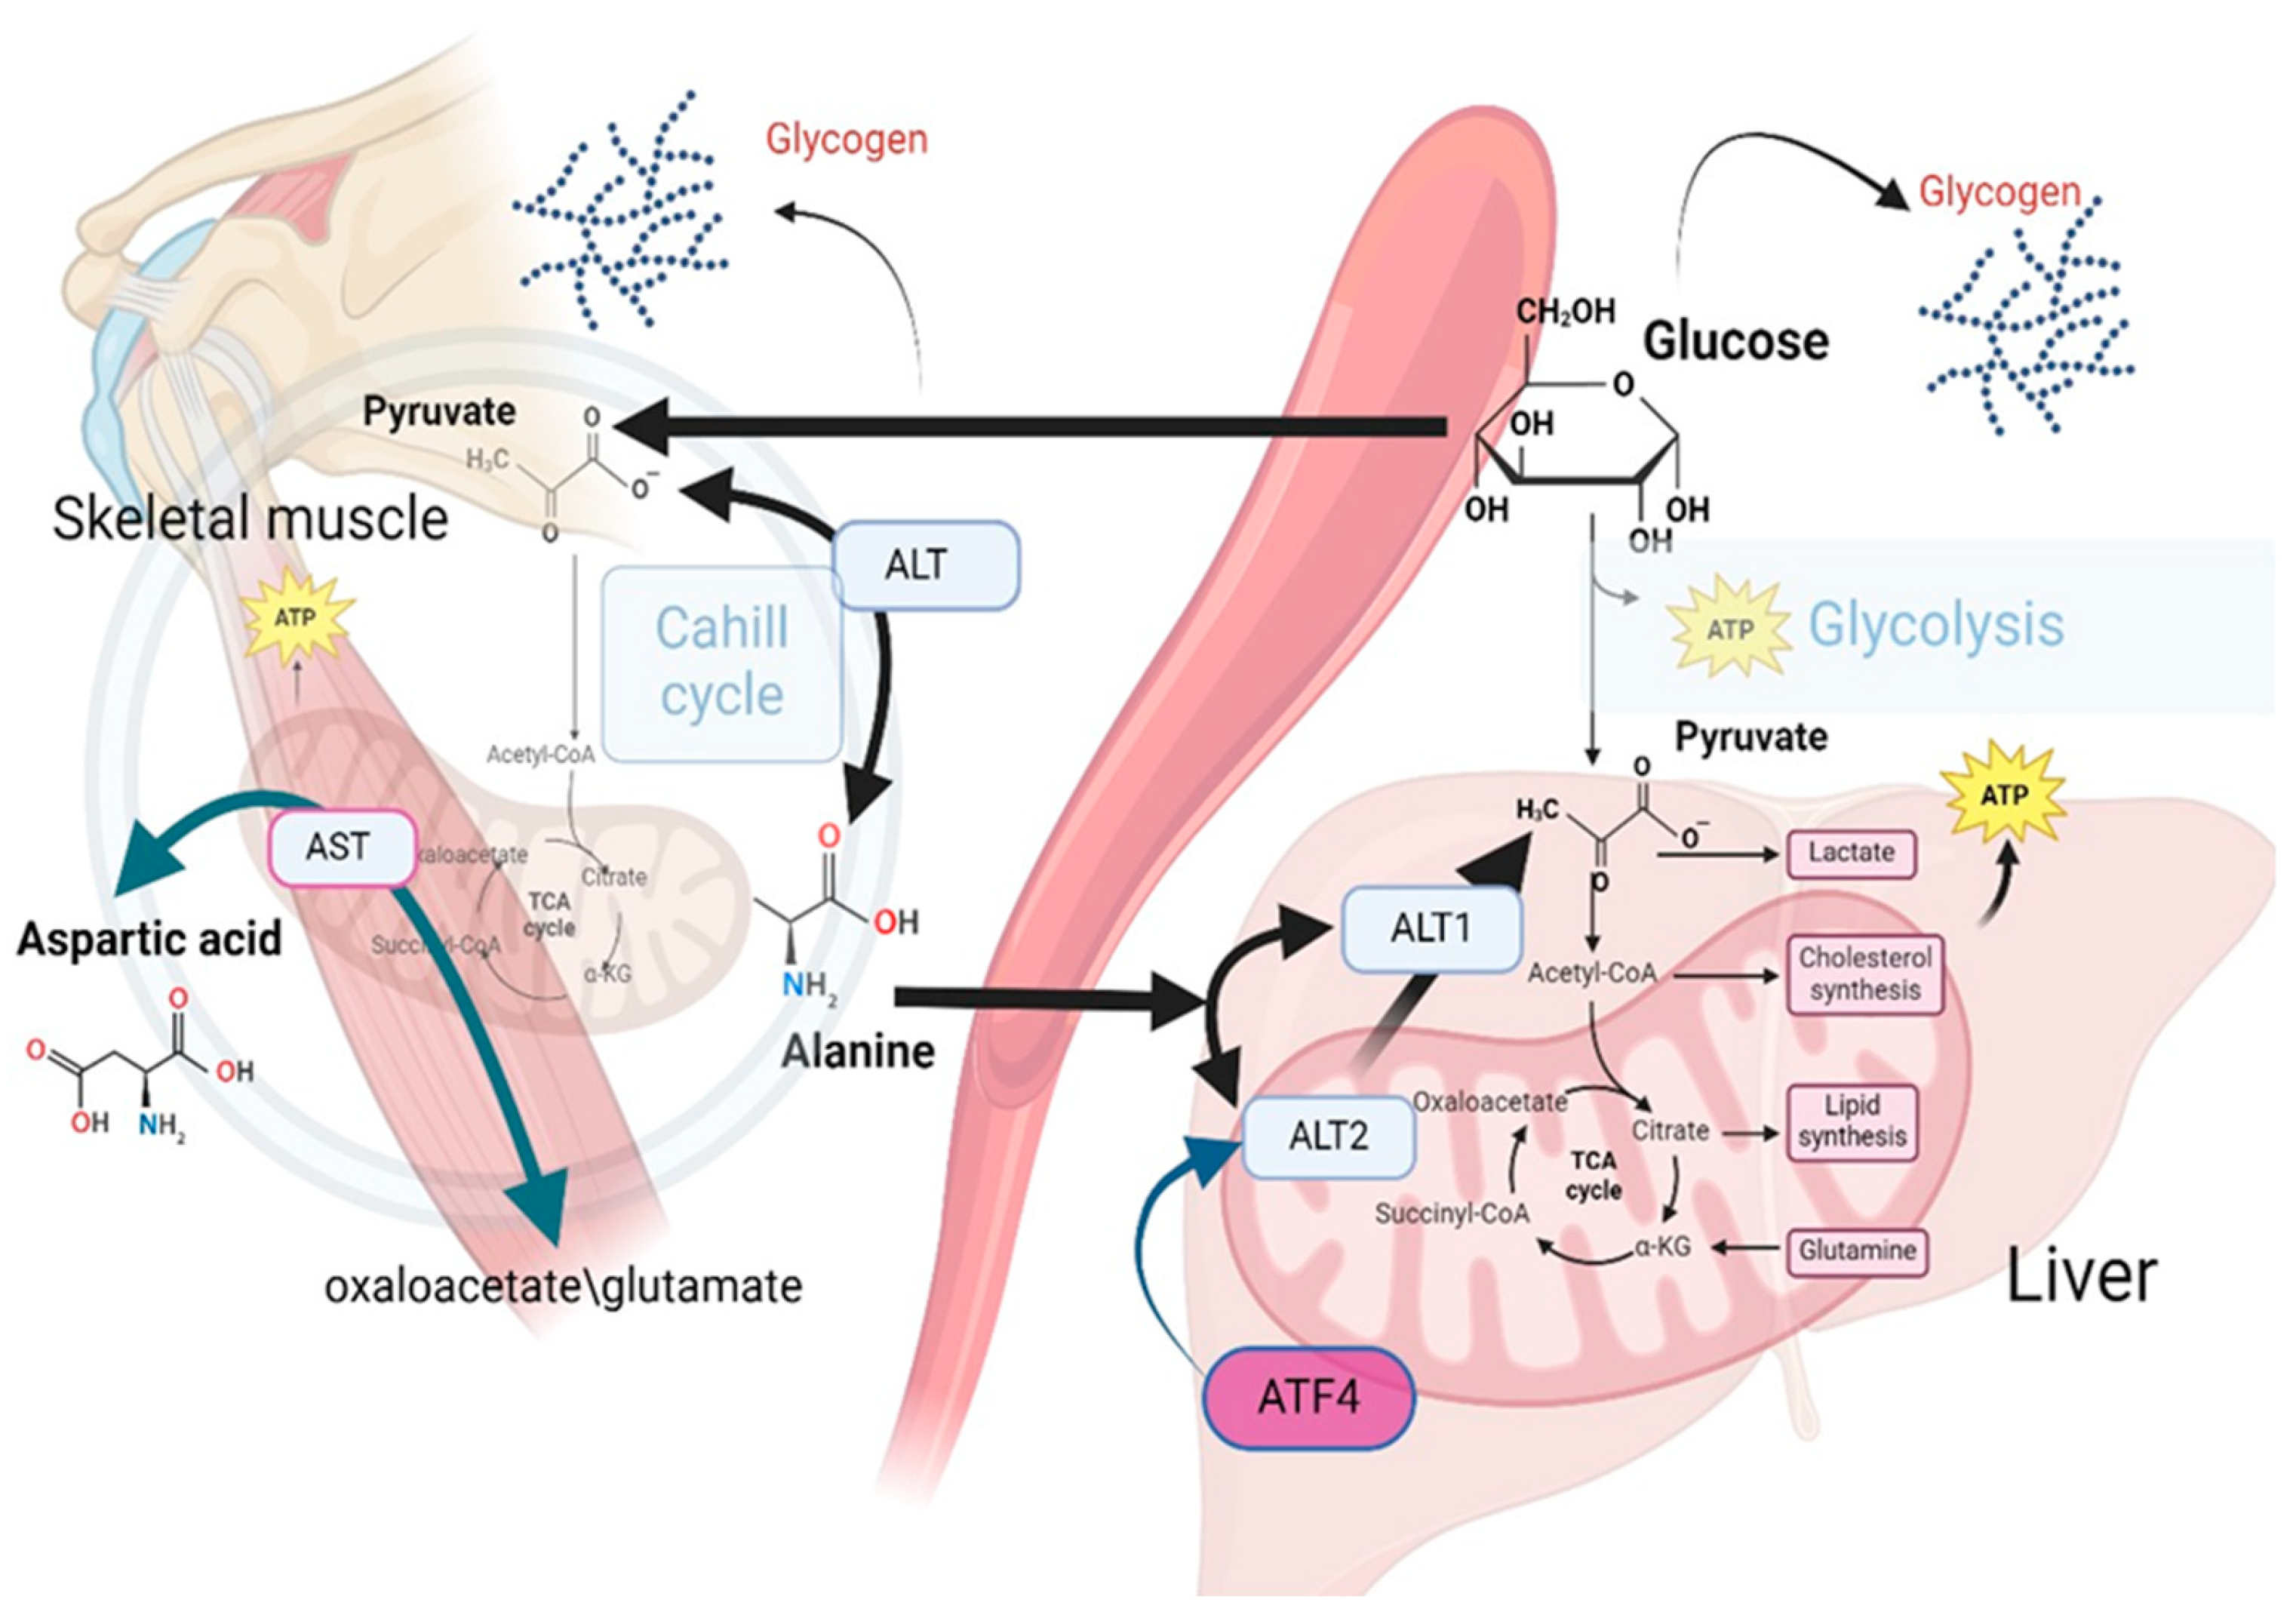

Table 1.
Baseline characteristics of the study population.
| Characteristics | Absolute number/% or mean/SD |
Prediabetes,% | P-value | |
| Yes | No | |||
| Gender, male | 75/44.12 | 70.83 | 29.17 | 0.367 |
| Age (years) | 50.55/7.47 | |||
| <39 | 10/5.88 | 4.46 | 9.09 | 0.04 |
| 40-49 | 70/41.18 | 35.71 | 52.73 | |
| 50-59 | 70/41.18 | 44.64 | 32.73 | |
| >60 | 20/11.76 | 15.18 | 5.45 | |
| BMI categories (kg/m2) | ||||
| <24.9 | 43/25.75 | 18.35 | 41.82 | 0.001, 0.0002* |
| 25-29.9 | 70/41.92 | 42.20 | 41.82 | |
| >30.0 | 54/32.34 | 39.45 | 16.36 | |
| Hypertension | 50/29.94 | 33.94 | 21.82 | 0.109 |
| Smoking | ||||
| No | 113/67.66 | 69.72 | 63.64 | 0.03 |
| Quitted | 34/20.36 | 15.60 | 30.91 | |
| Yes | 20/11.98 | 14.68 | 5.45 | |
| High fasting glucose (>5.6) | 23/13.61 | 73,91 | 26.09 | 0.452 |
| Lipid profile (mmol/L) | ||||
| High LDL-C (>3.3) | 73/42.94 | 70.83 | 29.17 | 0.367 |
| Low HDL-C (<1.03 in males, <1.29 in females) | 57/33.53 | 75.44 | 24.56 | 0.097 |
| High TG (>1.7) | 46/27.06 | 79.55 | 20.45 | 0.04 |
*p for trend of odds; BMI, body mass index, LDL-C, low density lipoprotein cholesterol, HDL-C, high density lipoprotein cholesterol, TG, triglycerides Comparisons between prediabetes and control subjects have been conducted by chi-square test for categorical variables.
Table 2.
ORs for increased levels of LDL-C, HDL-C, and TG crude and adjusted for BMIα.
| Amino acids, mmol/L | High LDL-C>3.3 mmol/L | HDL-C>1.03 mmol/L in males and >1.29 mmol/L in females | TG>1.7 mmol/L | |||
| ORcrude | ORadjusted | ORcrude | ORadjusted | ORcrude | ORadjusted | |
| Lysine <2.57 | 1.02 | 1.05 | 1.45 | 1.50 | 0.72 | 0.76 |
| Tyrosine <1.03 | 1.28 | 1.18 | 1.50 | 1.64 | 1.02 | 0.86 |
| Alanine <10.86 | 1.26 | 1.37 | 2.22* | 2.29* | 0.28** | 0.28** |
| Valine <5.74 | 0.95 | 0.86 | 0.92 | 0.97 | 1.89 | 1.72 |
| Leucine <6.36 | 0.90 | 0.94 | 0.96 | 0.87 | 0.75 | 0.88 |
| Isoleucine <3.58 | 0.98 | 0.94 | 0.85 | 1.01 | 2.30* | 1.99* |
| Proline <3.70 | 0.72 | 0.70 | 1.51 | 1.55 | 0.45* | 0.45* |
| Serine <1.69 | 1.12 | 1,23 | 2.11* | 1.97 | 0.24*** | 0.27*** |
| Threonine <1.52 | 1.74 | 1.96 | 3.01** | 2.93** | 0.32** | 0.35* |
| Methionine <1.14 | 0.96 | 1.06 | 1.77 | 1.73 | 0.27*** | 0.28** |
| Aspartic acid <0.27 | 1.95 | 1.80 | 1.09 | 1.3 | 1.3 | 1.02 |
| Glutamic acid <0.87 | 1.0 | 0.99 | 2.16* | 2.45* | 0.37** | 0.35** |
| Phenylalanine <0.58 | 1.0 | 1.13 | 2.22* | 2.31* | 0.45* | 0.54 |
α Chi-square test for categorical variables. *P<0.05, **p<0.005, ***p<0.0005.
Table 3.
Association between AAs and prediabetes*.
| AAs, mmol/L | ORcrude | 95%CI | p-value |
| Lysine >2.57 | 2.19 | 1.04;4.63 | 0.039 |
| Tyrosine <1.03 | 0.75 | 0.35;1.63 | 0.47 |
| Alanine <10.86 | 1.89 | 0.96;3.70 | 0.064 |
| Valine <5.74 | 0.60 | 0.29;1.21 | 0.153 |
| Leucine <6.36 | 0.74 | 0.38;1.43 | 0.367 |
| Isoleucine <3.58 | 0.67 | 0.34;1.33 | 0.249 |
| Proline <3.70 | 1.04 | 0.52;2.09 | 0.911 |
| Serine <1.69 | 1.02 | 0.51;2.07 | 0.953 |
| Threonine <1.52 | 1.27 | 0.60;2.66 | 0.531 |
| Methionine <1.14 | 0.55 | 0.28;1.09 | 0.087 |
| Aspartic <0.27 | 2.91 | 1.24;6.81 | 0.014 |
| Glutamic <0.87 | 0.83 | 0.42;1.66 | 0.595 |
| Phenylalanine <0.58 | 0.73 | 0.35;1.55 | 0.416 |
*Binary logistic regression.
Table 4.
Crude and adjusted ORs of prediabetes for plasma level of alanine, lysine and aspartic acid*.
Table 4.
Crude and adjusted ORs of prediabetes for plasma level of alanine, lysine and aspartic acid*.
| Number of observations | OR of prediabetes | 95%CI | P-value | Adjusted for | Model |
| Alanine<10.86 mmol/L | |||||
| 156 | 1.89 | 0.96;3.70 | 0.064 | Crude | 1 |
| 156 | 2.17 | 1.06;4.48 | 0.035 | Ageα | 2 |
| 153 | 2.19 | 1.03;4.60 | 0.042 | Age+BMIβ | 3 |
| Lysine > 2.57 mmol/L | |||||
| 129 | 2.19 | 1.04;4.63 | 0.039 | Crude | 1 |
| 129 | 2.11 | 0.99;4.50 | 0.053 | Ageα | 2 |
| 126 | 2.31 | 1.03;5.14 | 0.041 | Age+BMIβ | |
| Aspartic<0.27 mmol/L | |||||
| 103 | 2.91 | 1.24;6.81 | 0.014 | Crude | 1 |
| 103 | 3.0 | 1.25;7.22 | 0.014 | Ageα | 2 |
| 100 | 2.87 | 1.12;9.86 | 0.026 | Age+BMIβ | 3 |
*Multiple binary logistic regression. α, β-LRT (Likelihood Ratio Test) for the significance of age and BMI, p<0.01.
Table 5.
Crude and adjusted AUCs for LR models of association between AAs and prediabetes risk*.
| LR Models | AUC | Cutoff point**, mmol/L | Sensitivity, % | Specificity, % | |
| Crude | Adjusted for age and BMI | ||||
| Alanine | 0.47 | 0.73 | 10.21 | 90.00 | 37.74 |
| Lysine | 0.61 | 0.74 | 2.51 | 79.01 | 48.89 |
| Aspartic | 0.49 | 0.76 | 0.056 | 90.77 | 45.71 |
*ROC analysis, **Estimation by Liu method. LR – logistic regression, AUC – area under curve, BMI – body mass index.
Disclaimer/Publisher’s Note: The statements, opinions and data contained in all publications are solely those of the individual author(s) and contributor(s) and not of MDPI and/or the editor(s). MDPI and/or the editor(s) disclaim responsibility for any injury to people or property resulting from any ideas, methods, instructions or products referred to in the content. |
© 2024 by the authors. Licensee MDPI, Basel, Switzerland. This article is an open access article distributed under the terms and conditions of the Creative Commons Attribution (CC BY) license (http://creativecommons.org/licenses/by/4.0/).
Copyright: This open access article is published under a Creative Commons CC BY 4.0 license, which permit the free download, distribution, and reuse, provided that the author and preprint are cited in any reuse.


