
Submitted:
27 August 2024
Posted:
28 August 2024
You are already at the latest version
Abstract
The study on the sustainable utilization capacity of water resources is of great significance for the realization of sustainable water resources management and development in the water-scarce regions of Northwest China. It provides insights into the potential for sustainable utilization of these resources. To evaluate the sustainable utilization capacity of the Huangshui Basin, a comprehensive evaluation index system was constructed based on three aspects: climate factors, water resources systems, and socio-economic factors. The evaluation was conducted using two methods: the fuzzy comprehensive evaluation model and the ELECTRE III evaluation method. The results indicate that the Huangshui Basin's water resources, as a whole, exhibit a medium sustainable utilization capacity. Climatic factors and socio-economic characteristics are the main factors affecting the sustainable utilization of water resources in the Huangshui Basin. Based on the results, measures such as strengthening the introduction of external water resources, enhancing water resources management, and implementing comprehensive remediation efforts in the basin can improve the level of sustainable use of water resources. The research results can provide a reference for decision-making regarding the evaluation of sustainable utilization capacity of water resources in water-scarce areas and the optimization of water resources management in the Huangshui Basin.
Keywords:
Huangshui Basin
; Water resources
; Sustainable utilization capacity
; Evaluation index
; Fuzzy comprehensive evaluation method
; ELECTRE III
1. Introduction
Water is a fundamental and strategic resource that supports the virtuous cycle of river basin ecosystems and sustainable socio-economic development [1,2]. However, current freshwater resources are extremely limited, with more than 50% of the global population facing water scarcity issues [3]. China, in particular, faces a significant per capita water shortage, with levels less than one-fourth of the global average [4]. Moreover, there are considerable discrepancies in the spatial and temporal distribution of water resources. Against the backdrop of climate warming and the intensification of human activities, water shortages and water environment pollution have impacted the sustainable development of water resources in river basins, and water scarcity has become a bottleneck for the sustainable development of these basins [5,6].
Water resources sustainability utilization analysis quantifies the degree of sustainable use of water resources in a basin, objectively reflects its water security, and is the basis for water resources planning and management in a basin [7]. In recent years, the Chinese government has placed great emphasis on the management of water resources in river basins, clearly advocating for the ’implementation of the most stringent water resources management system’. It has promulgated a series of water resources management policies to ensure the sustainable development of river basins, making the evaluation of the sustainable utilization capacity of water resources increasingly recognized [8].
Since the concept of sustainable development was introduced in the 1970s, the issue of sustainable utilization of water resources has prompted in-depth research by scholars worldwide. This research has been closely integrated with the carrying capacity of water resources [9], rational allocation, and scientific management [10], in order to support the overarching strategy of sustainable socio-economic development [11,12]. As human activities and climate change are the primary drivers of sustainable utilization of water resources, scholars are increasingly engaged in research conducted under uncertain environmental conditions, including those related to human activities and climate change [13]. Most of the existing research on water resources sustainable utilization capacity is concentrated at the basin and regional scales [14], urban scale [15], and national scale [16], such as in China’s Yangtze River Basin [17], Poyang Lake Basin [18], and Guangdong Province [19]. However, there is a notable absence of research on the sustainable utilization capacity of water resources in the Huangshui Basin of the northwestern region of China.
The evaluation method for sustainable utilization capacity of water resources is central to the assessment process. This process relies on establishing an effective evaluation index system, applying mathematical methods to calculate the weights of these indices [20], and ultimately combining them with relevant evaluation models to quantitatively assess the sustainable utilization capacity of regional water resources [21,22]. Given the complexity of water resource systems, the evaluation results can be one-sided and uncertain [23]. Consequently, the construction of the indicator system [24] and the selection of appropriate evaluation methods and models are crucial to the assessment of water resources’ sustainable utilization capacity [22].
In recent years, scholars worldwide have primarily employed various evaluation methods for sustainable water resources utilization capacity, such as the fuzzy comprehensive evaluation method, hierarchical analysis method [25], ecological footprint method [26], and comprehensive index method. For instance, Tang et al. [27] evaluated the dynamic trend of sustainable water resources utilization in Ningxia using the fuzzy comprehensive evaluation method based on sustainable development theory. Li Bingyao et al. [28] utilized hierarchical analysis to assess the current status of sustainable utilization capacity in Yuhuan County and proposed measures to enhance water resources’ sustainable utilization in water-scarce regions. Chen et al. [29] applied an improved ecological footprint model to evaluate the sustainable utilization capacity in the Beijing-Tianjin-Hebei region and conducted an uncertainty analysis of water resources there. Cui [30] used the comprehensive index evaluation method to assess the level of water resources utilization in the Sugri Economic Development Zone.These evaluation methods offer valuable tools for studying sustainable utilization capacity of water resources, each with its strengths and limitations.
Therefore, based on previous research and considering the unique characteristics of the Huangshui Basin, this study employs both the fuzzy comprehensive evaluation method and the ELECTRE III evaluation method. The aim is to construct an evaluation system for the sustainable utilization capacity of water resources in the Huangshui Basin, to explore its current status and the factors influencing its sustainable utilization capacity. The findings aim to provide insights and recommendations for the healthy management and sustainable development of water resources in the basin.
2. Materials and Methods
2.1. Study Area
The Huangshui Basin, located in the northwestern interior of China (98°49′ - 103°26′E, 36°02′ - 38°22′N), is in the eastern part of Qinghai Province, flanked by the east of Tianjun County, Muli Mountain, and the Qilian Mountains to the north. The basin, covering approximately 32,900 square kilometers, features a complex and diverse terrain, including high mountains, river valley plains, and low hills, with a topography that is narrow in the east and wide in the west (Figure 1). It serves as the economic, political, and cultural hub of Qinghai Province and is the primary agricultural production base. The region is densely populated, with its gross industrial and agricultural product accounting for over 60% of the province’s total, making it a vital pillar for Qinghai’s economic development [31,32].
Cities within the basin, such as Xining City, are not only the political center of the province but also hold significant positions in economic and cultural spheres. The climate of the basin is characterized by typical alpine and arid conditions, with average annual temperatures ranging from 0.6 to 7.9°C, featuring a large diurnal temperature difference and a small seasonal temperature difference. Annual precipitation varies from 300 to 500 mm, while the average annual evaporation rate is as high as 800 to 1500 mm, indicating significant water scarcity. Although the inter-annual variation in precipitation is minimal, the seasonal variation is pronounced, and the distribution of precipitation is highly uneven across regions, leading to water shortages in certain areas during specific seasons.
Currently, the water resources development and utilization rate in the Huangshui Basin has reached 60%, with an average multi-year water shortage of 240 million cubic meters [32]. This high rate of exploitation reflects the dependency on water resources in the basin and also highlights the constraints of water scarcity on regional development. To foster sustainable development in the Huangshui Basin, there is an urgent need for a comprehensive assessment of the sustainable utilization capacity of water resources. This assessment aims to optimize water resource management, enhance water utilization efficiency, and ensure the coordinated development of the regional economy, society, and ecosystem.
2.2. Data
The data for the evaluation indexes in this study are sourced from a variety of official publications and reports, including the ’Qinghai Province Water Resources Bulletin’, the ’Qinghai Province Statistical Yearbook’, and the ’Qinghai Province Environmental Condition Bulletin’. Additionally, we have utilized specialized planning documents such as the ’Huangshui River Basin Comprehensive Planning’ (document number Water General Planning [2014] No. 1182), the ’Water Resources Configuration Project Planning of Huangshui Main Stream Area of Qinghai Province’, and the ’Qinghai Province Second Water Resources Survey and Evaluation Report’.
2.3. Method
2.3.1. Fuzzy Comprehensive Evaluation Method
The specific steps to apply the method are as follows:
(1) Establishment of an Evaluation Index System for Sustainable Utilization Capacity of Resources
Building on previous research related to the sustainable utilization capacity of water resources, this study posits that the basin’s water resources system’s sustainable utilization capacity is an external manifestation of its natural attributes. This capacity is influenced by external factors such as climate change, water resources development, and utilization. By integrating these considerations with the characteristics of the Huangshui Basin, the main indicators affecting the sustainable utilization capacity of water resources are categorized into three groups: climate factor indicators, water resources system indicators, and socio-economic indicators. The Analytic Hierarchy Process (AHP) is employed to construct a scientifically sound, rational, and operable evaluation index system for the sustainable utilization capacity of water resources. The calculation methods and attributes of each index are detailed in Table 1, which presents the Huangshui River Basin water resources sustainable utilization capacity evaluation index system.
(2) Determination of criteria for grading fuzzy comprehensive evaluation indexes
In this study, the evaluation of the sustainable utilization capacity of water resources is categorized into five distinct levels to reflect varying degrees of sustainability:
Level I: Low sustainable utilization capacity, indicating minimal sustainability in water resource use.
Level II: Moderate sustainable utilization capacity, suggesting a balanced state of water resource use.
Level III: Medium sustainable utilization capacity, denoting a fair level of sustainability in water resource management.
Level IV: Strong sustainable utilization capacity, reflecting a high degree of sustainability and efficient water resource use.
Level V: Very strong sustainable utilization capacity, representing an optimal state of sustainability and resource management.
The grading criteria for each evaluation index, which determine the classification into these levels, are detailed in Table 2
(1) Evaluation model construction of sustainable utilization capacity of fuzzy integrated water resources
Let the number of evaluation indexes involved in the evaluation of sustainable utilization capacity of water resources be one, there is an evaluation level, and the selected evaluation indexes of sustainable utilization capacity of water resources are expressed in terms of the set of evaluation indexes established can be expressed as follows:
where, is the first evaluation index,As can be seen from Table 2, the evaluation criteria for sustainable utilization capacity of water resources in this study are divided into five levels, then the evaluation set established is:
Let the degree of affiliation of the first water resources sustainable utilization capacity evaluation index to the evaluation set be recorded as, the larger the value of the degree of affiliation, the greater the probability that the evaluation index belongs to the evaluation level [33]. This value can be solved by the following affiliation function calculation method:
In the above formulas (2), (3) and (4):、、 respectively, for the 1st level (Class I), intermediate levels (Class II , Class III, Class IV) and the nth level (Class V) corresponding to the affiliation function; is the measured value of the ith evaluation indicator; 、、、、、、 are the evaluation level values of the 1st, 2nd, j-1th, jth, j+1th, n-1th, and nth level of water vulnerability criterion corresponding to the first evaluation indicator. For the evaluation indices where the evaluation grade values are negatively correlated (inversely) with the classification standards, the reciprocal values of the evaluation grade values need to be calculated and substituted to transform the relationships of the evaluation grade values of all evaluation indices into positive correlations, namely .
Based on the affiliation value calculated by the affiliation function, the fuzzy relationship matrix between the water resources vulnerability evaluation indicators and the evaluation categories is established, which is denoted by as:
(3) Determine the Weights of Evaluation Indicators
Since the importance of each evaluation indicator of water resources vulnerability is implicit in the grading criteria, the grading criteria values are used to determine the weights of the indicators, which are calculated using the following formula:
where, is the weight of the first i evaluation indicator, n is the number of standardized scores; and are the standardized values of the first evaluation indicator corresponding to level 1 and level n-1, respectively.
Based on the calculated weight values the weight vector can be obtained as:.
(4) Establishment of a Fuzzy Comprehensive Evaluation Model
According to the fuzzy relationship matrix R and weight vector A the fuzzy comprehensive evaluation model Y can be constructed as follows:
According to the results obtained from the model Y in the above equation using the principle of maximum affiliation [34] to determine the comprehensive evaluation level, that is, , then the vulnerability category of water resources of the evaluation object is the category j.
2.3.2. ELECTRE III Evaluation Method
ELECTRE (Elimination and Choice Expressing Reality) III is a Multi-Criteria Decision Analysis (MCDA) method that is primarily used to deal with complex decision problems, especially when there are multiple conflicting criteria. The method was proposed by Bernard Roy in the 1970s and belongs to the ELECTRE family of methods. The method introduces preference thresholds, no-difference thresholds, and rejection thresholds to characterize the decision maker’s sensitivity and tolerance to different criteria. The core of ELECTRE III is to determine the ranking of advantages and disadvantages by comprehensively evaluating multiple alternatives [35].The specific steps to apply the method are as follows:
Construct m evaluation objects n index judgment matrix, this paper has 5 evaluation objects 15 indicators, the Huangshui River Basin based on the evaluation index system data series as program A1 to A5 attribute values:
The negative threshold is greater than the strict preference threshold. All the above three thresholds are determined by the decision maker and usually take a fixed value, and the veto threshold is usually three times of the prioritization threshold. For any attribute j that satisfies vj≥pj≥qj≥0 no difference threshold qj:
strictly dominant thresholds pj:
veto threshold vj:
where, are the maximum and minimum values of the attribute values, respectively.
The formula for performing feasibility calculations is as follows
where, harmony index C(i,k) is the degree of ai better than aj on attribute k, dj (i,k) is the degree of rejection of aj level higher than ak on attribute k, which means that the program aj is worse than the program ak.
3. Results
3.1. Evaluation Index Analysis of a Single Index for Sustainable Utilization Capacity of Water Resources
The sustainable utilization capacity of water resources in the Huangshui River Basin, calculated from multi-year data series, is detailed in Table 3, which presents the average values and single index evaluation results. As illustrated in Table 3, the evaluation indices for rainfall concentration, the annual precipitation extreme ratio, and the average water consumption level per agricultural mu in the Huangshui River Basin have all reached Level I, indicating a low sustainable utilization capacity. The indices for multi-year average precipitation, water quality of water functional zones, and per capita water resources are categorized at Level II, suggesting a slightly higher but still low sustainable utilization capacity. Furthermore, the drought index, water shortage rate, and GDP per capita have achieved a medium sustainable utilization capacity level.
These findings indicate that climatic factors and socio-economic conditions exert the most significant impact on the sustainable utilization capacity of water resources in the Huangshui River Basin. Additionally, it highlights that there is room for improvement in the water resources system class index to enhance the overall sustainable utilization capacity.
3.2. Analysis of the Results of the Fuzzy Comprehensive Evaluation of the Sustainable Utilization Capacity of Water Resources
According to table 2 Huangshui basin water resources sustainable utilization capacity evaluation index grading standard in 15 evaluation index and 5 evaluation standard grade standard value, using the affiliation function formula (2), (3) and (4) calculated to get the affiliation value, the establishment of the Huangshui basin water resources sustainable utilization capacity evaluation index and evaluation category fuzzy relationship matrix for:
R According to formula (6) calculated weight value to the Huangshui Basin water resources sustainable utilization capacity evaluation index weight vector is:
Finally, according to formula (7) calculated Huangshui basin water resources sustainable utilization capacity fuzzy comprehensive evaluation model results for:.According to the principle of maximum affiliation can be seen, the above fuzzy comprehensive evaluation results of the maximum affiliation of 0.507, belongs to the third level, so the Huangshui River Basin water resources sustainable utilization capacity for the Ⅲ level, for the medium sustainable utilization capacity level.
Finally, the sustainable utilization capacity of the Huangshui Basin’s water resources has been evaluated using a fuzzy comprehensive evaluation model , as calculated by formula (7). According to the principle of maximum membership degree, the evaluation results indicate a maximum membership degree of 0.507. This value corresponds to the third level, signifying that the Huangshui River Basin’s water resources have a medium sustainable utilization capacity, classified as Level Ⅲ.
3.3. Results of the ELECTRE III Method of Evaluating the Sustainable Utilization Capacity of Water Resources
In this study, the ELECTRE III method has been employed to evaluate the sustainable utilization of water resources, establishing a total of five evaluation objects: the Huangshui Basin and four standard programs. The entropy weighting method and threshold values were applied to determine the formula for these evaluations. The relationships between the Huangshui Basin and the standard programs are illustrated in Figure 2. The resulting index weights and thresholds derived from this analysis are presented in Table 4.
According to the formula, the five programs have been sorted, and the results are presented in the table. The sorting of the evaluation objects based on the ELECTRE III method is as follows: Ae > Ag > Huangshui River Basin > Af > Ah. The B(Ai) result for the Huangshui River Basin is 0, placing it between the Ag and Af programs. This indicates that the sustainable utilization capacity of the Huangshui River Basin’s water resources is classified at the first Level Ⅲ. This classification is consistent with the results from the fuzzy comprehensive evaluation, which also categorizes the capacity as medium sustainable utilization.
4. Discussions
A comparison of the weighting results obtained from the fuzzy evaluation method and the ELECTRE III method reveals significant differences in the indices considered most impact on the sustainable utilization capacity of water resources (Figure 3). In the fuzzy evaluation method, the drought index (C3), water shortage rate (C5), per capita water resources (C9), and water consumption per ten thousand yuan of industrial output value (C14) are weighted highly, indicating their substantial influence on sustainability.
Conversely, the ELECTRE III method emphasizes the importance of different indices, such as precipitation concentration (C2), water quality compliance rate in water functional zones (C8), per capita water resources (C9), and population density (C11), in affecting the sustainable utilization capacity.
Integrating the findings from both methods, it is evident that certain indices—precipitation concentration (C2), the degree of drought (C3), water scarcity rate (C5), compliance rate with water quality standards in water functional zones (C8), per capita water resources (C9), and water consumption in irrigated farmland (C13)—have a pronounced impact on the sustainable utilization capacity of water resources. These indices should be prioritized in future water resource management strategies to enhance sustainability.
When addressing the critical issues surrounding the sustainable utilization of water resources in the Huangshui Basin, it is essential to concentrate on a set of core indicators. These indicators not only reflect the current state of water resource management but also foresee potential and challenges for future development. Based on a detailed analysis of these indicators, targeted measures and recommendations are proposed to ensure the long-term, stable, and efficient use of water resources in the Huangshui Basin.
Enhance External Water Resource Allocation: Given that climate factors are pivotal in determining water availability, the analysis indicates that the Huangshui Basin’s climate-related indicators for sustainable water use are generally lower than the overall evaluation suggests. This implies significant water scarcity, highlighting the need for augmenting external water sources to bolster the basin’s total water resources and enhance its sustainable utilization capacity. Initiatives such as accelerating water diversion projects like diversion water from Datong to the Huangshui and diversion water from the Yellow River to Xining are recommended.
Strengthen Water Resource Management: Implement flood early warning systems with automatic rainfall stations in key watersheds for real-time monitoring. Construct and maintain efficient drainage networks, including pipes, collection ponds, and pumping stations, with regular inspections to ensure functionality. Moreover, given the relatively low per capita water resources and irrigation efficiency in the basin, it is crucial to maximize water resource utilization efficiency.
Increase Comprehensive Water Body Remediation: The low water quality standard rate within the Huangshui Basin’s water function areas calls for clear management objectives and corresponding measures. Regular monitoring and assessment are needed to uphold water quality standards. Additionally, managing pollution sources from industrial, agricultural, and domestic sectors can reduce pollutant discharges. Establishing a sewage licensing system will regulate pollutant discharges. Strengthening water ecological protection and implementing ecological restoration projects, such as wetland conservation and river restoration, will help restore the natural purification capacity of water bodies.
5. Conclusions
The evaluation of the sustainable utilization capacity of water resources in the Huangshui Basin has been conducted using both the fuzzy comprehensive evaluation method and the ELECTRE III method. These methods involved constructing an index system, establishing a relationship matrix, determining index weights, and developing a comprehensive evaluation model. Based on the collected data, the evaluation indicates that the Huangshui Basin’s water resources have a utilization capacity level of III, which is classified as medium sustainable utilization capacity.
Climatic factors and socio-economic conditions are identified as the primary reasons for the relatively low sustainable utilization capacity in the Huangshui Basin. To improve this, measures such as increasing the introduction of external water resources, enhancing water resource management, and comprehensively renovating surface water bodies are recommended.
Rainfall concentration and average water consumption in agricultural irrigation are the main factors affecting the low sustainable utilization capacity of the Huangshui River Basin’s water resources. Other significant factors include multi-year average precipitation, the standard compliance rate of water quality in water functional zones, and per capita water resources. Additionally, the drought index, water scarcity rate, and per capita GDP have a certain degree of impact on the sustainable utilization status.
Due to data limitations within the Huangshui Basin, this paper’s evaluation reflects the overall situation in recent years. Future research should focus on long-term, smaller regional scale evaluations to more objectively and accurately reflect the sustainable utilization capacity of water resources within the basin.
Author Contributions
Lijuan Fan: Conceptualization, Data curation, Formal analysis, Writing – original draft; Ronglan Li: Writing – original draft, Ju Gao and Fen Zhao: Writing- original draft; Chunhui Li: Investigation, Methodology, Supervision, Writing – review & editing.
Funding
This work was supported by the Joint Funds of the National Natural Science Foundation of China (U2243236 and 42201046), National Science Fund for Distinguished Young Scholars (52025092) and the Qinghai Haidong Urban-rural Eco-development projection(L3443-PRC-HD-CB-CS4).
Conflicts of Interest
The authors declare no known competing financial interests or personal relationships that could be perceived as influencing the work reported in this paper.
References
- Liu, C. Discussion on some issues of China’s water resources in the 21st century[J]. Water Resources and Hydropower Engineering. 2002,33(01):15-19.
- Zhang, H., Zhang C., Zhang W. Water Resource Constraints and China’s Economic Growth—Based on Econometric Analysis of “Resistance”of Water Resource [J]. Industrial Economics Research, 2016,15(4):87-99.
- Mekonnen, M.M., Hoekstra A.Y. Four billion people facing severe water scarcity[J]. Sci Adv, 2016, 2(2): e1500323. [CrossRef]
- Bian, Z., Zhang L..Main Problems in the Exploitation of China’s Water Resources and Some New Fresh Ideas to Them[J]. Environmental Science and Management, 2011,36(10): 147-153.
- Zuo Q.,Zhang X.. Dynamic carrying capacity of water resources under climate change[J]. Journal of Hydraulic Engineering, 2015, 46(04): 387-395. (in Chinese).
- Lambooy, T. Corporate social responsibility: sustainable water use[J]. Journal of Cleaner Production, 2011, 19(8): 852-866. [CrossRef]
- Wang, Q., Li S., Li R. Evaluating water resource sustainability in Beijing, China: Combining PSR model and matter-element extension method[J]. Journal of Cleaner Production, 2019, 206: 171-179.
- Shi, C.. Study on the Sustainable Utilization Water Resources Assessment Method and lts Application of River Basin-A Case Study of the Hebei Sector in Chaohe River Basin[J]. Xi’an University of Technology,2009.
- Wu J., Li J., Ma Z. . Study on water resources carrying capacity of Qingshui River Basin based on system dynamics modeling[J/OL]. Journal of Changjiang River Scientific Research Institute, 2024: 1-10.(in Chinese).
- Liu, Z.. Reflections on Planning and Management of Water ResourcesProtection in the Yangtze River Basin in the New Era[J]. Journal of Changjiang River Scientific Research Institute, 2024, 41(04): 1-7.
- Qian, Z.. Comprehensive report on China’s sustainable development of water resources strategy and various thematic reports. China Water & Power Press, 2001.
- Li, L. Gan H.. Remark on the Relationship between Water Resources Rational Allocation,Carrying Capacity and Sustainable Development[J]. Advances in Water Science, 2000, (03): 307-313.
- Ma F., Wang X., Li C. Research progress in water resources vulnerability assessment[J]. Journal of Water Resources & Water Engineering, 2012,23(01): 30-37 (in Chinese).
- Padowski, J.C.,Jawitz J.W.. Water availability and vulnerability of 225 large cities in the United States[J]. Water Resources Research, 2012. 48(12).
- Mirauda, D., Ostoich M.Surface water vulnerability assessment applying the integrity model as a decision support system for quality improvement[J]. Environmental Impact Assessment Review, 2011, 31(3): 161-171.
- Ma, X., Guo T.. Study on Spatial-Temporal Evolution of Water Ecological Footprint and Ecological Carrying Capacity in China[J]. Yellow River, 2022, 44(06): 81-87.
- Shao J.,Lu M.S.,Du T., et al.. Water Resources Ecological Footprint in Yangtze River Basin and Its Driving Factors[J]. Journal of Yangtze River Scientific Research Institute, 2021,38(12): 19-24+32.(in Chinese).
- Xia, J.,Diao Y., She D. et al.. Analysis on ecological security and ecological carrying capacity of water resources in the Poyang Lake Basin[J]. Water Resources Protection, 2022,38(03): 1-8+24.
- Zhang, Y., Zhang X.,Chen C.. Analysis of the Water Resources Sustainable Utilization in Guangdong Province and Nine Cities in the Pearl River Delta Based on Ecological Footprint Theory[J]. Pearl River, 2022, 43(04): 31-40.
- Liu X, Liu H, Wan Z, et al.. Study on evaluation index system of sustainable development of mine water resources based on PSO-AHP model and fuzzy comprehensive evaluation[J].JOURNAL OF INTELLIGENT & FUZZY SYSTEMS, 2021, 41: 4253-4264.
- Chen, S.. Theory Model and a Method for Qualitative Assessment ofSustainable Development of Reqional Water Resources[J]. Strategic Study of CAE, 2001, 03(02): 33-38.
- Wei Y.. The Evaluation Research on Sustainable Utilization of Water Resources of Gansu Province and Cities (States)[D].Lanzhou University,2023, .(in Chinese).
- Wang, M., Zuo Q., Hu C.,et al.. Evaluation of Sustainable Utilization of Water Resources in Shaying River Basin Based on Matter-element Extension Model[J]. Journal of North China University of Water Resources and Electric Power ( Natural Science Edition), 2022, 43(01): 18-25.(in Chinese).
- Huang, W. , Chen J.. Generalized Index of Water Resource System Evaluation for River Basin[J]. Journal of Yangtze River Scientific Research Institute, 2005, 22(04): 22-25.(in Chinese).
- Pan, F., Zhao L.. AHP comprehensive evaluation on sustainable utilization of water resources in Hengshui City, China[J]. Transactions of Tianjin University, 2015, 21(2): 178-182.
- Jing, P., Sheng J., Hu T., et al..Spatiotemporal evolution of sustainable utilization of water resources in the Yangtze River Economic Belt based on an integrated water ecological footprint model[J]. Journal of Cleaner Production, 2022. 358: 132035.
- Tang L, Zhang W.. Fuzzy Comprehensive Evaluation for Water Resources Sustainable Utilization of Ningxia, in TRENDS IN CIVIL ENGINEERING, PTS 1-4. 2012: 2770-2775.
- Li, B., Chen X., Zhou Z.,et al., Evaluation on sustainable utilization of water resources in the water shortage region and countermeasure discussion[J]. Journal of Water Resources & Water Engineering, 2017, 28(06): 104-108.
- Chen, M., Zhou Q., Duan W, et al.. Using an improved ecological footprint model to analyze the sustainable utilization of water resources in Beijing-Tianjin-Hebei region[J]. Environment Development and Sustainability, 2023,25(8): 8517-8538.
- Cui, J.. Study on Sustainable Utilization of Water Resources Based on Quantification-Harmony Theory and Comprehensive Index Evaluation Method in Sulige Economic Development Zone[D]. 2014, Inner Mongolia Agricultural University.
- Zhang X., Ge J., Zhao J. al.. The Persistence of Precipitation and the Trend of Droughts in Huangshui Basin[J]. China Rural Water and Hydropower, 2018,(09): 137-143.(in Chinese).
- Ge J.,X. Zhang Ge Jie, Zhao Jianfen. Spatio-temporal Variations of Temperature and Precipitation in Huangshui River Basin within Qinghai Province[J]. Journal of Irrigation and Drainage, 2017, 36(11): 94-100.(in Chinese).
- Xia, W., Deng Y., Fan F. et al.. Analysis of Water Quality Response Relationship of Water Diversion Project Based on Fuzzy Comprehensive Analysis Method[J]. Environmental Monitoring and Forewarning, 2024, 16(02): 80-86+120.
- Zhang, H.,Jiang Y.. Evaluation and Analysis of Groundwater Quality Based on Fuzzy Mathematics Theory[J]. Shaanxi Water Resources, 2024,(02): 101-103.
- Huang W.,Yu Z., Li C. et al.. The assessment of water resources security in Huaihe River Basin based on ELECTRE Ⅲ[J]. South-to-North Water Transfers and Water Science & Technology, 2019, 17(01): 20-25. (in Chinese).
Figure 1.
Site of the Huangshui River Basin(ABasin (sion water project from Datong to the Huangshui. B.Diversion water project from the Yellow River to Xining).
Figure 1.
Site of the Huangshui River Basin(ABasin (sion water project from Datong to the Huangshui. B.Diversion water project from the Yellow River to Xining).
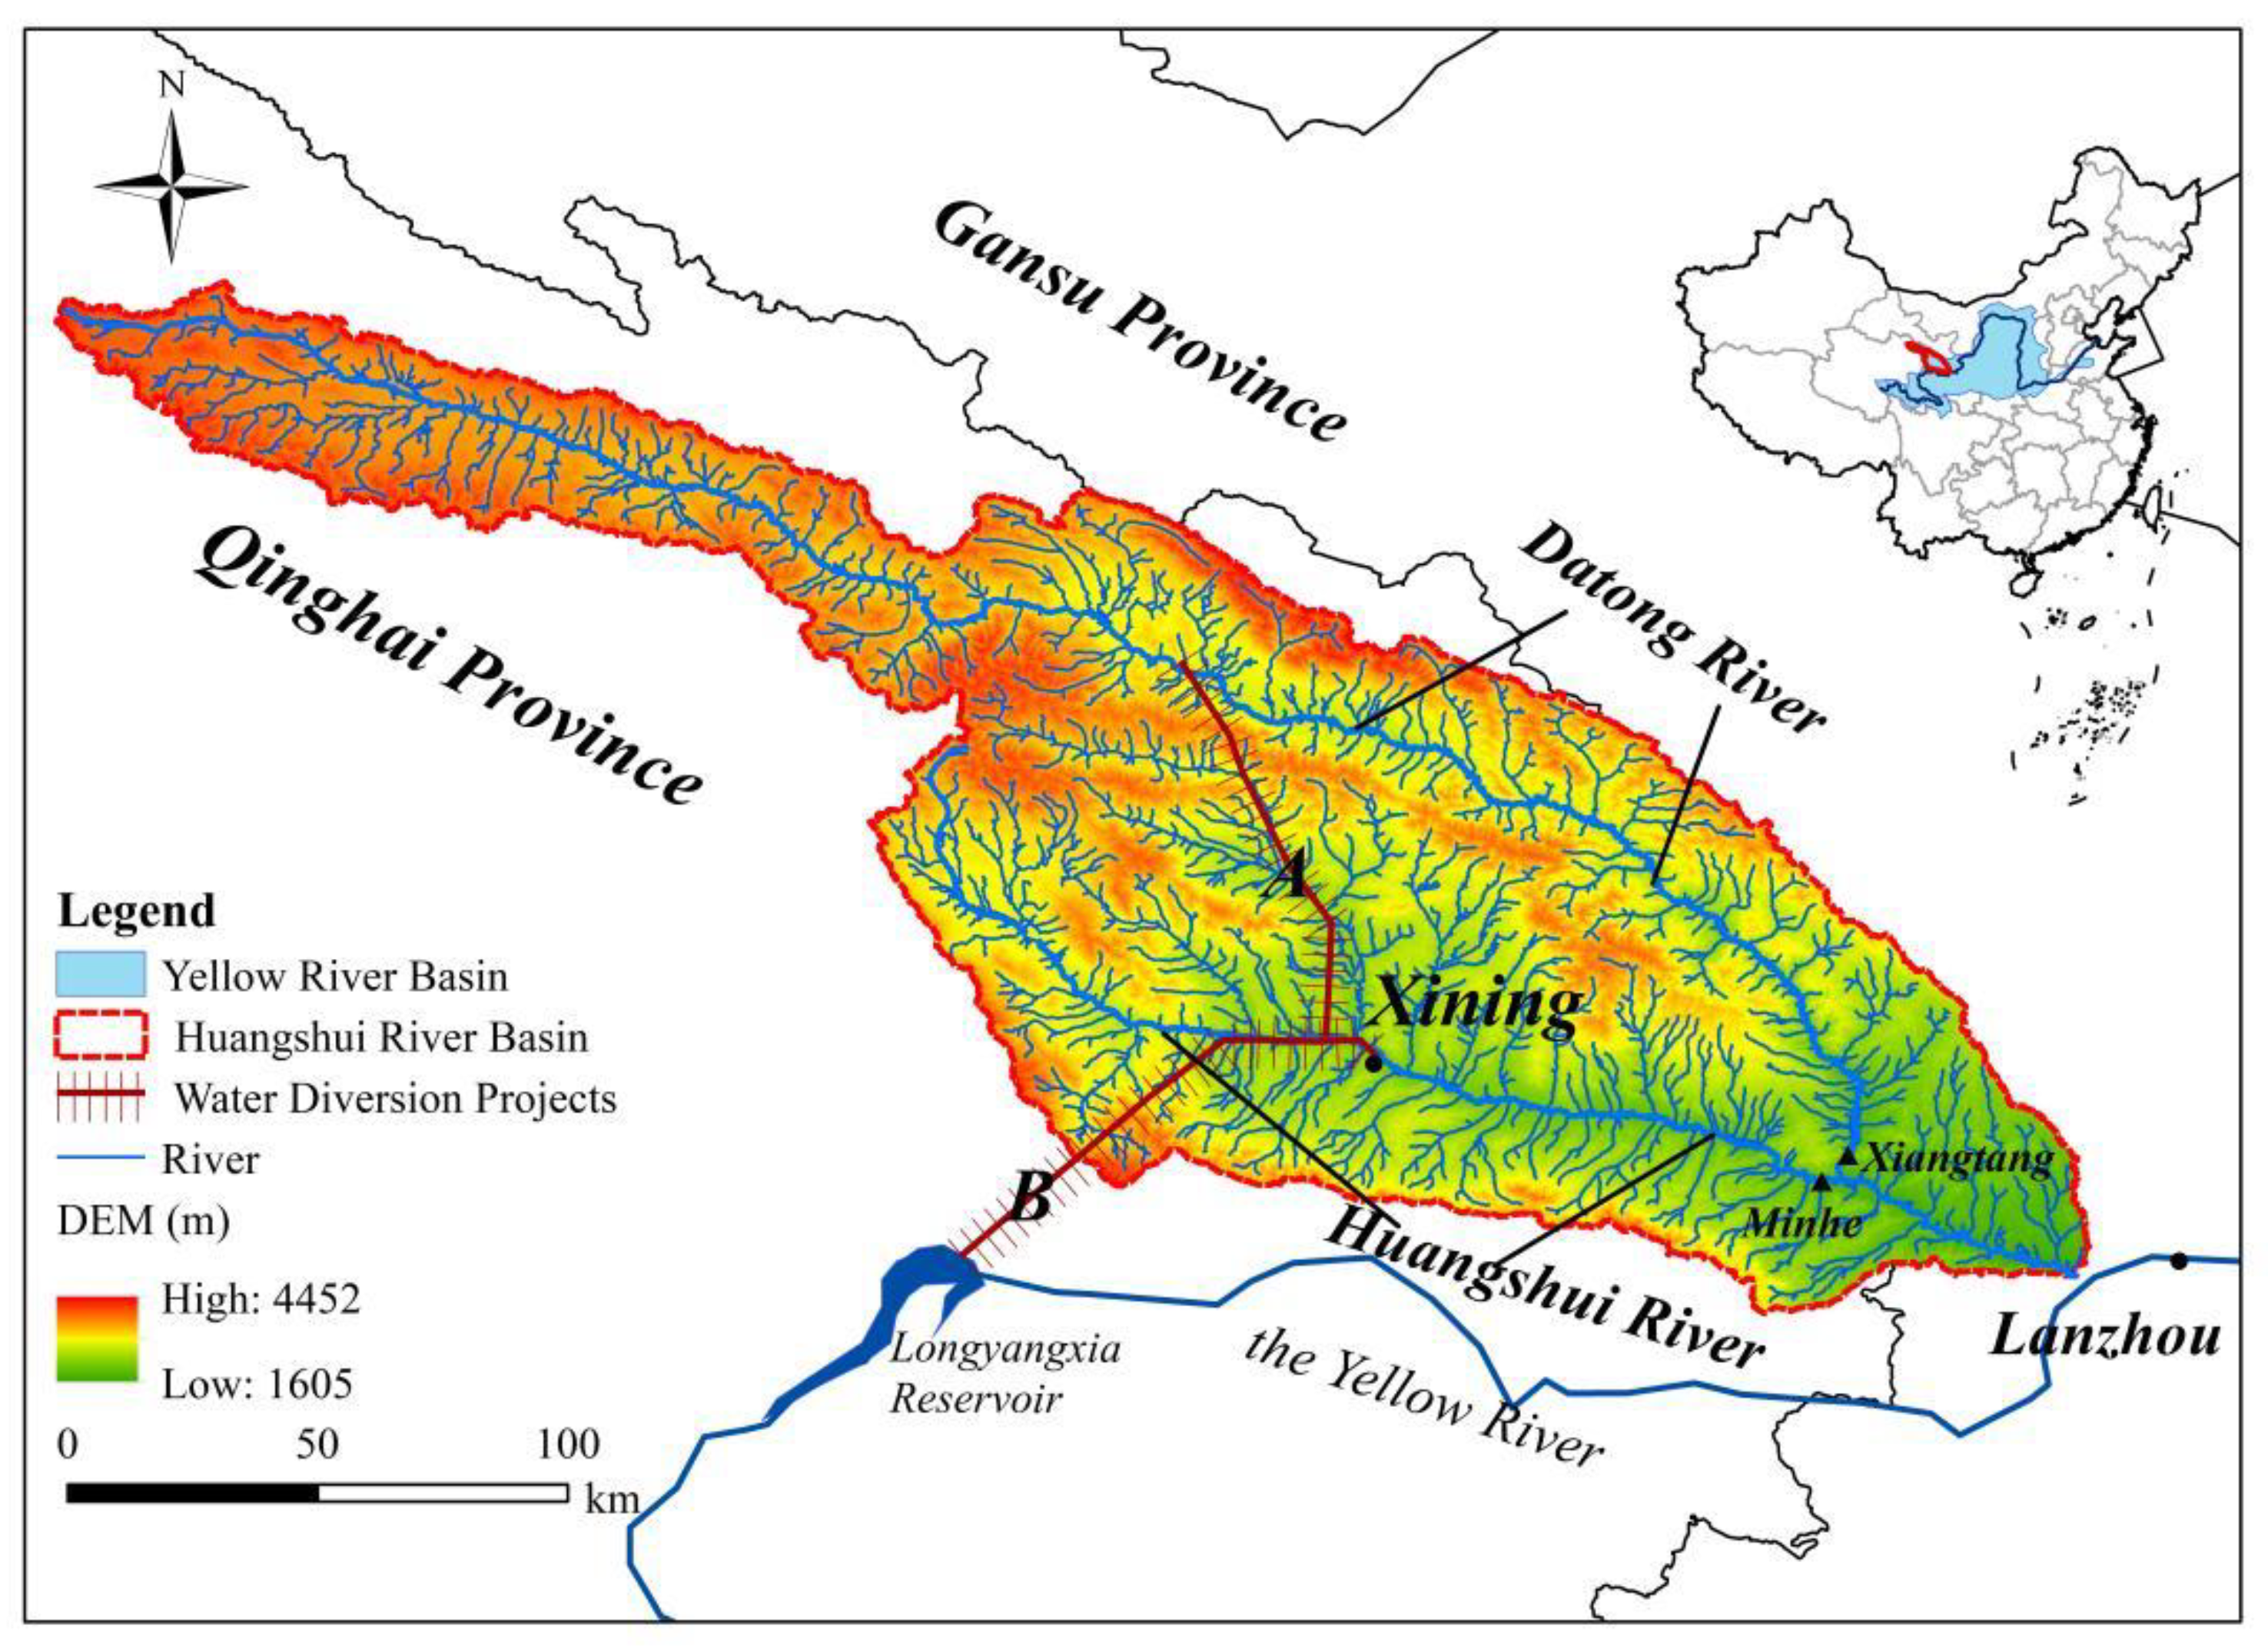
Figure 2.
Classification of security grade and standard.
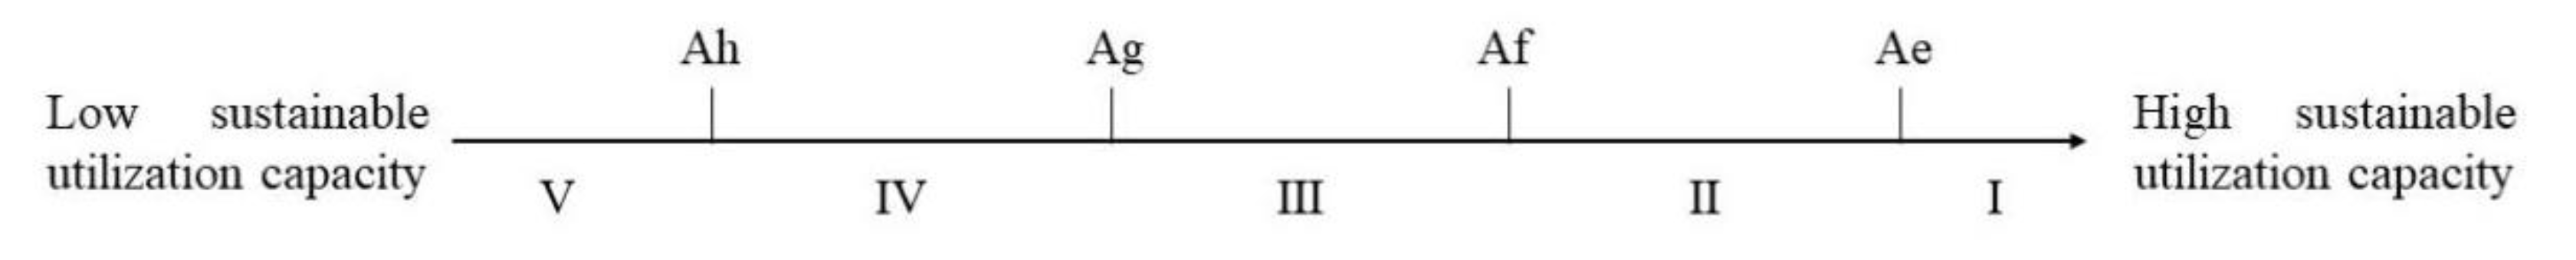
Figure 3.
Influence Factor Diagram.
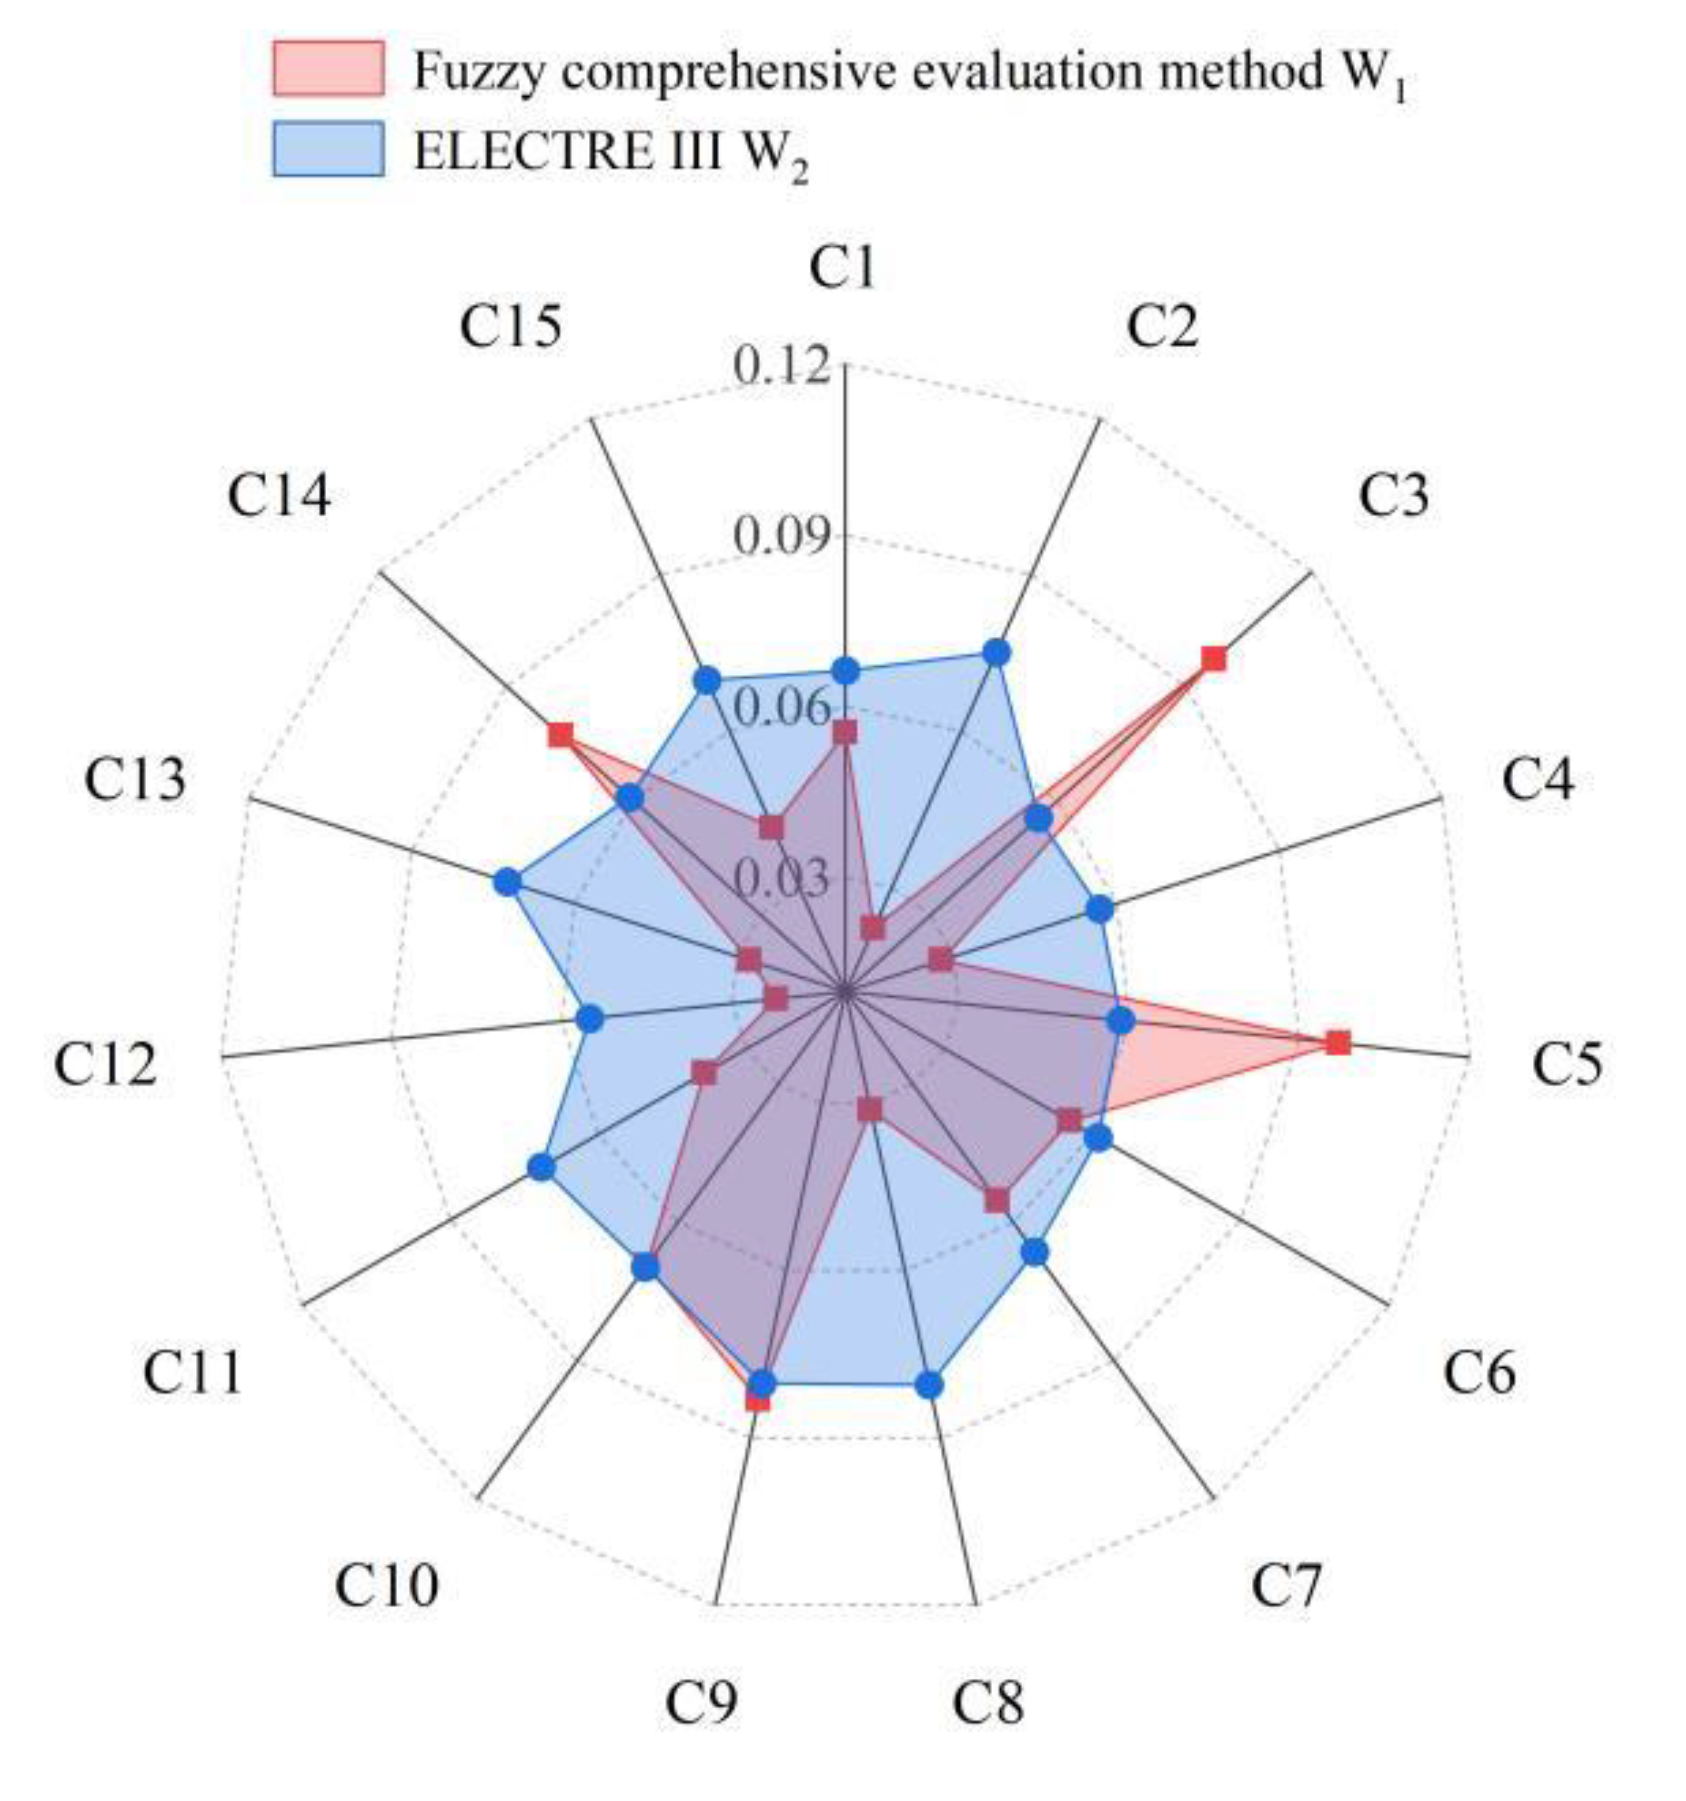

Table 1.
Evaluation index system of sustainable utilization capacity of water resources in Huangshui River Basin.
Table 1.
Evaluation index system of sustainable utilization capacity of water resources in Huangshui River Basin.
| objective | criterion | Indicator | calculation method | Indicators properties |
|---|---|---|---|---|
| Evaluation of sustainable utilization capacity of water resources | Indicators of climatic factors | Average multi-year precipitation/ mm | Total multi-year rainfall/year | positive |
| Concentration of precipitation/ % | Multi-year average ratio of maximum 4 consecutive months of precipitation to annual precipitation | negative | ||
| aridity index | Ratio of annual evaporative capacity to annual precipitation | negative | ||
| Annual Precipitation Extreme Ratio | Ratio of annual evaporative capacity to annual precipitation | negative | ||
| Indicators for water resources systems | water deficit/ % | Ratio of water deficit to total water supply | negative | |
| Surface water resource development and utilization/ % | Ratio of total water use to total water resources | negative | ||
| Ratio of inter-basin/regional transfers to local water resources/ % | Inter-basin transfers/total water resources | negative | ||
| Water quality compliance rate of water functional areas/ % | Number of water-quality-attainment sections in water functional zones/total number of sections in water functional zones | negative | ||
| Socio-economic indicators | Water resources per capita/ m3 | Total water resources/total population | negative | |
| water consumption of ten thousand Yuan output value/( m3/ ten thousand yuan) | Total water consumption/total GDP | negative | ||
| population density / People/ km2 |
Total population/basin area | negative | ||
| Per capita GDP/ million yuan | Total GDP/total population | negative | ||
| Average acre-foot water use for irrigated farmland/ m3 | Irrigation water use / irrigated acres of farmland | negative | ||
| Water consumption of 10,000 yuan of industrial output value/(m3/ million yuan) | Industrial water consumption/million yuan of industrial output value | negative | ||
| Centralized urban wastewater treatment rate/ % | Sewage treatment/total sewage discharge | negative |
Note: Positive attributes indicate that the larger the value of the evaluation index, the greater the sustainable utilization capacity of the basin’s water resources; negative attributes indicate a negative correlation between the evaluation index and the sustainable utilization capacity.
Table 2.
Classification standard of evaluation index of sustainable utilization capacity of water resources in Huangshui Basin.
Table 2.
Classification standard of evaluation index of sustainable utilization capacity of water resources in Huangshui Basin.
| objective | criterion | Indicator | I | II | III | IV | V |
|---|---|---|---|---|---|---|---|
| Evaluation of sustainable utilization capacity of water resources | Indicators of climatic factors | Average multi-year precipitation/mm | <200 | 200~400 | 400~600 | 600~800 | >800 |
| Concentration of precipitation/ % | >80 | 70~80 | 60~70 | 50~60 | <50 | ||
| aridity index | >7 | 3~7 | 2~3 | 1~2 | <1 | ||
| Annual Precipitation Extreme Ratio | >3 | 2.5~3 | 2~2.5 | 1.5~2 | <1.5 | ||
| Indicators for water resources systems | water deficit/% | >70 | 50~70 | 30~50 | 10~30 | <10 | |
| Surface water resource development and utilization/ % | >80 | 60~80 | 40~60 | 20~40 | <20 | ||
| Ratio of inter-basin/regional transfers to local water resources/ % | >20 | 15~20 | 10~15 | 5~10 | <5 | ||
| Water quality compliance rate of water functional areas/ % | <40 | 40~60 | 60~70 | 70~90 | >90 | ||
| Socio-economic indicators | Water resources per capita/m3 | <500 | 500~1000 | 1000~1700 | 1700~3000 | >3000 | |
| water consumption of ten thousand Yuan output value/(m3/million yuan) | >200 | 170~200 | 130~170 | 40~130 | <40 | ||
| population density / person/ km2 |
>500 | 400~500 | 260~400 | 180~260 | <180 | ||
| Per capita GDP/ million yuan | >8 | 3.5~8 | 2.5~3.5 | 0.5~2.5 | <0.5 | ||
| Average acre-foot water use for irrigated farmland/ m3 | >400 | 320~400 | 260~320 | 200~260 | <200 | ||
| Water consumption of 10,000 yuan of industrial output value/( m3/ million yuan) | >100 | 66~100 | 40~66 | 18~40 | <18 | ||
| Centralized urban wastewater treatment rate/ % | <20 | 20~30 | 30~50 | 50~60 | >60 | ||
| Sustainable utilization capacity of indicators | Low sustainable utilization capacity | Lower sustainable utilization capacity | Medium sustainable utilization capacity | Higher sustainable utilization capacity | High sustainable utilization capacity | ||
Table 3.
Evaluation result of single index of sustainable utilization capacity of water resources in Huangshui River Basin.
Table 3.
Evaluation result of single index of sustainable utilization capacity of water resources in Huangshui River Basin.
| objective | criterion | Indicator | Multi-year averages | Level |
|---|---|---|---|---|
| Evaluation of sustainable utilization capacity of water resources | Indicators of climatic factors | Average multi-year precipitation/ mm | 350 | II |
| Concentration of precipitation/ % | 84.2 | I | ||
| aridity index | 2.57 | III | ||
| Annual Precipitation Extreme Ratio | 5.3 | I | ||
| Indicators for water resources systems | water deficit/ % | 34.4 | III | |
| Surface water resource development and utilization/ % | 35.2 | IV | ||
| Ratio of inter-basin/regional transfers to local water resources/ % | 6.7 | IV | ||
| Water quality compliance rate of water functional areas/ % | 41.7 | II | ||
| Socio-economic indicators | Water resources per capita/m3 | 670 | II | |
| water consumption of ten thousand Yuan output value/( m3/ million yuan) | 85 | IV | ||
| population density / person/ km2 |
196.5 | Ⅳ | ||
| Per capita GDP/ million yuan | 2.01 | III | ||
| Average acre-foot water use for irrigated farmland/ m3 | 439 | I | ||
| Water consumption of 10,000 yuan of industrial output value/( m3/ million yuan) | 32 | IV | ||
| Centralized urban wastewater treatment rate/ % | 75 | V |
Table 4.
Evaluation index weights and thresholds.
| Indicator | Weights (wj) | strictly dominant thresholds(pj) | no difference threshold(qj) | veto threshold(v)j |
|---|---|---|---|---|
| C1 | 0.0663 | 760 | 228 | 3800 |
| C2 | 0.0751 | -33.16 | -9.948 | -165.8 |
| C3 | 0.0555 | 0.4 | 0.12 | 2 |
| C4 | 0.0569 | -0.44 | -0.132 | -2.2 |
| C5 | 0.0585 | 4 | 1.2 | 20 |
| C6 | 0.0612 | -4 | -1.2 | -20 |
| C7 | 0.0664 | -1 | -0.3 | -5 |
| C8 | 0.0805 | 82 | 24.6 | 410 |
| C9 | 0.0802 | 2900 | 870 | 14500 |
| C10 | 0.0697 | 0 | 0 | 0 |
| C11 | 0.0716 | -80 | -24 | -400 |
| C12 | 0.0551 | 1.1 | 0.33 | 5.5 |
| C13 | 0.0723 | -112.2 | -33.66 | -561 |
| C14 | 0.0609 | 2 | 0.6 | 10 |
| C15 | 0.0698 | 71 | 21.3 | 355 |
Table 5.
Evaluation index weights and thresholds.
| Indicator | A1 (Huangshui basin) | A2 (Ah) | A3 (Af) | A4 (Ag) | A5 (Ae) |
|---|---|---|---|---|---|
| B(ai) | 0 | -3 | -1 | 1 | 3 |
| Rank | 3 | 5 | 4 | 2 | 1 |
Disclaimer/Publisher’s Note: The statements, opinions and data contained in all publications are solely those of the individual author(s) and contributor(s) and not of MDPI and/or the editor(s). MDPI and/or the editor(s) disclaim responsibility for any injury to people or property resulting from any ideas, methods, instructions or products referred to in the content. |
© 2024 by the authors. Licensee MDPI, Basel, Switzerland. This article is an open access article distributed under the terms and conditions of the Creative Commons Attribution (CC BY) license (http://creativecommons.org/licenses/by/4.0/).
Copyright: This open access article is published under a Creative Commons CC BY 4.0 license, which permit the free download, distribution, and reuse, provided that the author and preprint are cited in any reuse.


