

Submitted:
26 August 2024
Posted:
27 August 2024
You are already at the latest version
Abstract
Estimation of tree volume typically focuses on excurrent forms, with less attention given to decurrent forms. Species with decurrent form, particularly hardwoods, lack a dominant stem and have large diameter branches that can be included in the merchantable wood volume. We developed a preliminary two-equation system comprising a taper equation and a merchantable whole-tree volume (stem and branches) equation for Quercus rubra L. growing in Navarra (Northern Spain). The equation system includes the diameter at breast height and total tree height as independent variables, along with merchantable height—the height up to which the stem maintains a well-defined excurrent form—as an additional variable. After estimating the stem volume, the branch volume is estimated by subtracting the stem volume from the merchantable whole-tree volume. A second order continuous autoregressive error structure was used to correct for autocorrelation between residuals from the fitted taper equation. The equations explained 90% of the observed variability in diameter and 86% of the observed variability in merchantable whole-tree volume. Both equations have been implemented in the Cubica Navarra software for use as a system of equations. These equations are considered preliminary and will be refitted or validated as additional data becomes available from various locations.
Keywords:
merchantable height
; irregular trees
; branching architecture
; autocorrelation
1. Introduction
Estimation of tree wood volume is one of the most important tasks for forest managers. Tree volume is usually considered to equal stem volume, and taper equations are used when product demand is expressed in terms of tree dimensions for different industrial uses. Taper equations predict the variation in diameter along the stem, and they therefore characterize stem form (Clutter et al. 1983; Avery and Burkhart 2002). Integration of the taper equation from the ground to any height provides an estimate of the wood volume up to that height. However, in contrast to the almost always excurrent form in softwoods, hardwoods often have decurrent form (Assmann 1970; Burkhart and Tomé 2012); and not all trees have a well-defined stem and they may be forked or lack apical dominance. In the development of taper equations, trees that differ from the idealized excurrent form are generally excluded (MacFarlane and Weiskittel 2016). However, some authors have incorporated different stem forms in stem taper models; thus e.g. Adu-Bredu et al. (2008) considered three general forms of Tectona grandis L.f. in West Africa, in order to take into account the effect of forks in the taper equation: zero-forked trees, one-forked trees and two-forked trees. For forked trees, the height(s) of fork(s) must be measured by the forest manager. MacFarlane and Weiskittel (2016) developed a generalized stem taper which can be calibrated by adding random-effects parameters depending on the species (22 species were considered) and merchantable form types (10 types were considered, including the combination of the presence/absence of merchantable stem/branches with the destination of saw/pulp).
In the other hand, some branches may be of sufficiently large diameter to be merchantable (Figure 1) with a main destination of pulp products (MacFarlane and Weiskittel 2016), and their volume should be known. However, most research is focused on modelling stem volume, and estimation of branch volume has received less attention (MacFarlane 2011; Ver Planck and MacFarlane 2014; Corral-Rivas et al. 2017). Quantification of tree branches has typically considered branch biomass, as quantifying branch volume is challenging owing to the large numbers of pieces of different sizes and shapes (MacFarlane 2011).
The northern red oak (Quercus rubra L.) was introduced to northern Spain for productive purposes in the 20th century, and Navarra region currently has the largest stocks of this species (Pemán García et al. 2013). Because of the decurrent form, the Regional Forest Service, in addition to diameter at breast height (D, measured 1.3 m above the ground) and total tree height (H), usually also measures the merchantable height (hm, Figure 1). Merchantable height is the subjective height up to which the stem has a form similar to excurrent form. When only taper equations are developed using D and H, the following are assumed: (i) excurrent form occurs and the stem is considered by the minimum top diameter fixed by the forest manager (dmin, Figure 1 right); and (ii) merchantable whole-tree volume (Vt) would be equal to stem volume, and Vt could therefore be underestimated. It has been found by Regional Forest Service that Vt is generally underestimated in trees classified as “poorly formed” because they have a large branch volume. Stem volume equations have already been developed for different stem forms and the main forest species considered in the Spanish National Forest Inventory (SNFI) (MITECO 2023). However, the SNFI approach does not classify stem products or consider the branch volume.
The overall objective of the present study was to develop a preliminary system of equations that allows estimation of the merchantable whole-tree volume and classification of wood products for Q. rubra growing in Navarra. The specific objectives were as follows: (i) to develop a taper equation that enables classification of stem products; (ii) to develop an equation that estimates the merchantable whole-tree volume (Vt), for both stem and branches; and (iii) to determine the compatibility of both equations and their applicability in routine forest inventories in Navarra. The nomenclature used in this study is summarized in Table 1.
2. Materials and Methods
2.1. Data
The study was conducted in the region of Navarra (North of Spain). A total of 30 oak trees were destructively sampled in 2001 in Etxalar in order to develop a taper equation for the Navarra Government. In 2021, sampling of 34 trees was carried out in Altsasu. Diameter at breast height (D -cm-, 1.3 m above ground level) was measured to the nearest 0.1 cm for each tree. Subsequently, the trees were felled, resulting in stumps of average height of 0.10 m. The maximum length of the felled trees was measured to the nearest 0.01 m to determine the total tree height (H, m). The bole was subsequently sectioned into logs at 2 m intervals in the trees from Etxalar and 1 m in those from Altsasu, up to a minimum diameter of 7 cm in the trees which had a well-defined dominant stem or, otherwise, until the merchantable height (hm) was reached. Two perpendicular diameters over bark were measured in each cross section (at height h -m- from ground level), to the nearest 0.5 cm, and the values were then averaged (d, cm). Moreover, in Altsasu the merchantable branches also were measured at 1-m intervals. For the branches, the same minimum diameter of 7 cm was defined unless branch architecture suggested a larger top diameter. The volume of a section (stem or branches) was calculated by Smalian´s formula.
2.2. Taper Equation
The scatter plot of relative diameter (d/D) against relative height (h/H) was visually examined for the 64 available trees to detect any possible anomalies in the data. Because inconsistent data were detected, a systematic method was taken to identify abnormal data points (Bi 2000), enhancing process efficiency. This involved employing local quadratic nonparametric fitting (LOESS) with a smoothing factor of 0.3, determined through iterative fitting and visual assessment of the smoothed taper curves overlaid on the data. This approach detected 1.28% anomalies from the initial data points, and these outliers were removed before parameterizing the taper models. Some of the outliers could be due to errors in measuring the bole sections or mistakes in transcribing field notes. However, others might be the result of deformations caused by fire damage, large knots, and other types of physical damage, such as partial death, growth deformities, and so on. For the data ultimately utilized, the summary statistics are displayed in Table 2, while Figure 2 illustrates the scatter plot of d/D against h/H.
The taper equations tested include the models developed by Max and Burkhart (1976), Biging (1984), Stud (Daquitaine et al., 1999), Bi (2000), Fang et al. (2000), Sharma and Zhang (2004), and Kozak (2004). Firstly, the models were fitted by Ordinary Nonlinear Least Squares (ONLS) using the Gauss-Newton iterative method (Hartley 1961). The initial values used in the iteration process were obtained from previous studies.
2.3. Merchantable Whole-Tree Volume
Merchantable whole-tree volume equation (Vt) includes stem volume (vs or Vs) and merchantable branch volume (Vb). We chose to develop a merchantable whole-tree volume equation instead of a merchantable branch volume equation because merchantable branch volume will be estimated by subtraction once stem volume is estimated up to the merchantable height (hm). All 64 trees were used for development of the taper equation, but only the 34 trees from Altsasu (summary statistics in Table 3) were used to develop the merchantable whole-tree volume equation (Vt) because merchantable branch volumes were calculated.
Linear, power and exponential models were fitted during the development of the Vt equation. The linear models were fitted by linear regression using the least squares method, and the non-linear models were fitted by ONLS using the Gauss-Newton iterative method (Hartley 1961). The initial values used in the iteration process were obtained by linear regression on the logarithmic transformation of the models. This approach is useful for solving many fitting problems in nonlinear models (Draper and Smith 1998). Diameter at breast height (D), total tree height (H), the combined variable D2H, the merchantable height (hm), and the hm/H ratio were tested as independent variables. In the present study, the hm/H ratio ranged from 0.36 to 0.91, with a mean value of 0.72.
Merchantable whole-tree volume (Vt) should be always greater than or equal to stem volume (Vs). However, this restriction was not included in the model formulation. A simulation was carried out to verify that Vt ≥ Vs. A database of D in the range 10-100cm was simulated at intervals of 5 cm and all possible combinations were crossed with a database of H in the range 5-60m, at intervals of 5 m. Vs was selected in the comparison because it is the highest value estimated by the taper equation.
2.4. Model Fitting
Statistical and graphical analyses were conducted to compare the performance of the equations. Plots of residuals against predicted values and plots of observed values against predicted values were examined to evaluate heteroscedasticity, anomalous trends and bias. Moreover, in development of the taper equation, the residuals were evaluated across relative height and D classes (McTague and Weiskittel 2021), both in absolute values of residuals and in relative values (, see notation below). The numerical analysis consisted of comparing three statistical criteria obtained from the residuals (Myers 1990): the coefficient of determination (R2), which measures the amount of the observed variability explained by the model, the mean bias (e), which is the average difference between the values estimated by a model and the actual observed values, and the root mean squared error (RMSE), which provides a measure of the precision of the estimates in the same units as the dependent variable. Despite the recognized limitations attributed to the utilization of R2 in nonlinear regression analysis, it is pertinent to underscore that the broader applicability of a comprehensive measure of model adequacy may supersede such constraints (Ryan 1997). The mean bias (e) and RMSE are also expressed as percentages (e (%) and RMSE (%)). The expressions of these statistics are summarized as follows:
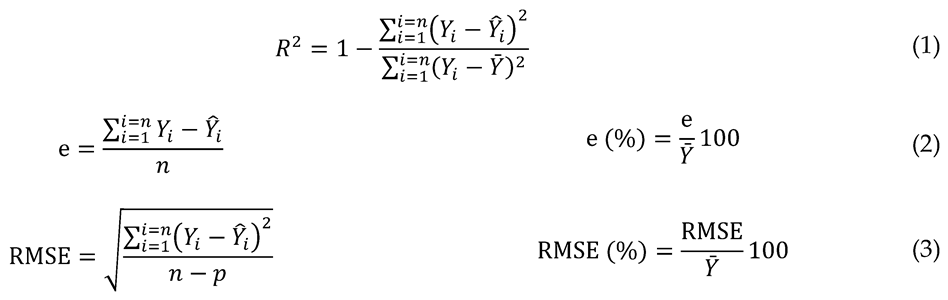
where and are the observed, estimated and the mean values of the dependent variable, respectively, n is the total number of observations used to fit the model, and p is the number of model parameters.
In regression analysis, the error terms should be independent, identically distributed, normal, random variables. However, in developing taper equations, multiple observations for each tree are used (i.e. longitudinal data). Thus, it is reasonable to expect that the observations within each tree will be spatially correlated and the assumption of independent error terms will therefore be violated (Burkhart and Tomé 2012). Autocorrelation can be taken into account by modelling the error term. To correct for the autocorrelation between residuals from the same tree, we used a continuous autoregressive error structure (CAR(x)), which accounts for the distance between measurements. This error structure expands the error term to (Zimmerman and Núñez-Antón 2001):
where eij is the jth ordinary residual of the ith individual, eij−k is the j-kth ordinary residual of the ith individual, Ik = 1 when j > k and 0 when j ≤ k, ρk is the k-order continuous autoregressive parameter to be estimated, and hij-hij−k is the distance separating the jth from the j-kth observation within each tree i, with hij > hij−k. In this case εij is an independent normal distributed error term with mean value of zero.
To assess the existence of autocorrelation and determine the appropriate order of the continuous autoregressive error structure (CAR(x)), plots of residuals versus lag-residuals (residuals from previous observations) within each tree were visually inspected. Appropriate fits for the selected model with correlated errors were obtained by including the CAR(x) error structure in the MODEL procedure of SAS/ETS® software (SAS Institute Inc. 2008), which allows for dynamic updating of the residuals. In developing the total merchantable tree volume equation (Vt), the linear models were fitted using the REG procedure of SAS/STAT® (SAS Institute Inc. 2009) and the non-linear models were fitted using the NLIN procedure of the same software.
3. Results
3.1. Taper Equation
Although all models tested satisfactorily estimated diameters at different heights, the model of Fang et al. (2000) performed slightly better than the others and/or all of its parameters were significant at the α=5% significance level. This model assumes that the stem has three sections, each with a different form factor:
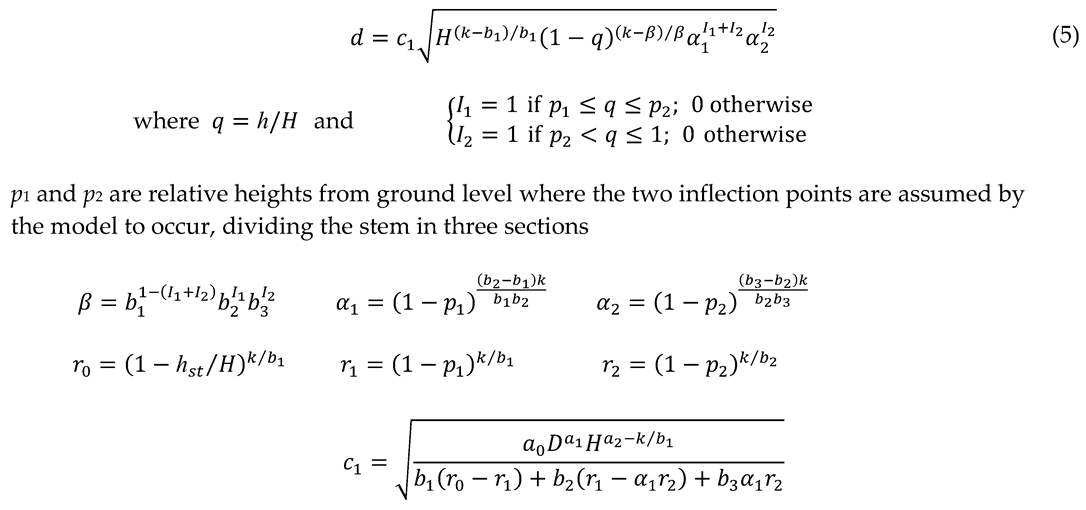
where d is the diameter (cm) at height h; h is the height above ground (m) to diameter d; D is the diameter at breast height (1.3 m above ground, cm); H is the total tree height (m); hst is the stump height (m); k is π/40,000, a metric constant for converting from diameter squared in cm2 to cross-section area in m2; bi is the form factor of tree section i and a0–a2, b1–b3, p1 and p2 are parameters to be estimated.
Integration of Equation (5) to any height limit (h) produces the merchantable volume Equation (6), m3. Assuming the tree has an excurrent form, integration of Equation (1) over total tree height (H) produces the stem volume Equation (7), m3.
The model of Fang et al. (2000) was initially fitted using ONLS, without expanding the error terms to account for autocorrelation. A trend in residuals as a function of lag-residuals within the same tree was apparent, as expected because of the longitudinal nature of the data used for model fitting (Figure 3, first row). To correct autocorrelation, the error term was modelled with a second order CAR structure, CAR(2), since the first order structure, CAR(1), did not totally correct autocorrelation with more than one lag (Figure 3, third and second rows, respectively). Although accounting for autocorrelation does not improve the predictive ability of the taper equation, it prevents underestimation of the covariance matrix of the parameters, thereby enabling use of the usual statistical tests (West et al. 1984), i.e. it allows valid interpretation. All parameter estimates, including autocorrelation parameters, were significant at the 5% level (Table 4).
The sole purpose of correction for autocorrelation was to obtain unbiased and efficient estimates of the parameters (Parresol and Vissage 1998), and it has no use in practical application. Therefore, to obtain a better idea of the true error expected, for practical use of the taper equation, we calculated the residuals obtained without autocorrelation parameters. The values of the statistical criteria were R2 = 0.901, e = 0.369 cm, e(%) = 1.42, RMSE = 3.54 cm and RMSE(%) = 13.7. The plot of residuals against estimated values showed a random pattern of residuals around zero, with no detectable significant trends (Figure 4).
The behaviour of residuals across the diameter at breast height classes was homogeneous both in absolute values and relative values of residuals (Figure 5, second row). The behaviour of residuals in absolute values across the relative height class was also homogeneous (Figure 5, first row, left), but the relative residuals increased with relative height (Figure 5, first row, right).
3.2. Merchantable Whole-Tree Volume
The merchantable whole-tree volume equation (Vt) includes stem volume (vs) and merchantable branch volume (Vb, with dmin= 7cm). The values of the statistical criteria for the model selected (Equation 8) were R2 = 0.861, e = -0.00625 m3, e(%) = -0.389, RMSE = 0.270 m3 and RMSE(%) = 16.8.
where Vt is the total merchantable tree volume (m3); D is the diameter at breast height (cm); H the total tree height (m); and t0, t1 and t2 are the fitted parameters, all of which were significant at the 5% level (Table 5). The plot of residuals against estimated values for Equation (8) showed a random pattern of residuals around zero, with no detectable significant trends (Figure 6).
3.3. System of Equations
Both the taper equation and merchantable whole-tree volume (Vt) equation have been integrated into the Cubica Navarra software (https://administracionelectronica.navarra.es/CubicacionMadera/), to be used as a system of equations. The input variables are diameter at breast height (D), total tree height (H) and merchantable height (hm). If hm is not specified, the system considers a well-defined excurrent form, with the stem top height defined by the minimum top diameter (dmin) selected by the forest manager. For merchantable whole-tree volume the dmin was fixed at 7 cm. The system also classifies products in the stem, with the remaining merchantable volume assumed to be in the branches, estimated by subtracting the stem volume from the merchantable whole-tree volume. Simulations performed with all possible combinations of D = 10-100 cm (at 5 cm intervals) and H = 5-60 m (at 5 m intervals) produced logical results (Vt > Vs) across the whole range of values.
4. Discussion
We developed a merchantable whole-tree volume model system, including stem and merchantable branches, based on the current measurements available from the Navarra Regional Forest Service. In accordance with Ver Planck and MacFarlane (2014), this study did not exclude forked trees or trees of poor form, typically seen in hardwood species, and which would exclude trees with large branches. MacFarlane and Weiskittel (2016) describe some defects in the ideal excurrent stem form which lead to trees or even stands being excluded in studies of stem taper equation development. The objective of the present study was to improve economic assessment of wood products, focused on stem volume because this prioritizes economic profitability while also considering the volume of merchantable branches.
The data used to develop the present system of equations is not widely representative regarding either the spatial distribution or number of trees; moreover, the ranges of diameters (25-58.5 cm) and heights (17.5-31.4 m) did not include small or overmature trees. However, in developing the taper equation, we used 930 observations of stem diameters along the bole, which is more than the minimum of 825 observations reported by Kitikidou and Chatzilazarou (2008) to be needed to parameterize taper equations correctly. We also used 64 trees, which is greater than the minimum 40-85 sample trees needed, and measurements of diameters along the stem were taken at least every 2 m (McTague and Weiskittel 2021). For development of merchantable whole-tree volume equations, it is advisable to use several stands because tree form varies between stands as a result of several factors such as site productivity, density, genetics, stand management and historical biotic or abiotic damage (Gevorkiantz and Olsen 1955; Neilsen and Gerrand 1999; Kerr and Boswell 2001; Gomat et al. 2011; MacFarlane and Weiskittel 2016; McTague and Weiskittel 2021). Taking biomass into account, Montagu et al. (2005) associated the proportion of mass allocated to branches with location and D. Stem form and partitioning of biomass among components have been shown to be affected by density, thinning, pruning and fertilization (Bi et al. 2010). In this study, only two locations were included; therefore, the developed model system is considered preliminary and independent data from other locations will be useful for refitting or validating it. In the taper equation development, we did not consider the discontinuity of diameter produced by the crown basis (Le Moguédec and Dhôte 2012) or the forks (Adu-Bredu et al. 2008). However, a new variable -already measured by the Navarra Regional Forest Service- is considered, the merchantable height (hm), simplifying consideration of the rest of the merchantable volume (including the wood above hm) as branches.
In the prediction of merchantable whole-tree volume, inclusion of the available merchantable height (hm) or the hm/H ratio as independent variables did not improve the predictive capacity of the model. MacFarlane (2011) found that variables such as crown ratio (CR) and the diameter at the base of the largest branch were good predictors of large branch volume. Crown ratio can be calculated by measuring height to the crown base, in addition to total tree height. Digital hypsometers can be used to measure several heights. However, variables such as diameter at the base of the largest branch or crown diameter are not easily measured. MacFarlane (2011) selected D and CR as predictor variables in developing species-specific large branch volume equations. Mäkelä and Valentine (2006) also indicated that CR is useful for tree allometry prediction. Crown length can be also used (Özçelik and Bal 2013). McTague and Weiskittel (2021) mentioned that the exploration of crown variables is encouraged in the development of taper equations. Moreover, the widely used crown classes (dominant, codominant, intermediate and suppressed trees) could be tested (Sanquetta et al. 2020). The use of emerging technologies such as terrestrial laser scanning (TLS) could improve the development and/or utilization of taper and volume equations (McTague and Weiskittel 2021). Moreover, non-destructive technologies such as ultrasonic and thermal images could be used to detect internal defects (Taskhiri et al. 2020).
Large branches can be defined as those with a significant impact on stem form (MacFarlane 2010) or through a minimum top diameter. MacFarlane (2011) defined large branches in hardwoods in Michigan state (USA) as those of diameter ≥ 9 cm and observed that the proportion of sampled trees with large branches changed as a function of the D class, ranging from 0% in the 10-cm class up to almost 100% in ≥60 cm classes. In our study, minimum top diameter for merchantable branches is 7 cm and only one tree (D= 38 cm) did not have merchantable branch volume (Vb). The Vb/Vt ratio ranged from 0 to 43% (mean 20%), and there was a non-significant positive correlation between Vb/Vt and D (Pearsons r = 0.25, p-value = 0.159). A weak positive correlation between Vb/Vt and D was also observed by MacFarlane (2011) and Ver Planck and MacFarlane (2014). It should also be taken into account that the data used in this study did not include small trees; and Gómez-García et al. (2016) reported that the contribution of each tree biomass component to the total biomass tends to stabilize as the tree diameter increases in Quercus robur L. growing in NW Spain.
Minimum top diameter (dmin) for merchantable volume is not a global standard and includes values of e.g. 5 cm (Rytter 2002), 7 cm (Segura and Kanninnen 2005; Gómez-García et al. 2016), 9 cm (Lambert et al. 2005; MacFarlane 2011) and 10 cm (Jenkins et al. 2003; MacFarlane and Weiskittel 2016). Moreover, regarding the stem form and the merchantability of branches, values other than the minimum top diameter are considered, and our data included values of top diameter per whole-tree (stem and branches) in the range 7.0-10.5 cm. On the other hand, new biomass harvesting methods and industrial uses have increased the demand for previously non-merchantable products (Nicholls et al. 2009), leading to a change in the minimum top diameter.
More informative models of whole-tree volume could be developed by measuring and testing ancillary variables. For instance, it may be possible to develop equations modelling the vertical allocation of branch volume (Ver Planck and MacFarlane 2014), equations with a variable minimum top diameter (Gómez-García et al. 2015) and considering different merchantable form types (MacFarlane and Weiskittel 2016). Such approaches should also include trees with decurrent form. Further research is also necessary to consider variables related to stem form, branch architecture and volume, with the purpose of developing more biologically based models.
Author Contributions
Conceptualization, E.G.G. and R.A.P.; methodology, E.G.G. and R.A.P.; software, F.P.R; formal analysis, E.G.G; data curation, E.G.G; writing—original draft preparation, E.G.G; writing—review and editing, R.A.P and F.P.R.; supervision, C.M.T.; project administration, C.M.T. and R.A.P.; funding acquisition, C.M.T. All authors have read and agreed to the published version of the manuscript.
Funding
This research was funded by the Navarra Government, within the framework of the Cubica project.
Data Availability Statement
Data generated or analyzed during this study are available from the corresponding author upon reasonable request.
Acknowledgments
Thanks to the forest engineers Nati Gómez Corral and Grégori Miaillier, both from the company Basartea SL, for being responsible for capturing the data within the framework of the project.
Conflicts of Interest
The authors declare no conflicts of interest.
References
- Adu-Bredu, S.; Bi, A.F.T.; Bouillet, J.-P.; Mé, M.K.; Kyei, S.Y.; Saint-André, L. An explicit stem profile model for forked and un-forked teak (Tectona grandis) trees in West Africa. For. Ecol. Manag. 2008, 255, 2189–2203. [CrossRef]
- Assmann, E. 1970. The principles of forest yield study. Pergamon Press, Oxford, UK.
- Avery, T.E., and Burkhart, H.E. 2002. Forest measurements. 5th ed. McGraw-Hill, New York, USA.
- Bi, H. 2000. Trigonometric variable-form taper equations for Australian eucalyptus. For. Sci., 46: 397–409. [CrossRef]
- Bi, H., Long, Y., Turner, J., Lei, Y., Snowdon, P., Li, Y., Harper, R., Zerihun, A., and Ximenes, F. 2010. Additive prediction of above-ground biomass for P. radiata (D. Don) plantations. For. Ecol. Manage., 12: 2301–2314.
- Biging, G. 1984. Taper equations for second-growth mixed conifers of Nothern California. For. Sci., 30(4): 1103–1117.
- Burkhart, H.E., and Tomé, M. 2012. Modeling forest trees and stands. Springer, New York, USA.
- Clutter, J.L.; Fortson, J.C.; Pienaar, L.V.; Brister, G.H.; Bailey, R.L. Timber Management: A Quantitative Approach; John Wiley & Sons, Inc.: Hoboken, NJ, USA, 1983.
- Corral-Rivas, J.J.; Vega-Nieva, D.J.; Rodríguez-Soalleiro, R.; López-Sánchez, C.A.; Wehenkel, C.; Vargas-Larreta, B.; Álvarez-González, J.G.; Ruiz-González, A.D. Compatible System for Predicting Total and Merchantable Stem Volume over and under Bark, Branch Volume and Whole-Tree Volume of Pine Species. Forests 2017, 8, 417. [CrossRef]
- Daquitaine, R., Saint-Andre, L., and Leban, J.M. 1999. Product properties prediction - improved utilisation in the forestry-wood chain applied on spruce sawnwood: Modelling stem properties distribution. Final Report subtask A2.1., Nancy, France.
- Draper, N.R., and Smith, H. 1998. Applied regression analysis. 3rd ed. Wiley, New York, USA.
- Fang, Z.; Borders, B.E.; Bailey, R.L. Compatible Volume-Taper Models for Loblolly and Slash Pine Based on a System with Segmented-Stem Form Factors. For. Sci. 2000, 46, 1–12. [CrossRef]
- Gevorkiantz, S.R., and Olsen, L.P. 1955. Composite volume tables for timber and their application in the Lake States. USDA Technical Bulletin No. 1104, Washington, USA.
- Gomat, H.Y.; Deleporte, P.; Moukini, R.; Mialounguila, G.; Ognouabi, N.; Saya, A.R.; Vigneron, P.; Saint-Andre, L. What factors influence the stem taper of Eucalyptus: growth, environmental conditions, or genetics?. Ann. For. Sci. 2011, 68, 109–120. [CrossRef]
- Gómez-García, E.; Biging, G.; García-Villabrille, J.D.; Crecente-Campo, F.; Castedo-Dorado, F.; Rojo-Alboreca, A. Cumulative continuous predictions for bole and aboveground woody biomass in Eucalyptus globulus plantations in northwestern Spain. Biomass- Bioenergy 2015, 77, 155–164. [CrossRef]
- Gómez-García, E.; Diéguez-Aranda, U.; Cunha, M.; Rodríguez-Soalleiro, R. Comparison of harvest-related removal of aboveground biomass, carbon and nutrients in pedunculate oak stands and in fast-growing tree stands in NW Spain. For. Ecol. Manag. 2016, 365, 119–127. [CrossRef]
- Hartley, H.O. 1961. The modified Gauss-Newton method for the fitting of nonlinear regression functions by least squares. Technometrics, 3: 269–280.
- Jenkins, J.C.; Chojnacky, D.C.; Heath, L.S.; Birdsey, R.A. National-Scale Biomass Estimators for United States Tree Species. For. Sci. 2003, 49, 12–35. [CrossRef]
- Kerr, G., and Boswell, R.C. 2001. The influence of spring frosts, ash bud moth (Prays fraxinella) and site on forking of young ash (Fraxinus excelsior) in southern Britain. Forestry, 74: 29–40. [CrossRef]
- Kitikidou, K.; Chatzilazarou, G. Estimating the sample size for fitting taper equations. J. For. Sci. 2008, 54, 176–182. [CrossRef]
- Kozak, A. 2004. My last words on taper functions. For. Chron., 80: 507–515.
- Lambert, M.-C.; Ung, C.-H.; Raulier, F. Canadian national tree aboveground biomass equations. Can. J. For. Res. 2005, 35, 1996–2018. [CrossRef]
- Le Moguédec, G., and Dhôte, J.F. 2012. Fagacées: a tree-centered growth and yield model for sessile oak (Quercus petraea L.) and common beech (Fagus sylvatica L.). Ann. For. Sci., 69: 257–269. [CrossRef]
- MacFarlane, D.W. Predicting branch to bole volume scaling relationships from varying centroids of tree bole volume. Can. J. For. Res. 2010, 40, 2278–2289. [CrossRef]
- MacFarlane, D.W. Allometric Scaling of Large Branch Volume in Hardwood Trees in Michigan, USA: Implications for Aboveground Forest Carbon Stock Inventories. For. Sci. 2011, 57, 451–459. [CrossRef]
- MacFarlane, D.W.; Weiskittel, A.R. A new method for capturing stem taper variation for trees of diverse morphological types. Can. J. For. Res. 2016, 46, 804–815. [CrossRef]
- Mäkelä, A.; Valentine, H.T. CROWN RATIO INFLUENCES ALLOMETRIC SCALING IN TREES. Ecology 2006, 87, 2967–2972. [CrossRef]
- Max, T. A., and Burkhart, H. E. 1976. Segmented polynomial regression applied to taper equations. For. Sci., 22(3): 283-289.
- McTague, J.P.; Weiskittel, A.R. Evolution, history, and use of stem taper equations: a review of their development, application, and implementation. Can. J. For. Res. 2021, 51, 210–235. [CrossRef]
- MITECO. 2023. Spanish National Forest Inventory. Available from https://www.miteco.gob.es/es/biodiversidad/temas/inventarios-nacionales/inventario-forestal-nacional.html [accessed 7 November 2023].
- Montagu, K.; Düttmer, K.; Barton, C.; Cowie, A. Developing general allometric relationships for regional estimates of carbon sequestration—an example using Eucalyptus pilularis from seven contrasting sites. For. Ecol. Manag. 2004, 204, 115–129. [CrossRef]
- Myers, R.H. 1990. Classical and modern regression with applications. 2nd ed. Duxbury Press, Belmont, California, USA.
- A Neilsen, W.; Gerrand, A.M. Growth and branching habit of Eucalyptus nitens at different spacing and the effect on final crop selection. For. Ecol. Manag. 1999, 123, 217–229. [CrossRef]
- Nicholls, D.; Monserud, R.A.; Dykstra, D.P. International bioenergy synthesis—Lessons learned and opportunities for the western United States. For. Ecol. Manag. 2009, 257, 1647–1655. [CrossRef]
- zçelik, R., and Bal, C. 2013. Effects of adding crown variables in stem taper and volume predictions for black pine. Turk. J. Agric. For., 37: 231–242. [CrossRef]
- Parresol, B.R., and Vissage, J.S. 1998. White pine site index for the southern forest survey. USDA, Forest Service, Southern Research Station, Research Paper SRS-10, Asheville, NC, USA.
- Pemán García, J., Cosculluela Giménez, J., and Gómez Fernández, J.A. 2013. Quercus rubra L. In Producción y manejo de semillas y plantas forestales. Edited by J. Pemán García, R. Navarro, J.L. Nicolás, M.A. Prada and R. Serrada. Organismo Autónomo Parques Nacionales, Tomo II, Madrid, Spain, pp. 292–304.
- Ryan, T.P. 1997. Modern regression methods. John Wiley & Sons, New York, USA.
- Rytter, L. Nutrient content in stems of hybrid aspen as affected by tree age and tree size, and nutrient removal with harvest. Biomass- Bioenergy 2002, 23, 13–25. [CrossRef]
- Sanquetta, M.N.I., McTague, J.P., Scolforo, H.F., Behling, A., Sanquetta, C.R., and Schmidt, L.N. 2020. What factors should be accounted for when developing a generalized taper function for black wattle trees? Can. J. For. Res., 50(11): 1113–1123. [CrossRef]
- SAS Institute Inc. 2008. SAS/ETS® 9.2 User’s Guide. SAS Institute Inc., Cary, NC, USA.
- SAS Institute Inc. 2009. SAS/STAT® 9.2 User’s Guide. 2nd ed. SAS Institute Inc., Cary, NC, USA.
- Segura, M.; Kanninen, M. Allometric Models for Tree Volume and Total Aboveground Biomass in a Tropical Humid Forest in Costa Rica. Biotropica 2005, 37, 2–8. [CrossRef]
- Sharma, M.; Zhang, S. Variable-exponent taper equations for jack pine, black spruce, and balsam fir in eastern Canada. For. Ecol. Manag. 2004, 198, 39–53. [CrossRef]
- Taskhiri, M.S.; Hafezi, M.H.; Harle, R.; Williams, D.; Kundu, T.; Turner, P. Ultrasonic and thermal testing to non-destructively identify internal defects in plantation eucalypts. Comput. Electron. Agric. 2020, 173. [CrossRef]
- Planck, N.R.V.; MacFarlane, D.W. Modelling vertical allocation of tree stem and branch volume for hardwoods. For. Int. J. For. Res. 2014, 87, 459–469. [CrossRef]
- West, P.; Ratkowsky, D.; Davis, A. Problems of hypothesis testing of regressions with multiple measurements from individual sampling units. For. Ecol. Manag. 1984, 7, 207–224. [CrossRef]
- Zimmerman, D.L., and Núñez-Antón, V. 2001. Parametric modeling of growth curve data: an overview (with discussion). Test, 10: 1–73.
Figure 1.
Diagram of two trees with the same diameter at breast height (D, measured 1.3 m above the ground) and total height (H). The tree on the right has an excurrent form and its stem is limited by the minimum top diameter established by the forest manager (dmin). The tree on the left has a decurrent form, with its stem limited by the merchantable height (hm) and a total stem top diameter of dt. Both trees have a merchantable stem volume (vs, in black) and a merchantable branch volume (Vb, in gray). vs is denoted as Vs when dmin = 0 cm. Merchantable whole-tree volume (Vt)= (Vs or vs) + Vb.
Figure 1.
Diagram of two trees with the same diameter at breast height (D, measured 1.3 m above the ground) and total height (H). The tree on the right has an excurrent form and its stem is limited by the minimum top diameter established by the forest manager (dmin). The tree on the left has a decurrent form, with its stem limited by the merchantable height (hm) and a total stem top diameter of dt. Both trees have a merchantable stem volume (vs, in black) and a merchantable branch volume (Vb, in gray). vs is denoted as Vs when dmin = 0 cm. Merchantable whole-tree volume (Vt)= (Vs or vs) + Vb.
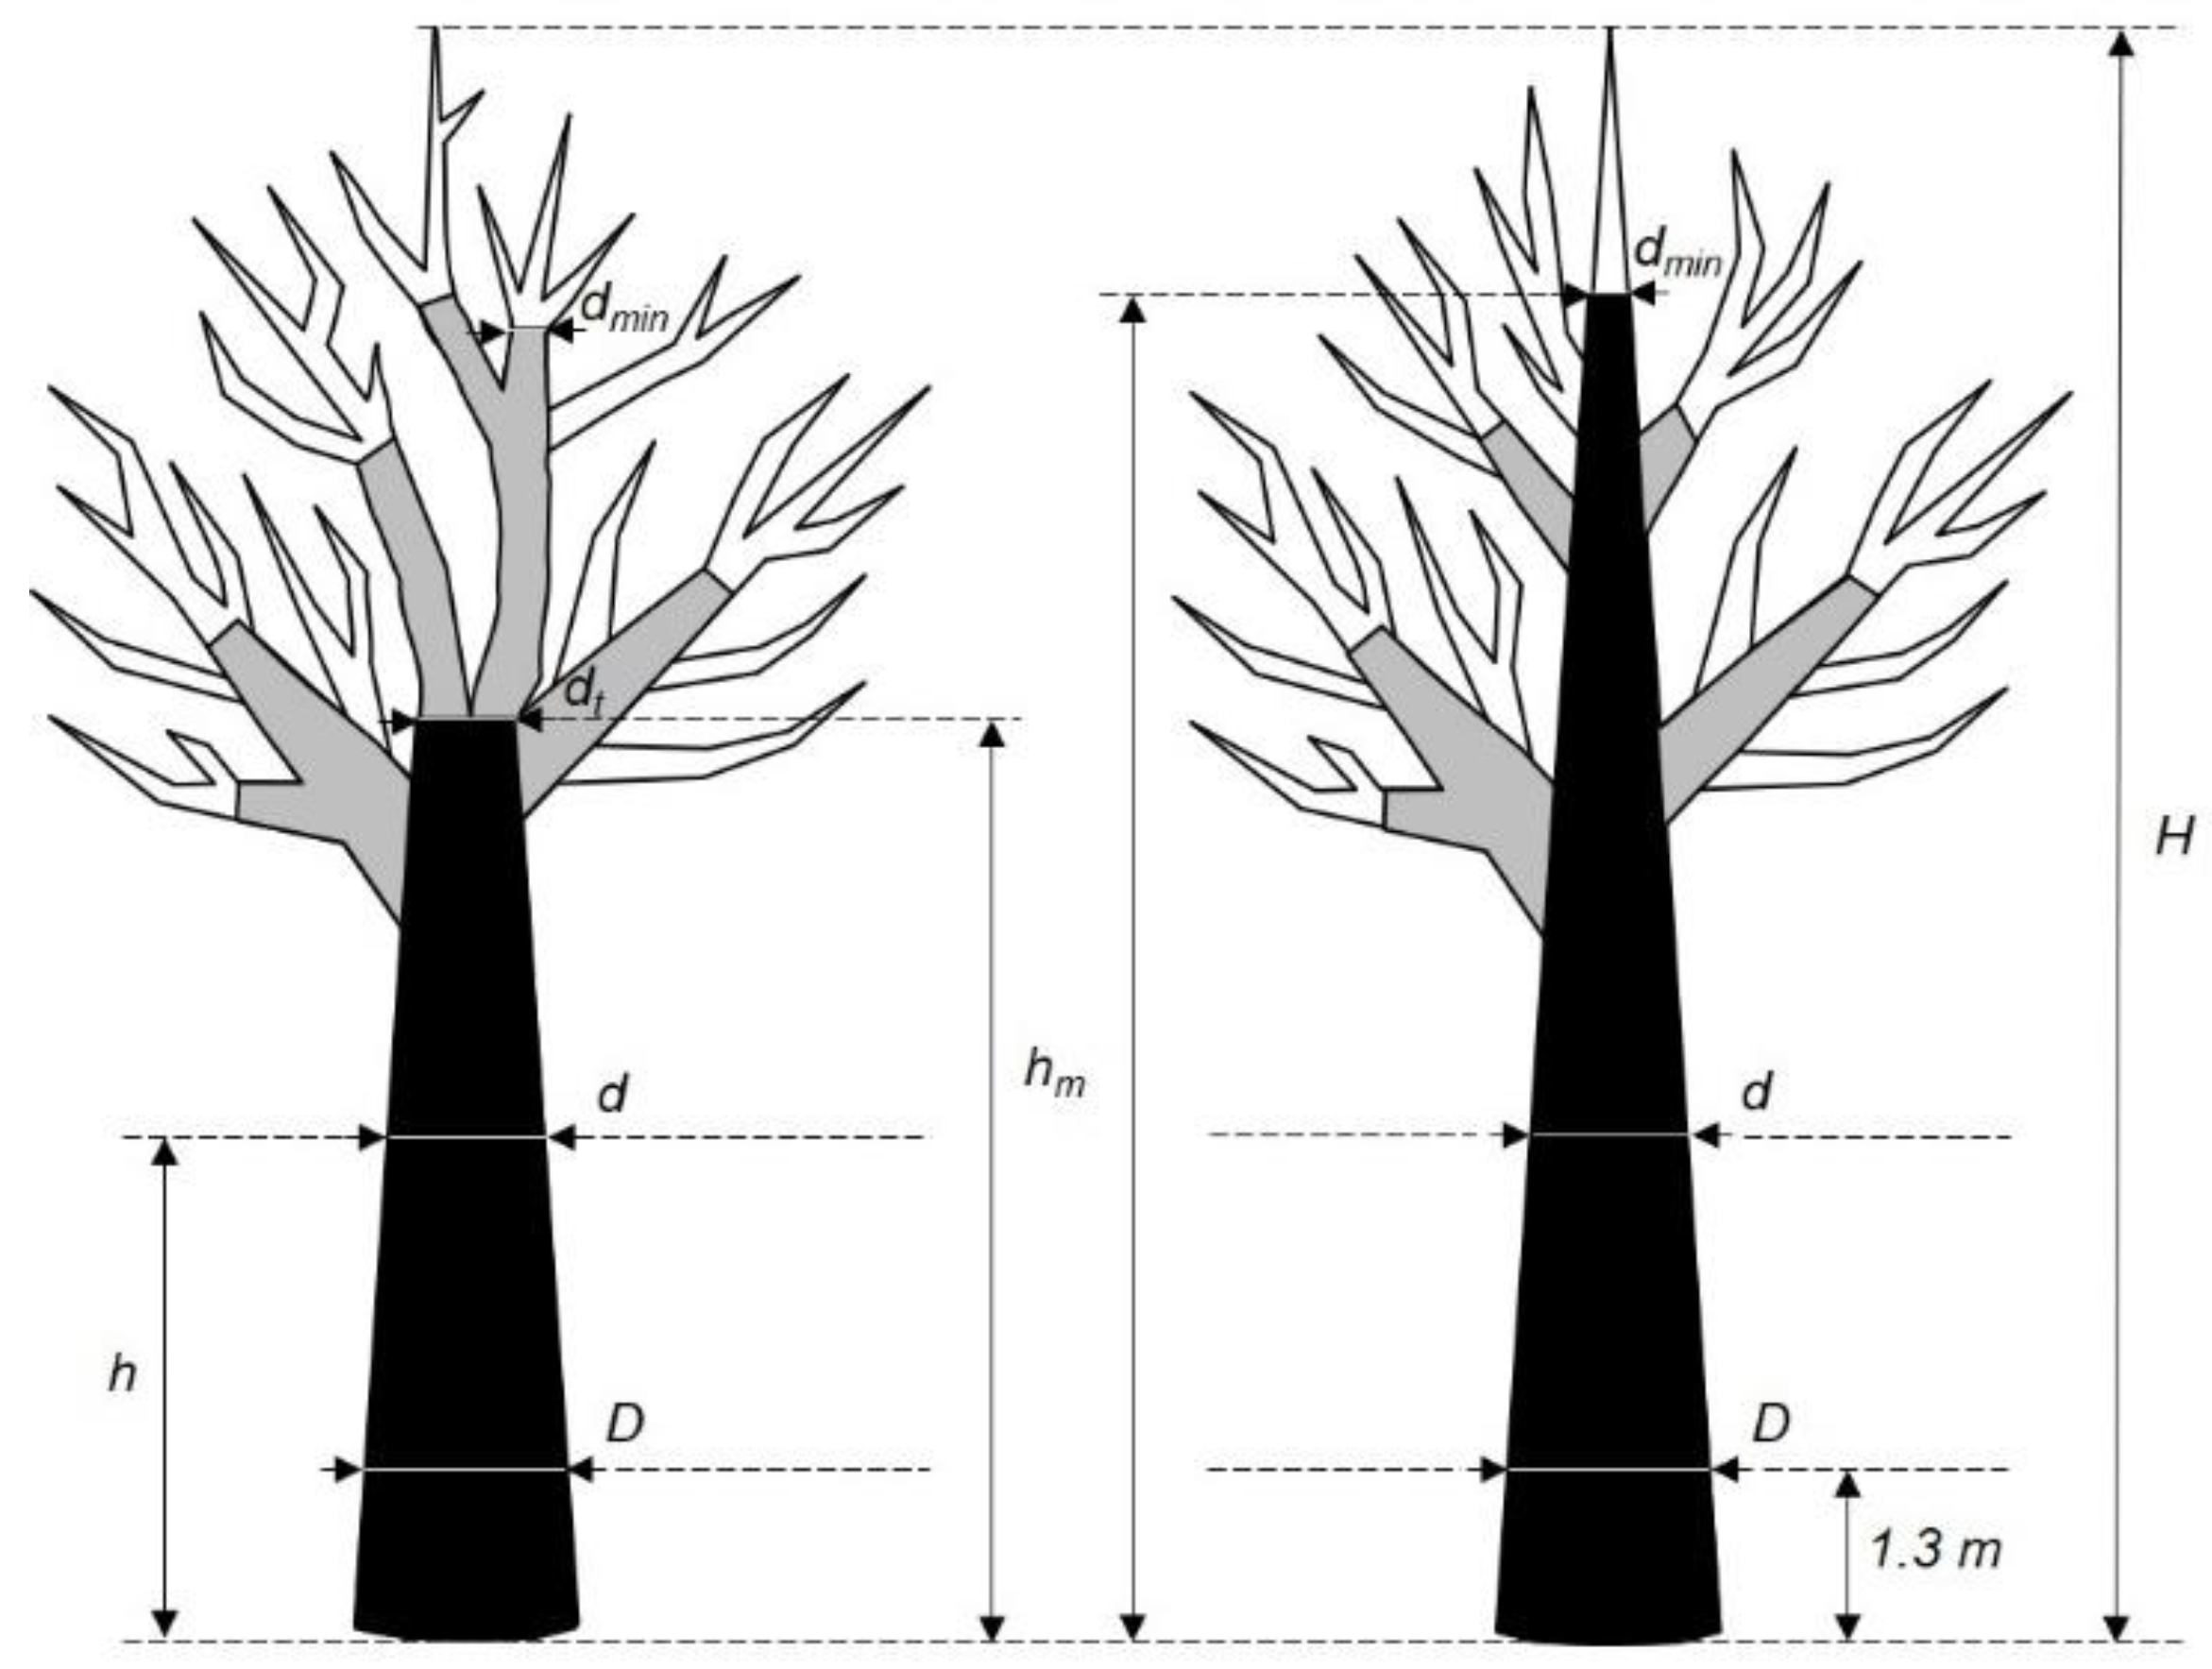
Figure 2.
Plot of relative diameter (d/D) against relative height (h/H) of final data used in the development of taper equation for Q. rubra in Navarra.
Figure 2.
Plot of relative diameter (d/D) against relative height (h/H) of final data used in the development of taper equation for Q. rubra in Navarra.
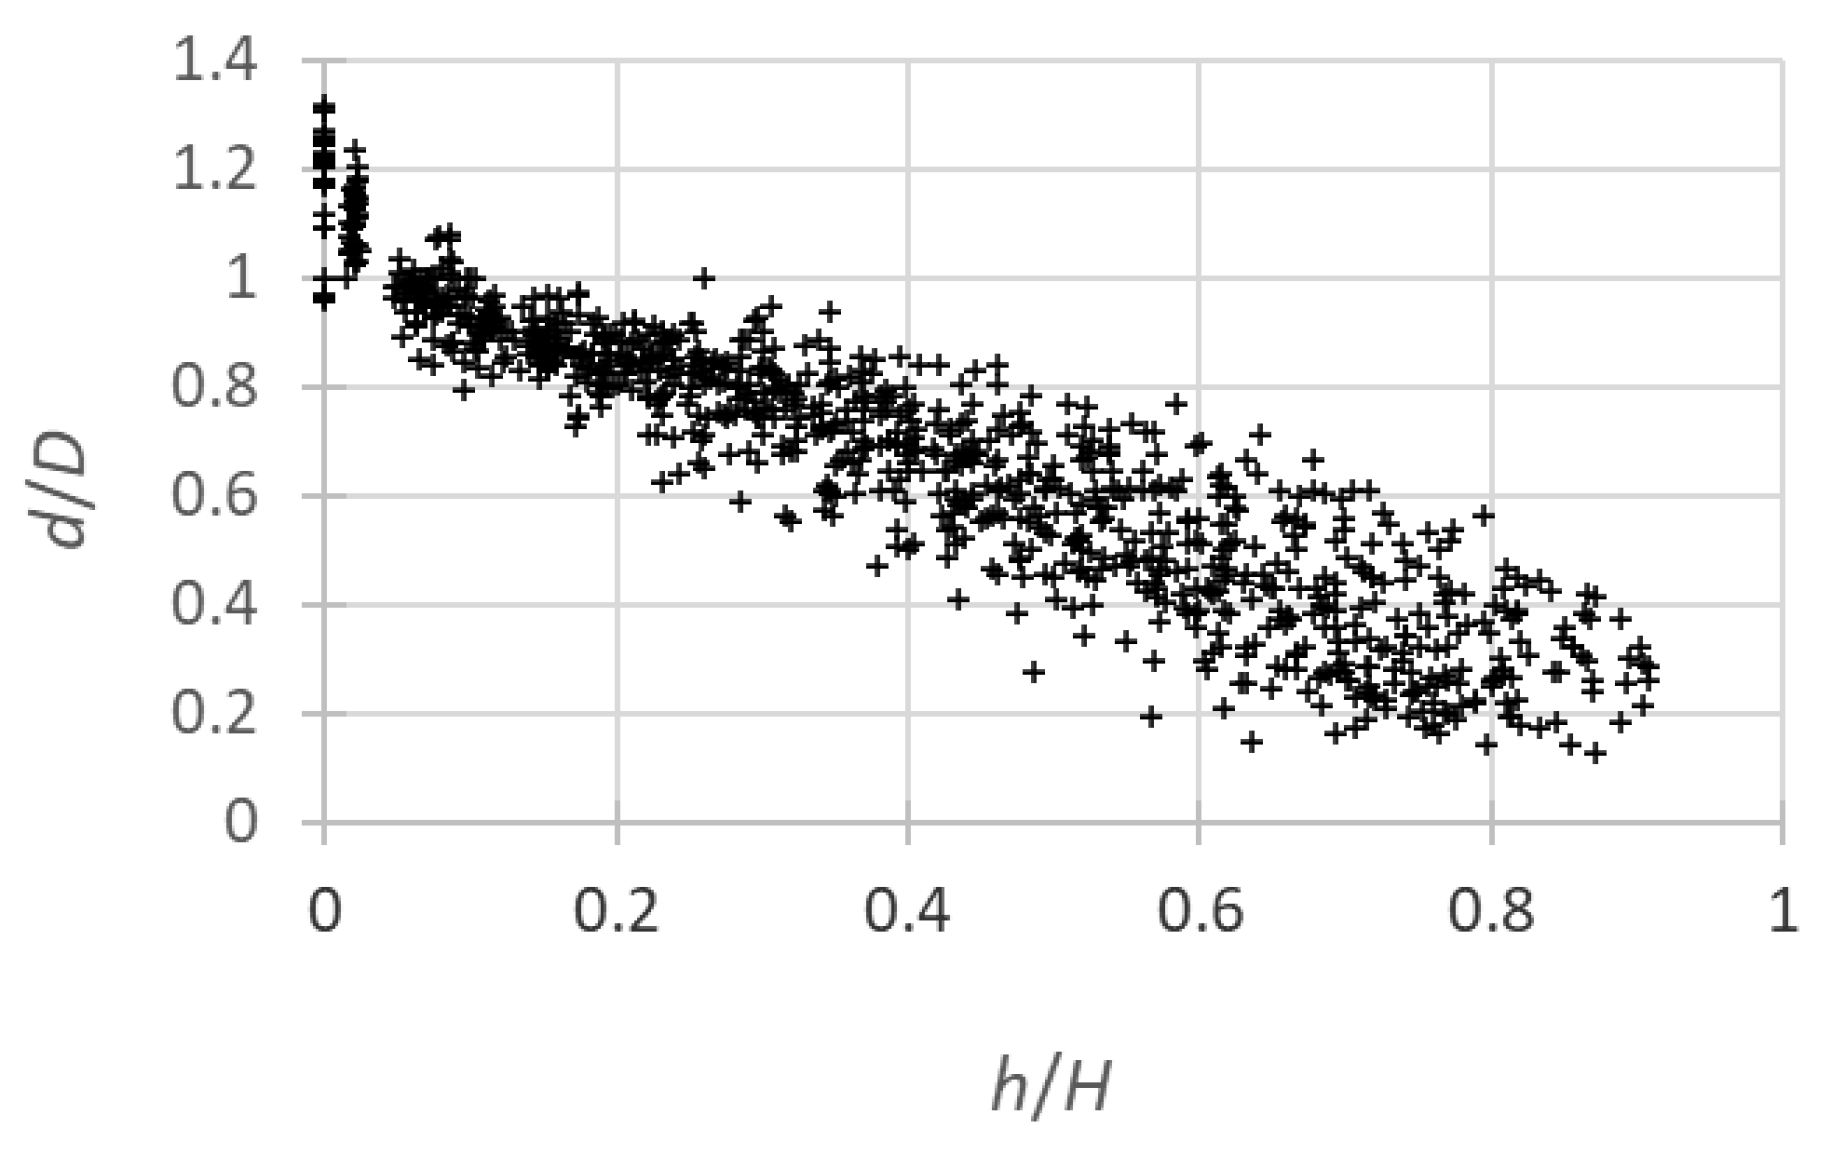
Figure 3.
Diameter residuals (cm) versus residuals with one lag (left column), two lags (middle column), and three lags (right column) for the model of Fang et al. (2000) without modelling the error term (first row) and using continuous autoregressive error structures of first order (CAR(1), second row) and second order (CAR(2), third row).
Figure 3.
Diameter residuals (cm) versus residuals with one lag (left column), two lags (middle column), and three lags (right column) for the model of Fang et al. (2000) without modelling the error term (first row) and using continuous autoregressive error structures of first order (CAR(1), second row) and second order (CAR(2), third row).
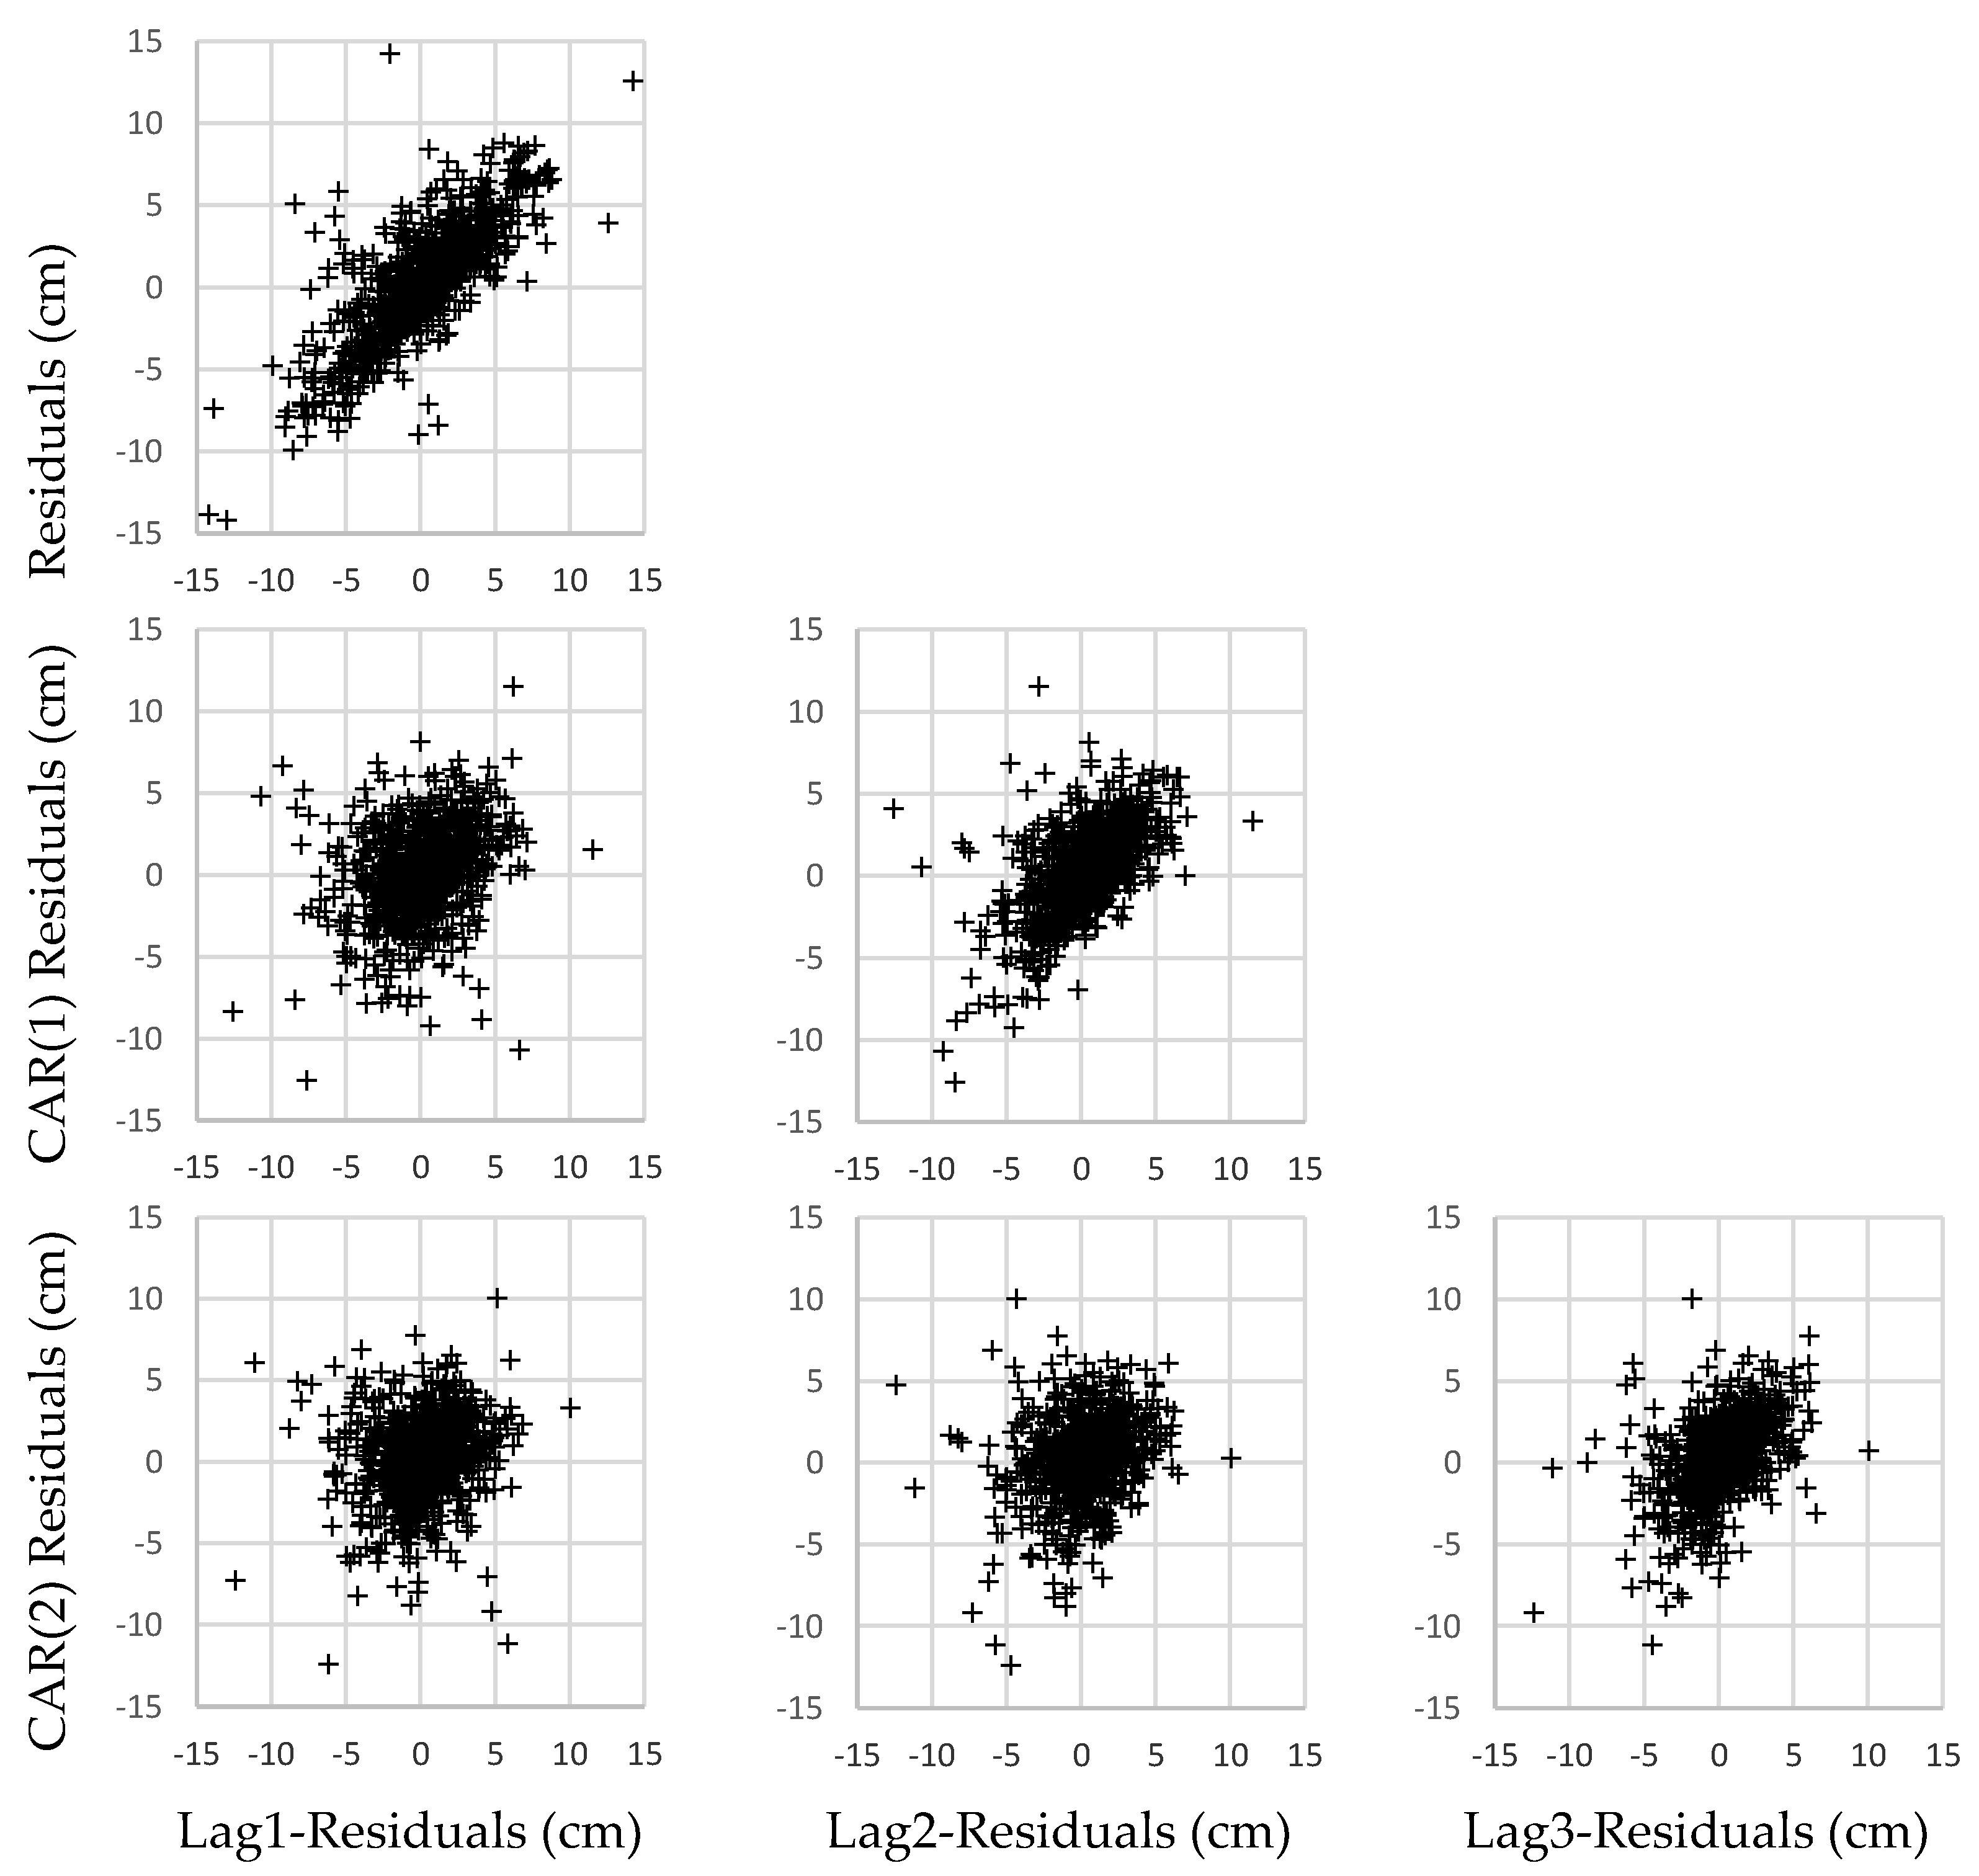
Figure 4.
Plots of residuals against predicted values (left) and observed against predicted values (right) for the model of Fang et al. (2000) for Q. rubra in Navarra.
Figure 4.
Plots of residuals against predicted values (left) and observed against predicted values (right) for the model of Fang et al. (2000) for Q. rubra in Navarra.
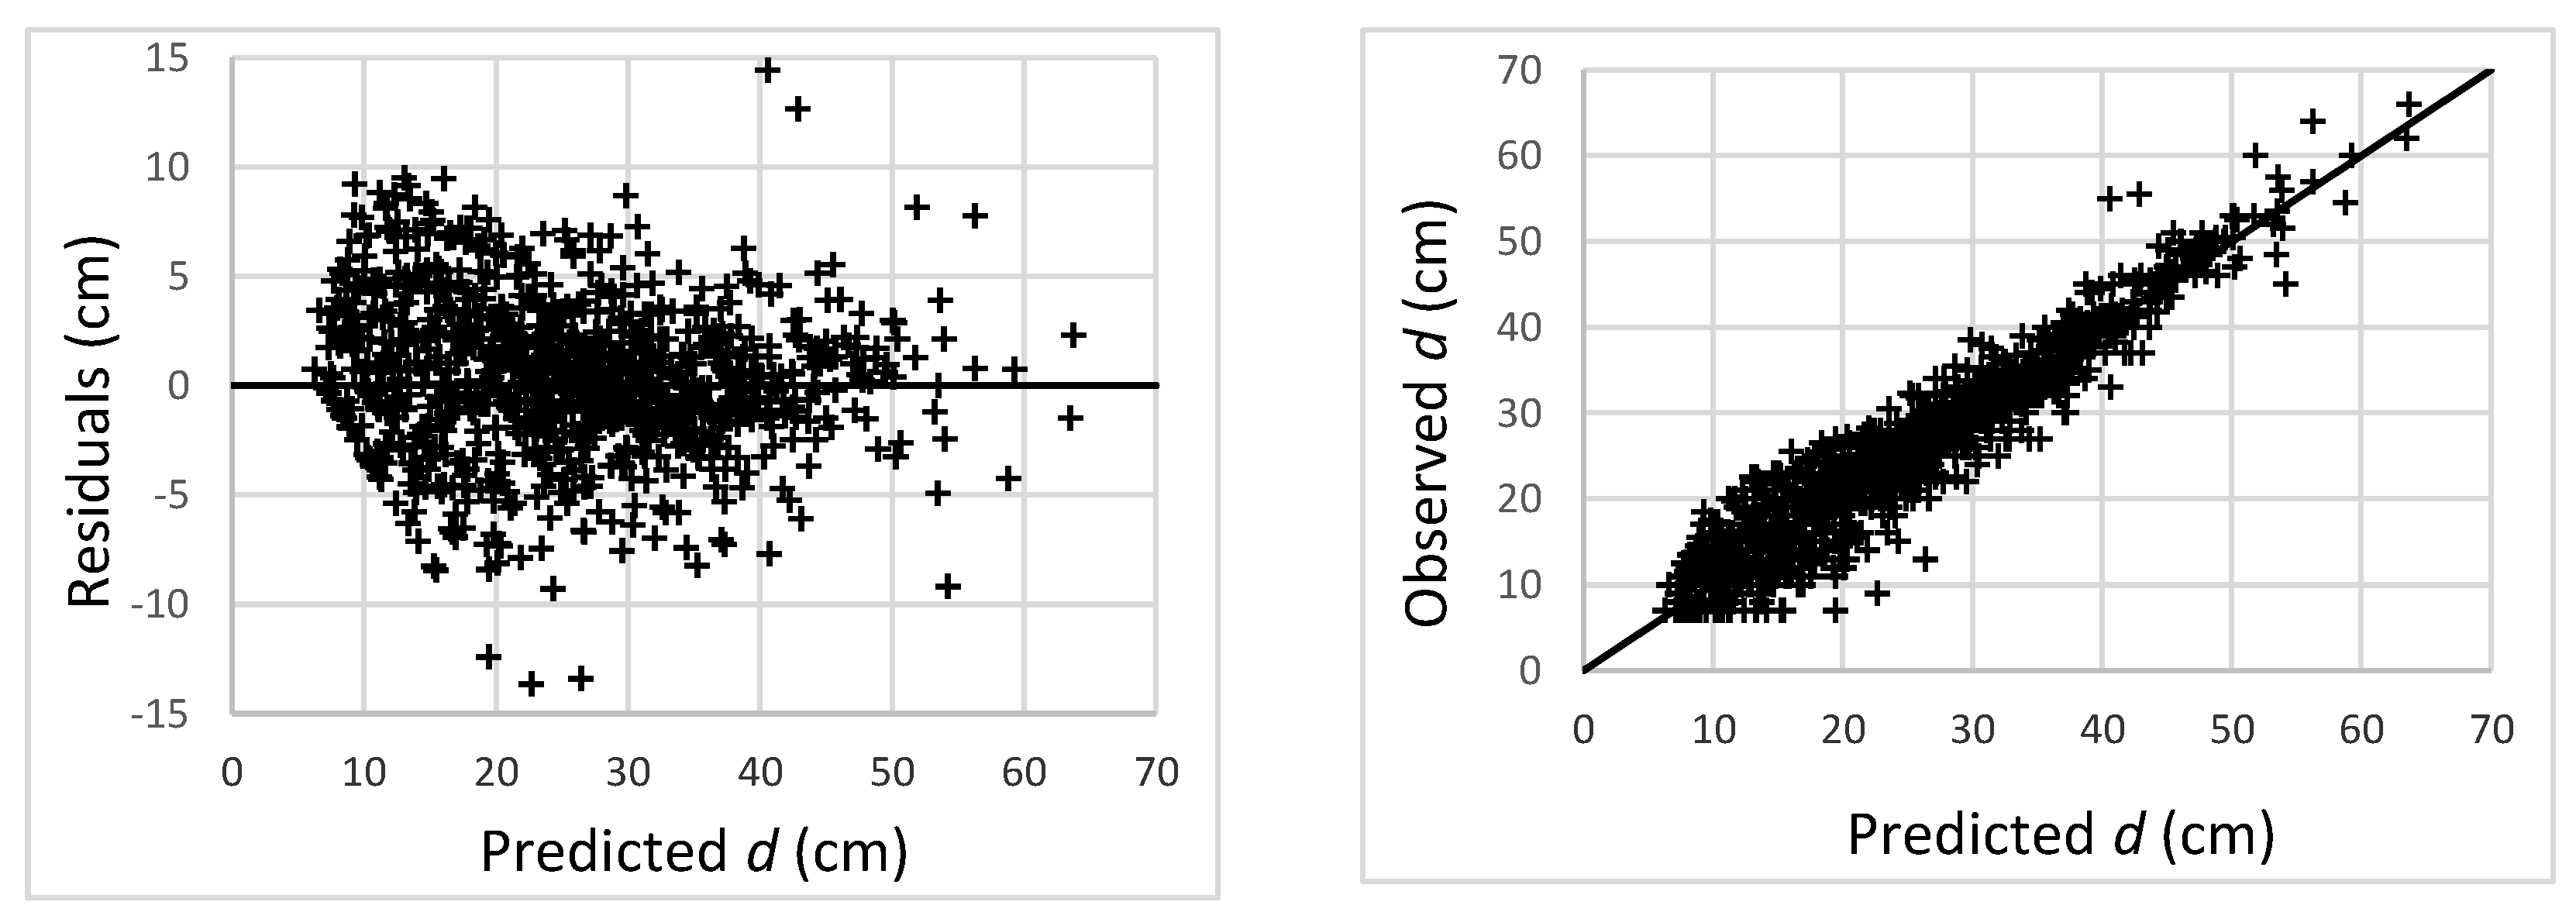
Figure 5.
Box-and-whisker plots of residuals against relative height class (first row) and diameter at breast height (D) class (second row), both for absolute values (left column) and relative values (right column), for the model of Fang et al. (2000) for Q. rubra in Navarra.
Figure 5.
Box-and-whisker plots of residuals against relative height class (first row) and diameter at breast height (D) class (second row), both for absolute values (left column) and relative values (right column), for the model of Fang et al. (2000) for Q. rubra in Navarra.
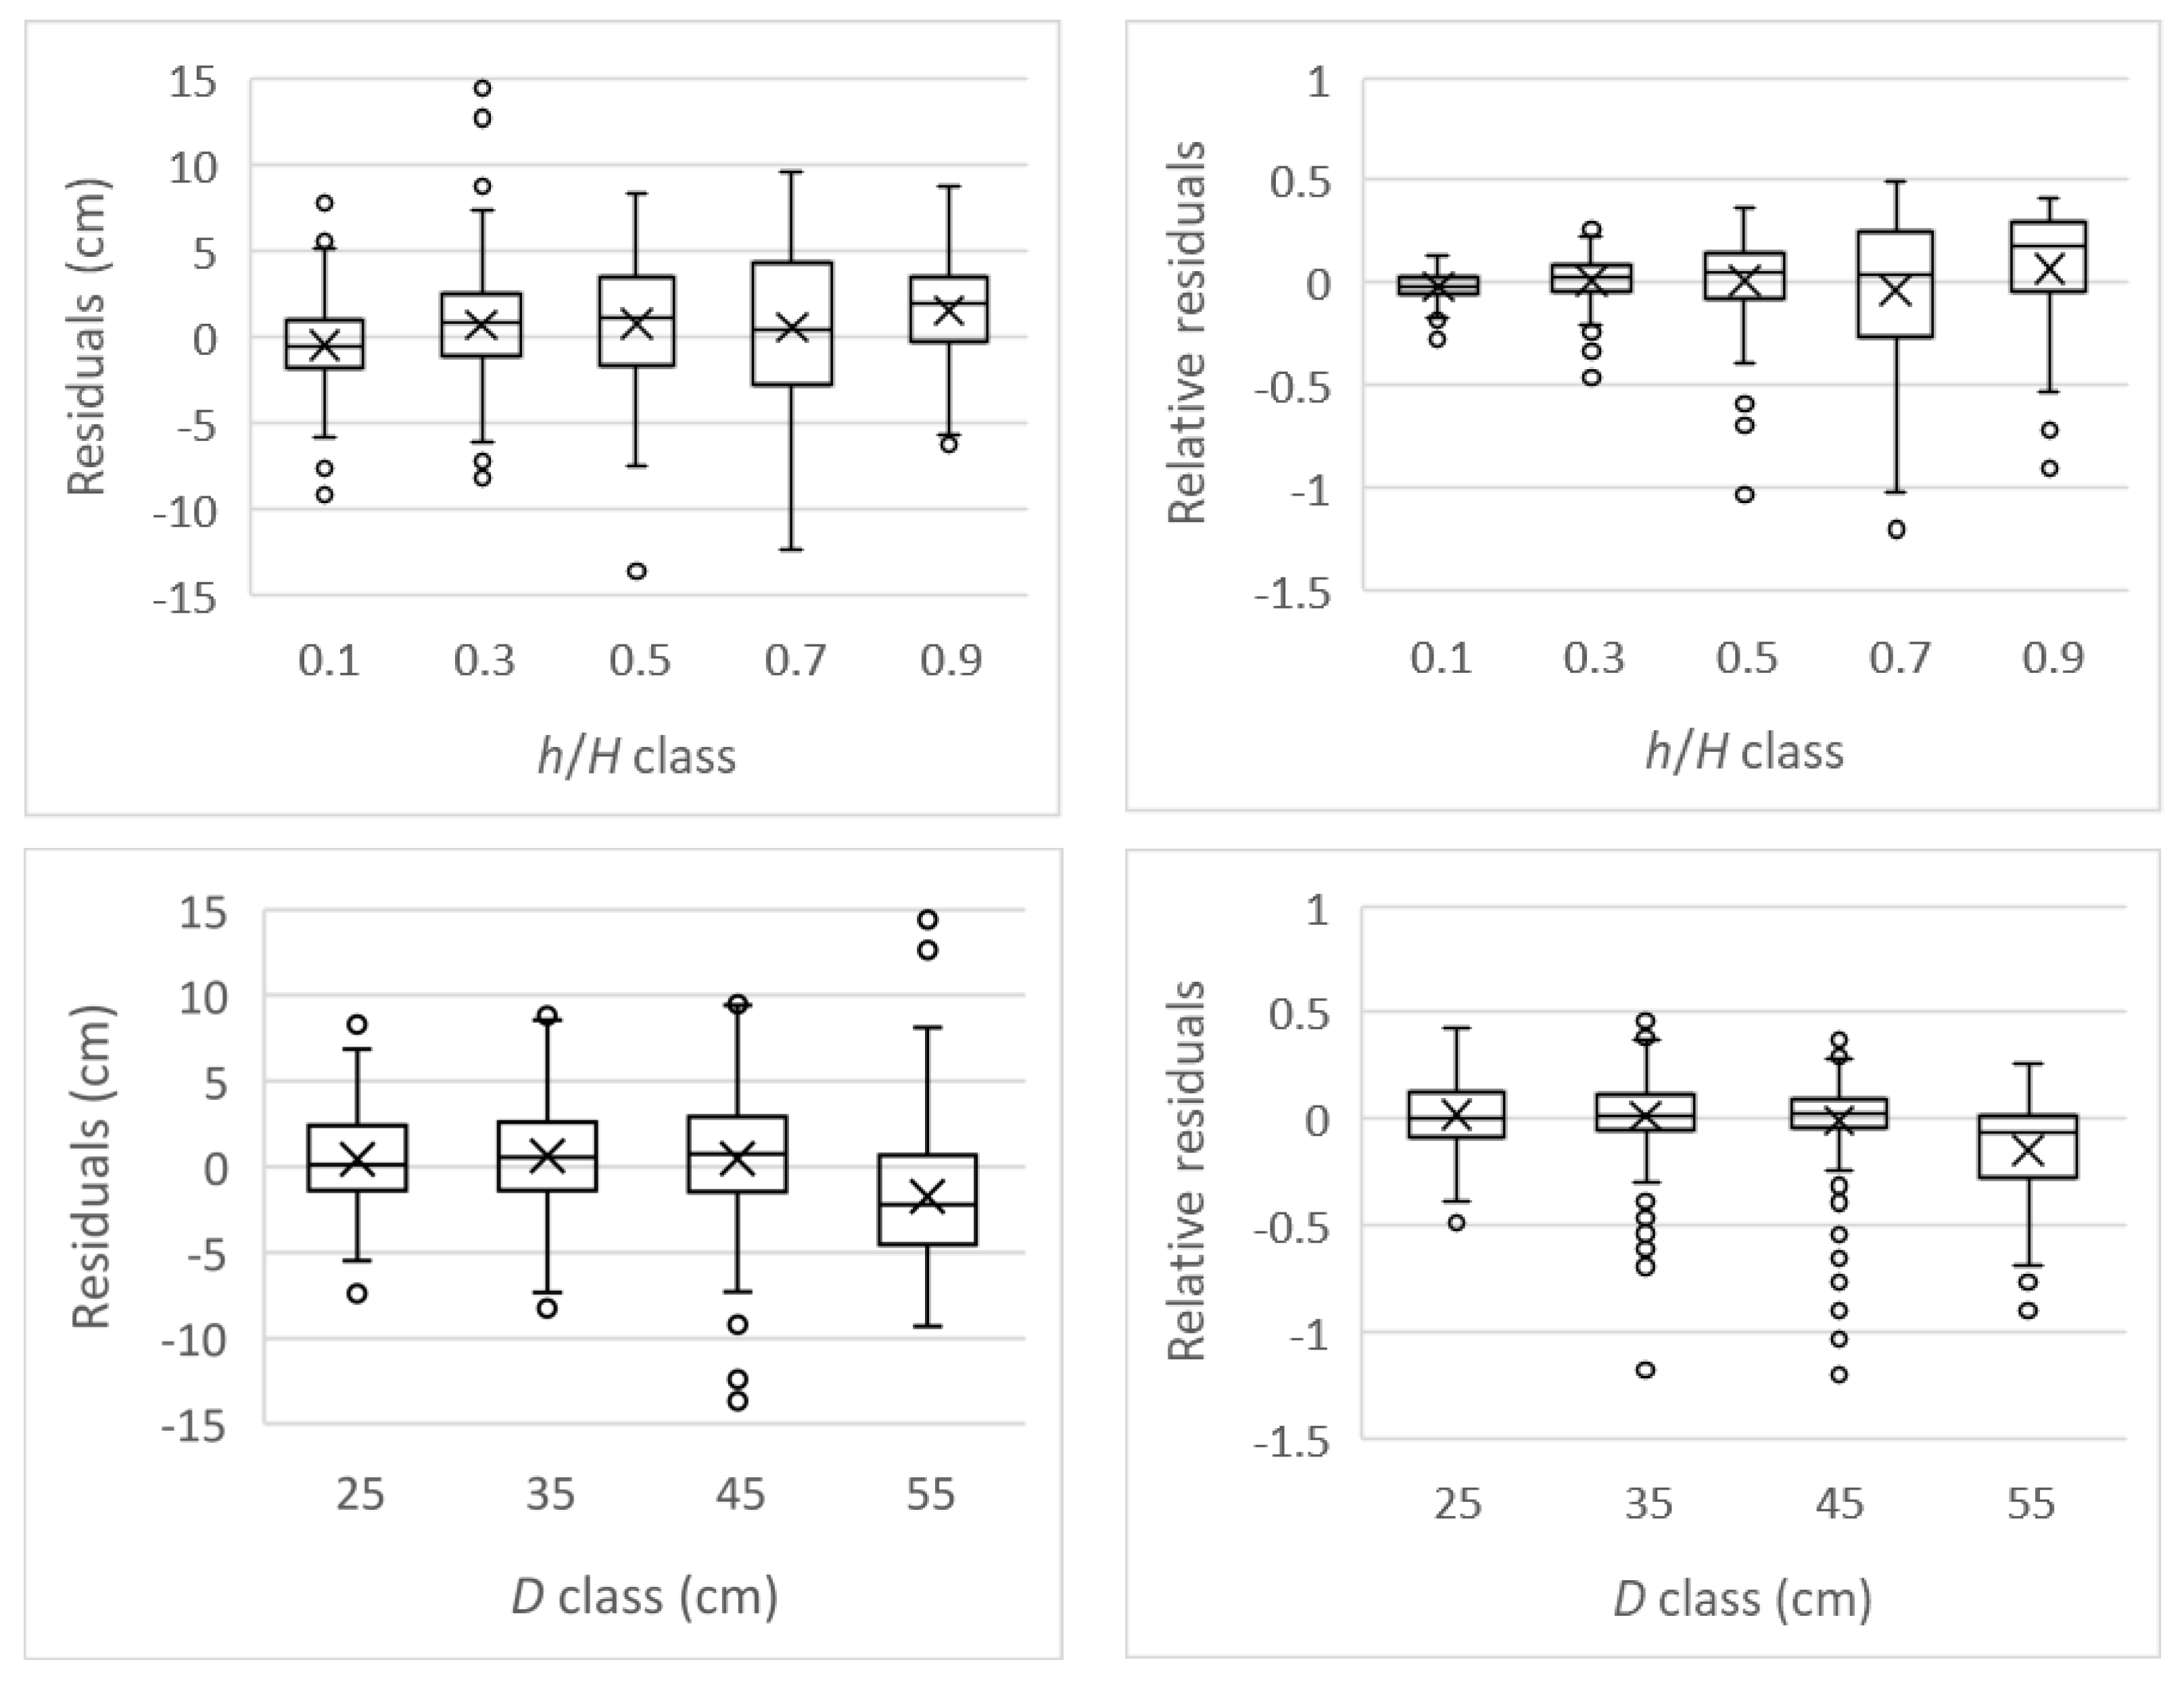
Figure 6.
Plots of residuals against predicted values (left) and observed against predicted values (right) for the merchantable whole-tree volume equation (Equation 8) fitted for Q. rubra in Navarra.
Figure 6.
Plots of residuals against predicted values (left) and observed against predicted values (right) for the merchantable whole-tree volume equation (Equation 8) fitted for Q. rubra in Navarra.
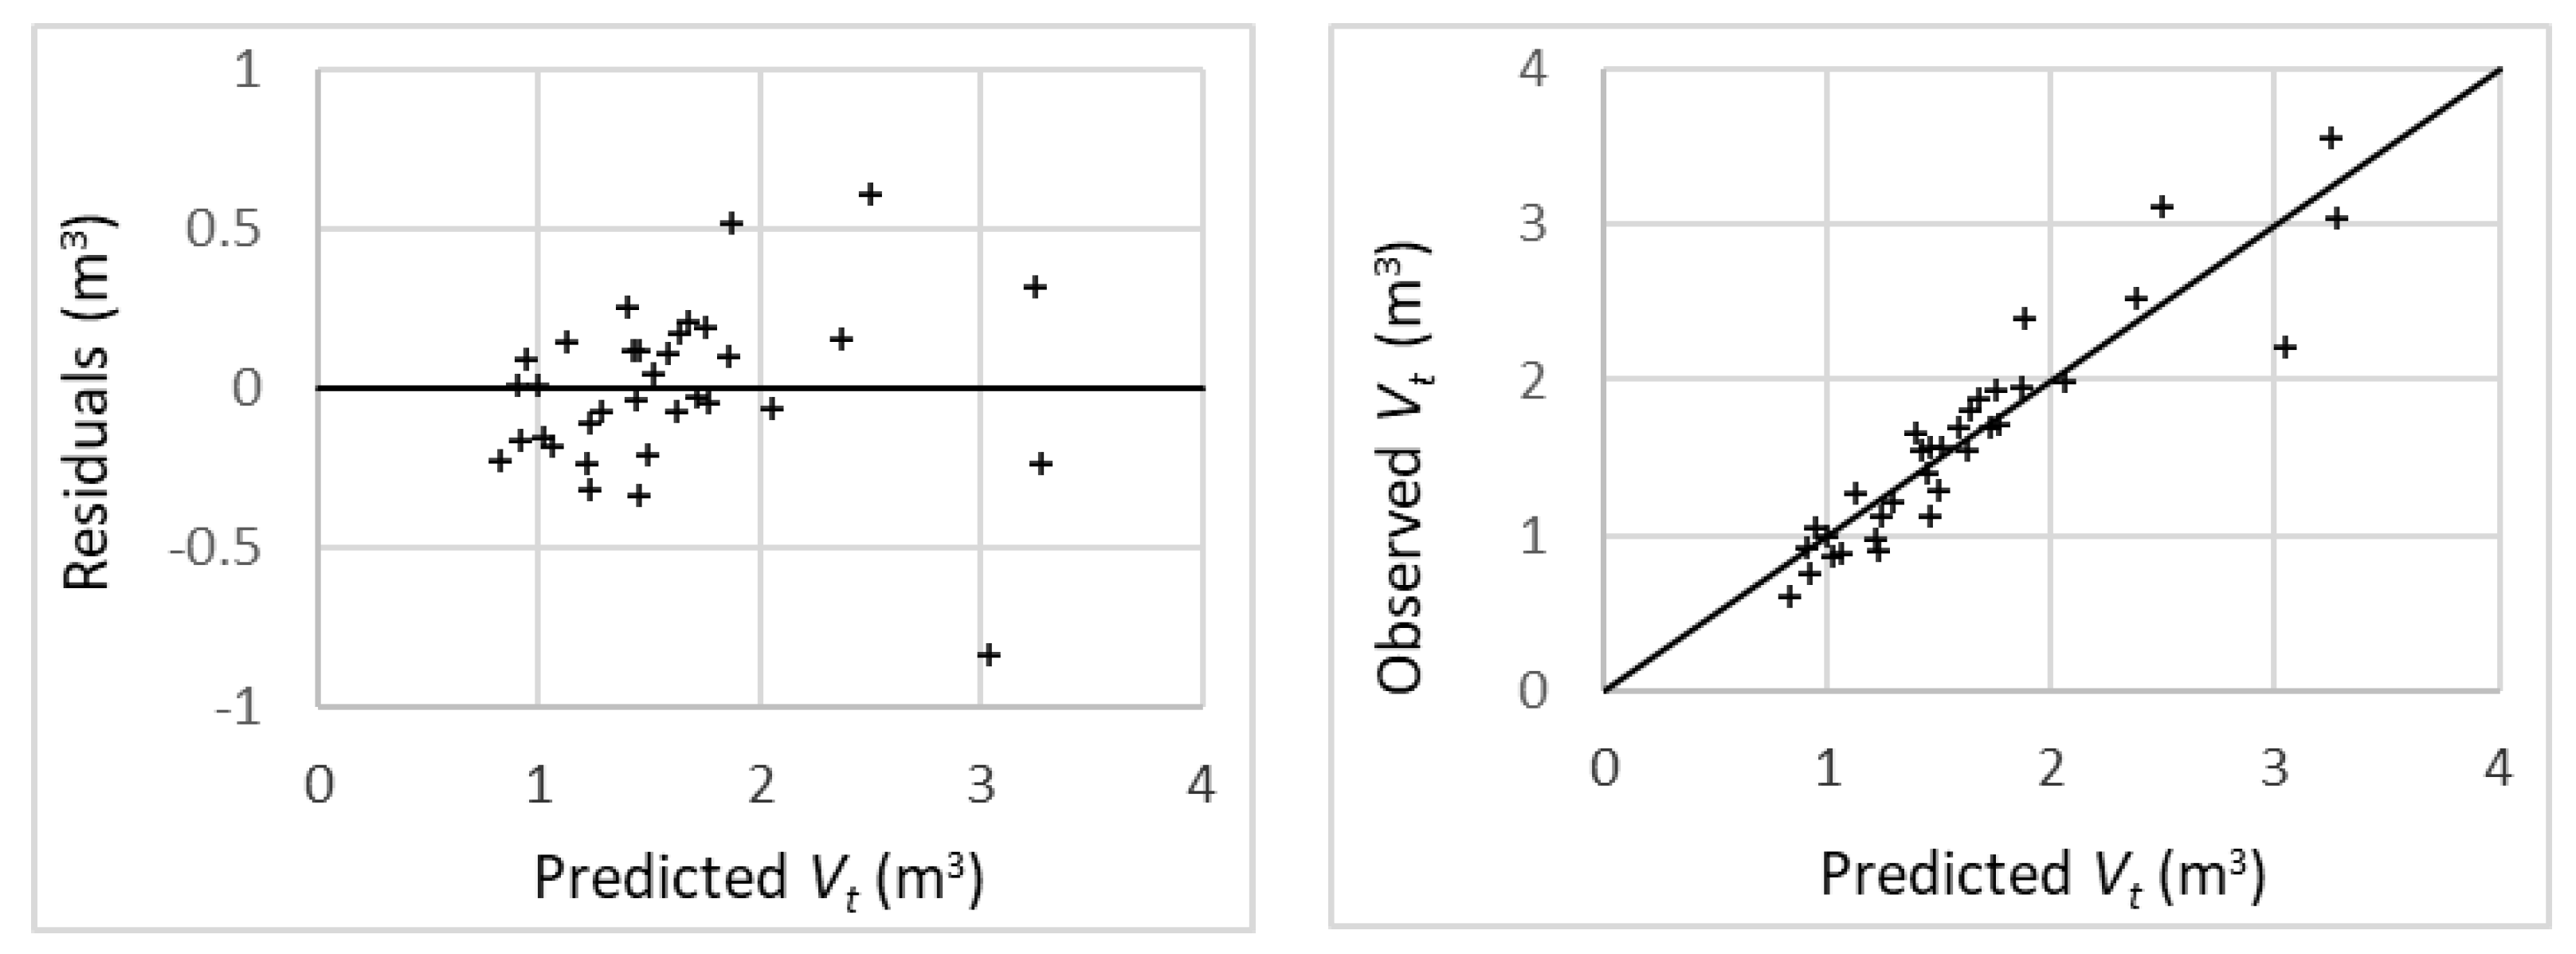

Table 1.
Nomenclature used in the study. See Figure 1 for clarification.
Table 1.
Nomenclature used in the study. See Figure 1 for clarification.
| Denotation | Description |
|---|---|
| D | diameter at breast height (cm), measured 1.3 m above the ground |
| H | total tree height (m) |
| hm | merchantable height (m) |
| d | diameter (cm) at a given height h |
| h | height (m) above ground to diameter d |
| dmin | minimum top diameter (cm) |
| dt | total stem top diameter (cm) |
| dwt | whole-tree top diameter (branches included) (cm) |
| Vt | merchantable whole-tree volume (branches included) (m3) |
| Vs | stem volume (m3) for excurrent form until H (dmin = 0cm) |
| vs | stem volume (m3) until h |
| Vb | merchantable branch volume (m3) |
Table 2.
Descriptive statistics of the sample of trees used for taper equation development.
| Variable | Mean | Minimum | Maximum | Std. dev. |
|---|---|---|---|---|
| Nº sections | 14.5 | 6.0 | 27.0 | 4.99 |
| D | 37.5 | 25.0 | 58.5 | 8.20 |
| H | 24.5 | 17.5 | 31.4 | 2.86 |
| dt | 11.0 | 7.0 | 34.0 | 6.29 |
D, diameter at breast height (cm); H, total tree height (m); dt, total stem top diameter (cm).
Table 3.
Descriptive statistics of the sample of trees used for merchantable whole-tree volume equation (Vt) development.
Table 3.
Descriptive statistics of the sample of trees used for merchantable whole-tree volume equation (Vt) development.
| Variable | Mean | Minimum | Maximum | Std. dev. |
|---|---|---|---|---|
| Vt | 1.61 | 0.60 | 3.57 | 0.70 |
| D | 40.2 | 27.0 | 58.5 | 7.71 |
| H | 24.8 | 20.2 | 31.4 | 3.01 |
| dwt | 8.5 | 7.0 | 10.5 | 0.76 |
Vt, merchantable whole-tree volume (m3), including stem volume and merchantable branch volume; D, diameter at breast height (cm); H, total tree height (m); dwt, whole-tree top diameter (cm), branches are also included.
Table 4.
Parameter estimates and approximate significance tests for the model of Fang et al. (2000) (Equation (5)) for Q. rubra in Navarra.
Table 4.
Parameter estimates and approximate significance tests for the model of Fang et al. (2000) (Equation (5)) for Q. rubra in Navarra.
| Parameter | Estimate | Approx. std. error |
tvalue | Approx. p-value |
|---|---|---|---|---|
| p1 | 0.06225 | 0.00609 | 10.22 | < 0.0001 |
| p2 | 0.7590 | 0.0166 | 45.68 | < 0.0001 |
| b1 | 0.00001172 | 8.475 x10⁻⁷ | 13.83 | < 0.0001 |
| b2 | 0.00002820 | 4.258 x10⁻⁷ | 66.24 | < 0.0001 |
| b3 | 0.00005116 | 8.637 x10⁻⁶ | 5.92 | < 0.0001 |
| a0 | 0.00007717 | 0.000024 | 3.27 | 0.0011 |
| a1 | 1.815 | 0.0508 | 35.77 | < 0.0001 |
| a2 | 0.9259 | 0.0934 | 9.91 | < 0.0001 |
| ρ1 | 0.7435 | 0.0251 | 29.60 | < 0.0001 |
| ρ2 | 0.7357 | 0.0205 | 35.97 | < 0.0001 |
Table 5.
Parameter estimates and approximate significance tests for Equation (8), which estimates merchantable whole-tree volume (Vt), including stem and merchantable branches (dmin = 7cm) for Q. rubra in Navarra.
Table 5.
Parameter estimates and approximate significance tests for Equation (8), which estimates merchantable whole-tree volume (Vt), including stem and merchantable branches (dmin = 7cm) for Q. rubra in Navarra.
| Parameter | Estimate | Approx. std. error |
tvalue | Approx. p-value |
|---|---|---|---|---|
| t0 | 0.1520 | 0.0355 | 4.29 | 0.00016 |
| t1 | 0.04258 | 0.00352 | 12.11 | < 0.0001 |
| t2 | 0.02363 | 0.00892 | 2.65 | 0.0126 |
Disclaimer/Publisher’s Note: The statements, opinions and data contained in all publications are solely those of the individual author(s) and contributor(s) and not of MDPI and/or the editor(s). MDPI and/or the editor(s) disclaim responsibility for any injury to people or property resulting from any ideas, methods, instructions or products referred to in the content. |
© 2024 by the authors. Licensee MDPI, Basel, Switzerland. This article is an open access article distributed under the terms and conditions of the Creative Commons Attribution (CC BY) license (http://creativecommons.org/licenses/by/4.0/).
Copyright: This open access article is published under a Creative Commons CC BY 4.0 license, which permit the free download, distribution, and reuse, provided that the author and preprint are cited in any reuse.


