Submitted:
15 August 2024
Posted:
21 August 2024
You are already at the latest version
Abstract
Heart failure is a major global health concern, especially in Ethiopia. Numerous studies have analyzed heart failure data to inform decision-making, but these often struggle with limitations to accurately capture death dynamics and account for within-cluster dependence and heterogeneity.
Addressing these limitations, this study is then to incorporate the dependence and to analyze heart
failure data to estimate survival time and identify risk factors affecting patient survival. The data, obtained from 497 patients at Jimma University Medical Center in Ethiopia, were collected between July 2015 and January 2019. Residence was considered as the clustering factor in the analysis. We employed the Bayesian accelerated failure time (AFT), and Bayesian AFT shared gamma frailty models, comparing their performance using the Deviance Information Criterion (DIC) and Watanabe-Akaike Information Criterion (WAIC). The Bayesian log-normal AFT shared gamma frailty model had the lowest DIC andWAIC, with well capturing cluster dependency that attributed to unobserved heterogeneity between patient residences. Unlike other methods that use Markov-Chain Monte-Carlo (MCMC), we applied the Integrated Nested Laplace Approximation (INLA) to reduce computational load. The study found that 39.44% of patients died, while 60.56% were censored, with a median survival time of 34 months. Another interesting finding of this study is by adding frailty into the Bayesian AFT models has boosted the performance in fitting the heart failure dataset. Significant factors reducing survival time included age, chronic kidney disease, heart failure history, diabetes, heart failure etiology, hypertension, anemia, smoking, and heart failure stage. The Bayesian model also showed lower standard errors for parameters compared to other methods, highlighting the importance of frailty models in accurately assessing survival time in heart failure patients.
Keywords:
time-to-death
; log-normal
; clustering factor
; Bayesian AFT shared frailty
; INLA
1. Introduction
Heart failure (HF) is becoming one of the major health problem across the globe [1]. It is a leading cause of death and poses a rapidly growing public health challenge, currently affecting over 64 million individuals [2,3,4]. With the prevalence of HF increasing with age, the number of patients is rising swiftly in both developed and developing countries with aging populations [5,6]. Additionally, HF is a major contributor to cardiovascular diseases and imposes a significant economic burden on individuals and healthcare systems worldwide [3,7]. A prospective cohort study of 5,823 patients revealed an overall mortality rate of 16.5%, with the highest rates in Africa (34%) and India (23%), intermediate rates in Southeast Asia (15%), and the lowest rates in China (7%), South America (9%), and the Middle East (9%) [8].
Heart failure (HF) poses a significant public health challenge, particularly in developing countries where mortality rates are alarmingly high [9,10,11]. In sub-Saharan Africa (SSA), including Ethiopia, HF is increasingly a leading cause of death, exacerbated by inadequate resources and weak healthcare systems [9,12,13]. Unlike in the US and Europe, HF in SSA often affects younger individuals due to preventable conditions, such as hypertension (43.9%), rheumatic heart disease (15%), and dilated cardiomyopathy (19.5%) [14,15]. In Ethiopia, HF-related hospital deaths account for 24.4% of total fatalities [16,17]. Despite this, there is a notable gap in research regarding the survival rates and duration of HF patients [16,17,18,19]. While advanced survival models like Cox regression [20,21,22] and Bayesian approaches have been employed to analyze HF survival distributions [23], these methods often fall short in addressing heterogeneity and within-cluster dependencies.
Various survival methods, including Cox regression and Accelerated Failure Time (AFT) models such as exponential, Weibull, log-normal, and log-logistic, are used to estimate median survival times and identify prognostic factors [23,24]. While parametric AFT models can offer a more accurate representation of survival data compared to Cox-PH models when the hazard shape is known [25,26], they often lack flexibility in capturing unobserved heterogeneity and associations. Most studies fail to incorporate random effects or frailty terms into these models, which limits their ability to account for cluster-level variability. Frailty models address this limitation by incorporating random effects to handle unobserved heterogeneity and are an extension of the Cox-PH model [23,27,28]. Shared frailty models, where frailties are common within clusters, are particularly suitable for clustered survival time data, offering a more nuanced understanding of survival dynamics within groups [26,29,30,31].
Traditional survival methods, such as Cox regression and parametric AFT models, often struggle with heterogeneity and within-cluster dependence, leading to potential inaccuracies. These methods may also suffer from computational inefficiencies and convergence issues, particularly with Markov-Chain Monte-Carlo (MCMC) approaches [32,33,34].
In contrast, Bayesian analysis with parametric AFT models [35,36], enhanced by the Integrated Nested Laplace Approximations (INLA), overcomes these limitations. The Bayesian approach effectively integrates prior knowledge (prior probability) with data (likelihood), improving model accuracy and handling unobserved heterogeneity [37]. INLA offers faster and more accurate computation than MCMC, making it highly efficient for complex survival data analysis [32]. Thus, Bayesian AFT models with INLA provide a more robust and efficient framework for analyzing survival times [35,38,39], addressing the drawbacks of traditional methods.
In this study, we employed Bayesian Accelerated Failure Time (AFT) shared gamma frailty models using the Integrated Nested Laplace Approximations (INLA) method to estimate the survival time of HF patients. Unlike to the classical survival approaches, our method enjoys the advantage of INLA especially in largely reducing the issue of time complexity. We chose this approach due to the increasing prevalence of HF in hospital settings and the gaps identified in various studies. The proposed method better estimates the parameters and captures the heterogeneity and dependence within clusters, ensuring a more accurate and comprehensive analysis and leading to more effective interventions.
The results from this study can significantly aid medical professionals in identifying high-risk patients and adjusting their treatment plans. Analyzing the survival time of HF patients is crucial for addressing public health issues by identifying factors associated with the survival time in time-to-death based analysis. Additionally, the findings can raise awareness about the factors that contribute to HF patient deaths.
This study can also provide valuable scientific information to the Ministry of Health in Ethiopia, helping policymakers to educate the public about factors that increase the probability of death due to HF. Heart failure is preventable and curable if screened and treated in its early stages with appropriate treatment. By enhancing awareness of these aspects, the study ultimately contributes to reducing mortality rates and improving overall public health outcomes.
Overall, the major contribution of this study are as follows:
1) New Data: This study applies Bayesian AFT shared frailty models using newly compiled data that incorporate recent developments in survival methods for estimating survival time and identifying predictors in heart failure patients. This new data can be public available to supplement the development of other methods and this study would contribute the quality of survival data analysis and improves parameter estimation.
2) New Frailty Model: Unlike the classical survival methods, the proposed frailty model captures unobserved heterogeneity within clusters and further leverages its advantages.
3) Novel INLA Implementation: Addressing the highly complexity of computation, this study makes use of the advanced INLA implementation to accurately estimate the parameters of the survival models.
4) Improved Parameter Estimation: Integrating Bayesian methods into Accelerated Failure Time (AFT) models improves parameter estimation during the heart failure patient data by incorporating prior knowledge and providing a full probability distribution, further enhancing the accuracy and reliability of results. It also offers flexibility in handling random effects and frailty terms, performs better with small samples, and provides a more comprehensive analysis of complex survival data. With this advantage, the proposed method enjoys in handling the issue of heterogeneity and survival analysis based on the heart failure patients.
5) Model Flexibility: The log-normal Bayesian AFT shared gamma frailty model excels in flexibly modeling the new survival data with both individual and group-level random effects, effectively handling unobserved heterogeneity and providing robust estimates. Our results reveal that it outperforms state-of-the-art methods.
2. Data and Methods
2.1. Heart Failure Dataset and Study Design
The retrospective study, which was conducted at Jimma University Medical Center (JUMC), Jimma, Ethiopia, focused on collecting data from heart failure (HF) patients over a period of 3 years and 6 months, specifically from July 1, 2015, to January 1, 2019. The primary objective was to gather comprehensive information on these patients by reviewing records from the registration logbook and patient registration cards. Any incomplete data encountered during this process was verified against patient files and excluded if inadequate for analysis. The study aimed to include all HF patients who had received treatment at least once during the study period. Patients were considered eligible if they had complete information on the study variables in the registration book or patient card. Those with insufficient data or who did not commence treatment at the hospital were excluded, as were patients who died due to accidents. Ethical permission was obtained from JUMC prior to data collection. The data extraction was carried out by a team that included a statistician, public health officer, and trained enumerator using a predefined checklist (data extraction form). This rigorous approach ensured that the data collected were reliable and suitable for subsequent analysis. Jimma University Medical Center is a pioneering and great hospital, providing essential services to many patients. This study at JUMC aimed to contribute valuable insights into the management and outcomes of HF patients within the institution during the specified time-frame.
2.2. Study Variables and Definitions
Outcome variable
The response variable was time-to-death of HF patients from the time of diagnosis (measured in months). In this study, we assume that the data follow the right-censored, where patients who die as a result of HF are said to have experienced the event and all others (death not related to HF, dropouts, stopped, and lost to follow-up) are said to be censored (have not experienced the event of interest). The status variable was coded as 0 for censored and 1 for death. Let be a binary indicator variable such that:
Predictor variables
The covariates that are considered in this study were as follows: sex, age, smoking cigarettes, diabetes mellitus, hypertension, place of residence, alcohol consumption, history of HF, anemia, treatments taken, etiology of HF, chronic kidney disease, and stages of HF.
The findings of the study will be intended to guide future healthcare interventions and to be well prepared for reduce the influence of heart failure patients.
2.3. Survival Data Analysis
The description of survival data analysis employs non-parametric methods to compare the survival functions of two or more groups. In non-parametric survival analysis, the data are summarized via estimates of the survival function and hazard function. And Kaplan-Meier plots are employed for this purpose [40]. When comparing groups, starting with a graphical display of the data for each group is helpful. A frequency distribution table was employed to summarize the data obtained from the patient registration book based on the study variables at Jimma University Medical Center.
Survival data are censored in the sense that they did not provide complete information since subjects of the study may not have experienced the event of interest [41,67]. Survival analysis is well suited for HF datasets which are very common in medical research since studies in medical areas have a special feature that follow-up studies could start at a certain observation time and could end before all experimental units had experienced an event [26]. The Cox PH model is widely used in survival regression analysis [42]. However, Wei [43] and Cox [44] have highlighted that the AFT model can provide a more realistic interpretation and alternative to the Cox PH model [43,45]. The AFT model is an alternative to the Cox PH and parametric models when the assumptions of the Cox PH model do not hold [46]. Finally, the key differences between the Cox PH and the AFT models are baseline hazard function and ways of estimating coefficients [47].
2.4. Shared Frailty AFT Models
The term `frailty’ was first introduced by [48] for univariate data and later extended to multivariate data by [48,49]. A natural extension of the univariate frailty model would be a multivariate frailty model where allows the individuals in the same cluster to share the same frailty. To account for unobserved heterogeneity, Hougaard [50] introduced the frailty term as an extension of the Cox PH model [50]. Frailty models extend traditional survival models by incorporating random effects (frailties) that act multiplicatively on the baseline hazard function [26,29,51]. The concept of frailty provides a convenient way to introduce random effects in the survival model to account for association and unobserved heterogeneity (frailty) [52]. A shared frailty model is a survival model that includes a random effect term, where the frailties are common or shared among individuals within specific groups [26,53,54]. Shared frailty model is a conditional independence model in which frailty is common to all subjects in a cluster [29,31]. AFT frailty models extend the standard AFT model by incorporating random effects [55,56].
Suppose that there are n clusters and that the cluster has individuals and is associated with an unobserved frailty . The log-linear representation of the shared frailty AFT model for the random variable, , that is associated with the survival time of the individual in the group or cluster (patient residence). Frailties or random effects are assumed to be identically and independently distributed random variables with a common density function , where is a parameter of the frailty distribution. Shared frailty models enable individuals within the same group to share a common frailty [31]. This study focused on HF patients in different parts of Ethiopia (urban and rural). The shared frailty model was applied based on their residence. The shared frailty AFT model can be written as follows [55]:
where denotes the time, and are unknown location and scale parameters, are vector of covariates, is a parameter vector, is the frailty term, and are independent identically distributed random errors. The conditional hazard function for a given frailty variable, u, at time is,
where is the hazard function at time t for a subject with a set of covariates , is the baseline hazard function, and are a vector of fixed effect parameters to be estimated. The conditional survival function for a given frailty u at time is,
where is the survival function at time t for a subject with a set of covariates , is the cumulative hazard function.
2.5. Bayesian AFT Shared Gamma Frailty Models
The Bayesian approach is preferred over the frequentist approach in survival analysis because the power of information obtained from the Bayesian approach is much better, as it combines likelihood data with prior information regarding the distribution of the parameters. The Bayesian approach is more useful in clinical data analysis than the frequentist approach and is a more appropriate data analysis technique for clinical researchers [57]. The main reasons to prefer Bayesian statistics include the ability to estimate complex models that traditional statistics cannot, a preference for the Bayesian definition of probability, the incorporation of prior and background knowledge into the analysis, and Bayesian statistics do not rely on large sample sizes (i.e., the central limit theorem). Furthermore, Bayesian statistics allow for incorporating uncertainty about a parameter and updating this knowledge via the prior distribution. The Bayesian approach considers the parameters of the model as random variables and requires specifying prior distributions for them, while the data are considered fixed [58].
Let’s start with the data likelihood function , which is a function that gives the probability of observing the sample data given the current parameters. For a set of unknown parameters in the presence of right censoring, it can be written as:
where is the censoring indicator (0 = censored and 1 = death) and and are the probability density and survival distributions, respectively [59].
In the Bayesian framework, the prior distribution is a probability distribution that expresses uncertainty about the unknown parameters before incorporating the data. It represents the prior information associated with the parameter of interest. We assumed normal priors with mean and variance for all regression coefficients and a gamma prior with shape and scale parameters for the frailty parameter [35,60]. The posterior probability density function, which summarizes our beliefs about a particular parameter, is obtained using Bayes’ rule. The distribution of a parameter can be updated by combining its prior distribution with the likelihood function, resulting in the posterior density of the parameter. It is obtained by multiplying the prior distribution over all parameters, , by the full likelihood function, [61] which is given by
So, if is the likelihood function and is the prior density of the parameter, then the posterior density function, , is proportional to the likelihood multiplied by the prior:
In our case, the posterior density function, , of is given by:
The quantity in the denominator is the normalizing constant of and is often called the marginal distribution of the data or the prior predictive distribution.
Parametric survival models play an important role in Bayesian survival analysis since many Bayesian analyses in practice are carried out using AFT models (Exponential, Weibull, Log-Normal, Log-Logistic) [35,62,63]. We considered shared gamma frailty as the gamma distribution is commonly used for modeling the frailty effect. Gamma frailty is very well suited to failure data in terms of computational and analytical points of view. The most common reason for using the gamma distribution is its mathematical convenience [64,65]. The mean and variance are and . Hence, the variance parameter represents the amount of heterogeneity in the risk of the event.
2.6. Integrated Nested Laplace Approximation Method
Survival models can be challenging to fit, especially when dealing with complex censoring schemes. Using the Gibbs sampler and other Markov-Chain Monte-Carlo (MCMC) techniques, fitting complex survival models becomes relatively straightforward, and the availability of software significantly simplifies the implementation [35]. However, MCMC methods have limitations, such as the time burden in approximating the posterior and convergence problems [33,34]. The Integrated Nested Laplace Approximation (INLA) method provides a flexible and fast technique for approximating complex Bayesian models. The Bayesian approach using the INLA method focuses on providing an accurate approximation to the posterior marginal distributions of the parameters in the model [32].
The INLA method was used to estimate the parameters in the Bayesian survival models. According to [32], INLA computes the posterior marginal for each component in the model, from which the posterior expectations and standard deviations can be derived. Additionally, INLA provides both extremely fast and highly accurate approximations to the posterior marginal via the clever use of Laplace approximations and advanced numerical methods, and it can be adapted to fit survival models [66].
2.7. Data Analysis Procedures
The entire data analysis was done using R software to estimate the heart failure patients median survival time while understanding the dataset’s unique characteristics and ensuring methodological precision. First, summary statistics was used to better present the characteristics of the data and Kaplan-Meier curves were fitted to learn the death dynamics, followed by a validation of the basic assumptions of the Cox model and fitting various survival models followed to identify the most suitable one.
For Bayesian models, the Deviance Information Criterion (DIC) was used to compare Bayesian survival models [68]. An alternative is the Watanabe-Akaike Information Criterion (WAIC) [69], which assumes a more fully Bayesian approach to construct a criterion. According to [37], the WAIC is preferable to the DIC. The preferable model is the one with the lowest values of the DIC and WAIC. A lower value indicates a better fit of the model. The most common ways of checking the goodness of fit are the Bayesian Cox-Snell residual plot and predictive distribution. Model-checking and adequacy play an important role in models for survival data. In Bayesian analysis, Chaloner [70] defined the Bayesian version of the residuals.
3. Results and Discussions
In this section, we begin by presenting descriptive results to better understand the nature of our dataset for readers and reviewers of this manuscript. Following this, we present results to clearly demonstrate the advantages of the proposed method. In doing so, we emphasize comparisons with other existing approaches in the literature. Finally, we discuss the analysis results, highlighting the benefits of the method and its broader implications in combating the potential problem of heart failure patients.
3.1. Results
The data for this study was collected from 497 patients who received treatments for HF at least once at Jimma University Medical Center in Jimma, Ethiopia, between July 2015 and January 2019.
3.1.1. Descriptive Results
As summarized in Table 1, the minimum and maximum event time observed from HF patient’s follow-up were 6 and 42 months respectively. Among those HF patients, about 60.56% were censored and the remaining 39.44% have died. Fifty percent of HF patients who received treatment survived 34 months or above.
Almost half, 53.92%, of the HF patients, were female, and the remaining were male during the follow-up study. However, the survival time of male patients seems lower. Most HF patients, about 72.03%, live in rural areas, while the remainder reside in urban areas; however, survival times appear to be shorter for those living in rural areas. The survival time of HF patients seems less as they get older. Among HF patients, 21.93% have ischemic heart disease, 22.54% have rheumatic valvular heart disease, 23.54% have cardiomyopathy, 24.14% have hypertensive heart disease, and 7.85% have other diseases. Regarding smoking status, 79.28% of HF patients were non-smokers and the remaining were smokers. Additionally, 63.38% of HF patients did not use alcohol, while 36.62% were alcohol users.
Moreover, about 18.31% of HF patients are treated in the hospital with a combination of two or more treatments, and 19.72% of HF patients take digoxin. In addition, the remaining 23.14%, 27.56%, and 11.27% of HF patients were treated with spironolactone, atorvastatin, and other treatments respectively. About diabetes, 56.94% of HF patients are non-diabetic, 15.09% have type I diabetes mellitus, and 27.97% have type II diabetes mellitus. Regarding chronic kidney disease among HF patients, approximately 31.19% have chronic kidney disease, while 68.81% do not. HF patients with chronic kidney disease generally have shorter survival times. Most HF patients, 60.16%, do not have hypertension, while the remaining patients have hypertension.
Finally, regarding the stage at which HF patients go to the hospital for treatment, approximately 35.41% are in stage IV, 25.96% in stage III, 21.73% in stage II, and 16.90% in stage I. Most HF patients who pass away, about 54.08%, HF patients go for treatment in the hospital at a later stage, and their survival times lower at this advanced stage.
3.1.2. Kaplan-Meier Estimate for Selective Covariates
The survival distributions of time-to-death of the HF patients were estimated for each group using the Kaplan-Meier (KM) method to compare the survival curves of two or more groups as seen from Figure 1.
As seen from Figure 1, it shows that the overall survival rate at the end of the first year was almost 92.6%, and the overall survival rate at the end of 42 months in this study was 19.2%, 95% confidence interval was (12.8%, 28.8%). Heart failure patients whose age was below 49 years had a higher probability of surviving than patients whose age was 49 to 65 years and those aged 65 years or older. The probability of surviving becomes less for patients aged 65 years or older. The HF patients with stage I had a higher chance of surviving than other stages. The survival curve for patients with stage I was above the survival curve for patients with stage II, stage III and stage IV. The probability of surviving becomes less for HF patients with stage IV. Additionally, HF patients who live in urban areas had a better chance of survival than HF patients who live in rural areas.
3.1.3. Bayesian AFT Shared Gamma Frailty Models
As comparison, we employed Bayesian AFT without frailty and Bayesian AFT with shared gamma frailty models for the HF dataset.
The multivariable survival models of the exponential, Weibull, lognormal, and log-logistic for the baseline hazard function by assuming gamma frailty distributions were fitted for time-to-death of HF patients. In univariable analysis at 5% level of significance, except for sex, treatment, and alcohol consumption, all variables were significant. The covariates significant in univariable analysis entered into multivariable analysis. We assume that all these coefficients have a normal prior with mean 0 and variance of 1000 in the Baysian modeling. In analyzing the frailty parameter (u) via the Bayesian approach, we assume that a gamma prior was applied to the Weibull, log-normal, and log-logistic distributions with shape parameter 1 and inverse scale parameter 0.001 [35].
Table 2 shows the analysis of the HF dataset for model comparison to compare the Bayesian AFT models with frailty with the Bayesian AFT models without frailty. To compare the efficiency of these various models, DIC and WAIC were used, and the one with the smallest value and the best fit was chosen. We noted that adding frailty to the Bayesian AFT models boosted the performance in all AFT models as compared with the Bayesian AFT models without frailty. Then, the Bayesian log-normal shared gamma frailty model (DIC = 1608.812; WAIC = 1607.838) was found to be the best model for survival time of HF patients from the given alternative.
Table 3 shows the final results for the Bayesian log-normal shared gamma frailty model, and as this result shows, the survival time of HF patients is statistically significantly affected by age, chronic kidney disease, diabetes mellitus, history of HF, aetiology of HF, hypertension, anemia, smoking, and stages of HF.
From Table 3, the results of the Bayesian log-normal shared gamma frailty model show that, keeping the effect of other factors constant, the estimated acceleration factor for HF patients aged 49 to 65 years and those aged 65 years or older is 0.7357 [95% CrI: 0.580, 0.931] and 0.6969 [95% CrI: 0.554, 0.873], respectively. Thus, the expected survival time of HF patients decreases by 26.43% and 30.31% for those aged 49 to 65 and 65 or older, respectively, compared to HF patients aged 49 or younger (reference group). The 95% CrI for the acceleration factors in both age groups does not include one, implying that both age groups significantly impact the survival time of HF patients.
For chronic kidney disease, while controlling for other factors, the estimated acceleration factor for HF patients with chronic kidney disease is 0.6630 [95% CrI: 0.569, 0.769], indicating that the expected survival time decreases by 33.70% compared to HF patients without chronic kidney disease. The 95% CrI for the acceleration factor of HF patients with chronic kidney disease does not include one, showing a significant impact on survival time.
Regarding the history of HF, keeping the effect of other factors constant, the estimated acceleration factors for HF patients in medical OPD to be 1.2751 [95% CrI: 1.046, 1.559]. Thus, the expected survival time increases by 27.51% for those in medical OPD compared to new HF patients (reference group). The 95% CrI for this acceleration factor does not include one, showing a significant impact on survival time.
For hypertension, keeping the effect of other factors constant, the estimated acceleration factor for HF patients with hypertension is 0.7320 [95% CrI: 0.626, 0.855], indicating a 26.80% decrease in expected survival time compared to HF patients without hypertension (reference group). The 95% CrI for the acceleration factor of HF patients with hypertension does not include one, implying a significant effect on survival time. Moreover, keeping the effect of other factors constant, the estimated acceleration factor for HF patients who smoked cigarettes is 0.8395 [95% CrI: 0.721, 0.976], indicating a 16.05% decrease in expected survival time compared to non-smokers. The 95% CrI for the acceleration factor of HF patients who smoked cigarettes does not include one, implying that smoking has a significant effect on survival time.
Regarding the aetiologies of heart failure and keeping the effect of other factors constant, the estimated acceleration factors for HF patients with rheumatic valvular heart disease, hypertensive heart disease, cardiomyopathy, and other heart diseases are 0.7211 [95% CrI: 0.568, 0.913], 0.7558 [95% CrI: 0.602, 0.948], 0.7416 [95% CrI: 0.586, 0.936], and 0.6750 [95% CrI: 0.487, 0.933], respectively. Thus, the expected survival time of HF patients decreases by 27.89% for those with rheumatic valvular heart disease, 24.42% for those with hypertensive heart disease, 25.84% for those with cardiomyopathy, and 32.50% for those with other heart diseases, compared to those with ischemic heart disease (reference group). The 95% CrI for these acceleration factors does not include one, implying that HF patients with these aetiologies have a significant impact on survival time.
On the other hand, for diabetes mellitus and keeping the effect of other factors constant, the estimated acceleration factors for HF patients with type I diabetes and type II diabetes are 0.6421 [95% CrI: 0.509, 0.806] and 0.5764 [95% CrI: 0.468, 0.706], respectively. Thus, the expected survival time of HF patients decreases by 35.79% for type I diabetics and 42.36% for type II diabetics compared to non-diabetic HF patients (reference group). The 95% CrI for the acceleration factors of HF patients with both types of diabetes does not include one, implying that diabetes has a significant effect on survival time. Regarding anemia, while controlling for other factors, the estimated acceleration factor for HF patients with anemia is 0.8445 [95% CrI: 0.729, 0.974], indicating that the expected survival time decreases by 15.55% compared to HF patients without anemia. The 95% CrI for the acceleration factor of HF patients with anemia does not include one, implying that anemia significantly affects survival time.
Finally, observing the stages of HF patients while keeping the effect of other factors constant, the estimated acceleration factors for stages II, III, and IV of HF patients are 0.6332 [95% CrI: 0.449, 0.888], 0.7033 [95% CrI: 0.509, 0.968], and 0.6402 [95% CrI: 0.467, 0.875], respectively. This result indicates that the expected survival time decreases by 36.68%, 29.67%, and 35.98% for stages II, III, and IV, respectively, compared to stage I (reference group). The 95% CrI for the acceleration factors of HF patients in stages II, III, and IV does not include one, implying that these stages significantly impact the survival time of HF patients.
From Table 3, the 95% CrI of the acceleration factors for covariates that do not include one are significant at the 5% significance level. The 95% CrI [1.0268, 95%: 1.00598, 1.625] of the frailties in the HF dataset suggests that this variability is significant. The frailty variance () = 0.0264 indicates heterogeneity between residence regions. Additionally, a frailty variance () of 0.0264 less than 1 suggests that HF patients living in rural areas have a higher risk of death (shorter survival time) compared to HF patients living in urban areas. Kendall’s tau ( = 0.013) indicates a moderate amount of dependence in the clusters or unobserved heterogeneity between groups (residence region). Therefore, the frailty term had a significant contribution to the model. The Kullback-Leibler divergence (KLD) values for all significant parameters in the Bayesian log-normal shared gamma frailty model were 0, indicating that the posterior distribution was well approximated by a normal distribution. The most efficient algorithm used was a simplified Laplace approximation, which improved efficiency and resulted in faster computation speed.
3.1.4. Bayesian Model Diagnostics
By observing the Bayesian Cox-Snell residual plots in Figure 2, we can see that the Bayesian log-normal shared gamma frailty model best fit HF data-set from the given alternative models, since the plot of Cox-Snell residuals against cumulative hazard function of residuals was approximately a straight line with slope one and Bayesian cox-snell residual plot for Bayesian log-normal shared gamma frailty model was nearest to the line through the origin. In addition, the plot also indicated that the Bayesian log-normal shared gamma frailty model describes the HF data-set well.
Figure 3 includes a 95% credibility interval by observing the posterior density for the parameter’s normal distribution in the HF dataset. In addition, the histograms of the cross-validated Probability Integral Transform (PIT) values show that the posterior predictive p-values are somewhat closer to a uniform distribution, with some outliers observed in the HF data set. The Conditional predictive ordinate (CPO) values are significantly smaller (order of magnitude smaller) than the others, so the observed values would be considered surprising concerning the Bayesian log-normal shared gamma frailty model because the sum of the observations associated with failure flags is equal to zero in the HF dataset. The KLD is a diagnostic that measures the accuracy of the INLA approximation since Table 3 shows that the KLD values for all significant parameters in the Bayesian log-normal shared gamma frailty model were 0.
3.2. Discussion
This study employed the Bayesian AFT shared gamma frailty models on the HF dataset obtained from Jimma University Medical Center. Heart failure is a growing global issue, with its prevalence increasing among the adult population in developing countries with aging populations [5,6]. The study considered 497 HF patients to attain the proposed objectives. The overall survival time observed from HF patient’s follow-up ranged from 6 months to 42 months. The result shows that the estimated median survival time of HF patients who received treatment survived 34 months or above. Moreover, among those HF patients, about 301 (60.56%) were censored and the remaining 196 (39.44%) died. This finding was supported by other studies conducted by [20,23,71].
In the study, among HF patients, 21.93% have ischemic heart disease, 22.54% have rheumatic valvular heart disease, 23.54% have cardiomyopathy, 24.14% have hypertensive heart disease, and 7.85% have other diseases. This finding was consistent with a study conducted by [8,9,16,20,23]. Most HF patients, about 72.03%, live in rural areas, while the remainder reside in urban areas; however, survival times appear to be shorter for those living in rural areas. This finding was consistent with a study conducted by [20,23].
Furthermore, our study results indicate heterogeneity among clusters or groups (residences) at the time of death of heart failure (HF) patients, suggesting residence as a significant clustering factor. In line with our current work, several authors have explored Bayesian frailty models [60,63,64], including parametric models with baseline distributions such as exponential, Weibull, log-normal, and log-logistic, incorporating gamma frailty. Bayesian approaches have been applied to AFT shared gamma frailty models, and efficiency comparisons of different AFT models have utilized DIC and WAIC [68,69]. The Bayesian log-normal AFT shared gamma frailty model emerged as the most effective for describing the HF dataset among the alternatives. Similar findings were reported in previous studies [23]. However, our study, using the INLA method, reveals that age, chronic kidney disease, history of HF, diabetes mellitus, etiology of HF, hypertension, anemia, smoking, and HF stage all significantly impact the survival time of HF patients.
The findings of this study reveal that age significantly impacts the survival time of heart failure (HF) patients, with older individuals (65 years and older) experiencing shorter survival times. This trend is consistent with results from several other studies [19,20,22,23,72,73]. Additionally, HF patients without hypertension tend to have longer survival times compared to those with hypertension, underscoring the significant effect of hypertension on survival. These results are corroborated by studies conducted by [17,19,20,23,73].
On the other hand, the survival time of heart failure (HF) patients who smoke is shorter compared to nonsmokers, consistent with findings from studies by [17,20,23]. Both types of diabetes mellitus significantly impact HF patients’ survival, with those having either type of diabetes experiencing shorter expected survival times compared to HF patients without diabetes. These findings align with studies conducted by [17,19,20,23]. Additionally, chronic kidney disease significantly affects survival time, with HF patients without chronic kidney disease having longer survival times compared to those with the condition. This result is corroborated by studies from [19,20,23,73].
According to findings from [19,20,22,23], anemia significantly impacts the survival time of heart failure (HF) patients, with those having anemia experiencing shorter expected survival times compared to non-anemic HF patients. This study aligns with those results. Additionally, studies [20,23,74] support the finding that HF patients with conditions such as rheumatic valvular heart disease, hypertensive heart disease, cardiomyopathy, and other heart diseases have significantly reduced survival times. The stages of HF also markedly influence survival, with increased stage correlating with decreased survival time. This conclusion is supported by studies [19,20,23], which demonstrate that advancing HF stages significantly impact survival time.
To assess model adequacy, we plotted cumulative hazard plots for the Bayesian Cox-Snell residuals of the Exponential, Weibull, Log-normal, and Log-logistic models, as shown in Figure 2. The Bayesian log-normal shared gamma frailty model approached the line more closely, indicating it was the most suitable for the HF dataset, consistent with previous research [23]. We also used conditional predictive ordinates and probability integral transforms to evaluate the model. Before graphical assessment, we confirmed that no numerical issues arose in the computation of conditional predictive ordinates, as indicated by zero failures. Histograms and scatter plots of the probability integral transform showed that the predictive residuals were reasonably uniformly distributed with some outliers, supporting a good match between the predictive distribution and actual data. These results are in line with studies by [23,66,75], highlighting the robustness of our model.
Diagnostic plots for the Bayesian log-normal shared gamma frailty model, including a 95% credibility interval, show that the posterior density for parameters is normally distributed. The Kullback-Leibler divergence (KLD) values for all significant parameters were zero, demonstrating that the model offers both speed and high accuracy. These findings align with results from [23,66,75]. Despite limitations, such as reliance on potentially incomplete secondary data and missing prognostic factors, this study is pioneering in Ethiopia for its rigorous analysis and critical insights into heart failure patient survival, highlighting the robustness and advantages of the proposed method.
4. Conclusions
The increasing application of survival methods to estimate median survival time and identify associated factors is crucial. However, traditional methods often struggle with overfitting or underfitting, resulting in large standard errors in regression coefficients. They also frequently fail to account for within-cluster dependence and handle heterogeneity effectively. To address these shortcomings, we analyzed the survival times of heart failure patients treated at Jimma University Medical Center. This study employed various advanced survival methods to estimate survival time and identify risk factors for heart failure patients in this region. To achieve the proposed objectives, we employed Bayesian AFT and Bayesian AFT shared frailty models, comparing their performance using the heart failure patient dataset based on DIC and WAIC criteria. Notably, the Bayesian AFT models with shared gamma frailty significantly outperformed the Bayesian AFT models without frailty across all AFT model classes considered in this research.
Among the Bayesian AFT shared frailty models, the log-normal model emerged as the best performer. This finding highlights the importance of incorporating frailty to enhance model accuracy and parameter estimation. Subsequently, we then conducted an extensive data analysis using the model that demonstrated the best performance. This is due to the fact that log-normal Bayesian AFT shared gamma frailty model provides flexible survival data modeling by incorporating both individual-level and group-level random effects, effectively handling unobserved heterogeneity and delivering robust survival estimates. This model consistently outperforms alternatives such as exponential, Weibull and log-logistic AFT models. In this study, 50% of heart failure patients who received treatment survived for 34 months or more. Significant factors affecting survival included age, chronic kidney disease, history of heart failure, diabetes mellitus, etiology, hypertension, anemia, smoking, and heart failure stages. Additionally, survival times varied between rural and urban areas, highlighting the model’s ability to capture important heterogeneity.
More specifically, the study findings suggest that age groups (49 to 65 years and years), etiology of heart failure (rheumatic valvular heart disease, cardiomyopathy, hypertensive heart disease, and other conditions), hypertension, anemia presence, history of HF (medical OPD), chronic kidney disease presence, smoking, diabetes mellitus (type I and type II), and heart failure stages (II, III, and IV) reduced the survival time of heart failure patients. Furthermore, residence differences between rural and urban areas significantly influenced HF patient survival times, indicating heterogeneity and highlighting the need for frailty models.
Our results underscore the superior performance of the Bayesian log-normal shared gamma frailty model compared to current state-of-the-art methods.
Author Contributions
This study was drafted and the data were analyzed by TA under the supervision of HTL and DC. HTL and DC edited and revised the entire manuscript. All authors agreed and equally contributed to the paper.
Funding
No funding.
Institutional Review Board Statement
The Institutional Research Ethics Review Board of Jimma University provided ethical clearance for the study. The dataset was collected after an official letter was obtained from Jimma University and sent to the Hospital for permission. Our study protocol complied with the ethical guidelines of the 1975 Declaration of Helsinki. All the enrolled patients provided informed consent. The ethics committee of Jimma University approved this form of consent due to the registry-based nature of the study.
Informed Consent Statement
Not applicable.
Data Availability Statement
The datasets and R code used in this study are available from the corresponding author upon reasonable request.
Acknowledgments
We thank Jimma University Medical Center for allowing us to collect the data set from the hospital. We would like to express our sincere gratitude to the Department of Statistics at the University of Pretoria, South Africa, for their valuable support and collaboration in this project. This work is partially based upon research supported by the National Research Foundation, South Africa (South Africa DST-NRF-SAMRC SARChI Research Chair in Biostatistics, Grant number 114613). Opinions expressed and conclusions arrived at are those of the author and are not necessarily to be attributed to the NRF.
Conflicts of Interest
The authors declare no competing interests.
Abbreviations
The following abbreviations are used in this manuscript:
| HF | Heart Failure |
| AFT | Accelerated Failure Time |
| Cox PH | Cox Proportional Hazard |
| MCMC | Markov Chain Monte Carlo |
| INLA | Integrated Nested Laplace Approximation |
| JUMC | Jimma University Medical Center |
| DIC | Deviance Information Criteria |
| WAIC | Watanabe Akaike Information Criterion |
| KLD | Kullback-Leibler Divergence |
| OPD | Out-Patient Department. |
References
- Ambrosy, A.P., Fonarow, G.C., Butler, J., Chioncel, O., Greene, S.J., Vaduganathan, M., Nodari, S., Lam, C.S., Sato, N., Shah, A.N., et al.: The global health and economic burden of hospitalizations for heart failure: lessons learned from hospitalized heart failure registries.Journal of the American College of Cardiology.2014,63 (12),1123–1133.
- Vos, T., Lim, S.S., Abbafati, C., Abbas, K.M., Abbasi, M., Abbasifard, M., Abbasi-Kangevari, M., Abbastabar, H., Abd-Allah, F., Abdelalim, A., et al.: Global burden of 369 diseases and injuries in 204 countries and territories, 1990–2019: a systematic analysis for the global burden of disease study 2019.Biomedical Signal Processing and Control. 2020, 70, 102–985.
- Yan, T., Zhu, S., Yin, X., Xie, C., Xue, J., Zhu, M., Weng, F., Zhu, S., Xiang, B., Zhou, X., et al.: Burden, trends, and inequalities of heart failure globally, 1990 to 2019: a secondary analysis based on the global burden of disease 2019 study. Journal of the American Heart Association,2023, 12(6), 027852.
- Martin, S.S., Aday, A.W., Almarzooq, Z.I., Anderson, C.A., Arora, P., Avery, C.L., Baker-Smith, C.M., Barone Gibbs, B., Beaton, A.Z., Boehme, A.K., et al.: 2024 heart disease and stroke statistics: a report of us and global data from the american heart association.Circulation, 2024, 149(8), 347–913.
- Hessel, F.P.: Overview of the socio-economic consequences of heart failure. Cardiovascular Diagnosis and Therapy,2021, 11(1), 254.
- Pratley, R., Guan, X., Moro, R.J., Lago, R.: The burden of heart failure.The American Journal of Medicine, 2024, 137(2), 3–8.
- Heidenreich, P., Sandhu, A.: Advances in management of heart failure.bmj,2024, 385.
- Dokainish, H., Teo, K., Zhu, J., Roy, A., AlHabib, K.F., ElSayed, A., Palileo-Villaneuva, L., Lopez-Jaramillo, P., Karaye, K., Yusoff, K., et al.: Global mortality variations in patients with heart failure: results from the international congestive heart failure (inter-chf) prospective cohort study.The Lancet Global Health, 2017, 5(7), 665–672.
- Gtif, I., Bouzid, F., Charfeddine, S., Abid, L., Kharrat, N.: Heart failure disease: an african perspective. Archives of Cardiovascular Diseases,2021, 114(10), 680–690.
- Keates, A.K., Mocumbi, A.O., Ntsekhe, M., Sliwa, K., Stewart, S.: Cardiovascular disease in africa: epidemiological profile and challenges.Nature Reviews Cardiology, 2017, 14(5), 273–293.
- Glezeva, N., Gallagher, J., Ledwidge, M., O’Donoghue, J., McDonald, K., Chipolombwe, J., Watson, C.: Heart failure in sub-saharan africa: review of the aetiology of heart failure and the role of point-of-care biomarker diagnostics.Tropical Medicine and International Health,2015, 20(5), 581–588.
- Oleribe, O.O., Momoh, J., Uzochukwu, B.S., Mbofana, F., Adebiyi, A., Barbera, T., Williams, R., Taylor-Robinson, S.D.: Identifying key challenges facing healthcare systems in africa and potential solutions.International journal of general medicine, 2019, 395–403.
- Bloomfield, G.S., Barasa, F.A., Doll, J.A., Velazquez, E.J.: Heart failure in subsaharan africa. Current cardiology reviews,2013, 9(2), 157–173.
- Damasceno, A., Mayosi, B.M., Sani, M., Ogah, O.S., Mondo, C., Ojji, D., Dzudie, A., Kouam, C.K., Suliman, A., Schrueder, N., et al.: The causes, treatment, and outcome of acute heart failure in 1006 africans from 9 countries: results of the sub-saharan africa survey of heart failure.Archives of internal medicine, 2012, 172(18), 1386–1394.
- Sliwa, K., Mayosi, B.M.: Recent advances in the epidemiology, pathogenesis and prognosis of acute heart failure and cardiomyopathy in africa. Heart,2013, 99(18), 1317–1322.
- Asfaw, E.: Five years clinical characteristics and in hospital outcome of acute heart failure at tertiary care hospital in ethiopia.Ethiopian Medical Journal, 2020, 58(01).
- Tirfe, M., Nedi, T., Mekonnen, D., Berha, A.B.: Treatment outcome and its predictors among patients of acute heart failure at a tertiary care hospital in ethiopia: a prospective observational study. BMC cardiovascular disorders,2020, 20, 1–10.
- Amare, H., Hamza, L., Asefa, H.: Malnutrition and associated factors among heart failure patients on follow up at jimma university specialized hospital, ethiopia.BMC cardiovascular disorders, 2015, 15, 1–6.
- Zeru, M.A.: Assessment of major causes of heart failure and its pharmacologic management among patients at felege hiwot referral hospital in bahir dar, ethiopia. Journal of public health and epidemiology,2018, 10(9), 326–331.
- Moyehodie, Y.A., Muluneh, M.W., Belay, A.T., Fenta, S.M.: Time to death and its determinant factors among patients with chronic heart failure in northwest ethiopia: A retrospective study at selected referral hospitals.Frontiers in Cardiovascular Medicine, 2022, 9, 817074.
- Hailay, A., Kebede, E., Mohammed, K.: Survival during treatment period of patients with severe heart failure admitted to intensive care unit (icu) at gondar university hospital (guh), gondar, ethiopia. American Journal of Health Research,2015, 3(5), 257–269.
- Ahmad, T., Munir, A., Bhatti, S.H., Aftab, M., Raza, M.A.: Survival analysis of heart failure patients: A case study.PloS one, 2017, 12(7), 0181001.
- Ashine, T., Muleta, G., Tadesse, K.: Assessing survival time of heart failure patients: using bayesian approach. Journal of Big Data,2021, 8(1), 156.
- Kalbfleisch, J.D., Prentice, R.L.: The Statistical Analysis of Failure Time Data.John Wiley and Sons, 2011 Jan 25.
- Khanal, S.P., Sreenivas, V., Acharya, S.K.: Accelerated failure time models: an application in the survival of acute liver failure patients in india. Int J Sci Res,2014, 3(6), 161–6.
- Collett, D.: Modelling survival data in medical research,2023 .
- Qi, J.: Comparison of proportional hazards and accelerated failure time models.PhD thesis, University of Saskatchewan, 2009.
- Lee, K.H., Rondeau, V., Haneuse, S.: Accelerated failure time models for semicompeting risks data in the presence of complex censoring. Biometrics,2017, 73(4), 1401–1412.
- Hanagal, D.D.: Modeling Survival Data Using Frailty Models. SpringerInt, 2011 Jan 26.
- Gutierrez, R.G.: Parametric frailty and shared frailty survival models. The Stata Journal,2002, 2(1), 22–44.
- Hougaard, P., Hougaard, P.: Analysis of multivariate survival data 564.2000 .
- Rue, H., Martino, S., Chopin, N.: Approximate bayesian inference for latent gaussian models by using integrated nested laplace approximations.Journal of the Royal Statistical Society Series B: Statistical Methodology, 2009, 71(2), 319–392.
- Berger, J.O.: Statistical Decision Theory and Bayesian Analysis. Springer. 2013.
- Brooks, S.P., Gelman, A.: General methods for monitoring convergence of iterative simulations. Journal of computational and graphical statistics,1998, 7(4), 434–45.
- Ibrahim, J.G., Chen, M.-H., Sinha, D., Ibrahim, J., Chen, M.: Bayesian survival analysis.2001 , 2.
- Ibrahim, J.G., Zhu, H., Tang, N.: Bayesian local influence for survival models.Lifetime Data Analysis, 2011, 17, 43–70.
- Gelman, A., Hwang, J., Vehtari, A.: Understanding predictive information criteria for bayesian models. Statistics and computing,2014, 24, 997–1016.
- Aslanidou, H., Dey, D.K., Sinha, D.: Bayesian analysis of multivariate survival data using monte carlo methods.Canadian Journal of Statistics, 1998, 26(1), 33–48.
- Congdon, P.D.: Applied bayesian hierarchical methods, 2010.
- Kaplan, E.L., Meier, P.: Nonparametric estimation from incomplete observations. Journal of the American statistical association,1958, 53(282), 457–481.
- Aalen, O., Borgan, O., Gjessing, H.: Survival and event history analysis: a process point of view,2008 .
- Cox, D.R.: Regression models and life-tables.Journal of the Royal Statistical Society: Series B (Methodological), 1972, 34(2), 187–202.
- Wei, L.J.: The accelerated failure time model: a useful alternative to the cox regression model in survival analysis. Statistics in medicine,1992, 11(14-15), 1871–1879.
- Bender, R., Augustin, T., Blettner, M.: Generating survival times to simulate cox proportional hazards models.Statistics in medicine, 2005, 24(11), 1713–1723.
- Cox, D.R.: Some remarks on the analysis of survival data. In: Proceedings of the First Seattle Symposium in Biostatistics: Survival Analysis. Springer,1997,pp. 1–9.
- Pan, W.: Using frailties in the accelerated failure time model.Lifetime Data Analysis, 1997, 7, 55–64.
- Kleinbaum, D.G., Klein, M.: Survival Analysis a Self-learning Text. Springer,1996.
- Vaupel, J.W., Manton, K.G., Stallard, E.: The impact of heterogeneity in individual frailty on the dynamics of mortality.Demography, 1979,16(3), 439–454.
- Clayton, D.G.: A model for association in bivariate life tables and its application in epidemiological studies of familial tendency in chronic disease incidence. Biometrika,1978,65(1), 141–151.
- Hougaard, P.: Modelling heterogeneity in survival data.Journal of Applied Probability, 1997, 28(3), 695–701.
- Hougaard, P.: Frailty models for survival data. Lifetime data analysis,1995,1, 255–273.
- Wienke, A.: Frailty Models in Survival Analysis.Chapman and Hall/CRC, 2010.
- Duchateau, L., Janssen, P.: The frailty model. 2008.
- Zhang, J., Peng, Y.: An alternative estimation method for the accelerated failure time frailty model. Computational statistics and data analysis,2007, 51(9), 4413–4423.
- Lambert, P., Collett, D., Kimber, A., Johnson, R.: Parametric accelerated failure time models with random effects and an application to kidney transplant survival.Statistics in medicine, 2004, 23(20), 3177–3192.
- Raman, T., Venkatesan, P.: Accelerated failure time frailty model in survival analysis. International Journal of Science and Technology,2012,2(2), 65–9.
- Bhattacharjee, A.: Application of bayesian approach in cancer clinical trial.World journal of oncology, 2014,5(3), 109.
- Depaoli, S.: The impact of inaccurate “informative” priors for growth parameters in bayesian growth mixture modeling. Structural Equation Modeling: A Multidisciplinary Journal,2014,21(2), 239–252.
- Ganjali, M., Baghfalaki, T.: Bayesian analysis of unemployment duration data in the presence of right and interval censoring.Journal of Reliability and Statistical Studies, 2012, 17–32.
- Hanagal, D.D., Dabade, A.D.: Bayesian estimation of parameters and comparison of shared gamma frailty models. Communications in Statistics-Simulation and Computation,2013,42(4), 910–931.
- Christensen, R., Johnson, W., Branscum, A., Hanson, T.E.: Bayesian ideas and data analysis: an introduction for scientists and statisticians.2010 .
- Santos, C., Achcar, J.: A bayesian analysis for multivariate survival data in the presence of covariates.Journal of Statistical Theory and Applications, 2010,9, 233–253.
- Yin, G., Ibrahim, J.G.: A class of bayesian shared gamma frailty models with multivariate failure time data. Biometrics,2005,61(1), 208–216.
- Yu, B.: Estimation of shared gamma frailty models by a modified em algorithm.Computational statistics and data analysis, 2006,50(2), 463–474.
- Hougaard, P.: Life table methods for heterogeneous populations: distributions describing the heterogeneity. Biometrika,1984,71(1), 75–83.
- Akerkar, R., Martino, S., Rue, H.: Implementing approximate bayesian inference for survival analysis using integrated nested laplace approximations.Prepr Stat Nor Univ Sci Technol, 2010,1, 1–38.
- Chen, D.G and Lio, Y.: Comparative studies on frailties in survival analysis. Communications in Statistics—Simulation and Computation,2008,37(8), 1631–1646.
- Spiegelhalter, D.J., Abrams, K.R., Myles, J.P.: Bayesian approaches to clinical trials and health-care evaluation 13 .2004 .
- Watanabe, S., Opper, M.: Asymptotic equivalence of bayes cross validation and widely applicable information criterion in singular learning theory.Journal of machine learning research, 2010,11(12).
- Chaloner, K.: Bayesian residual analysis in the presence of censoring. Biometrika,1991,78(3), 637–644.
- Hariharaputhiran, S., Peng, Y., Ngo, L., Ali, A., Hossain, S., Visvanathan, R., Adams, R., Chan, W., Ranasinghe, I.: Long-term survival and life expectancy following an acute heart failure hospitalization in australia and new zealand.European Journal of Heart Failure, 2022, 24(9), 1519–1528.
- Abebe, T.B., Gebreyohannes, E.A., Tefera, Y.G., Abegaz, T.M.: Patients with hfpef and hfref have different clinical characteristics but similar prognosis: a retrospective cohort study. BMC cardiovascular disorders,2016, 16, 1–8.
- L´opez-Vilella, R., Guerrero Cervera, B., Donoso Trenado, V., Mart´ınez Dolz, L., Almenar Bonet, L.: Clinical profiling of patients admitted with acute heart failure: a comprehensive survival analysis.Frontiers in Cardiovascular Medicine, 2024,11, 1381514.
- Beghini, A., Sammartino, A.M., Papp, Z., Haehling, S., Biegus, J., Ponikowski, P., Adamo, M., Falco, L., Lombardi, C.M., Pagnesi, M., et al.: 2024 update in heart failure. ESC Heart Failure,2024.
- Martino, S., Akerkar, R., Rue, H.: Approximate bayesian inference for survival models.Scandinavian Journal of Statistics, 2011,38(3), 514–528.
Figure 1.
Kaplan-Meier estimates of the survival curves of HF data set for the Overall survivor function for HF patients, Age group, Stages and Place of residence
Figure 1.
Kaplan-Meier estimates of the survival curves of HF data set for the Overall survivor function for HF patients, Age group, Stages and Place of residence
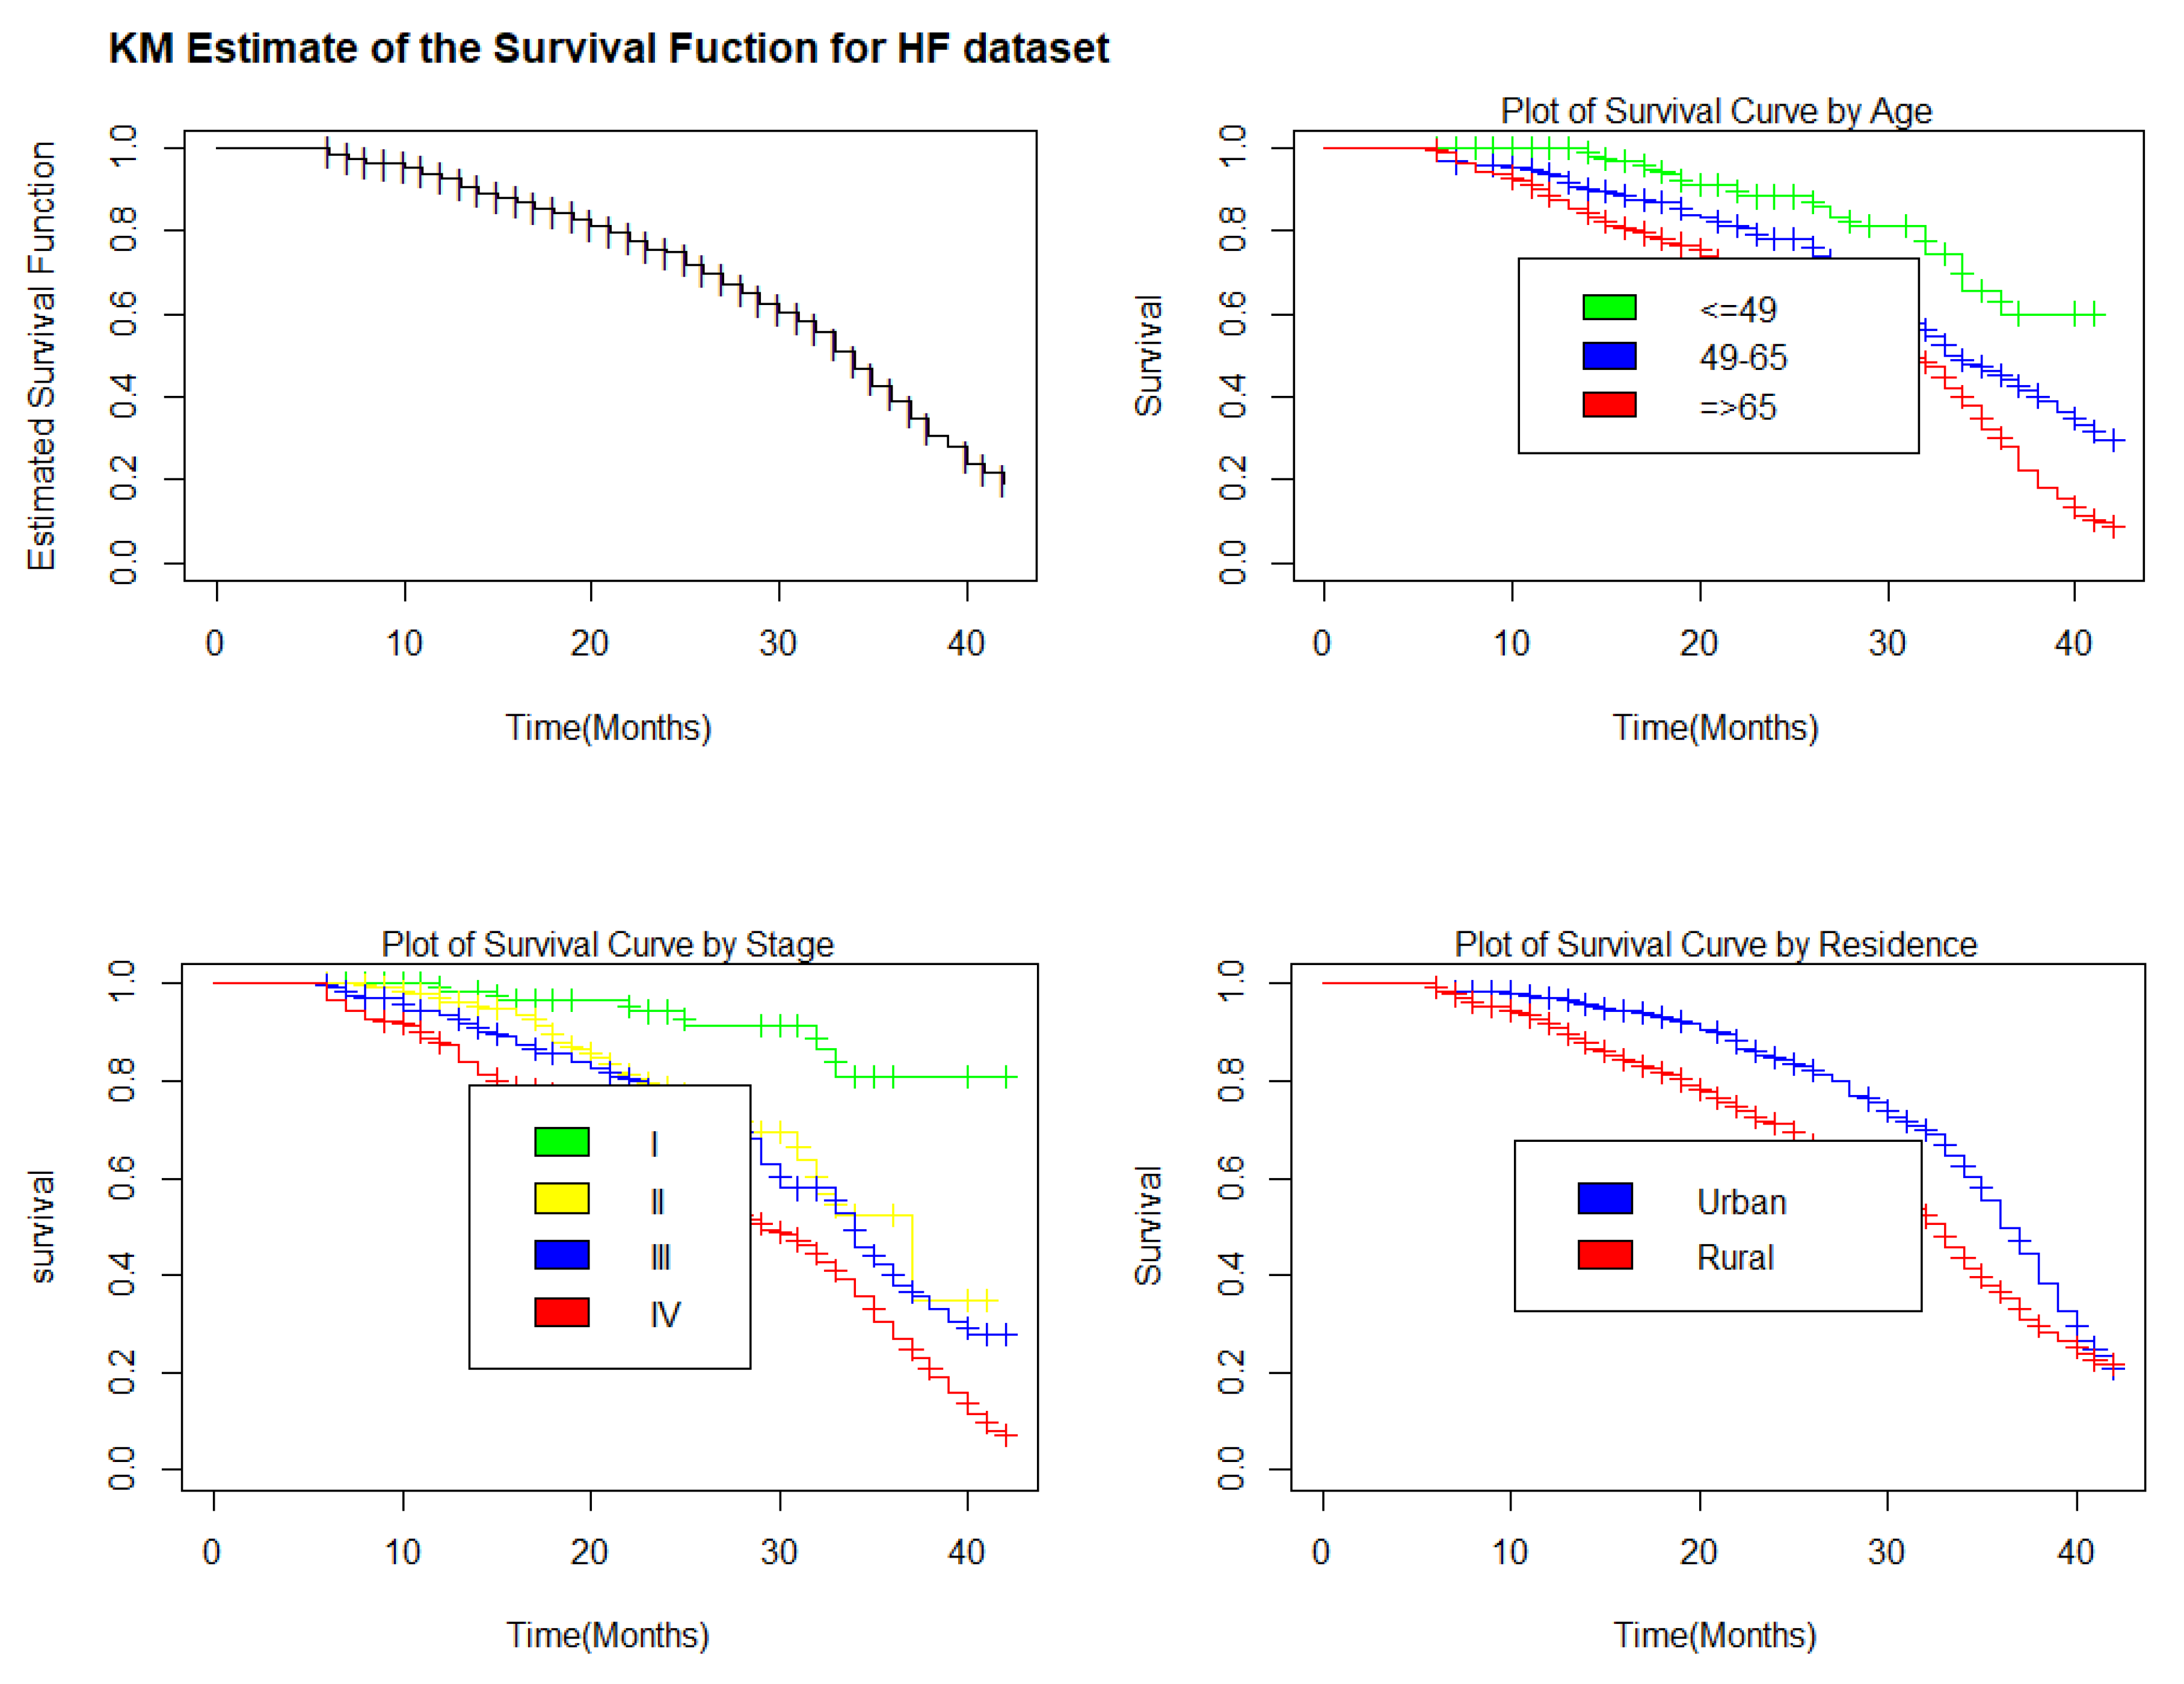
Figure 2.
Bayesian Cox-Snell residual plots for baseline distribution employed to fit the heart failure data set.
Figure 2.
Bayesian Cox-Snell residual plots for baseline distribution employed to fit the heart failure data set.
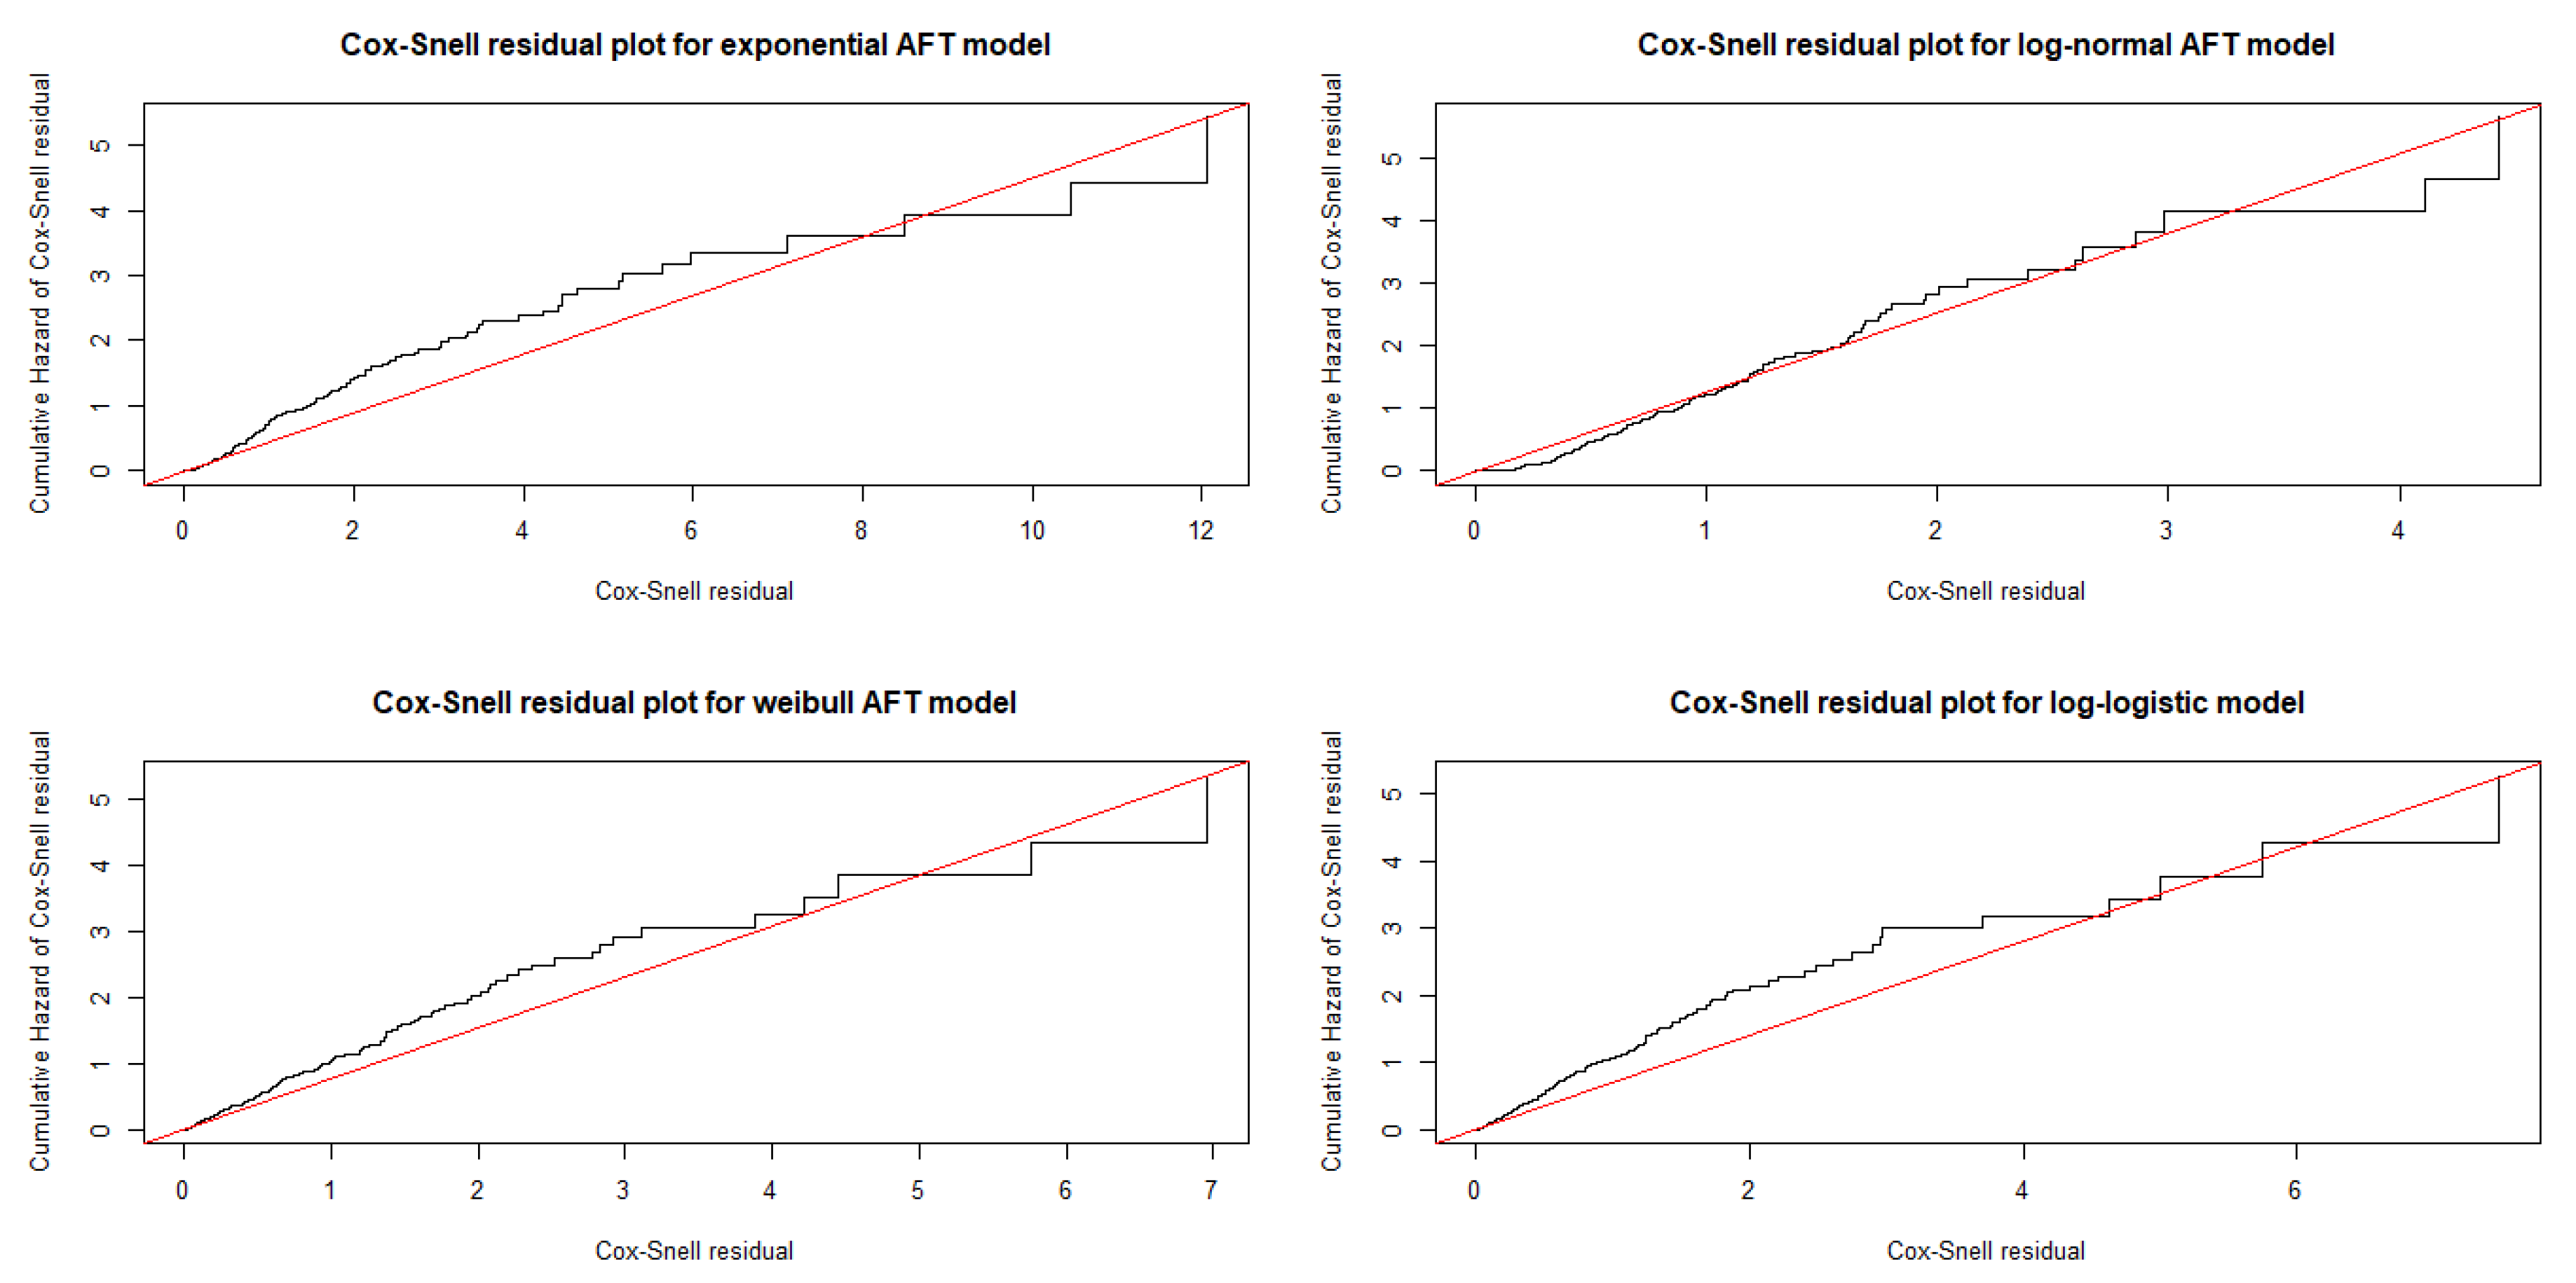
Figure 3.
Plots of Histogram, PIT, CPO, and 95% credible intervals used to fit the heart failure dataset.
Figure 3.
Plots of Histogram, PIT, CPO, and 95% credible intervals used to fit the heart failure dataset.
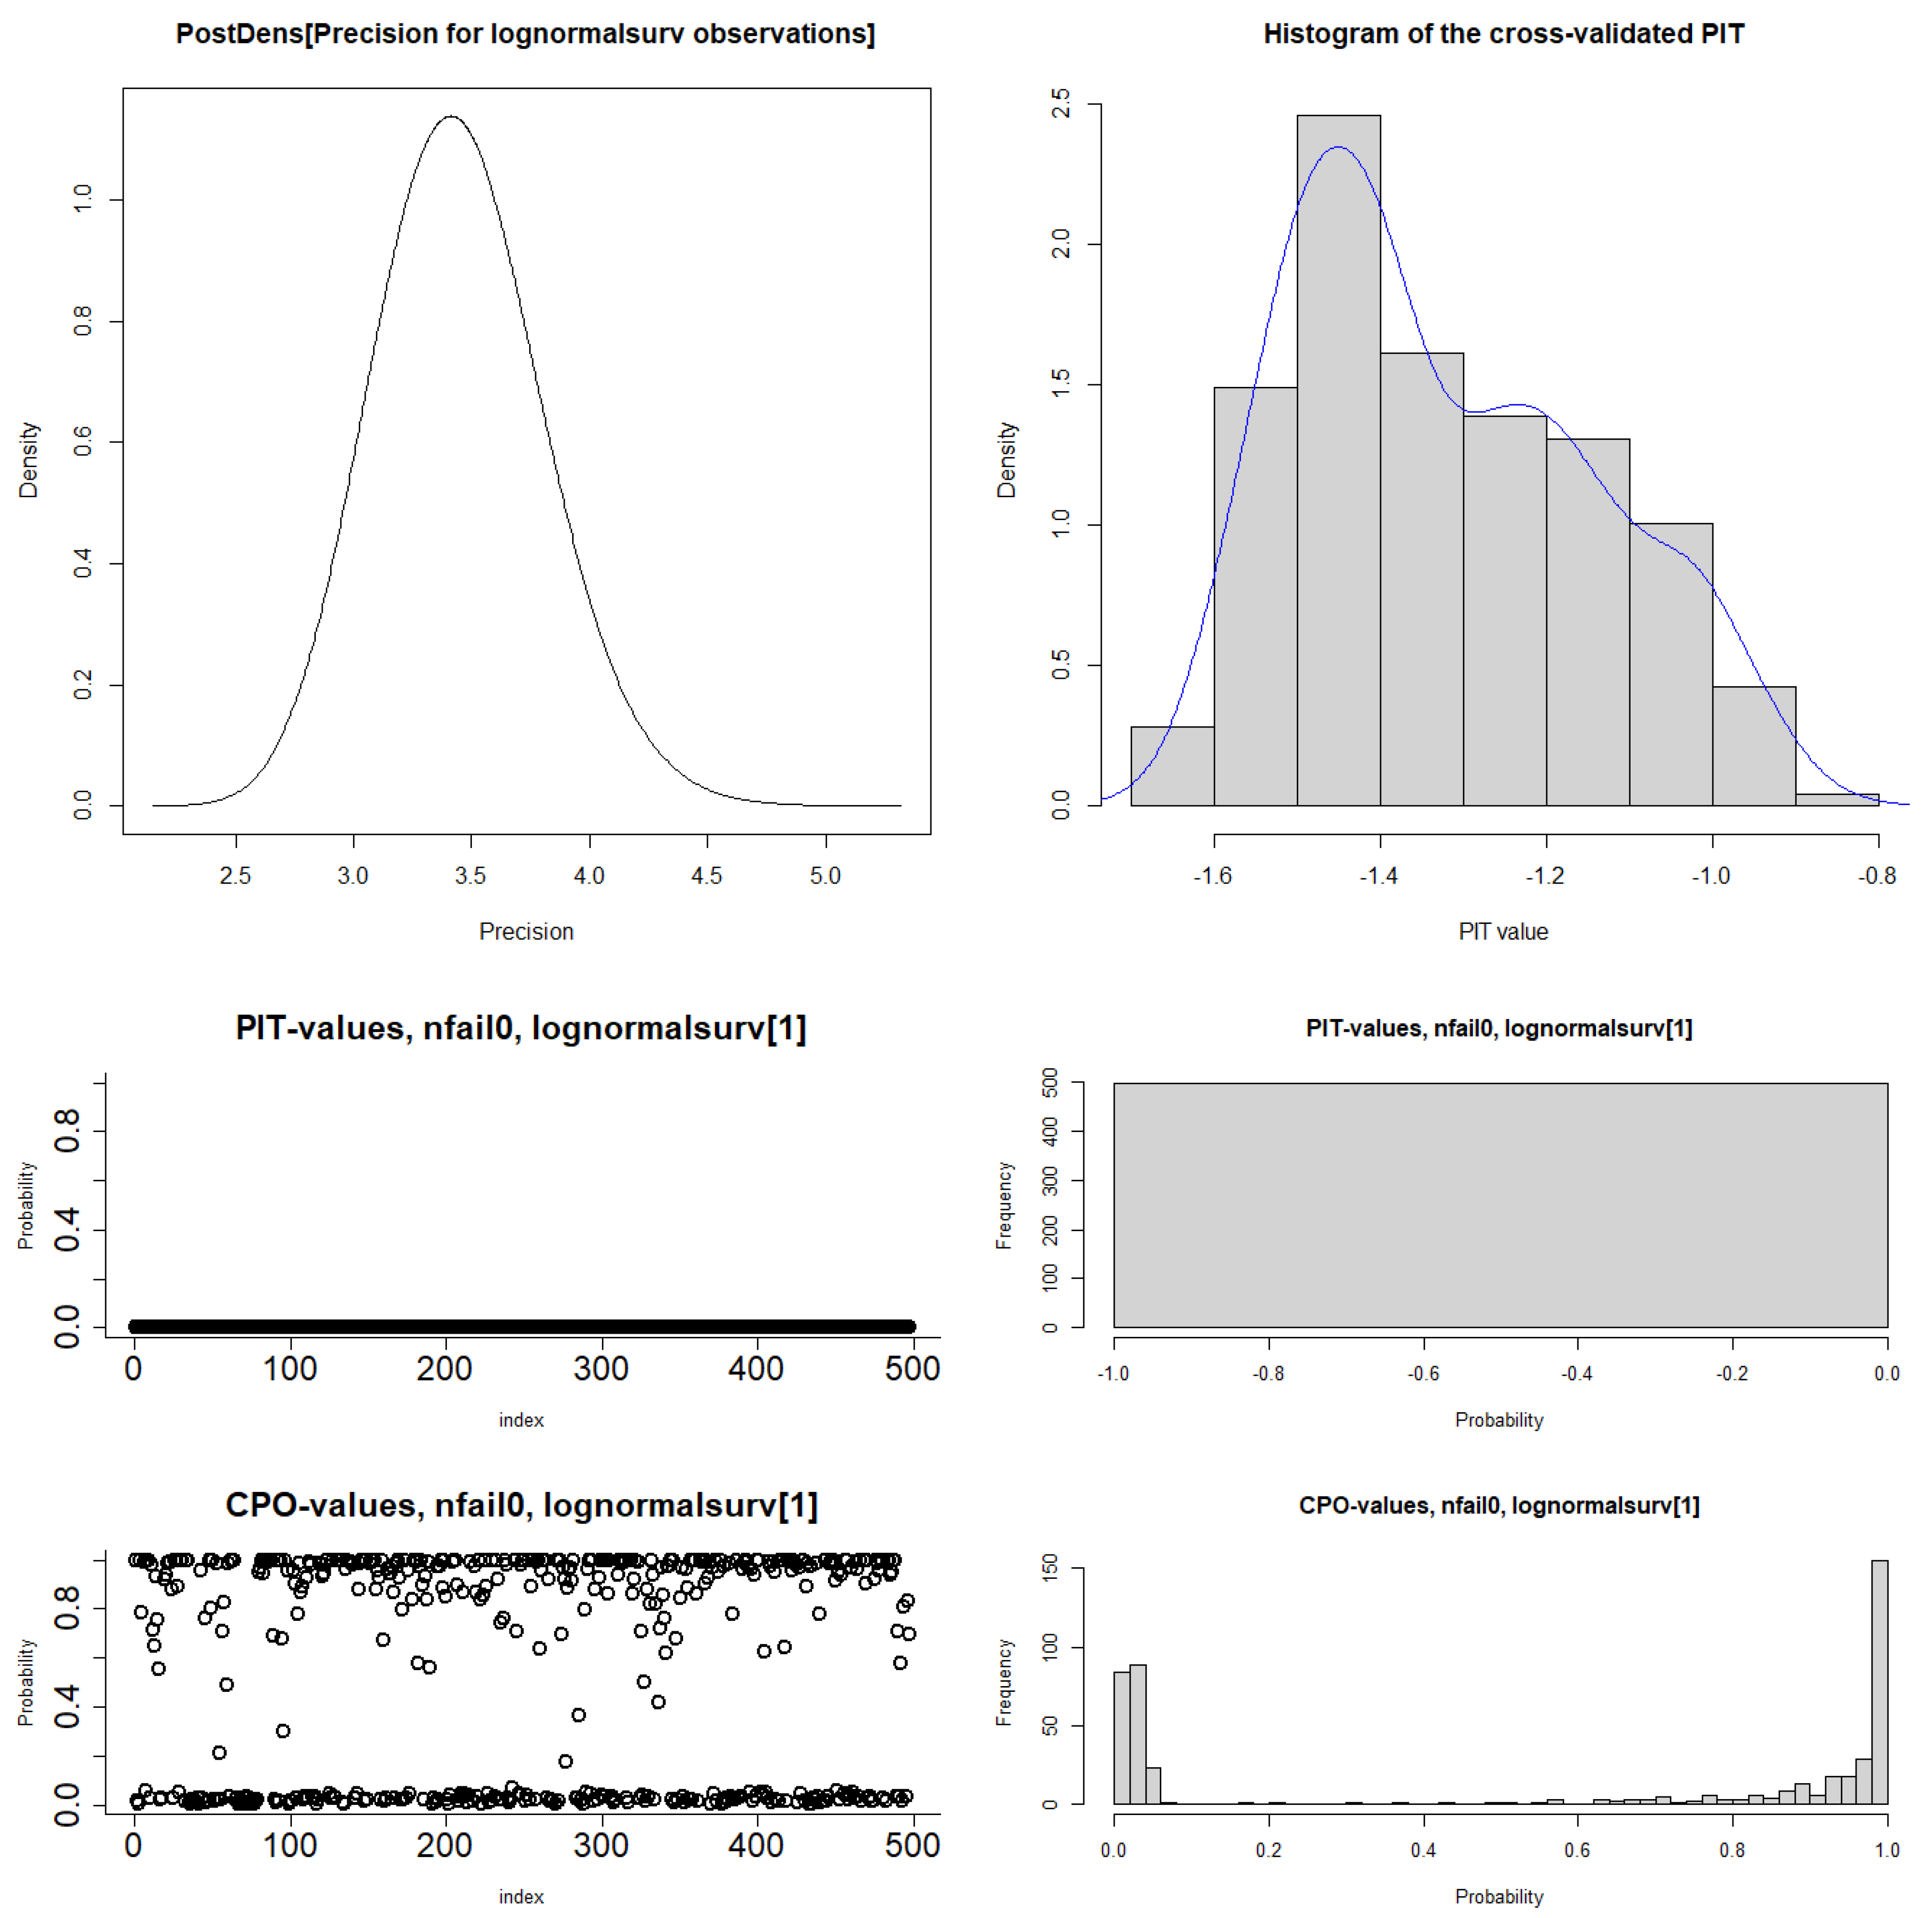

Table 1.
Descriptive summaries of patients for HF data set
| Covariates | Categories | No. of Censored (%) | No. of Death (%) | Total |
|---|---|---|---|---|
| Sex | Female | 180 (59.80) | 88 (44.90) | 268 (53.92) |
| Male | 121 (40.20) | 108 (55.10) | 229 (46.08) | |
| Age | 119 (39.54) | 18 (9.19) | 137 (27.56) | |
| 49-65 | 101 (33.55) | 61 (31.12) | 162 (32.60) | |
| 81 (26.91) | 117 (59.69) | 198 (39.84) | ||
| Alcohol | No | 202 (67.11) | 113 (57.65) | 315 (63.38) |
| Yes | 99 (32.89) | 83 (42.35) | 182 (36.62) | |
| Residence | Urban | 94 (31.23) | 45 (22.96) | 139 (27.97) |
| Rural | 207 (68.77) | 151 (77.04) | 358 (72.03) | |
| History of HF | New | 128 (42.53) | 64 (32.65) | 192 (38.63) |
| HF patient before | 82 (27.24) | 61 (31.12) | 143 (28.77) | |
| Medical OPD | 91 (30.23) | 71 (36.23) | 162 (32.60) | |
| Chronic kidney disease | No | 270 (89.70) | 72 (36.73) | 342 (68.81) |
| Yes | 31 (10.30) | 124 (63.27) | 155 (31.19) | |
| Hypertension | No | 248 (82.39) | 51 (26.02) | 299 (60.16) |
| Yes | 53 (17.61) | 145 (73.98) | 198 (39.84) | |
| Anemia | No | 256 (85.05) | 73 (37.24) | 329 (66.20) |
| Yes | 45 (14.95) | 123 (62.76) | 168 (33.80) | |
| Diabetes mellitus | Not | 247 (82.06) | 36 (18.37) | 283 (56.94) |
| Type I | 21 (6.98) | 54 (27.55) | 75 (15.09) | |
| Type II | 33 (10.96) | 106 (54.08) | 139 (27.97) | |
| Etiology of HF | IHD | 86 (28.57) | 23 (12.19) | 109 (21.93) |
| RVHD | 59 (19.60) | 53 (26.83) | 112 (22.54) | |
| Cardiomyopathy | 65 (21.59) | 52 (25.61) | 117 (23.54) | |
| HHD | 64 (21.26) | 56 (29.88) | 120 (24.14) | |
| Others | 27 (8.97) | 12 (5.49) | 39 (7.85) | |
| Smoking | No | 280 (93.02) | 114 (58.16) | 394 (79.28) |
| Yes | 21 (6.98) | 82 (41.84) | 103 (20.72) | |
| Treatments | Digoxin | 60 (19.94) | 38 (19.39) | 98 (19.72) |
| Spironolactone | 76 (25.25) | 39 (19.90) | 115 (23.14) | |
| Atorvastatin | 77 (25.58) | 60 (30.61) | 137 (27.56) | |
| Others | 37 (12.29) | 19 (9.69) | 56 (11.27) | |
| Combination | 51 (16.94) | 40 (20.41) | 91 (18.31) | |
| Stages of HF | I | 78 (25.91) | 6 (3.06) | 84 (16.90) |
| II | 81 (26.91) | 27 (13.78) | 108 (21.73) | |
| III | 72 (23.99) | 57 (29.08) | 129 (25.96) | |
| IV | 70 (23.26) | 106 (54.08) | 176 (35.41) |
No.: Number; %: Percent; IHD: Ischemic heart disease; RVHD: Rheumatic valvular heart disease; and HHD: Hypertensive heart disease. Source: JUMC, Jimma, Ethiopia; from July 1, 2015, to January 1, 2019.
Table 2.
Comparison of Bayesian AFT models without and with gamma frailty.
| Distributions | Bayesian AFT models | Bayesian AFT models with frailty | ||
|---|---|---|---|---|
| DIC | WAIC | DIC | WAIC | |
| Exponential | 1808.093 | 1801.966 | 1799.099 | 1790.696 |
| Log-normal | 1616.099 | 1615.184 | 1608.812 | 1607.838 |
| Weibull | 1642.971 | 1642.486 | 1616.210 | 1617.387 |
| Log-logistic | 1654.036 | 1651.165 | 1619.731 | 1616.926 |
Table 3.
Results for Bayesian log-normal shared gamma frailty model
| Covariates | Categories | Pmean () | SD | CrI for | KLD | |
|---|---|---|---|---|---|---|
| Intercept | 5.14 | 0.456 | 0 | |||
| Age | Ref | |||||
| 49–65 | -0.307 | 0.121 | 0.7357 | [0.580, 0.931]* | 0 | |
| -0.361 | 0.116 | 0.6969 | [0.554, 0.873]* | 0 | ||
| History of HF | New | Ref | ||||
| HF patient | 0.183 | 0.103 | 1.2008 | [0.983, 1.469] | 0 | |
| Medical OPD | 0.243 | 0.101 | 1.2751 | [1.046, 1.559]* | 0 | |
| CKD | No | Ref | ||||
| Yes | -0.411 | 0.077 | 0.6630 | [0.569, 0.769]* | 0 | |
| Hypertension | No | Ref | ||||
| Yes | -0.312 | 0.079 | 0.7320 | [0.626, 0.855]* | 0 | |
| Etiology of HF | IHD | Ref | ||||
| RVHD | -0.327 | 0.121 | 0.7211 | [0.568, 0.913]* | 0 | |
| Cardiomyopathy | -0.280 | 0.116 | 0.7558 | [0.602, 0.948]* | 0 | |
| HHD | -0.299 | 0.119 | 0.7416 | [0.586, 0.936]* | 0 | |
| Others | -0.393 | 0.166 | 0.6750 | [0.487, 0.933]* | 0 | |
| Smoking | No | Ref | ||||
| Yes | -0.175 | 0.077 | 0.8395 | [0.721, 0.976]* | 0 | |
| Stages of HF | I | Ref | ||||
| II | -0.457 | 0.173 | 0.6332 | [0.449, 0.888]* | 0 | |
| III | -0.352 | 0.164 | 0.7033 | [0.509, 0.968]* | 0 | |
| IV | -0.446 | 0.160 | 0.6402 | [0.467, 0.875]* | 0 | |
| Diabetes mellitus | Not | Ref | ||||
| Type I | -0.443 | 0.117 | 0.6421 | [0.509, 0.806]* | 0 | |
| Type II | -0.551 | 0.105 | 0.5764 | [0.468, 0.706]* | 0 | |
| Anemia | No | Ref | ||||
| Yes | -0.169 | 0.073 | 0.8445 | [0.729, 0.974]* | 0 | |
| Pre lognormal surv | Shape | 3.45 | 0.364 | 31.5 | [15.958, 67.356]* | |
| Pre Res | Frailty | 0.0264 | 0.0199 | 1.0268 | [1.00598, 1.625]* |
* indicates statistically significant. : Acceleration factor; : Coefficient of parameters; Pmean: Posterior Mean; CKD: Chronic Kidney Disease; IHD: Ischemic Heart Disease; RVHD: Rheumatic Valvular Heart Disease; HHD: Hypertensive Heart Disease; SD: Standard Deviation; CrI: Credible Interval for ; KLD: Kullback-Leibler Divergence. Source: JUMC, Jimma, Ethiopia; from July 1, 2015, to January 1, 2019.
Disclaimer/Publisher’s Note: The statements, opinions and data contained in all publications are solely those of the individual author(s) and contributor(s) and not of MDPI and/or the editor(s). MDPI and/or the editor(s) disclaim responsibility for any injury to people or property resulting from any ideas, methods, instructions or products referred to in the content. |
© 2024 by the authors. Licensee MDPI, Basel, Switzerland. This article is an open access article distributed under the terms and conditions of the Creative Commons Attribution (CC BY) license (http://creativecommons.org/licenses/by/4.0/).
Copyright: This open access article is published under a Creative Commons CC BY 4.0 license, which permit the free download, distribution, and reuse, provided that the author and preprint are cited in any reuse.


