Submitted:
20 August 2024
Posted:
21 August 2024
You are already at the latest version
Abstract
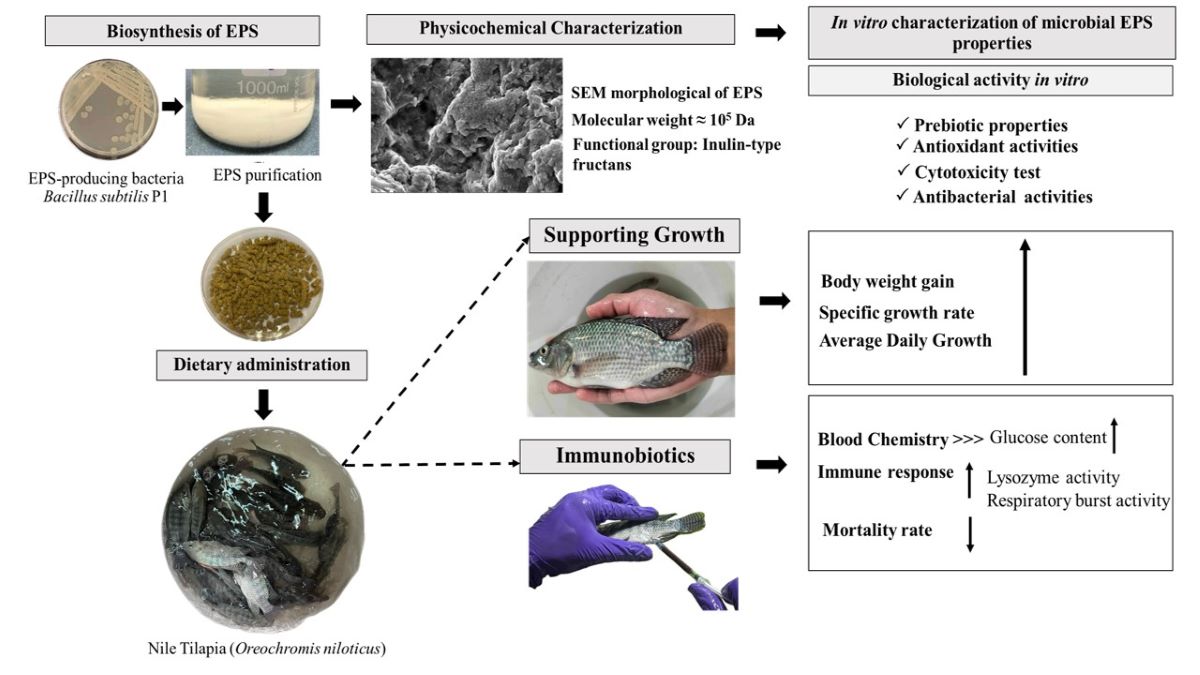
Exopolysaccharide (EPS)-producing bacteria were isolated from the intestines of freshwater fish as prebiotics. Among the isolates, Bacillus sp. P1 was the potent EPS producer with a high EPS production and was then identified as Bacillus subtilis P1 based on 16S rRNA and biochemical characteristics. The produced microbial EPS was characterized its functional groups by FTIR, showing a 90.20% correlation to inulin while the EPS molecular weight was approximately 105 Da with a high PDI (>1.5). Moreover, the EPS from B. subtilis P1 was assessed for prebiotic properties by growing probiotic bacteria and the significant cell growth occurred in sugar-free TSB with 0.5% EPS (p<0.05). EPS exhibited approximately 55.37% DPPH radical scavenging at 20 mg/mL and inhibited certain fish pathogens at 400 μg/mL (10-13 mm inhibition zone). EPS cytotoxicity was confirmed (<1% hemolysis) prior to use as immunobiotics in Nile Tilapia (Oreochromis niloticus) diet supplementation. Nile tilapia growth and immune response were monitored after feeding with control (C): Basal Diet (BD) and treatment (T): BD + EPS 5 g/kg. In the T-group, WG, %SGR, and ADG significantly increased compared to control (p<0.05) by week 4th, with no negative effects on blood chemistry parameters. Lysozyme activity and respiratory burst activity in T-groups were significantly higher than control (p<0.05), with a 50% RLP survival rate of Nile Tilapia challenged with Aeromonas veronii in the T-group within two weeks. On the other hand, for the proximate analysis revealed higher protein content in the T-group. These findings suggest that EPS from B. subtilis P1 in fish diets efficiently supports fish growth and stimulates innate immune responses in Nile Tilapia, thus showing potential as the immunobiotics for aquaculture.
Keywords:
Prebiotics
; Exopolysaccharide
; Bacillus sp.
; Biological activities
; Nile Tilapia (Oreochromis niloticus)
1. Introduction
Tilapia farming, particularly Nile tilapia (Oreochromis niloticus), plays a vital role in Thailand's aquaculture sector. Nile tilapia stands out as the most economically crucial freshwater fish, boasting an annual production exceeding 210,000 metric tons and has a market value over USD 300 million [1]. However, the intensive culture systems has raised concerns about potential negative impacts on fish health and water quality, particularly, disease outbreaks in the aquaculture industry. The most common bacterial disease outbreaks are Motile Aeromonas Septicaemia (AMS) [2,3,4]. At present, a range of methods such as synthetic chemicals and antibiotics, are applied for disease control. Nevertheless, the use of these chemotherapeutic agents has been associated with negative effects including residue accumulation and the emergence of drug resistance. Hence, the adoption of prebiotics presents an alternative strategy for sustaining healthy aquaculture systems. Prebiotics demonstrate immunomodulatory and/or immunostimulatory properties, contributing to the production of high-quality and safe aquatic products [3,4,5,6,7]. Prebiotics are non-digestible food ingredients that exhibit favourable effect on the host by stimulating growth activity and/or activity of beneficial bacteria in the gastrointestinal (GI) tract or a limited number of bacteria in the colon and thus improves host health [8]. It was reported that prebiotics can modify the GI tract microbial community, in turn enhance the non-specific immune responses, increase fermentation products, improve mineral uptake and enhance livestock performance indices such as protein efficiency ratio, feed conversion ratio as well as improve disease resistance [2,3,4,5]. Microbial Exopolysaccharide (EPS) is one of the potent prebiotics secreted by microorganisms with a variety of functional groups that cannot be found in animals and plant polysaccharides and are also regarded as being affordable, safe, and biodegradable [9,10,11]. Moreover the microbial EPS can be formulated under precise constraints with enduring stability in the GI tract to enrich the colonization of useful microorganisms [12], robust operability, high reproductive efficiency, and superior performance [13]. Notably, although EPS possesses the biological activities [10,11,14,15] including antibacterial activities [13,1618],antioxidant activities [15,18,19,20],and immunomodulatory activities[10,13], the application of the microbial EPS as fish immunomodulatory and/or immunostimulatory agents has been few reports [13]. Recent studies by Mahdhi et al.(2020)demonstrated the supplementation of the EPS produced from probiotics e.g. Lactobacillus plantarum and Bacillus strain (HM117830), showing anti-bacterial, anti-biofilm and antioxidant activities, in fish diet had significantly enhanced the expression of immune-associated genes in the head-kidney and the liver of European sea bass (Dicentrarchus labrax L.) [17] while in Nile tilapia (O. niloticus) was newly found that the EPS from Bacillus tequilensis PS21 exhibited an antioxidant activity and antimicrobial activity toward pathogenic bacteria by significantly increased fish survival post-challenge with Streptococcus agalactiae [13], in addition, EPS from Bacillus licheniformis Dahb1 was able to enhance the antioxidant response, lowered the death rate and improved the disease resistance in Oreochromis mossambicus [12]. However, at present the commercial use of microbial EPS is limited by low production yields during fermentation, the challenge is to improve productivity and produce the EPS possessed the desired structure and size affecting their functionality [9,21,22,23,24]. In this study, we examined the potential of microbial EPS produced from the new bacterial isolates from freshwater fish intestines by identification of a strain that produces the highest amount of EPS as well as determined the EPS optimal medium compostions, then the physiochemical of the produced EPS such as its molecular weight and its functional groups were characterized. Finally, the microbial EPS immunological activity were in vitro evaluated by investigation of its antibacterial, antioxidant, and prebiotics properties as well as the cytotoxicity was examined before supplementation in fish diet in Nile Tilapia (O.niloticus) as the immunobiotic agents for supporting the fish growth and stimulating their innate immune responses.
2. Materials and Methods
2.1. Screening and Isolation of EPS-Producing Bacteria from Freshwater Scaled Fish Intestine
Five local freshwater scaled fish species such as Oreochromis niloticus (Linnaeus, 1758), Notopterus notopterus (Pallas, 1769), Oxyeleotris marmorata (Bleeker, 1852), Pristolepis fasciata (Bleeker, 1851), and (Hampala macrolepidota (Kuhl & Van Hasselt, 1823) were obtained from a natural freshwater lake in Khuan Khanun district, Phatthalung, Southern Thailand (coordinates: 7°47'20.0"N 100°09'13.4"E). Their intestines were aseptically dissected, followed by dilution of the samples with 0.85%(w/v) NaCl. Then, the diluted samples were plated on de Man, Rogosa, Sharpe (MRS) agar and Trypticase Soy Agar (TSA) supplemented with amphotericin B for the isolation of lactic acid bacteria (LAB) and Bacillus spp., respectively. The cultures were then incubated at 28±2°C for 24-48 hours under anaerobic conditions for LAB, while Bacillus spp. were aerobically incubated. The obtained isolates were subjected to Gram staining and biochemical examination based on Bergey’s manual. Notably, LAB exhibited catalase-negative and non-spore-forming characteristics [25]. In addition, the quantitative analysis of EPS formation was measured using crystal violet staining of the attached cells [25,26]. To initially determine the EPS production, an overnight bacterial culture with an approximate OD600 of 1.0 was inoculated with a 10% (v/v) inoculum into MRS broth or Trypticase Soy Broth (TSB) supplemented with 2% (w/v) glucose in sterilized glass tubes. The tubes were then incubated at 30°C for 3 days, the bacterial attachment was measured using crystal violet staining. In brief, the attached cells were stained with 1% (w/v) crystal violet for 20 min and then de-stained with 95% (v/v) ethanol followed by measurement the optical density at 595 nm [27,28]. The EPS formation of all isolates were compared according to the intensity of crystal violet staining (method modified from Todhanakasem et al. [28].
2.2. Exopolysaccharide Production, Purification and Quantification
The bacterial isolates were cultivated in MRS broth or TSB and were then adjusted the concentration to 1x10⁸ CFU/mL prior transferred 5 mL of inoculum into 50 mL EPS-optimum medium supplemented with 20 g/L sucrose (modified from Liu et al.[29]). The bacterial culture was incubated at 30°C for 72 hours before harvested by high-speed centrifugation (15,000 x g for 30 min at 4°C). The cell-free supernatant was then collected and further precipitated in three volumes of ice-cold 96% ethanol and allowing the mixture to stand at 4°C for overnight. The precipitated EPS was then separated by centrifugation again. The resulting EPS pellet was suspended in ultrapure water and dialyzed against ultrapure water using a 10kDa cut-off cellulose membrane for 48 hours under stirring. The retentate was freeze-dried using a freeze-drier (Christ Delta 2-24 LSC plus, Germany) [9]. The yield (%) of EPS can be calculated by the weight of EPS produced divided by dry cell weight and expressed as percentage [9,30].
2.3. EPS Characterization of the Purified EPS
2.3.1. Molecular Mass Determination
The average molecular mass of the purified EPS was analyzed by Gel Permeation Chromatography (GPC) with TSKgel SuperHM-N columns (Tosoh Bioscience LLC). The EPS was eluted with 0.1 M sodium nitrate (NaNO3) at a flow rate of 0.35 mL/min at 40°C. Detection was carried out using a refractive index detector (RI) and a multi-angle laser-light scattering detector [31].The linear regression was calibrated using high molecular weight polystyrene standards (Sigma-Aldrich).
2.3.2. Functional Groups Determination
The chemical structural characterization of the bacterial EPS was examined using Fourier transform infrared (FTIR) spectroscopy to determine the distribution of functional groups. The pellets were prepared by mixing and compressing the freeze-dried EPS samples with KBr powder (in a ratio of 5:100 w/w). FTIR spectra were recorded in transmittance mode over a spectral range of 4000 to 400 cm-1, with an accumulation of 15 scans and a resolution of 4 cm-1with Fourier Transform Infrared Spectrometer (VERTEX 70, Bruker, Germany). Band identification was compared with known standard compounds such as inulin from chicory, dextran from Leuconostoc spp., and levan from Erwinia herbicola (Sigma-Aldrich). [13,31].
2.3.3. Monosaccharide and Oligosaccharide Determination
The monosaccharide composition analysis was performed according to the method described by Sutthi et al.[13]. A sealed tube containing 5 mL of 2 M trifluoroacetic acid (TFA) was employed to hydrolyze 100 mg of microbial EPS at 100°C for 6 hours followed by neutralization with 1 N NaOH, the hydrolysate was then filtered using a 0.22 μm syringe filter. Subsequently, the High-performance liquid chromatography (HPLC) was then analyzed for the EPS compositions by LC-20 AD system (a RID-10 A refractive index detector, Shimadzu, Japan) with an Aminex HPX-87H column (Bio-Rad, USA). The column was maintained at 65°C and the mobile phase used was 0.005 M H2SO4 with a flow rate of 0.5 mL/min for 40 min, the monosaccharide and oligosaccharide were finally identified using a UV detector, referencing sugar standards.
2.3.4. Scanning Electron Microscopy (SEM) Analysis
About 5 mg of lyophilized EPS sample, obtained from the cell-free supernatant culture of Bacillus sp. P1, was affixed to the SEM stub, then coated with a gold layer approximately 10 nm thick on both sides. The SEM image was taken at 3.0 kV using a scanning electron microscope (FEI Quanta 450 FEG).
2.4. Optimization Condition of EPS Production from the Selected Strain
Five EPS production media formulations as mentioned by the previous studies [21,22,23,24,29] containing the various types and different amount of carbon and nitrogen and/or supplementation with amino acid, minerals and vitamins were compared their EPS production efficiency to obtain the suitable and optimum formulation. Moreover, to achieve a maximum EPS yield (the response value (Y)), medium composition e.g. carbon content and nitrogen content sucrose (X1: 20-40 g/L), yeast extract (X2: 0.5-1.5 g/L), and (NH4)2SO4 (X3: 5-15 g/L) were optimized using the response surface methodology (RSM) with Box–Behnken design (BBD) [22]. Three factors and three levels were used for fitting a second-order response surface to generate 17 experimental runs comprising five central points. Regression analysis was performed on the data obtained using Design Expert software (Version 12). ANOVA analysis of predicted model was carried out to estimate its statistical significance. The quality of the fit polynomial model was expressed by the coefficient of determination regression (r2), and its statistical significance was tested by the F-test. Model terms were accepted or rejected based on the p-value (probability) with a 95% of confidence level.
2.5. Bacterial Identification
The identification of the bacterial isolate was conducted based on nucleotide sequencing of the 16S rRNA gene and biochemical characteristics using the API-50 CHB/API-20NE kit (bioMérieux, France). For 16S rRNA gene identification, the genomic DNA from Bacillus sp. P1 was extracted by the DNA Extraction Kit (Vivantis Technologies, Malaysia), followed by PCR amplification. In short, the 16S rRNA gene was amplified using universal primers, 27F (5’-AGAGTTTGATCCTGGCTCAG-3’) and 1492R (5’-GGTTACCTTGTTACGACTT-3’). The PCR cycle comprised an initial denaturation step at 95°C for 3 min, followed by 30 cycles at 95°C for 1 min, 55°C for 1 min, and 72°C for 1 min, with a final extension at 72°C for 5 min. Finally, the obtained sequence alignment was conducted using MEGA-X, and cross-referencing by BLAST against sequences in the GenBank database to identify its species. Phylogenetic trees were then constructed using the neighbor-joining method [26,29]. Furthermore, the biochemical characteristic e.g. carbohydrate utilization and certain enzyme production was conducted to confirm species identification by API-50 CHB/API-20NE test kit (bioMérieux, France). The method for assay following to the protocol provided by the manufacturer. The data were interpreted using ApiwebTM (bioMérieux), available at https://apiweb.biomerieux.com/
2.6. In vitro Biological Activity
2.6.1. Prebiotic Properties
The prebiotic properties of the produced EPS were determined by examining its effect on the growth of probiotic strains Bacillus amyloliquefaciens NL1.2, isolated and confirmed its probiotic properties by Khongkool and co-workers [32]. For this purpose, the strain was cultivated at 35°C under aerobic conditions in TSB for 24 hours. To evaluate the prebiotic effect of EPS, sugar-free TSB (pH 7.0) was prepared, and 0.5% (w/v) EPS from Bacillus sp. P1 was used as a carbon source. The pre-culture of the probiotic strain B. amyloliquefaciens NL1.2 was adjusted to a concentration of 108 CFU/mL beforehand and then inoculated into TSB supplemented with the EPS while sugar-free TSB was served as the negative control. Changes in cell density were monitored in a multi-plate reader at 600 nm for 24 hours [26,33].
2.6.2. EPS Antioxidant Studies
Various concentrations (0.625, 1.25, 2.5, 5.0, 10, and 20 mg/mL) of the purified EPS sample were prepared for DPPH radical scavenging activity. To elaborate, 2 mL of deionized water and 2.0 mL of DPPH solution (0.16 mM) were added to 1.0 mL of the different concentrated EPS samples as above. The mixture was then incubated at 37°C in the dark for 30 min, followed by measurement of an absorbance at 517 nm [19,23]. The radical scavenging activity of EPS was performed by using the equation given below.
where; A0 is the DPPH solution without sample and A1 refers to the solution containing samples in different concentrations (0.625, 1.25, 2.5, 5.0, 10, and 20 mg/mL).
DPPH Radical scavenging (%) = [(A0 -A1)/A0] × 100
2.6.3. Antibacterial Activity Studies
The agar well diffusion assay was performed to assess the antibacterial activity of the bacterial EPS. This activity was tested against a panel of fish pathogens, including Aeromonas veronii, Aeromonas hydrophila, Streptococcus agalactiae, and Edwardsiella ictaluri. Each bacterial culture was adjusted to 108 CFU/mL, and then swabbed on TSA plates. The wells with a diameter of 6 mm were corked and filled with 50 μL of various EPS concentrations ranging from 50 to 400 μg/mL. The plates were then incubated at 35°C for 24-48 hours. DMSO was used as a negative control. After incubation, the diameters of growth inhibition were measured in millimeters (mm). Data were presented as mean ± SD. Four levels of inhibition intensity were categorized based on the inhibition zone: weak (<5 mm), moderate (5-10 mm), strong (10-20 mm), and very strong (>20 mm) [34,35].
2.6.4. Cytotoxicity of EPS by Hemolytic Test
Hemolytic activity of the EPS from Bacillus sp. P1 was evaluated as described by Abinaya et al. [36]. 100 μL of 3.8 %(w/v) sodium citrate was gently mixed with 900 μL of fish blood to prevent blood coagulation. The sample was then centrifuged at 3,000×g for 10 min and the resulting pellet containing red blood cells (RBCs) was washed three-times with 10 mL of PBS (pH 7.4), followed by uniformly suspended in PBS. A mixture of 2 mL of erythrocyte suspension with EPS at varying concentrations (0.25, 0.50, 1.0, 2.5, and 5.0 mg/mL) was added and gently inverted. Subsequently, the mixtures were incubated at 37°C for 1 hour, with PBS used as a control. After incubation, the samples were centrifuged again to pellet the RBC. The supernatant was then collected and measured an absorbance at OD540. The percentage of hemolysis was calculated as follows:
Hemolysis (%) = [(Asample - Ablank)/ Acontrol] x 100
2.7. Experimental Animal
2.7.1. Acclimatization of Oreochromis niloticus Linn.
Oreochromis niloticus Linn. (Nile tilapia) with average weight: 20 ± 1.5 g was obtained from Phatthalung Inland Fisheries Research and Development Center, Phatthalung, Thailand and was prior acclimatized for 2 weeks before the feeding trial. According to the method of Ibrahem et al. (2010) [2] and Gobi et al. (2018) [18], The fish were sustained in a 100 liter FRP tank and provided with a commercial feed (ad libitum) twice a day. Water temperature was maintained at 28±2°C, pH at 7.0, and DO at 6.63 ± 7.78 mg/L.
2.7.2. Experimental Fish Diet Formulation
The Basal fish diet formulation used in this study as a control was modified from the formulation as described by Figueiredo-Silva et al.[37] containing about 30% protein content and the ingredients were as followed (g/kg): fish meal (30); soybean meal (420); ground poultry by-product (70); wheat gluten (20); DL-methionine (3.6); L-lysine (3.8); L-threonine (0.6); rice flour (202.6); rice bran (155); rice hull (2.4); soybean oil (23.5); vitamin premix (5); mineral premix (5); Ca2HPO4 (35); and vitamin C (0.6). All the ingredients were ground and sieved through fine mesh sieve (60 mesh) prior mixed thoroughly by 20 liter stand food mixer (EM20, Spring Green Evolution) while in the treatment formulation, those basal diet was mixed homogeneously with EPS from B. subtilis P1 at the concentration of 5.0 g/kg as recommended by Ibrahem et al. [2]. The mixtures were then pelleted by using animal feed pellet machine (model 150, SIF machinery) with 3 mm diameter of the pellet mold. The fish diet pellets were then dried at 55-60°C for 16 -18 h before being stored at 4°C.
2.7.3. Experimental Design and Sample Collection
Fish were randomly selected and divided into two groups: a control group (C) and a treatment group (T), each with three replicate tanks. Each tank housed 25 fish and was equipped with aeration and filtration systems, with daily monitoring of water parameters (temperature, dissolved oxygen (DO), and pH). Both groups were fed twice daily (ad libitum) for a duration of 6 weeks. Growth performance was examined at 2rd week and 6th week. Additionally, blood and serum samples were collected to analyze the humoral immune parameters and antioxidant activities [33]. Briefly, approximately 1 mL of fish blood was drawn from caudal puncture, and was then transferred to a heparinized vacutainer tube. The tube was then centrifuged at 5,000 × g for 10 min, and the resulting serum was stored at -20°C for further analysis [36].
2.8. Growth performance parameters
The growth performance parameters was determined at 2,4 and 6 weeks including weight gain (WG; g), average daily weight gain (ADG; g/day), specific growth rate (SGR; %/day), and feed conversion ratio (FCR) were calculated as follows:
WG (g) = Final weight (FW) - initial weight (IW0)
ADG (g/day) = [Final weight (FW) - initial weight (IW0)]/days
SGR (%/day) = 100 x [Ln (FW) – Ln (IW0)]/days
FCR (g) = [Feed intake (g) / Weight gain (g)
All the calculations were an average per fish tank and an average per each fish for WG and ADG.
2.9. Measurement of Immune Response Parameters
2.9.1. Lysozyme Activity
Serum lysozyme activity was measured using colorimetric method [38]. In a cuvette, 3 mL of Micrococcus luteus suspension in phosphate buffer (with an absorbance at 450 nm ranging from 0.5 to 0.7) was prepared, into which 50 μL of diluted serum sample was added. The suspension was thoroughly mixed for 15 sec, and readings were taken using a spectrophotometer at 450 nm. The bacterial lysis readings were recorded immediately at 2 min intervals for 20 min. A unit of lysozyme activity was defined as the amount of sample resulting in a reduction of an absorbance of 0.001 per min, and lysozyme activity is expressed as units of enzyme per min.
2.9.2. Respiratory Burst Activity
Nitroblue tetrazolium (NBT) assay was performed as mentioned by [39,40,41]. Briefly, 100 μL of blood was added into the wells of 'U'-bottom micro-titer plates and incubated at 37°C for 1 hour to facilitate cell adhesion. After incubation, the supernatant was discarded, and the loaded wells were washed three times with PBS. Following washing, 100 μL of 0.2% (w/v) NBT was added, and the plate was incubated for another 1 hour. Subsequently, the cells were treated with 100% methanol for 2–3 min and washed with 70% methanol for three times. The plates were then air-dried, after that a solution containing 60 μL of 2 N KOH and 70 μL of DMSO was added to each well to produce the formazone blue precipitate. The OD of the turquoise-blue solution was measured at 630 nm. This notable color change can be easily quantified with a standard plate reader, and since the absorbance of the solution correlates directly with the amount of superoxide produced, absorbance can be used to estimate respiratory burst activity [40].
2.9.3. Total Immunoglobulin
Total immunoglobulin (Ig) was estimated by the modifications described by Sewaka et al.[42]. Using this method, immunoglobulin was precipitated out of the plasma with polyethylene glycol and the remaining protein of the plasma was determined. The total immunoglobulin was calculated by subtracting the total plasma protein concentration from the remaining protein in the plasma concentration.
2.10. Measurement of Serum Biochemical Parameters
The obtain serum samples were analyzed by using an automate chemistry analyzer (AU400, Olympus, Japan). The following parameters were measured: glucose, cholesterol, total protein, albumin, blood urea nitrogen (BUN), total bilirubin (T-bilirubin), direct bilirubin (D-bilirubin), serum alanine transaminase (ALT) and serum aspartate aminotransferase (AST).
2.11. Challenge Test
Six-week-old fish from each group, totalling ten individuals, were randomly transferred to a FRP tank for 6 hours. Subsequently, they were exposed to a challenge with a reference fish pathogenic strain of A. veronii, which had been previously assessed for its pathogenicity with a lethal dose (LD50) of 108 CFU/mL. A bacterial suspension was prepared by culturing the strain in TSA for 24 hours, followed by suspension in sterile saline solution (0.85%) and adjustment to a concentration of 108 CFU/mL that was equivalent to 0.5 McFarland standard bacterial suspension turbidity using the Densichek instrument. The fish were then artificially infected via intra-peritoneal injection with 0.25 mL of the microbial suspension of A. veronii (modified method according to Ibrahem et al. [2]). The relative level of protection (RLP) among the challenged fish was determined using these following equation:
RLP % = 1 - (% of mortality in treated groups/% of mortality in control group) x 100
2.12. Statistical Analysis
All experiments were performed in triplicate and were reported as means ± standard error (SE). Differences of the treatments determined through an independent sample T-test and one-way analysis of variance (ANOVA) followed Tukey’s test, in which P-values less than 0.05 were considered statistically significant by using SPSS software, Version29 (SPSS Inc., USA).
3. Results and Discussion
3.1. Screening and Isolation of EPS-Producing Bacteria
A total of 66 bacterial isolates were obtained from the intestines of local freshwater scaled fish. Out of these, only 30 isolates exhibited distinct mucoid colonies on MRS or TSA supplemented with 2.0% (w/v) sucrose and were consequently classified as Lactobacillus spp. for 7 isolates, while the remaining 23 isolates were identified as Bacillus spp. based on morphological and biochemical tests, such as the catalase test. To assess the EPS production of each isolate, the selected bacterial colonies were cultured in MRS or TSB with the addition of 2.0% (w/v) sucrose overnight. Following this, the development of EPS attachment under static conditions for 3 days allowed for the quantification of EPS production, which was measured using the crystal violet staining method, as previously described by Todhanakasem et al.(2018) [28]. The EPS formation of all isolates were compared based on the intensity of crystal violet staining [27,28,43]. The results demonstrated that only 4 from 7 isolates of Lactobacillus spp. and 10 from 23 isolates of Bacillus spp. produced the relatively high EPS amount with an OD595 above 2.0, in the range of 2.21±0.08 to 2.85±0.34. These results agreed with the reports of Bacillus subtilis J1 and Bifidobacterium animalis J28 that were strong EPS producers with a production ability of 1.71±0.21 to 1.80±0.68 [44] while Acinetobacter and Bacillus isolated by Lim et al.2023 [27] exhibited an absorbance range of 0.02–4.16 and 0.03 to 12.77, respectively when grown in BHI at 25°C for 24 h. These can be explained that at the higher absorbance seems to produce high amount of EPS owing to crystal violet is a cationic dye, it can bind to negatively charged bacteria and polysaccharides of the EPS. The amount of dye solubilized by the solvent such as ethanol is directly proportional to EPS production [28,43]. After that, all 14 potential EPS-producing strains were then cultivated in EPS liquid medium containing 20 g/L sucrose as a carbon source [29] under aerobic condition at 30°C with shaking of 180 rpm for 48 h to quantify the exact amount of EPS production. Figure 1 showed the highest percentage EPS yield of 86.19 produced from Lactobacillus sp. B3-1 while in Bacillus spp., the isolate of Bacillus sp. P1 was able to synthesize a maximum EPS up to 1.72 gEPS/gDCW among the other isolates. Therefore, this two isolates were further selected for EPS characterization due to their high EPS-producers. However, the amount of EPS is considerably relied on variation of species and strains, this variation could also depend on the EPS isolation method employed, growth conditions (pH, temperature and incubation time) and medium composition (carbon, nitrogen sources and other nutrients) can directly affect the polymer yield and the sugar composition [10,11,14,31,45].
3.2. Characterization of the Purified EPS
3.2.1. Molecular Mass
After the average molecular mass of the purified EPS was detected by GPC analysis, the results showed that the two EPS-producing strains e.g. Lactobacillus sp. B3-1 and Bacillus sp. P1 had the different EPS molecular mass (Table 1). The molar mass of the EPS produced by each microorganisms varied according to strains, polymer type and the cultivation conditions [9,10,31,44,45]. For example, the molecular mass of the EPS produced by Lb. plantarum C7 was about 33 kDa which was similar to that of the EPS produced from Lb. plantarum EP56 (about 44kDa) [46] but lower than that of the EPS of Lb. plantarum C88 which was up to 1,150 kDa of the EPS of Lb. plantarum C88 [47]. The polydispersity index (Mw/Mn) indicates the extent of heterogeneity within polymer chain lengths. A higher PDI observed in this study signifies a diverse range of polysaccharide chain sizes, suggesting that the EPS may consist of multiple polymers exhibiting variations in monomer composition and molecular mass ratios [9,11,31,48]. It is reported that the average molar mass for hetero-polysaccharides ranges between 4 × 10⁴ to 6 × 10⁶ Da. In this case, the produced EPS from Lactobacillus sp. B3-1 and Bacillus sp. P1 presented an average molar mass in comparison with most of the reports [14,45,49–51].
3.2.2. Functional Groups of EPS and Its Monosaccharide Compositions
FTIR spectroscopy is a powerful analytical method to investigate the nature of the functional groups of the EPS in terms of monomeric units and their linkages [29,31,44]. Figure 2 presented the FTIR spectra of EPS fractions from Lactobacillus sp. B3-1 and Bacillus sp. P1. The EPS spectrum was identified within the range of 4,000 to 400 cm-1 and exhibited numerous peaks. For instance, a broad absorption peak observed at approximately 3,420-3,434 cm-1 indicated the presence of intense hydroxyl groups (O-H) stretching frequency, confirming the polysaccharide nature. Signals at around 2,850 and 2,928 cm-1 were attributed to C-H stretching. Additionally, the stretch vibration of the carboxyl group (C=O) was observed as an absorption peak at approximately 1,600 cm-1, while the symmetric stretching of -COO was noted at about 1,400 cm-1. Furthermore, a weak adoption band around 500 cm-1 suggested the presence of a glycosidic linkage peak for polysaccharides [13,17,29,31]. The EPS produced from Lactobacillus sp. B3-1 exhibited its functional groups highly similar to dextran with 92.25% correlation (Figure 2A) while Bacillus sp. P1 generated EPS that showed the percentage of correlation about 90.20 to inulin (Figure 2B). In this case, the percentage correlation could be converted into the identical match between the sample and standard spectra.
However, both EPS from Lactobacillus sp. B3-1 and Bacillus sp. P1 demonstrated only about 66% correlation to Levan. Dextran is glucose-based polysaccharide synthesized by LAB such as Lb. sakei MN1, composed of a linear chain of D-glucoses linked by α-(1→6) bonds, with possible branches of D-glucose [14,26,52,53]. On the other hand, inulin belongs to fructose-based polymers and is composed mainly of β-D-fructosyl subgroups linked by (2→1) glycosidic bonds [9,16,51]. Bacillus sp. and strains produce a variety of EPS such as levan, β-1,3-glucan, and also heteropolymers [7,10,54]. These finding unlike the previous studies that was found that in most Bacillus spp. tended to produce levan-type EPS e.g. B. subtilis, B. polymyxa, B. licheniformis, B. megaterium [7,29,30,50]. However, in this study, the sugar and its derivative compositions in the EPS produced by Bacillus sp. P1 was further confirmed and found that it was composed of fructose (1.51% w/v) and glucose (0.35% w/v) as major monosaccharides in a ratio of 4:1, in addition, the fructooligosaccharide (FOS) such as kestose (GF2), nestose (GF3), and fructofuranosyl-D-nystose (GF4) were also detected. Thus, this can be indicated that the EPS produced from Bacillus sp. P1 is classified as an inulin-fructan types. The characteristics of EPS in terms of molecular weight and branches depend on the producing strain thus there is a great variety in its properties [50,51]. However, it has been reported that certain lactic acid bacteria can produce homo-polysaccharides (HoPS), which include α-D-glucans like dextran, alternan, and reuteran, as well as β-D-fructans such as inulin and levan. Additionally, some hetero-polysaccharides (HePS) can also be synthesized [26,52]. While in Bacillus spp. has been revealed to produce complex homo-and/or heteropolysaccharides, a variety of EPS such as levan and β(1→3) glucan and hetero-polymers composed mainly of neutral sugar , uronic acid , uncommon sugar , or sugar protein conjugates [54]. It is noteworthy that these variations in functional groups lead to diverse bioactive functions, encompassing immunomodulatory properties, antioxidant activity, antibacterial activity, and various other biological properties [10,11,14,15,50]. In this study, sucrose is utilized as a specific substrate by Bacillus sp. P1 which gets cleaved into glucose and fructose and polymerized into glucan and fructan by glucan sucrase and fructan sucrase. These polymerized HoPs are directly released to the extracellular environment [16].
3.3. Optimization Conditions for EPS Production
Due to the highest EPS yield up to 172% was produced by Bacillus sp. P1 when cultivated in EPS production medium as describes by Liu et al. [29], an optimization of EPS biosynthesis was then performed by using this isolate for larger scale production. Among five formulations of EPS-production media as described by previous studies [21–24,29], the medium consisting of sucrose 20 g, yeast extract 1 g, K2HPO4 8 g, KH2PO4 2 g, MgSO4 • 7H2O 0.5 g, and (NH4)2SO4 10 g per liter as mentioned by Berekaa [22] provided a maximum EPS concentration about 4.13±0.12 g/L with accounted for about 474% EPS yield. The carbon and nitrogen content in medium composition were then optimized by using RSM with a BBD model. The BBD experiment (Table S1) was specifically designed to determine the optimal EPS medium composition for maximizing EPS production from the isolate Bacillus sp. P1. This following quadratic polynomial equation was used to evaluate the EPS yield by multiple regression analysis: % yield EPS = -2902.54875+93.33953 X1 +1485.44450 X2 + 246.05420 X3 -9.32200 X1X2 - 0.621550 X1X3 -19.24500 X2X3 -1.18917 X1²- 441.76600 X2² -11.24076 X3²
The regression model was analyzed by variance analysis (ANOVA) and statistical tests were performed with the F-test shown in Table 2. The F value was 20.23 (p<0.0003) was statistically significant indicating that the model had good simulation, and R2 and correction coefficient R2Adj were 0.9630 and 0.9154, respectively, indicating that the established regression equation had a good degree of fit and could successfully predict the response value. The model data showed the primary term C and the interaction term A², B², and C² had a very significant impact on the EPS yield (p<0.01), and the primary term A and B had a significant impact on the EPS yield (p<0.05).In summary, the order of the significant differences in the influence of the three factors was the concentration of (NH4)2SO4> yeast extract > sucrose.
To visualize the effect of an interaction among those three factors on the EPS yield, the contour plots between each factors and EPS yield were drawn (Figure S1). Finally, the optimal EPS medium composition was predicted to obtain the highest EPS yield about 570% as follows: sucrose, yeast extract, and (NH4)2SO4 were 31.75, 1.13, and 9.14 g/L. To verify the effectiveness of the RSM, those factors were adjusted as 30 g/L sucrose, 1 g/L yeast extract, and 10 g/L (NH4)2SO4 and under these conditions, the EPS yield from Bacillus sp. P1 was 552% (closely to the predicted EPS yield in the range of 522.22-571.43%) when the five groups of parallel experiments at the center point of the response surface was performed thus the experimental results were in good agreement with the predicted results, indicating that the mathematical model was suitable for the simulation of the EPS production by Bacillus sp. P1 in this study. To sum up, after optimization the EPS medium composition i.e. sucrose concentration increase from 20 to 30 g/L and verification of RSM model, it was found that the EPS yield had increased from 474% to 552% that accounted for 16.5% increase. These obtained result was similar to the EPS from B. licheniformis 14580 that had greater EPS yields with increased concentrations of sucrose [55]. According to the literatures, the quantity of EPS produced by different bacterial strains varies significantly, with LAB typically producing the lowest yields, ranging from 0.01 to 2.0 g/L. Lactobacilli, in particular, are among the least prolific EPS producers, typically yielding less than 1.0 g/L, and this production may further decrease under unfavourable culture conditions [50]. Such low yields were attributed to the fact that LAB acidify the culture media to below pH 5.0 causing glycosyl-hydrolase activation which results in enzymatic digestion or hydrolysis of the EPS produced thus significantly affect the final EPS yields [25,38,42,43] in comparison to most of Bacillus species is able to synthesize higher EPS concentration, for example, B. aerophilus rk1 accumulated EPS about 3.73 g/L similar to B. licheniformis QS5 synthesized EPS of 3.78 g/L [22,23] whereas in B. subtilis gave the highest EPS of 4.86 g/L when grown in cane molasses [10] or B. licheniformis 14580 yield about 3.5 g/L of EPS in mineral base-medium with added yeast extract [42]. In this study, after cultivation of Bacillus sp. P1 under the optimal medium, it could synthesize about 4.96 g/L of EPS when cultivated in 30 g/L sucrose. In general, bacterial EPSs are formed in an amount from 0.29 to 65.27–100 g/L depending on their type, the type of microorganism, the cultivation conditions, and bioreactor type [9,24,50,52]. Moreover, the source of carbon and C/N ratio have a significant effect on EPS biosynthesis. The synthesis of bacterial EPS typically demands a high concentration of carbon sources in the culture medium and restricted nitrogen availability. Glucose or sucrose are commonly employed as primary carbon sources due to their ability to provide a substantial carbon yield per molecule. This ensures a considerable amount of carbon is accessible for bacterial growth and EPS production. Additionally, these sugars may serve as inducers or amplify the expression of genes responsible for EPS synthesis in certain bacterial strains [5,28,33,42] especially sucrose has known to be the best substrate to stimulate EPS production [13,42]. Notably, the use of EPS optimum medium for the growth of Bacillus sp.P1 proposed to produce heteropolymers with a higher MW of about 105 Da (as shown in Table 1) similar to the EPS from B. licheniformis 14580 that had a high MW in the range of 30-100 kDa and was confirm to produce heteropolymers [55]. The heterogeneity in the EPS produced by Bacillus spp. is well documented, but the constitutive monomeric units are highly variable in nature and numbers depending on the strain and culture conditions [31,45,55]. The morphology of mucoid colony of Bacillus sp. P1 and its purified EPS, which was examined under SEM, were presented in Figure 3.
3.4. Bacterial Identification
The EPS-producer of Bacillus sp. P1 was then identified its species by 16S rRNA gene analysis. The nucleotide sequence revealed that this strain showed 99.27% homology with Bacillus subtilis NCIB 3610T (ATCC 6051) by phylogenetic analysis thus the isolate was identified as Bacillus subtillis P1 (GenBank accession number PP124894) (Figure S2). Additionally, an analysis of the carbohydrate utilization patterns of B. subtilis P1 by using API-50 CHB/API-20NE kit (bioMérieux, France) was further confirmation the bacterial species and presented in Table S2. The biochemical characteristics of B. subtilis P1 showed about 98% identity to Bacillus subtilis. Finally, the pure culture of Bacillus subtilis P1 was then deposited in culture collection of Thailand Bioresource Research Center (TBRC) under an accession number TBRC 18356. Furthermore, Bacillus subtilis P1 was primarily screening for biosafety by hemolysis assay and the results demonstrated that B. subtilis P1 displayed α -hemolytic activity on sheep blood agar. However, most B. subtilis species are non-pathogenic and are not associated with infections. γ-hemolytic and α-hemolytic strains are remarkable as safe that means the Bacillus species did not show any risk to host [56], in addition, Bacillus subtilis is one of such probiotics that is very well-researched and most widely used probiotics in aquaculture[57].
3.5. In vitro Biological Activity
3.5.1. Prebiotic Properties of the Produced EPS
After 6 h of incubation, the growth of probiotic Bacillus amyloliquefaciens NL1.2 was significantly achieved (p<0.05) when EPS produced from B. subtilis P1 was used as a carbon source rather than in sugar free-TSB. These can be indicated that B. amyloliquefaciens NL1.2 was able to utilize EPS as an energy source. However, the cell density gradually increased and reached a maximum at 18 h of cultivation, then the cells were maintained at certain level and was likely to decrease along the stationary phase while in the cells growing in sugar free-TSB was distinctly drop after 24 h (Figure 4A). These may explain that probiotic B. amyloliquefaciens NL1.2 enters sporulation due to the depletion of carbon source which is the main stimulus for sporulation by Bacillus spp.[58]. The findings indicate a positive prebiotic impact of the EPS derived from B. subtilis P1, as evidenced by its ability to enhance the growth of the evaluated probiotic. This suggests that bacterial EPS comprises complex structures capable of stimulating the growth and metabolic functions of beneficial bacteria. Furthermore, certain bacteria can ferment EPS and generate valuable metabolites, particularly short-chain fatty acids (SCFA), in the presence of probiotics. SCFA are known to play crucial roles in supporting the growth of probiotics by fostering a favorable intestinal environment and reducing intestinal pH [8,14,26,33,50,51]. According to the report by Angelin and Kavitha (2020), Bacillus subtilis produced levan containing homopolysaccharides of fructose with β-2,6 glycosidic bonds showed prebiotic properties [8,16]. Nevertheless, the prebiotic impact of inulin hinges largely on its degree of polymerization, which dictates its degradation site, hydrolysis rate, and fermentation byproducts. Additionally, inulin aids in suppressing endotoxin secretion by elevating the proportion of probiotics, thus exerting anti-inflammatory effects. Intriguingly, long-chain inulin predominantly fosters the proliferation of gut microbiota together with the diverse enzymes capable of breaking down complex polysaccharides into oligosaccharides and monosaccharides [8,59].
3.5.2. Anti-Oxidant Activity
The DPPH free radical, being stable, can be rendered inert upon encountering a proton radical scavenger, which transfers either an electron or a hydrogen atom to the DPPH molecule. As shown in Figure 4B, the percentage of scavenging activity of the EPS from B. subtilis P1 on DPPH radical increased with an EPS concentration increased and it had maintained about 50% from 5-20 mg/mL while the standard ascorbic acid showed almost 96% DPPH scavenging. Similar to EPS produced by Bacillus tequilensis PS21 and Bacillus subtilis AF17 displayed the strongest DPPH radical scavenging activity of 43.93-58.54% with an increase of EPS concentration [30,60]. In the case of, B. amyloquefaciens RT7 showed the highest scavenging activity of 67% at 7.5 mg/mL EPS while the EPS produced from B. amyloliquefaciens GSBa-1 had a DPPH scavenging activity of 76.7% at 5 mg/mL [19,48] , in addition, the EPS from Bacillus coagulans RK-02 with Mw of 30 kDa and Bacillus anthracis showed an antioxidant activity when used at the concentration of 0.05 to 0.5 mg/mL and 0.2 to 5 mg/mL, respectively.[10]. Correspondingly to EPS from Bacillus licheniformis Dahb1, reached about 83 %scavenging capability when tested at 100 μg/mL of EPS [36].In comparison, the relatively low molecular mass of EPS (<30 kDa) exhibited potentially DPPH radical scavenging activity [29]. Reports suggest that a lower molecular weight of the polysaccharide could contribute to its heightened antioxidant activities. This is attributed to increased solubility, reduced steric hindrance, enabling more efficient interaction with Reactive oxygen species (ROS), and facilitating faster reactions [8,48,59]; however, in this study, the produced EPS from B. subtilis P1 had a relative high MW (>105 Da) that may reduce the antioxidant activity. Furthermore, the antioxidant capacity of microbial EPS is related to its diverse functional groups, including hydroxyl, carboxyl, sulfate, or acetyl groups. These functional groups either donate electron pairs, release a proton, or aid in metal binding processes. This remarkable scavenging ability leads to the conversion of free radicals into stable substances. Additionally, the presence of negatively charged functional groups may facilitate EPS hydrolysis, thereby increasing the exposure of hemiacetal hydroxyl groups and enhancing antioxidant activity [10,15].
3.5.3. Anti-Bacterial Activity
Microbial EPS demonstrate significant inhibitory effects on a range of pathogenic bacteria by competing for adherence and colonization. Bacteria belonging to LAB, such as Lactobacillus or Bacillus genera, produce EPS that exhibit either bacteriostatic or bactericidal activity. These microbial EPS exhibited either broad-spectrum or specific activity [16]. However, there are few studies in the use of microbial EPS against fish pathogenic bacteria. In this study, freshwater fish pathogenic bacteria including A. veronii, A. hydrophila, S. agalactiae, and E. ictaluri were tested for growth inhibition by EPS from B. subtilis P1 using agar well diffusion method. The results demonstrated that the produced EPS seems to inhibit Aeromonas spp. with a strong intensities (>13 mm) while in S. agalactiae, and E. ictaluri showed a moderate inhibition with a diameter of only 10 mm at 400 μg/mL of EPS (Figure 4C). Unlike EPS from B. licheniformis Dahb1, at a little amount of EPS (75 μg/mL) showed strong antibacterial activity against numerous pathogenic bacteria [36] while B. tequilensis PS22 showed a maximum inhibition on S. agalactiae (>12 mm) among the other tested Bacillus spp., in addition, B. amyloliquefaciens KW8 revealed a moderate inhibition (<10 mm) on S. aureus that mostly causing diseases in Nile tilapia [60]. On the other hand, Mahdhi et al. (2020) [17] has reported that EPS from probiotic Lb. plantarum and Bacillus strain HM117830 showed the inhibition diameter between 13 and 15 mm against S. aureus, V. alginolyticus and P. aeruginosa at concentration of 2 mg/mL. The antibacterial mechanisms of microbial EPSs may involve disrupting the structure of bacterial cell membranes, cell walls, or respiratory chains, thereby affecting the cell division machinery of fish pathogens [4,10,11]. Additionally, microbial EPSs contain a variety of functional groups, such as hydroxyl, phosphate, and carbonyl groups, which play a role in the interaction of the EPS with the cell membranes or cell walls of bacterial pathogens [4,10,14,34].
3.5.4. Cytotoxicity test
EPS cytotoxicity was confirmed by hemolytic potential activity test. Although a slight increase in hemolysis activity increasing the EPS concentration, very low hemolytic activity (≤1% hemolysis) was obtained (Figure 4D). Similarly to Abinaya et al. (2018) detected the hemolysis activity at low levels of cytotoxicity even at 5 mg/mL of EPS. In contrast, the cytotoxicity activities of EPS from Physarum polycephalum microplasmodia were investigated against various cell lines, revealing differing effects. These discrepancies were attributed to distinct chemical properties, including carbohydrate, protein, and total sulfate group contents, as well as monosaccharide composition and molecular weights. Numerous evidences suggested that some polysaccharides isolated from cultivable sources had low cytotoxicity due to their remarkable functional properties [10–12,36].
3.6. In Vivo Study of the Effect of EPS Supplementation in Fish Diet on Growth Performance and Immune Response
The body weight gain (WG), specific growth rates (SGR), average daily gain (ADG), and survival rate were significantly higher (p<0.05) in fishes supplemented with 0.5% EPS in 4 week than those control basal diet ;however, the FCR showed no significant difference among two group (Table 3). Interestingly, the SGR in this study were slightly higher than the previous works that fed the Oreochromis tilapia and with a similar concentration of inulin-based EPS had an average SGR about 2.10-2.39% [2,36,61]. In addition, there was no dead detection for all fish tanks during the whole experiment.
Additionally, for immunological parameters such as NBT and lysozyme values were significantly increased (p < 0.05) in EPS-supplemented group which reached about OD630 of 0.44±0.02 and 6.88±0.16 U/min, respectively (Table 4). Conversely, total immunoglobulins (Ig) that referred to as antibodies are generated by B cells and released into both the bloodstream and mucosal surfaces. Their primary function is to neutralize pathogens such as bacteria, viruses, and other foreign substances [42], obtained in the T-group showed no statistically difference from control group.
These may explain that the duration of feeding time only 4-6 weeks was not able to trigger a strong immune response as mentioned in the previous studies, of which, the supplementation of Lactobacillus rhamnosus in rainbow trout (Oncorhynchus mykiss) and in red Tilapia (Oreochromis spp.) for 30 days had not increase total immunoglobulin [42]. Several studies have evaluated the effect of inulin supplemented diet on the humoral immune response of aquaculture such as fish. These obtained results were similar trends to the previous studied by Ibrahem et al. [2] reported that after feeding of 0.5% commercial inulin (Sigma-Aldrich) to Nile tilapia (O. niloticus) for 2 months showed significantly improved lysozyme activity about 9.29±0.16 to 9.34±0.13 U/min while NBT exhibited the highest value of 0.297±0.04. Furthermore, Cerezuela et al. (2013) utilized inulin-type EPS as a prebiotic in Gilthead seabream (Sparus aurata) and observed an augmentation in intraepithelial leukocytes, as well as an upregulation in IL-8 and IL-6, and the expression of Casp-1 and COX-2 genes, implicated in various cellular processes associated with inflammation, immune responses, and cell death. Additionally, they noted a significant enhancement in complement activity and IgM levels in fish fed with EPS. Correspondingly, with previous studied by Reyes-Becerril,et al. (2014) reported that the lysozyme activity, IgM level, and myeloperoxidase activity elevated significantly in leopard grouper (Mycteroperca rosacea) fed with diet supplemented with 5 g/kg inulin for eight weeks while in the hybrid surubim (Pseudoplatystoma sp.) fed with similar dose of inulin showed an increase of the total immunoglobulin [4,62].Additionally, Ghafarifarsan et al. (2020) evaluated the effects of dietary inulin on growth performance and immune factors as well as innate immune responses of Oncorhynchus mykiss (rainbow trout) fry challenged with A. hydrophila and found that the inulin affected significantly increased the WG, FCR, SGR, and protein content while for humoral immune responses showed that the inulin supplements significantly increased lysozyme and complement activities in addition total IgM was improved [63]. For the relative level of protection (RLP) after challenge infection the fish with A. veronii for 6 week, about 50% RLP was obtained in the EPS supplemented groups which was lower than that of commercial inulin (33.33-35.71%RLP)[2] Besides, the EPS produced from Bacillus megaterium 1 showed an immunostimulant and immunomodulatory agent for Cyprinus carpio juveniles and C. carpio fry, respectively [7]. Lysozyme activity is an important marker of innate immunity in fish. Pathogen recognition, facilitated by pattern recognition receptors (PRRs), is instrumental in triggering innate immune responses through various signalling pathways. Elevated lysozyme levels aid in pathogen inhibition by targeting the peptidoglycan within bacterial cell walls [4,10]. The innate immune response is characterized by its swift reaction to pathogen presence, activating cellular defend mechanisms and networks of action including the production of antimicrobial substances and proteins, non-classical complement activation, release of cytokines, inflammation, and phagocytosis. Ultimately, the innate immune response paves the way for the development of an adaptive response [36,38]. On the other hand, NBT analysis is an assay to evaluate the respiratory burst activity of the immune cells, such as neutrophils and macrophages especially in the context of phagocytosis which generated ROS and free radicals e.g. superoxide anion playing a significant role in killing and destroying engulfed pathogens during the immune responses [4,13,41,61]. Also, the blood chemistry parameters were investigated as presented in Table 5.The results strongly proved that ALT, AST, T-bilirubin, D-bilirubin in T-group was not statistically different from control group These indicated that the supplementation the fish diet with microbial EPS from B. subtilis P1 had no negative effect on kidney and liver of Nile Tilapia [64]. Furthermore, blood urea nitrogen, total cholesterol, total protein and albumin content in the T-group showed no statistically difference when compared with control group, that was implied that the EPS feeding had no negative adverse on fish health [2,42]. While the glucose content in T-group showed slightly higher than in control group (p<0.05) which resulted in an increase of the absorptive area in fish intestine, and showed the positive effect on the glucose in the serum [42,64].
Finally, the proximate analysis based on AOAC (2000) revealed the higher protein content in the T-group. These findings suggest that EPS from B. subtilis P1 in fish diets efficiently supports fish growth and stimulates innate immune responses in Nile Tilapia, thus showing potential as the immunobiotics for aquaculture. The understanding of how microbial inulin interacts with the fish body remains intricate and not fully elucidated. Inulin potentially influences the intestinal microbiota by promoting the rapid growth of beneficial bacteria while suppressing the proliferation of harmful microbes. Additionally, it may impact the immune system and systemic metabolism. Moreover, the efficacy of this prebiotic microbial EPS in aquatic cultures significantly relies on factors such as type, dosage, and duration of administration [2,4,51,59]. The present findings indicate that fish dietary administration of EPS-inulin based produced from B. subtilis P1 is able to promote the growth and enhance the serum immune responses of Nile tilapia; therefore this EPS is promising immunobiotics with immune-stimulatory and/or immune-modulatory activities in aquaculture.Notably, most of previous studies, the microbial EPS has been applied in aquaculture systems are dextran , levan, or glucan while the use of microbial inulin is only few reports [3,4,6,51] and the most often applications in feed additives are the inulin from plant such as chicory roots (Cichorium intybus L.) and Jerusalem artichoke tubers (Helianthus tuberosus L.) [2,4,5] thus this present study is one of an introduction to use the inulin produced from bacteria in Nile Tilapia which is supposed to have some advantages over from plant sources including high purity and consistency with specific degrees of polymerization that can be tailored to specific functional properties such as prebiotic effectiveness, solubility, and fermentability [12,51,54]. This customization can be particularly beneficial for targeted health applications or for specific food formulation requirements. Moreover, the inulin from microbial fermentation process can be run continuously and is less affected by seasonal or geographical constraints.
4. Conclusions
This study has successfully isolated and produced a significant amount of microbial EPS, which contains inulin-fructans type molecules with a molecular weight of approximately 105 Da, from the newly isolated Bacillus subtilis P1. This produced EPS was added to the diet of Nile tilapia (O. niloticus) fish due to its capacity to promote probiotic growth, inhibit certain fish pathogens, enhance antioxidant activity, and exhibit non-cytotoxic effects. Notably, the tested group supplemented with EPS demonstrated immune system stimulation, particularly through an innate immune response, and exhibited a higher survival rate among fish when challenged with A. veronii. Furthermore, the treatment group showed an increase in protein content. These findings underscore the potential of the prebiotic EPS from B. subtilis P1 as an effective immunobiotic in aquaculture.
Supplementary Materials
The following supporting information can be downloaded at: Preprints.org. Figure S1 Response surface plots of three variables in medium composition on EPS production. Figure S2 Phylogenetic tree of Bacillus sp. P1 based on the sequence of 16S rDNA gene. Table S1 Experimental design and the response values of % yield EPS produced by B. subtilis P1. Table S2 Carbohydrate substrate utilization and enzyme activity of Bacillus sp. P1.
Author Contributions
Conceptualization, M.S., M.L., and W. C.; methodology, A.K., S.K., M.S., M.L., and W. C.; investigation, K.B., A.Y., A.K., S.K., and W. C.; data curation, K.B., A.Y., S.K., M.S., and W. C.; writing—original draft preparation, K.B., and W. C.; writing—review and editing, K.B., A.K., S.K., M.S., M.L., and W. C.; supervision, A.K., S.K., M.S., M.L., and W. C. All authors have read and agreed to the published version of the manuscript.
Funding
This work was financially supported by National Higher Education, Science,Research and Innovation Policy Council, Thaksin University (Research project grant no. TSU-66A105000004) Fiscal Year 2023 and by Thaksin University Research Fund (Research project grant no. TSU-66LGS003) Fiscal Year 2023.
Institutional Review Board Statement
The fishes were anesthetized with an excess dose of tricaine methane sulfonate MS-222 at 200 mg/L to reduce stress and suffering. The standard operation procedure as stipulated in Thasksin University guide for the use of animals for experiment was followed. This research received approval from the Animal Ethics Screening Committee, Thaksin University (Permit number: COA No. TSU 2023-009 and date of approval: 25 March 2023) for studies involving animals.
Informed Consent Statement
Not applicable.
Data Availability Statement
The datasets used and/or analyzed during the current study are available from the corresponding author on reasonable request. Requests to access these datasets should be directed to wankuson.c@tsu.ac.th
Conflicts of Interest
The authors have no financial conflicts of interest to declare. The funders had no role in the design of the study; in the collection, analyses, or interpretation of the data; in the writing of the manuscript; or in the decision to publish the results.
References
- T. Lertwanakarn, T. Purimayata, T. Luengyosluechakul, P. B. Grimalt, A. S. Pedrazzani, M. H. Quintiliano, and W. Surachetpong, “Assessment of Tilapia (Oreochromis spp.) Welfare in the Semi-Intensive and Intensive Culture Systems in Thailand,” Animals, vol. 13, no. 15, p. 2498, 2023. [CrossRef]
- M. D. Ibrahem, M. Fathi, S. Mesalhy, and A. Abd El-Aty, “Effect of dietary supplementation of inulin and vitamin C on the growth, hematology, innate immunity, and resistance of Nile tilapia (Oreochromis niloticus),” Fish & Shellfish Immunology, vol. 29, no. 2, pp. 241–246, 2010. [CrossRef]
- D. Carbone and C. Faggio, “Importance of prebiotics in aquaculture as immunostimulants. Effects on immune system of Sparus aurata and Dicentrarchus labrax,” Fish & Shellfish Immunology, vol. 54, pp. 172–178, 2016. [CrossRef]
- S. H. Hoseinifar, M. Á. Esteban, A. Cuesta, and Y.-Z. Sun, “Prebiotics and fish immune response: a review of current knowledge and future perspectives,” Reviews in Fisheries Science & Aquaculture, vol. 23, no. 4, pp. 315–328, 2015. [CrossRef]
- M. Yousefian and M. S. Amiri, “A review of the use of prebiotic in aquaculture for fish and shrimp,” African Journal of Biotechnology, vol. 8, no. 25, 2009.
- J. C. Camacho-Chab, F. Lango-Reynoso, M. d. R. Castañeda-Chávez, I. Galaviz-Villa, D. Hinojosa-Garro, and B. O. Ortega-Morales, “Implications of extracellular polymeric substance matrices of microbial habitats associated with coastal aquaculture systems,” Water, vol. 8, no. 9, p. 369, 2016. [CrossRef]
- S. Gupta, P. Das, S. Singh, M. Akhtar, D. Meena, and S. Mandal, “Microbial levari, an ideal prebiotic and immunonutrient in aquaculture,” World Aquaculture, vol. 42, no. 1, p. 61, 2011.
- S. You et al., “The promotion mechanism of prebiotics for probiotics: A review,” Frontiers in Nutrition, vol. 9, p. 1000517, 2022. [CrossRef]
- A. I. Netrusov, E. V. Liyaskina, I. V. Kurgaeva, A. U. Liyaskina, G. Yang, and V. V. Revin, “Exopolysaccharides Producing Bacteria: A Review,” Microorganisms, vol. 11, no. 6, p. 1541, 2023. [CrossRef]
- F. Salimi and P. Farrokh, “Recent advances in the biological activities of microbial exopolysaccharides,” World Journal of Microbiology and Biotechnology, vol. 39, no. 8, p. 213, 2023. [CrossRef]
- W. Wang, Y. Ju, N. Liu, S. Shi, and L. Hao, “Structural characteristics of microbial exopolysaccharides in association with their biological activities: a review,” Chemical and Biological Technologies in Agriculture, vol. 10, no. 1, p. 137, 2023. [CrossRef]
- M. Abinaya et al., “Exopolysaccharides-mediated ZnO nanoparticles for the treatment of aquatic diseases in freshwater fish Oreochromis mossambicus,” Toxics, vol. 11, no. 4, p. 313, 2023. [CrossRef]
- N. Sutthi et al., “Dietary Administration Effects of Exopolysaccharide Produced by Bacillus tequilensis PS21 Using Riceberry Broken Rice, and Soybean Meal on Growth Performance, Immunity, and Resistance to Streptococcus agalactiae of Nile tilapia (Oreochromis niloticus),” Animals, vol. 13, no. 20, p. 3262, 2023. [CrossRef]
- P. Ruas-Madiedo, J. Hugenholtz, and P. Zoon, “An overview of the functionality of exopolysaccharides produced by lactic acid bacteria,” International Dairy Journal, vol. 12, no. 2–3, pp. 163–171, 2002. [CrossRef]
- M. Andrew and G. Jayaraman, “Structural features of microbial exopolysaccharides in relation to their antioxidant activity,” Carbohydrate Research, vol. 487, p. 107881, 2020. [CrossRef]
- J. Angelin and M. Kavitha, “Exopolysaccharides from probiotic bacteria and their health potential,” International Journal of Biological Macromolecules, vol. 162, pp. 853–865, 2020. [CrossRef]
- A. Mahdhi et al., “Dietary administration effects of exopolysaccharide from potential probiotic strains on immune and antioxidant status and nutritional value of European sea bass (Dicentrarchus labrax L.),” Research in Veterinary Science, vol. 131, pp. 51–58, 2020. [CrossRef]
- N. Gobi et al., “Dietary supplementation of probiotic Bacillus licheniformis Dahb1 improves growth performance, mucus and serum immune parameters, antioxidant enzyme activity as well as resistance against Aeromonas hydrophila in tilapia Oreochromis mossambicus,” Fish & Shellfish Immunology, vol. 74, pp. 501–508, 2018. [CrossRef]
- W. Zhao et al., “Characterization and antioxidant activity of the exopolysaccharide produced by Bacillus amyloliquefaciens GSBa-1,” 2018. [CrossRef]
- P. Petrova, A. Arsov, I. Ivanov, L. Tsigoriyna, and K. Petrov, “New exopolysaccharides produced by Bacillus licheniformis 24 display substrate-dependent content and antioxidant activity,” Microorganisms, vol. 9, no. 10, p. 2127, 2021. [CrossRef]
- S. A. Moghannem, M. Farag, A. M. Shehab, and M. S. Azab, “Exopolysaccharide production from Bacillus velezensis KY471306 using statistical experimental design,” Brazilian Journal of Microbiology, vol. 49, pp. 452–462, 2018. [CrossRef]
- M. M. Berekaa, “Improved exopolysaccharide production by Bacillus licheniformis strain-QS5 and application of statistical experimental design,” Int J Curr Microbiol App Sci, vol. 3, no. 4, pp. 876–886, 2014.
- R. Gangalla et al., “Optimization and characterization of exopolysaccharide produced by Bacillus aerophilus rk1 and its in vitro antioxidant activities,” Journal of King Saud University-Science, vol. 33, no. 5, p. 101470, 2021. [CrossRef]
- S. A. Razack, V. Velayutham, and V. Thangavelu, “Medium optimization for the production of exopolysaccharide by Bacillus subtilis using synthetic sources and agro wastes,” Turkish Journal of Biology, vol. 37, no. 3, pp. 280–288, 2013. [CrossRef]
- F. C. Mgomi, Y.-R. Yang, G. Cheng, and Z.-Q. Yang, "Lactic acid bacteria biofilms and their antimicrobial potential against pathogenic microorganisms," Biofilm, vol. 100118, 2023. [CrossRef]
- M.-G. Lee et al., "Potential probiotic properties of exopolysaccharide-producing Lacticaseibacillus paracasei EPS DA-BACS and prebiotic activity of its exopolysaccharide," Microorganisms, vol. 10, no. 12, p. 2431, 2022. [CrossRef]
- E. S. Lim, S. J. Nam, O. K. Koo, and J.-S. Kim, "Protective role of Acinetobacter and Bacillus for Escherichia coli O157 in biofilms against sodium hypochlorite and extracellular matrix-degrading enzymes," Food Microbiology, vol. 109, p. 104125, 2023. [CrossRef]
- T. Todhanakasem, A. Sangsutthiseree, K. Areerat, G. M. Young, and P. Thanonkeo, "Biofilm production by Zymomonas mobilis enhances ethanol production and tolerance to toxic inhibitors from rice bran hydrolysate," New Biotechnology, vol. 31, no. 5, pp. 451-459, 2014. [CrossRef]
- C. Liu, J. Lu, L. Lu, Y. Liu, F. Wang, and M. Xiao, "Isolation, structural characterization and immunological activity of an exopolysaccharide produced by Bacillus licheniformis 8-37-0-1," Bioresource Technology, vol. 101, no. 14, pp. 5528-5533, 2010. [CrossRef]
- T. Lin, C. Chen, B. Chen, J. Shaw, and Y. Chen, "Optimal economic productivity of exopolysaccharides from lactic acid bacteria with production possibility curves," Food Science & Nutrition, vol. 7, no. 7, pp. 2336-2344, 2019. [CrossRef]
- M. Ziadi et al., "Evaluation of the efficiency of ethanol precipitation and ultrafiltration on the purification and characteristics of exopolysaccharides produced by three lactic acid bacteria," BioMed Research International, 2018. [CrossRef]
- K. Khongkool, B. Prakit, R. Chiyod, T. Suttibul, and M. Lertworapreecha, "Qualitative analysis of fibre-degrading enzymes production by Bacillus isolated from native swine manures," Burapha Science Journal, pp. 647-659, 2023.
- T. Yılmaz and Ö. Şimşek, "Potential health benefits of ropy exopolysaccharides produced by Lactobacillus plantarum," Molecules, vol. 25, no. 14, p. 3293, 2020. [CrossRef]
- E. H. Zaghloul, M. I. Ibrahim, and H. A. Zaghloul, "Antibacterial activity of exopolysaccharide produced by bee gut-resident Enterococcus sp. BE11 against marine fish pathogens," BMC Microbiology, vol. 23, no. 1, p. 231, 2023. [CrossRef]
- D. W. Wanja et al., "Antibiotic and disinfectant susceptibility patterns of bacteria isolated from farmed fish in Kirinyaga County, Kenya," International Journal of Microbiology, 2020. [CrossRef]
- M. Abinaya et al., "Structural characterization of Bacillus licheniformis Dahb1 exopolysaccharide—antimicrobial potential and larvicidal activity on malaria and Zika virus mosquito vectors," Environmental Science and Pollution Research, vol. 25, pp. 18604-18619, 2018. [CrossRef]
- C. Figueiredo-Silva, A. Lemme, D. Sangsue, and S. Kiriratnikom, "Effect of DL-methionine supplementation on the success of almost total replacement of fish meal with soybean meal in diets for hybrid tilapia (Oreochromis niloticus × Oreochromis mossambicus)," Aquaculture Nutrition, vol. 21, no. 2, pp. 234-241, 2015. [CrossRef]
- J. D. Biller et al., "Lysozyme activity as an indicator of innate immunity of tilapia (Oreochromis niloticus) when challenged with LPS and Streptococcus agalactiae," Revista Brasileira de Zootecnia, vol. 50, 2021. [CrossRef]
- S. A. Stasiak and P. C. Baumann, "Neutrophil activity as a potential bioindicator for contaminant analysis," Fish & Shellfish Immunology, vol. 6, no. 7, pp. 537-539, 1996. [CrossRef]
- L. M. T. Hampton, M. K. S. Jeffries, and B. J. Venables, "A practical guide for assessing respiratory burst and phagocytic cell activity in the fathead minnow, an emerging model for immunotoxicity," MethodsX, vol. 7, p. 100992, 2020. [CrossRef]
- J. D. Biller and L. S. Takahashi, "Oxidative stress and fish immune system: phagocytosis and leukocyte respiratory burst activity," Anais da Academia Brasileira de Ciências, vol. 90, pp. 3403-3414, 2018. [CrossRef]
- M. Sewaka et al., "Efficacy of synbiotic Jerusalem artichoke and Lactobacillus rhamnosus GG-supplemented diets on growth performance, serum biochemical parameters, intestinal morphology, immune parameters and protection against Aeromonas veronii in juvenile red tilapia (Oreochromis spp.)," Fish & Shellfish Immunology, vol. 86, pp. 260-268, 2019. [CrossRef]
- T. Nuryastuti, "Current in vitro assay to determine bacterial biofilm formation of clinical isolates," Journal of the Medical Sciences (Berkala Ilmu Kedokteran), vol. 46, no. 03, 2014. [CrossRef]
- J. A. Amào, P. F. Omojasola, and M. Barooah, "Isolation and characterization of some exopolysaccharide producing bacteria from cassava peel heaps," Scientific African, vol. 4, e00093, 2019. [CrossRef]
- M. Marvasi, P. T. Visscher, and L. Casillas Martinez, "Exopolymeric substances (EPS) from Bacillus subtilis: polymers and genes encoding their synthesis," FEMS Microbiology Letters, vol. 313, no. 1, pp. 1-9, 2010. [CrossRef]
- R. Tallon, P. Bressollier, and M. C. Urdaci, "Isolation and characterization of two exopolysaccharides produced by Lactobacillus plantarum EP56," Research in Microbiology, vol. 154, no. 10, pp. 705-712, 2003. [CrossRef]
- L. Zhang et al., "Antioxidant activity of an exopolysaccharide isolated from Lactobacillus plantarum C88," International Journal of Biological Macromolecules, vol. 54, pp. 270-275, 2013. [CrossRef]
- E. Sánchez-León, E. Huang-Lin, R. Amils, and C. Abrusci, "Production and characterisation of an exopolysaccharide by Bacillus amyloliquefaciens: Biotechnological applications," Polymers, vol. 15, no. 6, p. 1550, 2023. [CrossRef]
- E. Huang-Lin, E. Sánchez-León, R. Amils, and C. Abrusci, "Potential applications of an exopolysaccharide produced by Bacillus xiamenensis RT6 isolated from an acidic environment," Polymers, vol. 14, no. 18, p. 3918, 2022. [CrossRef]
- D. Jurášková, S. C. Ribeiro, and C. C. Silva, "Exopolysaccharides produced by lactic acid bacteria: From biosynthesis to health-promoting properties," Foods, vol. 11, no. 2, p. 156, 2022. [CrossRef]
- S. M. Dănăilă-Gidea et al., "Inulin. Unique among the polyglucides with significant functional properties and biotechnological perspectives," Revista de Biologie, vol. 25, no. 2, pp. 1387-1395, 2020. [CrossRef]
- E. Korcz and L. Varga, "Exopolysaccharides from lactic acid bacteria: Techno-functional application in the food industry," Trends in Food Science & Technology, vol. 110, pp. 375-384, 2021. [CrossRef]
- R. Prete et al., "Lactic acid bacteria exopolysaccharides producers: a sustainable tool for functional foods," Foods, vol. 10, no. 7, p. 1653, 2021. [CrossRef]
- M. A. Ghoneim et al., "Effect of polysaccharide from Bacillus subtilis sp. on cardiovascular diseases and atherogenic indices in diabetic rats," BMC Complementary and Alternative Medicine, vol. 16, no. 1, pp. 1-12, 2016. [CrossRef]
- A. Malick, N. Khodaei, N. Benkerroum, and S. Karboune, "Production of exopolysaccharides by selected Bacillus strains: Optimization of media composition to maximize the yield and structural characterization," International Journal of Biological Macromolecules, vol. 102, pp. 539-549, 2017. [CrossRef]
- R. Daneshazari et al., "Bacillus subtilis isolates from camel milk as probiotic candidates," Scientific Reports, vol. 13, no. 1, p. 3387, 2023. [CrossRef]
- S. K. Nayak, "Multifaceted applications of probiotic Bacillus species in aquaculture with special reference to Bacillus subtilis," Reviews in Aquaculture, vol. 13, no. 2, pp. 862-906, 2021. [CrossRef]
- V. Elisashvili, E. Kachlishvili, and M. L. Chikindas, "Recent advances in the physiology of spore formation for Bacillus probiotic production," Probiotics and Antimicrobial Proteins, vol. 11, pp. 731-747, 2019. [CrossRef]
- L. Zhu, S. Qin, S. Zhai, Y. Gao, and L. Li, "Inulin with different degrees of polymerization modulates composition of intestinal microbiota in mice," FEMS Microbiology Letters, vol. 364, no. 10, p. fnx075, 2017. [CrossRef]
- T. Karirat et al., "Data on exopolysaccharides produced by Bacillus spp. from cassava pulp with antioxidant and antimicrobial properties," Data in Brief, vol. 50, p. 109474, 2023. [CrossRef]
- A.-M. A. Yones, E. I. A.-M. Mohamed, M. A. Ghobashy, and S. S. Marzok, "Effects of dietary inulin as prebiotic on growth performance, immuno-haematological indices and ectoparasitic infection of fingerlings Nile tilapia, Oreochromis niloticus," Egyptian Journal of Histology, vol. 43, no. 1, pp. 88-103, 2020. [CrossRef]
- M. Reyes-Becerril et al., "Single or combined effects of Lactobacillus sakei and inulin on growth, non-specific immunity and IgM expression in leopard grouper (Mycteroperca rosacea)," Fish Physiology and Biochemistry, vol. 40, pp. 1169-1180, 2014. [CrossRef]
- H. Ghafarifarsani et al., "Study on growth enhancement and the protective effects of dietary prebiotic inulin on immunity responses of rainbow trout fry infected with Aeromonas hydrophila," Annals of Animal Science, vol. 21, no. 2, pp. 543-559, 2021. [CrossRef]
- V. Kumar, H. S. Makkar, and K. Becker, "Nutritional, physiological and haematological responses in rainbow trout (Oncorhynchus mykiss) juveniles fed detoxified Jatropha curcas kernel meal," Aquaculture Nutrition, vol. 17, no. 4, pp. 451-467, 2011. [CrossRef]
Figure 1.
Figure 1. The percentage yield of EPS when grown the bacterial cells in liquid EPS-production medium for 48 h: Bacillus spp. (top) and Lactobacillus spp.(bottom) *Different letters (a-f) means in a bar, they are statistically significant different (P<0.05). Error bars represent mean ± SE
Figure 1.
Figure 1. The percentage yield of EPS when grown the bacterial cells in liquid EPS-production medium for 48 h: Bacillus spp. (top) and Lactobacillus spp.(bottom) *Different letters (a-f) means in a bar, they are statistically significant different (P<0.05). Error bars represent mean ± SE
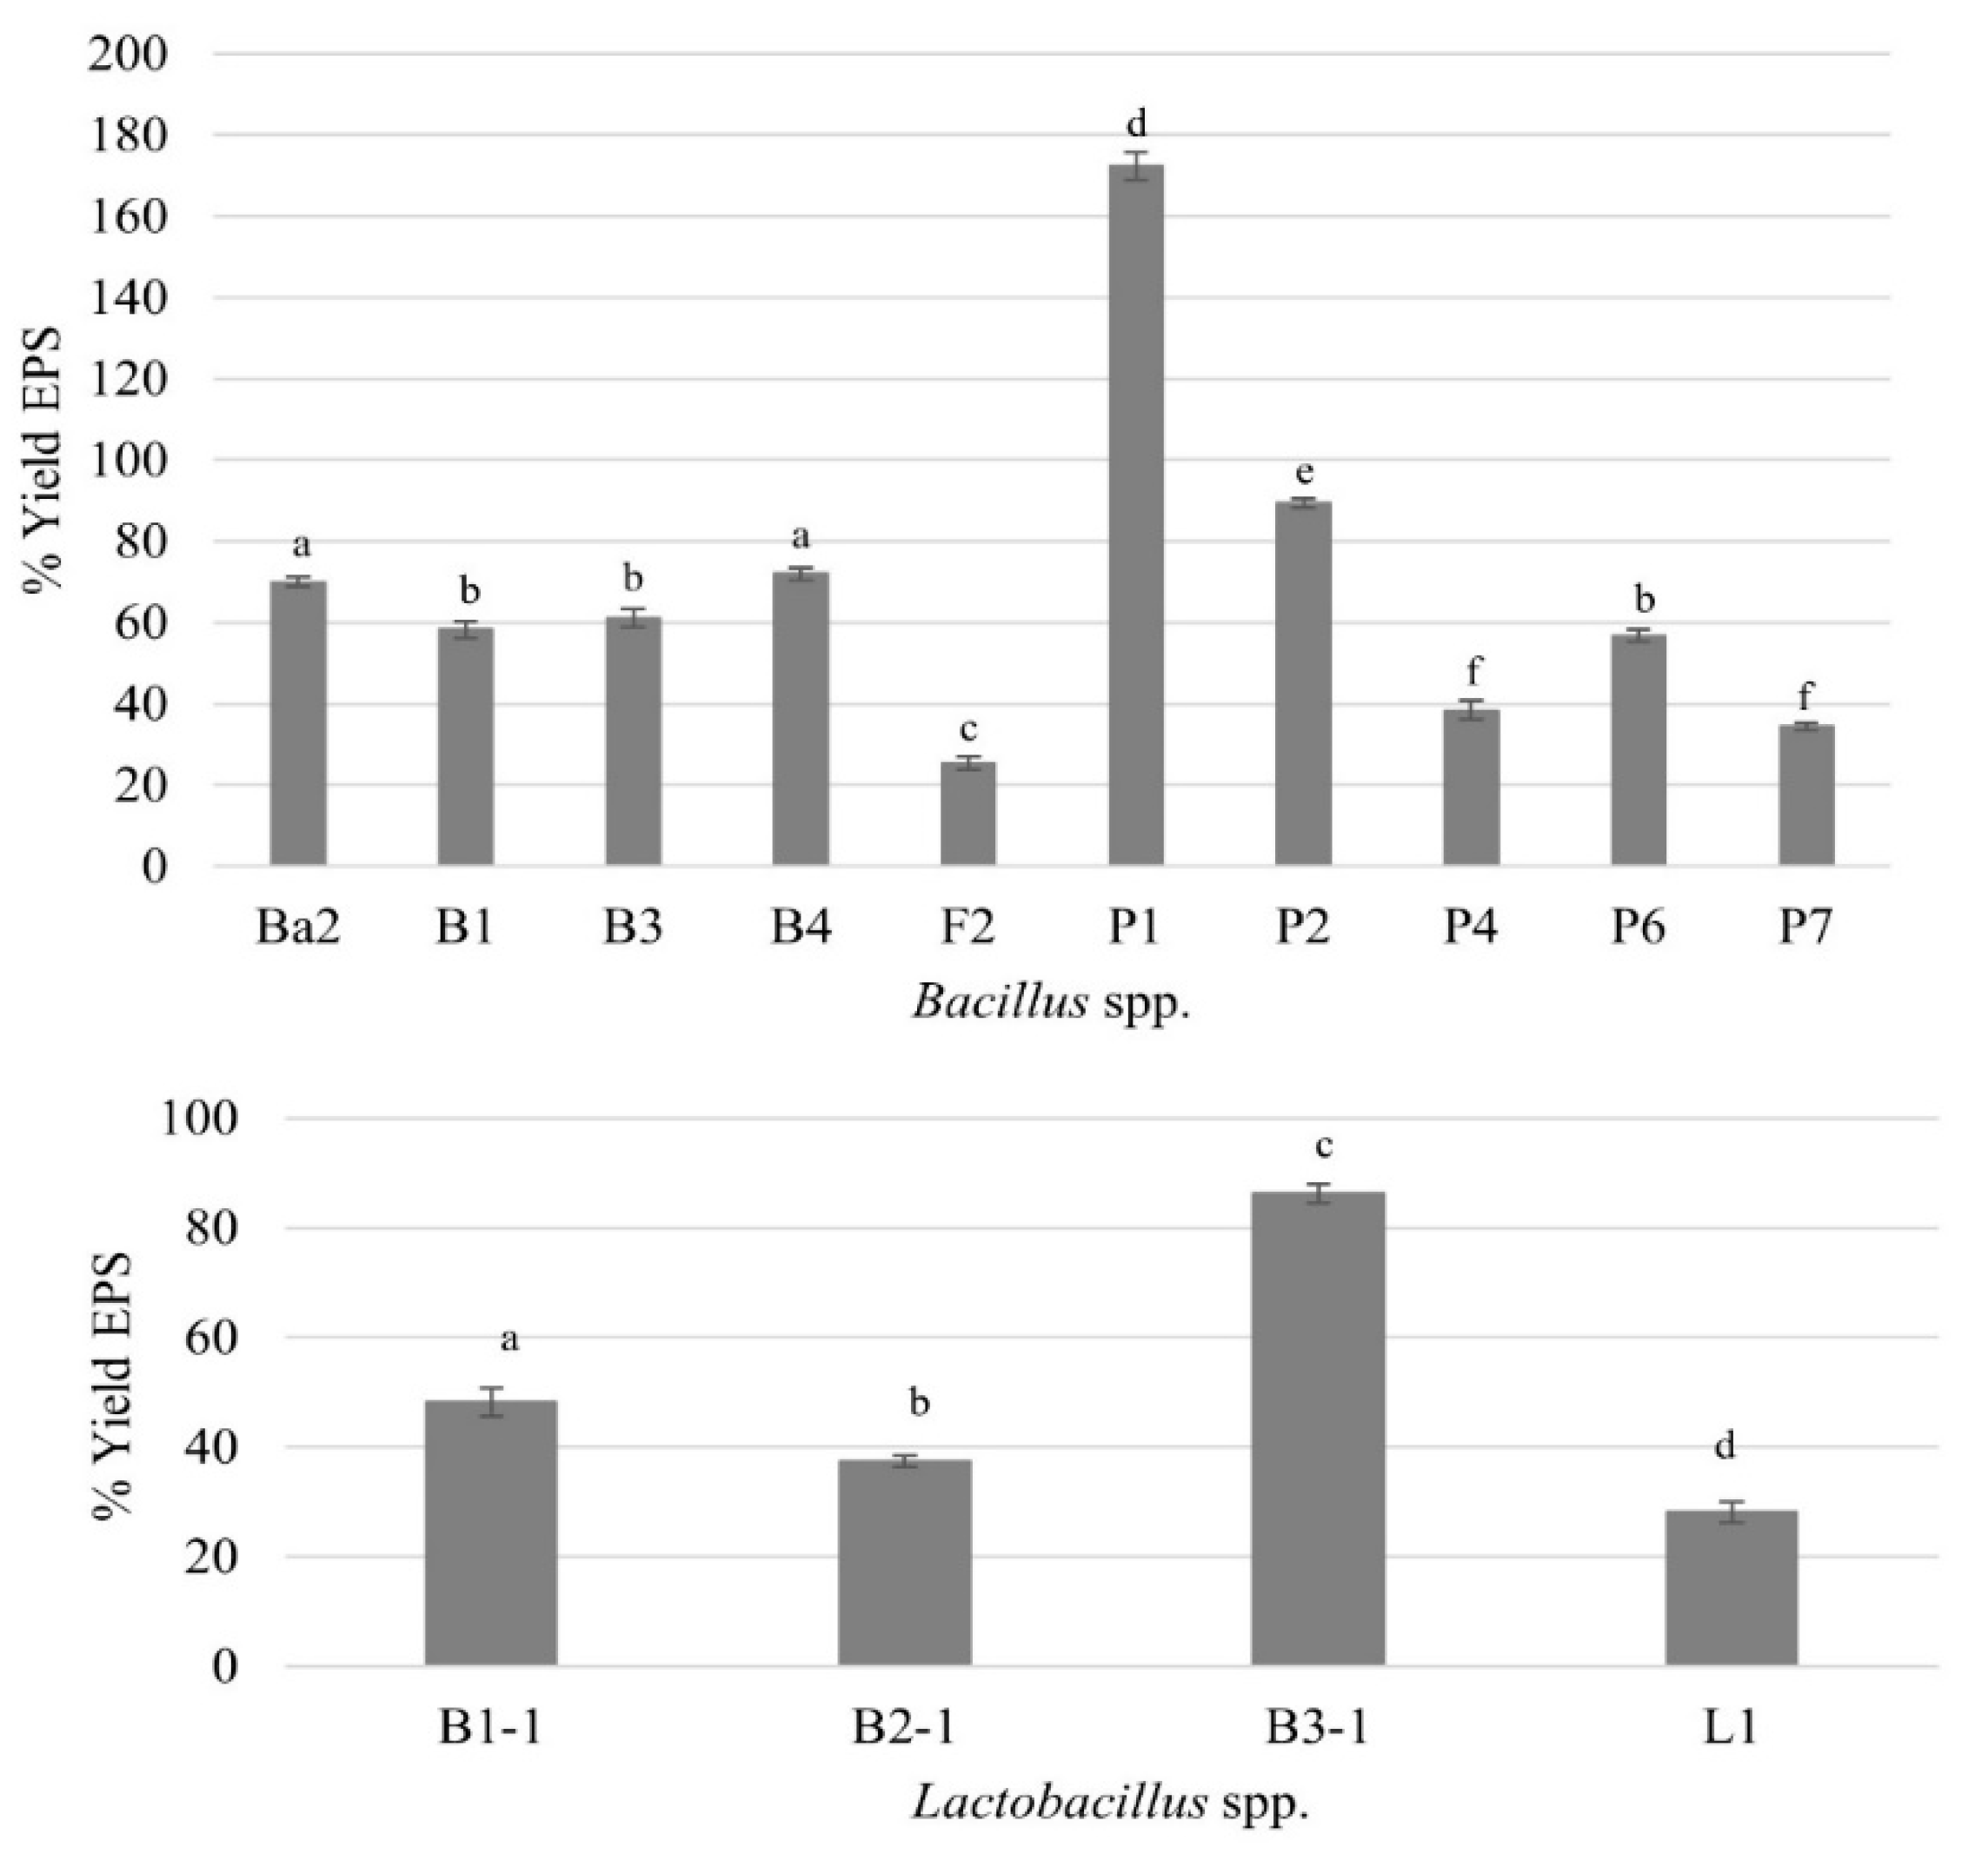
Figure 2.
FTIR spectra of EPS fractions from Lactobacillus sp. B3-1 (A) and Bacillus sp. P1 (B) compared with the standard dextran and standard inulin.
Figure 2.
FTIR spectra of EPS fractions from Lactobacillus sp. B3-1 (A) and Bacillus sp. P1 (B) compared with the standard dextran and standard inulin.
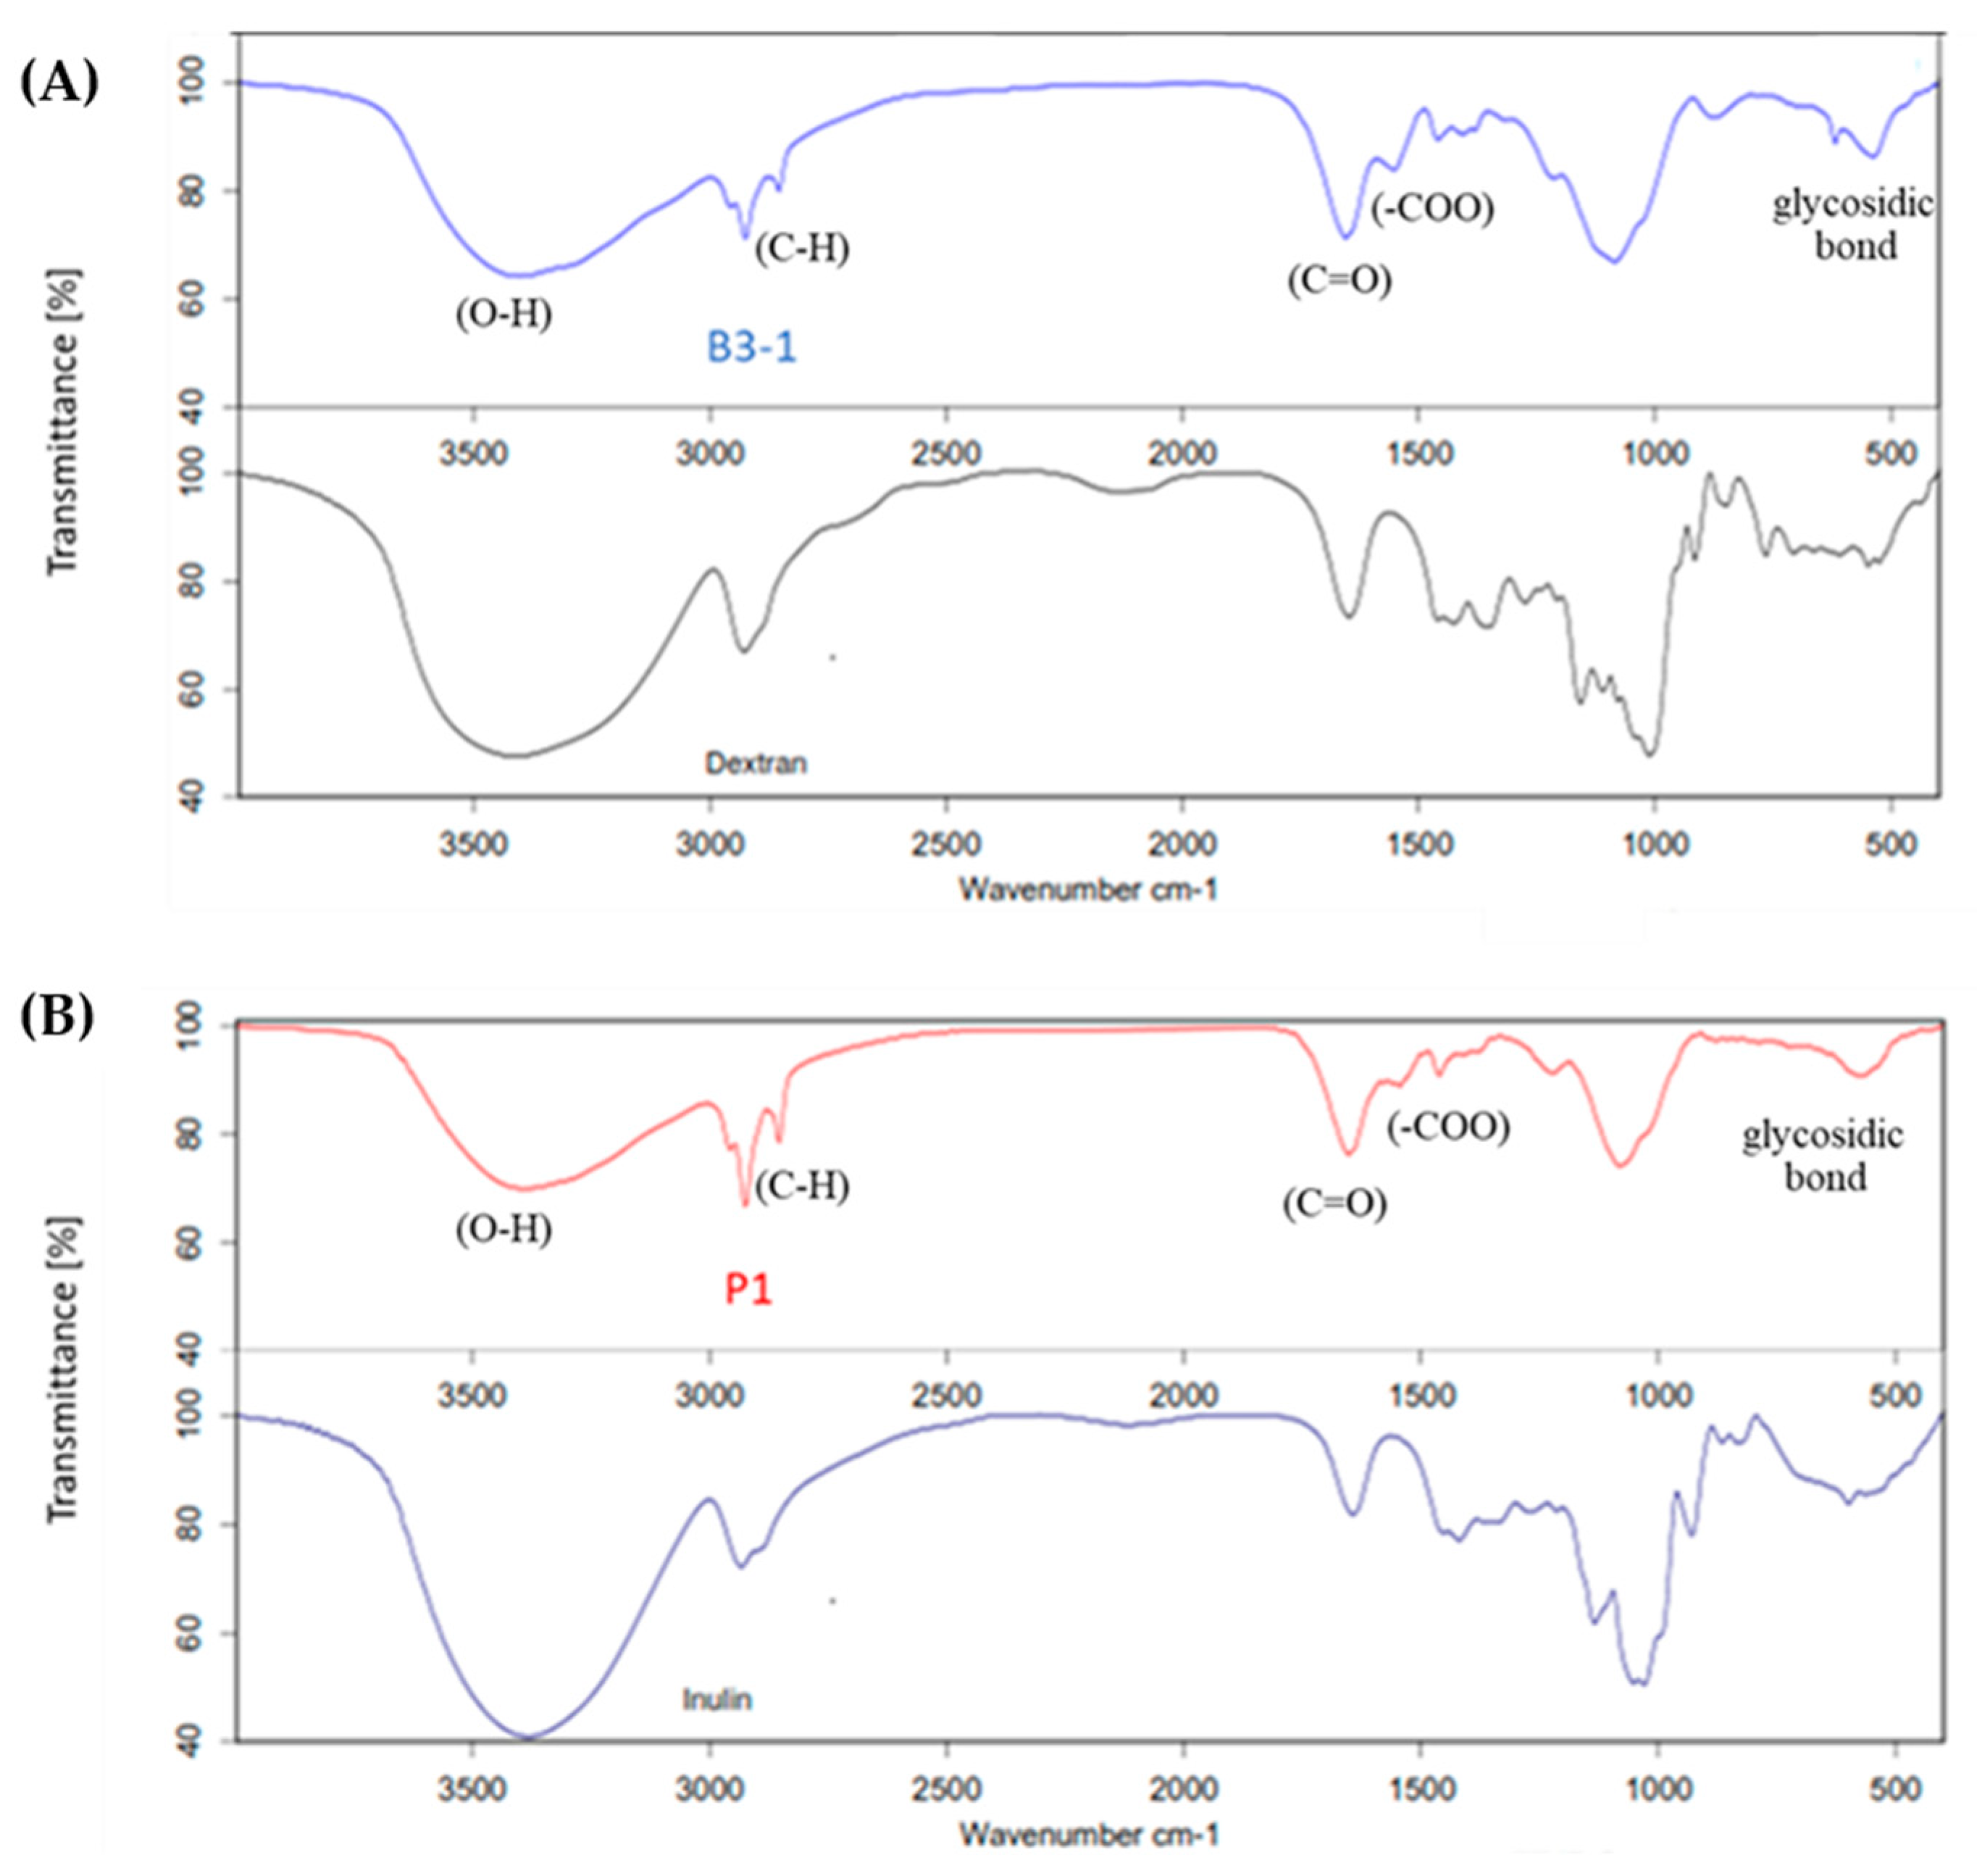
Figure 3.
Morphology of EPS-producing bacteria Bacillus sp. P1 and its purified EPS (A) mucoid colony of Bacillus sp. P1 on TSA (B) EPS precipitation in ice-cold ethanol (C) SEM morphological analysis of EPS at 3,500x magnification (scale bar =20μm), and (D) A matrix of EPS at 50,000x magnification (scale bar =1 μm).
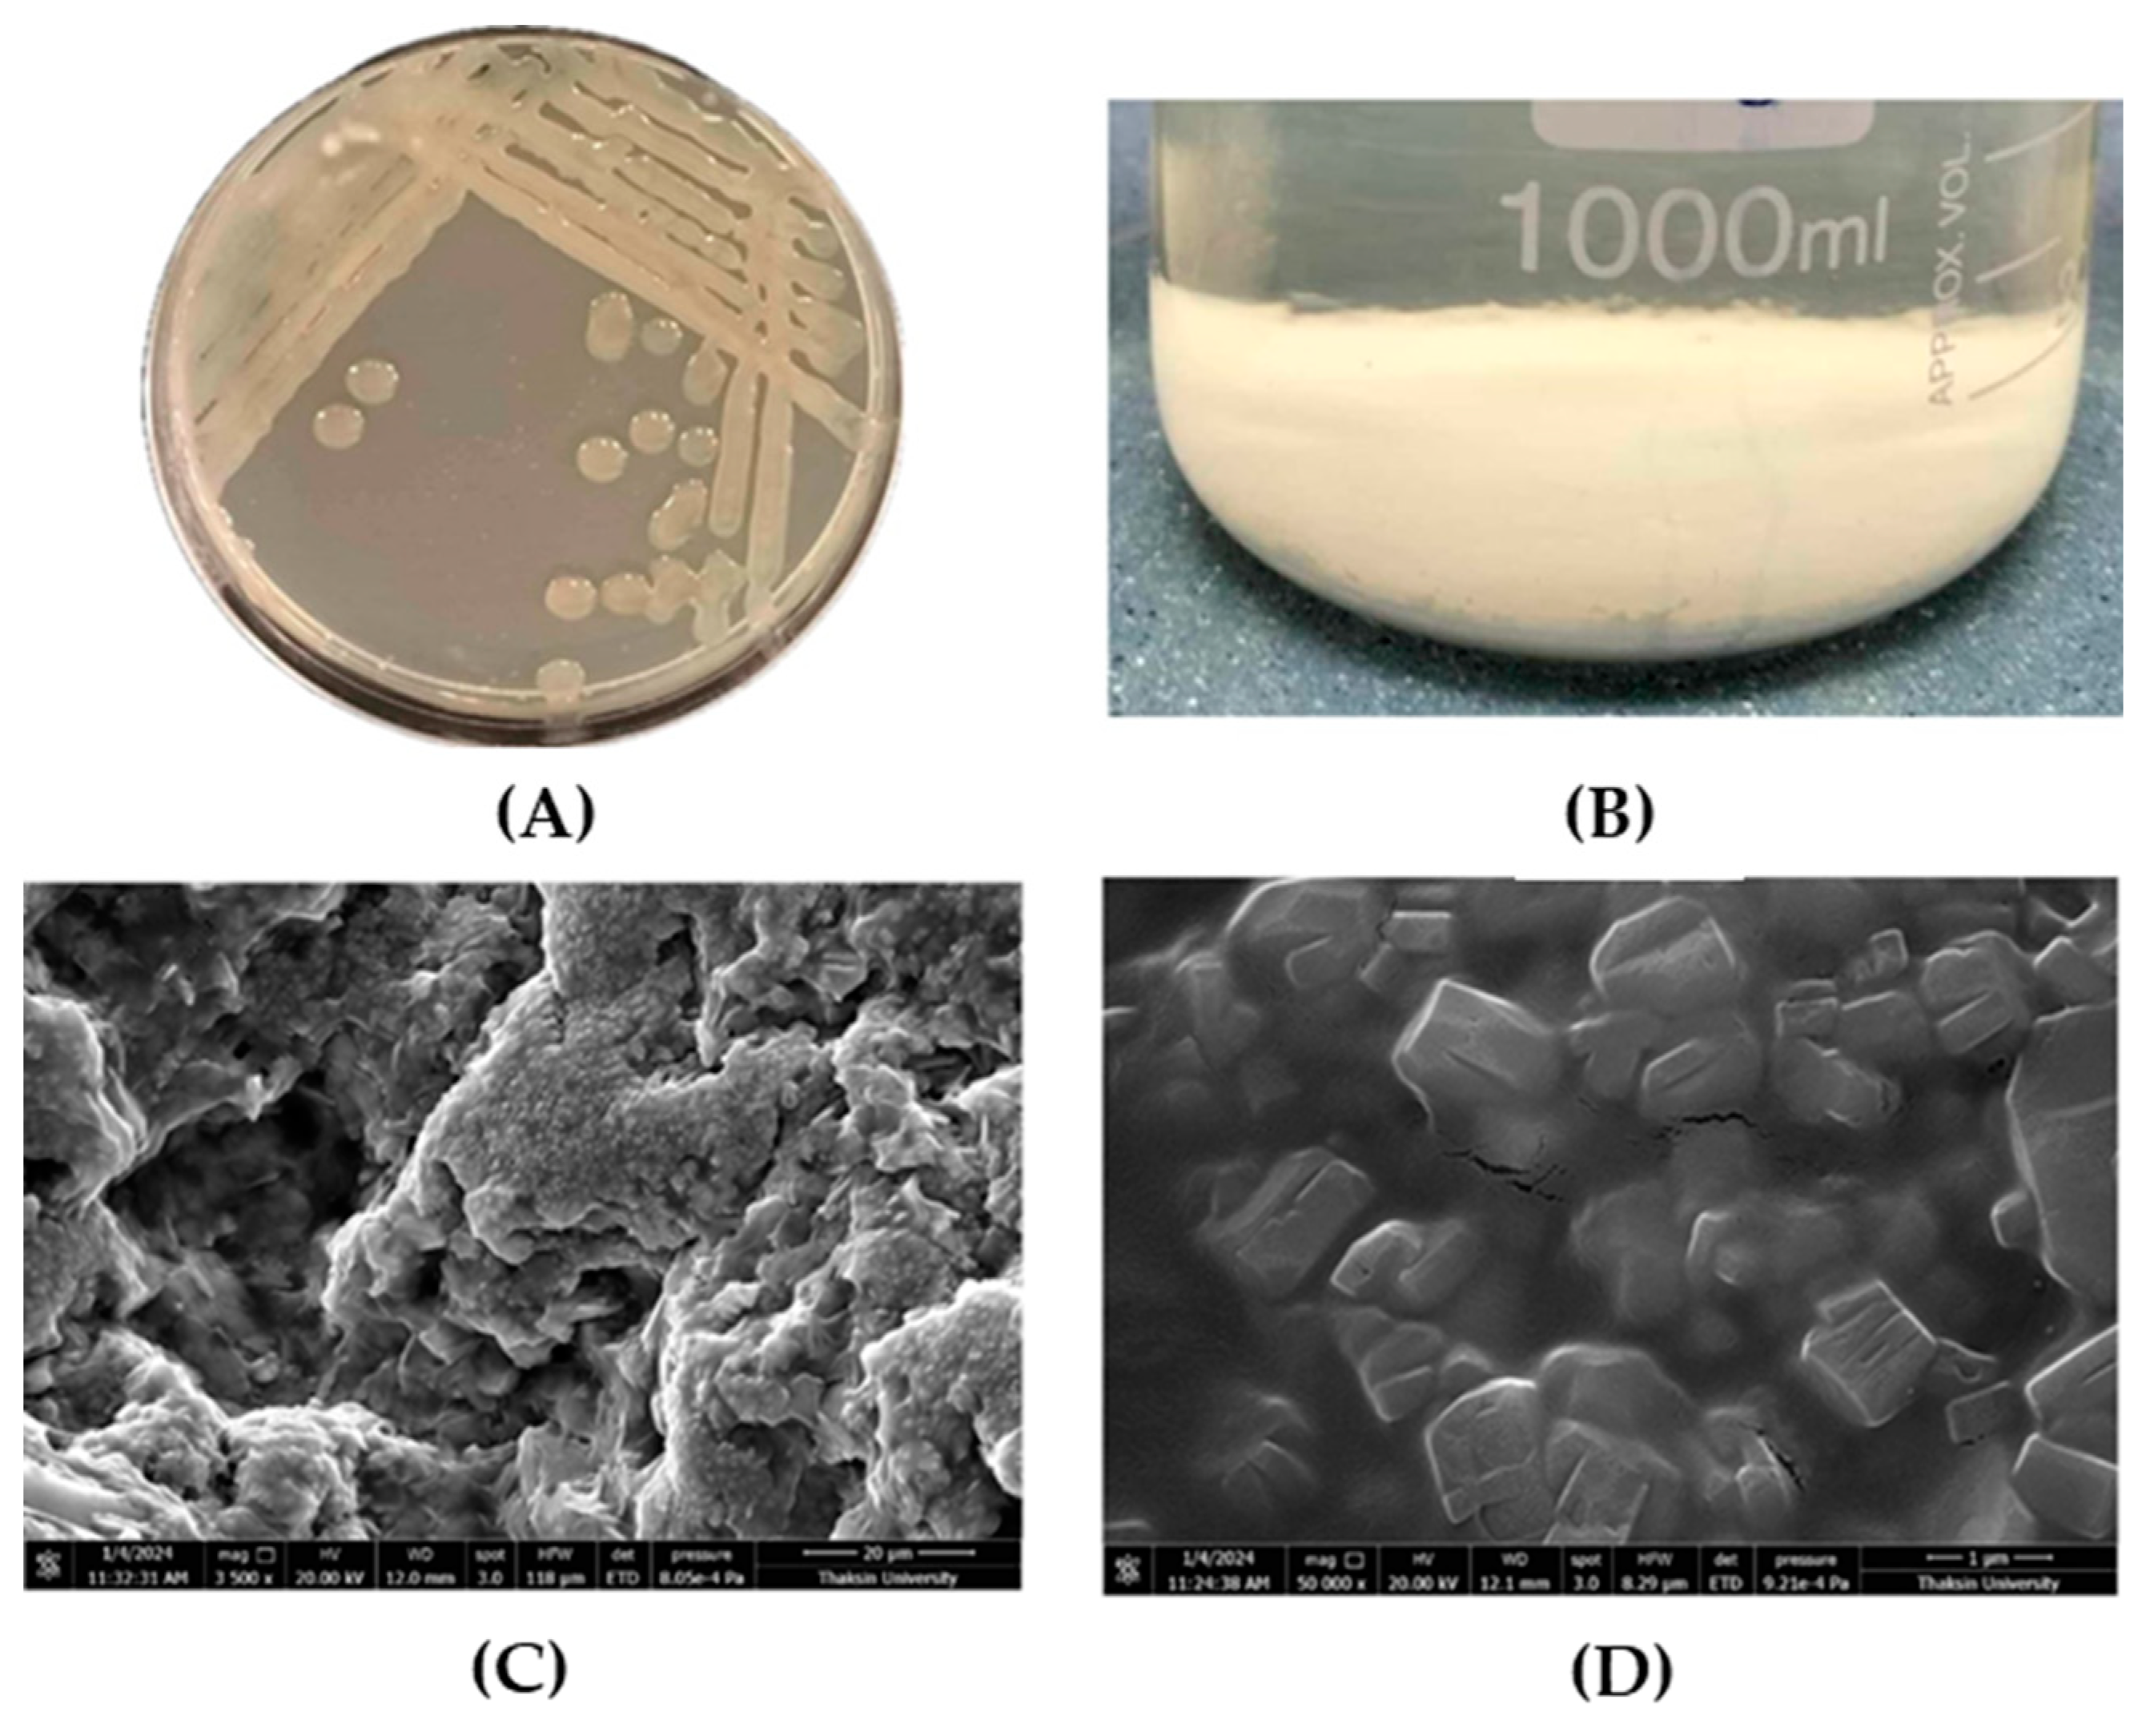
Figure 4.
In vitro biological activities of EPS from B. subtilis P1 (A) The growth of probiotic B. amyloliquefaciens with 0.5% (w/v) EPS and without EPS supplementation (B) DPPH radical scavenging activity of different concentrations of the EPS (C) The antibacterial activity profile of EPS against fish pathogens (expressed as diameter of inhibition zone in mm), and (D) Cytotoxicity test (% hemolysis) of the produced EPS from B. subtilis P1. Error bars represent mean ± SE and *Sig. 2-tailed: p<0.05 independent t-test
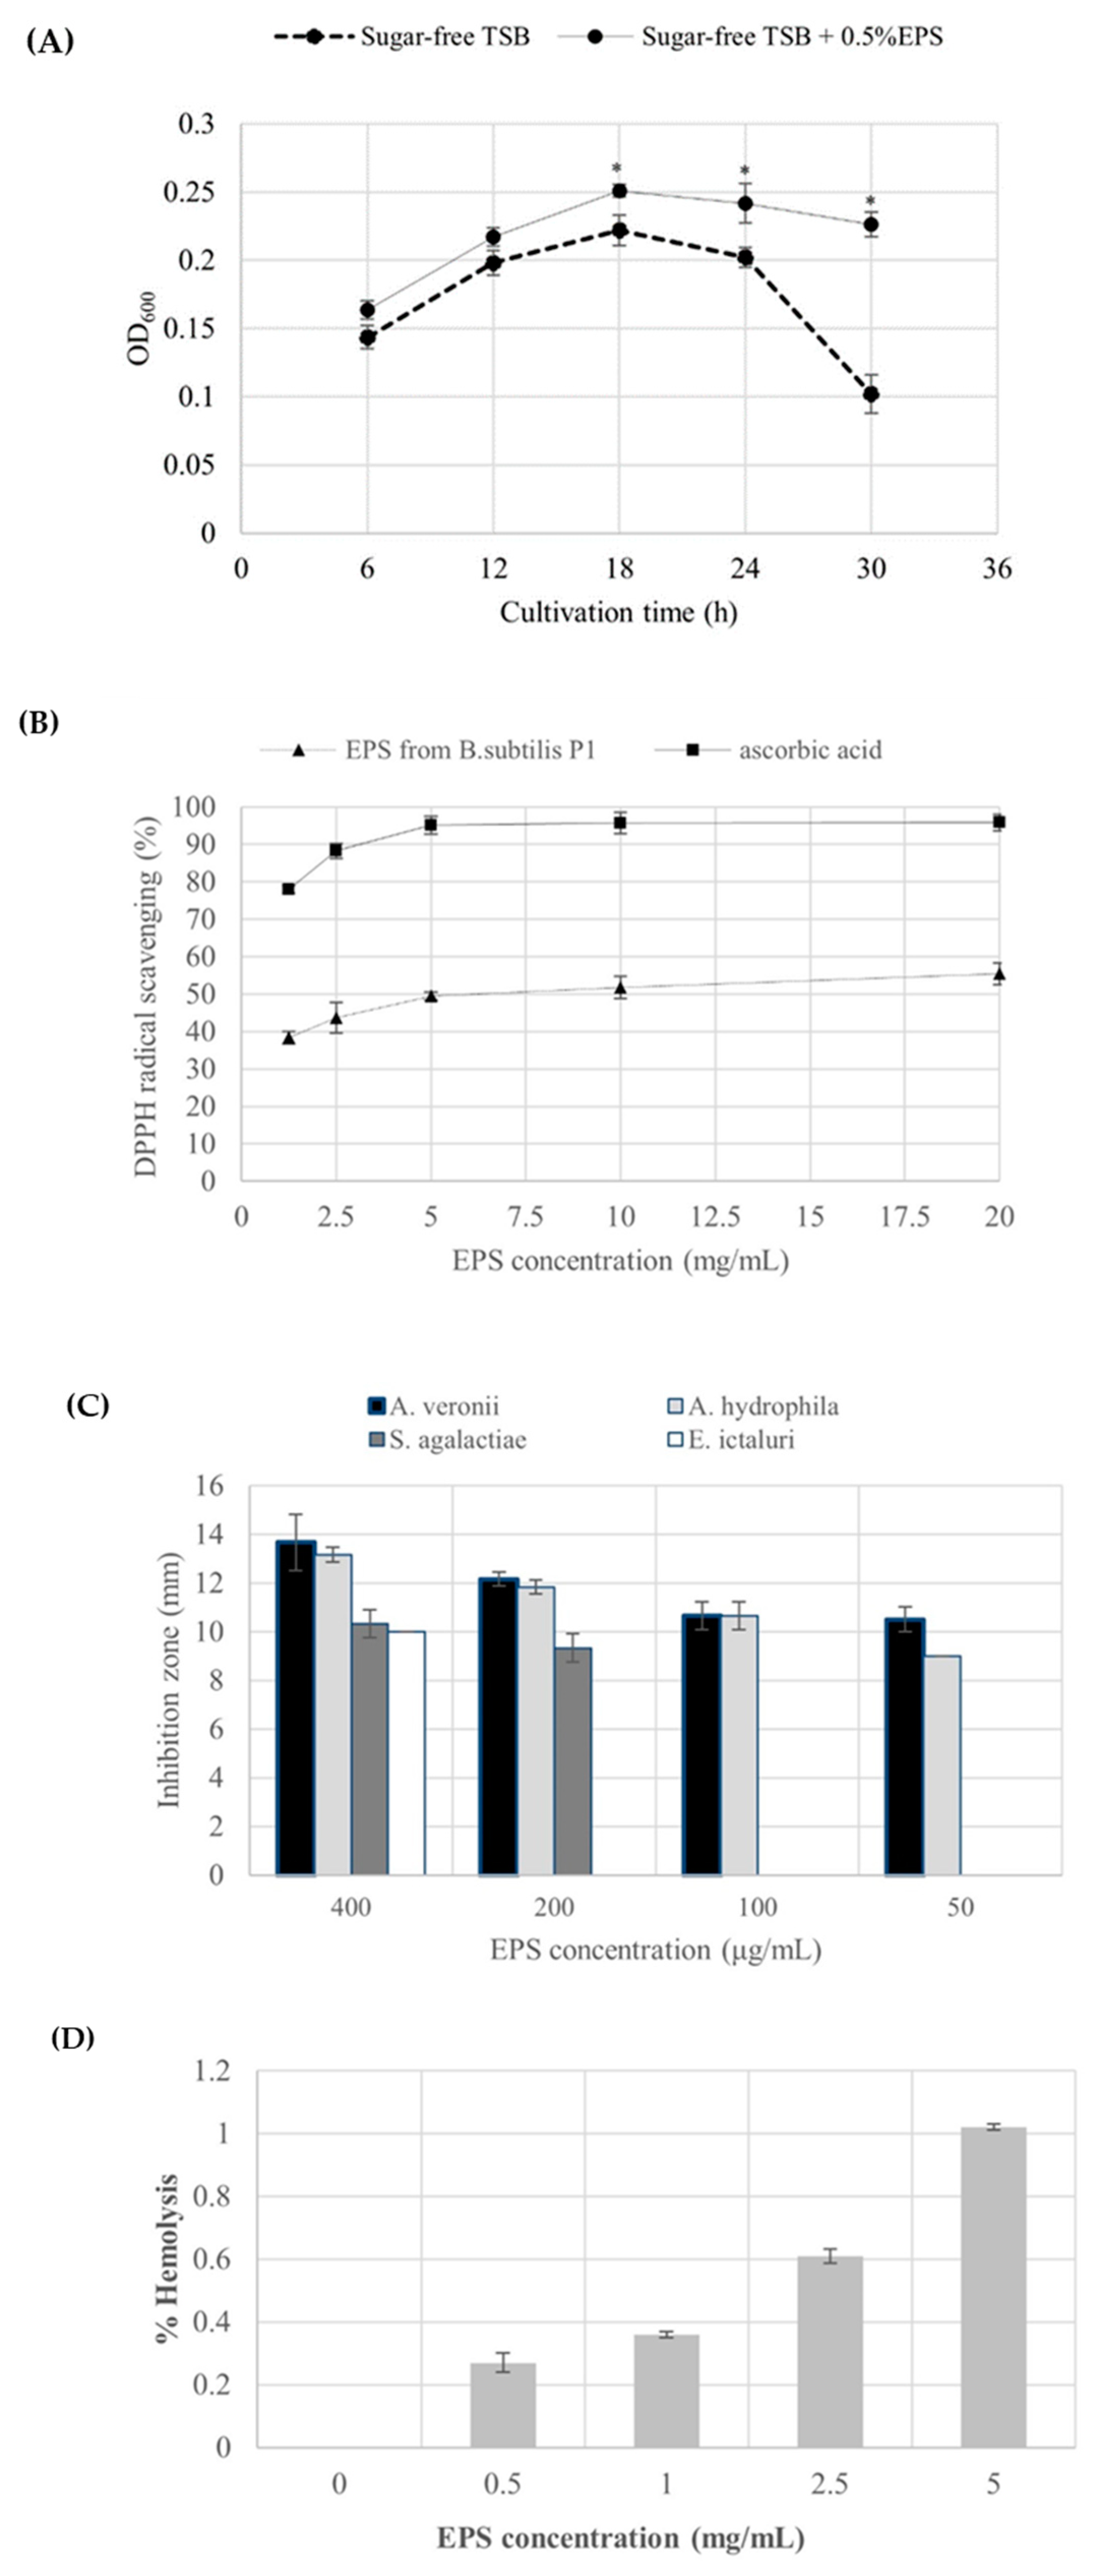

Table 1.
Molecular weight (Mw), molecular number (Mn), and polydispersity index (PDI) of the purified EPS
Table 1.
Molecular weight (Mw), molecular number (Mn), and polydispersity index (PDI) of the purified EPS
| Bacterial strain | Mw (Da) | Mn (Da) | PDI | References |
|---|---|---|---|---|
| Lb. plantarum C7 | 3.37 x 10⁴ | 0.85 x 10⁴ | 3.96 | Ziadi et al. [31] |
| Lb.delbrueckii subsp. bulgaricus | 104 to 106 | n.r. | n.r | Jurášková et al. [50] |
| Lactobacillus sp. B3-1 | 8.31 x 10⁵ | 3.38 x 10⁵ | 2.46 | This study |
| B.amyloliquefaciens GSBa-1 | 5.40 x 10⁴ | n.r. | 1.78 | Zhao et al. [19] |
| B. velezensis KY471306 | 1.29 x 10⁵ | 1.14 x 10⁵ | 1.13 | Moghannem et al. [21] |
| B.subtilis | 0.57 to 1.28 x 10⁵ | n.r. | n.r | Marvasi et al. [45] |
| Bacillus sp. P1 | 9.81 x 10⁵ | 6.04 x 10⁵ | 1.62 | This study |
Lb.; Lactobacillus and B.; Bacillus n.r.; not reported.
Table 2.
ANOVA for the fitted quadratic polynomial regression model using BBD.
| Source | Sum of Squares | Mean Square | F-value | p-value* |
| Model | 6.268E+05 | 69645.11 | 20.23 | 0.0003 |
| A:sucrose | 33303.93 | 33303.93 | 9.67 | 0.0171 |
| B:yeast extract | 33697.38 | 33697.38 | 9.79 | 0.0166 |
| C:(NH4)2SO4 | 55461.15 | 55461.15 | 16.11 | 0.0051 |
| AB | 8689.97 | 8689.97 | 2.52 | 0.1561 |
| AC | 3863.24 | 3863.24 | 1.12 | 0.3246 |
| BC | 9259.25 | 9259.25 | 2.69 | 0.1450 |
| A² | 59541.62 | 59541.62 | 17.30 | 0.0042 |
| B² | 51357.16 | 51357.16 | 14.92 | 0.0062 |
| C² | 3.325E+05 | 3.325E+05 | 96.59 | < 0.0001 |
| Lack of Fit | 22795.51 | 7598.50 | 23.36 | 0.0054 |
| Pure Error | 1301.35 | 325.34 | - | - |
| R² | 0.9630 | - | - | |
| Adjusted R² | 0.9154 | - | - | - |
*P< 0.05 indicate model terms are significant.
Table 3.
Growth performances and feed utilization of Nile tilapia for 6 weeks feeding
| Duration (week) | Experiment | Growth performance parameters | |||||
| Weight gain | Specific growth rate (%) | Average daily gain | Feed conversion rate (g/g) | ||||
| av. per tank (g) | av. per fish (g) | av. per tank (g/day) | av. per fish (g/day) | ||||
| 2 | Control | 527.55±13.35a | 21.10 | 4.83±0.08a | 37.68±0.95a | 1.51 | 1.30±0.06a |
| Treatment | 529.40±19.83a | 21.18 | 4.98±0.14a | 37.81±1.42a | 1.51 | 1.36±0.05a | |
| 4 | Control | 990.28±25.91b | 39.61 | 3.69±0.03b | 35.37±0.93b | 1.41 | 0.66±0.03b |
| Treatment | 1,047.00±11.80c | 41.88 | 3.92±0.07c | 37.40±0.42c | 1.50 | 0.71±0.02b | |
| 6 | Control | 1,403.86±34.17d | 56.15 | 3.03±0.03d | 33.43±0.81d | 1.34 | 0.42±0.04d |
| Treatment | 1,464.57±29.22d | 58.58 | 3.17±0.09d | 34.87±0.70d | 1.40 | 0.43±0.00d | |
Mean ±SE (n=3) having the same letter in the same row are not significantly different, av.: an abbreviation of average.
Table 4.
Immunological parameters and relative level of protection of Nile tilapia for 6 weeks feeding with EPS
Table 4.
Immunological parameters and relative level of protection of Nile tilapia for 6 weeks feeding with EPS
| Parameters | Control | Treatment |
|---|---|---|
| Lysozyme activity (U/min) | 3.37±0.13 | 6.88±0.16* |
| Respiratory burst activitya (OD630) | 0.10 | 0.44 |
| Total immunoglobulin (mg/dL) | 3±0 | 3±0 |
| Relative level of protection (%RLP) after 2 weeks challenge test |
0 | 50 |
Mean ±SE (n=3), * means significantly different (p<0.05) determined by an independent T-test analysis. a Absorbance can be used to estimate respiratory burst activity as described by Hampton et al.(2020) [40].
Table 5.
Blood chemical parameters and proximate chemical analysis.
| Analysis | Parameters | Control | Treatment |
|---|---|---|---|
| Blood chemistry | Blood urea nitrogen (mg/dL) | 3±1 | 3±0 |
| Glucose (mg/dL) | 98.33±15.89a | 118.67±11.59ab | |
| ALT (U/L) | 12.67±7.77 | 15.33±3.51 | |
| AST (U/L) | 68.33±32.59 | 58.67±30.29 | |
| Total bilirubin (mg/dL) | 0.23±0.06 | 0.20±0.00 | |
| Direct bilirubin (mg/dL) | 0.26±0.05 | 0.23±0.05 | |
| Total cholesterol (mg/dL) | 197.33±5.03 | 190.67±16.29 | |
| Total protein (g/dL) | 4.30±0.26 | 4.43±0.06 | |
| Albumin (mg/dL) | 1.47±0.06 | 1.43±0.06 | |
| Proximate chemical compositions (AOAC 2000*) |
Crude protein** | 17.80±0.04 | 19.02±0.10 |
| Crude fat | 0.33±0.01 | 0.83±0.03 | |
| Moisture content | 71.91±0.50 | 69.86±0.20 | |
| Ash | 1.85±0.01 | 2.30±0.02 | |
| Carbohydrate | 8.11±0.02 | 7.99±0.06 |
Mean ±SE (n=3) having the same letter in the same row are not significantly different. *Proximate chemical analysis in the unit of g/100g. ** Total nitrogen calculated by % nitrogen x 6.25.
Disclaimer/Publisher’s Note: The statements, opinions and data contained in all publications are solely those of the individual author(s) and contributor(s) and not of MDPI and/or the editor(s). MDPI and/or the editor(s) disclaim responsibility for any injury to people or property resulting from any ideas, methods, instructions or products referred to in the content. |
© 2024 by the authors. Licensee MDPI, Basel, Switzerland. This article is an open access article distributed under the terms and conditions of the Creative Commons Attribution (CC BY) license (http://creativecommons.org/licenses/by/4.0/).
Copyright: This open access article is published under a Creative Commons CC BY 4.0 license, which permit the free download, distribution, and reuse, provided that the author and preprint are cited in any reuse.


