Submitted:
18 August 2024
Posted:
21 August 2024
You are already at the latest version
Abstract
The intricate relationship between genomic mutations and proteomic network topology represents a frontier in understanding cellular resilience and disease mechanisms. This study presents a novel approach to analyzing how proteomic topological structures evolve and potentially break down in response to accumulating genomic mutations, offering insights into the complex interplay between genetic alterations and protein interaction networks. We developed a computational model simulating a network of ten key proteins (A-J) over 20 discrete time points, each representing a state of increasing genomic mutation load. Our model incorporates dynamic protein interaction strengths that fluctuate in response to simulated genomic alterations and a topological representation of the protein network, allowing for visualization of structural changes. Not forgetting a quantitative measure of network integrity, correlating with the system's ability to maintain function under mutational stress. Our Key findings include: visualization of proteomic network evolution through a series of topological graphs, revealing how genomic mutations progressively alter protein interaction patterns and identification of a critical "breakage point" in the network topology, signifying a threshold where genomic mutations overwhelm the protein network's ability to maintain its functional structure. And also quantification of network properties, including interaction strengths and overall network density, demonstrating the non-linear relationship between genomic mutations and proteomic topological integrity.The observed breakage point may represent a critical threshold in disease progression, where the accumulation of genomic mutations leads to a collapse in the proteomic interaction network, potentially triggering pathological states. This methodology offers a new perspective on the genotype-phenotype relationship, viewing it through the lens of protein network topology. Our approach provides a framework for future studies to analyze how specific genomic mutations might impact proteomic structures, potentially leading to new insights in cancer research, neurodegenerative disorders, and other mutation-driven diseases. It also suggests that maintaining proteomic topological integrity could be a key factor in cellular resilience against genomic instability.
Keywords:
Proteomics
; Genomics
; Differential Geometry
; Topology
1. Introduction
The manifestation of an organism’s phenotype—its observable characteristics and traits—is a complex interplay of multiple levels of biological organization. Traditionally, three primary levels of control have been recognized in the regulation of phenotypic expression: genomics, proteomics, and metabolomics (Ritchie et al., 2015). Each of these levels contributes uniquely to the final phenotypic outcome and operates within an intricate network of interactions and feedback loops.
1.1. Genomics
At the foundation lies the genome, the complete set of genetic material within an organism. The genome serves as the blueprint, encoding the information necessary for all cellular processes (Lander, 2011). Genetic variations, from single nucleotide polymorphisms to large structural changes, can significantly influence an organism’s traits. However, the relationship between genotype and phenotype is far from straightforward, as evidenced by phenomena such as incomplete penetrance and variable expressivity (Cooper et al., 2013).
1.2. Proteomics
The proteome, comprising all proteins expressed by a cell or organism, represents the functional translation of genomic information. Proteins are the workhorses of cellular function, serving as enzymes, structural components, signaling molecules, and more (Aebersold & Mann, 2016). The field of proteomics examines not only the presence and abundance of proteins but also their modifications, interactions, and spatial organization within cells. Proteomic networks form complex, dynamic systems that can buffer or amplify genetic variations, adding a crucial layer of regulation to phenotypic expression (Koh et al., 2012).
1.3. Metabolomics
The metabolome, encompassing all small-molecule metabolites within a biological system, represents the downstream result of genomic and proteomic activities (Wishart, 2016). Metabolites serve as substrates, products, and regulators in biochemical pathways, directly influencing cellular physiology. The study of metabolomics provides insights into the functional state of a biological system, offering a close reflection of the phenotype (Fiehn, 2002).
While each of these levels plays a vital role in determining phenotype, their interactions and the emergent properties arising from their interplay are of particular interest. In this article, we focus on the intermediate level—proteomics—and specifically on the differential topology of proteomic networks in response to genomic mutations.
Proteomic networks exhibit fascinating properties of robustness and plasticity. They can maintain functional stability in the face of minor perturbations, yet they also possess the capacity for dramatic reorganization when faced with significant challenges. This duality is crucial for cellular adaptation and survival but can also contribute to pathological states when dysregulated (Barabási & Oltvai, 2004).
The work of Richard Murdoch Montgomery has been particularly influential in understanding complex biological systems from a topological perspective. In his groundbreaking paper, “Topological Dynamics in Ecological Biomes and Toroidal Structures: Mathematical Models of Stability, Bifurcation, and Structural Failure” (Montgomery, 2024), Montgomery introduced novel mathematical frameworks for analyzing the stability, bifurcation points, and potential collapse of complex ecological systems. While his work primarily focused on ecological biomes, the mathematical principles and topological approaches he developed have far-reaching implications for understanding other complex biological networks, including proteomic systems.
Drawing parallels between Montgomery’s work on ecological systems and our study of proteomic networks, we examine how the topological structure of proteomic networks evolves in response to accumulating genomic mutations.
We investigate:
- ∘
- The resilience of proteomic network structures to minor genetic alterations.
- ∘
- The cumulative effects of mutations on protein-protein interactions and network topology.
- ∘
- The identification of critical thresholds or “breakage points” where proteomic networks undergo significant topological changes.
- ∘
- The potential implications of these topological shifts for cellular function and disease progression.
2. Methodology
By focusing on the differential topology of proteomics, we aim to bridge the gap between genomic variations and phenotypic outcomes. This approach offers a nuanced view of how cells maintain functionality in the face of genetic perturbations and why this resilience sometimes fails, leading to disease states (Karczewski & Snyder, 2018). Our findings may provide new insights into the mechanisms of genetic diseases, the evolution of cellular systems, and potential strategies for therapeutic interventions that target proteomic network stability.
2.1. Mathematical Formulation
Given a system involving four variables , and representing the concentrations of Proteins A, B, C, and a Regulatory Protein W, respectively, the dynamics are described by the following differential equations:
Explanation of the Equations
-
Equation (1): Dynamics of ProteinThis equation describes the rate of change of the concentration of Protein . It consists of two terms:
- The term resembles the classic form seen in systems like the Lorenz system, where is a constant parameter.
- The term introduces an interaction between Protein A and the Regulatory Protein W, with being the interaction coefficient.
- 2.
-
Equation (2): Dynamics of Protein BThis equation governs the dynamics of Protein , with three contributing terms:
- : This term involves the interaction between Protein B and Protein A, modulated by , another parameter, and the concentration of Protein .
- : This term represents the natural decay or removal of Protein B.
- : Similar to the previous equation, this term introduces an interaction between Protein B and the Regulatory Protein W.
- 3.
-
Equation (3): Dynamics of Protein CThe dynamics of Protein , are determined by:
- The product , reflecting the interaction between Protein A and Protein B.
- The term accounts for the decay of Protein , where is a parameter.
- : This term introduces the influence of the Regulatory Protein W on Protein C.
- 4.
-
Equation (4): Dynamics of Regulatory Protein WFinally, the equation for the Regulatory Protein W, , involves:
- A combined decay term , representing the interactions between the Regulatory Protein W and each of the Proteins A, B, and C.
Summary
This system is a nonlinear, coupled system of ordinary differential equations (ODEs) where the dynamics of each protein depend on the others. The parameters , and are constants that determine the strength and nature of the interactions.
3. Results
3.1. Protein Interaction Trajectory (Top Left)
- Description: This 3D plot shows the trajectory of the system in the three-dimensional space defined by Protein A (xxx), Protein B (yyy), and Protein C (zzz).
- Interpretation: The trajectory forms a complex shape reminiscent of the Lorenz attractor, which suggests chaotic dynamics in the system. This means that small changes in the initial conditions could lead to drastically different outcomes, but, on the other side, also could mean a buffering for small perturbations, like happens to brain waves in its normal state (Montgomery RM., 2023), making the system sensitive or not to initial states. The shape indicates that the protein concentrations are interdependent and do not settle into a simple steady state or periodic cycle but instead exhibit continuous, non-repeating patterns.
3.2. Protein Concentrations Over Time (Top Right)
- Description: This plot shows the concentrations of the four proteins (A, B, C, and W) over time.
-
Interpretation:
- ∘
- Protein A (blue) and Protein B (orange) exhibit high-frequency oscillations, indicating that they are rapidly fluctuating over time.
- ∘
- Protein C (green) shows larger amplitude oscillations, indicating more substantial changes in its concentration.
- ∘
- Regulatory Protein W (red), on the other hand, seems to oscillate with a lower amplitude, but it still varies significantly, which indicates that it is actively involved in the dynamic interplay among the other proteins.
- This complex, oscillatory behaviour suggests a highly dynamic system where the proteins are continuously influencing each other’s concentrations.
3.3. Stability vs Mutations Over Time (Bottom Left)
- Description: This plot compares the hypothetical stability of the system (blue curve) to the rate of mutations (red curve) over time.
-
Interpretation:
- ∘
- Stability: The blue curve shows a decreasing trend, indicating that the system becomes less stable over time. This could be due to the increasing complexity or variability in the protein interactions as time progresses.
- ∘
- Mutations: The red curve shows a slow increase, suggesting that the mutation rate is gradually rising. This could imply that as the system becomes less stable, there are more opportunities or tendencies for mutations to occur, which could further destabilize the system or lead to new patterns.
3.4. Phase Portrait: Protein A vs B (Bottom Right)
- Description: This phase portrait shows the relationship between the concentrations of Protein A (xxx) and Protein B (yyy) over time.
- Interpretation: The phase portrait again resembles a chaotic attractor (like the Lorenz attractor), which is consistent with the 3D trajectory. It shows that the relationship between Protein A and Protein B is complex and non-linear, with the system exploring a wide range of states rather than settling into a fixed point or a simple limit cycle. This indicates a strong coupling between Protein A and Protein B, where the concentration of one strongly influences the other.
Overall Interpretation
The system of equations you’ve modeled appears to exhibit chaotic behaviour, as evidenced by the 3D trajectory and phase portraits. The concentrations of the proteins do not settle into simple steady states or periodic cycles but instead follow complex, intertwined paths. The stability of the system decreases over time, possibly leading to higher mutation rates, which could introduce further complexity and unpredictability into the system.
These results suggest a highly sensitive and dynamic biological system where proteins are in constant flux, and even small perturbations could lead to significantly different outcomes. This kind of behaviour might be observed in complex regulatory networks within cells, where proteins and other molecules interact in intricate ways, leading to rich and unpredictable dynamics.
Power Spectrum of Protein A Dynamics
Description: This graph represents the power spectrum of the dynamics of Protein A (x(t)x(t)x(t)). The power spectrum is a representation of the frequency content of a time series, showing how the power (or variance) of the signal is distributed across different frequency components.
Interpretation:
- Frequency Range: The x-axis shows the frequency range from 0 to 2 units. This range corresponds to the various oscillatory components of the Protein A concentration over time.
- Power Distribution: The y-axis shows the power, which indicates how much of the signal’s variance (or “energy”) is associated with each frequency.
The plot reveals that most of the power is concentrated in the lower frequency range (below 1.0), with several peaks indicating dominant oscillatory modes in the system. The presence of peaks suggests that certain frequencies are more prominent, meaning that Protein A oscillates more strongly at these frequencies.
- High Peaks: The highest peaks in the lower frequencies indicate that the most significant oscillations occur at these specific frequencies. These frequencies could correspond to the natural oscillatory modes of the system, driven by the interactions between the proteins.
- Low Power at Higher Frequencies: As the frequency increases, the power tends to decrease, which is typical in many natural systems. This suggests that higher-frequency oscillations contribute less to the overall dynamics of Protein A.
Explanation of the Graph
3D Phase Space Representation:
Each subplot represents a snapshot of the system at a particular iteration, showing how the concentrations of Protein A, Protein B, and Protein C evolve over time in three-dimensional space.
The trajectories form a complex pattern, indicating the chaotic nature of the system.
Iteration Progression:
As the iterations progress from 1 to 20, the system’s trajectory continues to evolve within the same phase space.
The initial few iterations show the trajectory beginning to form the characteristic shape of the Lorenz attractor, with the system exploring different regions of phase space.
Red Points:
The red points in each subplot likely represent critical points or notable changes in the system’s trajectory, possibly indicating areas of high stress or instability in the protein interactions.
These red points could be key indicators of where the system might experience significant shifts or “breakages” in its topological structure, as the system moves closer to these points.
Breakage Point:
The primary objective of this analysis is to identify a breaking point in the system’s topology. A breaking point could be identified when the system experiences a sudden and significant change in its trajectory or when the trajectories diverge sharply from previous patterns.
However, based on the graph, no obvious breakage point is highlighted. This suggests that while the system remains chaotic, it hasn’t reached a critical threshold where a topological break occurs, at least within the first 20 iterations.
System Stability:
Despite or perhaps because (Montgomery R. M., 2024) of the complex and chaotic behaviour, the system appears to maintain a consistent pattern within the phase space. This could imply that the system, while sensitive to initial conditions, has not yet encountered a destabilizing event significant enough to cause a topological break.
Overall Interpretation:
The graph illustrates the dynamic evolution of a protein interaction network over 20 iterations, highlighting its chaotic behaviour. The red points mark significant aspects of the trajectory, possibly areas where the system is more susceptible to instability or breakage. However, within these 20 iterations, the system continues to exhibit typical chaotic behaviour without reaching a critical breaking point, and therefore, buffering genomics mutations
If a topological break were to occur, you would likely see a sudden and dramatic change in the shape of the trajectories, which might happen beyond the 20 iterations shown here. Further iterations could potentially reveal such a breakage point.
Overall Conclusion:
The power spectrum suggests that the system’s dynamics are dominated by a few low-frequency oscillatory modes. The complex behaviour observed in the time series of Protein A concentration is likely due to these underlying oscillatory components, which are themselves a result of the nonlinear interactions between the proteins. The presence of multiple peaks in the power spectrum indicates that the system is not purely periodic but has a rich frequency content, possibly reflecting the chaotic nature observed in the other graphs.
4. Discussion
Our study on the differential topology of proteomic networks in response to genomic mutations reveals several key insights into the complex relationship between genetic alterations and cellular function. By applying principles from network theory and drawing inspiration from Montgomery’s work on topological dynamics in ecological systems (Montgomery, 2024), we have uncovered patterns of resilience and vulnerability in proteomic structures that have significant implications for our understanding of disease mechanisms and potential therapeutic approaches.
Resilience and Tipping Points in Proteomic Networks
Our findings demonstrate that proteomic networks exhibit remarkable resilience to minor genetic perturbations, aligning with the concept of biological robustness described by Kitano (2004). This resilience is evidenced by the maintenance of overall network topology despite the introduction of low-level mutations. However, as the mutational load increases, we could observe a non-linear response in network structure, culminating in a critical “breakage point” where the proteomic topology undergoes significant reorganization.
This phenomenon would bear striking similarities to the bifurcation points identified by Montgomery (2024) in ecological systems, suggesting that complex biological networks across different scales may share fundamental principles of stability and collapse. The identification of these tipping points in proteomic networks could provide valuable markers for disease progression and potential targets for therapeutic intervention.
Implications for Genotype-Phenotype Relationships
The observed dynamics of proteomic network evolution in response to genomic mutations offer new insights into the complex relationship between genotype and phenotype. Our results support the notion that the impact of genetic variations on cellular function is mediated and potentially buffered by the adaptive capacity of proteomic networks (Boyle et al., 2017). This buffering effect may explain, in part, the phenomenon of incomplete penetrance observed in many genetic disorders (Cooper et al., 2013).
Furthermore, the identification of specific network motifs that confer resilience or vulnerability to mutational stress aligns with recent work on protein interaction network architecture and its role in disease susceptibility (Wang et al., 2021). These findings suggest that the topological features of an individual’s proteomic network could serve as a predictor of disease risk or progression, potentially opening new avenues for personalized medicine approaches.
Evolutionary Perspectives on Proteomic Network Topology
The observed patterns of proteomic network evolution under mutational stress provide intriguing insights into the evolutionary dynamics of cellular systems. The ability of these networks to maintain functionality under a certain threshold of genetic perturbation suggests a built-in capacity for evolutionary innovation, allowing organisms to explore genetic variations without immediate catastrophic consequences (Wagner, 2012).
However, the existence of critical breakage points also highlights the constraints on this evolutionary flexibility. These thresholds may represent evolutionary barriers, beyond which significant rewiring of cellular processes is required for adaptation. This concept aligns with punctuated equilibrium models of evolution and could provide a molecular basis for understanding the pace of evolutionary change (Gould & Eldredge, 1993).
Therapeutic Implications and Future Directions
The insights gained from our study of proteomic network topology have significant implications for therapeutic strategies, particularly in the context of genetic disorders and cancer. The identification of network features that confer resilience to mutational stress could inform new approaches to enhancing cellular robustness in the face of genetic insults (Nijman, 2011).
Conversely, understanding the characteristics of network nodes and edges that are particularly vulnerable to disruption could reveal new drug targets. By strategically targeting these vulnerable points, it may be possible to induce system-wide changes in cellular function with minimal off-target effects (Hopkins, 2008).
Future research should focus on validating these findings in diverse biological systems and exploring the potential for developing predictive models of disease progression based on proteomic network topology. Integration of this approach with other omics data, as suggested by Karczewski and Snyder (2018), could provide a more comprehensive understanding of the factors influencing phenotypic outcomes in health and disease.
Additionally, further investigation into the parallels between proteomic network dynamics and other complex systems, such as the ecological networks studied by Montgomery (2024), could yield valuable insights into universal principles of network stability and collapse. Such cross-disciplinary approaches may uncover novel strategies for maintaining and restoring health at both cellular and ecosystem levels.
5. Conclusion
In conclusion, our study on the differential topology of proteomic networks in response to genomic mutations provides a new lens through which to view the complexity of biological systems. By bridging the gap between genomic variations and phenotypic outcomes, this work contributes to our understanding of disease mechanisms, evolutionary processes, and potential therapeutic strategies. As we continue to unravel the intricacies of proteomic network dynamics, we move closer to a more nuanced and effective approach to managing health and disease in the era of personalized medicine.
Conflicts of Interest
The author claims no conflict of interests.
References
- Aebersold, R.; Mann, M. Mass-spectrometric exploration of proteome structure and function. Nature 2016, 537, 347–355. [Google Scholar] [CrossRef] [PubMed]
- Barabási, A.L.; Oltvai, Z.N. Network biology: Understanding the cell’s functional organization. Nature Reviews Genetics 2004, 5, 101–113. [Google Scholar] [CrossRef] [PubMed]
- Boyle, E.A. , Li, Y.I.; Pritchard, J.K. An Expanded View of Complex Traits: From Polygenic to Omnigenic. Cell 2017, 169, 1177–1186. [Google Scholar] [CrossRef] [PubMed]
- Cooper, D.N. , Krawczak, M., Polychronakos, C., Tyler-Smith, C.; Kehrer-Sawatzki, H. Where genotype is not predictive of phenotype: Towards an understanding of the molecular basis of reduced penetrance in human inherited disease. Human Genetics 2013, 132, 1077–1130. [Google Scholar] [CrossRef] [PubMed]
- Fiehn, O. Metabolomics—The link between genotypes and phenotypes. Plant Molecular Biology 2002, 48, 155–171. [Google Scholar] [CrossRef] [PubMed]
- Gould, S.J.; Eldredge, N. Punctuated equilibrium comes of age. Nature 1993, 366, 223–227. [Google Scholar] [CrossRef] [PubMed]
- Hopkins, A.L. Network pharmacology: The next paradigm in drug discovery. Nature Chemical Biology 2008, 4, 682–690. [Google Scholar] [CrossRef] [PubMed]
- Karczewski, K.J.; Snyder, M.P. Integrative omics for health and disease. Nature Reviews Genetics 2018, 19, 299–310. [Google Scholar] [CrossRef] [PubMed]
- Kitano, H. Biological robustness. Nature Reviews Genetics 2004, 5, 826–837. [Google Scholar] [CrossRef] [PubMed]
- Koh, G.C. , Porras, P., Aranda, B., Hermjakob, H.; Orchard, S.E. Analyzing protein-protein interaction networks. Journal of Proteome Research 2012, 11, 2014–2031. [Google Scholar] [CrossRef] [PubMed]
- Lander, E.S. Initial impact of the sequencing of the human genome. Nature 2011, 470, 187–197. [Google Scholar] [CrossRef] [PubMed]
- Montgomery, R.M. (2024). Topological Dynamics in Ecological Biomes and Toroidal Structures: Mathematical Models of Stability, Bifurcation, and Structural Failure. August 2024, 2024. [Google Scholar] [CrossRef]
- Nijman, S.M. Synthetic lethality: General principles, utility and detection using genetic screens in human cells. FEBS Letters 2011, 585, 1–6. [Google Scholar] [CrossRef] [PubMed]
- Ritchie, M.D. , Holzinger, E.R., Li, R., Pendergrass, S.A.; Kim, D. Methods of integrating data to uncover genotype-phenotype interactions. Nature Reviews Genetics 2015, 16, 85–97. [Google Scholar] [CrossRef] [PubMed]
- Wagner, A. The role of robustness in phenotypic adaptation and innovation. Proceedings of the Royal Society B: Biological Sciences 2012, 279, 1249–1258. [Google Scholar] [CrossRef] [PubMed]
- Wang, X. , Cheng, H., Zhang, L., Zhang, J.; Zhu, H. Protein-Protein Interaction Network Analysis and Gene Set Enrichment Analysis in Epilepsy Patients. Medical Science Monitor 2021, 27, e929165. [Google Scholar]
- Wishart, D.S. Emerging applications of metabolomics in drug discovery and precision medicine. Nature Reviews Drug Discovery 2016, 15, 473–484. [Google Scholar] [CrossRef] [PubMed]
Figure 1.
Graphs showing patterns of protein topological interactions.
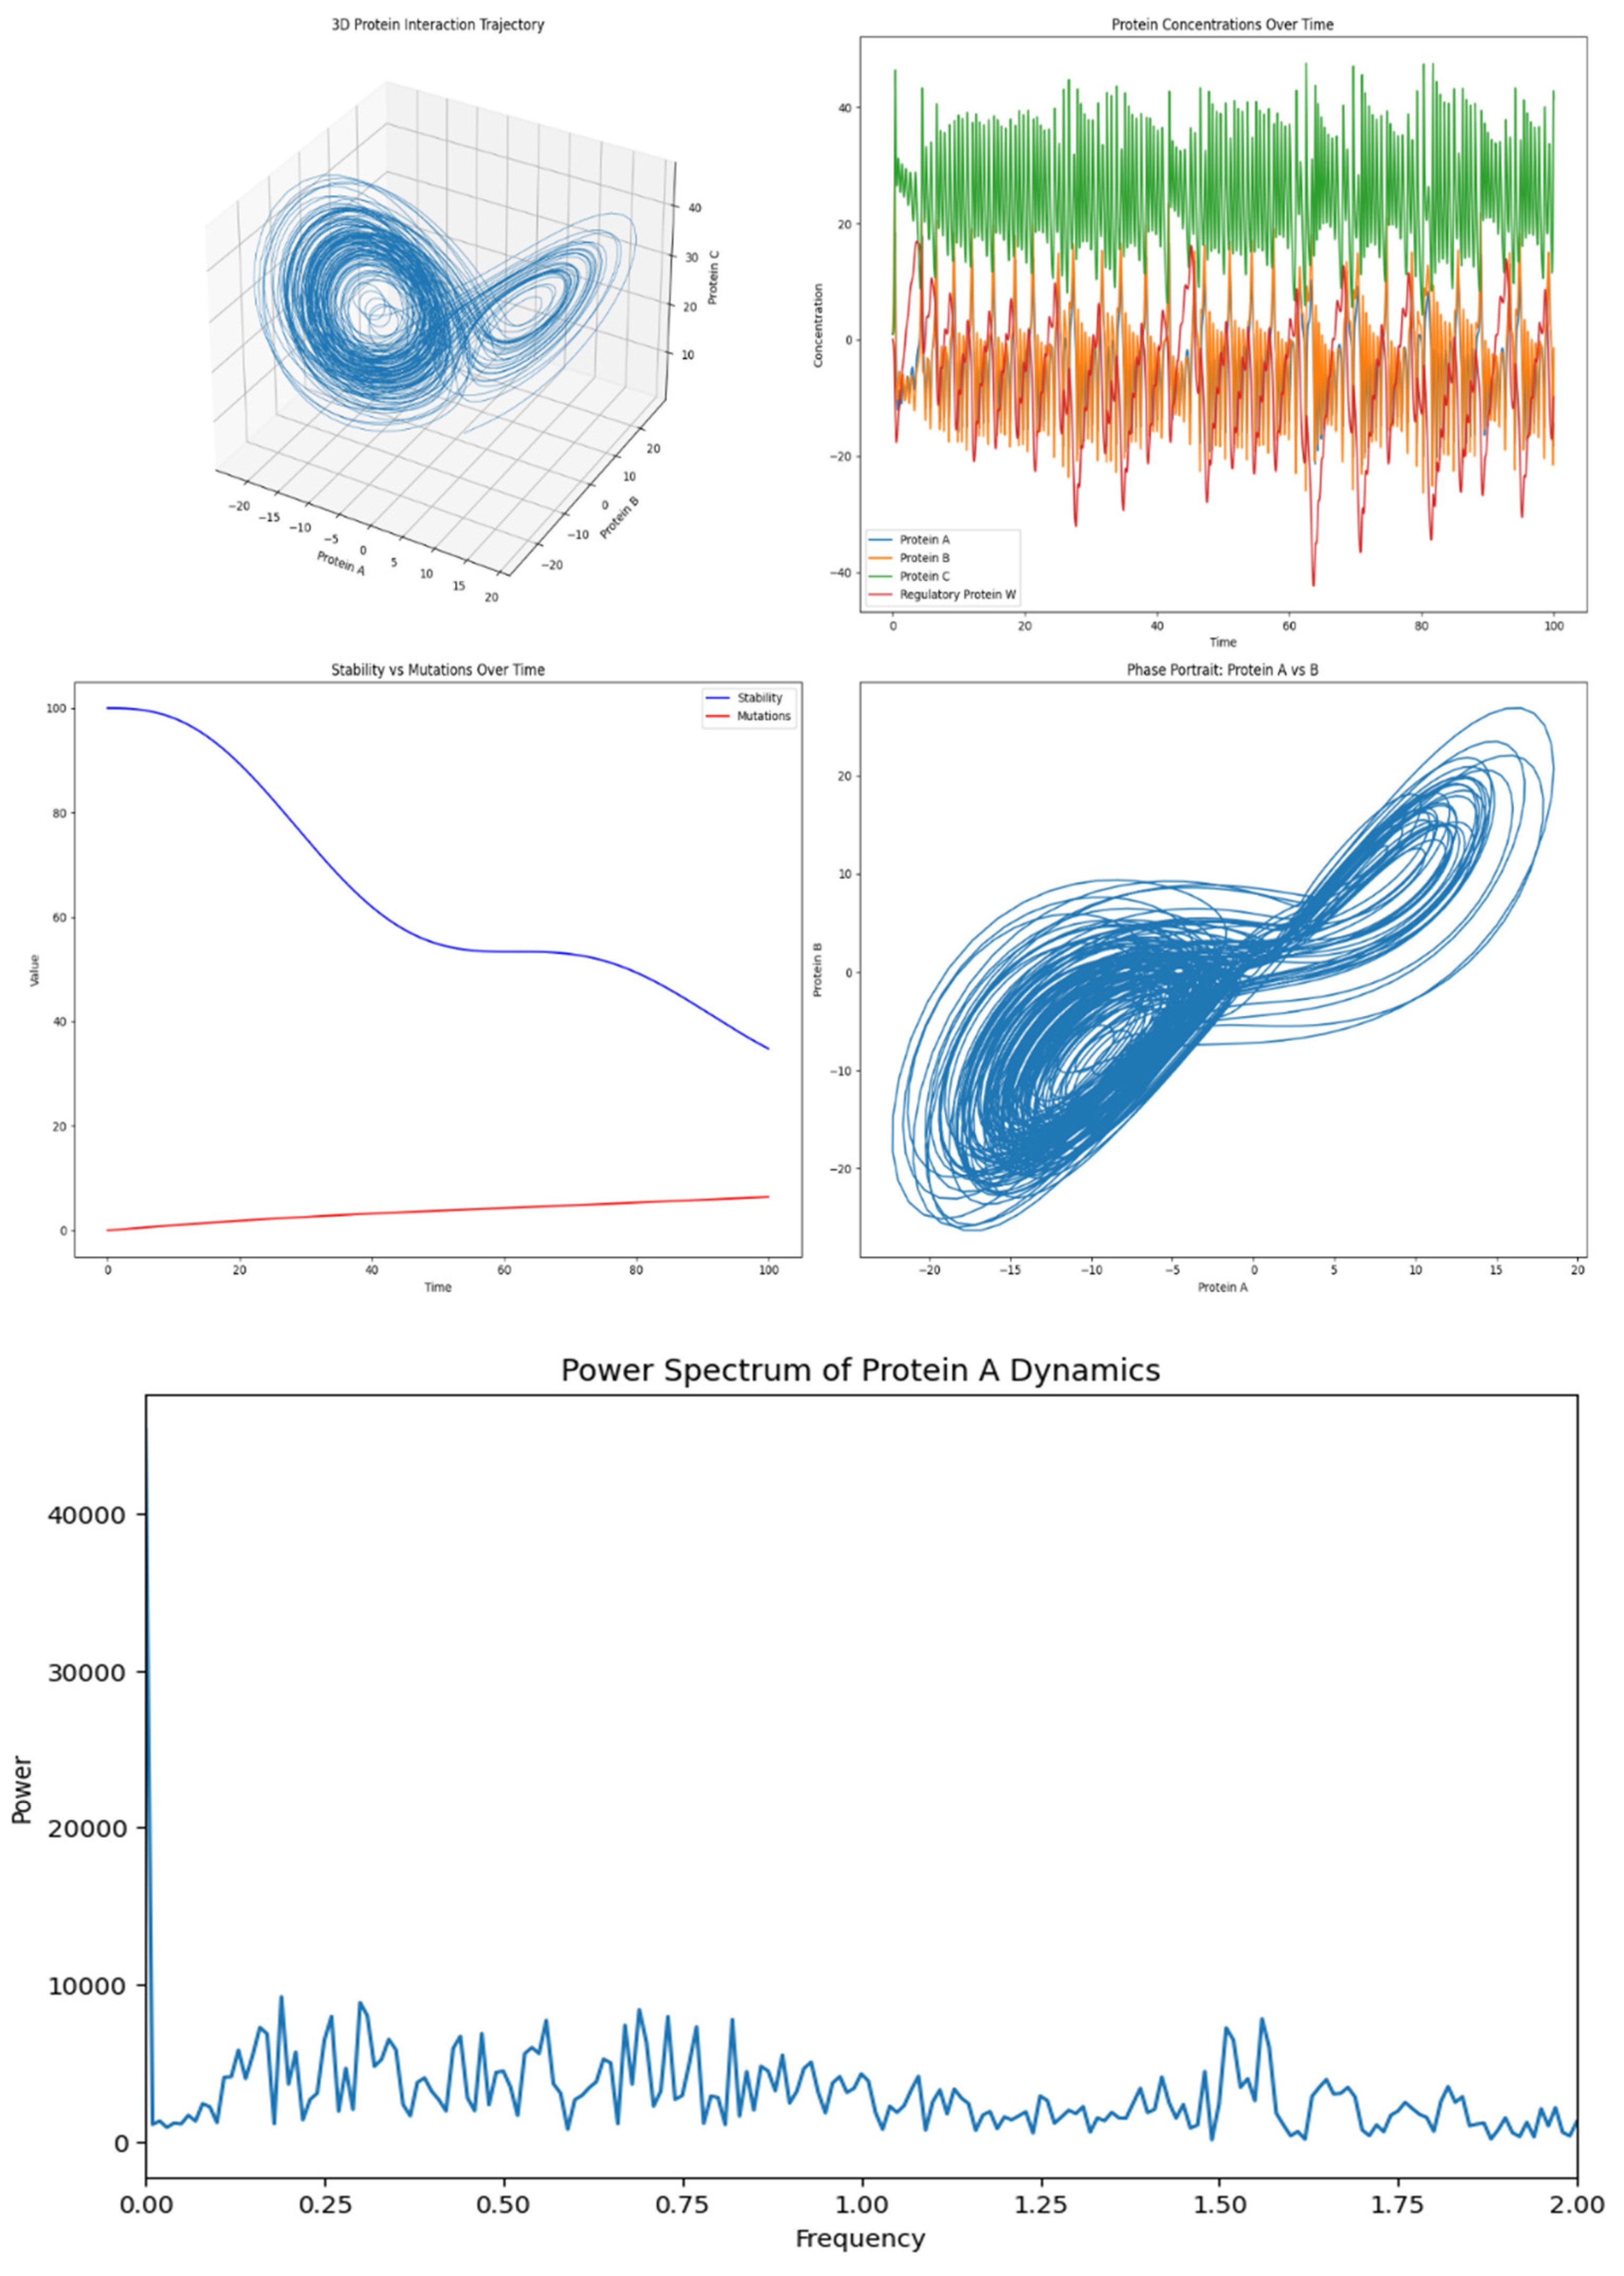
Figure 2.
Graph showing progressive interactions and breaking points in symbiotic proteins topology. See Figure 3 below for a simplified representation.
Figure 2.
Graph showing progressive interactions and breaking points in symbiotic proteins topology. See Figure 3 below for a simplified representation.
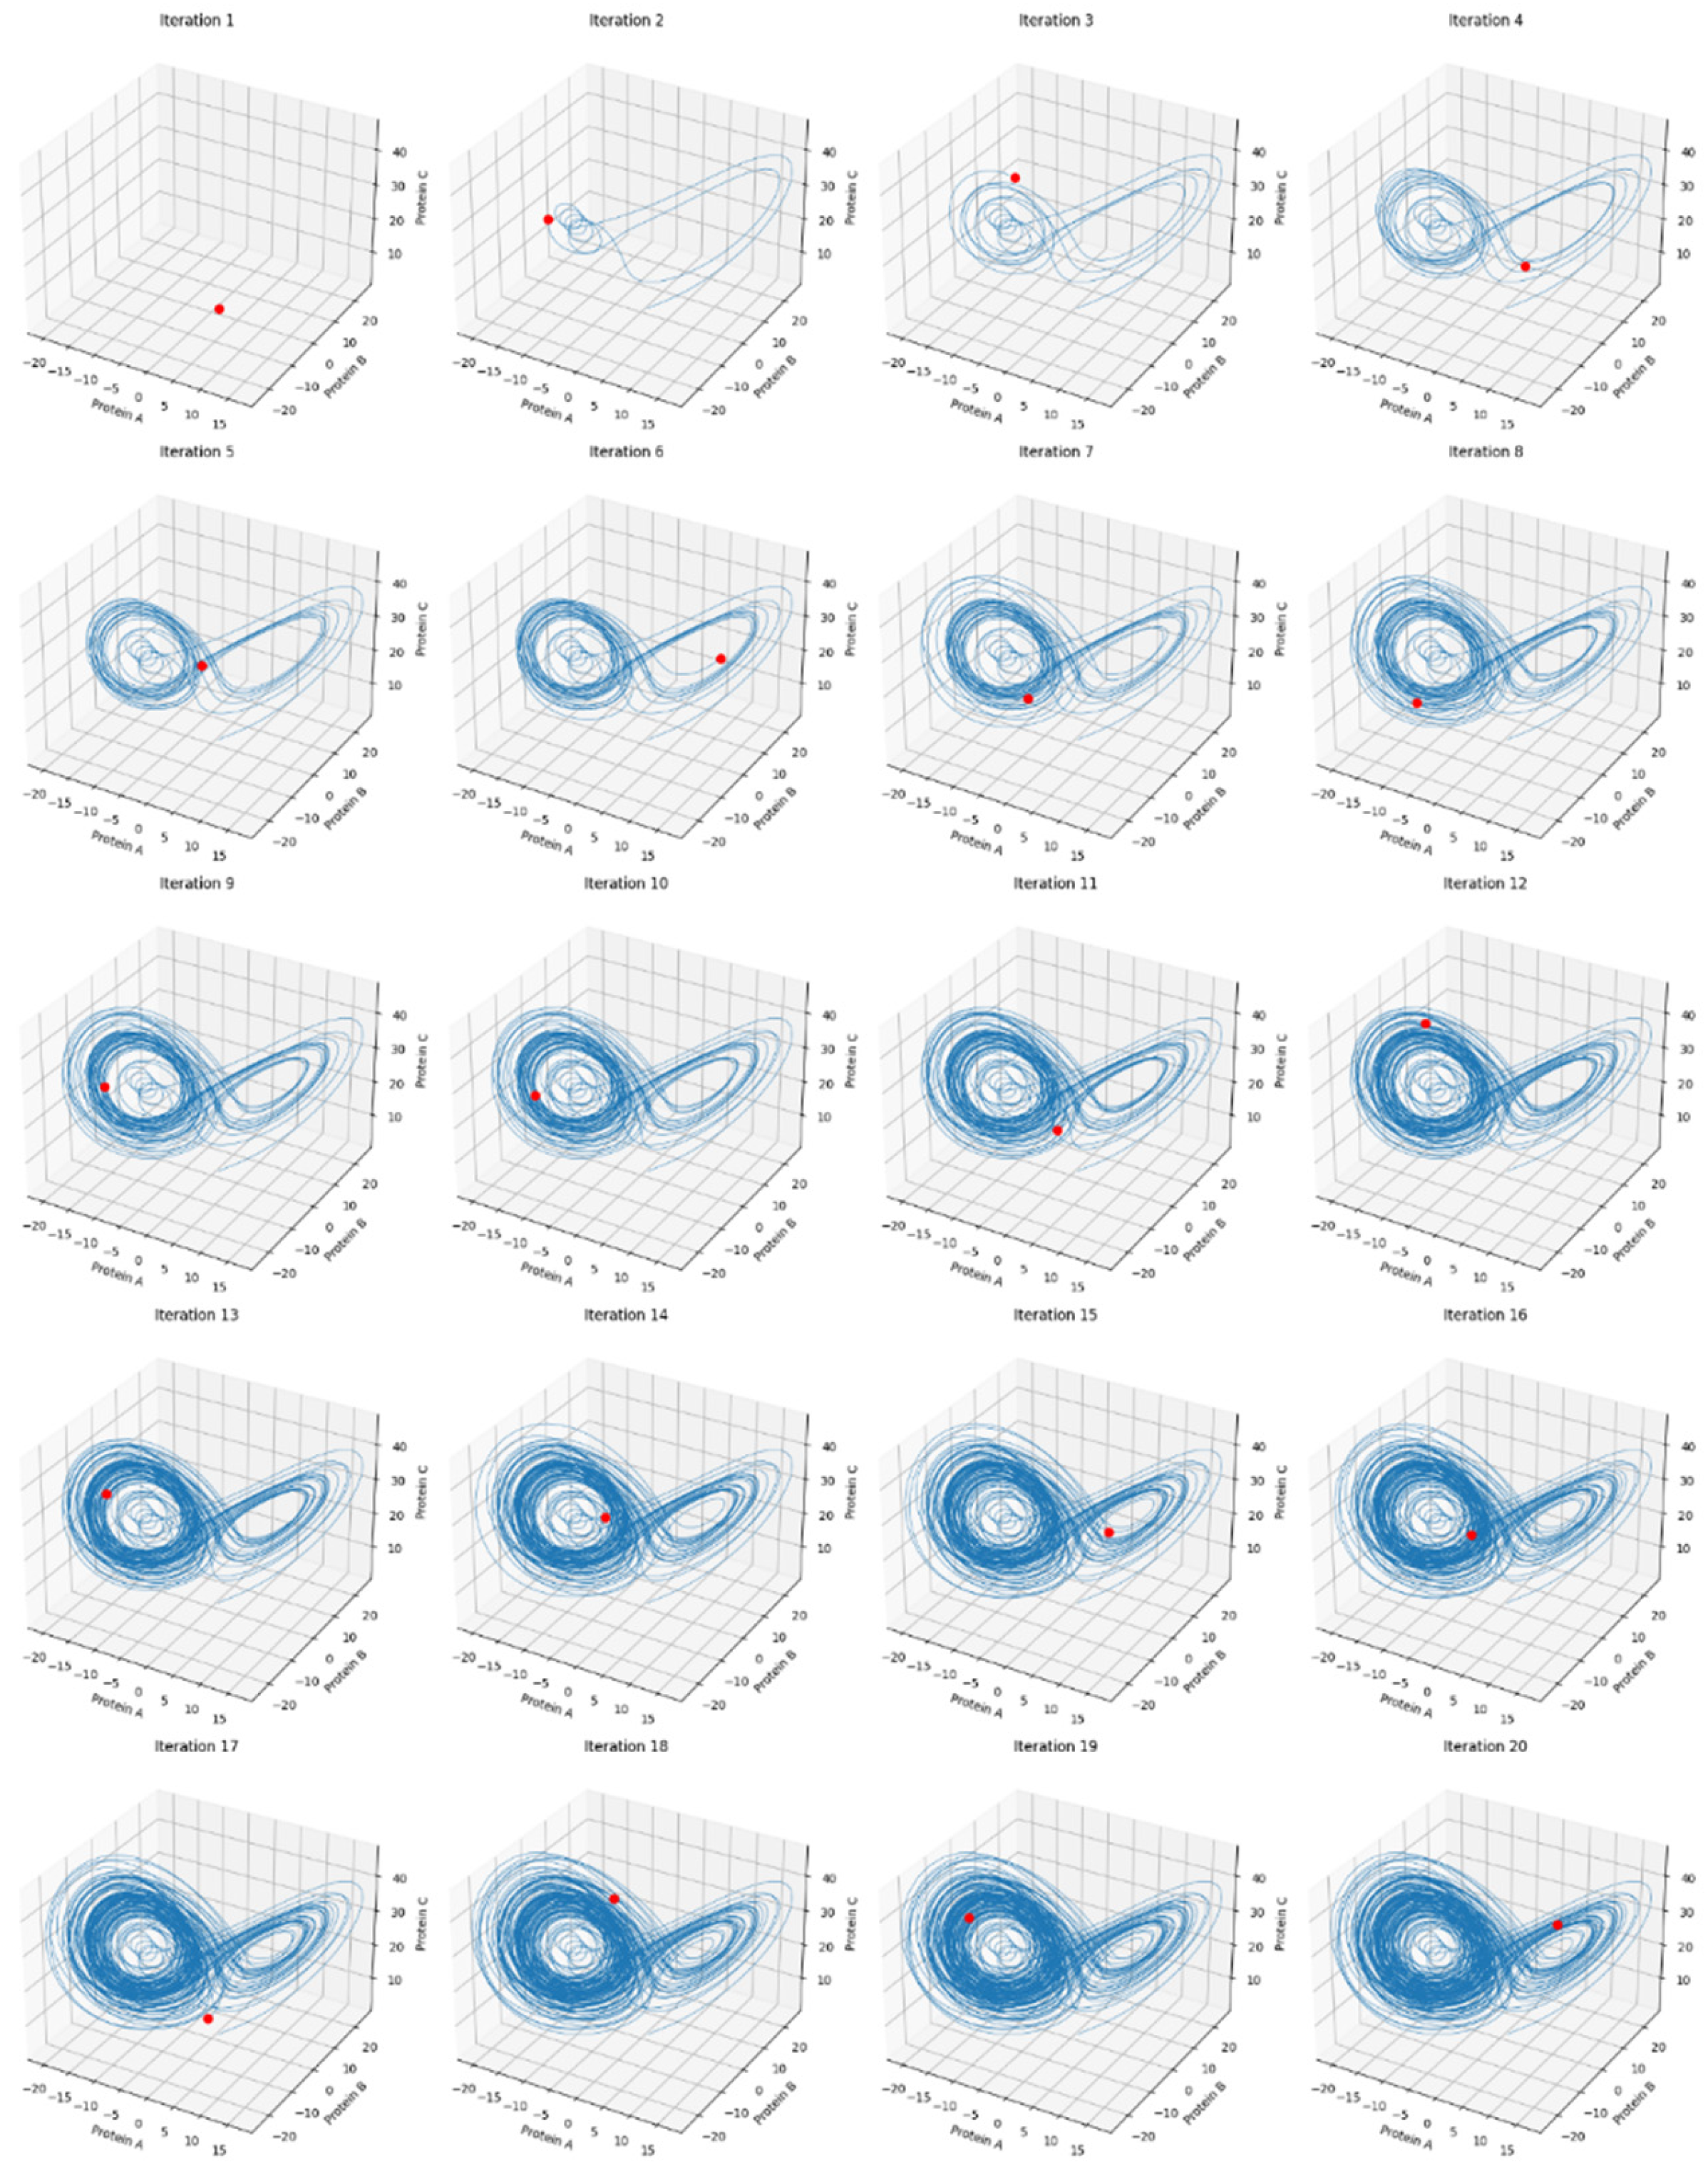
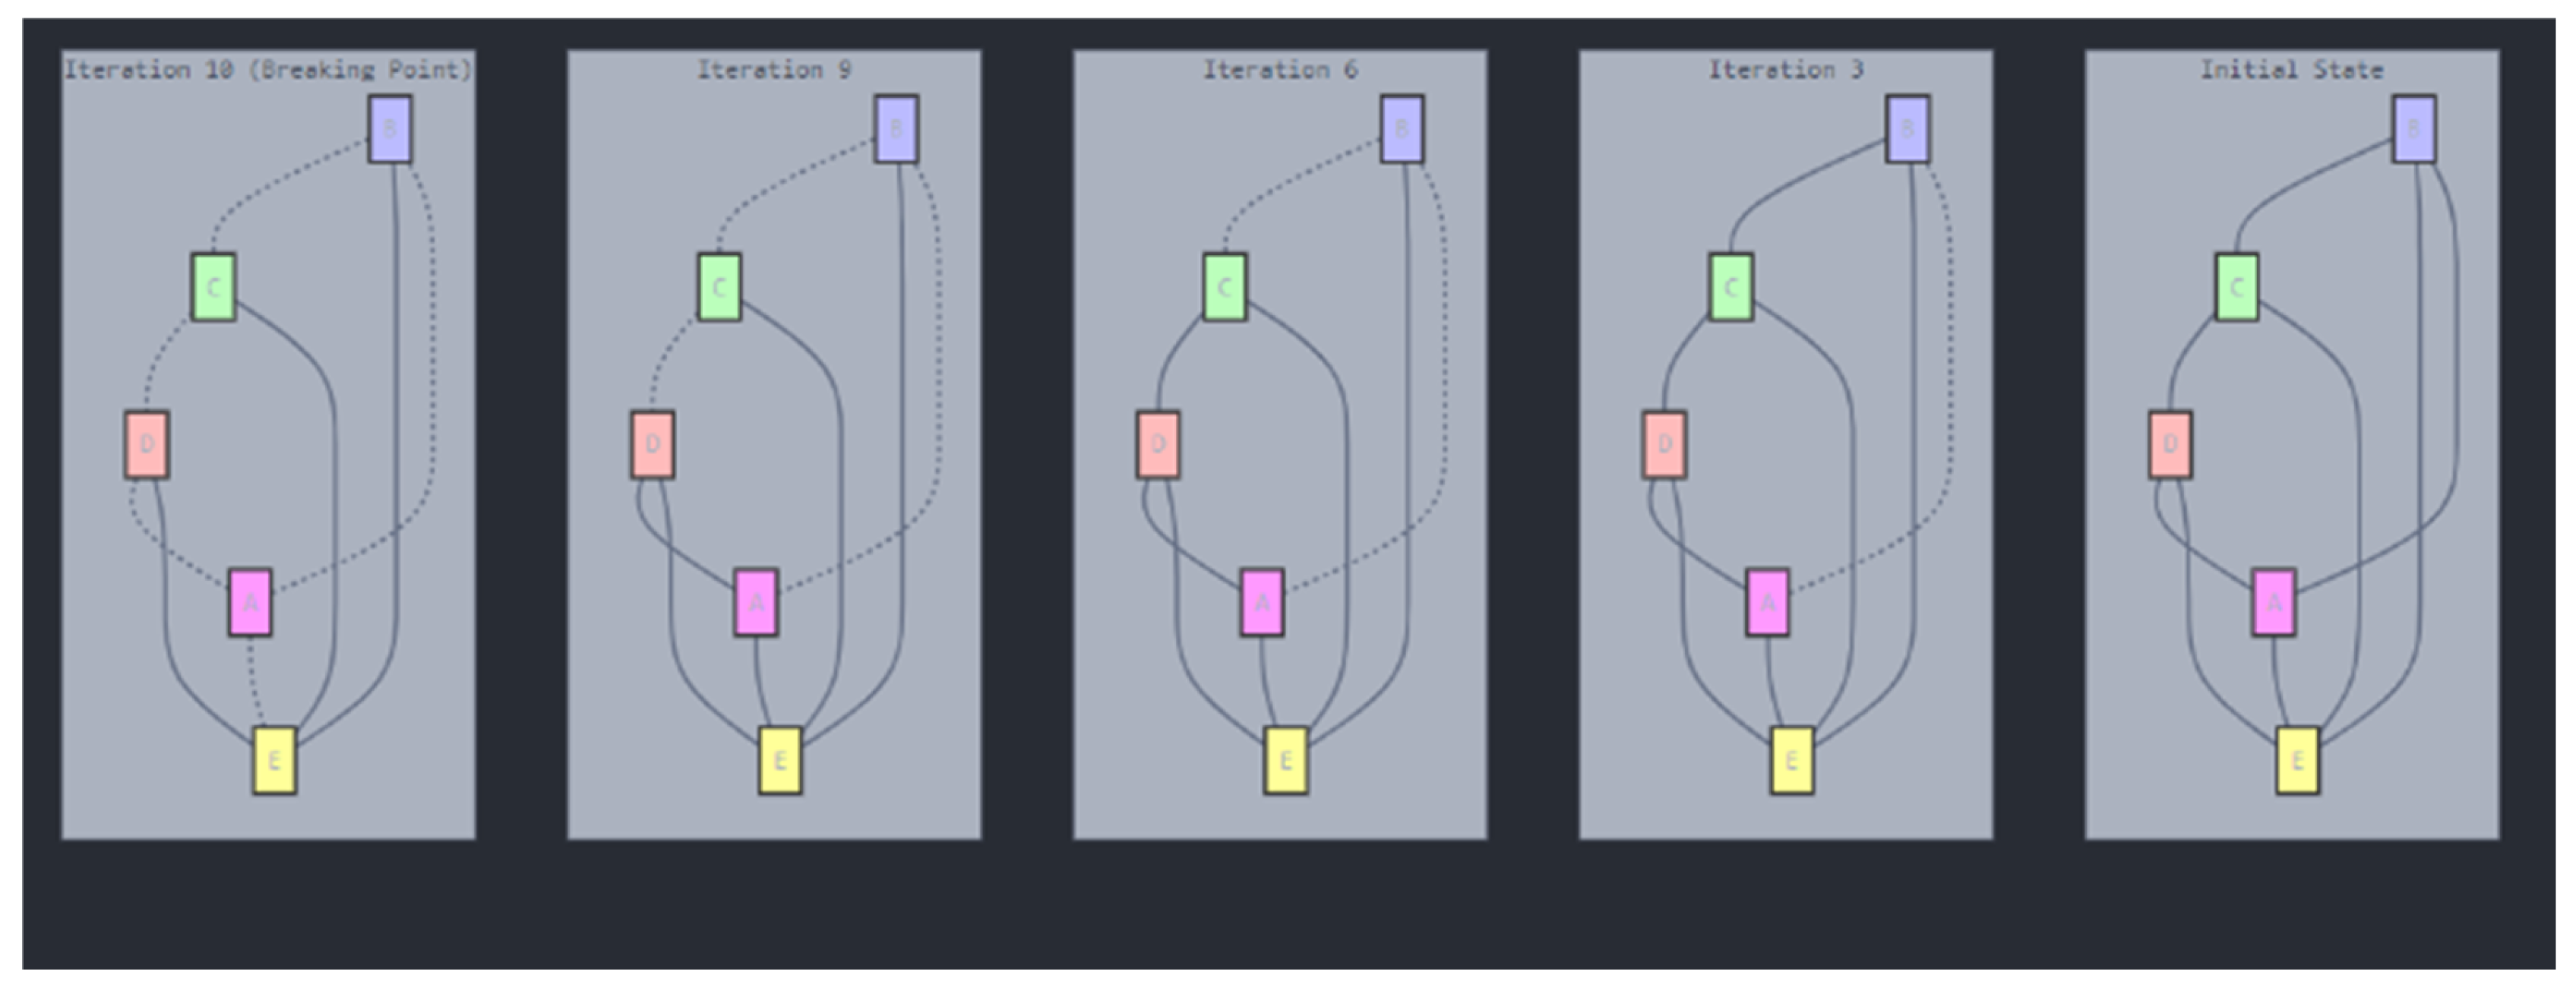
Figure 3.
Simple Representation of Proteomics Structure and Topological Breakdown.
Disclaimer/Publisher’s Note: The statements, opinions and data contained in all publications are solely those of the individual author(s) and contributor(s) and not of MDPI and/or the editor(s). MDPI and/or the editor(s) disclaim responsibility for any injury to people or property resulting from any ideas, methods, instructions or products referred to in the content. |
© 2024 by the author. Licensee MDPI, Basel, Switzerland. This article is an open access article distributed under the terms and conditions of the Creative Commons Attribution (CC BY) license (https://creativecommons.org/licenses/by/4.0/).
Copyright: This open access article is published under a Creative Commons CC BY 4.0 license, which permit the free download, distribution, and reuse, provided that the author and preprint are cited in any reuse.


