
Submitted:
15 August 2024
Posted:
16 August 2024
You are already at the latest version
Abstract
As the aging of the world accelerates, clarifying the relationship between cultural differences and ageism is an urgent issue. Therefore, in this study, we conducted a correlation analysis between the six cultural scales of Hofstede et al. [1] and the objective and subjective ageism scales calculated from data on 35,232 people from 31 countries included in the World Values Survey Wave 6 by Inglehart et al. [2]. The results of a partial correlation analysis controlling for economic and demographic factors showed that power distance (PDI) and indulgence versus restraint (IVR) are positively and negatively correlated with ageism, respectively. This is the first study to show that these two cultural scales that previous studies have not paid much attention to are related to ageism.
Keywords:
ageism
; correlation
; culture
; Indulgence
; power distance
; restraint
1. Introduction
Ageism is the process of systematic stereotyping and discrimination against people because of their age [3]. Previous studies have found that ageism is related to the size of the aging population [4] and the rate of aging [5]. However, compared to these demographic discussions, there has been less discussion of cultural factors, and a recent systematic review of ageism across 199 papers showed that only eight studies considered institutional or cultural determinants [6]. Given that the world is made up of diverse cultures, research is valuable to gain insight into how cultural differences affect ageism.
As the author discusses later, recent studies have shown that certain cultures correlate with ageism using certain scales. However, to the author's knowledge, there seems to be no research that has comprehensively clarified this. At present, there is no consensus on what scale to use to measure ageism, and it has been pointed out that this may be one of the reasons why studies do not provide consistent results on the issue of whether ageism is stronger in the East or the West [7]. Therefore, in this study, using objective and subjective ageism variables computed from 7 items of ageism-related attitude data from the World Values Survey Wave 6 [2] and the values of six cultural scale indicators from Hofstede et al. [1], the author shows that national cultures, especially power distance (PDI) and indulgence versus restraint (IVR) that have not been paid much attention to in previous studies are associated with ageism through partial correlation analysis that controls for economic and demographic factors.
2. Review of Previous Research and Presentation of Hypotheses
2.1. Hofstede’s Six Cultural Scales
The most widely used scales for measuring national culture are the six cultural scales by Hofstede et al. [1]. First, power distance (PDI) indicates the extent to which the less powerful members of an organization or institution accept that power is distributed unequally. A higher index indicates that hierarchies are clearly separated in society and are not questioned by its members. A lower index, on the other hand, means that people question authority and seek to distribute power equally [1]. Meanwhile, individualism (IDV) indicates the extent to which people in a society are integrated into groups. Individualistic societies often have loose ties that relate individuals only to their immediate family. They emphasize "I" and "we". At the other end of the spectrum, collectivist societies have tightly integrated relationships that bind extended family and others to in-groups. These in-groups are filled with unquestioning loyalty and support each other when conflicts arise with other in-groups [1].
Uncertainty avoidance (UAI) is a society's tolerance for ambiguity. In societies with high UAI, people avoid the unexpected, unknown, or unconventional. To do so, they adhere to strict codes of conduct, guidelines, and laws, and rely on absolute or unique truths. On the other hand, the lower the UAI, the more readily different thoughts and ideas are accepted. Such societies tend to be less regulated, more comfortable with ambiguity, and more liberal in their environments [1]. Masculinity (MAS) is the degree to which a society values achievement, its heroism and assertiveness, and its preference for material rewards for success. Societies with low UAI tend to value cooperation and humility, have compassion for the weak, and prefer quality of life [1].
Long-term orientation (LTO) links past connections to current and future actions and challenges. A high level of this indicator indicates that traditions are respected, maintained, and immutable [1]. Indulgence versus restraint (IVR) refers to the degree of freedom that social norms give to citizens. A society with high indulgence is one that considers the enjoyment of life to be a natural human desire and seeks to satisfy it freely. On the other hand, a society with high restraint is one that tries to control the satisfaction of desires and regulate them through strict social norms [1].
2.2. Hypothesis Presentation Regarding the Relationship between Cultural Measures and Ageism
This study examines whether six cultural variables, namely PDI, IDV, UAI, MAS, LTO, and IVR, are associated with ageism.
PDI: To the author's knowledge, there have been no studies clarifying the relationship between PDI and ageism. This may be because the two are conceptually close and therefore difficult to raise as subjects of analysis. According to Hofstede et al. [1], in societies with a high PDI, respect for parents and older relatives is a fundamental virtue that continues throughout life. Societies with a high PDI overlap geographically with Confucian societies such as China [8]. However, North and Fiske [5] found in a meta-analysis review of 37 papers that Eastern cultures have more negative attitudes toward the elderly than Western cultures. The reason for this is that Western societies with strong post-materialist values place as much importance on the welfare and dignity of the elderly as they do on individuals, and the positive effects of this outweigh the negative effects of the loss of the tradition of placing importance on the elderly [5,9]. These arguments are consistent with an earlier, paradoxical finding that the world’s three highest elder suicide rates belong to South Korea, Taiwan, and China [10]. Thus, the following hypothesis is derived:
H1.
The PDI is positively correlated with ageism.
IDV: A common belief is that Eastern cultures, with their strong collectivist traditions of filial piety, value older people more highly than Western cultures. However, the results of a meta-analysis reveal that ageism is stronger in collectivist cultures than in individualist cultures [5]. This is interpreted as being because collectivism, which emphasizes the differences between in-groups and out-groups, is more likely to produce negative stereotypes about different age groups, which may in turn fuel resentment toward older people who seek support and enjoy benefits without contributing to society [5]. Thus, the following hypothesis is derived:
H2.
IDV is negatively correlated with ageism.
UAI: Societies with high uncertainty avoidance scores tend to be uncomfortable with unpredictability [1]. The experience of aging is largely unpredictable and uncontrollable, which may be a source of discomfort for people living in cultures that favor predictability [11,12]. Consistent with these arguments, previous studies have consistently found that people from cultures with high uncertainty avoidance have more negative perceptions of aging [4,11,13]. For example, in a study by Ackerman and Chopik [11], people living in cultures with high uncertainty avoidance tended to have less warmth toward older people. Thus, the following hypothesis is derived:
H3.
UAI is positively related to ageism.
MAS: Ng & Lim-Soh [14] conducted a study of 20 English-speaking countries and found that ageism in each country, assessed using a database of 8 billion words, correlates with MAS. MAS is related to ageism because a society that values competition and values the strong and successful easily sees older people, who are the opposite of competition, as weak [14]. Previous research has described, for example, how older men are alienated from younger men in their prime in social clubs in heavy industrial areas of England, where the economy is supported by male manual labor [15]. Relatedly, an analysis using large-scale data from the same World Values Survey Wave 6 [2] as this study showed that people who have a strong "market mentality" that emphasizes becoming rich and being successful in society are more likely to perceive the elderly as a burden on society. This is because people who are obsessed with money and success are more sensitive to the decline in their share due to the increase in the social burden of supporting the elderly [16]. Therefore, the following hypothesis is derived.
H4.
MAS is positively correlated with ageism.
LTO: A study by Ackerman and Chopik [11] found that people living in countries with a higher long-term orientation (more emphasis on the future) tend to have higher prejudice against the elderly and less warmth toward the elderly. Similarly, the study by Ng and Lim-Soh [14] mentioned above shows that in addition to masculinity, ageism is more likely to be strengthened in societies with a long-term orientation. The common interpretation given by the authors of these studies is that, from a long-term perspective, investing in young people is expected to produce greater returns than investing in older people [11,14]. Thus, the following hypothesis is derived:
H5.
LTO is positively related to ageism.
IVR: To the author's knowledge, there has been no research clarifying the relationship between IVR and ageism. According to Hofstede et al. [1], the world can be divided into ample and restrained societies. Ample societies are societies that seek to freely satisfy human desires related to savoring and enjoying life. On the other hand, restrained societies are societies that believe that strict social norms should suppress and limit the fulfillment of desires. Previous research has shown that ample societies tend to have lower mortality rates [1] and longer life expectancies [16]. The reason for this is thought to be that ample societies usually have a higher subjective sense of well-being and a positive view of happiness, which suppresses deaths from stress-related diseases such as cardiovascular disease (however, ample societies have a negative side in that people tend to consume more fast food and soft drinks, which makes them more likely to become obese). In other words, a fulfilling society where people enjoy life is a society where it is easy for the elderly to live. If the elderly are lively in a society, it is thought that discrimination and prejudice based on age are less likely to occur. Therefore, the following hypotheses are derived:
H6.
IVR is negatively correlated with ageism.
Table 1 indicates the number of participants by country and survey year.
3.2. Measures
Ageism was evaluated using the 10 items shown in Table 2 in the World Values Survey Wave 6 [2]. As can be seen from the sentences, the items include those that ask about the general position and evaluation of older people from the perspective of others ("Social position: People in their 70s", "People over 70: are seen as friendly", "People over 70: are seen as competent", "People over 70: viewed with respect", "Older people are not respected much these days") and those that require subjective evaluation ("Is a 70-year old boss acceptable", "Older people get more than their fair share from the government", "Older people are a burden on society", "Companies that employ young people perform better than those that employ people of different ages", "Older people have too much political influence"). Previous studies have measured ageism using a combination of some of these items (e.g., [17]).
3.3. Control Variables
There is evidence that the values of individuals are related to the economic level of a country [18,19]. Therefore, evaluations of the elderly have also changed in step with the global industrialization and lifestyle changes that have occurred over the past 200 years [14]. Therefore, in previous studies, economic indicators such as the level of modernization [16] and GDP per capita (Chen et al., 2023) are often used in analyzing the determinants of ageism. On the other hand, previous studies have shown that the aging rate, which is expressed by the growth rate of the population aged 65 and over [5,16] and the burden of supporting the elderly, such as the public pension rate [20], are a threat to resources and are related to the rise of ageism. In addition, the aging rate, which is expressed by the population ratio aged 65 and over, has also been shown to be related to ageism [4,16,20]. Therefore, in this study, GDP per capita, aging rate, and aging rate are used as covariates. Of these, GDP per capita is the natural logarithm of gross domestic product per capita converted to US dollars at constant prices. Meanwhile, the aging rate is the ratio of those aged 65 or over to the total population, and the aging rate indicates the change in the aging rate over the past 10 years. Both were obtained from the World Bank database [21], and unavailable data was supplemented with the United Nations database [22].
3.4. Analysis Method
Correlation coefficients and partial correlation coefficients were calculated for the six cultural variables and the 2 ageism variables. Cultural variables that were significant in the partial correlations were then simultaneously entered into a multiple regression analysis with ageism as the dependent variable, and the strength of the coefficients was compared. The significance level was set at 5%. All statistical analyses have been performed using IBM SPSS Statistics Version 26 (IBM Corp., Armonk, NY, USA).
4. Analysis and Findings
We conducted an exploratory factor analysis of all the 10 items with varimax rotation as presented in Table 3, confirming a two-factor solution for the two items: objective ageism and subjective ageism. We decided not to use three items, including “Social position: People in their 70s”, “Is a 70-year old boss acceptable”, and “Older people are not respected much these days” due to low or multiple-factor loadings. To calculate objective ageism (Cronbach alpha = 0.797) and subjective ageism (Cronbach alpha = 0.724), the items were converted into z-scores to consider differences in scale between items, and then the average values were calculated. Data from 59 countries were used for factor analysis and Cronbach alpha calculations, including data from 28 countries for which Hofstede Culture Scale scores were not available and therefore were not used in subsequent analyses.
Table 4 shows the mean, standard deviation (SD), and correlation coefficient of each variable. The correlation coefficients below the diagonal are normal correlation coefficients, and those above the diagonal are partial correlation coefficients. Below, we will mainly discuss the partial correlation coefficient results in order. First, PDI showed a significant positive correlation with subjective ageism (r = 0.643***, p = 0.000). On the other hand, IVR showed a significant negative correlation with subjective ageism (r = -0.455*, p = 0.015). These results support H1 and H6. On the other hand, the other four cultural indicators were not correlated with ageism. Therefore, H2, H3, H4, and H5 are rejected. However, IDV and subjective ageism (r = -0.372, p = 0.051) showed p-values close to the significance level. Objective ageism was not correlated with any of the cultural indicators. For reference, let's also look at the results of the usual correlation analysis. The correlation between PDI and subjective ageism was reproduced here (r = 0.700***, p = 0.000). On the other hand, the correlation between IVR and subjective ageism was not reproduced here at the 5% significance level (r = -0.307, p = 0.093). Instead, a significant correlation between IDV and subjective ageism was shown (r = -0.646***, p = 0.000).
Table 5 shows the results of a hierarchical multiple regression analysis with subjective ageism as the dependent variable, and PDI and IVR, which were correlated with the dependent variable, and three covariates as independent variables. Compared to Model 1 including only the control variables (R2 = 0.430, F = 6.790**), Model 2 including the cultural variables had an improved fit (R2 = 0.704, F = 11.883***). PDI (β = 0.484**, p = 0.001) was significant at the 1% level, while IVR (β = -0.232, p = 0.084) was not significant at the 5% level. This shows that PDI is more strongly correlated with subjective ageism than IVR.
Figure 1 and Figure 2 are scatter plots with the residuals of subjective ageism (Δ subjective ageism) on the vertical axis and PDI and IVR on the horizontal axis. Δ subjective ageism is the residual of a regression analysis that includes only control variables. Figure 3 is a scatter plot with subjective ageism on the vertical axis and objective ageism on the horizontal axis. Interestingly, there is a negative correlation between the two (r = -0.358, p = 0.048), although the partial correlation coefficient is not significant (r = -0.227, p = 0.246) as shown in Table 4. For example, Japan is one of the countries with the strongest objective ageism, but its subjective ageism is moderate.
5. Discussion
This is the first study to show that Hofstede's various cultural axes are related to various ageism. Previous studies have shown that IDV [5] is negatively correlated with ageism, and UAI [4,11,13], MAS [14], and TIOWVS [11,14] are positively correlated with ageism, but to the author's knowledge, there has been no research clarifying the relationship between PDI and IVR and ageism.
Of these, previous research has pointed out that PDI overlaps with Confucian societies [8], and it has also been found that Eastern cultures have more negative attitudes toward the elderly than Western cultures [5]. Therefore, a positive relationship between PDI and ageism was predicted, albeit paradoxically. In this study, consistent with these predictions, The higher the PDI, the higher the level of subjective ageism. This is consistent with another paradoxical finding that the suicide rate of the elderly is high in Confucian societies where the elderly are supposed to be protected [10]. Furthermore, considering the geographical overlap between PDI and collectivism [1], this is consistent with previous research that found a positive relationship between collectivism and ageism and argued that collectivist aggression may be directed at older people who do not contribute to society [5]. The current study also confirmed that societies with stronger IDV tend to have lower levels of subjective ageism, although this relationship was not reproduced by partial correlation coefficients using population and economic indicators as covariates.
On the other hand, the relationship between IVR and ageism is a topic that has hardly been taken into consideration in previous studies. However, there has been research on aging that has shown that, from the perspective of human development, more fulfilling societies tend to have lower mortality rates [1] and longer life expectancies [17]. This is thought to be because in fulfilling societies, subjective happiness is higher and is perceived positively, which reduces deaths from stress-related diseases such as cardiovascular disease and makes it more likely that elderly people are healthy. In a society where elderly people are lively, it is thought that discrimination and prejudice based on age are less likely to occur. Considering these arguments, it is a convincing result that, as shown in this study, the more fulfilling a society is, the healthier its elderly are, and therefore the less likely they are to be discriminated against.
No significant correlation between LTO and ageism shown in this study is inconsistent with previous research [11,14] that has argued that investing in young people can be expected to produce greater returns than investing in older people by taking a long-term perspective. Likewise, the correlation between the MAS and ageism shown in previous research on English-speaking countries [14] was not shown in this study. The story argued by Ng & Lim-Soh [14] that a society that values competition and highly values the strong and successful is likely to label the elderly as weak, who are the opposite, seems reasonable at first glance, but the results of this study show that this is not necessarily a globally observable international trend. The results of some previous studies showing that LTO and MAS are linked to ageism can be interpreted, but are not very reasonable. In an LTO society, there would be an incentive to create an elderly-friendly society in anticipation of aging, and in an MAS society, it is not surprising that people would respect the elderly who have led modernization. Therefore, the result of this study that these variables do not correlate with ageism is not difficult to understand, although it contradicts the hypothesis of this study.
Regarding the relationship between UAI and ageism that was not reproduced in this study requires careful interpretation. Previous studies have found that countries with higher UAI tend to have stronger ageism (Ackerman & Chopik, 2021; Lawrie et al., 2020; Löckenhoff et al., 2009), and have argued that aging is an unpredictable experience as a justification for this [11,12]. However, the author finds this argument a little difficult to understand. If aging is highly unpredictable, it is not surprising that there is a reverse incentive to prepare an environment that is friendly to the elderly in advance in anticipation of one's own aging future. Therefore, the results of this study showing no correlation between UAI and ageism, although contrary to the hypothesis, should not be surprising.
PDI and IVR were significantly correlated with subjective ageism, but not with objective ageism. This result means that the results vary depending on the scale of ageism, which may partially explain why previous studies have not been able to show consistent results. Relatedly, the two ageism were negatively correlated with each other. However, the relationship between the two disappeared in partial correlation analyses that controlled for population and economic data. For example, in Japan, the world's most rapidly aging country, many people feel that others have ageism. However, they themselves do not have strong ageism. Future research should attempt to elucidate the mechanism behind this interesting gap between subjective and objective ageism. For example, this could be due to a sense of wariness of the opinions of others, or a sense of self-efficacy that they are the only ones who can see the truth.
6. Limitation
This study analyzed the factors of ageism through cross-sectional analysis. Therefore, it should be noted that the results of this study are correlational and do not indicate a causal relationship. In relation to this, the small sample size also raises concerns about the reproducibility of the results. In addition, because the data was obtained from an existing database, it is possible that the unique cultural differences of each country may have been underestimated. Future research should verify and develop the results of this study through longitudinal analysis or individual analysis using a larger sample.
7. Conclusions
Today, as the aging of the global population accelerates, it is meaningful to clarify the relationship between a country's culture and ageism. In this study, by analyzing data from 40,869 people from 31 countries collected in the World Values Survey Wave 6 and Hofstede's cultural scale, the author showed that the two cultural scales, PDI and IVR are related to subjective ageism after controlling for economic and demographic factors. However, there were no significant correlations between these cultural indicators and objective ageism. Furthermore, there were no significant correlations between IDV, UAI, MAS, LTO and ageism. This is the first study to show that PDI and IVR that previous studies have not paid much attention to are related to ageism.
Funding
This research received no external funding.
Institutional Review Board Statement
Not applicable. We used anonymous information that is open to the public.
Informed Consent Statement
Not applicable. We used anonymous information that is open to the public.
Data Availability Statement
Publicly available datasets were analyzed in this study (available upon request).
Acknowledgments
An earlier version of this article is published on the following preprint server: ***** (accessed on 10 August 2024).
Conflicts of Interest
The author declares no conflict of interest.
References
- Hofstede, G.; Hofstede, G.J.; Minkov, M. Cultures and Organizations: Software of the Mind, Revised and expanded, 3rd ed.; McGraw-Hill: New York, 2010. [Google Scholar]
- Inglehart, R.; Haerpfer, C.; Moreno, A.; Welzel, C.; Kizilova, K.; Diez-Medrano, J.; Lagos, M.; Norris, P.; Ponarin, E.; Puranen, B.; et al. (Eds.) World Values Survey: Round Six - Country-Pooled Datafile Version, Madrid: JD Systems Institute, 2014. Available online: https://www.worldvaluessurvey.org/WVSDocumentationWV6.jsp (accessed on 9 May 2024).
- Butler, R.N. Age-ism: Another form of bigotry. Gerontologist 1969, 9, 243–246. [Google Scholar] [CrossRef] [PubMed]
- Löckenhoff, C.E.; De Fruyt, F.; Terracciano, A.; McCrae, R.R.; De Bolle, M.; Costa, P.T.; Aguilar-Vafaie, M.E.; Ahn, C.-K.; Ahn, H.-N.; Alcalay, L.; et al. Perceptions of aging across 26 cultures and their culture-level associates. Psychol. Aging 2009, 24, 941–954. [Google Scholar] [CrossRef] [PubMed]
- North, M.S.; Fiske, S.T. Modern attitudes toward older adults in the aging world: A cross-cultural meta-analysis. Psychol. Bull. 2015, 141, 993–1021. [Google Scholar] [CrossRef] [PubMed]
- Marques, S.; Mariano, J.; Mendonça, J.; De Tavernier, W.; Hess, M.; Naegele, L.; Peixeiro, F.; Martins, D. Determinants of ageism against older adults: A systematic review. Int. J. Environ. Res. Public Health 2020, 17, 2560. [Google Scholar] [CrossRef] [PubMed]
- Vauclair, C.M.; Hanke, K.; Huang, L.L.; Abrams, D. Are Asian cultures really less ageist than Western ones? It depends on the questions asked. Int. J. Psychol. 2017, 52, 136–144. [Google Scholar] [CrossRef] [PubMed]
- Hofstede, G.; Bond, M.H. The Confucius connection: From cultural roots to economic growth. Organ. Dyn. 1988, 16, 5–21. [Google Scholar] [CrossRef]
- Inglehart, R.; Baker, W.E. Modernization, cultural change, and the persistence of traditional values. Am. Sociol. Rev. 2000, 65, 19–51. [Google Scholar] [CrossRef]
- LaFraniere, S. China might force visits to Mom and Dad. New York Times 29 January 2011. Available online: http://www.nytimes.com (accessed on 9 May 2024).
- Ackerman, L.S.; Chopik, W.J. Cross-cultural comparisons in implicit and explicit age bias. Pers. Soc. Psychol. Bull. 2021, 47, 953–968. [Google Scholar] [CrossRef] [PubMed]
- Ramírez, L.; Palacios-Espinosa, X. Stereotypes about old age, social support, aging anxiety and evaluations of one's own health. J. Soc. Issues 2016, 72, 47–68. [Google Scholar] [CrossRef]
- Lawrie, S.I.; Eom, K.; Moza, D.; Gavreliuc, A.; Kim, H.S. Cultural variability in the association between age and well-being: The role of uncertainty avoidance. Psychol. Sci. 2020, 31, 51–64. [Google Scholar] [CrossRef] [PubMed]
- Ng, R.; Lim-Soh, J.W. Ageism linked to culture, not demographics: Evidence from an 8-billion-word corpus across 20 countries. J. Gerontol. B Psychol. Sci. Soc. Sci. 2021, 76, 1791–1798. [Google Scholar] [CrossRef] [PubMed]
- Pain, R.; Mowl, G.; Talbot, C. Difference and the negotiation of ‘old age’. Environ. Plan. D Soc. Space 2000, 18, 377–393. [Google Scholar] [CrossRef]
- Gamlath, S. Human development and national culture: A multivariate exploration. Soc. Indic. Res. 2017, 133, 907–930. [Google Scholar] [CrossRef]
- Hövermann, A.; Messner, S.F. Explaining when older persons are perceived as a burden: A cross-national analysis of ageism. Int. J. Comp. Sociol. 2023, 64, 3–21. [Google Scholar] [CrossRef]
- Inglehart, R.; Welzel, C. Modernization, Cultural Change, and Democracy: The Human Development Sequence; Cambridge University Press: New York, 2005. [Google Scholar]
- Stevenson, B.; Wolfers, J. Economic growth and subjective well-being: Reassessing the Easterlin paradox (No. w14282); National Bureau of Economic Research: Cambridge, MA, USA, 2008. [Google Scholar]
- Chen, Z.; North, M.S.; Zhang, X. Pension Tension: Retirement Annuity Fosters Ageism Across Countries and Cultures. Innov. Aging 2023, 7, igad080. [Google Scholar] [CrossRef] [PubMed]
- World Bank. World Development Indicators; World Bank: Washington, DC, USA, 2024. [Google Scholar]
- United Nations. World Population Prospects 2022; United Nations: Rome, Italy, 2024. [Google Scholar]
Figure 1.
Scatter plot showing the relationship between PDI and Δsubjective ageism, which is measured by the residuals of a regression analysis in which only the control variables are used as independent variables. PDI: power distance.
Figure 1.
Scatter plot showing the relationship between PDI and Δsubjective ageism, which is measured by the residuals of a regression analysis in which only the control variables are used as independent variables. PDI: power distance.
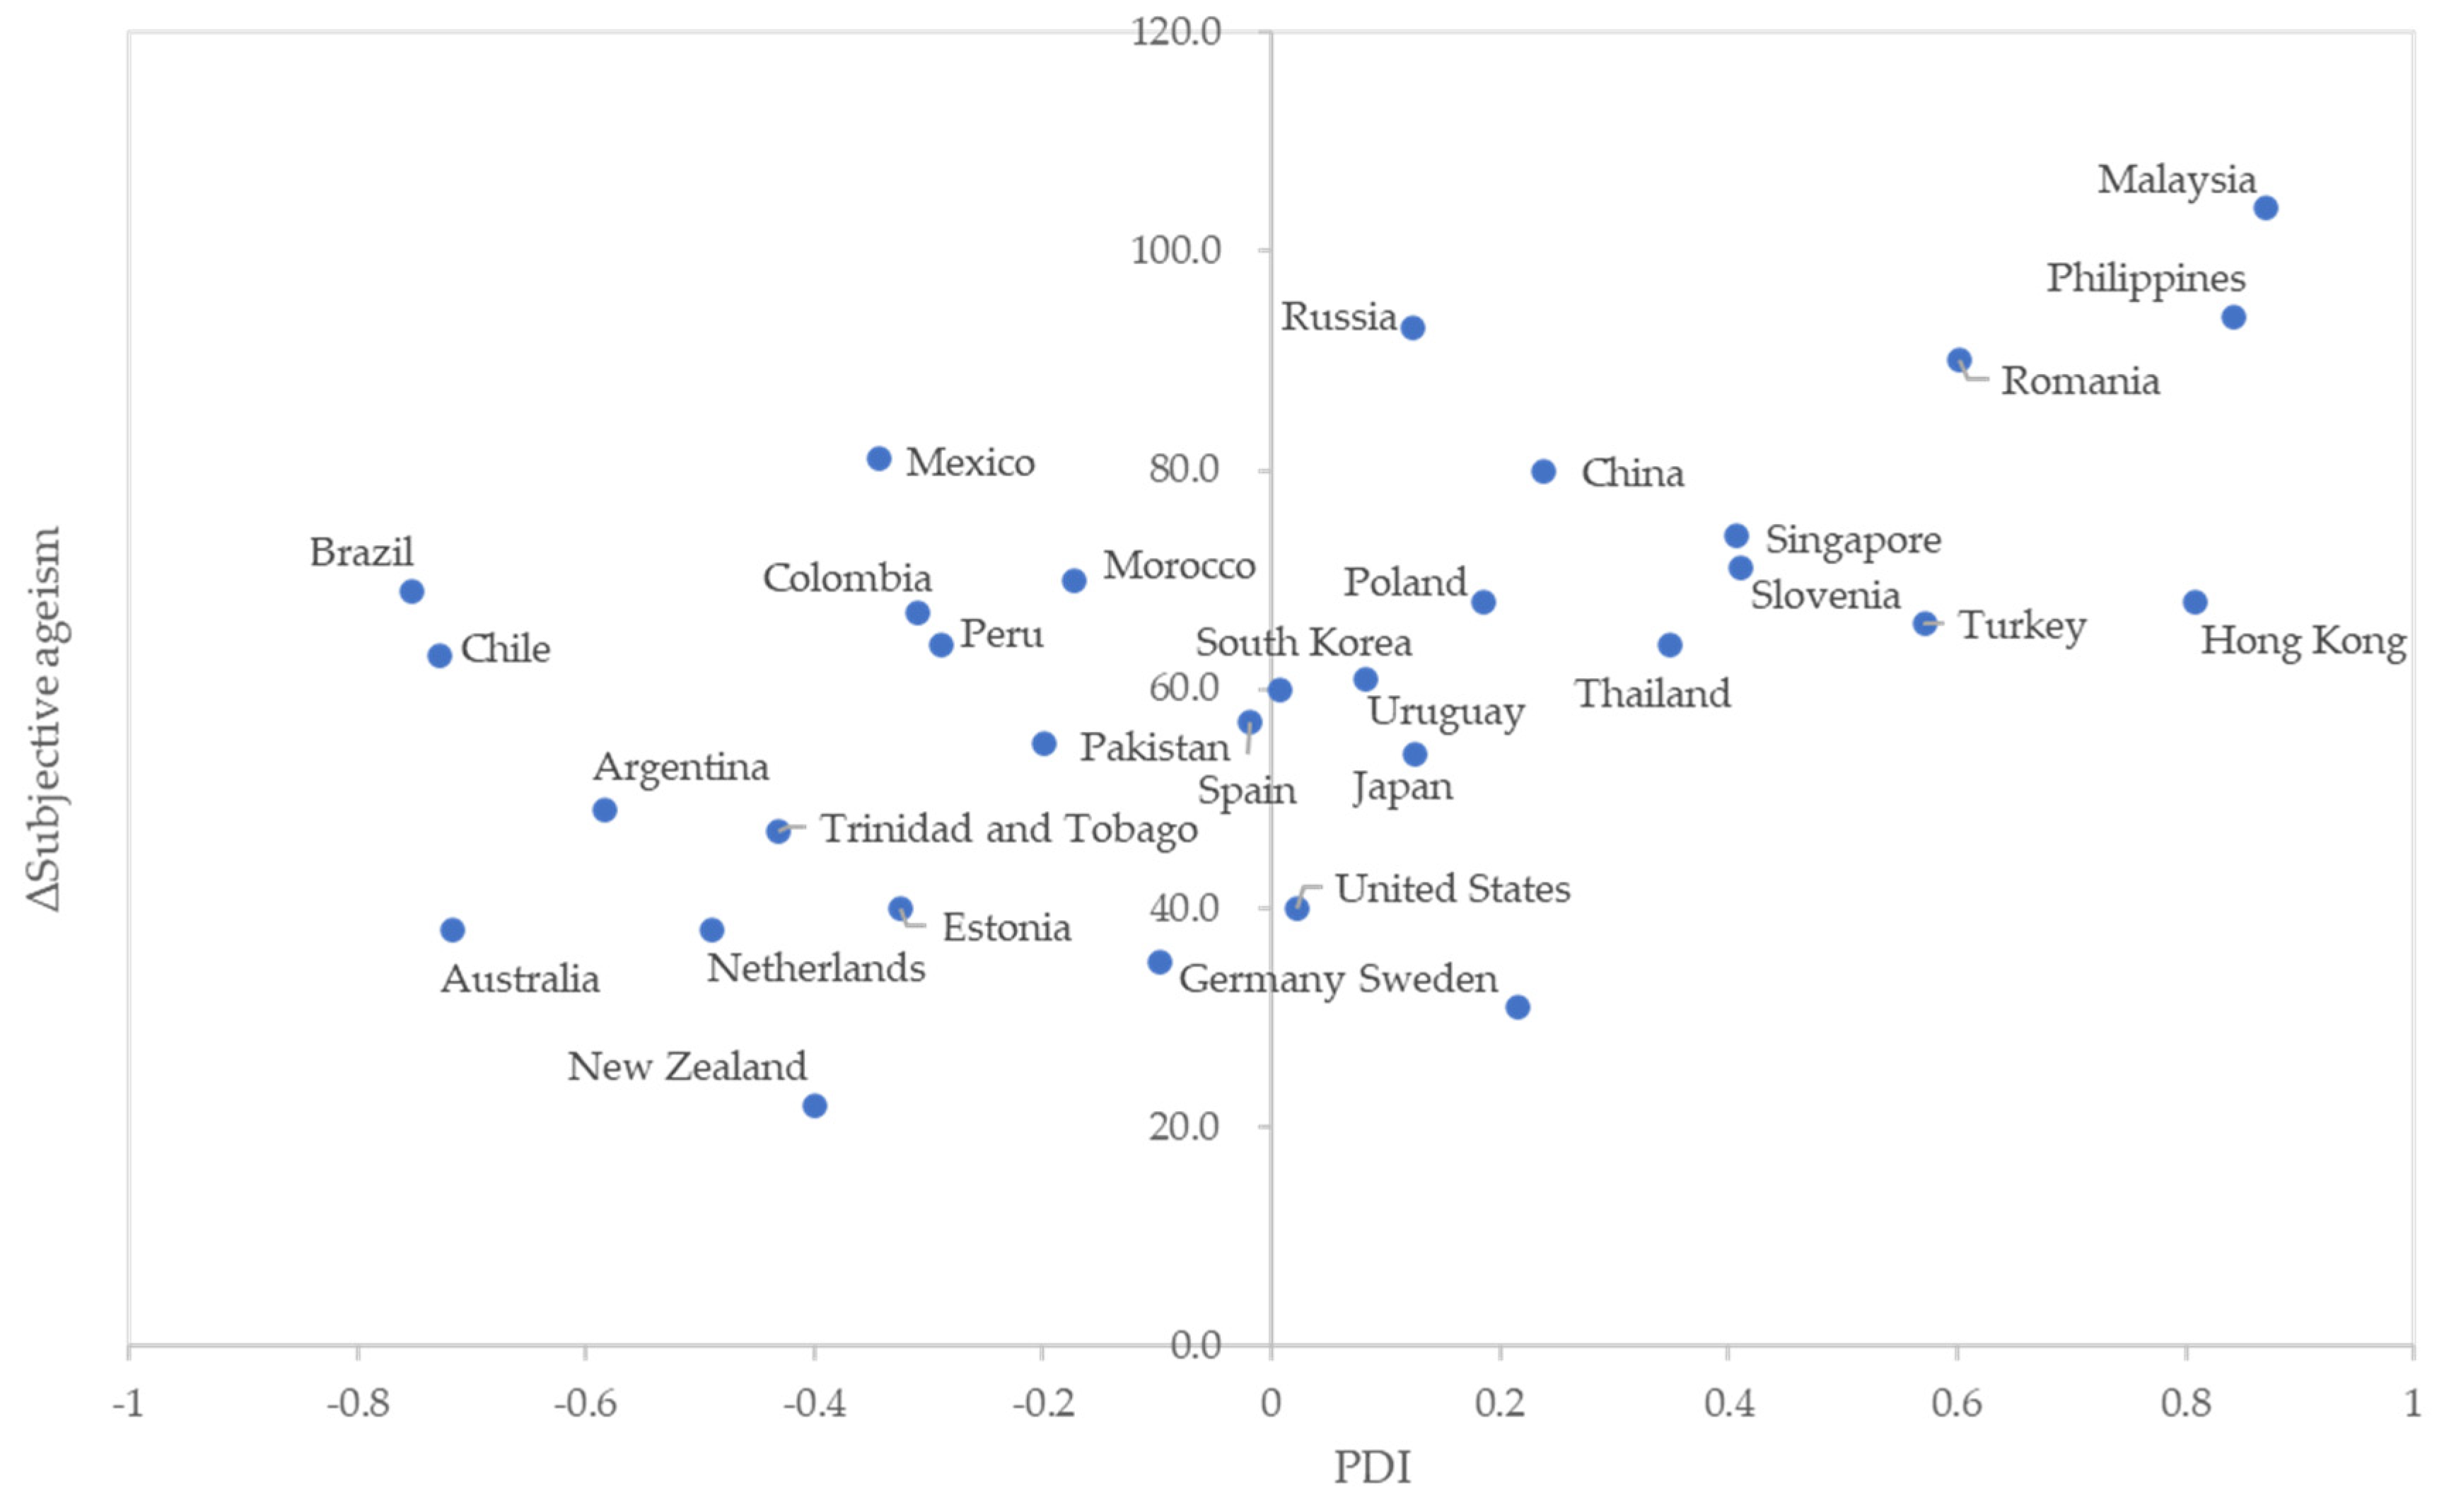
Figure 2.
Scatter plot showing the relationship between IVR and Δsubjective ageism, which is measured by the residuals of a regression analysis in which only the control variables are used as independent variables. IVR: indulgence versus restraint.
Figure 2.
Scatter plot showing the relationship between IVR and Δsubjective ageism, which is measured by the residuals of a regression analysis in which only the control variables are used as independent variables. IVR: indulgence versus restraint.
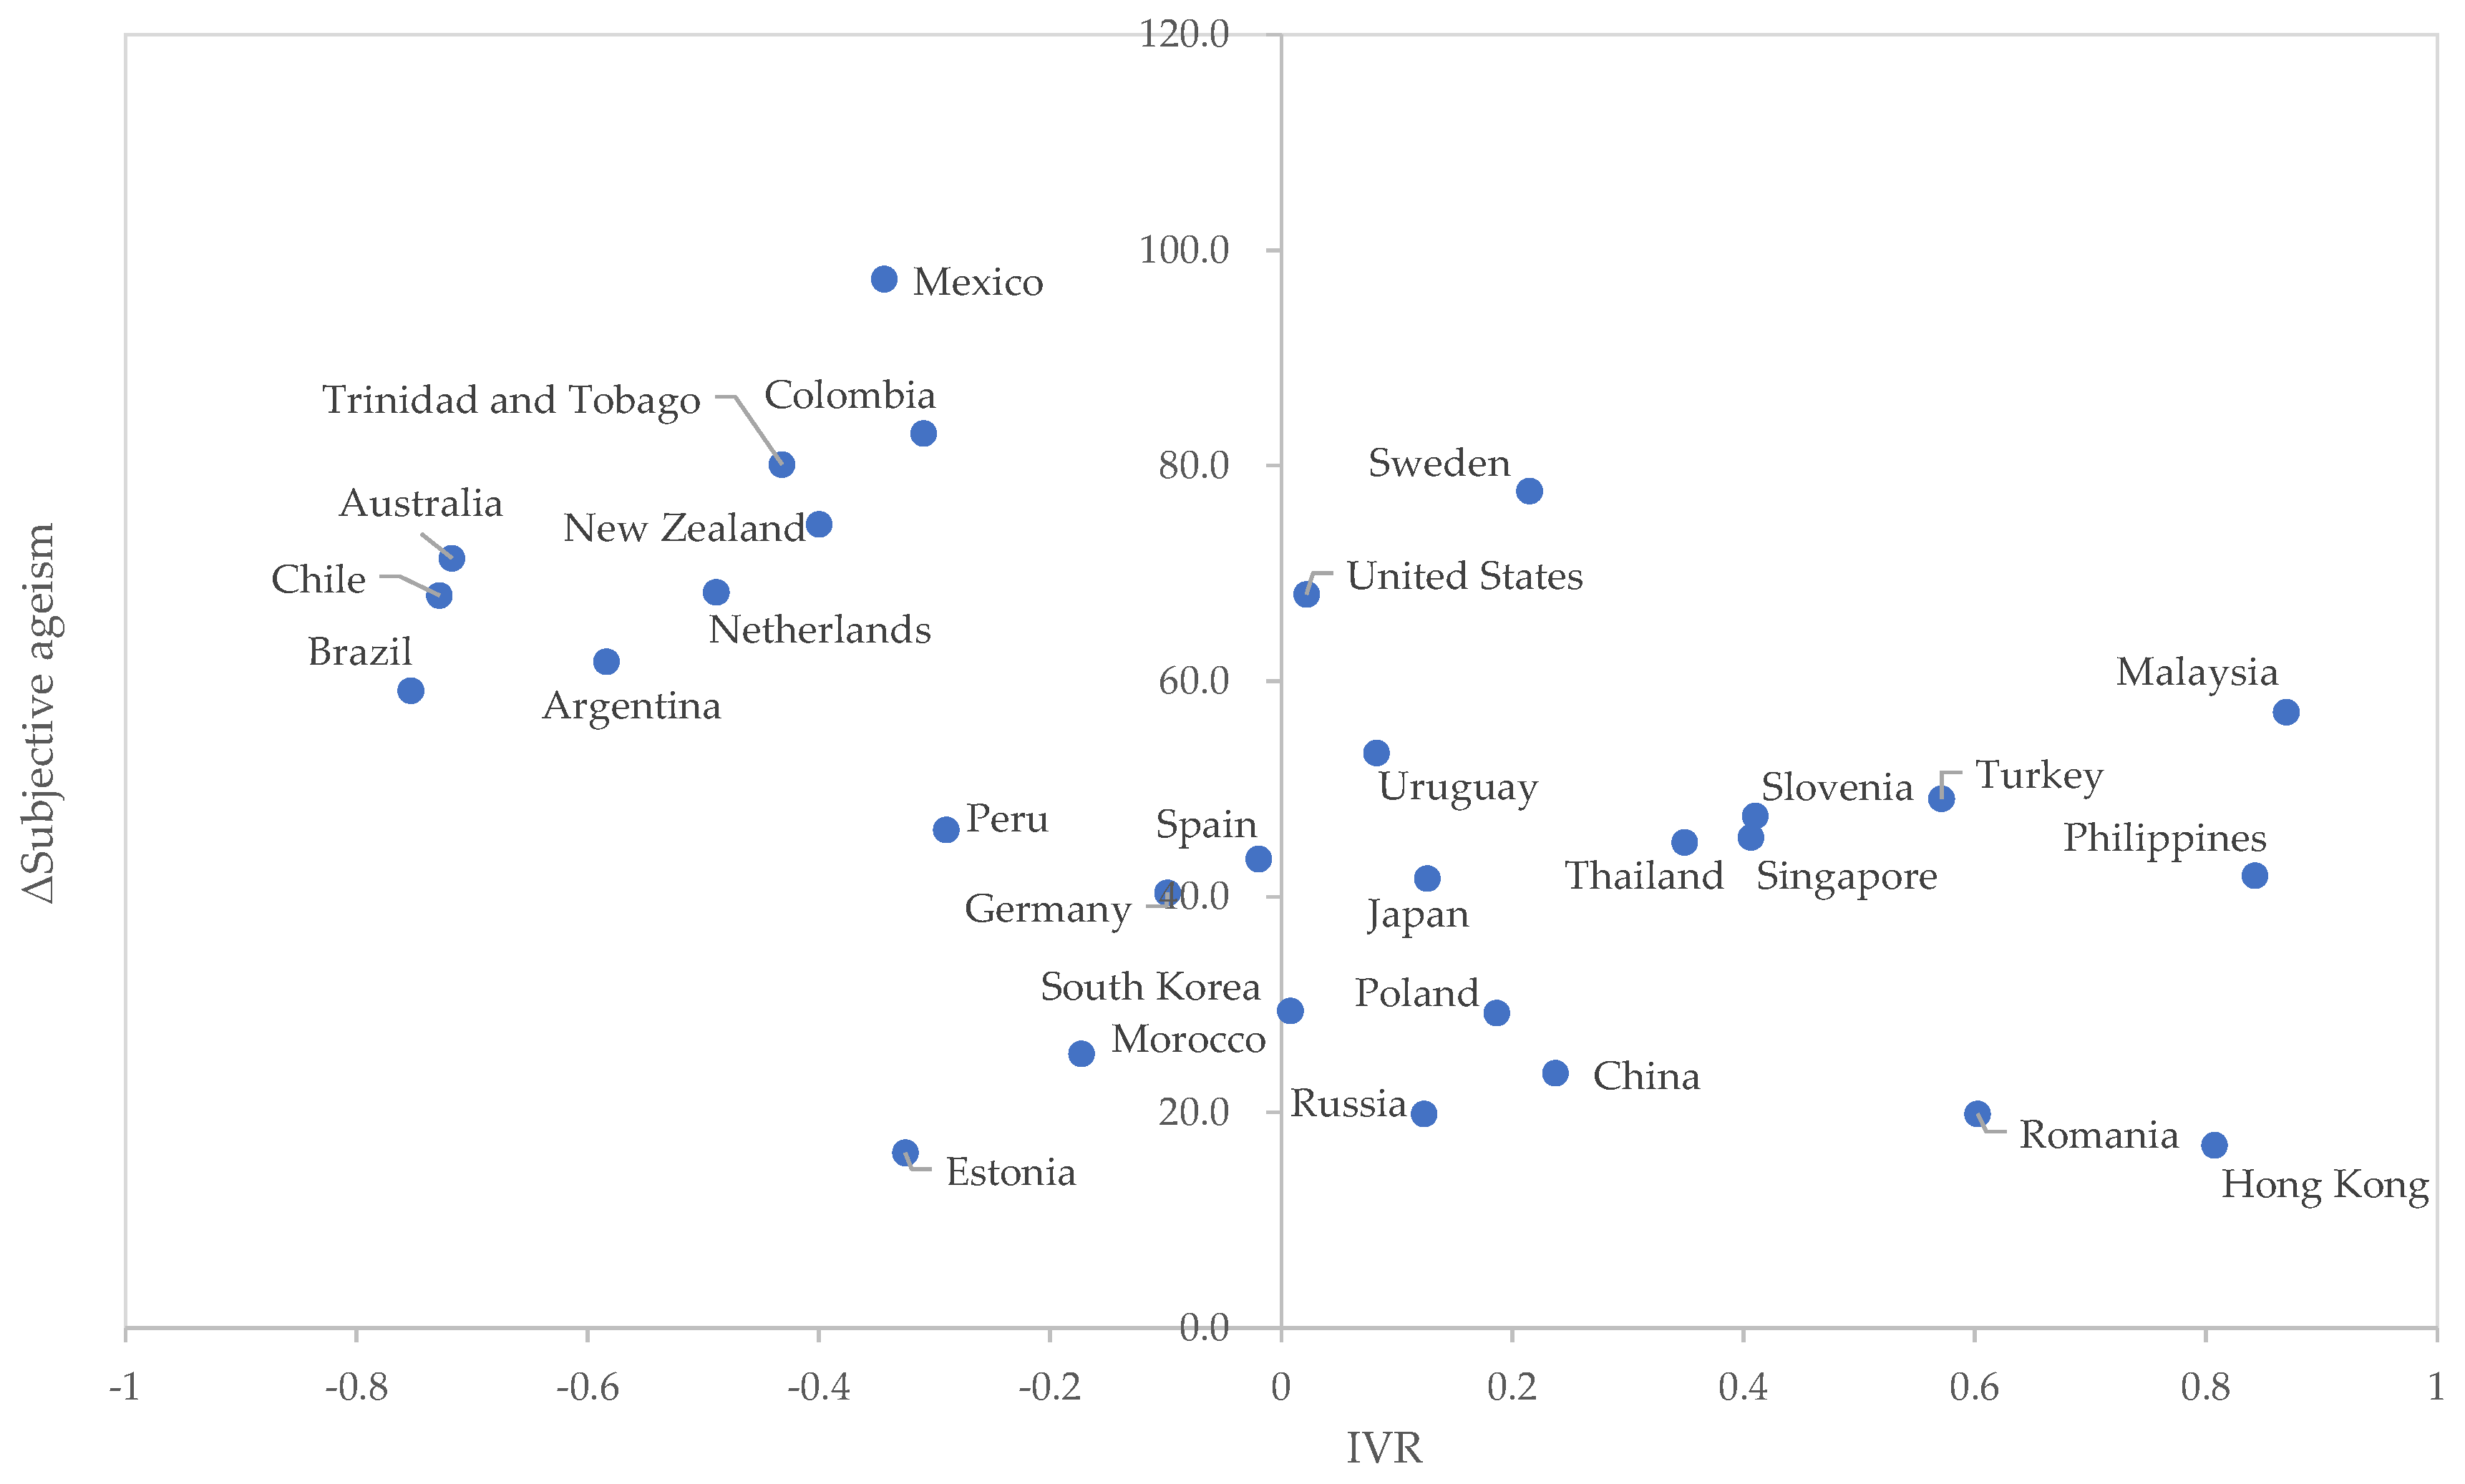
Figure 3.
Scatter plot showing the relationship between objective ageism and subjective ageism.
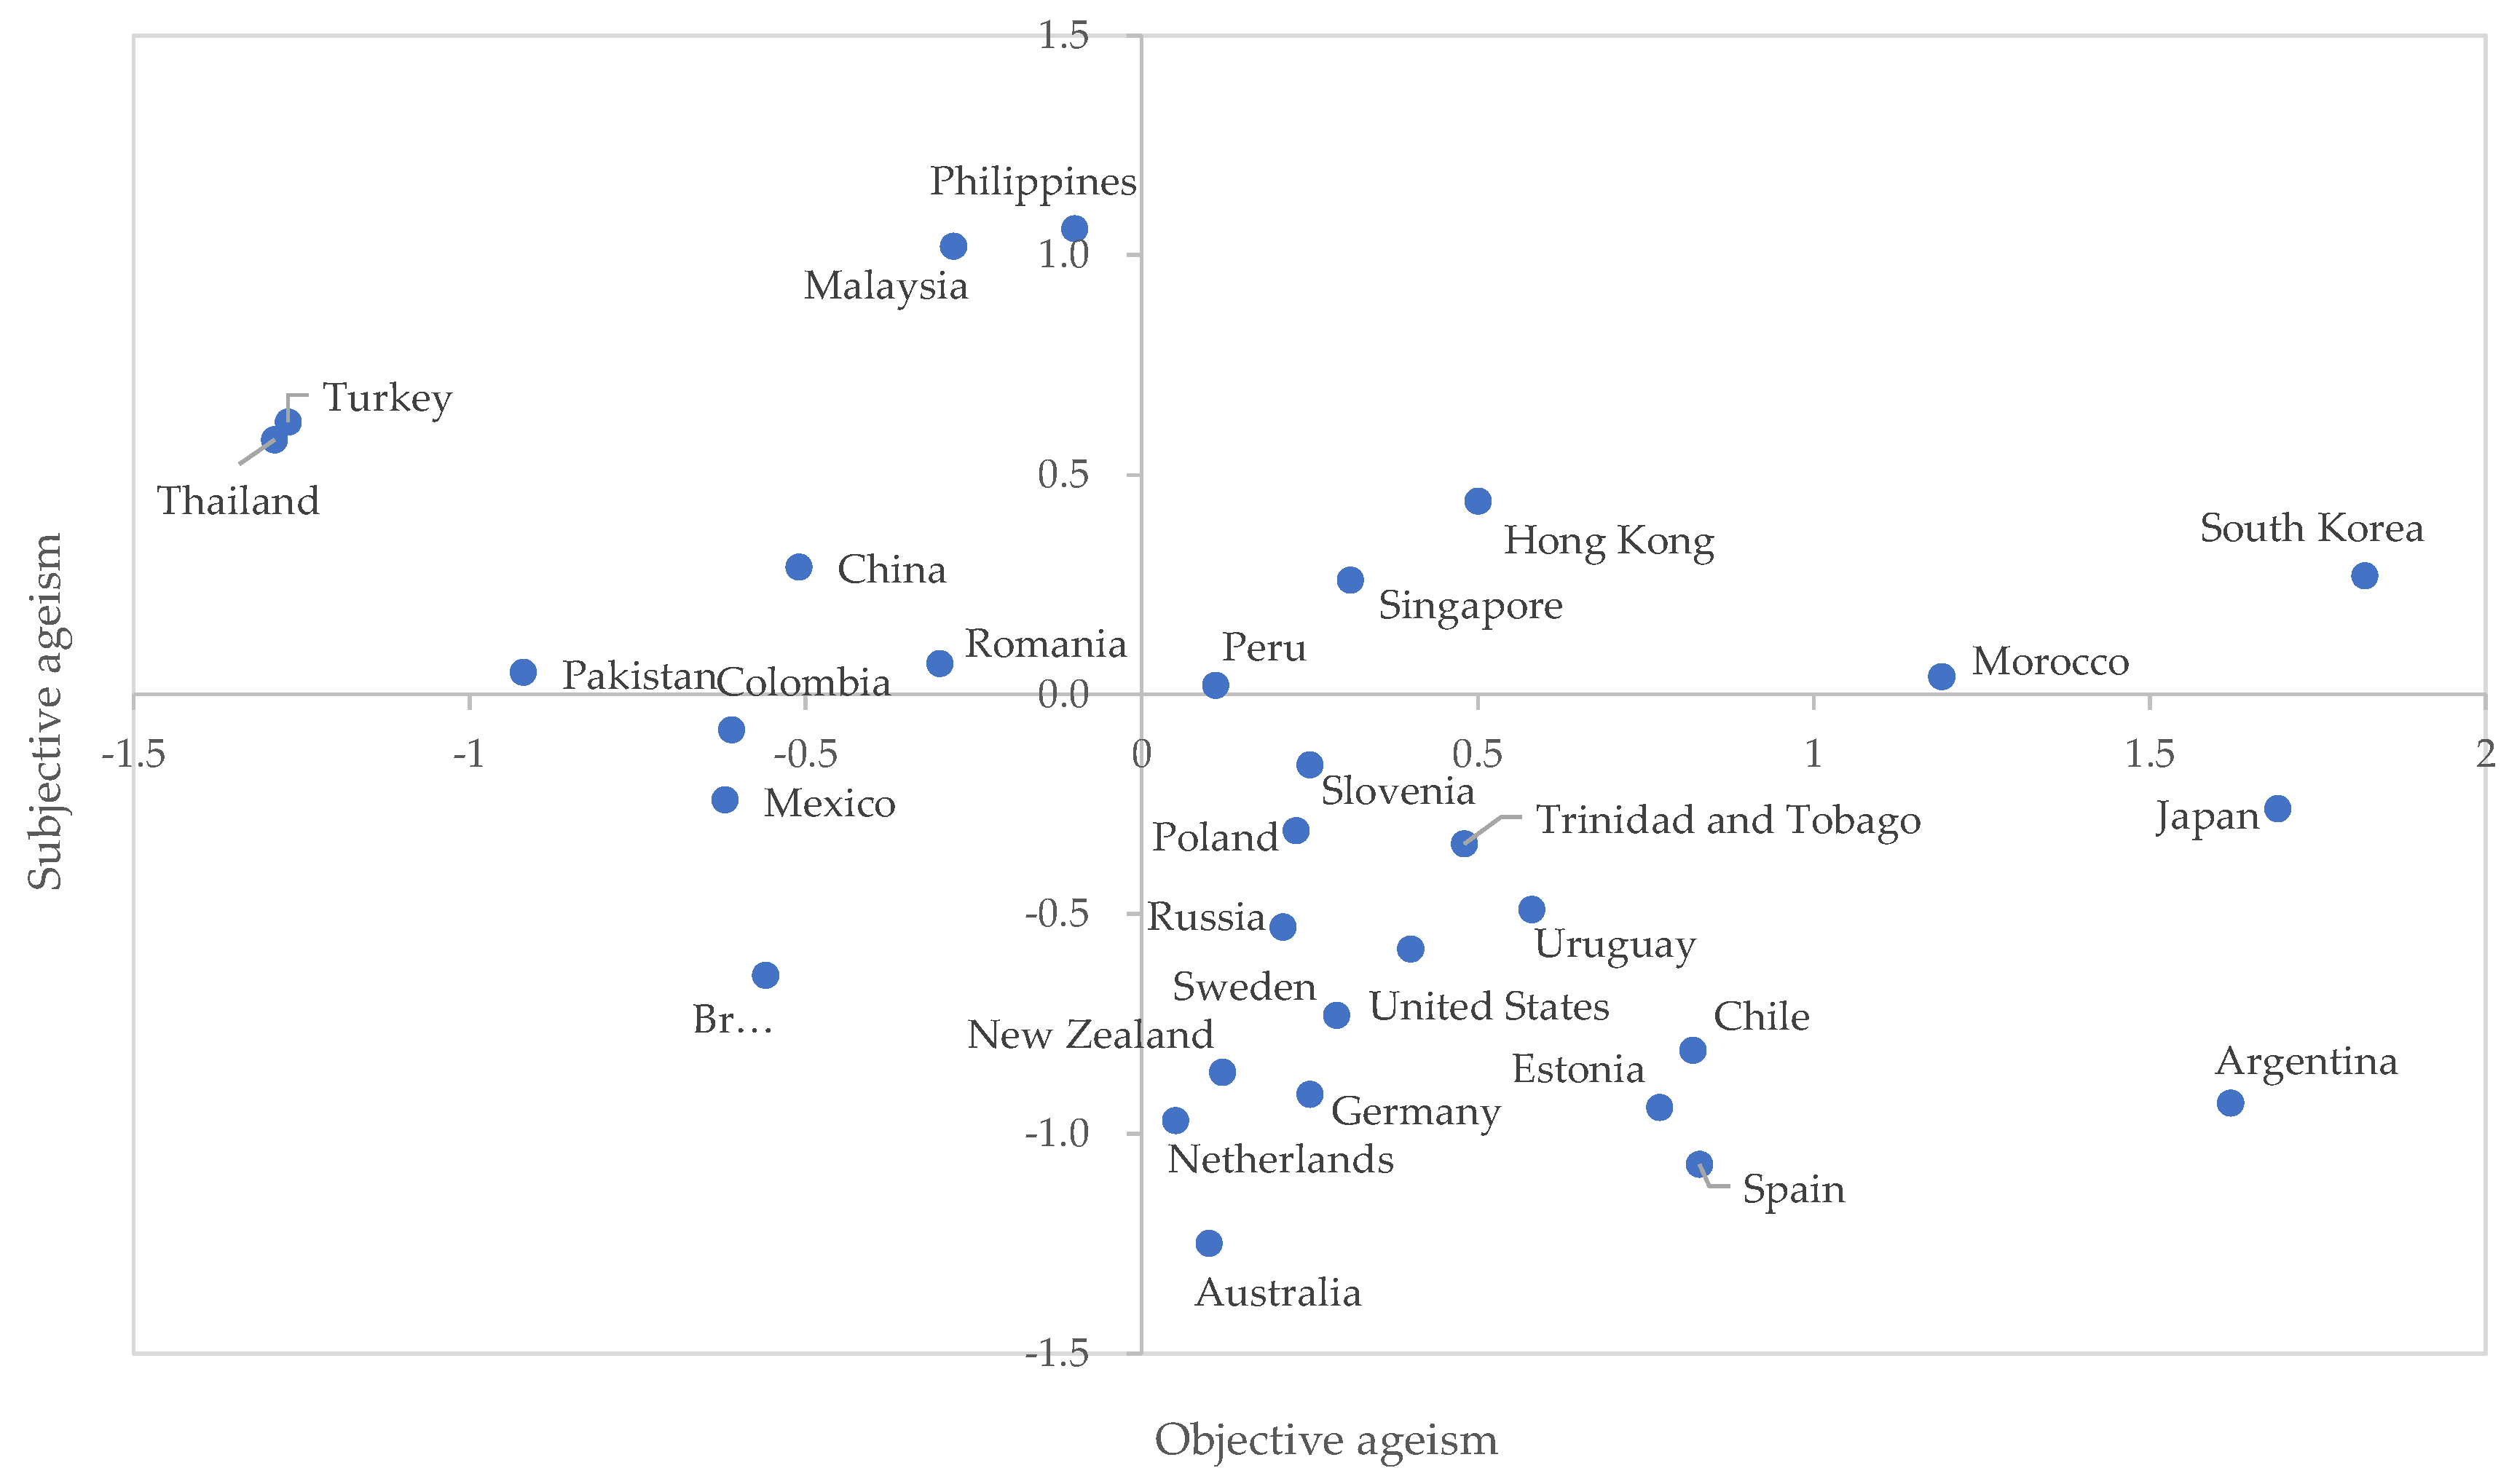

Table 1.
Number of participants by country and survey year.
| Country and survey year | N |
| Argentina 2012/13 | 815 |
| Australia 2012 | 1,089 |
| Brazil 2014 | 1,214 |
| Chile 2012 | 801 |
| China 2012/13 | 1,945 |
| Colombia 2012 | 1,294 |
| Estonia 2011 | 1,108 |
| Germany 2013 | 1,406 |
| Hong Kong 2014 | 788 |
| Japan 2010 | 1,571 |
| South Korea 2010 | 977 |
| Malaysia 2012 | 1,177 |
| Mexico 2012 | 1,793 |
| Morocco 2011 | 1,076 |
| Netherlands 2012 | 1,119 |
| New Zealand 2011/12 | 547 |
| Pakistan 2012 | 1,148 |
| Peru 2012 | 1,031 |
| Philippines 2012 | 1,001 |
| Poland 2012 | 689 |
| Romania 2012 | 1,105 |
| Russia 2011 | 1,972 |
| Singapore 2012 | 1,484 |
| Slovenia 2011 | 758 |
| Spain 2011 | 854 |
| Sweden 2011 | 852 |
| Thailand 2013 | 1,050 |
| Trinidad and Tobago 2010/11 | 728 |
| Turkey 2011 | 1,406 |
| United States 2011 | 1,683 |
| Uruguay 2011 | 751 |
Table 2.
Ageism item names and scoring methods.
| Item | Scoring method |
| “Social position: People in their 70s” (n = 33,402). | A ten-point Likert scale ranging from "extremely high" to "extremely low" was used for the analysis with the scores from 1 to 10 given. |
| “People over 70: are seen as friendly” (n = 33,619), “People over 70: are seen as competent” (n = 33,421), “People over 70: viewed with respect” (n = 33,831). | A six-point Likert scale ranging from " very likely to be viewed that way" to "not at all likely to be viewed that way " was used for the analysis with the scores from 0 to 5 given. |
| “Is a 70-year old boss acceptable” (n = 33,878). | A ten-point Likert scale ranging from "completely acceptable" to "completely unacceptable" was used for the analysis with the scores from 1 to 10 given. |
| “Older people are not respected much these days” (n = 34,203), “Older people get more than their fair share from the government” (n = 33,159), “Older people are a burden on society” (n = 33,885), “Companies that employ young people perform better than those that employ people of different ages” (n = 32,456), “Old people have too much political influence” (n = 31,904). | A four-point Likert scale ranging from "Strongly disagree" to "Strongly agree" was used for the analysis with the scores from 1 to 4 given. |
The item names are taken from the variable names included in the database by Inglehart et al. [2] and are different from the questions in the questionnaire. In some countries with a small elderly population, the definition of elderly in the questionnaire is "60 years old or older." Therefore, the question text corresponding to the above item names is also changed to "60" instead of "70.".
Table 3.
Results of exploratory factor analysis.
| Items | Objective ageism | Subjective ageism |
| People over 70: are seen as competent | 0.828 | -0.092 |
| People over 70: viewed with respect | 0.807 | -0.198 |
| People over 70: are seen as friendly | 0.716 | 0.282 |
| Companies that employ young people perform better than those that employ people of different ages | -0.188 | 0.741 |
| Old people have too much political influence | -0.202 | 0.738 |
| Older people get more than their fair share from the government | 0.088 | 0.595 |
| Older people are a burden on society | 0.279 | 0.528 |
Note(s): The italic values are the scores higher than 0.4.
Table 4.
Descriptive statistics and correlation coefficients.
| Mean | SD | 1 | 2 | 3 | 4 | 5 | 6 | 7 | 8 | 9 | 10 | ||
| 1 | PDI | 61.710 | 19.683 | -0.537** | 0.121 | 0.044 | 0.319 | -0.327 | -0.064 | 0.643*** | |||
| 2 | IDV | 40.870 | 23.332 | -0.639*** | -0.202 | 0.191 | -0.28 | 0.313 | -0.03 | -0.372 | |||
| 3 | UAI | 66.710 | 24.089 | 0.112 | -0.152 | 0.004 | -0.234 | 0.171 | 0.178 | -0.295 | |||
| 4 | MAS | 48.520 | 18.266 | 0.109 | -0.027 | -0.032 | -0.12 | 0.042 | 0.108 | 0.012 | |||
| 5 | LTO | 46.632 | 25.141 | 0.005 | 0.000 | -0.111 | -0.089 | -0.664*** | -0.033 | 0.298 | |||
| 6 | IVR | 48.449 | 23.302 | -0.291 | 0.245 | -0.078 | 0.005 | -0.533** | -0.109 | -0.455* | |||
| 7 | Objective ageism | -0.198 | 0.775 | -0.268 | 0.195 | 0.152 | 0.062 | 0.213 | -0.080 | -0.227 | |||
| 8 | Subjective ageism | 0.237 | 0.615 | 0.700*** | -0.646** | -0.216 | 0.162 | 0.018 | -0.307 | -0.358* | |||
| 9 | Population ages 65 and above (% of total population) | 11.679 | 5.157 | -0.474** | 0.552** | 0.126 | -0.116 | 0.477** | -0.08 | 0.431* | 0.550** | ||
| 10 | Change in percentage aged 65 and above | 1.729 | 1.146 | -0.221 | -0.026 | 0.108 | 0.15 | 0.474** | -0.074 | 0.314 | 0.021 | 0.509** | |
| 11 | Log of Gross domestic product per capita, constant prices | 10.098 | 0.683 | -0.441* | 0.494** | -0.266 | -0.14 | 0.321 | 0.281 | 0.355 | 0.425* | 0.652*** | 0.297 |
n = 31. *** p < 0.001, ** p < 0.01, * p < 0.05. Below the diagonal are normal correlation coefficients, above are partial correlation coefficients. PDI: power distance. IDV: individualism. UAI: uncertainty avoidance. MAS: masculinity. LTO: long-term orientation. IVR: indulgence versus restraint.
Table 5.
Results of hierarchical multiple regression analysis.
| Model 1 | Model 2 | |||
| β | p | β | p | |
| Population ages 65 and above (% of total population) | 0.696 | 0.003** | 0.638 | 0.002** |
| Change in percentage aged 65 and above | -0.402 | 0.025* | -0.39 | 0.005 |
| Log of Gross domestic product per capita, constant prices | 0.091 | 0.638 | -0.153 | 0.348 |
| PDI | -0.484 | 0.001** | ||
| IVR | 0.232 | 0.084 | ||
| R2 | 0.430 | 0.704 | ||
| F | 6.790** | 0.010 | 11.883*** | 0.000 |
n = 31. *** p < 0.001, ** p < 0.01, * p < 0.05. Dependent variable is subjective ageism. PDI: power distance. IVR: indulgence versus restraint.
Disclaimer/Publisher’s Note: The statements, opinions and data contained in all publications are solely those of the individual author(s) and contributor(s) and not of MDPI and/or the editor(s). MDPI and/or the editor(s) disclaim responsibility for any injury to people or property resulting from any ideas, methods, instructions or products referred to in the content. |
© 2024 by the authors. Licensee MDPI, Basel, Switzerland. This article is an open access article distributed under the terms and conditions of the Creative Commons Attribution (CC BY) license (http://creativecommons.org/licenses/by/4.0/).
Copyright: This open access article is published under a Creative Commons CC BY 4.0 license, which permit the free download, distribution, and reuse, provided that the author and preprint are cited in any reuse.


