Submitted:
14 August 2024
Posted:
15 August 2024
You are already at the latest version
Abstract
Background: Bioaerosol can represent a danger to the health. During SARS-CoV-2 pandemic, portable devices were used in different environments and considered a valuable prevention tool. This study has evaluated the effectiveness of the air treatment device “AEROK 1.0” in reducing microbial, particulate and pollen airborne contamination indoors, during normal activity. Methods: In an administrative room, airborne microbial contamination was measured using active (DUOSAS 360 and MD8) and passive sampling; a particle counter was used to evaluate particle concentrations; a Hirst-type pollen trap was used to assess airborne pollen and Alternaria spores. Statistical analysis was performed using SPSS 26.0; p values <0.05 were considered statistically significant. Results: The airborne bacterial contamination assessed by the two different samplers decreased by 55.54% and 69.13%, respectively. The airborne bacterial contamination assessed by passive sampling decreased by 44.16%. For fungi, the reduction was 38.7% by active sampling. Airborne particles (diameters ≥ 1.0, 2.0 μm) and the ratio of indoor/outdoor concentrations of total pollen and Alternaria spp spores significantly decreased. Conclusions: The results highlight the effectiveness of AEROK 1.0 in reducing airborne contamination. The approach carried out represents a contribution to the definition of a standardized model for evaluating the effectiveness of this type of devices.
Keywords:
air contamination
; microorganisms
; pollen
; particles
; sampling
; air disinfection
1. Introduction
A part of aerosol consists of particles of biological origin (bioaerosol). Airborne particulate is a topic of great interest in many areas of human activity, as it represents a danger to the human health and the integrity of materials [1,2,3,4,5,6,7,8,9,10,11]. In indoor environments the concentrations of particulate may be higher than outdoor depending on the activity taking place there, the number of occupants, construction characteristics, materials and furnishings characteristics, and the possible presence of air treatment systems. The indoor air quality assumes an important role for people’s health, if we consider that we spend up to 90% of our time indoors (domestic, work, leisure, transport, etc.) [12,13,14].
World Health Organization has described a combination of symptoms associated with staying in a building, without specific causes, named Sick Building Syndrome (SBS) [15]. It is a disease with multifactorial etiology, with non-specific symptoms, such as headache, drowsiness, difficulty concentrating, memory issues, asthenia, nausea, eye irritation, nose, throat, asthmatic respiratory problems, skin rashes, dryness and irritation of the throat and gastrointestinal manifestations. The presence of particulate matter, especially of fungal origin, together with unfavorable microclimatic parameters is often considered one of the causes of the symptoms [16,17,18,19]. Indoor air quality also can affect mental well-being [20].
To achieve high-quality indoor air, various air treatment systems, with different mechanisms of action, have been used, including HVAC (Heating, Ventilation and Air Conditioning) systems equipped with HEPA (High Efficiency Particulate Air) filters [21,22,23,24,25,26,27,28,29,30,31,32,33,34,35,36,37,38,39,40].
Ventilation and air filtration were a valuable prevention tool during the COVID19 pandemic, and portable air purification devices have also been used [41,42,43,44,45] in different kinds of environments.
This study aimed to evaluate the effectiveness of the air treatment device “AEROK 1.0” (hereinafter AEROK) in reducing microbial, particle, and pollen airborne contamination in working environments.
2. Methods
2.1. Features of the Device AEROK
AEROK treats 1250 m3/h of air. Air disinfection is carried out by a copper electro-filter. The filter undergoes periodic self-washing with distilled water, which removes solid particles present on the accumulation plates, restoring the initial filtration capacity. The water is constantly disinfected by UV radiation. The noise level is lower than 40 dB.
2.2. Study Site
AEROK was installed in a room used for administrative purposes at the Laboratory of Hygiene and Public Health, of the Department of Medicine and Surgery of the University of Parma. The room had the following dimensions: 4.50 m height, 5.25 m length, 3.50 m width of 18.25 m2 surface area, and 82.68 m3 volume. The room was occupied by 2-3 people.
2.3. Microbial Sampling
The airborne concentration of microorganisms (cfu/m3, colony forming units per cubic meter of air) was measured by active sampling, and the sedimentation rate of microorganisms on surfaces (cfu/plate/time) was measured by passive sampling [46,47,48,49,50,51,52].
2.3.1. Active Sampling
Two PBI (VWR) - DUOSAS 360 samplers with 55 mm diameter RODAC plates (Replicate Organism Detection and Agar Counting) for bacterial and fungal evaluation were used and a Sartorius MD8 Airport Portable Air Sampler, with gelatine filter membranes, for bacterial evaluation was used; after sampling the gelatine membranes were put on Petri dishes of 9 cm diameter. The results were expressed as cfu/m3.
2.3.2. Passive Sampling
Petri dishes of 9 cm in diameter were exposed at a height of 1 meter for 1 hour to determine the Index of Microbial Air (IMA) for bacterial and fungal evaluation.
2.3.3. Cultural Conditions
TSA medium (Triptic Soy Agar) and SDA medium (Sabouraud Dextrose Agar) were used, to determine bacterial and fungal contamination, respectively. TSA plates were incubated for 48 hours at 36±1 °C and SDA plates were incubated for 120 hours at 25±1 °C.
2.3.4. Microbial Monitoring Plan
Microbial monitoring was carried out for five working days, with samplers and plates positioned according to the scheme shown in Figure 1 and Figure 2. The study involved two hours of sampling with AEROK turned off; then AEROK ran for one hour, without sampling. The sampling started again at the 2nd hour of the AEROK running over the next two hours. The sampling took place during regular working activity, and the number of door openings in the room was recorded during the sampling time to assess the working traffic.
For one-hour sampling, serial active microbiological sampling with the suction of 125 L of air four times was performed (every 20 minutes, at 0, 20, 40, 60 minutes) and settle plates were exposed in the studied room. Furthermore, an additional passive sampling point was placed in the corridor adjacent to the room, where air treatment was absent.
2.4. Particle Sampling
The particle concentration measurements were carried out in the center of the room by using a particle counter LASAIR III 5100 (Particle Measuring System) according to ISO 14644-1 and 14644-2 [53,54,55] (Figure 1).
2.4.1. Particles Sampling Plan
Two hundred measures each were taken (one per minute) by continuously sampling of 100 L of air, with AEROK off and then with AEROK on, in the absence of people.
The particle counter LASAIR III 5100, with a flow rate of 100 L/minute and channels for sampling particles ≥ 0.5; 1.0; 2.0; 5.0; 10.0; 25.0 μm, was certified and validated according to ISO 21501-4:2018 [53].
2.5. Aerobiological Sampling of Pollen and Fungal Spores
The sampling of airborne pollen and fungal spores was carried out using a volumetric Hirst-type pollen trap (7-day Burkard Spore trap) [56]. The sampler worked continuously for two weeks with the change of the sampling tape on the seventh day. After sampling, the tape, previously treated with silicone, was mounted with gelatine on slides, one for each day of sampling, stained with fuchsin and observed under a microscope for the recognition and counting of total pollen and fungal spores of Alternaria spp. The values obtained were expressed as spores per m3.
The concentration of indoor (I) total pollen and fungal spores of Alternaria spp. were compared to those outdoor (O) (kindly provided by the Regional Agency for Prevention, Environment and Energy of Emilia-Romagna, ARPAE). The indoor-to outdoor concentration ratio (I/O) result was used as a reference value to compare the results obtained with AEROK off and with AEROK on.
2.5.1. Sampling Points
Inside the room, the sampling of total pollen and fungal spores of Alternaria spp. were made according to the scheme shown in Figure 2.
2.5.2. Pollen and Fungal Spores Sampling Plan
Sampling was carried out continuously, keeping the windows constantly open to allow the aerospora entry from outside, for 7 days with AEROK off and for 7 days with AEROK on in the absence of people.
2.6. Measurement of Temperature, Relative Humidity and CO2 Concentration
The microclimatic parameters were measured, during microbial monitoring, by Kimo AMI 310 STD device equipped with multifunction probes for temperature, relative humidity, and CO2. The measurement of temperature, relative humidity and CO2 was performed with the same time frame as the microbial monitoring inside the room.
2.7. Statistical Analysis
Statistical analysis was performed using the SPSS 26.0 package. Descriptive analysis was made showing mean, standard deviation, minimum value, maximum value, confidence intervals. For the comparison of bacterial and fungal contamination detected with AEROK off and with AEROK on, Student’s t test was performed for paired data. In particular, the results of the 2nd hour were compared with the ones obtained in the 3rd hour and with the mean of the results of 3rd and 4th hour. Student’s t test for independent data was used to assess the difference in particle concentration. Chi-square test was used to assess the difference between the concentration ratio I/O of pollen and fungal spore concentrations of Alternaria spp. with AEROK off and with AEROK on. P values <0.05 were considered statistically significant.
3. Results
3.1. Microbial Air Sampling
3.1.1. Bacteria
Table 1 shows the mean, standard deviation, and confidence interval of cfu/m3 for active sampling carried out by DUOSAS sampler (mean values from the two DUOSAS samplers) over the 5 working days. The decrease in airborne bacterial contamination between the 2nd hour of sampling (AEROK off) and the 3rd hour (AEROK on) was 69.13%; between the 2nd hour and the mean between the values of 3rd and 4th hour (AEROK on) was 70.41%.
Figure 3 shows the cfu/m3 obtained with the two DUOSAS samplers over the five working days (mean).
Table 2 shows the cfu/m3 mean values of the MD8 sampler over the 5 working days. The decrease in airborne bacterial contamination between the 2nd hour of sampling (AEROK off) and the 3rd hour (AEROK on) was 55.54%; between the 2nd hour and the mean between the values of 3rd and 4th hour (AEROK on) it was 56.72%.
Regarding passive sampling, Table 3 shows the IMA values obtained at point E (center of the room). There was a decrease between the values of the 2nd hour (AEROK off) and the 3rd hour (AEROK on) of 44.16% and between the 2nd hour compared to the mean of 3rd and 4th hour (AEROK on) of 56.49%.
Table 4 shows the IMA values obtained in the corridor.
Figure 4 shows the results of IMA values obtained at the same time at point E in the studied room with AEROK off (1st e and 2nd hour) and with AEROK on (3rd and 4th hour) and in the adjacent corridor in the absence of air treatment.
Figure 5 shows bacterial air contamination values assessed by active sampling using DUOSAS and MD8, expressed as cfu/m3, and the results of passive sampling performed at point E, expressed as IMA.
Figure 6 shows the IMA median values and interquartile ranges referring to IMA values measured in the different sampling hours for each sampling point (Figure 2). At points A, B and E a reduction in IMA values during the third and fourth hour (AEROK on) compared to the first two hours (AEROK off) was observed.
3.1.2. Fungi
Fungal airborne contamination detected by DUOSAS significantly decreased between the 2nd hour (AEROK off) and the 3rd and 4th hour (AEROK on) (p=0.013), from 27.1 cfu/m3 to 16.6 cfu/m3 (38.7% of reduction). Regarding the passive sampling carried out at point E, the fungal contamination decreased, although not significantly, between the 2nd hour (1.6 IMA) and the mean of the 3rd hour and the 4th hour (1.2 IMA) (data not shown).
3.1.3. Door Openings
Table 5 shows the number of door openings per hour recorded during microbial sampling over 5 days sampling, used as an indicator of the attendance in the room and adjacent spaces (p<0.05). The highest number of openings was observed at the fourth hour.
3.2. Particles
Table 6 shows particles/m3 values according to the particle size assessed with AEROK off and with AEROK on during the 200 minutes of observation for each of the two conditions.
With AEROK turned on, a significant reduction of particles with diameters 1.0, 2.0 μm was observed (p<0.001). For particles with diameters ≥0.5, 5, 10 and 25 μm, no significant differences were found between the results obtained with AEROK off and with AEROK on (data not shown).
3.3. Pollen and Fungal Spores
Figure 7 shows the mean values of the indoor-to-outdoor concentration ratio (I/O) of total pollen and fungal spores of Alternaria spp. Over the 7 days of sampling during the sampling period: 7 days with AEROK off and 7 days with AEROK on.
Significantly, the concentration ratio I/O of total pollen (p<0.001) and spores of Alternaria spp. (p<0.05) decreased with AEROK on.
3.4. Monitoring of Microclimatic Parameters
No significant changes in temperature, relative humidity and CO2 values were observed between AEROK off and AEROK on (data not shown).
4. Discussion
In recent years portable (stand-alone) air purifiers are increasingly being adopted, also due to COVID-19 pandemic, with a wide diffusion in different environments. This, despite the uncertainties about their effectiveness, in reducing airborne contamination [31,57,58,59].
The characteristics of these devices using different mechanisms of action (HEPA filters, electrostatic decontamination, chemical and/or UV radiation disinfection, etc.) are very different. Each mechanism of action has strengths and weaknesses (noise, high energy costs, pressure drop, disposal of chemicals, residues, or by-products). The goal has been to demonstrate the effectiveness in removing airborne contamination from particulate matter, viruses, bacteria, fungi, VOCs, allergens, etc.
Most of the studies have analyzed only one device at a time or a comparison between multiple devices; other studies have compared decontamination methods [32,33,34,35,36,37,38,39]. Often, the studies were limited to well controlled laboratory situation or in at rest conditions, but also field tests are important, because laboratory tests may not run with the complexities of the real situations (i.e airflow patterns, occupant behaviors, interactions with the interior environment, etc). A recent review and metanalysis [60] refers 36 papers on stand-alone-air purifiers that investigated biological pollutants removal in residential buildings; 6 in health care settings; 4 in schools, 2 in daycares. The research focused on pet allergens (11 papers), bioaerosols (9 papers), house dust mite allergen (8 papers), fungal spores (8 papers), SARS-CoV-2 RNA (5 papers), cockroach allergen (2 papers), pollen (2 papers), and airborne endotoxin (1 paper). The air cleaning technologies applied in these studies were different, but a majority focused on HEPA filters. The tests have been often carried out without a vision of standardization regarding the methods used and the contaminants considered [21,32,33,34,35,36,37,38,39].
Based on the previous experiences [61,62,63,64,65,66], we evaluated the effectiveness of an air treatment device with a global approach including the assessment microbial, particle, pollen, and fungal contamination. As for microbial contamination, active and passive sampling were used to have a complete assessment of air biological quality. They have different purpose: active sampling provides information about concentration of airborne viable particles, whereas passive sampling measures the rate of which viable particles settle on surfaces. Passive sampling provides a measure of the contribution of airborne contamination to the contamination of the surfaces.
The results obtained highlight the effectiveness of the tested device in reducing airborne microbial contamination. This effectiveness is also supported by the observation of the trend of microbial contamination detected in the room where the device was operating compared to that of the contamination detected in the adjacent corridor, with similar activity. The presence of people and their activity are in fact the main factors that increase airborne microbial contamination [67,68,69]. Between the 1st and 2nd hour, in both environments a reduction in microbial contamination was observed, corresponding to the reduction of administrative activity; during the 3rd and 4th hours, in correspondence with the increased administrative activity, an increase in microbial contamination was observed in the corridor, while in the room with AEROK on, microbial contamination continued to decrease. Regarding passive sampling, no reduction in microbial contamination was observed in the points C and D, contrary to what was observed at the point E, probably affected respectively by the presence of a copier in continuous operation and the opening of the door. AEROK was also effective in reducing airborne particle contamination for particles with diameters ≥ 1.0; 2.0 μm. Moreover, AEROK reduced the concentration of airborne pollen (p<0.001) and fungal spores of Alternaria spp. (p<0.05). This result is particularly relevant, because it is obtained with windows constantly open and therefore in a condition which favors the accumulation of the monitored “contaminants”. The tested device does not use chemical compounds with biocidal activity, resulting in the absence of chemical by-products to be disposed off. Therefore, the need for maintenance activities for filter cleaning is reduced, minimizing the risk of environmental contamination or exposure of personnel. The effectiveness of air handling devices is usually assessed through laboratory tests and not through field studies within living or working environments, as carried out in this study. In addition, only some of the aspects considered in this study (bacterial, fungal, particulate contamination, pollen, and fungal spores) are often analyzed. Based on the literature, no converged conclusions can be drawn regarding the effectiveness of air purification technologies in practice. The documented and well-controlled laboratory studies do not adequately represent the practical situation in which the purifier systems are used [40]. Air cleaners are generally found to be effective in removing PM2.5 and PM10, with mean aggregated reductions of 49% and 44% respectively [59]. These findings are in line with our results using AEROK electrostatic copper filter device showing slightly higher reduction of microbial contamination and of pollen and fungal spores I/O ratio.
5. Conclusions
This study provided an assessment of the effectiveness of the AEROK copper electro-static filtration system for air disinfection in a working environment under real working conditions. It can also represent a useful contribution to the definition of a standardized model for evaluating of the effectiveness of this type of devices.
Author Contributions
“Conceptualization, R.A., C.P. and M.E.C.; methodology, R.A., C.P., M.E.C., I.V. and E.C.; statistical Analysis, R.A., C.P., M.E.C., L.V., M.M.M.I. and A.C.; investigation, R.A., C.P., M.E.C., I.V., E.C. and M.S.; data curation, A.C., M.M.M.I.; writing – original draft preparation, R.A., P.C. and M.M.M.I.; writing – review & editing, R.A., C.P., M.E.C., I.V., R.Z., P.A., L.V., A.C. and M.M.M.I;”, All authors have read and agreed to the published version of the manuscript.
Funding
The AERSAFE srl supported this study with a liberal grant.
Institutional Review Board Statement
Not applicable.
Informed Consent Statement
Not applicable.
Data Availability Statement
Data are available upon request.
Acknowledgments
The authors are grateful to Mrs. Rosslynne Milburn for her linguistic advice.
Conflicts of Interest
All the authors certify that they have NO affiliations with or involvement in any organization or entity with any financial interest in the subject matter or materials discussed in this manuscript. The funding sponsor did have any role in the choice of research project, design of the study, collection and analysis or interpretation of data and in the writing of the manuscript.
References
- Mbareche, H.; Morawska, L.; Duchaine, C. On the Interpretation of Bioaerosol Exposure Measurements and Impacts on Health. J Air Waste Manage Assoc 2019, 69, 789–804. [Google Scholar] [CrossRef] [PubMed]
- Raaschou-Nielsen, O.; Andersen, Z.J.; Beelen, R.; Samoli, E.; Stafoggia, M.; Weinmayr, G.; Hoffmann, B.; Fischer, P.; Nieuwenhuijsen, M.J.; Brunekreef, B.; et al. Air Pollution and Lung Cancer Incidence in 17 European Cohorts: Prospective Analyses from the European Study of Cohorts for Air Pollution Effects (ESCAPE). Lancet Oncol 2013, 14, 813–822. [Google Scholar] [CrossRef] [PubMed]
- Haddrell, A.E.; Thomas, R.J. Aerobiology: Experimental Considerations, Observations, and Future Tools. Appl Environ Microbiol 2017, 83, e00809-17. [Google Scholar] [CrossRef] [PubMed]
- Cincinelli, A.; Martellini, T. Indoor Air Quality and Health. Int J Environ Res Public Health 2017, 14, 1286. [Google Scholar] [CrossRef]
- Kumar, P.; Singh, A.B.; Singh, R. Comprehensive Health Risk Assessment of Microbial Indoor Air Quality in Microenvironments. PLoS One 2022, 17, e0264226. [Google Scholar] [CrossRef]
- Cedeño Laurent, J.G.; Macnaughton, P.; Jones, E.; Young, A.S.; Bliss, M.; Flanigan, S.; Vallarino, J.; Chen, L.J.; Cao, X.; Allen, J.G. Associations between Acute Exposures to PM2.5and Carbon Dioxide Indoors and Cognitive Function in Office Workers: A Multicountry Longitudinal Prospective Observational Study. Environ Res Letters 2021, 16, 094047. [Google Scholar] [CrossRef] [PubMed]
- Buters, J.; Prank, M.; Sofiev, M.; Pusch, G.; Albertini, R.; Annesi-Maesano, I.; Antunes, C.; Behrendt, H.; Berger, U.; Brandao, R.; et al. Variation of the Group 5 Grass Pollen Allergen Content of Airborne Pollen in Relation to Geographic Location and Time in Season the HIALINE Working Group. J. Allergy Clin Immunology 2015, 136, 88–95. [Google Scholar] [CrossRef]
- Ridolo, E.; Albertini, R.; Giordano, D.; Soliani, L.; Usberti, I.; Dall’Aglio, P.P. Airborne Pollen Concentrations and the Incidence of Allergic Asthma and Rhinoconjunctivitis in Northern Italy from 1992 to 2003. Int Arch Allergy Immunol. 2007, 142, 151–157. [Google Scholar] [CrossRef]
- Borrego Alonso, S.F.; Molina, A. Behavior of the Cultivable Airborne Mycobiota in Air-Conditioned Environments of Three Havanan Archives, Cuba. J. Atmos Sc Res 2020, 3, 16–28. [Google Scholar] [CrossRef]
- Pasquarella, C.; Barchitta, M.; D’Alessandro, D.; Cristina, M.L.; Mura, I.; Nobile, M.; Auxilia, F.; Agodi, A.; Collaborators. Heating, ventilation and air conditioning (HVAC) system, microbial air contamination and surgical site infection in hip and knee arthroplasties: the GISIO-SItI Ischia study. Ann Ig 2018, 30, 22–35. [Google Scholar]
- Chawla, H.; Anand, P.; Garg, K.; Bhagat, N.; Varmani, SG.; Bansal, T.; McBain, AJ.; Marwah, RG. A comprehensive review of microbial contamination in the indoor environment: sources, sampling, health risks, and mitigation strategies. Front Public Health 2023, 11, 1285393. [Google Scholar] [CrossRef]
- Bonadonna, L.; Briancesco, R.; Coccia, A.M.; Meloni, P.; La Rosa, G.; Moscato, U. Microbial Air Quality in Healthcare Facilities. Int J Environ Res Public Health 2021, 18, 6226. [Google Scholar] [CrossRef] [PubMed]
- Sessa, R.; Di Pietro, M.; Schiavoni, G.; Santino, I.; Altieri, A.; Pinelli, S.; Del Piano, M. Microbiological Indoor Air Quality in Healthy Buildings. New Microbiologica 2002, 25, 51–56. [Google Scholar] [PubMed]
- Zoni, R.; Capobianco, E.; Viani, I.; Colucci, M.E.; Mezzetta, S.; Affanni, P.; Veronesi, L.; Di Fonzo, D.; Albertini, R.; Pasquarella, C. Fungal Contamination in a University Building. Acta Biomedica 2020, 91, 150–153. [Google Scholar]
- World Health Organization. Regional Office for Europe. Indoor Air Quality Research: Report on a WHO Meeting, Stockholm, 27-31 August 1984.; World Health Organization, Regional Office for Europe, 1986; ISBN 9289012692.
- Berglund, B.; Lindvall, T. Sensory reactions to sick buildings. Environ Int 1986, 12, 147–159. [Google Scholar] [CrossRef]
- Redlich, C.A.; Sparer, J.; Cullen, M.R. Sick-Building Syndrome. Lancet 1997, 349, 1013–1016. [Google Scholar] [CrossRef] [PubMed]
- Zhang, L.; Ou, C.; Magana-Arachchi, D.; Vithanage, M.; Vanka, K.S.; Palanisami, T.; Masakorala, K.; Wijesekara, H.; Yan, Y.; Bolan, N.; et al. Indoor Particulate Matter in Urban Households: Sources, Pathways, Characteristics, Health Effects, and Exposure Mitigation. Int J Environ Res Public Health 2021, 18, 11055. [Google Scholar] [CrossRef] [PubMed]
- Cabral, J.P.S. Can We Use Indoor Fungi as Bioindicators of Indoor Air Quality? Historical Perspectives and Open Questions. Sci Total Environ 2010, 408, 4285–4295. [Google Scholar] [CrossRef]
- Bhui, K.; Newbury, J.B.; Latham, R.M.; Ucci, M.; Nasir, Z.A.; Turner, B.; O’Leary, C.; Fisher, H.L.; Marczylo, E.; Douglas, P.; Stansfeld, S.; Jackson, S.K.; Tyrrel, S.; Rzhetsky, A.; Kinnersley, R.; Kumar, P.; Duchaine, C.; Coulon, F. Air quality and mental health: evidence, challenges and future directions. BJPsych Open 2023, 5, e120. [Google Scholar] [CrossRef]
- Oh, H.-J.; Nam, I.-S.; Yun, H.; Kim, J.; Yang, J.; Sohn, J.-R. Characterization of Indoor Air Quality and Efficiency of Air Purifier in Childcare Centers, Korea. Build Environ 2014, 82, 203–214. [Google Scholar] [CrossRef]
- Van Tran, V.; Park, D.; Lee, Y.C. Indoor Air Pollution, Related Human Diseases, and Recent Trends in the Control and Improvement of Indoor Air Quality. Int J Environ Res Public Health 2020, 17, 2927. [Google Scholar] [CrossRef] [PubMed]
- UNI 11425:2011. Impianto di ventilazione e condizionamento a contaminazione controllata (VCCC) per il blocco operatorio - Progettazione, installazione, messa in marcia, qualifica, gestione e manutenzione. Milano: Ente Nazionale Italiano di Unificazione 2011.
- Wu, J.; Alipouri, Y.; Luo, H.; Zhong, L. Ultraviolet Photocatalytic Oxidation Technology for Indoor Volatile Organic Compound Removal: A Critical Review with Particular Focus on Byproduct Formation and Modeling. J Hazard Mater 2022, 421. [Google Scholar] [CrossRef] [PubMed]
- Brągoszewska, E.; Biedroń, I. Efficiency of Air Purifiers at Removing Air Pollutants in Educational Facilities: A Preliminary Study. Front Environ Sci 2021, 9. [Google Scholar] [CrossRef]
- Kelly, F.J.; Fussell, J.C. Improving Indoor Air Quality, Health and Performance within Environments Where People Live, Travel, Learn and Work. Atmos Environ 2019, 200. [Google Scholar] [CrossRef]
- Li, Y.W.; Ma, W.L. Photocatalytic Oxidation Technology for Indoor Air Pollutants Elimination: A Review. Chemosphere 2021, 280, 130667. [Google Scholar] [CrossRef] [PubMed]
- Bragoszewska, E.; Bogacka, M.; Pikoń, K. Efficiency and Eco-Costs of Air Purifiers in Terms of Improving Microbiological Indoor Air Quality in Dwellings-A Case Study. Atmosphere 2019, 10, 742. [Google Scholar] [CrossRef]
- Lombini, M.; Schreiber, L.; Albertini, R.; Alessi, E.M.; Attinà, P.; Bianco, A.; Cascone, E.; Colucci, M.E.; Cortecchia, F.; De Caprio, V.; et al. Solar Ultraviolet Light Collector for Germicidal Irradiation on the Moon. Sci Rep 2023, 13, 8326. [Google Scholar] [CrossRef] [PubMed]
- Grinshpun, S.A.; Adhikari, A.; Honda, T.; Kim, K.Y.; Toivola, M.; Rao, K.S.R.; Reponen, T. Control of Aerosol Contaminants in Indoor Air: Combining the Particle Concentration Reduction with Microbial Inactivation. Environ Sci Technol 2007, 41, 606–612. [Google Scholar] [CrossRef] [PubMed]
- Otter, J.A.; Clark, L.; Taylor, G.; Hussein, A. Comparative evaluation of stand-alone HEPA-based air decontamination systems. Infection, Disease & Health 2023, 28, 246–248. [Google Scholar]
- Griffiths, W.D.; Bennett, A.; Speight, S.; Parks, S. Determining the Performance of a Commercial Air Purification System for Reducing Airborne Contamination Using Model Micro-Organisms: A New Test Methodology. J Hosp Infection 2005, 61, 242–247. [Google Scholar] [CrossRef]
- Uhde, E.; Salthammer, T.; Wientzek, S.; Springorum, A.; Schulz, J. Effectiveness of Air-Purifying Devices and Measures to Reduce the Exposure to Bioaerosols in School Classrooms. Indoor Air 2022, 32, e13087. [Google Scholar] [CrossRef]
- Polidori, A.; Fine, P.M.; White, V.; Kwon, P.S. Pilot Study of High-Performance Air Filtration for Classroom Applications. Indoor Air 2013, 23, 185–195. [Google Scholar] [CrossRef] [PubMed]
- Heredia-Rodríguez, M.; Álvarez-Fuente, E.; Bustamante-Munguira, J.; Poves-Alvarez, R.; Fierro, I.; Gómez-Sánchez, E.; Gómez-Pesquera, E.; Lorenzo-López, M.; Eiros, J.M.; Álvarez, F.J.; et al. Impact of an Ultraviolet Air Sterilizer on Cardiac Surgery Patients, a Randomized Clinical Trial. Med Clin 2018, 151, 299–307. [Google Scholar] [CrossRef] [PubMed]
- Batterman, S.; Du, L.; Mentz, G.; Mukherjee, B.; Parker, E.; Godwin, C.; Chin, J.Y.; O’Toole, A.; Robins, T.; Rowe, Z.; et al. Particulate Matter Concentrations in Residences: An Intervention Study Evaluating Stand-Alone Filters and Air Conditioners. Indoor Air 2012, 22, 235–252. [Google Scholar] [CrossRef] [PubMed]
- Liu, D.T.; Phillips, K.M.; Speth, M.M.; Besser, G.; Mueller, C.A.; Sedaghat, A.R. Portable HEPA Purifiers to Eliminate Airborne SARS-CoV-2: A Systematic Review. Otolaryngology - Head Neck Surg 2022, 166, 615–622. [Google Scholar] [CrossRef]
- Riederer, A.M.; Krenz, J.E.; Tchong-French, M.I.; Torres, E.; Perez, A.; Younglove, L.R.; Jansen, K.L.; Hardie, D.C.; Farquhar, S.A.; Sampson, P.D.; et al. Effectiveness of Portable HEPA Air Cleaners on Reducing Indoor Endotoxin, PM10, and Coarse Particulate Matter in an Agricultural Cohort of Children with Asthma: A Randomized Intervention Trial. Indoor Air 2021, 31, 1926–1939. [Google Scholar] [CrossRef] [PubMed]
- Medical Advisory Secretariat. Air cleaning technologies: an evidence-based analysis. Ont Health Technol Assess Ser 2005, 5, 1–52. [Google Scholar]
- Kompatscher, K.; van der Vossen, J.M.B.M.; van Heumen, S.P.M.; Traversari, A.A.L. Scoping Review on the Efficacy of Filter and Germicidal Technologies for Capture and Inactivation of Micro-Organisms and Viruses. J Hospital Infec 2023, 142, 39–48. [Google Scholar] [CrossRef]
- Allen, J.G.; Ibrahim, A.M. Indoor Air Changes and Potential Implications for SARS-CoV-2 Transmission. JAMA 2021, 325, 2112–2113. [Google Scholar] [CrossRef]
- Nardell, E.A.; Nathavitharana, R.R. Airborne Spread of SARS-CoV-2 and a Potential Role for Air Disinfection. JAMA 2020, 324, 141–142. [Google Scholar] [CrossRef]
- Schuit, M.; Ratnesar-Shumate, S.; Yolitz, J.; Williams, G.; Weaver, W.; Green, B.; Miller, D.; Krause, M.; Beck, K.; Wood, S.; et al. Airborne SARS-CoV-2 Is Rapidly Inactivated by Simulated Sunlight. Journal of Infectious Diseases 2020, 222, 564–571. [Google Scholar] [CrossRef]
- Lindsley, W.G.; Derk, R.C.; Coyle, J.P.; Martin, S.B.; Mead, K.R.; Blachere, F.M.; Beezhold, D.H.; Brooks, J.T.; Boots, T.; Noti, J.D. Efficacy of Portable Air Cleaners and Masking for Reducing Indoor Exposure to Simulated Exhaled SARS-CoV-2 Aerosols — United States, 2021. MMWR 2021, 70, 972–976. [Google Scholar] [CrossRef]
- Cortes, A.A.; Zuñiga, J.M. The use of copper to help prevent transmission of SARS-coronavirus and influenza viruses. A general review. Diagn Microbiol Infect Dis 2020, 98, 115176. [Google Scholar] [CrossRef]
- INAIL. Il Monitoraggio Microbiologico negli Ambienti di Lavoro - Campionamento e Analisi; 2010.
- International Organization for Standardization ISO 14698-1. Cleanrooms and Associated Controlled Environments — Biocontamination Control — Part 1: General Principles and Methods 2003.
- EN 17141. Camere Bianche Ed Ambienti Controllati Associati - Controllo Della Biocontaminazione. 2021.
- CDC Guidelines for Environmental Infection Control in Health-Care Facilities; NO:RR-10. 2003. Available online: https://www.cdc.gov/infectioncontrol/guidelines/environmental/index.html.
- Pitzurra, M.; Savino, A.; Pasquarella, C. Il monitoraggio ambientale microbiologico (MAM). Ann Ig 1997, 9, 439–54. [Google Scholar] [PubMed]
- Pasquarella, C.; Pitzurra, O.; Savino, A. The Index of Microbial Air Contamination. Journal of Hospital Infection. 2000, 46, 241–256. [Google Scholar] [CrossRef]
- Pasquarella, C.; Albertini, R.; Dall’Aglio, P.; Saccani, E.; Sansebastiano, G.E.; Signorelli, C. Air microbial sampling: the state of the art. Ig Sanita Pubbl 2008, 64, 79–120. [Google Scholar]
- International Organization for Standardization ISO 21501-4:2018. Determination of Particle Size Distribution -- Single Particle Light Interaction Methods -- Part 4: Light Scattering Airborne Particle Counter for Clean Spaces.
- International Organization for Standardization SO 14644-1:2015. Cleanrooms and associated controlled environments - Part 1: Classification of air cleanliness by particle.
- International Organization for Standardization ISO 14644-2:2015. Cleanrooms and associated controlled environments - Part 2: Monitoring to provide evidence of cleanroom performance related to air cleanliness by particle concentration.
- ISO 16868:2019. Ambient air - Sampling and analysis of airborne pollen grains and fungal spores for networks related to allergy - Volumetric Hirst method.
- Pisharodi, M. Portable and Air Conditioner-Based Bio-Protection Devices to Prevent Airborne Infections in Acute and Long-Term Healthcare Facilities, Public Gathering Places, Public Transportation, and Similar Entities. Cureus 2024, 11, e55950. [Google Scholar] [CrossRef] [PubMed]
- Banholzer, N.; Jent, P.; Bittel, P.; Zürcher, K.; Furrer, L.; Bertschinger, S.; Weingartner, E.; Ramette, A.; Egger, M.; Hascher, T.; Fenner, L. Air cleaners and respiratory infections in schools: A modeling study using epidemiological, environmental, and molecular data. Open Forum Infect Dis 2024, 21, ofae169. [Google Scholar] [CrossRef] [PubMed]
- Salmonsmith, J.; Ducci, A.; Balachandran, R.; Guo, L.; Torii, R.; Houlihan, C.; Epstein, R.; Rubin, J.; Tiwari, MK.; Lovat, LB. Use of portable air purifiers to reduce aerosols in hospital settings and cut down the clinical backlog. Epidemiol Infect 2023, 18, e21. [Google Scholar] [CrossRef]
- Ebrahimifakhar, A.; Poursadegh, M.; Hu, Y.; Yuill, D.P.; Luo, Y. A systematic review and meta-analysis of field studies of portable air cleaners: Performance, user behavior, and by-product emissions. Sci Total Environ 2024, 20, 168786. [Google Scholar] [CrossRef]
- Pasquarella, C.; Balocco, C.; Pasquariello, G.; Petrone, G.; Saccani, E.; Manotti, P.; Ugolotti, M.; Palla, F.; Maggi, O.; Albertini, R. A Multidisciplinary Approach to the Study of Cultural Heritage Environments: Experience at the Palatina Library in Parma. Sci Total Environ 2015, 536, 557–567. [Google Scholar] [CrossRef] [PubMed]
- Pasquarella, C.; Vitali, P.; Saccani, E.; Manotti, P.; Boccuni, C.; Ugolotti, M.; Signorelli, C.; Mariotti, F.; Sansebastiano, G.E.; Albertini, R. Microbial Air Monitoring in Operating Theatres: Experience at the University Hospital of Parma. J Hospital Infec 2012, 81, 50–57. [Google Scholar] [CrossRef]
- Pasquarella, C.; Saccani, E.; Sansebastiano, G.E.; Ugolotti, M.; Pasquariello, G.; Albertini, R. Proposal for a Biological Environmental Monitoring Approach to Be Used in Libraries and Archives. Ann Agric Environ Med 2012, 19, 209–212. [Google Scholar] [PubMed]
- Pasquarella, C.; Veronesi, L.; Napoli, C.; Castiglia, P.; Liguori, G.; Rizzetto, R.; Torre, I.; Righi, E.; Farruggia, P.; Tesauro, M.; Torregrossa, M.V.; Montagna, M.T.; Colucci, M.E.; Gallè, F.; Masia, M.D.; Strohmenger, L.; Bergomi, M.; Tinteri, C.; Panico, M.; Pennino, F.; Cannova, L.; Tanzi, M. SItI Working Group Hygiene in Dentistry. Microbial environmental contamination in Italian dental clinics: A multicenter study yielding recommendations for standardized sampling methods and threshold values. Sci Total Environ 2012, 420, 289–99. [Google Scholar] [CrossRef]
- Buters, J.; Prank, M.; Sofiev, M.; Pusch, G.; Albertini, R.; Annesi-Maesano, I.; Antunes, C.; Behrendt, H.; Berger, U.; Brandao, R.; Celenk, S.; Galan, C.; Grewling, Ł.; Jackowiak, B.; Kennedy, R.; Rantio-Lehtimäki, A.; Reese, G.; Sauliene, I.; Smith, M.; Thibaudon, M.; Weber, B.; Cecchi, L. Variation of the group 5 grass pollen allergen content of airborne pollen in relation to geographic location and time in season. J Allergy Clin Immunol 2015, 136, 87–95. [Google Scholar] [CrossRef] [PubMed]
- Viani, I.; Colucci, M.E.; Pergreffi, M.; Rossi, D.; Veronesi, L.; Bizzarro, A.; Capobianco, E.; Affanni, P.; Zoni, R.; Saccani, E.; et al. Passive Air Sampling: The Use of the Index of Microbial Air Contamination. Acta Biomedica 2020, 91, 92–105. [Google Scholar] [PubMed]
- Qian, J.; Peccia, J.; Ferro, A.R. Walking-Induced Particle Resuspension in Indoor Environments. Atmos Environ 2014, 89, 464–481. [Google Scholar] [CrossRef]
- McDonagh, A.; Byrne, M.A. The Influence of Human Physical Activity and Contaminated Clothing Type on Particle Resuspension. J Environ Radioact 2014, 127, 119–126. [Google Scholar] [CrossRef]
- Whyte, W.; Hejab, M. Particle and microbial airborne dispersion from people. Eur J Parent Pharm Sc 2007, 12, 39–46. [Google Scholar]
Figure 1.
Positioning points of air samplers (active sampling with  DUOSAS,
  MD8),
MD8),  Petri dishes (passive sampling) and “AEROK” in the studied room.
DUOSAS, MD8), Petri dishes (passive sampling) and “AEROK” in the studied room.
Figure 1.
Positioning points of air samplers (active sampling with DUOSAS, MD8), Petri dishes (passive sampling) and “AEROK” in the studied room.
DUOSAS, MD8), Petri dishes (passive sampling) and “AEROK” in the studied room.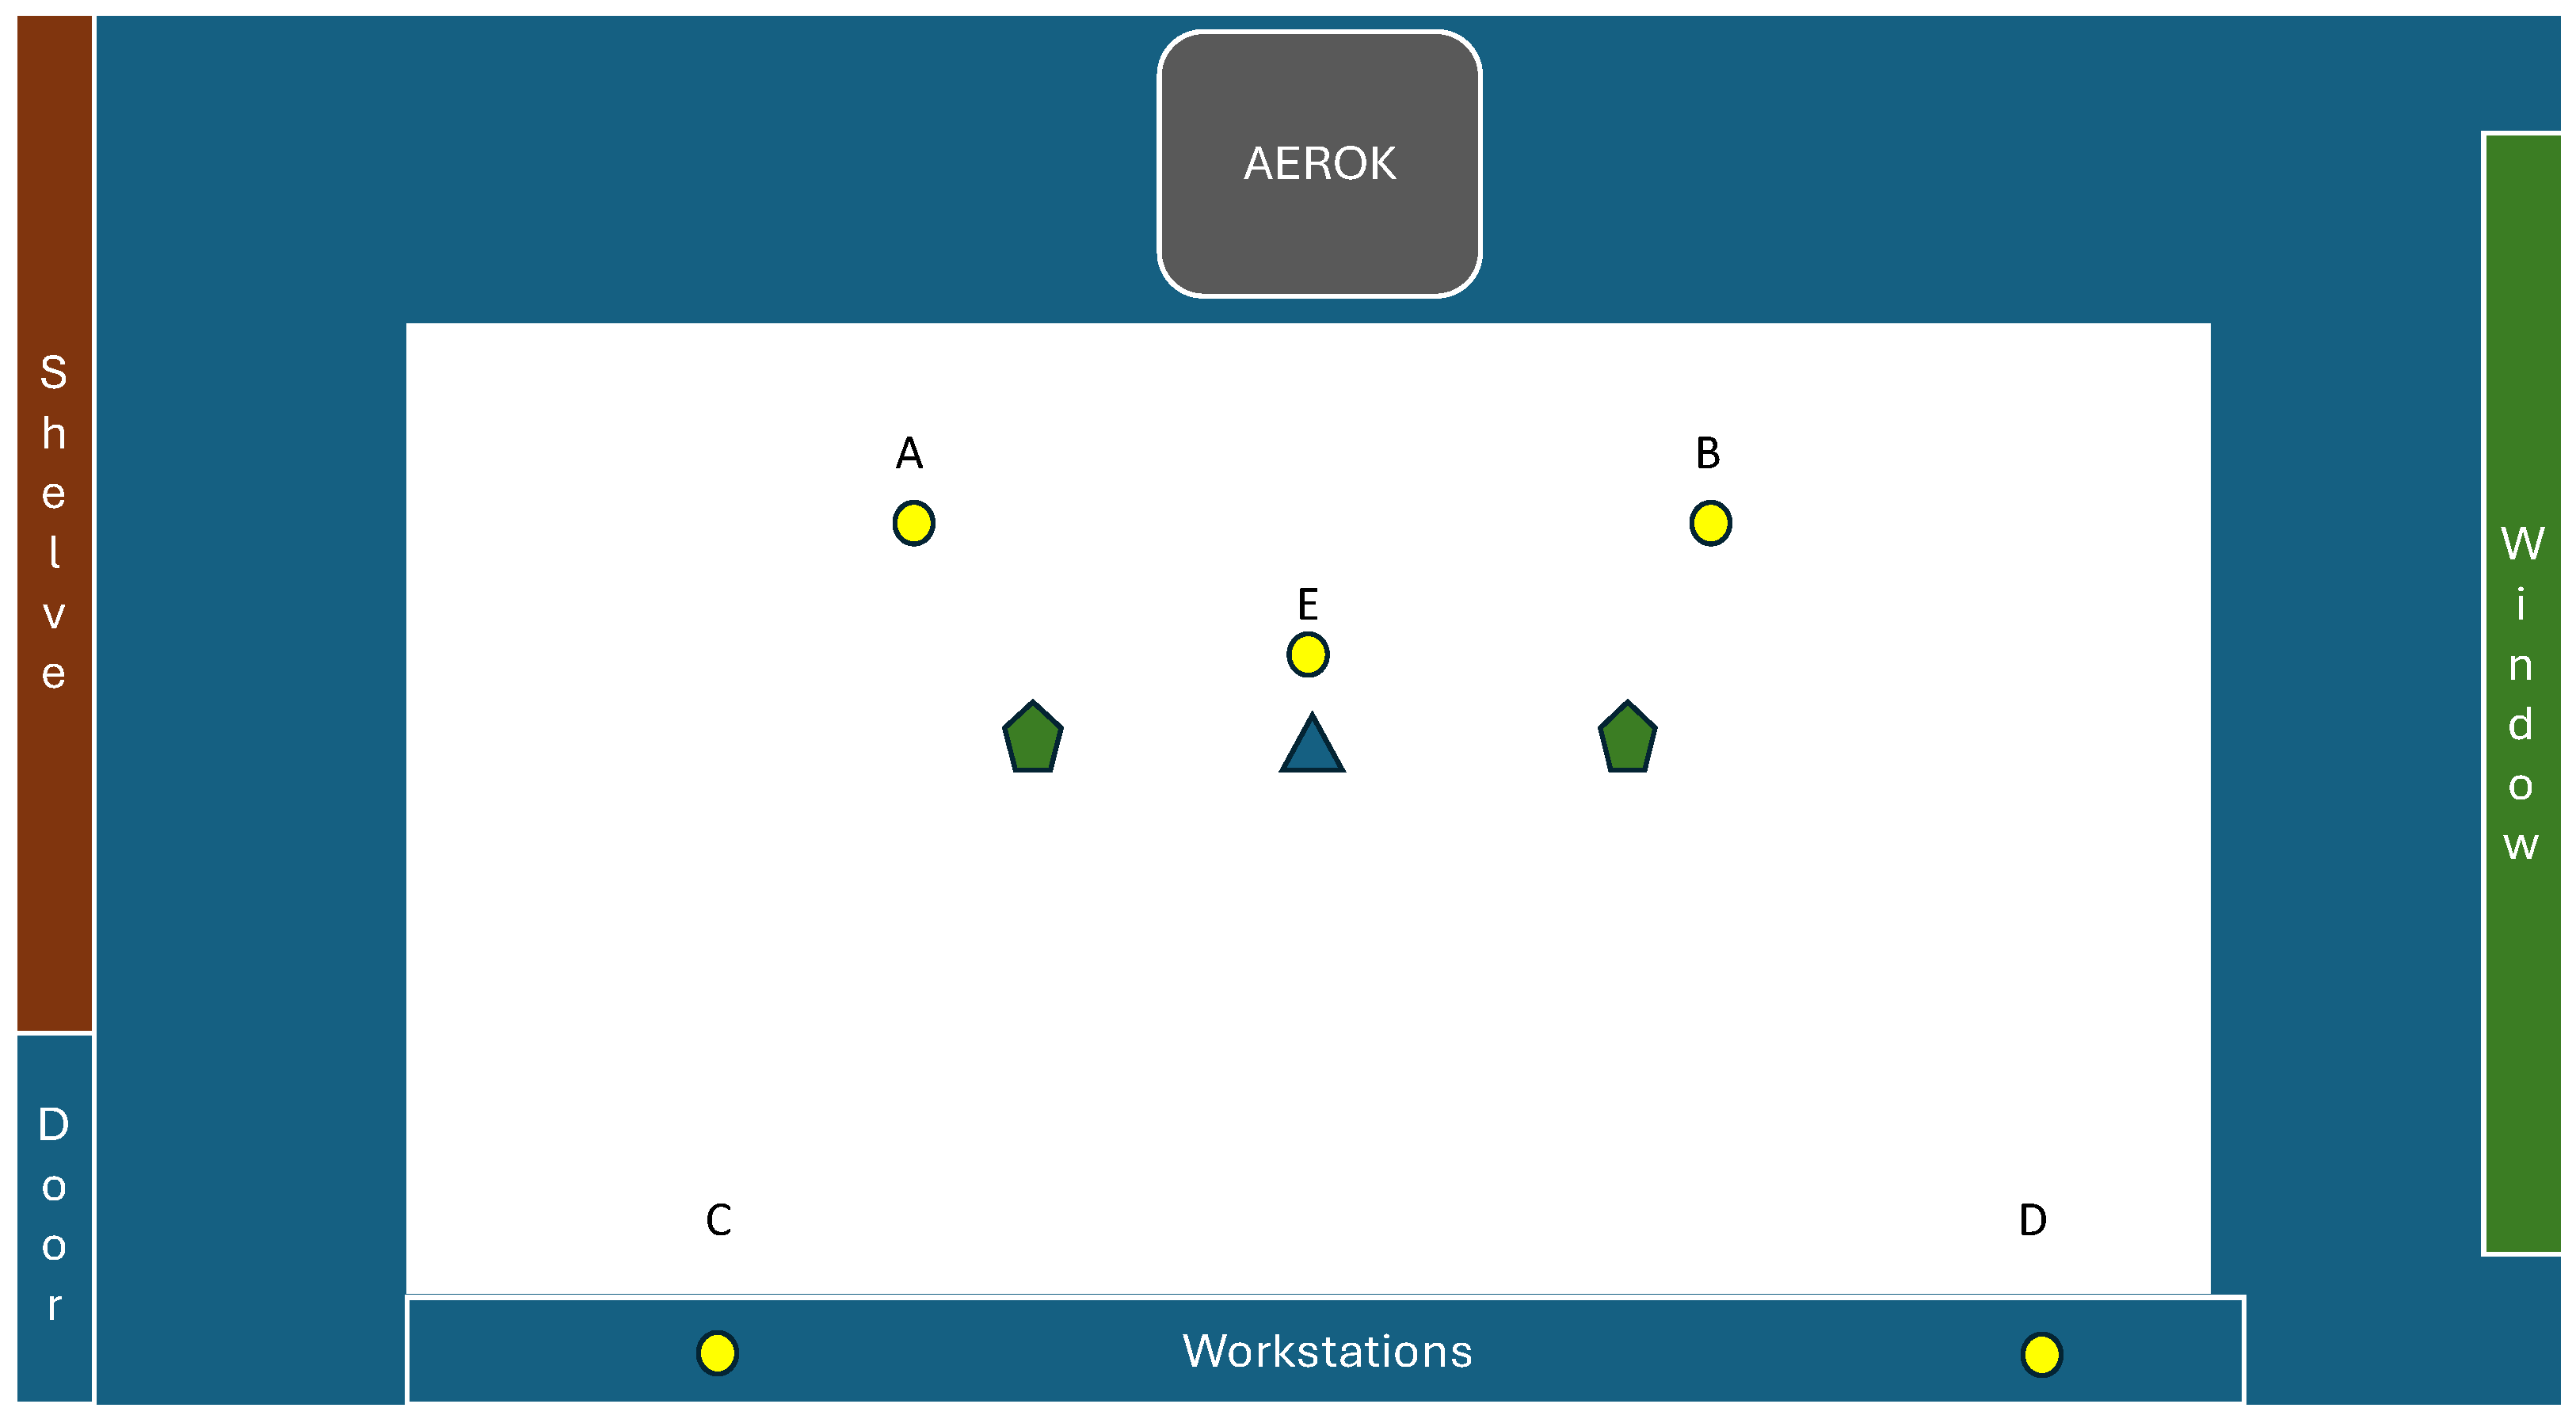
Figure 2.
Positioning of the particle counter ( ) and
pollen-trap (
) and
pollen-trap ( ) in the studied room.
) and
pollen-trap () in the studied room.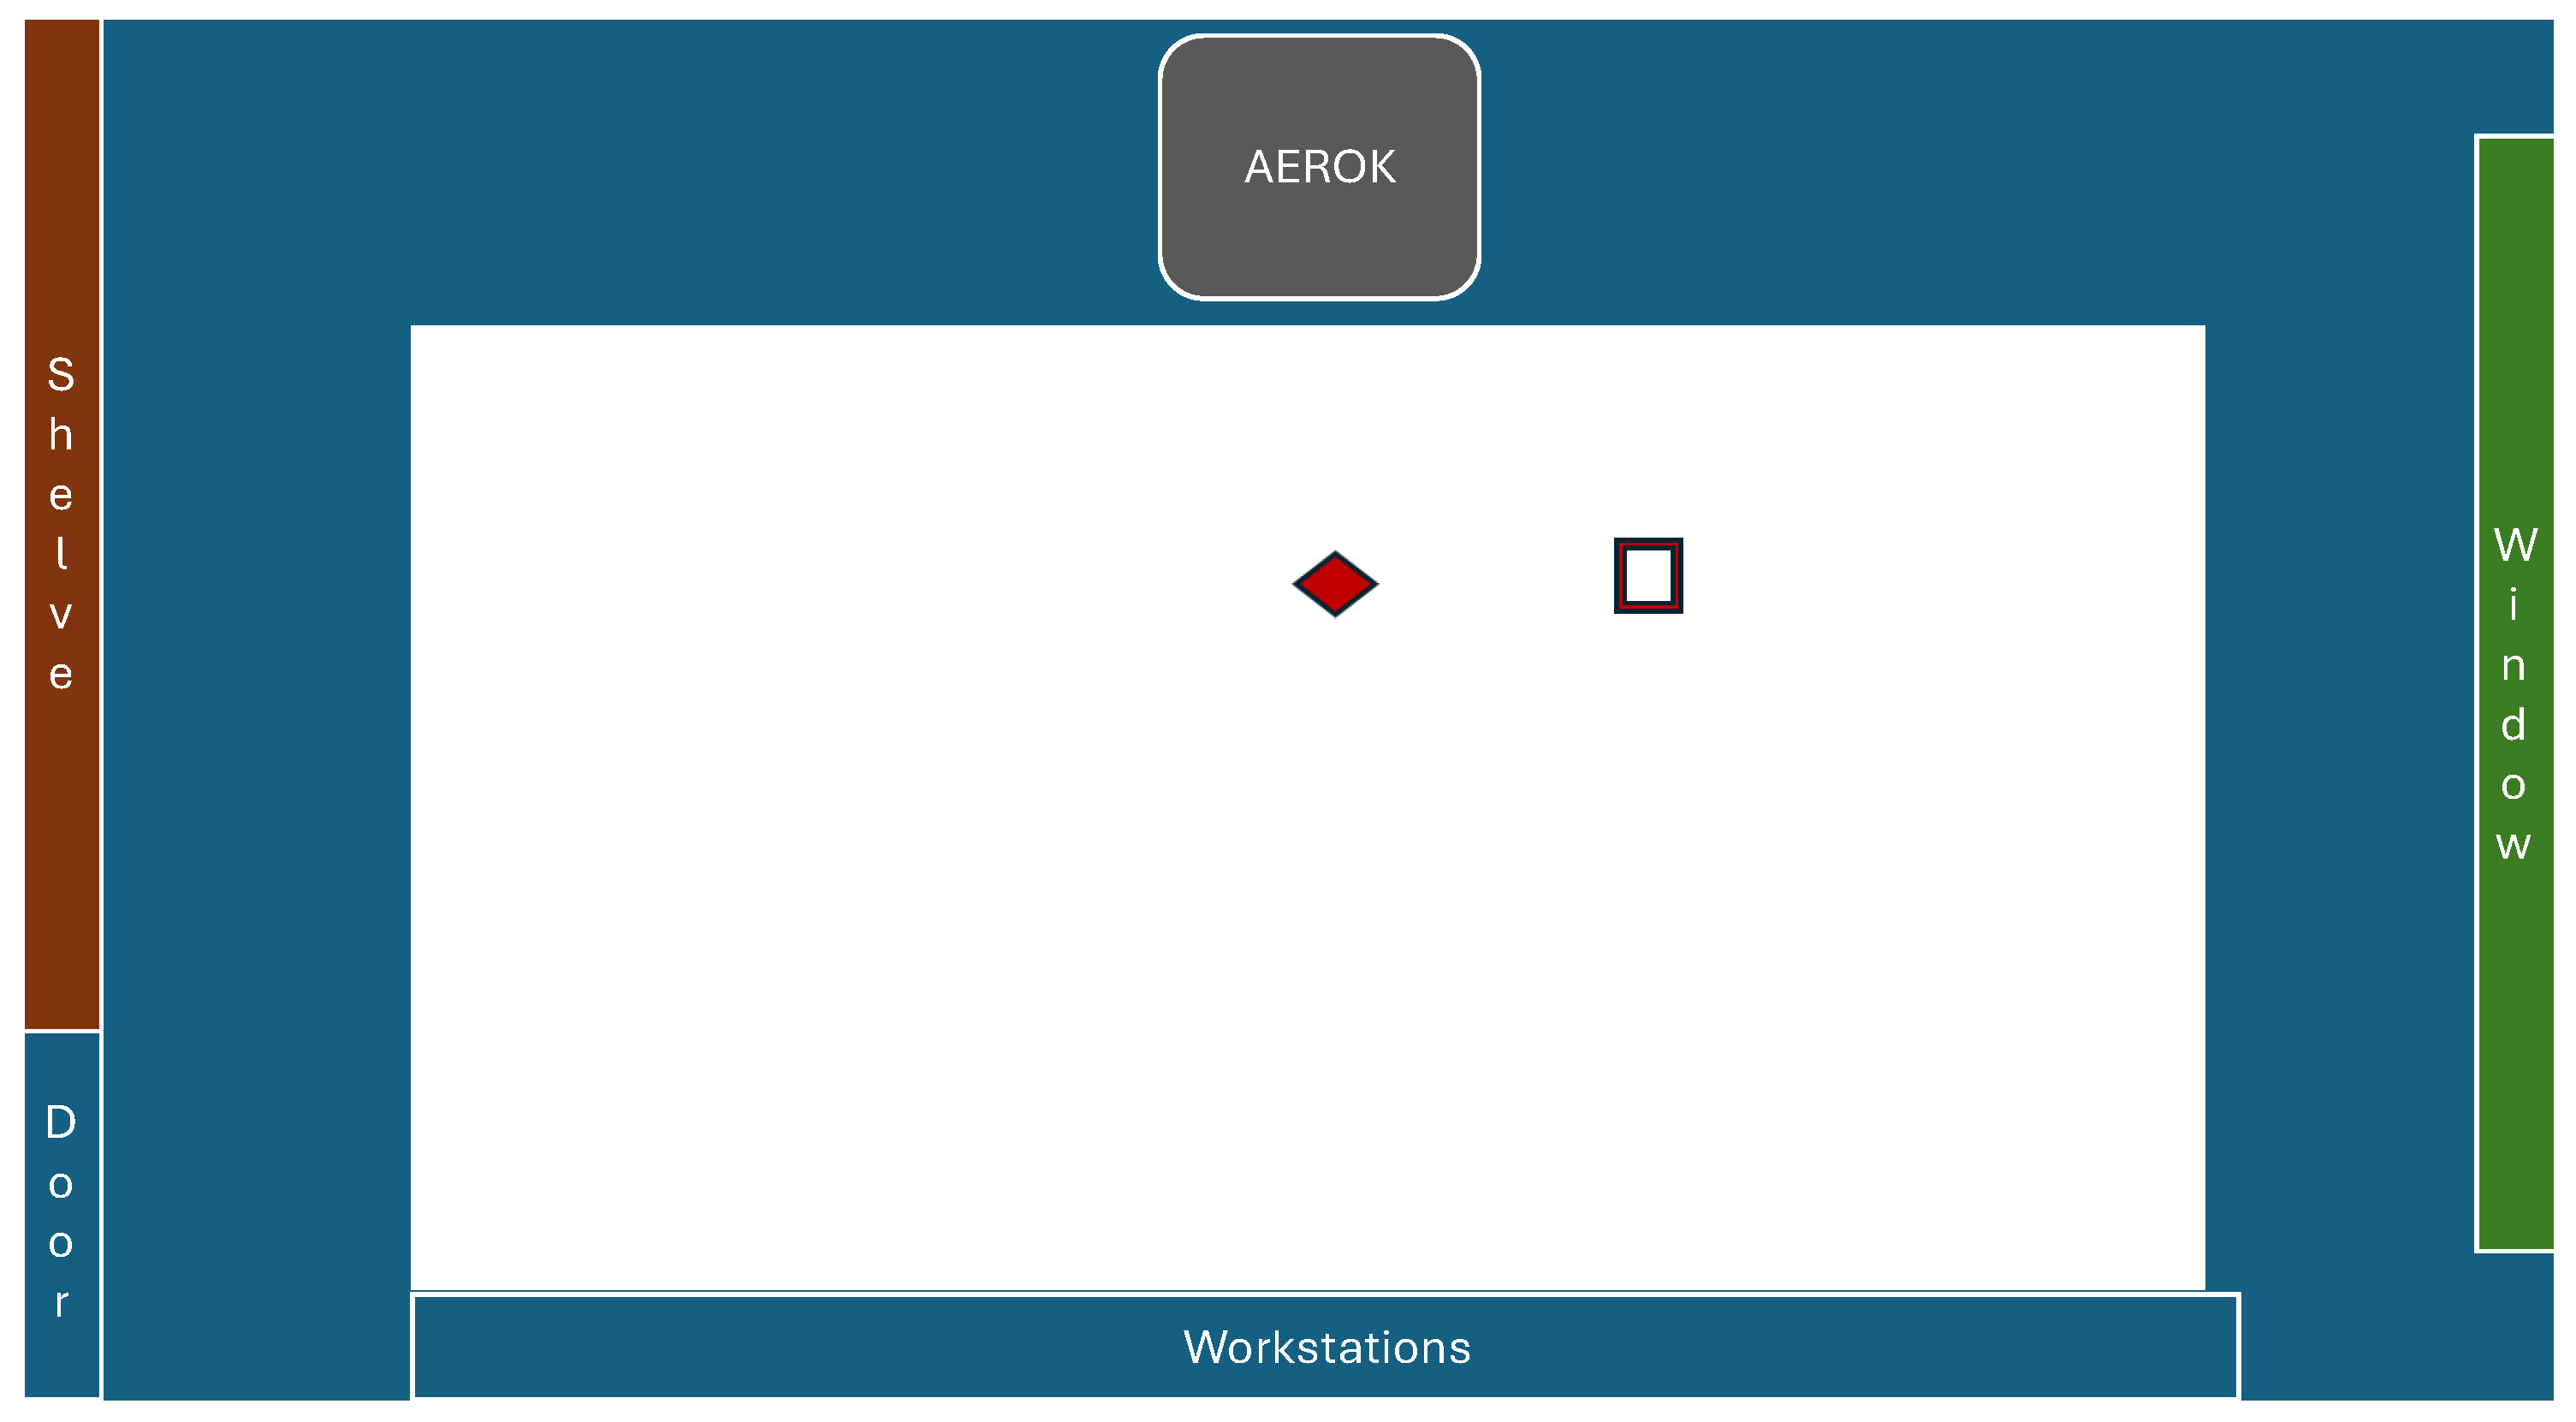
Figure 3.
Bacterial air contamination (cfu/m3) assessed by DUOSAS samplers.
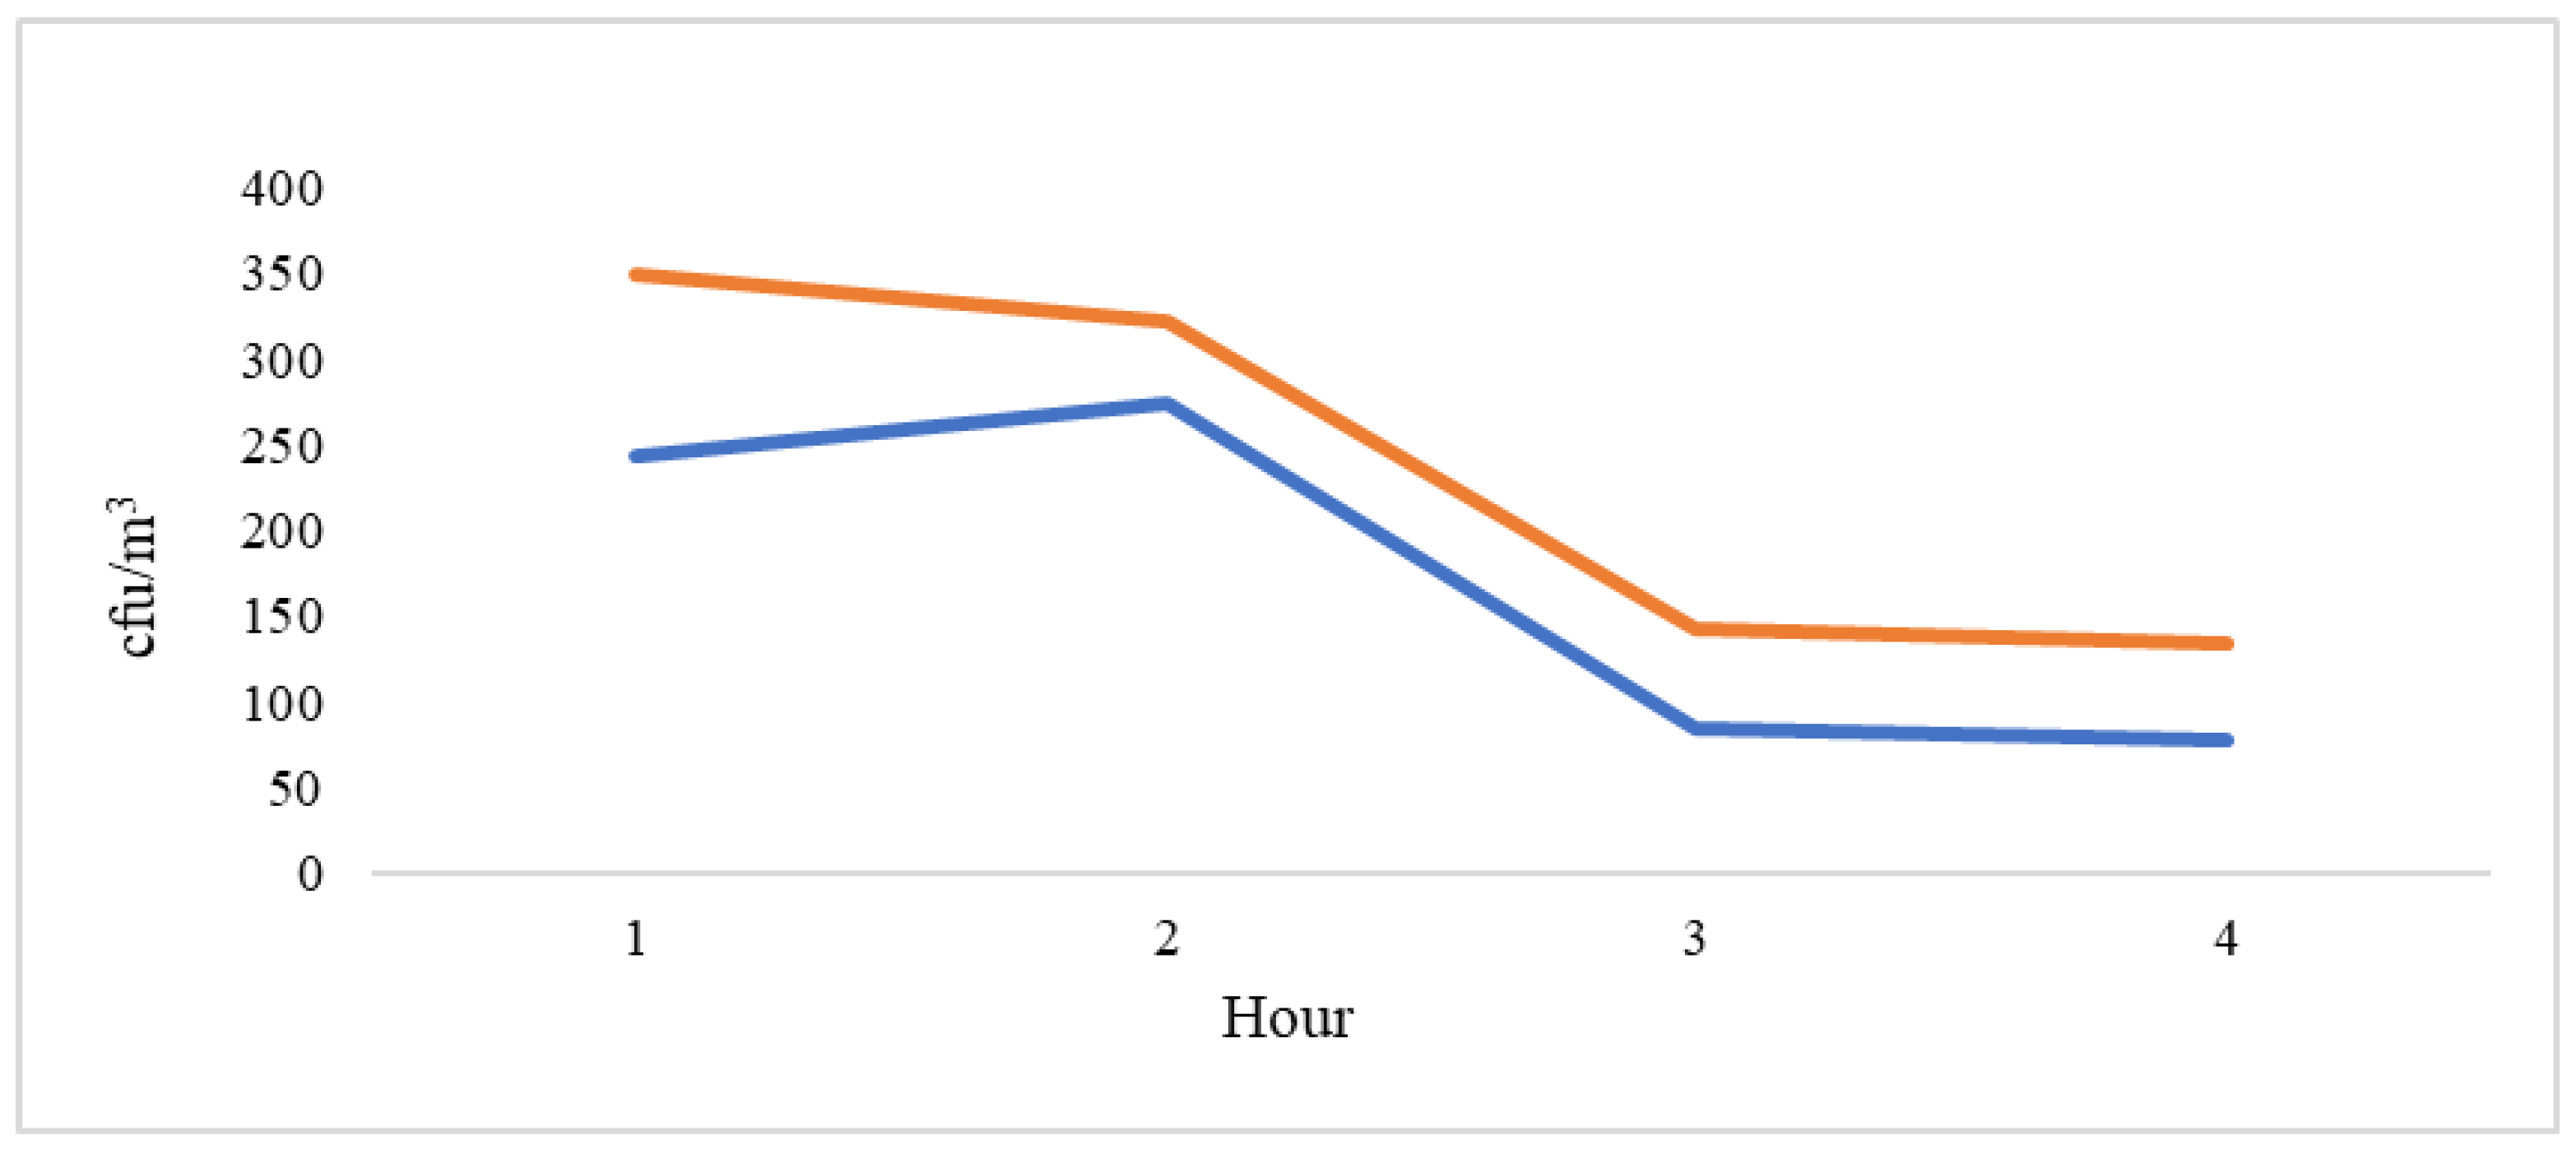
Figure 4.
Bacterial air contamination (IMA) at the point E.
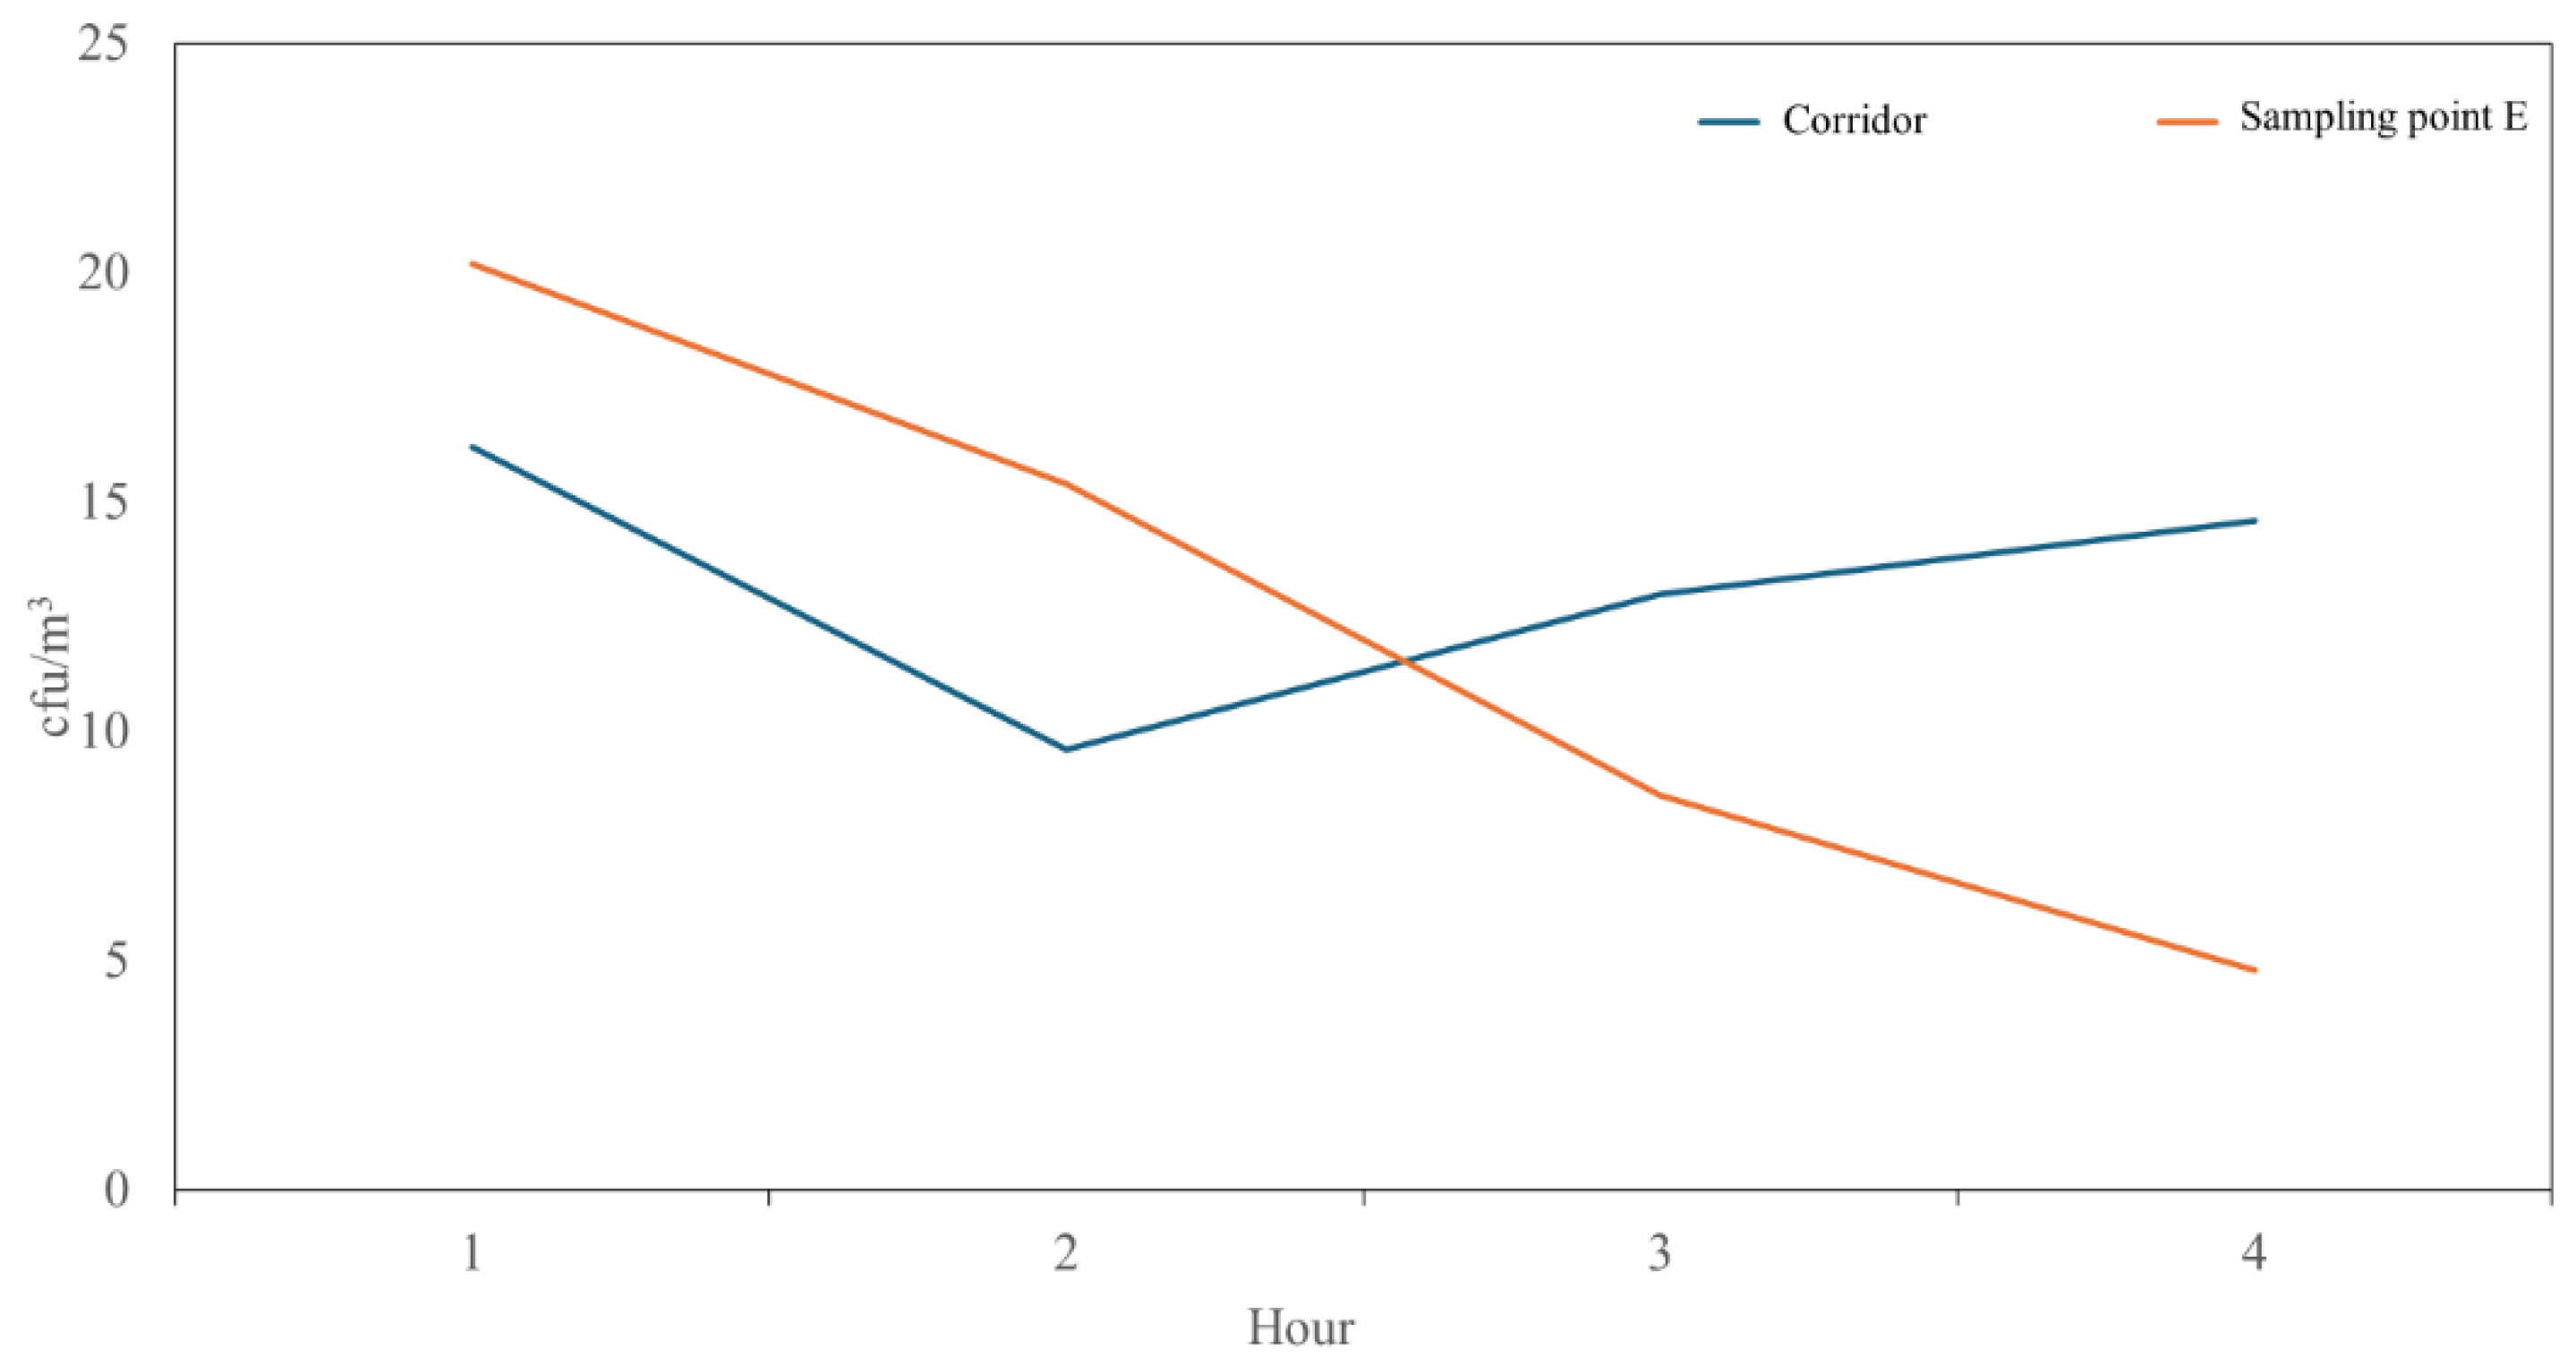
Figure 5.
Cfu/m3 mean values obtained by DUOSAS and MD8 and IMA values at point E.
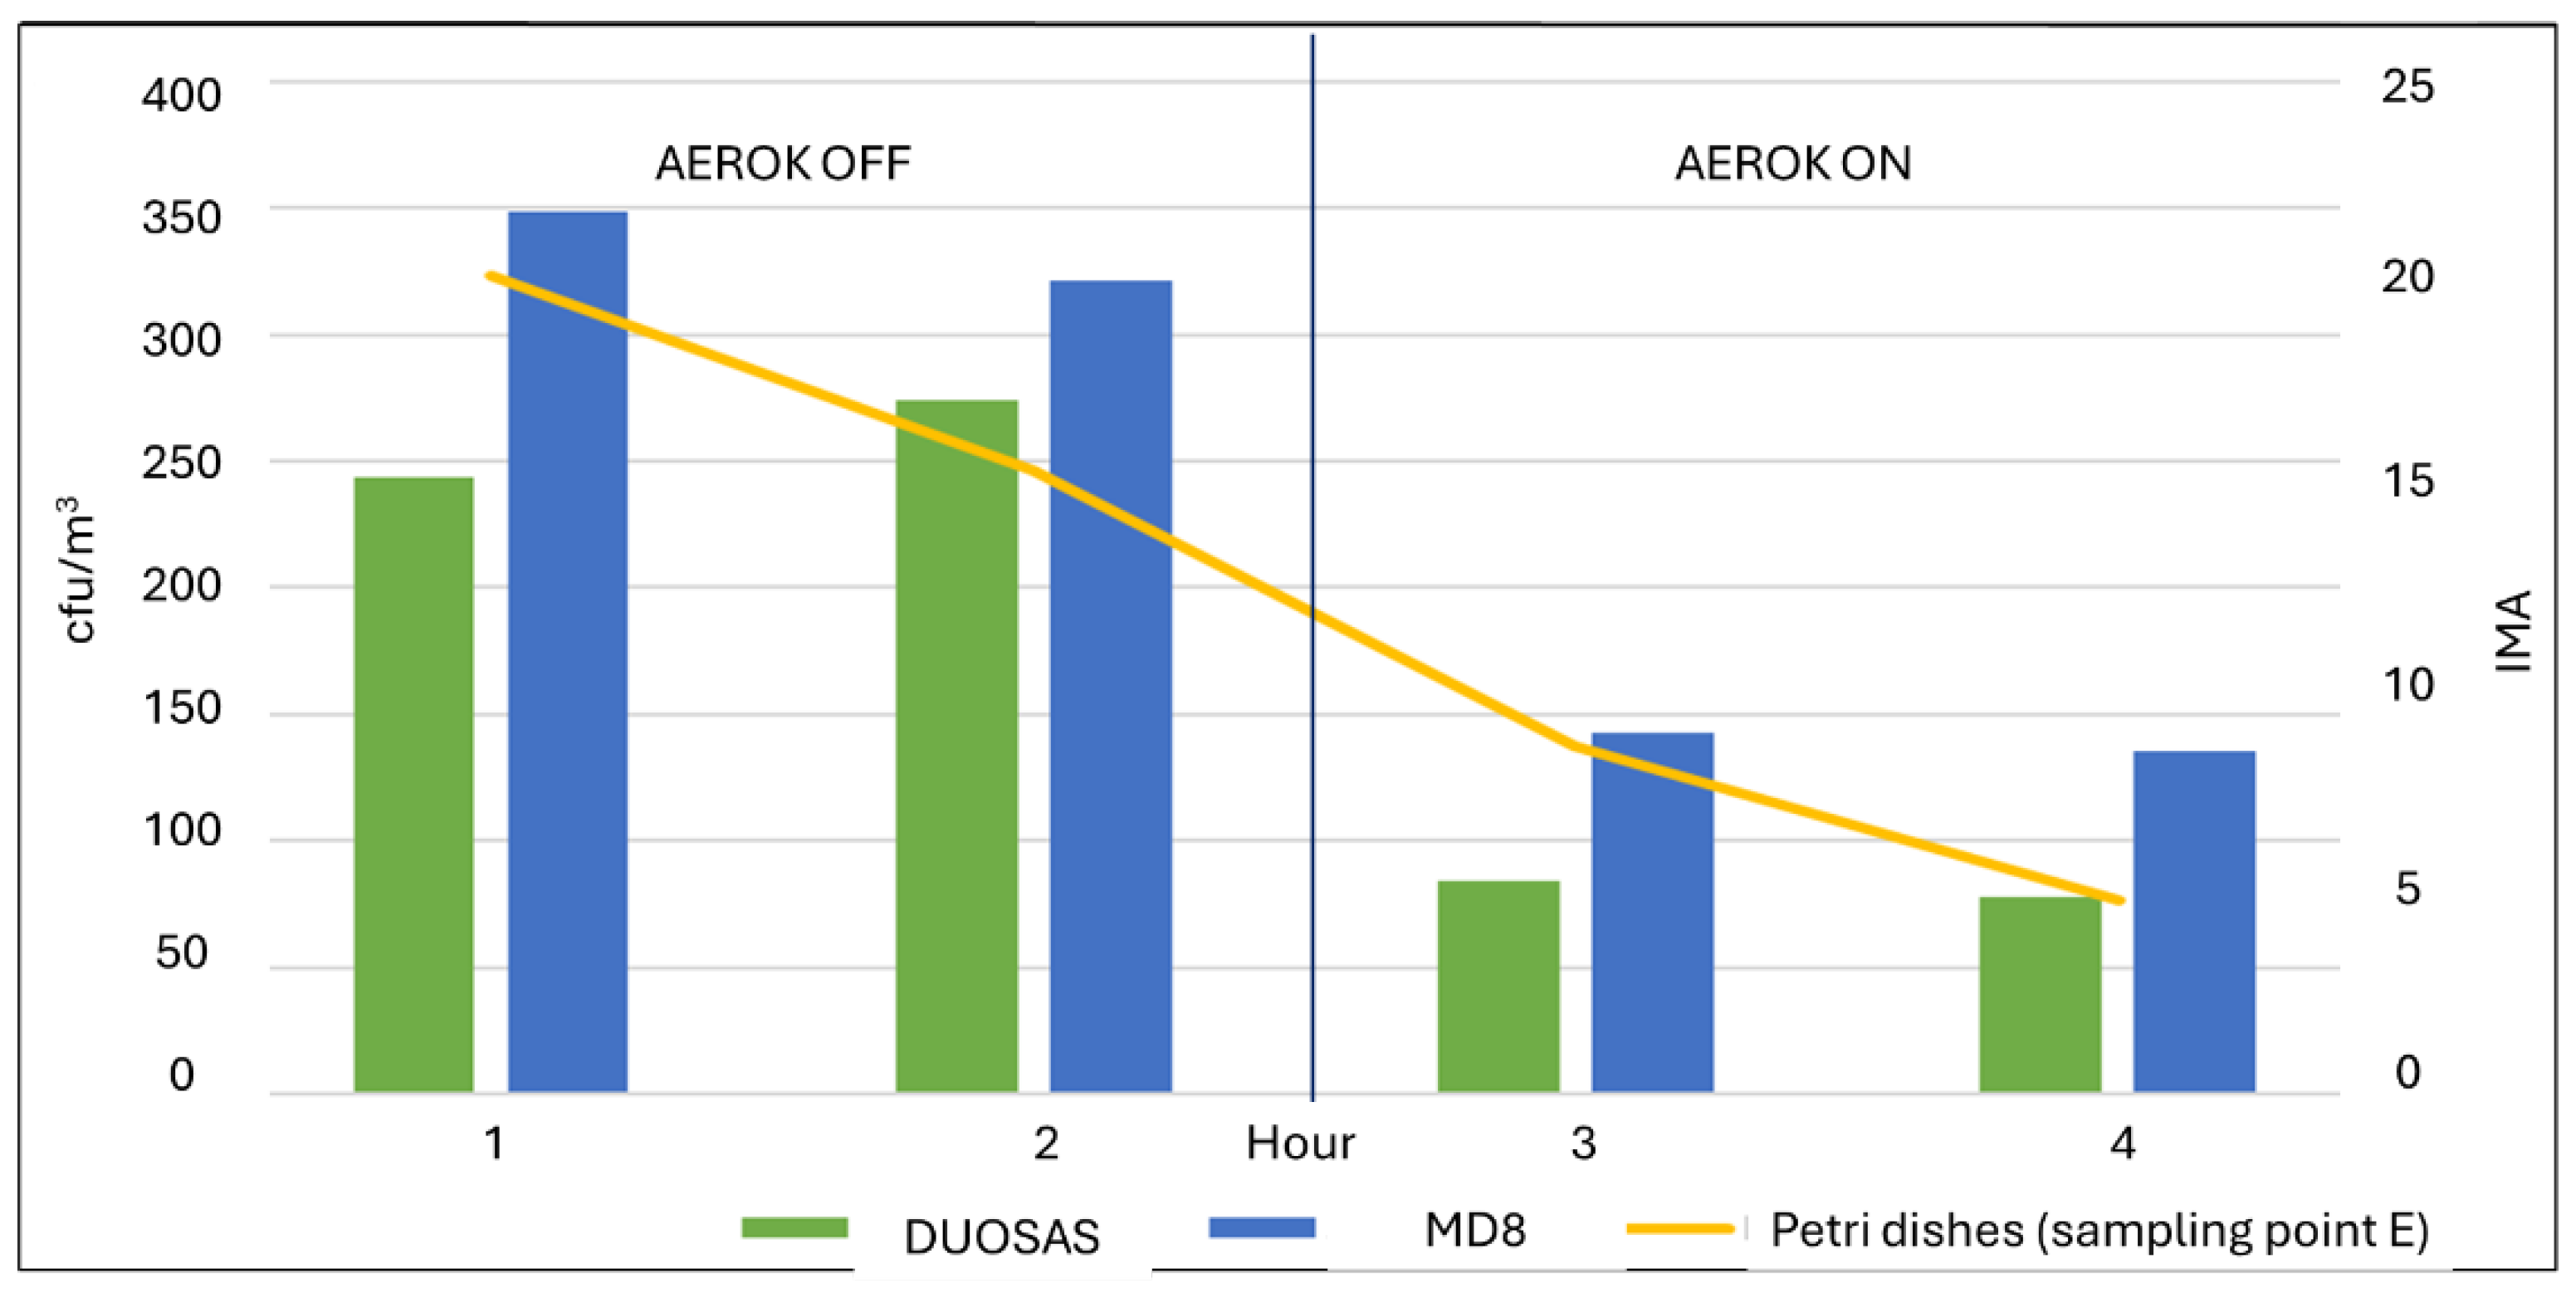
Figure 6.
IMA median values and interquartile range at the different sampling points and times.
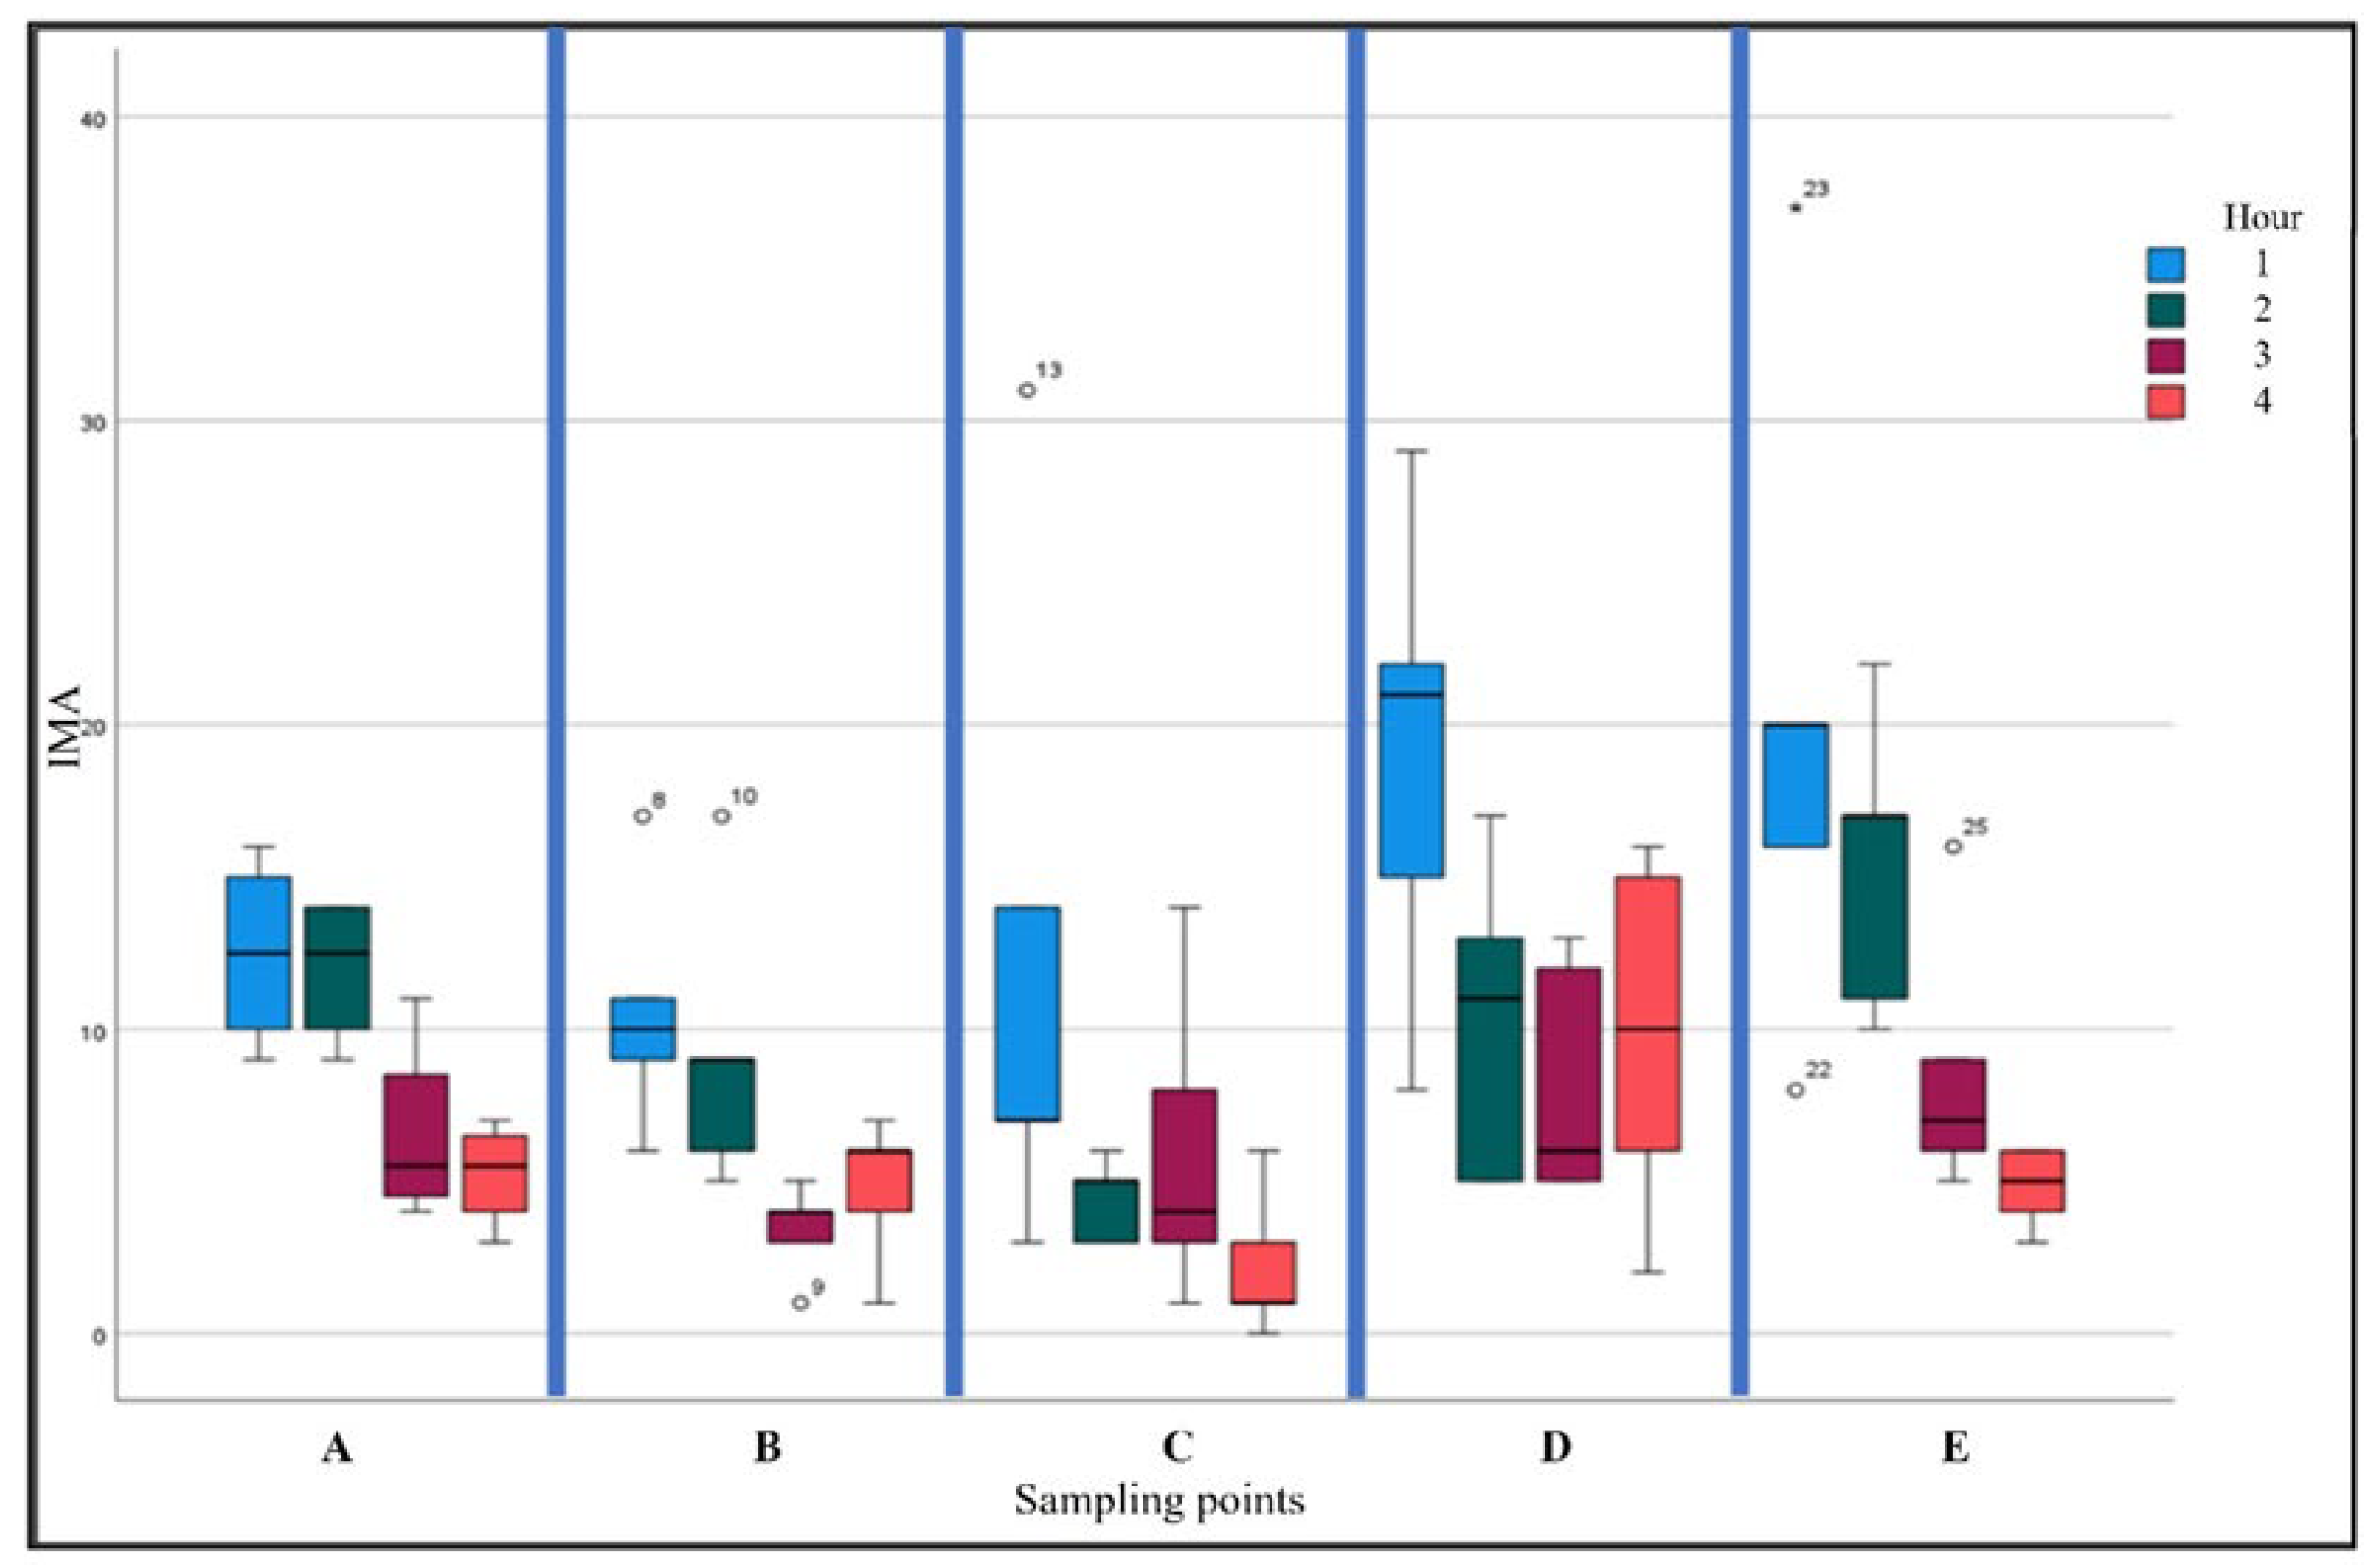
Figure 7.
Mean value of the weekly concentration ratio I/O of total pollen and fungal spores of Alternaria spp. with AEROK off and with AEROK on.
Figure 7.
Mean value of the weekly concentration ratio I/O of total pollen and fungal spores of Alternaria spp. with AEROK off and with AEROK on.
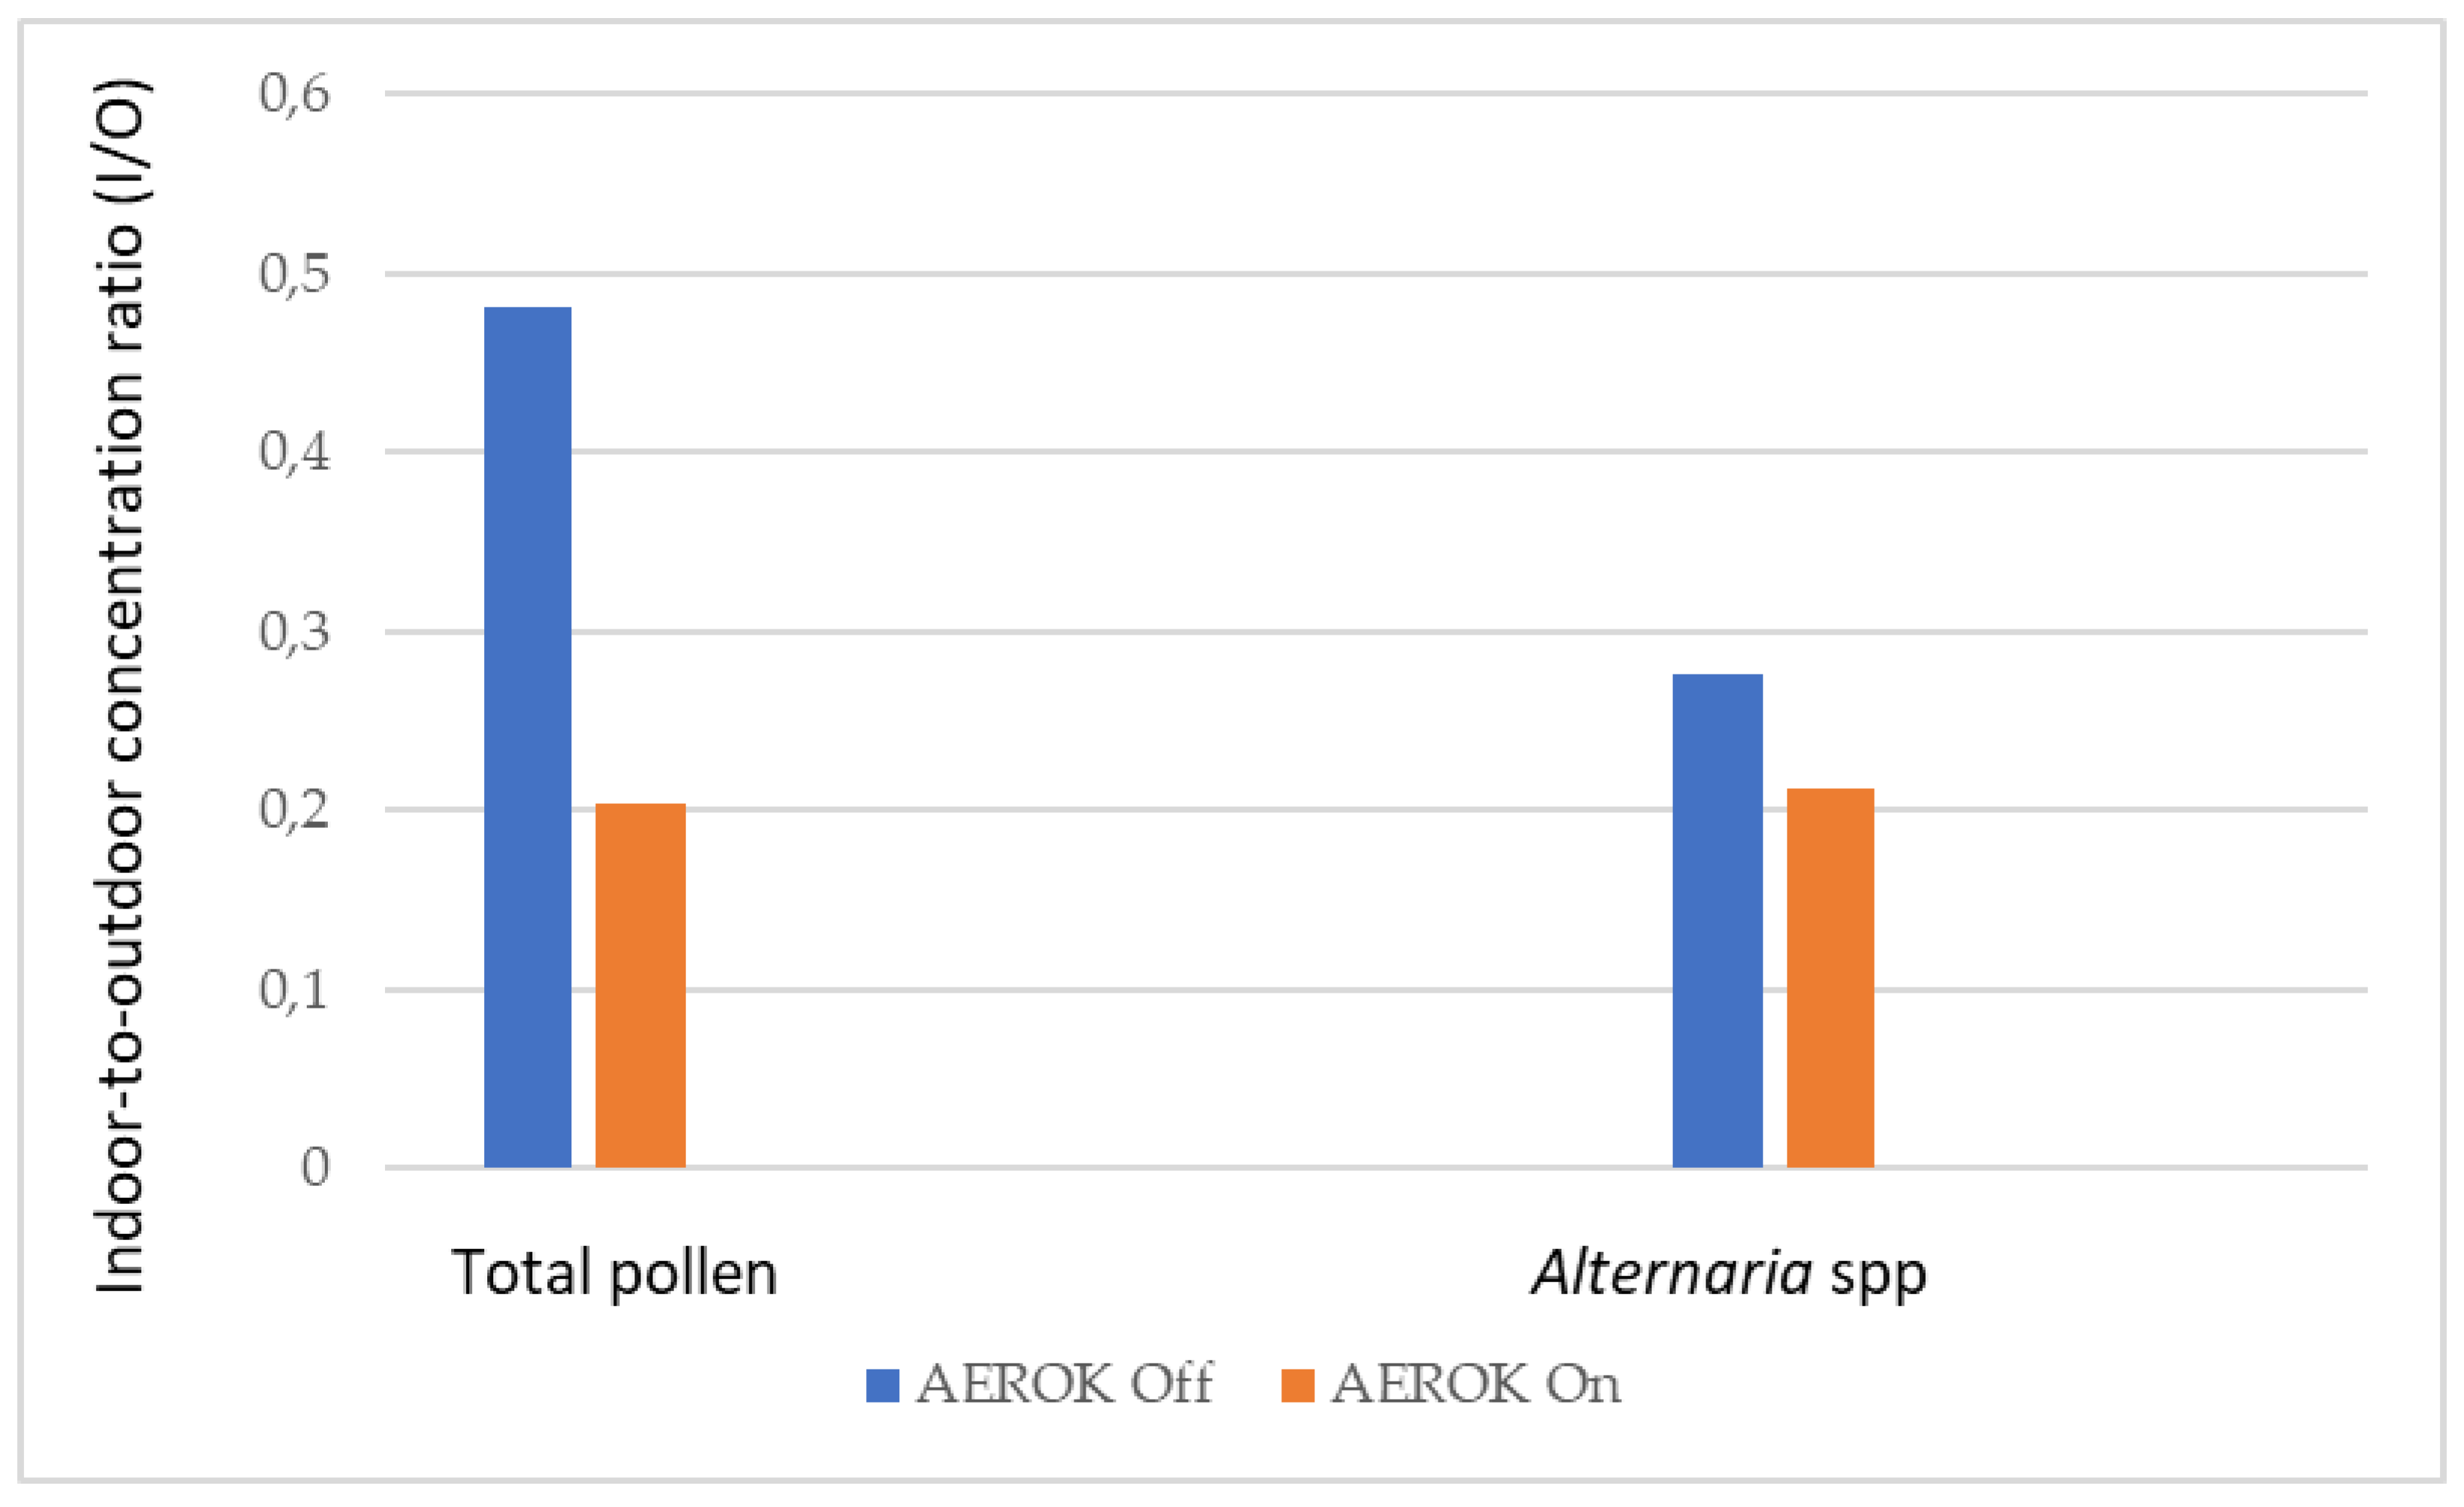

Table 1.
Bacterial air contamination (cfu/m3) assessed by DUOSAS samplers.
| Hour | Mean | Standard deviation | 95% Confidence interval | |
| Upper | Lower | |||
| 1 | 243.50 | 88.51 | 102.66 | 384.34 |
| 2 | 273.75 | 144.68 | 43.54 | 503.96 |
| 3 | 84.50 | 14.29 | 61,75 | 107.25 |
| 4 | 77.50 | 23.70 | 39.79 | 115.21 |
Table 2.
Bacterial air contamination (cfu/m3) assessed by MD8 sampler.
| Hour | Mean | Standard deviation | 95% Confidence interval | |
| Upper | Lower | |||
| 1 | 348.80 | 129.411 | 188.12 | 509.48 |
| 2 | 321.20 | 122.381 | 169.24 | 473.16 |
| 3 | 142.80 | 19.422 | 118.68 | 166.92 |
| 4 | 135.20 | 56.136 | 65.50 | 204.90 |
Table 3.
Bacterial air contamination (IMA) at the point E.
| Hour | Mean | Standard deviation |
95% Confidence interval | |
| Upper | Lower | |||
| 1 | 20.20 | 10.59 | 7.05 | 33.35 |
| 2 | 15.40 | 4.93 | 9.28 | 21.52 |
| 3 | 8.60 | 4.39 | 3.15 | 14.05 |
| 4 | 4.80 | 1.30 | 3.18 | 6.42 |
Table 4.
Bacterial air contamination (IMA) in the corridor.
| Hour | Mean | Standard deviation |
95% Confidence interval | |
| Upper | Lower | |||
| 1 | 16.20 | 9.88 | 3.93 | 28.47 |
| 2 | 9.60 | 4.67 | 3.80 | 15.40 |
| 3 | 13.00 | 6.04 | 3.50 | 20.50 |
| 4 | 14.60 | 3.85 | 9.82 | 19.38 |
Table 5.
Number of door openings over 5 days of microbial sampling.
| Hour | Mean | Standard deviation | Minimum | Maximum |
|---|---|---|---|---|
| 1 | 24.40 | 4.16 | 19 | 28 |
| 2 | 19.60 | 2.07 | 17 | 22 |
| 3 | 23.20 | 7.46 | 14 | 32 |
| 4 | 30.25 | 3.27 | 27 | 35 |
Table 6.
Maximum, minimum, mean, standard deviation of particles according to their size.
| AEROK |
Particle diameter (μm) ≥ |
Numbers of detections | Maximum | Minimum | Mean | St. deviation |
| Off | 0.5 | 200 | 3,805,710 | 2,892,967 | 3,285,666 | 234,369 |
| 1 | 691,139 | 195,696 | 512,461 | 133,723 | ||
| 2 | 265,530 | 61,854 | 139,215 | 35,317 | ||
| 5 | 36,282 | 550 | 2,687 | 5,622 | ||
| 10 | 19,450 | 0 | 496 | 1,887 | ||
| 25 | 570 | 0 | 18 | 70 | ||
| On | 0.5 | 200 | 5,430,398 | 431,967 | 2,076,980 | 859.814 |
| 1 | 1,574,021 | 108,754 | 480,738 | 243,308 | ||
| 2 | 595,518 | 31,621 | 130,090 | 87,937 | ||
| 5 | 39,166 | 170 | 1,860 | 5,284 | ||
| 10 | 10,852 | 0 | 343 | 1,371 | ||
| 25 | 750 | 0 | 16 | 78 |
Disclaimer/Publisher’s Note: The statements, opinions and data contained in all publications are solely those of the individual author(s) and contributor(s) and not of MDPI and/or the editor(s). MDPI and/or the editor(s) disclaim responsibility for any injury to people or property resulting from any ideas, methods, instructions or products referred to in the content. |
© 2024 by the authors. Licensee MDPI, Basel, Switzerland. This article is an open access article distributed under the terms and conditions of the Creative Commons Attribution (CC BY) license (http://creativecommons.org/licenses/by/4.0/).
Copyright: This open access article is published under a Creative Commons CC BY 4.0 license, which permit the free download, distribution, and reuse, provided that the author and preprint are cited in any reuse.


