Submitted:
12 August 2024
Posted:
12 August 2024
Read the latest preprint version here
Abstract
The purpose of this project is to explore the potential of Long Short-Term Memory (LSTM), a type of recurrent neural network (RNN), as a tool for making directional predictions for assets. The focus will be on using LSTM for classifying up/down moves in stock indices, stocks, and FX rates (EUR/USD). Various financial ratios, advanced technical indicators, and volatility estimators will be used as features to enhance the predictive power of the model. Incorporating credit spreads and news indicators can also improve the model. The advantage of LSTM is its ability to handle sequences of arbitrary length, which means that longer time frames such as 5-day, 10-day, or 1-week returns can be used for prediction. Before using RNNs, exploratory data analysis (EDA) will be performed to understand the underlying patterns in the data. This may include dimensionality reduction techniques such as autoencoding, self-organizing maps, or decision tree regression. The results of the EDA will be used to guide the selection of features for the LSTM model. It is important to note that long memory and stationarity are common characteristics of time series data, such as interest rates or economic indicators. Power-law autocorrection, Hurst exponent fractional, or Markov processes may be used to model these data. Predicting 5-day, 10-day returns for equities or 1-week, 1-month returns for financial factors presents two challenges. First, a large amount of data is required, typically 7–10 years of data. Second, positive autocorrelation in the 5-day or 10-day returns in equity time series must be isolated.
Keywords:
Deep Learning
; LSTM
; RNN
; EDA
; Financial Time Series Prediction
; Volatility Estimators
; Stock Indices
; FX Rates
; EUR
; USD
; Python
1. Introduction
Financial time series prediction is a crucial task in finance, as it can help investors make informed decisions and maximise their returns. The field of deep learning and its applications in finance has received increasing attention in recent years. Deep learning, a subset of machine learning, uses artificial neural networks with multiple hidden layers to model complex patterns and relationships in data [1]. Long Short-Term Memory (LSTM), a type of Recurrent Neural Network (RNN), has shown promising results for time series prediction tasks, such as stock market forecasting [2]. In finance, the goal of time series prediction is often to classify whether the price of an asset will increase or decrease [3]. By incorporating financial ratios, advanced technical indicators, and volatility estimators as features.
The focus of this project is to explore the potential of LSTM as a tool for making directional predictions for assets, including stock indices, stocks, and foreign exchange (FX) rates [4]. The aim is to classify up/down moves in these assets, and the model will be enhanced by incorporating various financial ratios, advanced technical indicators, and volatility estimators as features.
The literature review shows that LSTM has been widely used for time series prediction in finance and has also gained popularity due to its usefulness. The literature review further stressed that various financial ratios, advanced technical indicators, and volatility estimators have been used as features to enhance the predictive power of the LSTM model. Incorporating these features into the LSTM model can be challenging, and careful feature selection is required to ensure that the features are relevant and informative. This paper will use the literature as a guide to explore the potential of LSTM in financial time series prediction and will enhance the model by incorporating various financial ratios, advanced technical indicators, and volatility estimators as features.
The remainder of this paper is organized as follows. Section 2 provides the literature review of LSTM and its applications in financial time series prediction. Section 3 presents the methodology used to train and test the LSTM model. Section 4 outlines the Model evaluation and results. Section 5 discusses the visualization, and Section 6 presents the limitations of the LSTM model. Finally, Section 7 and Section 8 present the conclusions and recommendations for future work respectively.
2. Literature Review
Long Short-Term Memory (LSTM) is a type of recurrent neural network that has been widely used in the field of finance for time series prediction. LSTM networks are designed to handle sequences of arbitrary length, making them a suitable tool for making directional predictions for assets. The use of LSTM for time series prediction in finance has gained popularity due to its ability to capture long-term dependencies and overcome the limitations of traditional time series models such as ARIMA and GARCH. The advantage of using LSTM for financial time series prediction lies in its ability to handle sequential and correlated data. In financial time series, data can be correlated in many ways, such as with lagged values, moving averages, or previous events, and LSTM is capable of modelling these correlations effectively. In recent years, several studies have been conducted to explore the potential of LSTM for time series prediction in finance.
Various financial ratios, advanced technical indicators, and volatility estimators are commonly used as features to enhance the predictive power of the LSTM model. These features are important as they provide additional information about the financial time series and can improve the performance of the LSTM model. For example, financial ratios, such as the price-to-earnings (P/E) ratio, provide information about the valuation of a company and its future growth potential, while advanced technical indicators, such as moving averages, provide information about the trends in the stock price. Volatility estimators, such as historical or implied volatility, provide information about the uncertainty in the stock price and can help identify the risk associated with a stock.
A study by X. Li et al. (2021) [5] used LSTM to forecast changes in stock prices and evaluated how well it performed in comparison to traditional time series models. The outcomes demonstrated that LSTM performed better in terms of prediction accuracy than the traditional models when used to forecast changes in exchange rates. Another study by Z. Zhang et al. (2020) [6] discovered that LSTM outperformed traditional time series models in terms of both accuracy and computational efficiency. Wang et al. (2018) [7] used LSTM to predict FX rates while also adding technical indicators and news data as extra features. The outcomes demonstrated that the LSTM model performed better in terms of prediction accuracy than conventional time series models, such as ARIMA and GARCH.
Incorporating these features into the LSTM model can be challenging, as the financial ratios, advanced technical indicators, and volatility estimators are not always directly related to the target variable. It is important to carefully select the features to ensure that they are relevant and informative. A common approach is to use feature selection techniques, such as principal component analysis (PCA) or mutual information, to identify the most important features. Exploratory data analysis (EDA) can also play a critical role in guiding the selection of features for the LSTM model. In a study by [6], various dimensionality reduction techniques, such as autoencoding and self-organizing maps, were used in combination with LSTM for stock price prediction. The results showed that the EDA results can provide valuable insight into the underlying patterns in the data and inform the selection of relevant features for the LSTM model. In a study by [8], LSTM was used to predict stock price movements, using various financial ratios, technical indicators, and volatility estimators as features. The results indicated that the LSTM model incorporating these additional features outperformed a baseline LSTM model and traditional time series models.
Ultimately, LSTM has shown potential as a tool for financial time series prediction. Incorporating advanced technical indicators and volatility estimators, as well as performing EDA, can further enhance the predictive power of the LSTM model. However, financial time series prediction presents challenges, including the need for a large amount of data and the isolation of positive autocorrelation. Further research is needed to overcome these challenges and improve the accuracy of LSTM in financial time series prediction.
3. Methodology
3.1. Dataset and Features
In this project, we will be using Python and machine learning algorithms to perform time series analysis and forecasting on the stock prices of the NASDAQ 100 Index (NDX), (EUR/USD) FX rate and Amazon stock (AMZN). Here is the link to our online repository: https://github.com/fabulouskorex/Capstone-Project/blob/fabulous-korex/Deep_Learning_in_Finance.ipynb
3.2. Feature Characterization
Multiple technical indicators are integrated with the past moving averages of price in order to predict the direction of LSTM. These moving averages include both simple and exponentially weighted ones, such as SMA and MA, which decay over time. Several technical indicators, such as RSI, Stochastic K, MACD, CCI, ATR, Acc/Dist, and Bollinger Bands, have been found to be successful predictors. Here’s a brief overview of each indicator.
3.2.1. Simple Moving Average (SMA)
Simple Moving Average (SMA) is a statistical method used in finance, technical analysis and engineering to calculate the average value of a given set of data points over a specified period of time. SMA is calculated by summing up the closing price of a security over a certain number of time periods and then dividing the sum by the number of periods. It is used to smooth out fluctuations in the price data and identify trends in the market. According to an article by [10], “SMA is a lagging indicator because it is based on past prices.”
The formula for calculating the Simple Moving Average (SMA) is given below:
Where:
Pk = Price of an asset over a period k
k = Total number of periods over which the average is calculated.
3.2.2. Exponential Moving Average (EMA)
Exponential Moving Average (EMA) is a type of moving average that assigns more weight to recent prices and less weight to older prices in the calculation of the average [11]. The purpose of using EMA is to give more importance to the most recent prices, as it is believed that these prices are more relevant for forecasting future prices. EMA is a lagging indicator because it uses past prices to calculate current prices.
The formula for Exponential Moving Average (EMA) is as follows:
Where:
C: the closing price of the current period
EMA(previous): the EMA value from the previous period
k: the number of periods used in the EMA calculation
3.2.3. Moving Average Convergence Divergence (MACD)
Moving Average Convergence Divergence (MACD) is a popular technical indicator used in stock trading and analysis. It is a trend-following momentum indicator that shows the relationship between two moving averages of an asset’s price. The MACD is calculated by subtracting the 26-day exponential moving average (EMA) from the 12-day EMA. The resulting difference is then plotted against a signal line, which is a 9-day EMA of the MACD. A histogram is also produced to visually represent the difference between the MACD and the signal line. The MACD is used to identify changes in momentum, and trends to generate buy and sell signals. When the MACD line crosses above the signal line, it is often interpreted as a bullish signal, indicating that the price of the asset is likely to rise. Conversely, when the MACD line crosses below the signal line, it is considered a bearish signal, indicating that the price of the asset is likely to fall. Additionally, the MACD histogram can be used to identify divergences, where the price of an asset is moving in a different direction from the MACD line. One advantage of the MACD is that it incorporates both trend-following and momentum-based elements, making it a useful tool for traders who are looking to make buy and sell decisions based on both price trends and momentum.
3.2.4. Lagged Momentum
Momentum refers to the rate at which the price of an asset changes over a specific period of time. It is commonly used in technical analysis to evaluate the strength of an asset’s price trend. Momentum can be measured in various ways, such as the difference between the current price and the price x periods ago, or by calculating the percentage change over a specific time period. Momentum can also be used to help traders make decisions about whether to buy or sell an asset, as an asset with positive momentum is likely to continue to rise, while an asset with negative momentum is likely to decline. Lagged momentum refers to a calculation of momentum that is shifted forward in time. For example, if a trader calculates momentum using a 10-day moving average, lagged momentum would be calculated using the same method but with a delay of 10 days. This allows traders to evaluate how momentum has changed over time, which can help to identify trends that might not be apparent when using only current momentum data.
3.2.5. Bollinger Bands
This is a popular technical analysis tool that provides a visualization of a stock’s volatility and price trends [12]. The Bollinger Bands consist of three lines plotted on a price chart: a simple moving average (SMA) line in the middle, and two standard deviation lines above and below the SMA line. The upper and lower bands are used to provide an estimate of price volatility, with the upper band indicating the stock’s high volatility, and the lower band indicating its low volatility. This can help traders to understand when a stock is overbought or oversold and make informed trading decisions based on that information. The theory behind Bollinger Bands is that prices tend to remain within the upper and lower bands, and that periods of high volatility are indicated by price breaking out of the bands [13]. In this context, Bollinger Bands can be used to generate buy and sell signals, to provide an estimate of a stock’s volatility, and to help traders and investors make informed decisions. It is important to note that Bollinger Bands are not a standalone indicator and should be used in conjunction with other technical analysis tools to confirm trends and make informed trading decisions. There is also some debate among traders and investors about the appropriate way to interpret Bollinger Bands and how they should be used in trading strategies. Despite these challenges, Bollinger Bands remain a widely-used tool in the technical analysis of stock prices.
3.2.6. Relative Strength Index (RSI)
Relative Strength Index (RSI) is a popular momentum oscillator used to measure the strength of price movements [16]. The RSI is calculated using the average gains and losses over a set period of time, typically 14 periods, and ranges between 0 and 100 [15]. If the RSI is above 50, it indicates that the asset is in an uptrend, while if it’s below 50, it suggests the asset is in a downtrend [14]. A value of 70 or above is typically considered overbought, while a value of 30 or below is considered oversold [16]. RSI is used by traders to make decisions on entering or exiting trades, as well as identifying potential trend reversals [15].
3.2.7. Stochastic K
Stochastic K is a technical indicator that uses the closing price of an asset relative to its price range over a set period of time to generate buy or sell signals. The stochastic oscillator ranges between 0 and 100 and is calculated using the lowest low and the highest high of the asset over the set period of time. A value above 80 indicates the asset is overbought and a value below 20 indicates the asset is oversold. Stochastic K is often used in combination with its moving average, the Stochastic D, to generate buy and sell signals.
3.2.8. Commodity Channel Index (CCI)
Commodity Channel Index (CCI) - The CCI is a momentum oscillator that measures the current price level relative to an average price level over a given period of time. It was developed by Donald Lambert to identify cyclical turns in commodities, but it is also used in stocks and indices analysis. The CCI ranges from +100 to -100 and readings above +100 suggest that the security is overbought, while readings below -100 suggest it is oversold.
3.2.9. Average True Range (ATR)
The ATR is a volatility indicator that measures the average range of an asset’s price over a given period. It provides information on how much an asset’s price is moving, independent of direction. The ATR is used to identify market volatility and to help traders set appropriate stop-loss and profit-taking levels.
The formula for ATR is as follows:
Where:
TRn = True Range for the nth period
n = the number of periods used in the calculation.
3.2.10. Accumulation/Distribution (Acc/Dist)
The Acc/Dist indicator is used to evaluate a security’s supply and demand by determining if buyers or sellers are controlling the market. The Acc/Dist indicator is based on the close, high, and low prices of each period and can be used as a leading indicator to predict future price movement.
3.2.11. Volume Weighted Average Price (VWAP)
The VWAP is a popular trading benchmark that is calculated by adding up the money traded for each transaction and dividing it by the total shares traded over a given period. The VWAP is used as a reference point to assess the performance of a security relative to its average price.
3.2.12. Lagged Returns
Returns are the change in price of an asset over a specified period, expressed as a percentage. Lagged returns refer to past returns that are shifted forward or backwards in time. Lagged returns are commonly used in technical analysis to predict future price movements based on historical patterns.
The YZ Estimator, also known as drift-independent volatility estimation, is a statistical method for calculating volatility that uses four different prices: high, low, open, and close prices. The aim of this method is to provide a drift-independent measurement of volatility, meaning that it is not affected by changes in the mean of the underlying price process. This is achieved by taking into account the difference between the high and low prices of the asset, as well as its opening and closing prices, rather than just the closing price alone. The YZ Estimator has been widely used in financial markets, particularly in risk management and options pricing, as an alternative to traditional volatility estimators such as the historical volatility or the GARCH model.
3.3. Feature Engineering
This is a crucial step in machine learning or statistical modelling, which involves converting raw data into features that can be utilized to develop a predictive model. On the other hand, feature selection refers to the process of picking out essential independent features, those that are highly correlated to the dependent feature, to construct a robust model. The final selection of the features involves the application of various methods that aid in identifying the most relevant features for a particular dataset and model type, thus contributing to better model performance. We are going to discuss below some of these methods that are used for final selection features.
3.3.1. Correlation matrix with Heatmap
A heatmap is a visual depiction of 2D (two-dimensional) data, where each data value is presented in a matrix format. To generate a heatmap, begin by plotting a pair plot that showcases the relationship between independent and dependent features. This will provide insights into the correlations and dependencies between the two types of features.
FigurePl 1.
Correlation Matrix for Nasdaq-100 Index (NDX).
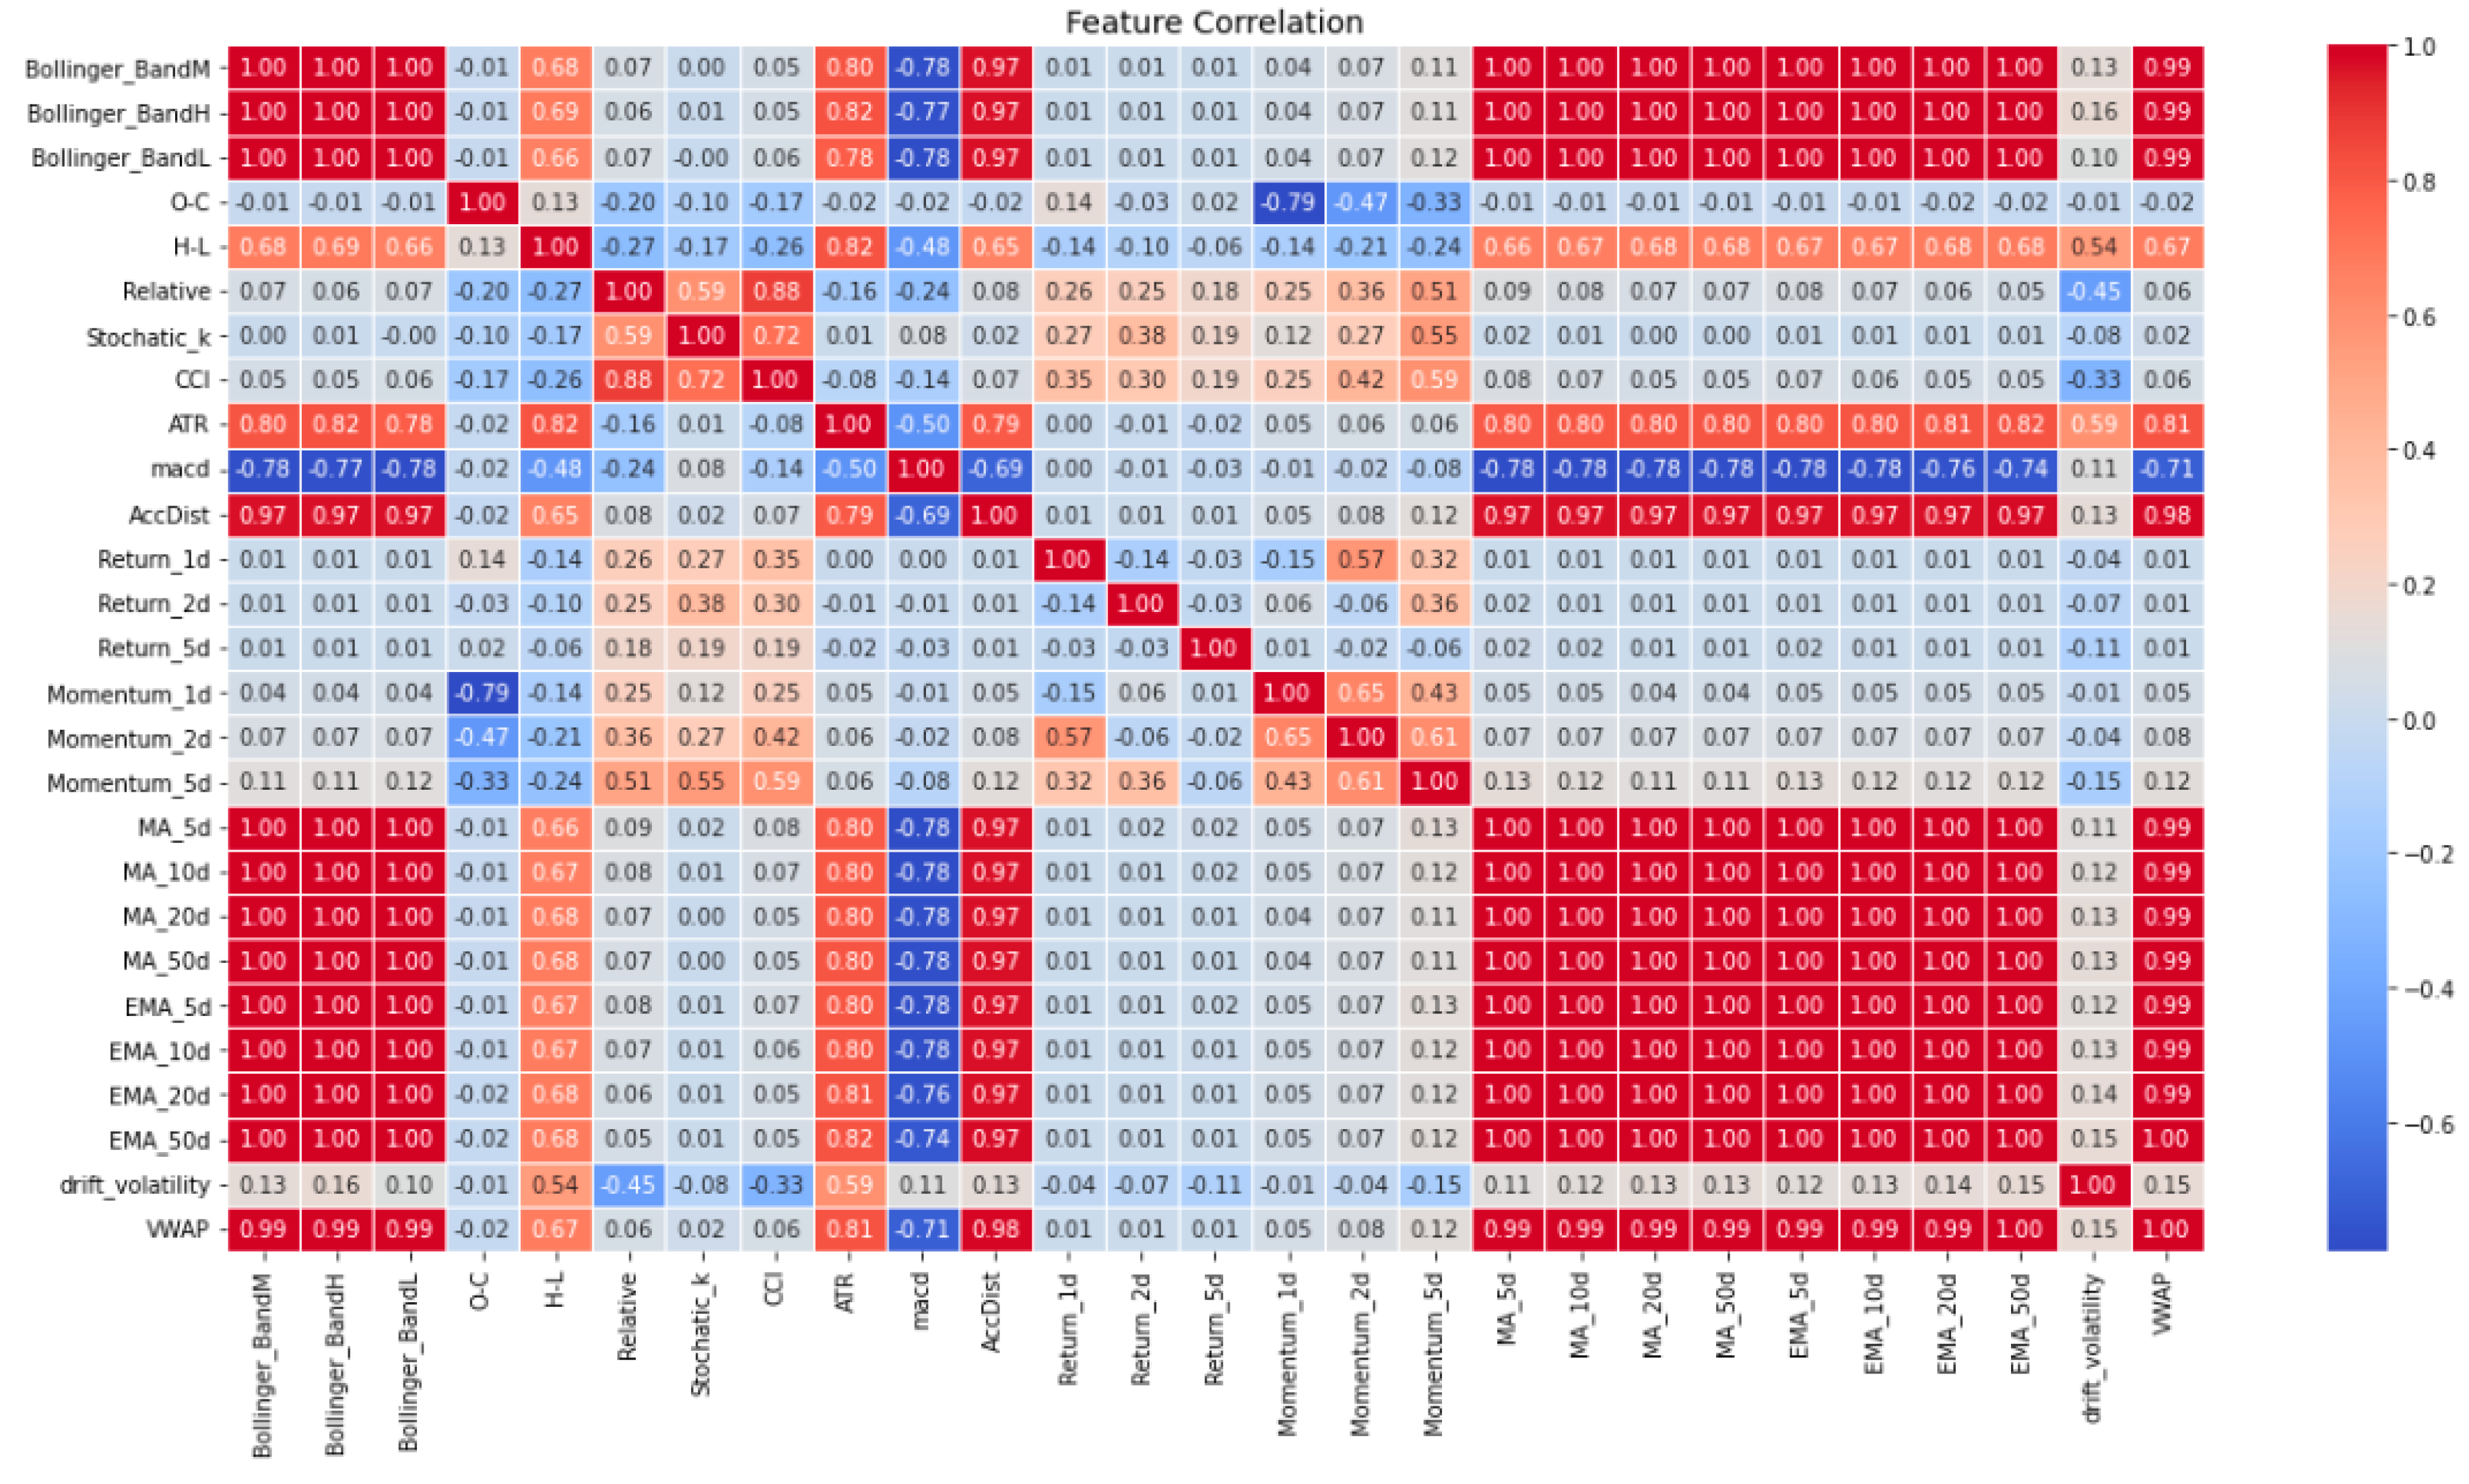
Figure 2.
Correlation Matrix for (EUR/USD) FX Rate.

Figure 3.
Correlation Matrix for Amazon (AMZN) Stock.

Analysis of Correlation Matrix
- Nasdaq-100 Index (NDX): The correlation matrix indicates a strong correlation among the features MA_5d, MA_10d, MA_20d, MA_50d, EMA_5d, EMA_10d, EMA20d, and EMA_50d. Consequently, only a single feature will be chosen for model construction. Additionally, Bollinger bands and VWAP also exhibit a similar correlation.
- (EUR/USD) FX Rate: The features MA_5d, MA_10d, MA_20d, MA_50d, EMA_5d, EMA_10d, EMA20d, and EMA_50d in the correlation matrix are found to be highly correlated with each other. As a result, only one of these features will be selected for model construction. This correlation is also seen between Bollinger bands and VWAP.
- Amazon (AMZN) Stock: High correlations were found among the features MA_5d, MA_10d, MA_20d, MA_50d, EMA_5d, EMA_10d, EMA20d, and EMA_50d within the correlation matrix. Consequently, only one of these features will be chosen for constructing the model. The correlation between Bollinger bands and VWAP was also observed.
3.3.2. K-Means Clustering
Clustering is an unsupervised machine learning technique that aims to discover groups or clusters within a dataset by analyzing its properties. Unlike classification, clustering identifies a collection of data points that share common traits and refers to them as a cluster. The task of choosing the right clustering algorithm can be challenging given the numerous options available.
The k-means algorithm is utilized for finding a specific number of clusters within an untagged dataset. This approach is founded on two presumptions:
First, the optimal cluster will feature a “cluster centre” which is the average of all the points that belong to that cluster.
Second, each data point is closer to its respective cluster centre than to any other cluster centre.
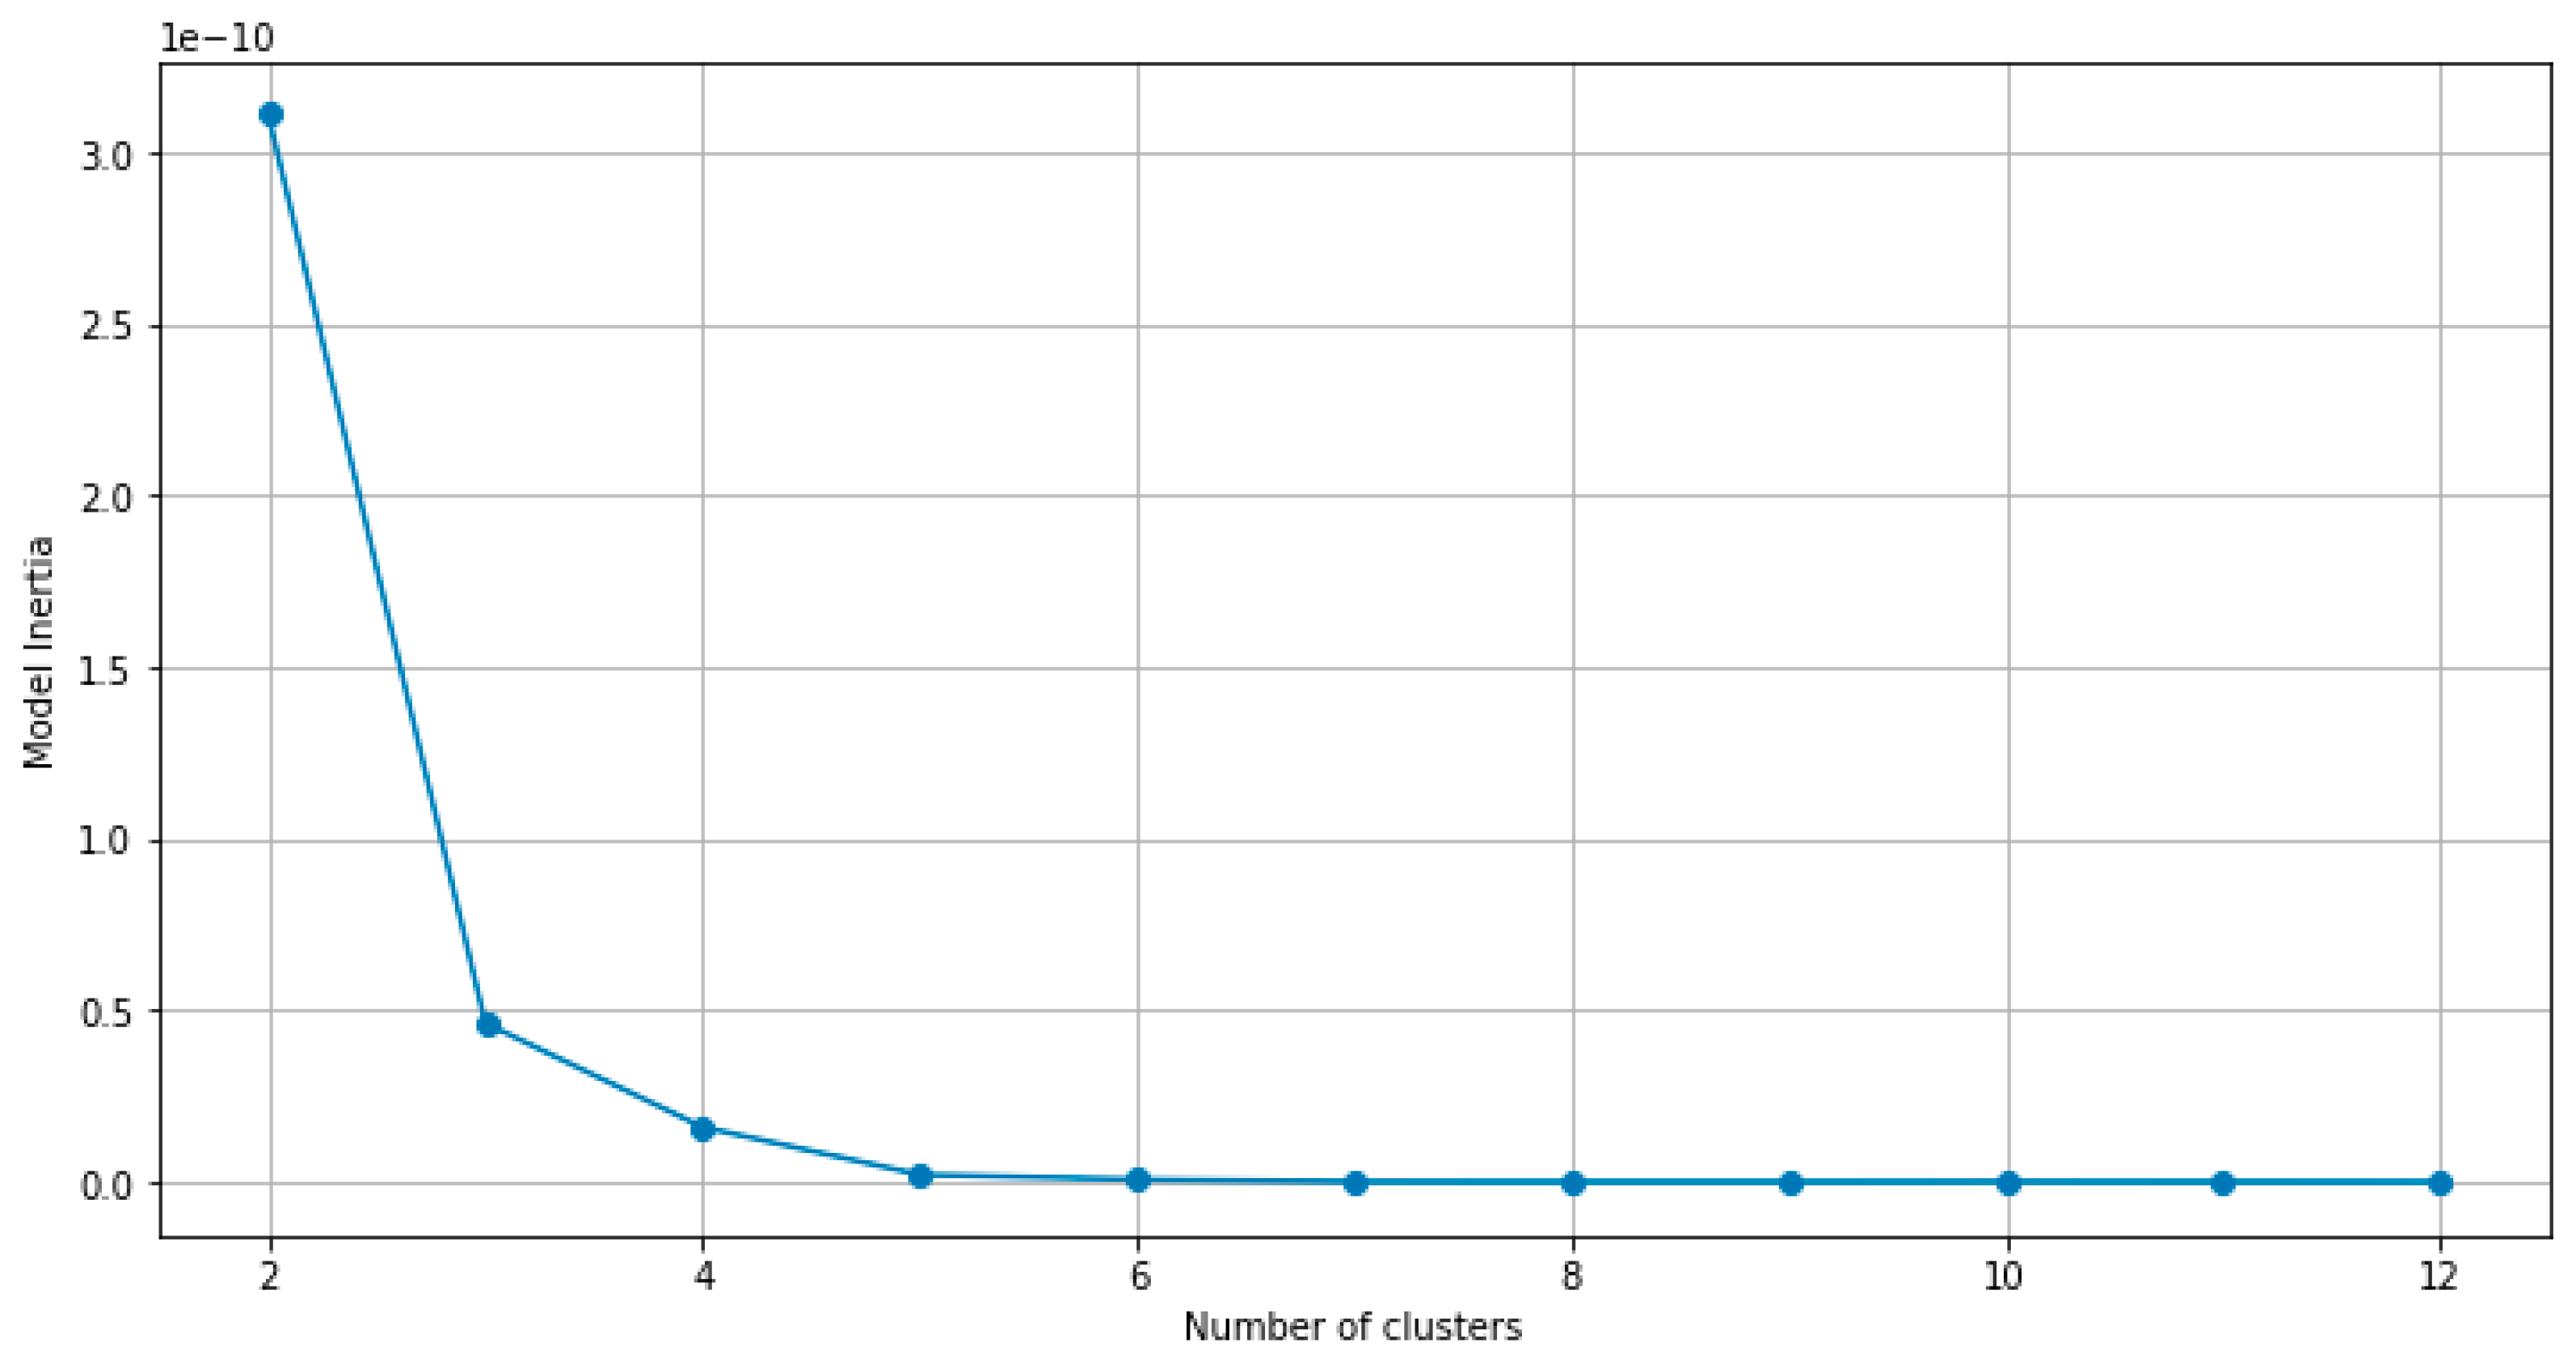
Elbow Plot
The optimal number of clusters is a crucial hyperparameter in clustering models, and selecting it correctly is vital for obtaining accurate results. When every point represents its cluster, the inertia is zero. Thus, selecting the number of clusters that results in the lowest inertia is not appropriate. Instead, we need to determine the inflexion point where increasing the number of clusters does not lead to a significant drop in inertia. An elbow plot is a useful tool for identifying the optimal number of clusters.
Figure 4.
Elbow Plot for Nasdaq-100 Index (NDX).
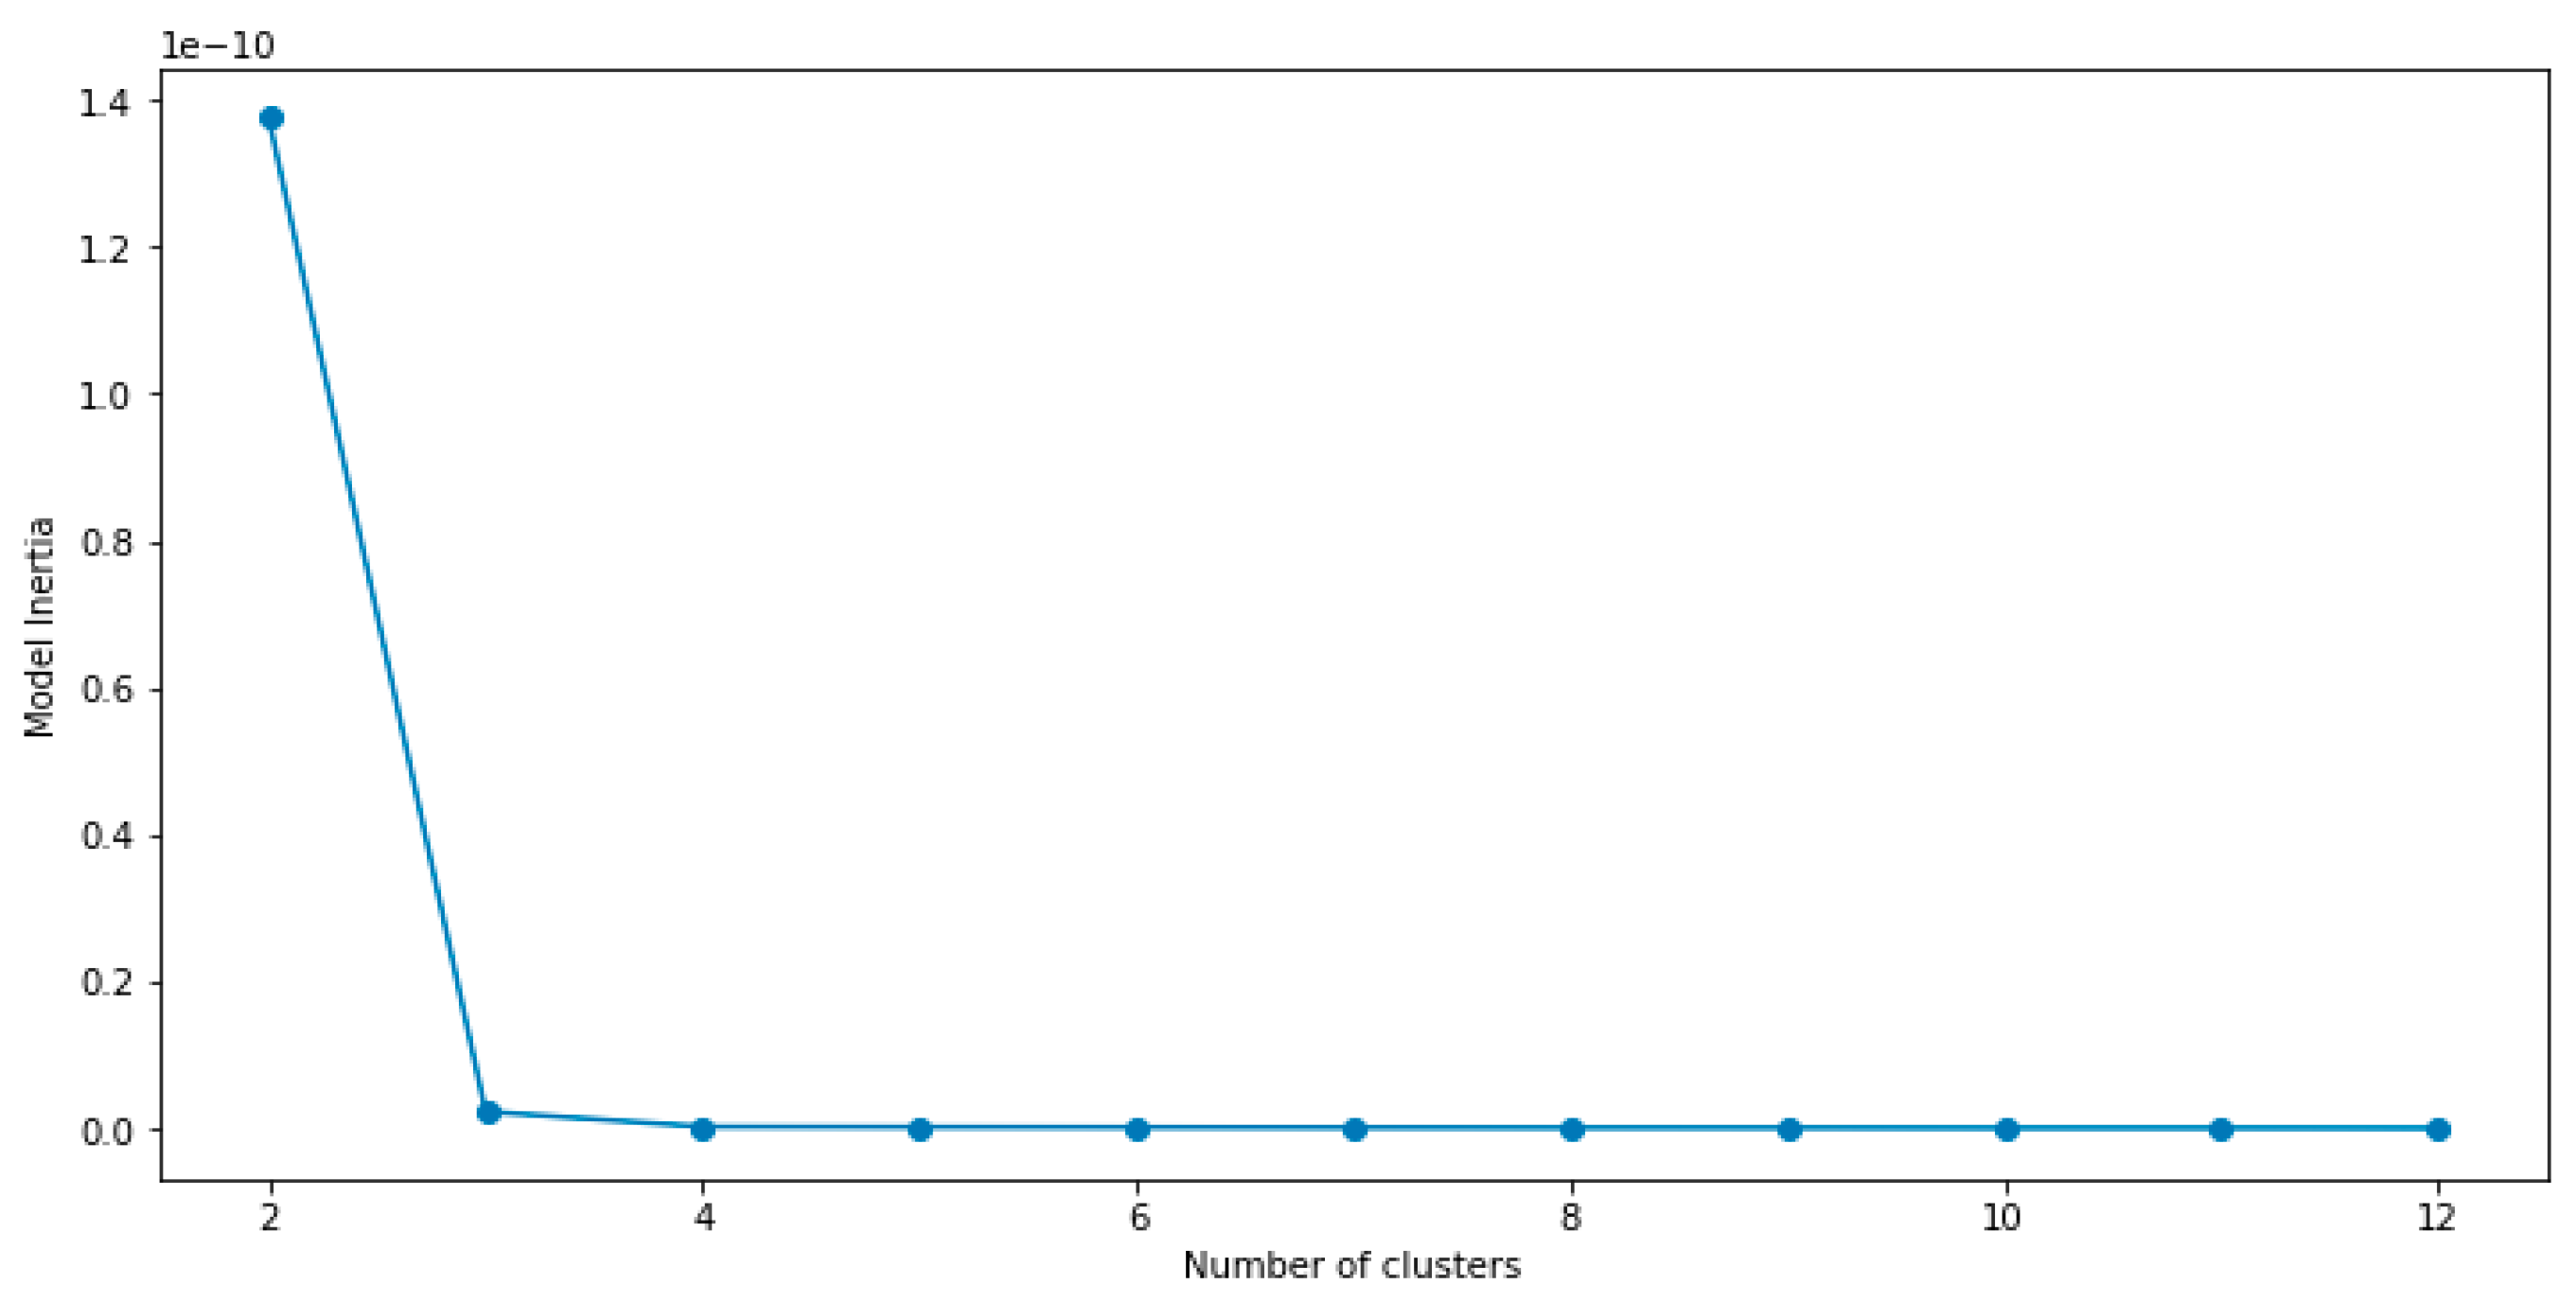
Figure 5.
Elbow Plot for (EUR/USD) FX Rate.
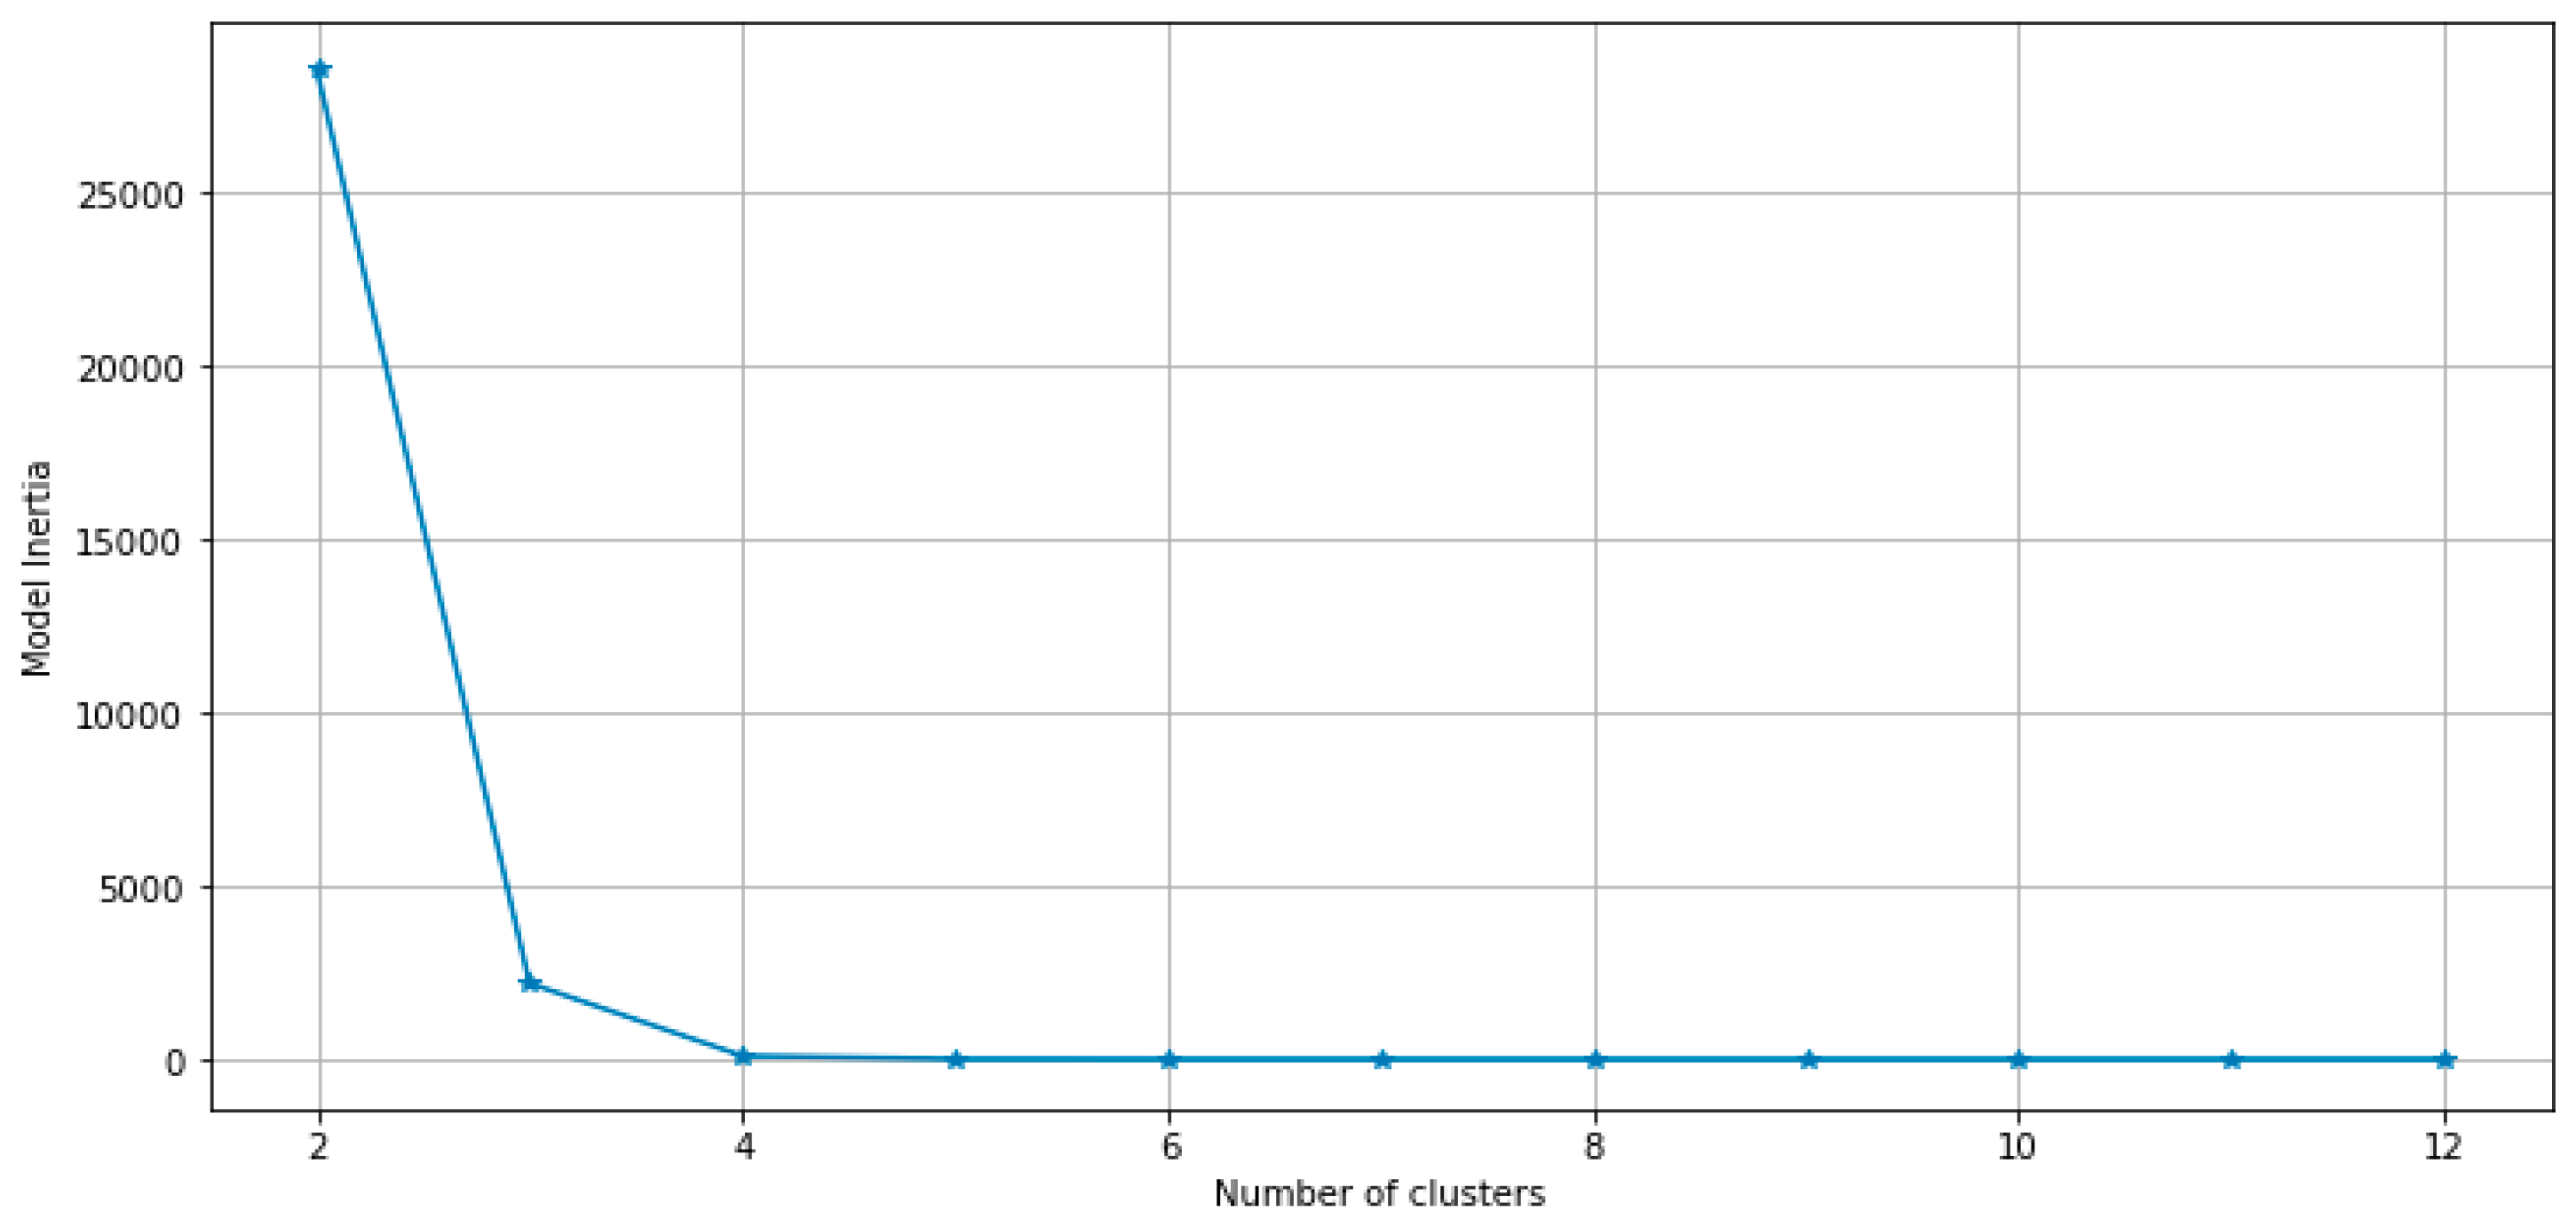
Figure 6.
Elbow Plot for Amazon (AMZN) Stock.
Analysis of Elbow Plot
- Nasdaq-100 Index (NDX): After analyzing the Elbow plot, we observed a clear inflexion point at 3, which led us to modify the KMeans clustering approach to incorporate 3 clusters.
- (EUR/USD) FX Rate: Upon analyzing the Elbow plot, we noticed a discernible shift in the curve at 4. Consequently, we will modify the KMeans clustering method to include 4 clusters.
- Amazon (AMZN) Stock: After examining the Elbow plot, we have identified a significant alteration in the curve at 4, which has led us to modify the KMeans clustering process by including 4 clusters.
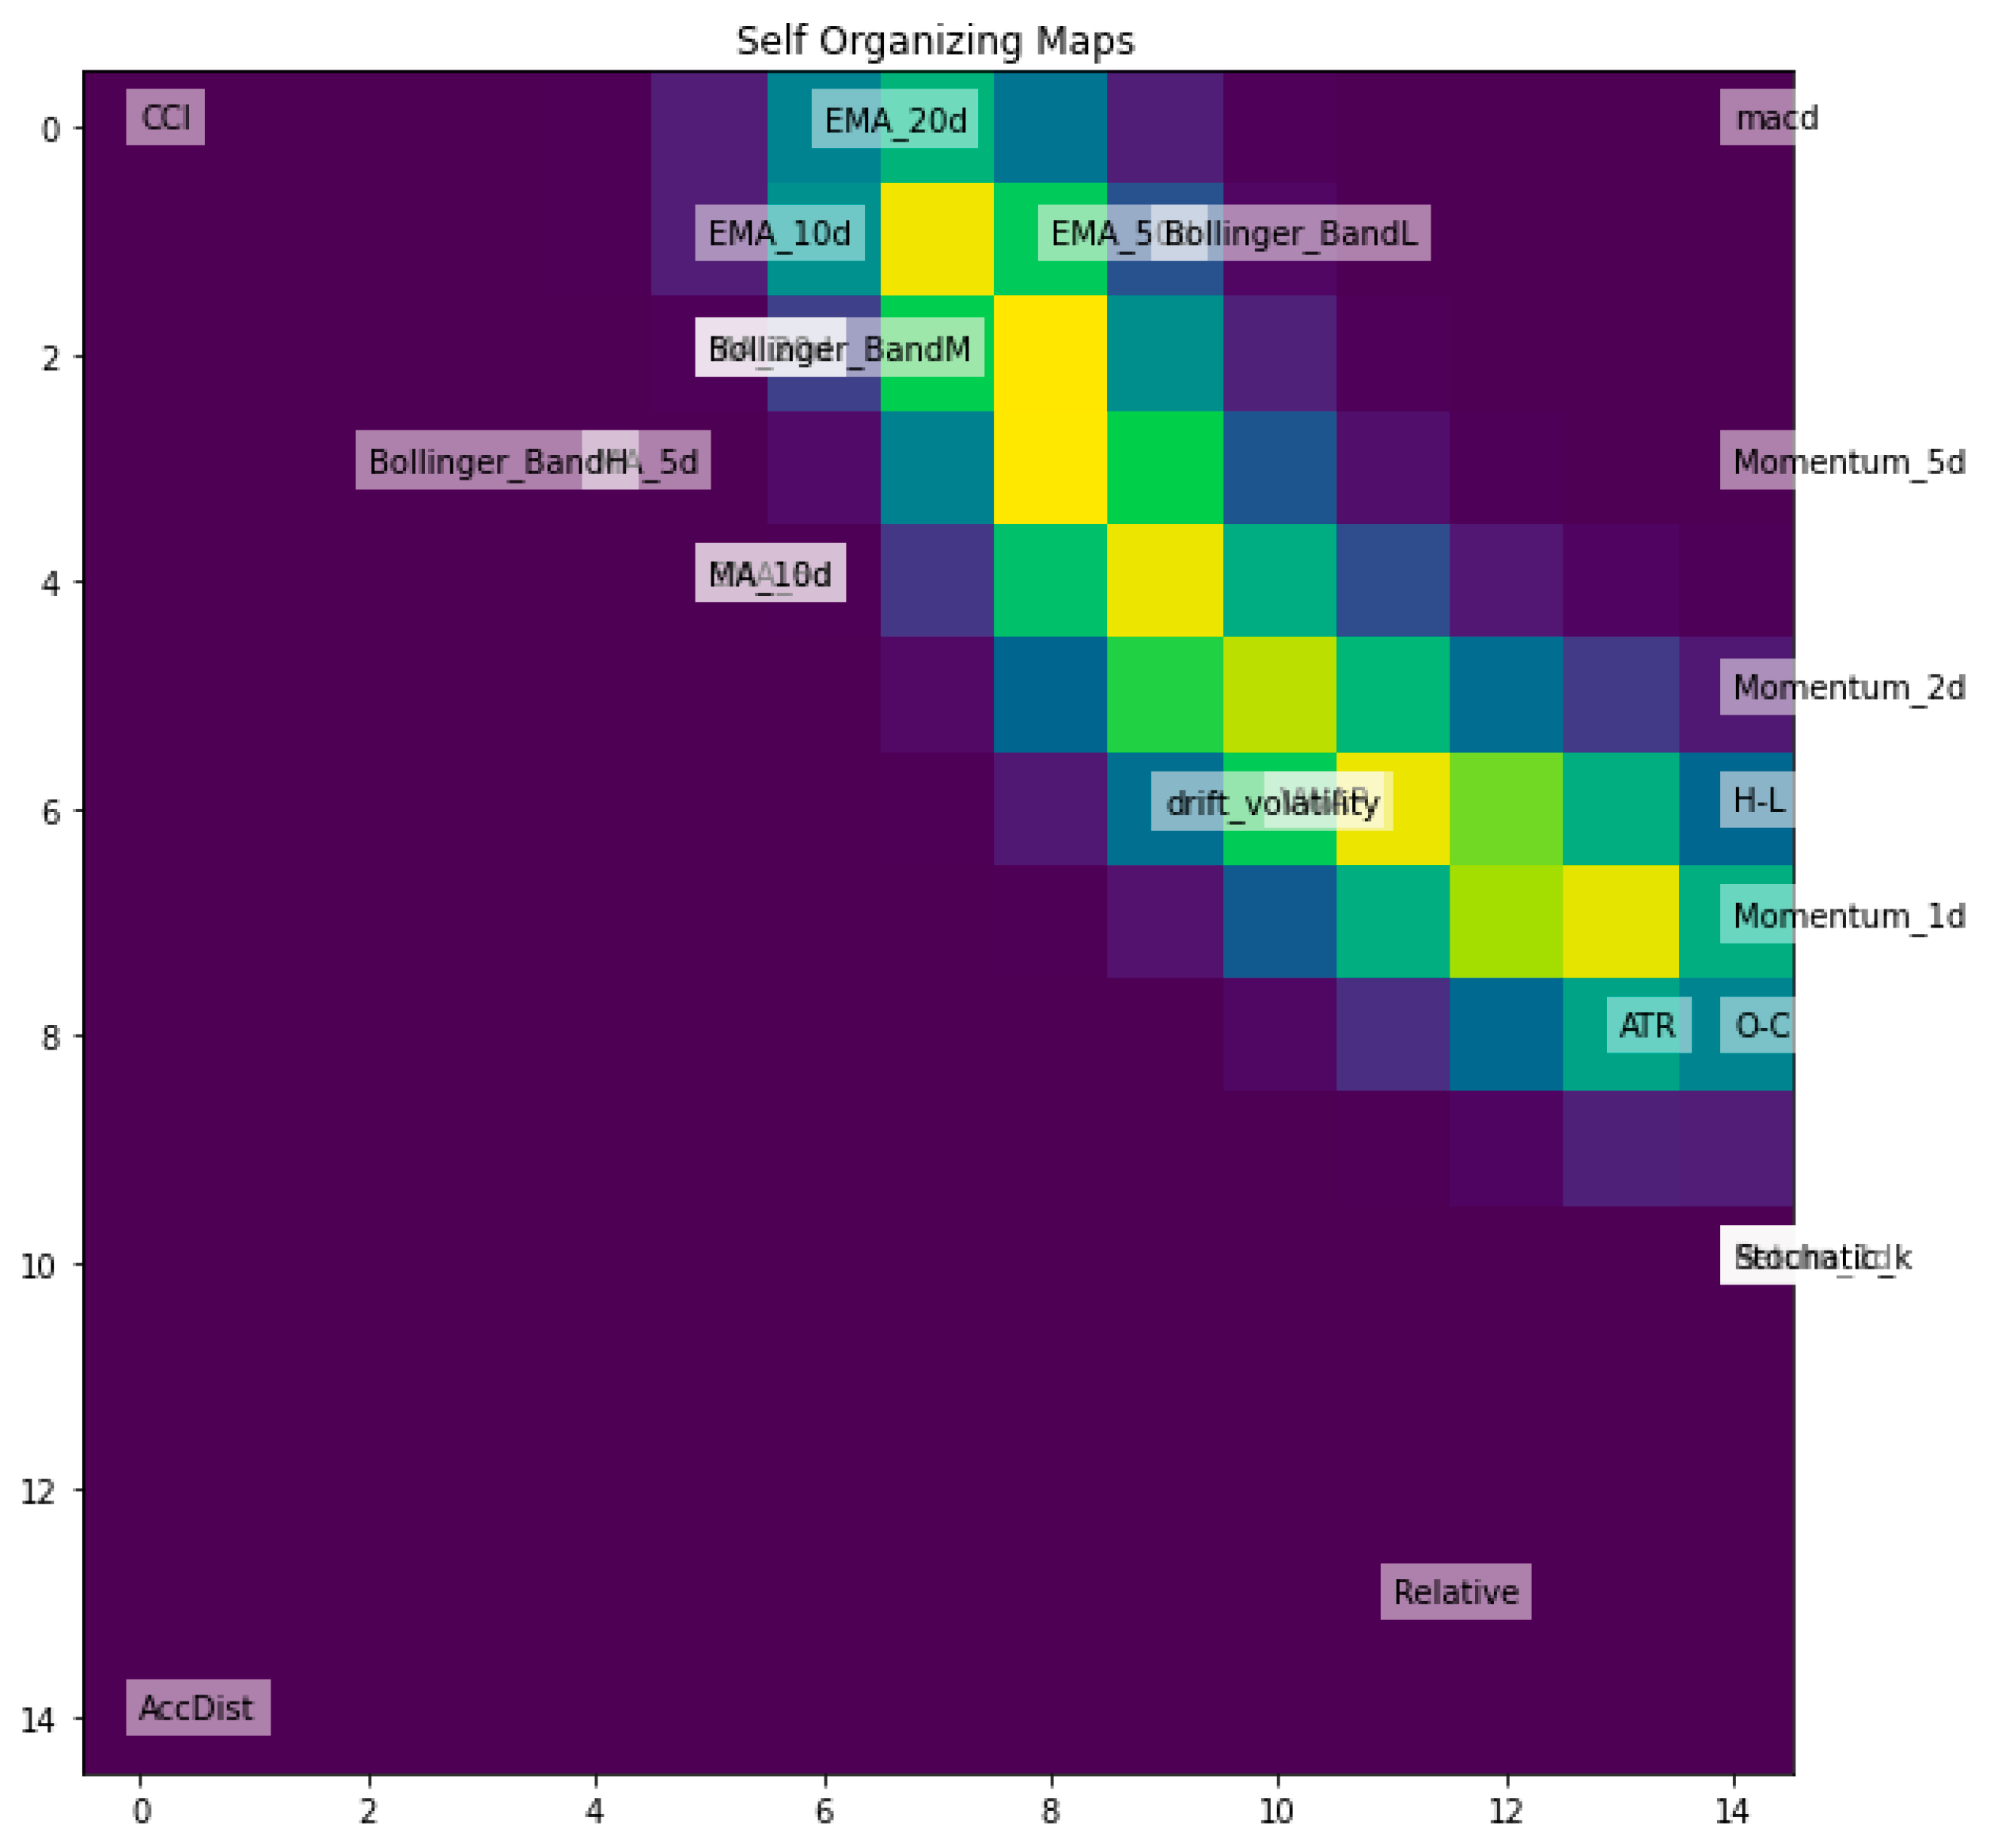
3.3.3. Self-Organizing Maps (SOMs)
Self-organizing maps (SOMs) belong to the category of unsupervised learning neural networks that excel at identifying features in data. SOMs are utilized for dimensionality reduction by projecting high dimensional data onto a smaller set. Unlike traditional artificial neural networks that use error-correlated learning, which involves backpropagation and gradient descent, SOMs utilize competitive learning. In SOMs, the training data lack labels, and the network learns to recognize and differentiate features based on their similarities.
Figure 7.
SOM for Nasdaq-100 Index (NDX).
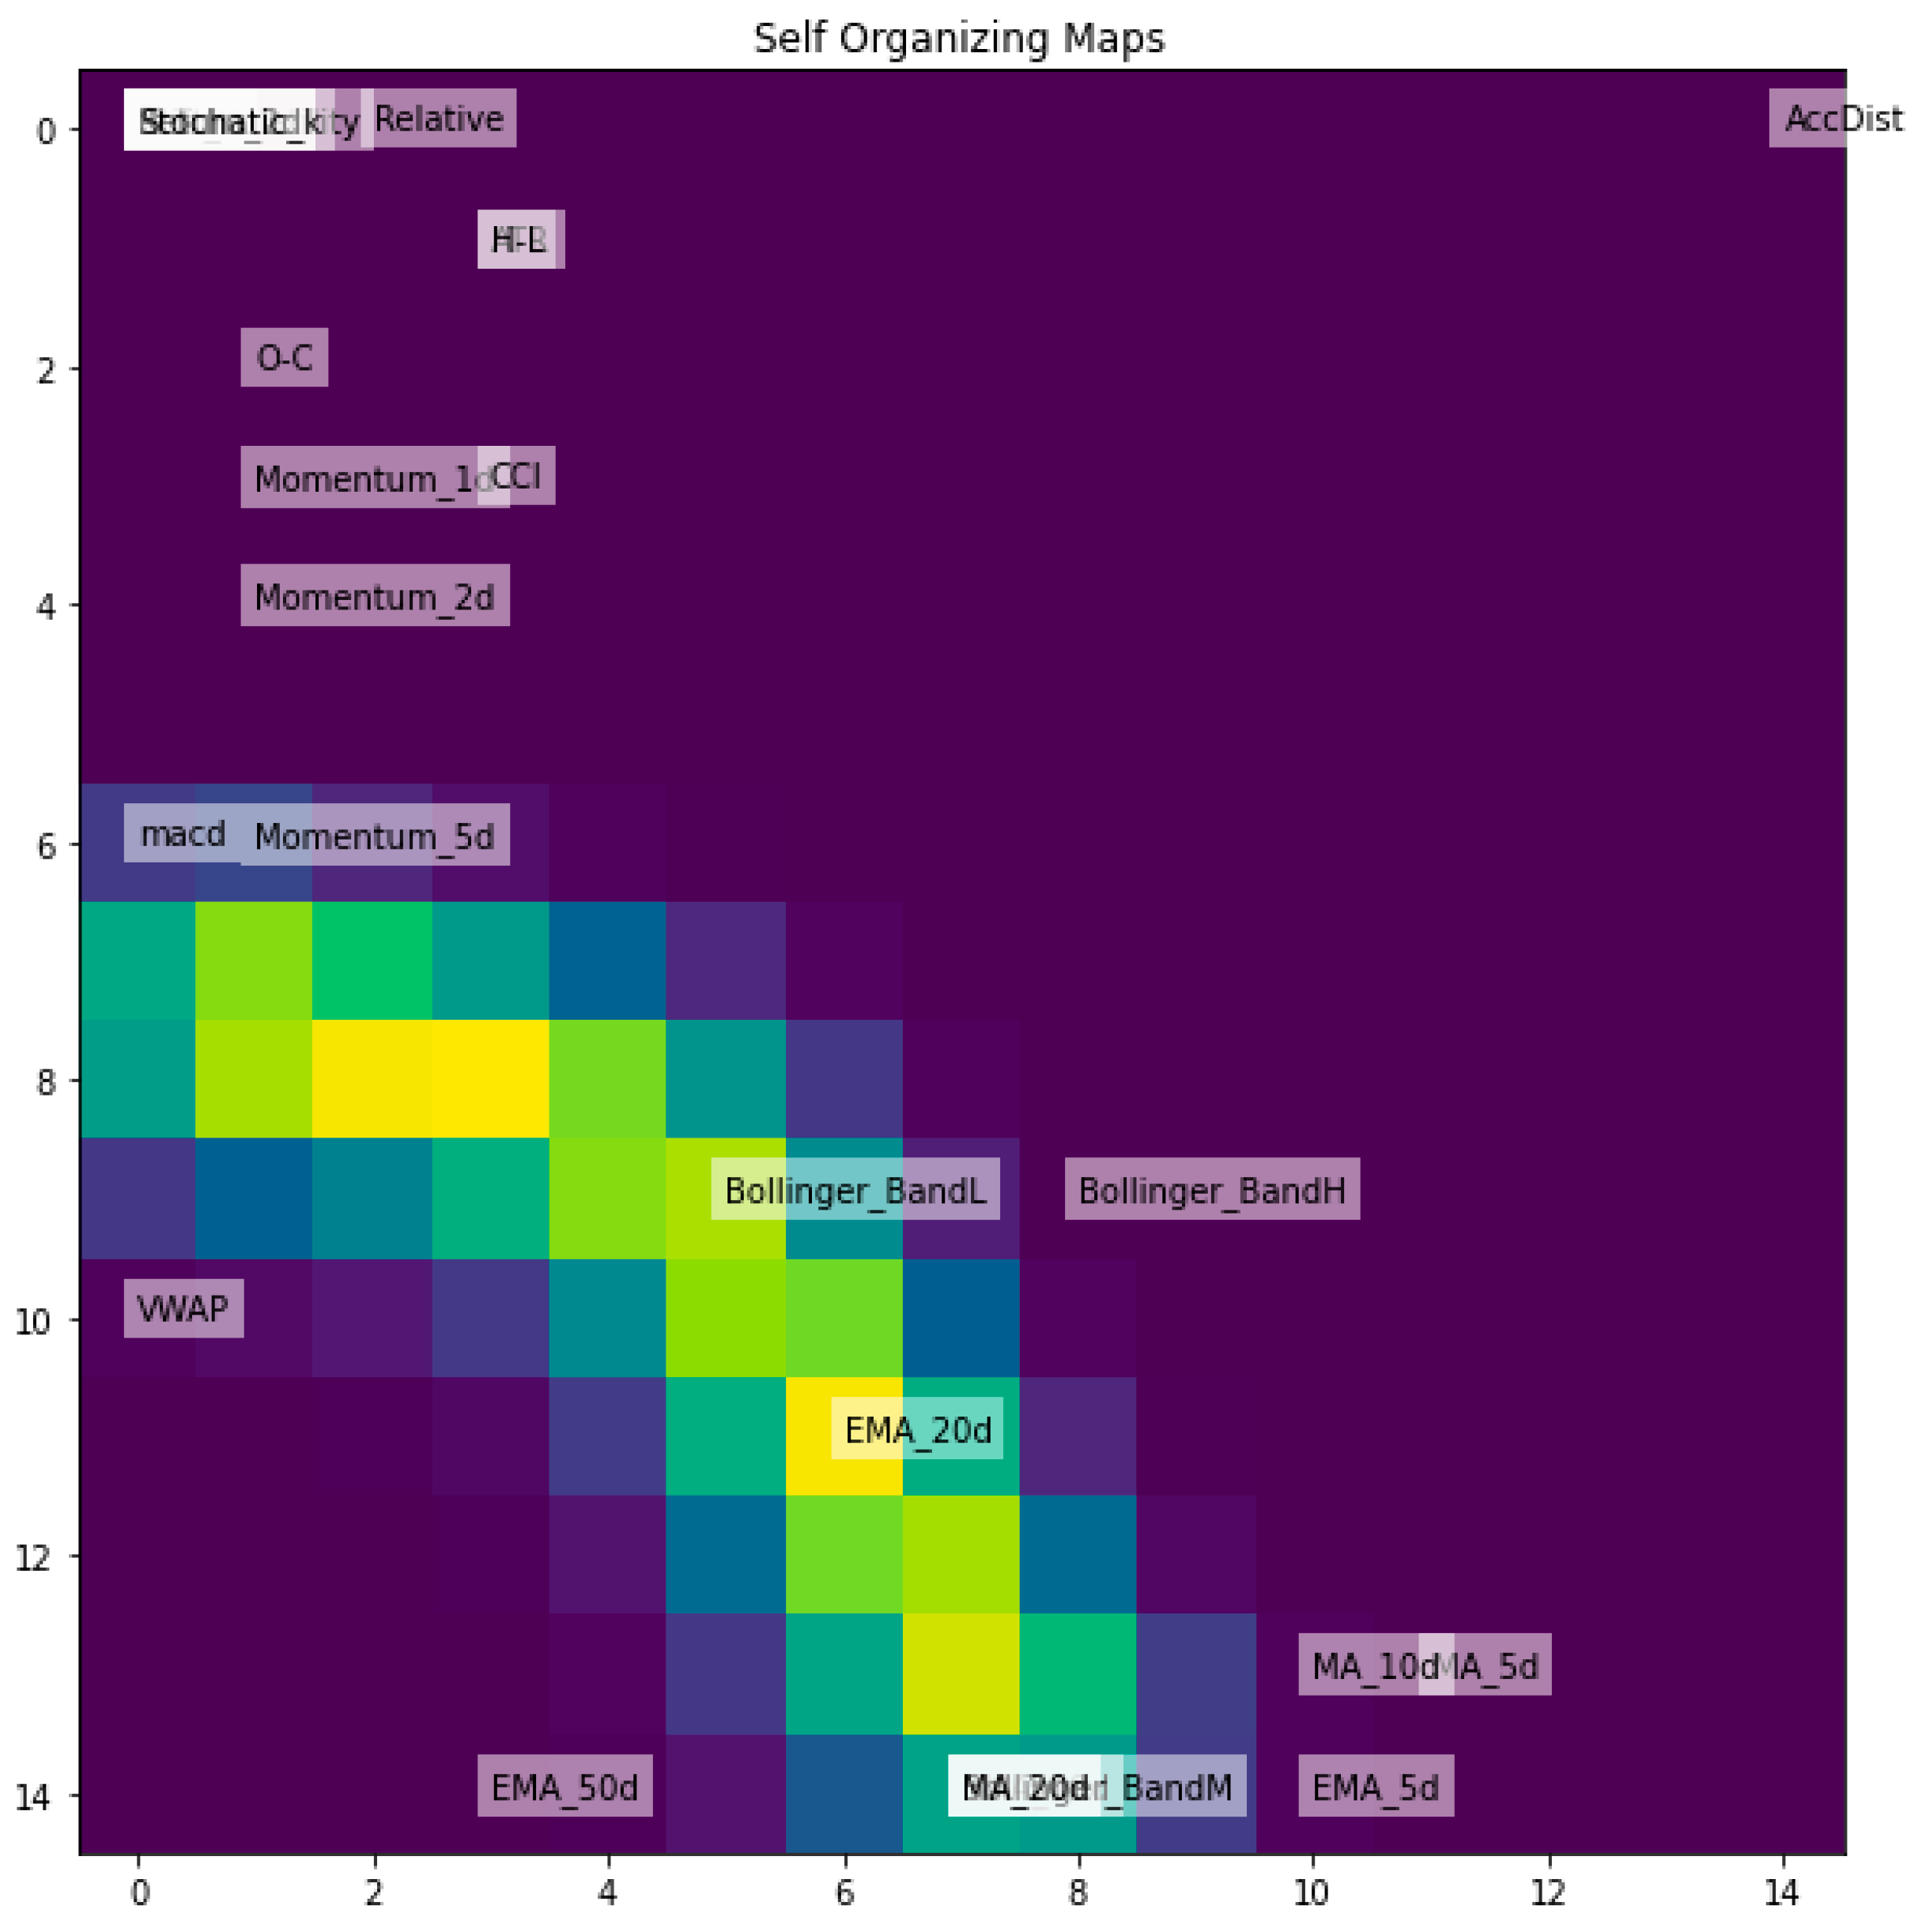
Figure 8.
SOM for (EUR/USD) FX Rate.
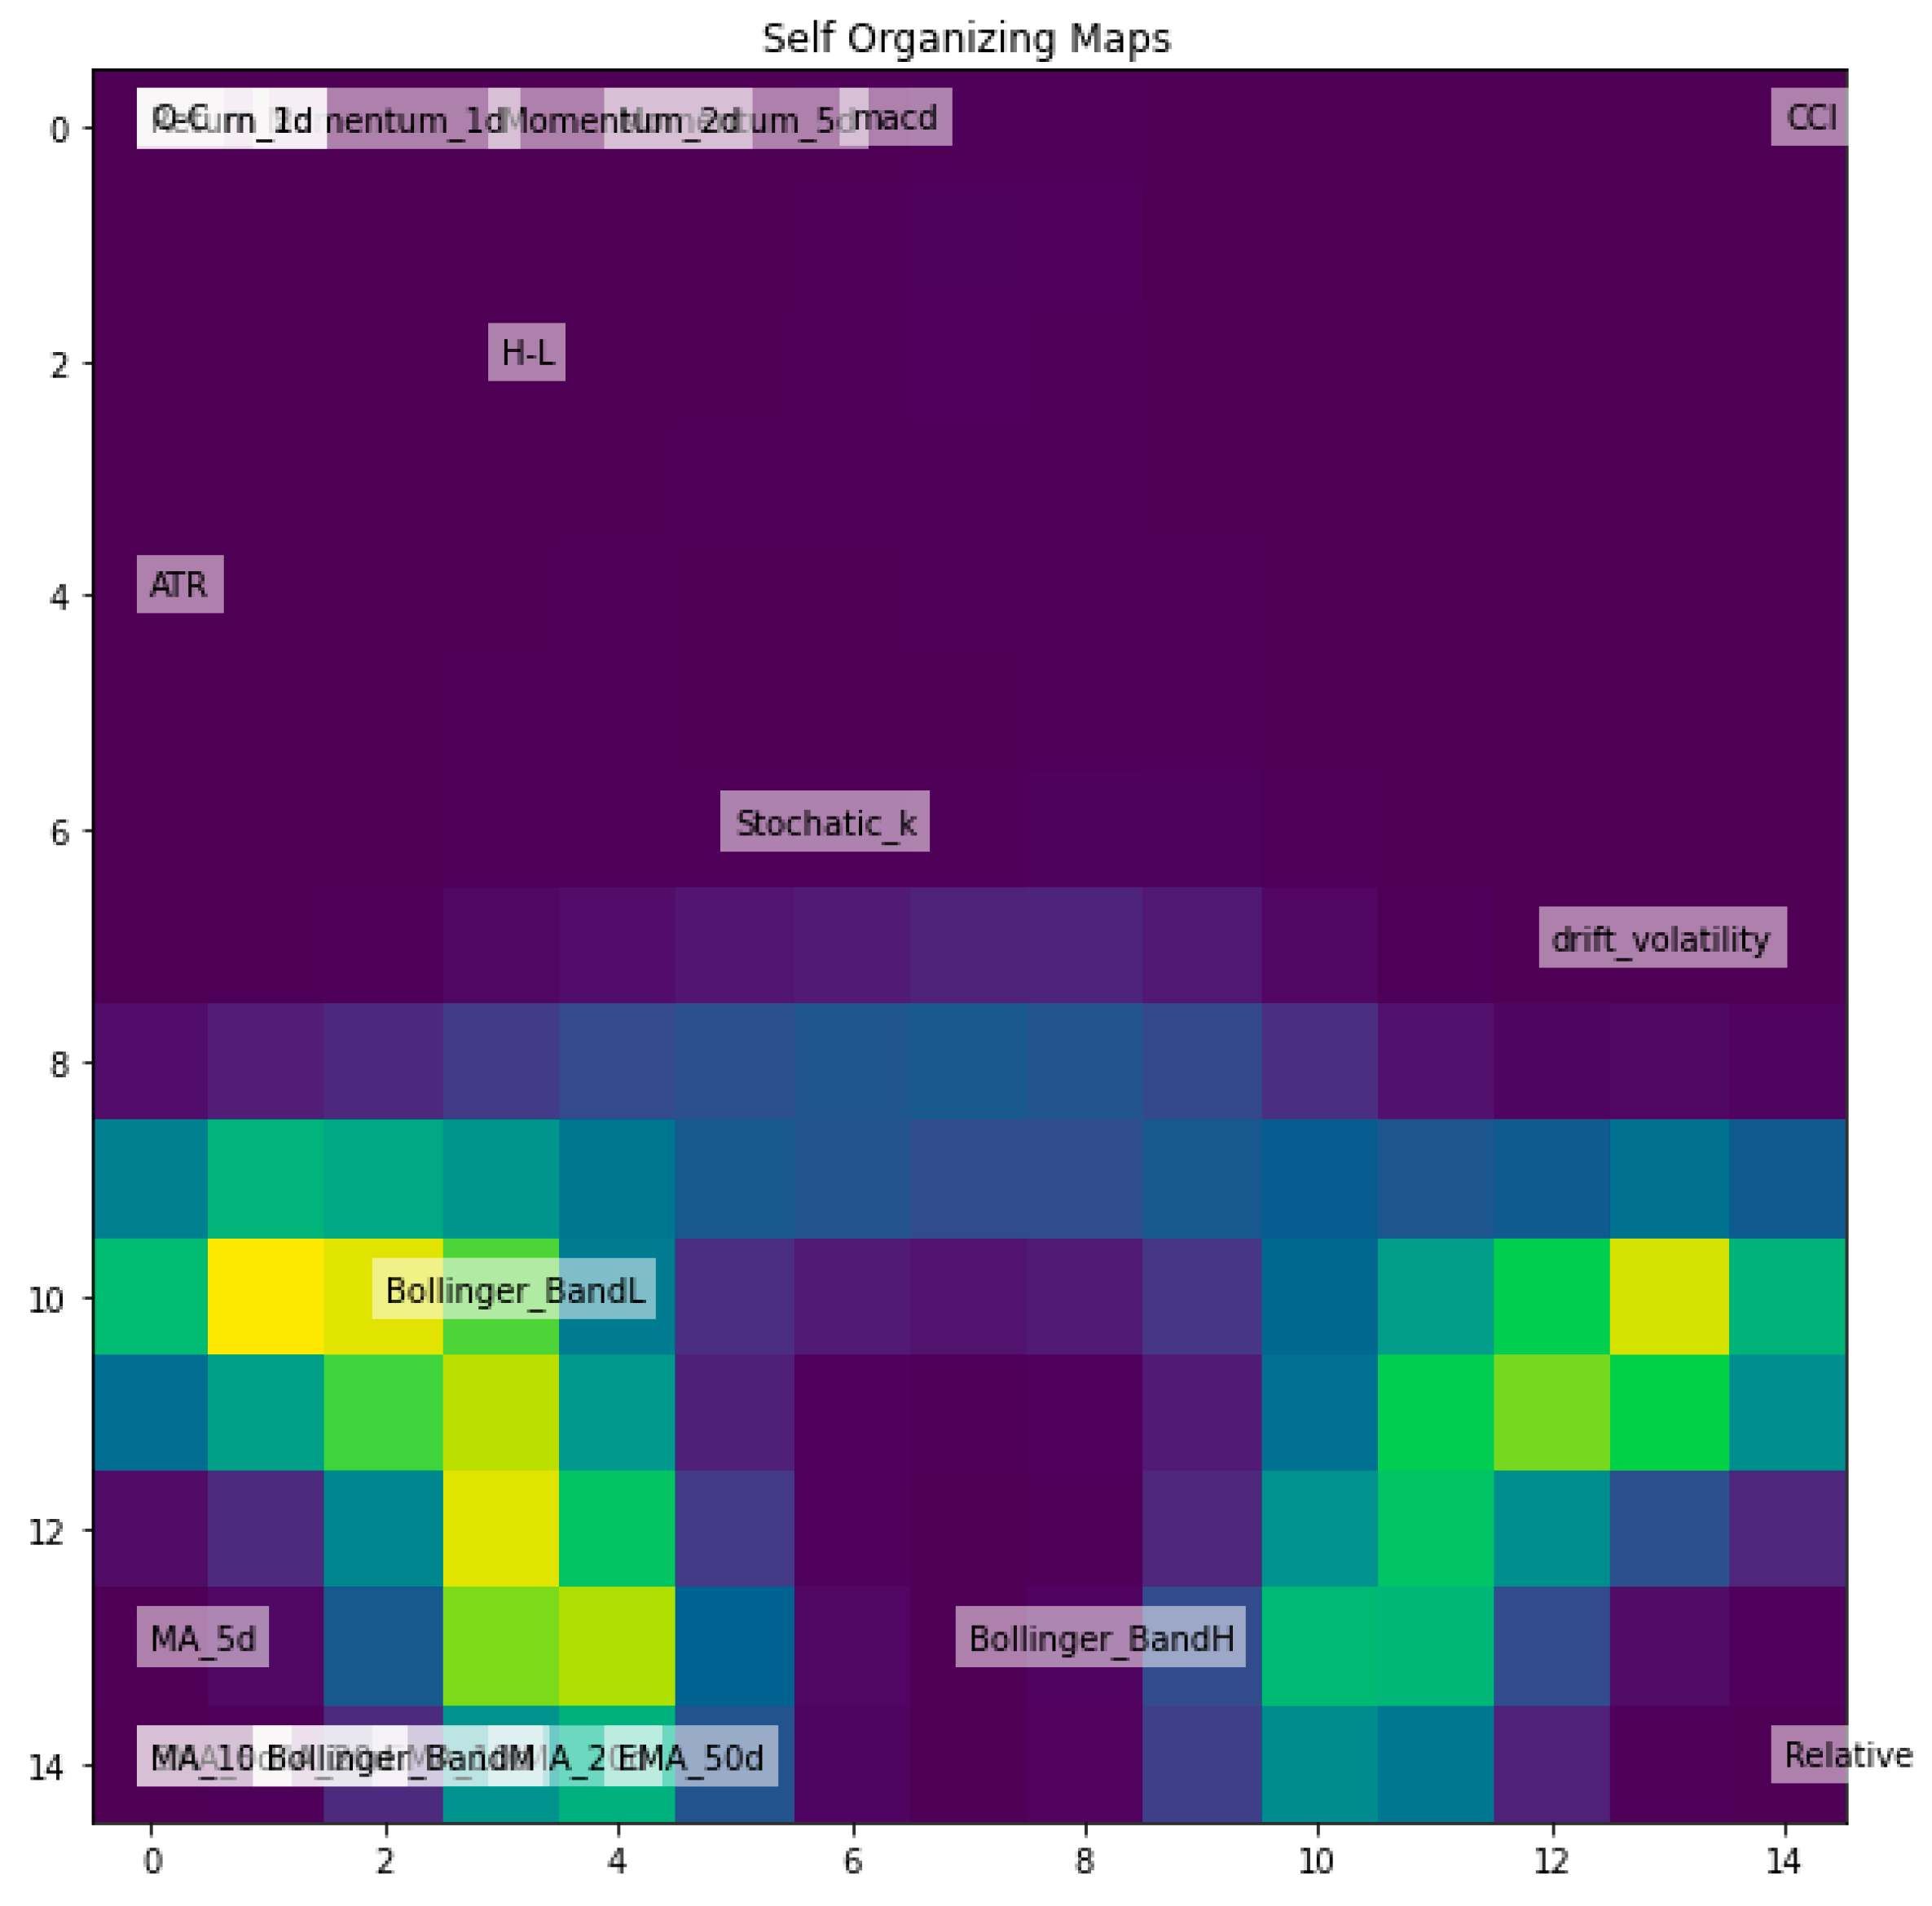
Figure 9.
SOM for Amazon (AMZN) Stock.
3.4. Modelling Approach
The model that has been selected for predicting the direction of movement across all the chosen assets is presented below.
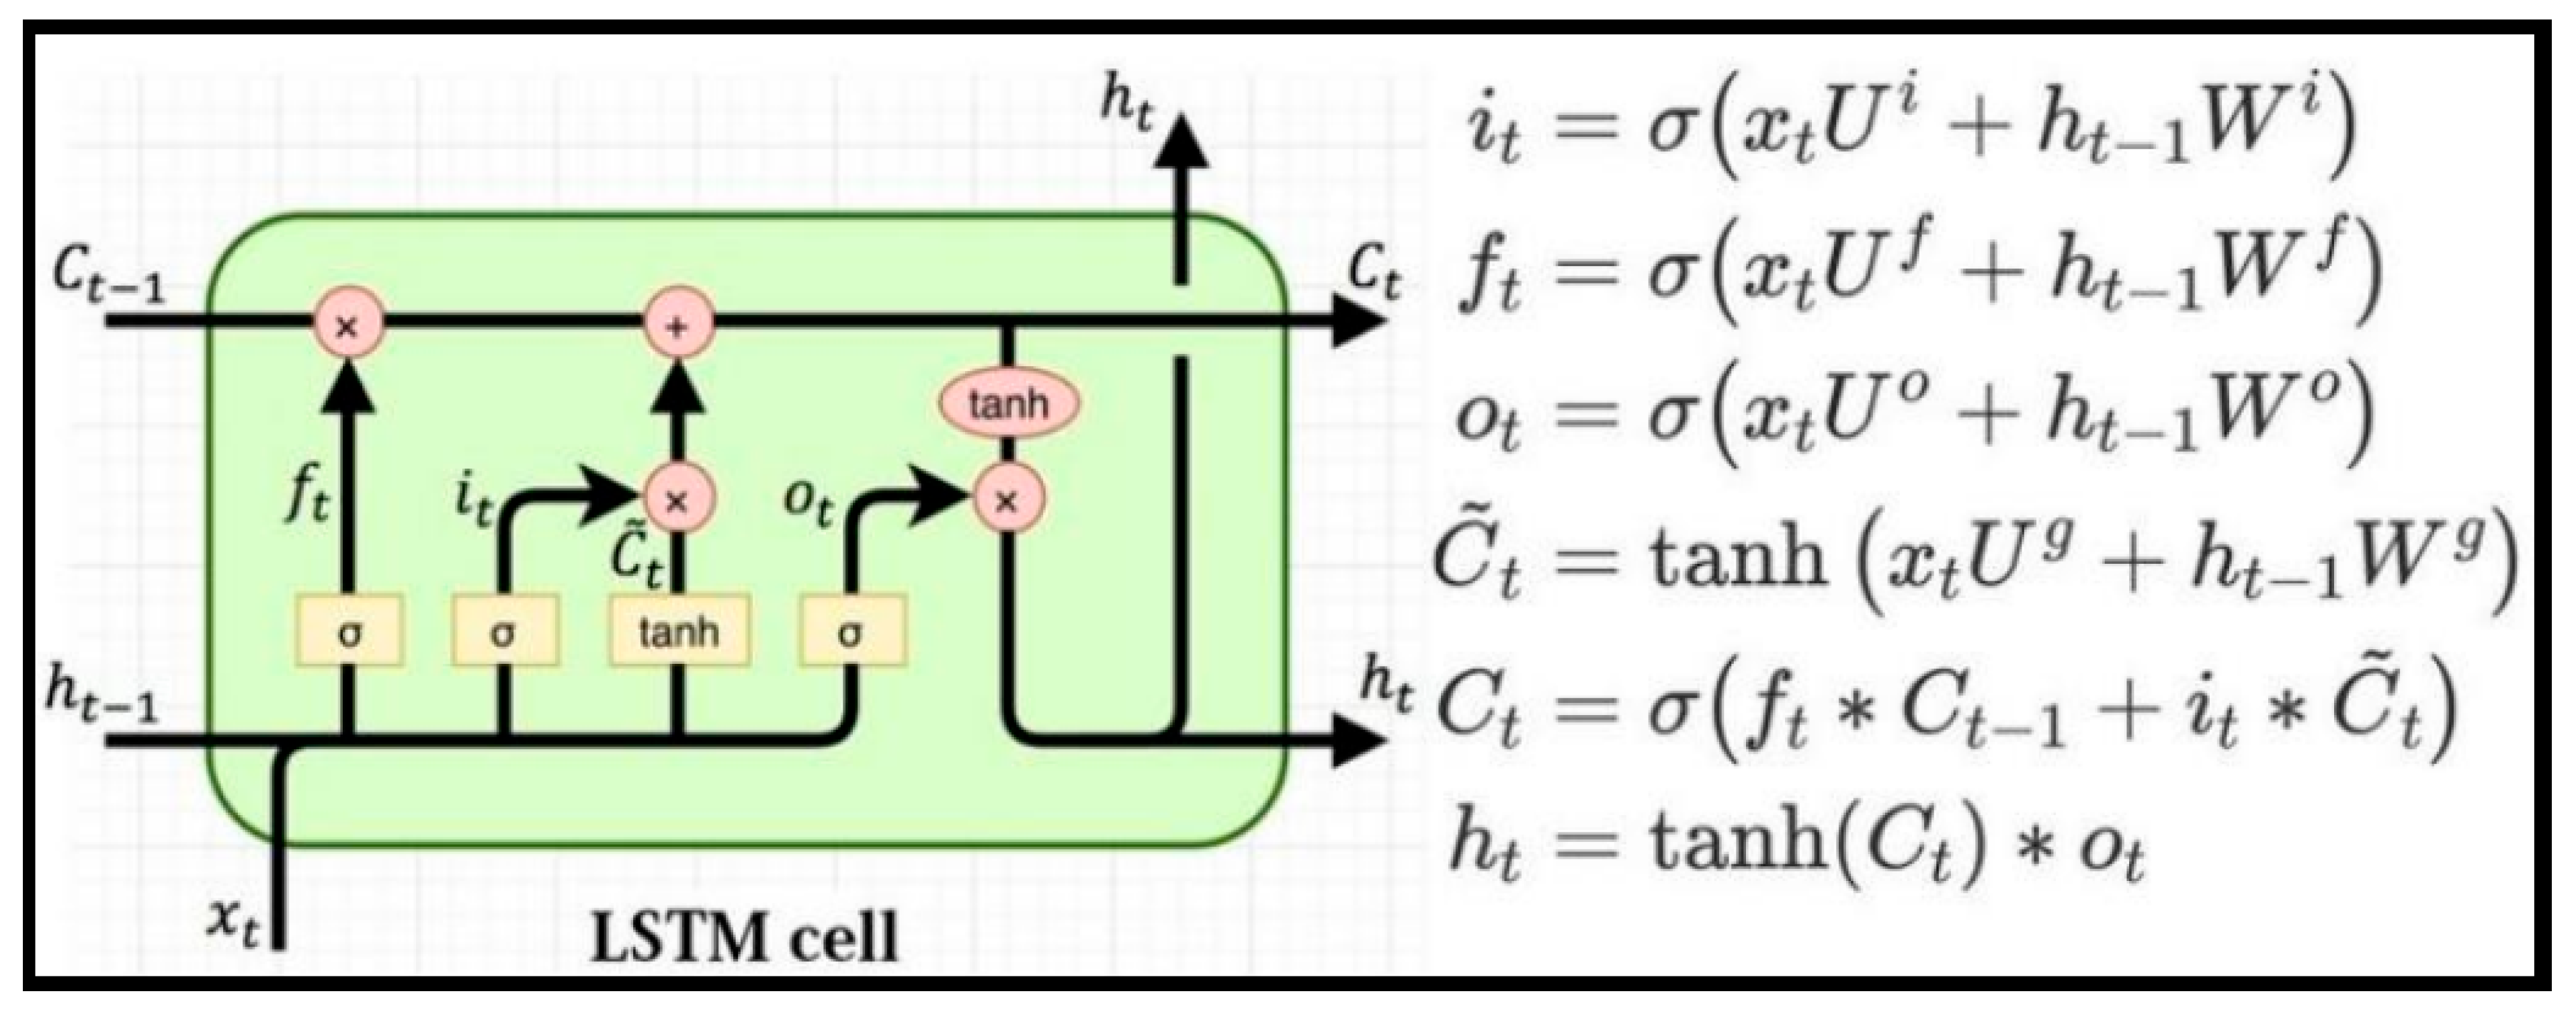
3.4.1. Long Short-Term Memory (LSTM)
This type of recurrent neural network has the ability to learn order dependence, which means that it can take into account the sequential order of the data. Like other RNNs, LSTMs have recurrent connections that enable them to use the state from previous activations of the neuron from the previous time step as context for formulating an output. However, LSTMs have a unique formulation that allows them to avoid the issues that hinder the training and scaling of other RNNs. This uniqueness, coupled with the impressive results that can be achieved, is the reason why the technique is so popular.
The fundamental unit of computation in the LSTM network is referred to as the memory cell, memory block, or simply the cell. While the term “neuron” is commonly used to describe the computational unit of a multilayer perceptron, it has also become common to refer to the LSTM memory cell as a neuron. LSTM cells consist of gates and weights.
Weight parameters are assigned to a memory cell to handle input, output, and internal state, which is developed over time through exposure to input time steps. These weight parameters can be categorized as follows:
- Input Weights: These weights are used to give importance to the input for the current time step.
- Output Weights: These weights are used to give importance to the output from the previous time step.
- Internal State: The internal state of the memory cell is utilized in computing the output for the current time step.
The gates are the cornerstone of the memory cell. They are weighted functions that regulate the flow of information within the cell. The memory cell consists of three gates that have distinct functions:
- Forget Gate: Determines which information should be discarded from the cell.
- Input Gate: Determines which values from the input should be used to update the memory state.
- Output Gate: Decides what to output based on the input and the memory of the cell.
Figure 10.
LSTM Architecture [Source: [9]].
Figure 10.
LSTM Architecture [Source: [9]].
3.4.2. LSTM Input
To use LSTM, the input data must have three dimensions in the format of [samples, timesteps, features]. To meet this requirement, a code or function is employed to convert 2D data into a 3D sliding window shape. This function helps to ensure that the LSTM input is in the proper format.
3.4.3. Data Splitting and Lookback Periods
To convert 2D data into 3D data, the following lookback periods are utilized: 5 days, 10 days, 21 days, 50 days, and 200 days. These lookback periods are used to ensure that the data is formatted correctly. When it comes to data splitting, 70% of the data is utilized for training purposes while the remaining 30% is used for testing.
3.4.4. LSTM Model Design
The LSTM architecture utilises Many-to-Many types, meaning that each time-step in the input has a corresponding time-step in the output. This contrasts Many-to-One types, which result in much lower accuracy for training and testing.
4. Model Evaluation and Results
For this classification task, we employed LSTM (Long-Term Short Memory), a type of Recurrent Neural Network (RNN) architecture that is widely used in stock directional movement analysis due to its ability to handle long sequence dependencies effectively.
4.1. Train Data Accuracy

Table 1.
Train Data Accuracy for Nasdaq-100 Index (NDX).
| Model - Nasdaq-100 Index (NDX) | Loss | Accuracy |
|---|---|---|
| LSTM with 5-Day Lookback Period | 0.6885 | 0.5507 |
| LSTM with 10-Day Lookback Period | 0.6893 | 0.5518 |
| LSTM with 21-Day Lookback Period | 0.6879 | 0.5495 |
| LSTM with 50-Day Lookback Period | 0.6893 | 0.5525 |
| LSTM with 200-Day Lookback Period | 0.6907 | 0.5488 |
Table 2.
Train Data Accuracy for EUR/USD FX Rate.
| Model - EUR/USD FX Rate | Loss | Accuracy |
|---|---|---|
| LSTM with 5-Day Lookback Period | 0.6937 | 0.5012 |
| LSTM with 10-Day Lookback Period | 0.6941 | 0.4950 |
| LSTM with 21-Day Lookback Period | 0.6925 | 0.5190 |
| LSTM with 50-Day Lookback Period | 0.6951 | 0.4973 |
| LSTM with 200-Day Lookback Period | 0.6939 | 0.4990 |
Table 3.
Train Data Accuracy for Amazon (AMZN) Stock.
| Model - Amazon (AMZN) Stock | Loss | Accuracy |
|---|---|---|
| LSTM with 5-Day Lookback Period | 0.6919 | 0.5365 |
| LSTM with 10-Day Lookback Period | 0.6917 | 0.5353 |
| LSTM with 21-Day Lookback Period | 0.6924 | 0.5389 |
| LSTM with 50-Day Lookback Period | 0.6923 | 0.5288 |
| LSTM with 200-Day Lookback Period | 0.6899 | 0.5365 |
4.2. Test Data Accuracy
Table 4.
Test Data Accuracy for Nasdaq-100 Index (NDX).
| Model-Nasdaq-100 Index (NDX) | Prediction Accuracy |
|---|---|
| LSTM with 5-Day Lookback Period | 0.5809 |
| LSTM with 10-Day Lookback Period | 0.5816 |
| LSTM with 21-Day Lookback Period | 0.5825 |
| LSTM with 50-Day Lookback Period | 0.5816 |
| LSTM with 200-Day Lookback Period | 0.5855 |
Table 5.
Test Data Accuracy for EUR/USD FX Rate.
| Model - EUR/USD FX Rate | Prediction Accuracy |
|---|---|
| LSTM with 5-Day Lookback Period | 0.4939 |
| LSTM with 10-Day Lookback Period | 0.5067 |
| LSTM with 21-Day Lookback Period | 0.4938 |
| LSTM with 50-Day Lookback Period | 0.5079 |
| LSTM with 200-Day Lookback Period | 0.4934 |
Table 6.
Test Data Accuracy for Amazon (AMZN) Stock.
| Model - Amazon (AMZN) Stock | Prediction Accuracy |
|---|---|
| LSTM with 5-Day Lookback Period | 0.5310 |
| LSTM with 10-Day Lookback Period | 0.5323 |
| LSTM with 21-Day Lookback Period | 0.5318 |
| LSTM with 50-Day Lookback Period | 0.5315 |
| LSTM with 200-Day Lookback Period | 0.5302 |
5. Visualization
The section of code in our online repositories includes illustrations of the LSTM architecture for different look-back periods, as well as information on model accuracy, model loss, and the models’ performance in terms of the confusion matrix and area under the curve.
6. Limitations
The primary limitation of the model is related to the selection of labels for the LSTM architecture across all assets. Altering the labels will have an impact on the accuracy of both the training and testing data sets. Therefore, a comprehensive qualitative and quantitative approach must be implemented when selecting labels for directional prediction. For this project, a straightforward approach has been utilized, whereby the asset is purchased (+1) if the closing price tomorrow is predicted to be higher than today’s closing price, and sold (0) if it is lower. If there is no change between the closing prices of today and tomorrow, the position is considered neutral.
The model lacks the ability to differentiate between classes based on the labelling criteria outlined above. Despite experimenting with various look-back periods ranging from 10 to 200 in an attempt to enhance model performance, it did not perform well for the chosen assets in both the training and testing data sets. For the majority of look-back periods, the area under the curve was either equal to or less than 50%. This was reflected in the confusion matrix generated for the assets across all the different look-back periods.
7. Final Conclusion
- Nasdaq-100 Index (NDX): The performance metrics included in the code suggest that the chosen features are not effective predictors for the short-term directional movement (1 day) of the Nasdaq-100 index. The area under the curve is less than or equal to 50% for the classes, indicating that the model is unable to differentiate between them. Furthermore, the model is incapable of predicting class ‘0’, which is reflected in the confusion matrix, with both the true positive and false negative values being zero. The highest levels of accuracy were observed for the 50-day and 200-day look-back periods in the training and testing data sets, with a maximum accuracy of 55.25% and 58.55%, respectively.
- EUR/USD FX Rate: The model demonstrated progress in predicting both classes when utilizing a 200-day look-back period. Nevertheless, for the majority of periods, the area under the curve is less than or equal to 50% for the classes, implying that the model is incapable of differentiating between them. Therefore, it is apparent that the chosen features are inadequate predictors for determining the short-term directional movement (1Day) of the EUR/USD FX rate. The maximum accuracy was observed for the 21-day look-back period in terms of training (51.90%), whereas, for the test data (50.79%), the maximum accuracy was observed with a 50-day look-back period.
- Amazon (AMZN) Stock: Similar outcomes with NDX were observed for the AMZN. Upon analyzing the performance metrics included in the code, it is evident that the selected features are insufficient predictors for determining the short-term directional movement (1Day) of the AMZN stock. The area under the curve is less than or equal to 50% for the classes, indicating that the model cannot distinguish between them. Furthermore, the model cannot predict class ‘0,’ as seen in the confusion matrix, where both the true positive and false negative values are zero. The maximum levels of accuracy were observed for the 21-day and 10-day look-back periods, with the highest training accuracy being 53.89% and the highest testing accuracy being 53.23%.
8. Recommendation for Future Work
It is recommended to conduct exploratory data analysis (EDA) to understand the underlying patterns in the data. This may include dimensionality reduction techniques such as autoencoding, self-organizing maps, or decision tree regression, which were used in previous studies [6]. The results of the EDA will be used to guide the selection of features for the LSTM model.
In consequence, this capstone project has the potential to contribute to the growing field of deep learning and its applications in finance. By exploring the potential of LSTM for making directional predictions for assets, including stock indices, stocks, and FX rates (EUR/USD), this project can help investors make informed decisions and maximize their returns.
Disclaimer
This paper was created as part of a WorldQuant University degree program towards an MSc in Financial Engineering. This paper is reproduced with the consent and permission of WorldQuant University. All rights reserved.
Appendix
Github:https://github.com/fabulouskorex/Capstone-Project/blob/fabulous-korex/Deep_Learning_in_Finance.ipynb
Python: https://www.python.org/
Pandas: https://pandas.pydata.org/
Yahoo Finance: https://finance.yahoo.com/
References
- Goodfellow, I., Bengio, Y., & Courville, A. (2016). Deep learning (Vol. 1). Cambridge: MIT press.
- Génois, M., & Gramfort, A. (2019). Recurrent neural networks for time series forecasting: A survey. arXiv preprint arXiv:1909.04404.
- Wang, L., Liu, J., Wei, Y., & Zhang, X. (2018). Deep learning for financial market: A review. arXiv preprint arXiv:1805.08531. [CrossRef]
- Moody, J., & Saffell, M. (2001). Learning to trade using positive linear programming. IEEE Transactions on Neural Networks, 12(4), 875-889. [CrossRef]
- Li, X., Lin, L., Liu, Z., & Feng, Y. (2021). A Comparative Study of LSTM and ARIMA Models for Stock Price Prediction. Journal of Applied Mathematics, 2021, 1-10.
- Zhang, Z., Zhao, H., Wang, X., & Liu, Y. (2020). A Comparative Study of Deep Learning Models for Exchange Rate Prediction. Mathematical Problems in Engineering, 2020, 1-15.
- Wang, H., Liu, Y., & Fan, Y. (2018). Deep learning for foreign exchange rate prediction using technical indicators and news articles. Expert Systems with Applications, 104, 33-44.
- Zhou, X., & Pei, J. (2019). A comparative study of LSTM with technical indicators for stock price movement prediction. Applied Soft Computing, 74, 238-248.
- Understanding LSTM networks. Understanding LSTM Networks -- colah’s blog. (n.d.). Retrieved March 16, 2023, from https://colah.github.io/posts/2015-08-Understanding-LSTMs/.
- Investopedia. (2021). Simple Moving Average (SMA). Retrieved March 25, 2023 from https://www.investopedia.com/terms/s/sma.asp.
- Investopedia. (2021). Exponential Moving Average (EMA). Retrieved March 25, 2023 from https://www.investopedia.com/terms/e/ema.asp.
- Bollinger, J. (2001). Bollinger on Bollinger Bands. McGraw-Hill Education.
- Investopedia. (2021). Bollinger Bands. Retrieved March 25, 2023 from https://www.investopedia.com/terms/b/bollingerbands.asp.
- Chande, T. S., & Kroll, S. (1994). The new technical trader: boost your profit by plugging into the latest indicators (Vol. 44). John Wiley & Sons Incorporated.
- CMT, M. N. K. (2009). Technical analysis plain and simple: Charting the markets in your language. FT Press.
- Murphy, J. J. (1999). Technical analysis of the financial markets: A comprehensive guide to trading methods and applications. Penguin.
Disclaimer/Publisher’s Note: The statements, opinions and data contained in all publications are solely those of the individual author(s) and contributor(s) and not of MDPI and/or the editor(s). MDPI and/or the editor(s) disclaim responsibility for any injury to people or property resulting from any ideas, methods, instructions or products referred to in the content. |
© 2024 by the authors. Licensee MDPI, Basel, Switzerland. This article is an open access article distributed under the terms and conditions of the Creative Commons Attribution (CC BY) license (http://creativecommons.org/licenses/by/4.0/).
Copyright: This open access article is published under a Creative Commons CC BY 4.0 license, which permit the free download, distribution, and reuse, provided that the author and preprint are cited in any reuse.


