Submitted:
09 August 2024
Posted:
13 August 2024
You are already at the latest version
Abstract
Background: Alzheimer's disease (AD) is a leading cause of dementia, significantly influenced by the Apolipoprotein E4 (APOE4) gene and gender. This study aims to use machine learning (ML) algorithms to predict brain age and assess AD risk by considering the effects of APOE4 genotype and gender.
Methods: We collected brain volumetric MRI data and medical records from 1100 cognitively unimpaired individuals and 602 AD patients. We applied three ML regression models—XGBoost, Random Forest (RF), and Linear Regression (LR)—to predict brain age. Additionally, we introduced two novel metrics, Brain Age Difference (BAD) and Integrated Difference (ID), to evaluate model performance and analyze the influence of APOE4 genotype and gender on brain aging.
Results: AD patients displayed significantly older brain ages compared to their chronological ages, with BADs ranging from 6.5 to 10 years. The RF model outperformed both XGBoost and LR in terms of accuracy, delivering higher ID values and more precise predictions. Comparing APOE4 carriers with non-carriers, the models showed enhanced ID values and consistent brain age predictions, improving overall performance. Gender-specific analyses indicated slight enhancements, with models performing equally well on both genders. It indicates that APOE4 may be a more robust predictor of brain age than gender.
Conclusion: Robust ML models for brain age prediction can be pivotal in the early detection of AD risk via MRI brain structural imaging, especially for APOE4 carriers. Such early identification may facilitate timely preventive interventions for AD.
Keywords:
MRI
; Alzheimer's disease
; Machine learning
; Brain age prediction
; APOE4
1. Introduction
Alzheimer's disease (AD) is the most prevalent form of dementia, characterized by progressive cognitive decline and memory loss. Unlike normal brain atrophy associated with aging, AD involves an accelerated reduction in brain volume, particularly in the hippocampus, a region critical for memory and cognition [1,2,3,4,5,6]. Key indicators include the Apolipoprotein E4 (APOE4) gene, the primary genetic risk factor for AD, and gender disparities, with women having a higher risk than men [7,8]. These factors contribute to more pronounced atrophy in specific brain regions for APOE4 carriers and manifest differently between sexes [1,2,8,9,10].
Early identification of accelerated brain aging is essential, as it may signal the onset of AD and enable timely interventions that could slow its progression. Magnetic Resonance Imaging (MRI) plays a crucial role by illustrating subtle brain structural changes, facilitating the early detection of AD risk and other neurodegenerative diseases [9,11,12]. The potential of MRI to predict "brain age"—a possible indicator of increased AD risk—remains underexplored. This study aims to bridge this knowledge gap by exploring the effectiveness of patient-specific training while implementing new statistical tools for model selection and assessment.
The study has two primary objectives: first, to develop machine learning (ML) algorithms capable of determining brain age versus chronological age, and second, to identify effective models and training procedures to stratify APOE4 genotype and gender effects for assessing AD risk. We hypothesize that (i) accelerated brain age can accurately indicate higher AD risk; (ii) MRI brain volume data can be used to estimate brain age; (iii) APOE4- and gender-specific training will improve predictions of brain age; and (iv) APOE4 carriers and females may experience more rapid brain volume reduction compared to APOE4 non-carriers and males.
Machine learning (ML)-driven algorithms have been widely used for predicting AD risk [13,14]. However, using ML to predict brain age is a relatively new approach. A recent study shows that ML-based Linear Regression (LR) was able to effectively predict the brain age for epilepsy [15]. In our research, we expanded on this by incorporating two additional regression models: XGBoost and Random Forest (RF). We compared their efficacy with LR in determining brain age from MRI volumetric data. This comparison led to the development of mathematical models that describe the predictive capabilities of these algorithms. We introduced two new metrics: 'brain age difference' (BAD) and 'integrated difference' (ID), enhancing the comparison of brain ages between healthy individuals and AD patients and providing insights into the progression of brain atrophy. These methods were applied to explore the influence of the APOE4 variant and gender on brain atrophy. Our goal is to identify the most precise and efficient ML model and training methods for AD detection, offering significant implications for future clinical applications.
2. Materials and Methods
2.1. Data
We obtained brain volumetric MRI data and medical information from National Alzheimer's Coordinating Center (NACC), a publicly available database [16]. The dataset we collected comprises a total of 1,702 participants, including 1,100 cognitively unimpaired (CU) individuals and 602 with Alzheimer's disease (AD) (Table 1). Both study groups were matched for age (CU: 76.1 ± 8.3 years; AD: 76.1 ± 8.5 years; p = 0.93). Differences were observed in educational attainment, with the CU group having a higher level of education on average. Additionally, a greater proportion of females was noted in the CU group. Importantly, the two groups showed significant differences in the presence of the ε4 allele of the apolipoprotein E (APOE ε4), a major genetic risk factor for Alzheimer's disease [7,13,17,18]. Participants in the AD group were notably more likely to carry the APOE ε4 allele compared to those in the CU group.
The brain volumetric data revealed significant differences in several key brain regions affecting cognitive function, with AD patients exhibiting significantly lower values compared to CU participants (Table 2). We utilized this data for machine learning (ML) training to determine brain age differences that may predict AD risk in aging individuals.
2.2. Architecture and Training Procedure
We used three distinct ML regression models for brain age prediction: Extreme Gradient Boosting (XGBoost), Random Forest (RF), and a simple linear regression (LR) for comparative purposes. For optimizing model parameters, we implemented a cross-validated grid search algorithm specifically for XGBoost and RF. Figure 1 illustrates the overall architecture and training workflow. Initially, all three models undergo identical preliminary steps to generate predictive data. Prior to training, the CU dataset is divided into training and testing subsets. The training subset is used to train each model, which is subsequently applied to AD patient datasets and CU testing subset to predict patients’ brain age. For trials focusing on the APOE ε4 allele and gender differences, we employed three varied training procedures, each modifying the composition of the CU training group.
We introduced a novel metric, Brain Age Difference (BAD), to assess the degree which a model estimates AD individuals to be older than CU individuals. To calculate a model’s BAD, we first established the lines of best fit (LOBF) that characterize the prediction distribution for the model predicted ages predicted of the CU and AD groups. We then integrated the area between these LOBFs across the target population's age range and divided this integral by the age range to derive the BAD, as depicted in Equation (1).
Describing the separation between CU and AD groups, a large BAD is attributed to an effective diagnostic model. For a single individual, their BAD would be the difference between their model predicted age and the normal model predicted age for a CU individual the same age, with higher BADs indicating higher AD risk. The uneven age-distribution within the target region led us to calculate a model’s BAD using Equation (1) instead of simply averaging the individuals BADs so that the higher concentration of individuals on the upper age limit of the target region wouldn’t dominate the calculation of a models’ BAD. A model with a higher BAD indicates larger AD risk when tested on AD diagnosed patients.
Despite its utility, BAD is only a baseline value which does not gauge a model’s precision. To complement this, we introduced the Integrated Difference (ID) values, a novel statistical method that provides a measure of precision, as outlined in Equation (2).
For ID, we first utilize the standard deviation of distribution of model predictions about the LOBF. The STD is used to construct normal probability distribution functions (PDFs) describing the behavior of CU and AD predictions, as displayed in Figure 2. We then calculated the absolute difference between these PDFs and normalized the result, yielding a value that reflects the degree of overlap between the two distributions. The ID value ranges from 0 to 1, where a value of 0 indicates two identical prediction PDFs, and a value of 1 represents completely distinct distributions with no overlap. A model with an ID value of 1 would theoretically predict an individual’s mental health status with perfect accuracy. Conversely, an ID value of 0 would be found for a model with no ability to distinguish between CU and AD individuals. Capturing the probabilistic nature of ML predictions, ID comprehensively describes the clinical applicability of a model and was used as the primary metric for model evaluation through this study.
3. Results
3.1. All Subjects Model Performance
Figure 3 presents the Brain Estimate Age versus Chronological Age results from all subjects, including the 1100 CU individuals and 602 AD patients. The black dashed line represents the regression line between each individual’s chronological age and their estimated brain age. Data points above this line indicate an older brain age relative to chronological age, and points below indicate a younger brain age. The LOBF for CU and AD are shown in blue and orange, repectively. The graph illustrates that AD patients typically exhibit significantly older brain ages compared to CU individuals between 55 to 75 years of age, with BADs of 6.5-10 years seperating the two groups. These highlighting accelerated brain aging in AD patients relative to their chronological age.
Our analysis reveals that the models progressively lose their ability to effectively differentiate between AD and CU individuals with age. The BAD steadily decreases with age before becoming negative as the model begins to predict lower ages for AD individuals than CU individuals at at 80-85 years old.This suggests that models become less capable of discerning differences from MRI brain imaging at higher ages, regardless of the individual's health status. Given that our goal is to develop tools for the early detection of AD, this limitation is not critical for evaluating individuals within the primary target group, aged 55 to 75. To more precisely assess the model's performance in this targeted age range, we conducted tests using various models on individuals within this demographic.
3.2. Comparions between the Three ML Models
We first compared the three models: RF, XGBoost and LR. The BAD, ID value and STD of the CU and AD prediction distributions are shown in Table 3, with the STDs being calculated about each distributions respective LOBF. We found that ID values of RF (0.762) and XGBoost (0.75) were far larger than that of Linear Regression (0.604), indicating clearer separation between CU and AD distributions using RF and XGBoost. The corresponding scatter plots are shown in Figure 4—LR had the largest variation on age predictions while RF returned the lowest prediction STD. Despite RFs generating smaller BAD, its tighter distributions led it to generate the highest ID values of the three Models.
ID values were further examined over smaller four-year increments (Table 4). These incremental ID values showed XGBoost scoring marginally better at the lower ends of the target region while RF scored significantly higher ID values at ages where the number of tested individuals was most concentrated. With the highest ID values and degree of precision, we concluded that RF to be the best model for AD indication and proceeded with RF throughout the rest of the study.
3.3. APOE4 Comparison
3.3.1. APOE4-Stratified Model Compositions
We stratified the dataset based on APOE4 status and applied five different training models to test the effect APOE4 and genotype-specific training on model performance (Table 5). The data was first split as described in section 2.2 before being further split as described below.
Model A (E4-specific): trained with 100% E4-carriers (N= 280) dataset and tested exclusively on E4-carriers.
Model B (E4-specific): trained with 100% E4 non-carriers (N= 599) dataset and tested exclusively on E4-NCs.
Model C (Mixed): trained with mixed dataset of E4-carriers and NCs (E4-carrier: N=280, E4-NC: N= 599) and tested over both the E4-carrier and E4-NC groups.
Model D (Mixed-Condensed): trained with an evenly mixed dataset of E4-carriers and NCs (E4-carrier: N=140, E4-NC: N= 140), matched in sized to Model A to examine the effects of specific training. Tested exclusively on E4-carriers.
Model E (Mixed-Condensed): trained with evenly mixed dataset of E4-carriers and NCs (E4-carrier; N=280, E4-NC; N= 319), matched in sized to Model B to directly examine the effects of specific training. Tested exclusively on E4-NCs.
The desired 50-50 ratio of E4-carriers to E4-NCs was not possible for this Model E. Model E was created to match Model B number of individuals in the training set (N=599), however there were too few E4-carriers (N=280) to compose half of the training group.
3.3.2. APOE4-Stratified Model Oucomes
Table 6 shows the testing outcomes. We found that Model C delivered the highest performance on both E4-carriers and E4-NCs, generating the highest ID values and BADs. This result was expected as it was trained on the largest group of individuals.
Comparing the smaller models trained on equally sized datasets, Models A and B displayed significantly higher performance over models D and E. Models A and B generated higher BADs, ID values, with more minimally varying distributions, as displayed in Figure 5. These results demonstrate the significant advantage of APOE4-specific training utilized in models A and B over the mixed approach in C and D.
Genotype specific training lowered the STD of the CU distribution when trained and tested on E4-NCs. Conversely, E4-carrier specific training didn’t lower the STD about the CU distribution but lowered instead the AD distribution’s STD. This result could point to an underlying difference in the homogeneity in which brain atrophy and AD affects individuals based on their genotype.
E4-specific, General, and Condensed-Mixed training procedures all yielded better results when tested on E4-carriers, generating higher ID values and significantly lower STD about their LOBF. For patient specific training (A & B) and mixed-condensed models (D & E) the E4-tested Models A and D both scored ID values 0.17 and 0.39 higher than their E4-NC tested counterpart. Lastly, while most of the training data for the Model C was from E4-NCs, this model generated a larger ID for E4-carriers as well (0.789 to 0.787). Taken all together these results strongly support RF to be more effective at predicting AD for E4-carriers.
3.4. Gender Comparison
3.4.1. Gender-Stratified Model Compositions
To similarly compare the effects of gender on model performance we stratified our training set into 5 different groups A-E by gender, the composition of each group displayed in Table 7.
Model A (Female-specific) trained with 100% E4-carriers (N= 280) dataset and tested exclusively on E4-carriers.
Model B (Male-specific): trained with 100% E4 non-carriers (N= 599) dataset and tested exclusively on E4-NCs.
Model C (Mixed): trained with mixed dataset of Males and Females (E4-carrier: N=280, E4-NC: N= 599) and tested over both the E4-carrier and E4-NC groups.
Model D (Mixed-Condensed): trained with an evenly mixed dataset of E4-carriers and NCs (E4-carrier: N=140, E4-NC: N= 140), matched in total size to Model A to examine the effects of specific training. Tested exclusively on E4-carriers.
Model E (Mixed-Condensed): trained with evenly mixed dataset of E4-carriers and NCs (E4-carrier; N=280, E4-NC; N= 319), matched in total size to Model B to directly examine the effects of specific training. Tested exclusively on E4-NCs.
3.4.2. Gender-Stratified Model Outcomes
Training outcomes are shown in Table 8. The highest ID values came again from Model C trained on the largest dataset. Gender appeared to be a far less significant factor on model performance. Gender-Specific groups A and B did outperform the Condensed-Mixed groups D and E, however, the Gender-specific training showed milder improvements than those seen in APOE4 specific training, only increasing ID values by 0.01.
We found that each training method generated higher ID values when tested on females. Testing on females returned only a minor increase in ID values by 0.003 for Gender-Specific Models (A & B) and Mixed-Condensed Models (D & E). The Increase in ID values when testing the general Model C was similarly minor, only 0.006. These modest increases in ID values for female tested models could be explained by larger training sets.
Unlike the APOE4-trail there was no significant disparity in BAD except for between Mixed-Condensed Models (D&E) with a 0.7-year difference.
While Gender-specific training did show performance improvements, it improved model performance to a lesser degree compared to APOE4-specific training. This result supports APOE genotype to be a more impactful risk factor than gender.
4. Discussion
In this study, we used ML algorithms to predict brain age and assess AD risk, with four key findings. First, AD patients exhibited significantly older brain ages compared to CU individuals, with BAD ranging from 6.5 to 10 years, indicating accelerated brain aging. Second, we compared the performance of three ML algorithms: LR, XGBoost, and RF. Unlike previous studies that used LR to predict brain age [15], our results revealed that RF consistently outperformed both XGBoost and LR by generating tighter predictive distributions and higher Integrated Difference (ID) values. Third, models trained with APOE4 data showed enhanced performance for APOE4 carriers compared to non-carriers, with higher ID values and more consistent brain age predictions. APOE4-specific models (Models A & B) outperformed those trained on mixed training groups (Models D and E), demonstrating the benefits of patient-specific training. While training on the entire dataset (Model C) yielded the best overall results, the advantages of patient-specific training are expected to increase with higher data availability, despite the reduced training dataset size. The improved effectiveness of models for APOE4 carriers underscores the clinical value of these methods for the most genetically at-risk population. Fourth, gender-specific training showed smaller performance improvements compared to APOE4-specific training. The results indicated little difference between male and female brain age predictions, suggesting that gender is a weaker risk factor and training condition compared to the APOE4 genotype.
A unique aspect of this study is the implementation of novel ID values, which allowed for a more effective assessment of the models’ predictive value. The probability density functions (PDFs) constructed to calculate the models’ ID values can be used in future work to determine the probability of an AD diagnosis, providing reliable statistics on the likelihood of AD at a given age. Additionally, ID values facilitated examining model performance over smaller ranges within the target region, revealing that different models returned lower ID values at various stages. This indicates that age-specific model selection for prediction could yield better clinical results. Future studies could benefit from patient-specific training and more sophisticated PDF derivations. The current method of PDF construction in this study assumes a static STD around the line of best fit (LOBF). Implementing a more dynamic calculation of PDFs could enhance model evaluation in future research.
The current study has a few limitations. Firstly, there is a gender imbalance in our data, with a larger proportion of females in the CU group and fewer females than males in the AD diagnosed group. This does not align with established trends, which indicate that women are at a higher risk of AD. This discrepancy is likely due to selection bias in the NACC data, which is compiled from various clinical trials. Secondly, our models became less effective at distinguishing brain age between AD and CU individuals over 80 years old. This could be attributed to the increased brain atrophy that naturally occurs in individuals over 80, reducing the models' effectiveness. Future studies may aim for balanced gender distribution and develop age-specific models to improve accuracy.
Alzheimer’s disease is characterized by extracellular beta amyloid (Aβ) plaques (A), intraneuronal tau tangles (T), and neurodegeneration (N), referred as the A/T/N framework for AD biomarkers classification[19,20]. Brain volume atrophy assessed by MRI is a part of the "N" marker. Our current findings align with existing literature suggesting that "N" markers may be more effective in early prediction of Alzheimer's disease (AD) progression than "A" and "T" markers [21,22]. Early prediction and diagnosis can enable timely interventions for mitigating or preventing AD risk. For instance, animal models have shown that through either pharmacological or nutritional interventions such as mTOR inhibition, can protect against brain aging and reduce AD risk, particularly for APOE4 carriers and females [23,24,25,26,27,28,29,30,31]. By combining early prediction of brain age using machine learning with potential interventions, the risk of AD could be further mitigated and prevented.
In summary, the study's implications for future clinical settings are significant. MRI-based ML models, particularly RF, can be integrated into clinical practice to identify individuals at higher risk for AD earlier, enabling timely intervention and potentially slowing disease progression. The ability to predict brain age and stratify risk based on APOE4 genotype and gender can lead to more effective and personalized diagnostic and treatment plans. With increased data availability, individualized training can be utilized to continuously enhance model performance. Regular brain age assessments using ML models can monitor disease progression and the effectiveness of interventions over time. Overall, the study highlights the potential of MRI-based ML models in improving AD diagnosis and management, advocating for further research to refine these models and better understand the biological factors influencing brain aging.
Author Contributions
Conceptualization, C.W., S.K., X.X. and A-L.L; methodology, C.W. and X.X.; software, X.X., C.W.; formal analysis, C.W., and X.X.; resources, A-L.L.; data curation, S.K.; writing—original draft preparation, C.W.; writing—review and editing, A-L.L and C.W.; visualization, C.W. and X.X.; supervision, A-L.L.; project administration, A-L.L.; funding acquisition, A-L.L. All authors have read and agreed to the published version of the manuscript.
Funding
This research was funded by National Institute on Aging (NIA), grant number R01AG054459 to A-L.L. The NACC database is funded by NIA/NIH Grant U24 AG072122.
Data Availability Statement
Data used in this article were collected from the National Alzheimer’s Coordinating Center (NACC) database (https://Naccdata.Org/Requesting-Data/Data-Request-Process). Code used for models construction and Analysis available here: (CarterWo/MRI-data-analysis-for-AD-detection (github.com).
Conflicts of Interest
The authors declare no conflicts of interest.
References
- Svennerholm, L.; Boström, K.; Jungbjer, B. Changes in Weight and Compositions of Major Membrane Components of Human Brain during the Span of Adult Human Life of Swedes. Acta Neuropathol. (Berl.) 1997, 94, 345–352. [Google Scholar] [CrossRef]
- Jack, C.R.; Shiung, M.M.; Gunter, J.L.; O’Brien, P.C.; Weigand, S.D.; Knopman, D.S.; Boeve, B.F.; Ivnik, R.J.; Smith, G.E.; Cha, R.H.; et al. Comparison of Different MRI Brain Atrophy Rate Measures with Clinical Disease Progression in AD. Neurology 2004, 62, 591–600. [Google Scholar] [CrossRef] [PubMed]
- Chen, Z.J.; He, Y.; Rosa-Neto, P.; Gong, G.; Evans, A.C. Age-Related Alterations in the Modular Organization of Structural Cortical Network by Using Cortical Thickness from MRI. NeuroImage 2011, 56, 235–245. [Google Scholar] [CrossRef]
- Salat, D.H.; Lee, S.Y.; Van Der Kouwe, A.J.; Greve, D.N.; Fischl, B.; Rosas, H.D. Age-Associated Alterations in Cortical Gray and White Matter Signal Intensity and Gray to White Matter Contrast. NeuroImage 2009, 48, 21–28. [Google Scholar] [CrossRef]
- McGinnis, S.M.; Brickhouse, M.; Pascual, B.; Dickerson, B.C. Age-Related Changes in the Thickness of Cortical Zones in Humans. Brain Topogr. 2011, 24, 279–291. [Google Scholar] [CrossRef]
- Planche, V.; Manjon, J.V.; Mansencal, B.; Lanuza, E.; Tourdias, T.; Catheline, G.; Coupé, P. Structural Progression of Alzheimer’s Disease over Decades: The MRI Staging Scheme. Brain Commun. 2022, 4, fcac109. [Google Scholar] [CrossRef] [PubMed]
- Yanckello, L.M.; Hoffman, J.D.; Chang, Y.-H.; Lin, P.; Nehra, G.; Chlipala, G.; McCulloch, S.D.; Hammond, T.C.; Yackzan, A.T.; Lane, A.N.; et al. Apolipoprotein E Genotype-Dependent Nutrigenetic Effects to Prebiotic Inulin for Modulating Systemic Metabolism and Neuroprotection in Mice via Gut-Brain Axis. Nutr. Neurosci. 2022, 25, 1669–1679. [Google Scholar] [CrossRef]
- Ho, K.C.; Roessmann, U.; Straumfjord, J.V.; Monroe, G. Analysis of Brain Weight. I. Adult Brain Weight in Relation to Sex, Race, and Age. Arch. Pathol. Lab. Med. 1980, 104, 635–639. [Google Scholar] [PubMed]
- Takao, H.; Hayashi, N.; Ohtomo, K. A Longitudinal Study of Brain Volume Changes in Normal Aging. Eur. J. Radiol. 2012, 81, 2801–2804. [Google Scholar] [CrossRef]
- Peters, R. Ageing and the Brain. Postgrad. Med. J. 2006, 82, 84–88. [Google Scholar] [CrossRef]
- Murray, M.E.; Przybelski, S.A.; Lesnick, T.G.; Liesinger, A.M.; Spychalla, A.; Zhang, B.; Gunter, J.L.; Parisi, J.E.; Boeve, B.F.; Knopman, D.S.; et al. Early Alzheimer’s Disease Neuropathology Detected by Proton MR Spectroscopy. J. Neurosci. 2014, 34, 16247–16255. [Google Scholar] [CrossRef] [PubMed]
- Lemaitre, H.; Goldman, A.L.; Sambataro, F.; Verchinski, B.A.; Meyer-Lindenberg, A.; Weinberger, D.R.; Mattay, V.S. Normal Age-Related Brain Morphometric Changes: Nonuniformity across Cortical Thickness, Surface Area and Gray Matter Volume? Neurobiol. Aging 2012, 33, 617–e1. [Google Scholar] [CrossRef] [PubMed]
- Xing, X.; Rafique, M.U.; Liang, G.; Blanton, H.; Zhang, Y.; Wang, C.; Jacobs, N.; Lin, A.-L. Efficient Training on Alzheimer’s Disease Diagnosis with Learnable Weighted Pooling for 3D PET Brain Image Classification. Electronics 2023, 12, 467. [Google Scholar] [CrossRef]
- Xing, X.; Liang, G.; Zhang, Y.; Khanal, S.; Lin, A.-L.; Jacobs, N. Advit: Vision Transformer On Multi-Modality Pet Images For Alzheimer Disease Diagnosis. In Proceedings of the 2022 IEEE 19th International Symposium on Biomedical Imaging (ISBI); IEEE: Kolkata, India, March 28, 2022; pp. 1–4. [Google Scholar]
- Verma, G.; Jacob, Y.; Jha, M.; Morris, L.S.; Delman, B.N.; Marcuse, L.; Fields, M.; Balchandani, P. Quantification of Brain Age Using High-Resolution 7 Tesla MR Imaging and Implications for Patients with Epilepsy. Epilepsy Behav. Rep. 2022, 18, 100530. [Google Scholar] [CrossRef]
- NACC Alzheimer’s Data. Available Online: Https://Naccdata.Org/Requesting-Data/Data-Request-Process.
- Lin, A.-L.; Parikh, I.; Yanckello, L.M.; White, R.S.; Hartz, A.M.S.; Taylor, C.E.; McCulloch, S.D.; Thalman, S.W.; Xia, M.; McCarty, K.; et al. APOE Genotype-Dependent Pharmacogenetic Responses to Rapamycin for Preventing Alzheimer’s Disease. Neurobiol. Dis. 2020, 139, 104834. [Google Scholar] [CrossRef] [PubMed]
- Hammond, T.C.; Xing, X.; Yanckello, L.M.; Stromberg, A.; Chang, Y.-H.; Nelson, P.T.; Lin, A.-L. Human Gray and White Matter Metabolomics to Differentiate APOE and Stage Dependent Changes in Alzheimer’s Disease. J. Cell. Immunol. 2021, 3, 397–412. [Google Scholar] [CrossRef] [PubMed]
- Jack, C.R.; Bennett, D.A.; Blennow, K.; Carrillo, M.C.; Feldman, H.H.; Frisoni, G.B.; Hampel, H.; Jagust, W.J.; Johnson, K.A.; Knopman, D.S.; et al. A/T/N: An Unbiased Descriptive Classification Scheme for Alzheimer Disease Biomarkers. Neurology 2016, 87, 539–547. [Google Scholar] [CrossRef]
- Jack, C.R.; Bennett, D.A.; Blennow, K.; Carrillo, M.C.; Dunn, B.; Haeberlein, S.B.; Holtzman, D.M.; Jagust, W.; Jessen, F.; Karlawish, J.; et al. NIA-AA Research Framework: Toward a Biological Definition of Alzheimer’s Disease. Alzheimers Dement. 2018, 14, 535–562. [Google Scholar] [CrossRef] [PubMed]
- Hammond, T.C.; Lin, A.-L. Glucose Metabolism Is a Better Marker for Predicting Clinical Alzheimer’s Disease than Amyloid or Tau. J. Cell. Immunol. 2022, 4, 15–18. [Google Scholar]
- Hammond, T.C.; Xing, X.; Wang, C.; Ma, D.; Nho, K.; Crane, P.K.; Elahi, F.; Ziegler, D.A.; Liang, G.; Cheng, Q.; et al. β-Amyloid and Tau Drive Early Alzheimer’s Disease Decline While Glucose Hypometabolism Drives Late Decline. Commun. Biol. 2020, 3, 352. [Google Scholar] [CrossRef]
- Sanganahalli, B.G.; Mihailovic, J.M.; Vekaria, H.J.; Coman, D.; Yackzan, A.T.; Flemister, A.; Aware, C.; Wenger, K.; Hubbard, W.B.; Sullivan, P.G.; et al. mTOR Inhibition Enhances Synaptic and Mitochondrial Function in Alzheimer’s Disease in an APOE Genotype-Dependent Manner. J. Cereb. Blood Flow Metab. Off. J. Int. Soc. Cereb. Blood Flow Metab. 2024, 271678X241261942. [Google Scholar] [CrossRef] [PubMed]
- Lin, A.-L.; Parikh, I.; Yanckello, L.M.; White, R.S.; Hartz, A.M.S.; Taylor, C.E.; McCulloch, S.D.; Thalman, S.W.; Xia, M.; McCarty, K.; et al. APOE Genotype-Dependent Pharmacogenetic Responses to Rapamycin for Preventing Alzheimer’s Disease. Neurobiol. Dis. 2020, 139, 104834. [Google Scholar] [CrossRef]
- Lee, J.; Yanckello, L.M.; Ma, D.; Hoffman, J.D.; Parikh, I.; Thalman, S.; Bauer, B.; Hartz, A.M.S.; Hyder, F.; Lin, A.-L. Neuroimaging Biomarkers of mTOR Inhibition on Vascular and Metabolic Functions in Aging Brain and Alzheimer’s Disease. Front. Aging Neurosci. 2018, 10, 225. [Google Scholar] [CrossRef] [PubMed]
- Ma, D.; Wang, A.C.; Parikh, I.; Green, S.J.; Hoffman, J.D.; Chlipala, G.; Murphy, M.P.; Sokola, B.S.; Bauer, B.; Hartz, A.M.S.; et al. Ketogenic Diet Enhances Neurovascular Function with Altered Gut Microbiome in Young Healthy Mice. Sci. Rep. 2018, 8, 6670. [Google Scholar] [CrossRef] [PubMed]
- Lin, A.-L.; Jahrling, J.B.; Zhang, W.; DeRosa, N.; Bakshi, V.; Romero, P.; Galvan, V.; Richardson, A. Rapamycin Rescues Vascular, Metabolic and Learning Deficits in Apolipoprotein E4 Transgenic Mice with Pre-Symptomatic Alzheimer’s Disease. J. Cereb. Blood Flow Metab. Off. J. Int. Soc. Cereb. Blood Flow Metab. 2017, 37, 217–226. [Google Scholar] [CrossRef] [PubMed]
- Lin, A.-L.; Parikh, I.; Hoffman, J.D.; Ma, D. Neuroimaging Biomarkers of Caloric Restriction on Brain Metabolic and Vascular Functions. Curr. Nutr. Rep. 2017, 6, 41–48. [Google Scholar] [CrossRef] [PubMed]
- Chang, Y.-H.; Yanckello, L.M.; Chlipala, G.E.; Green, S.J.; Aware, C.; Runge, A.; Xing, X.; Chen, A.; Wenger, K.; Flemister, A.; et al. Prebiotic Inulin Enhances Gut Microbial Metabolism and Anti-Inflammation in Apolipoprotein E4 Mice with Sex-Specific Implications. Sci. Rep. 2023, 13, 15116. [Google Scholar] [CrossRef] [PubMed]
- Parikh, I.; Guo, J.; Chuang, K.-H.; Zhong, Y.; Rempe, R.G.; Hoffman, J.D.; Armstrong, R.; Bauer, B.; Hartz, A.M.S.; Lin, A.-L. Caloric Restriction Preserves Memory and Reduces Anxiety of Aging Mice with Early Enhancement of Neurovascular Functions. Aging 2016, 8, 2814–2826. [Google Scholar] [CrossRef]
- Lin, A.-L.; Zhang, W.; Gao, X.; Watts, L. Caloric Restriction Increases Ketone Bodies Metabolism and Preserves Blood Flow in Aging Brain. Neurobiol. Aging 2015, 36, 2296–2303. [Google Scholar] [CrossRef]
Figure 1.
Workflow and data splitting for XGBoost model.
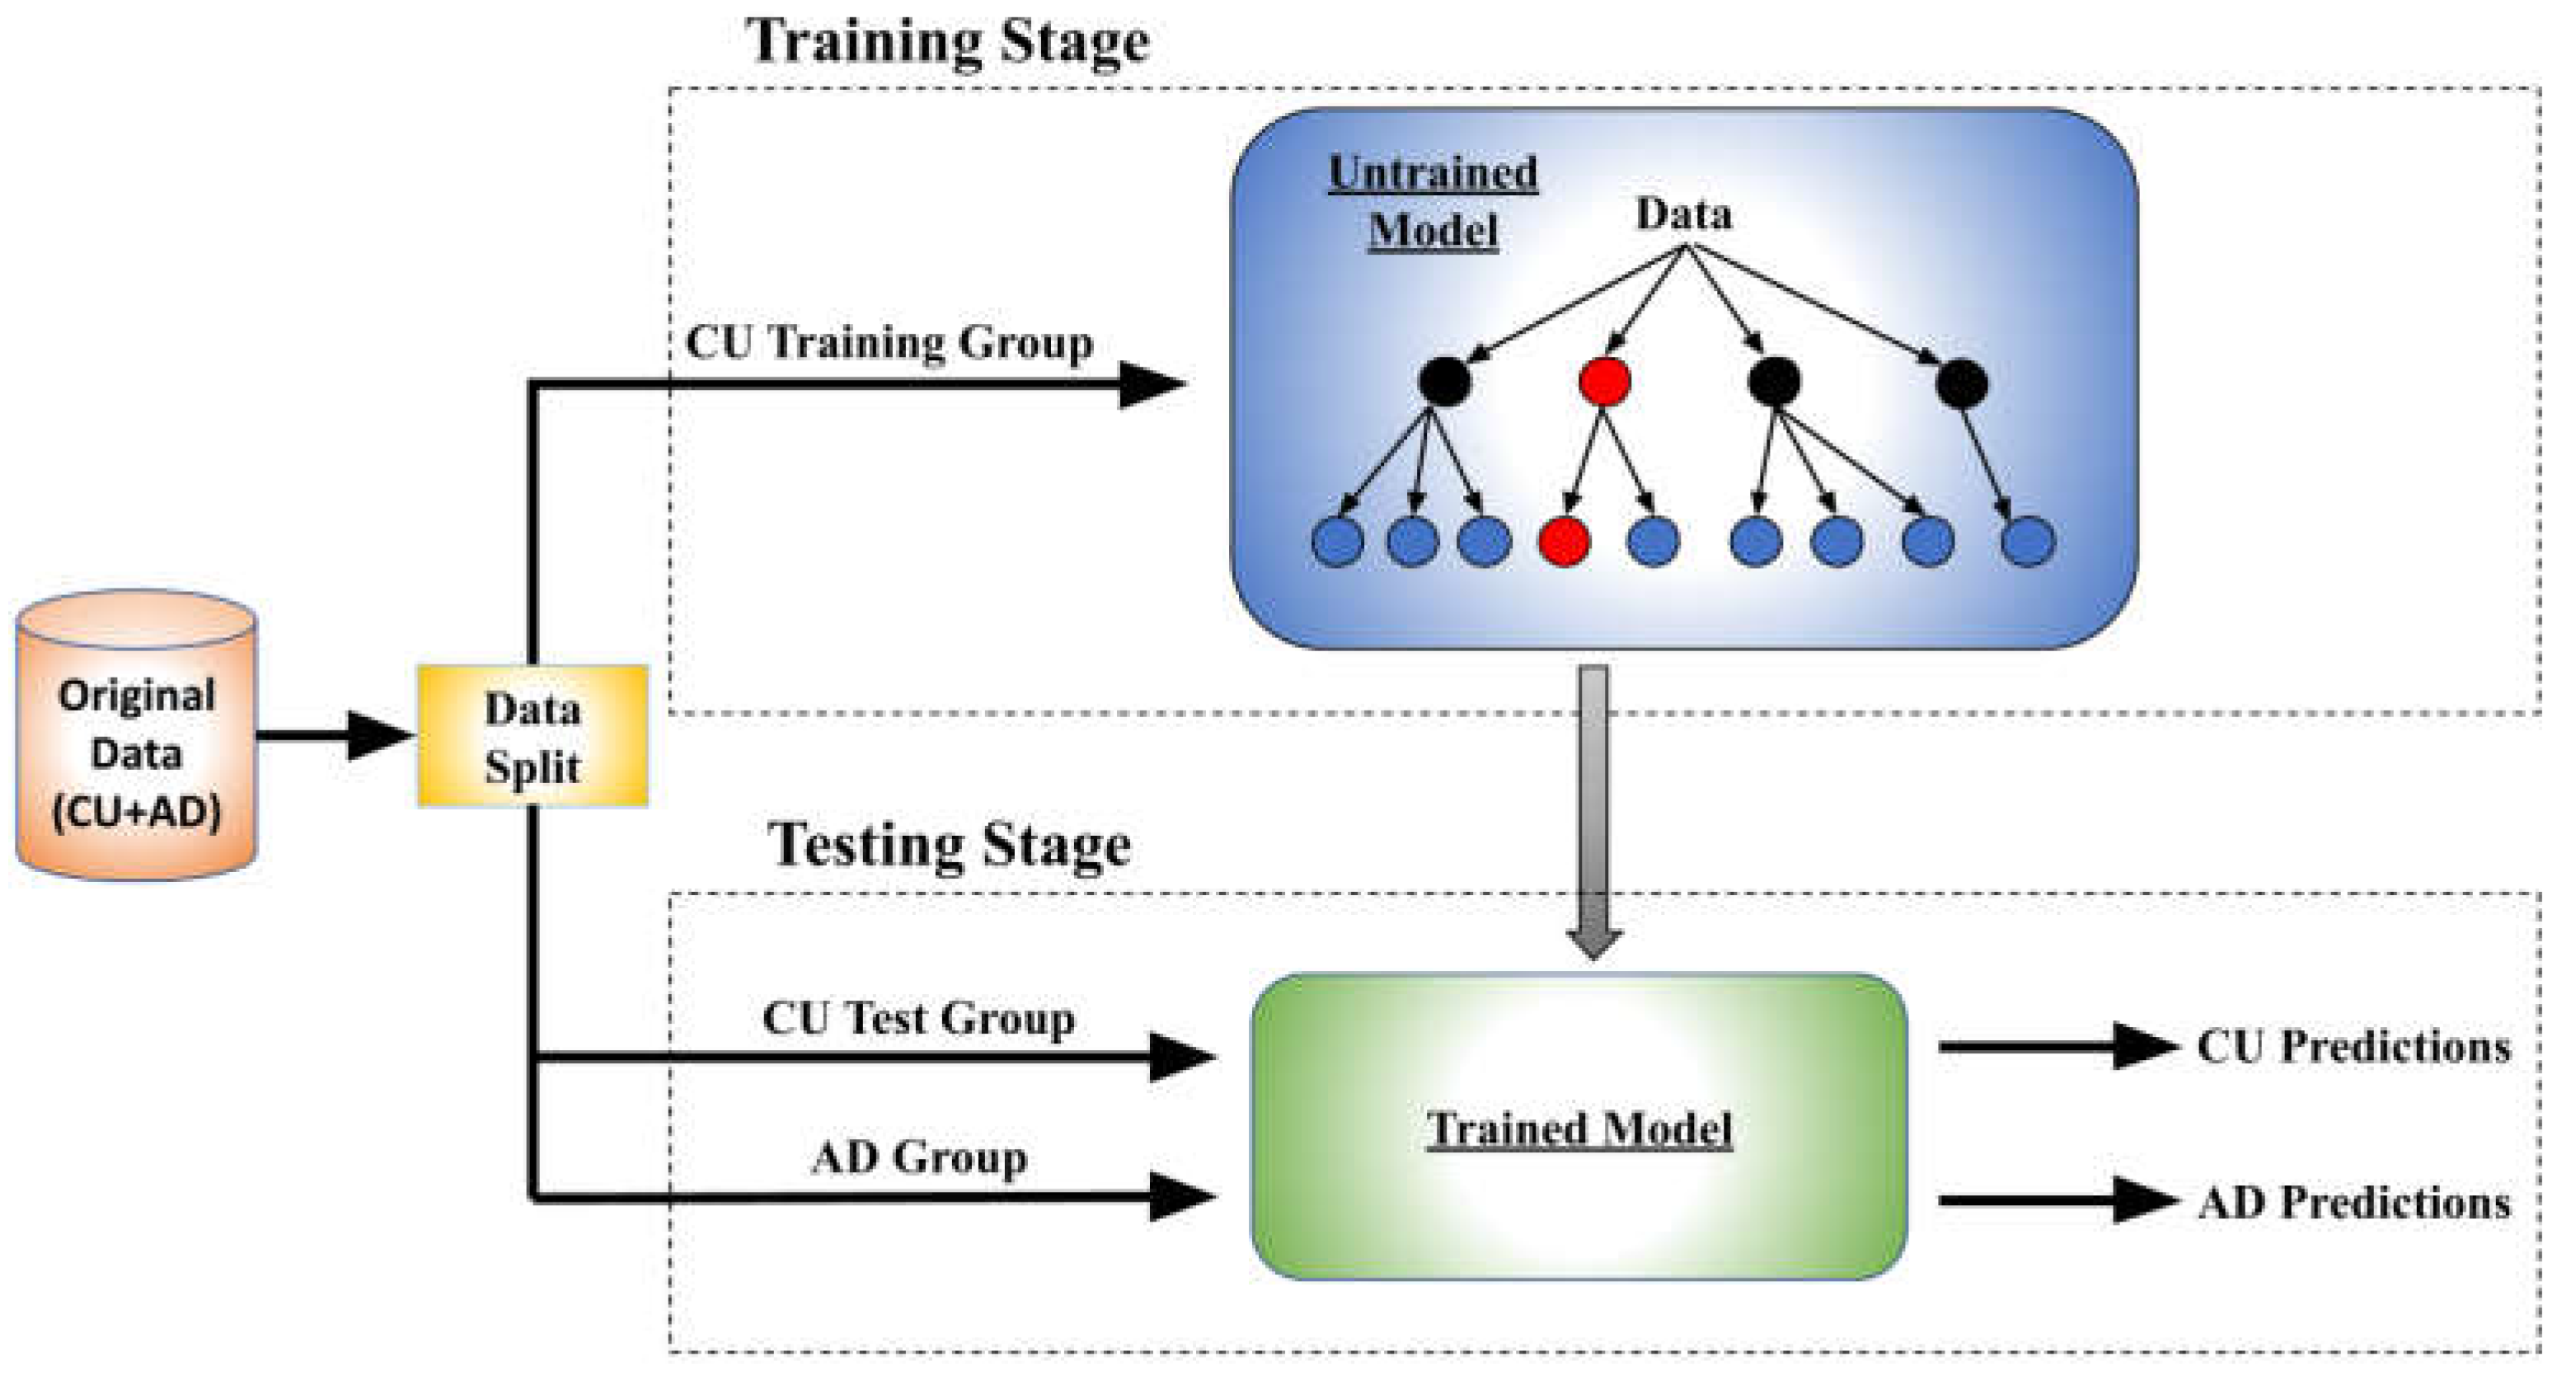
Figure 2.
Displays probability distribution functions (PDF) modeled to ref CU and AD prediction distribution. (a) The PDF of age predictions for CU individuals. (b) The PDF of age predictions on AD patients. (c) The two PDFs overlaid together.
Figure 2.
Displays probability distribution functions (PDF) modeled to ref CU and AD prediction distribution. (a) The PDF of age predictions for CU individuals. (b) The PDF of age predictions on AD patients. (c) The two PDFs overlaid together.
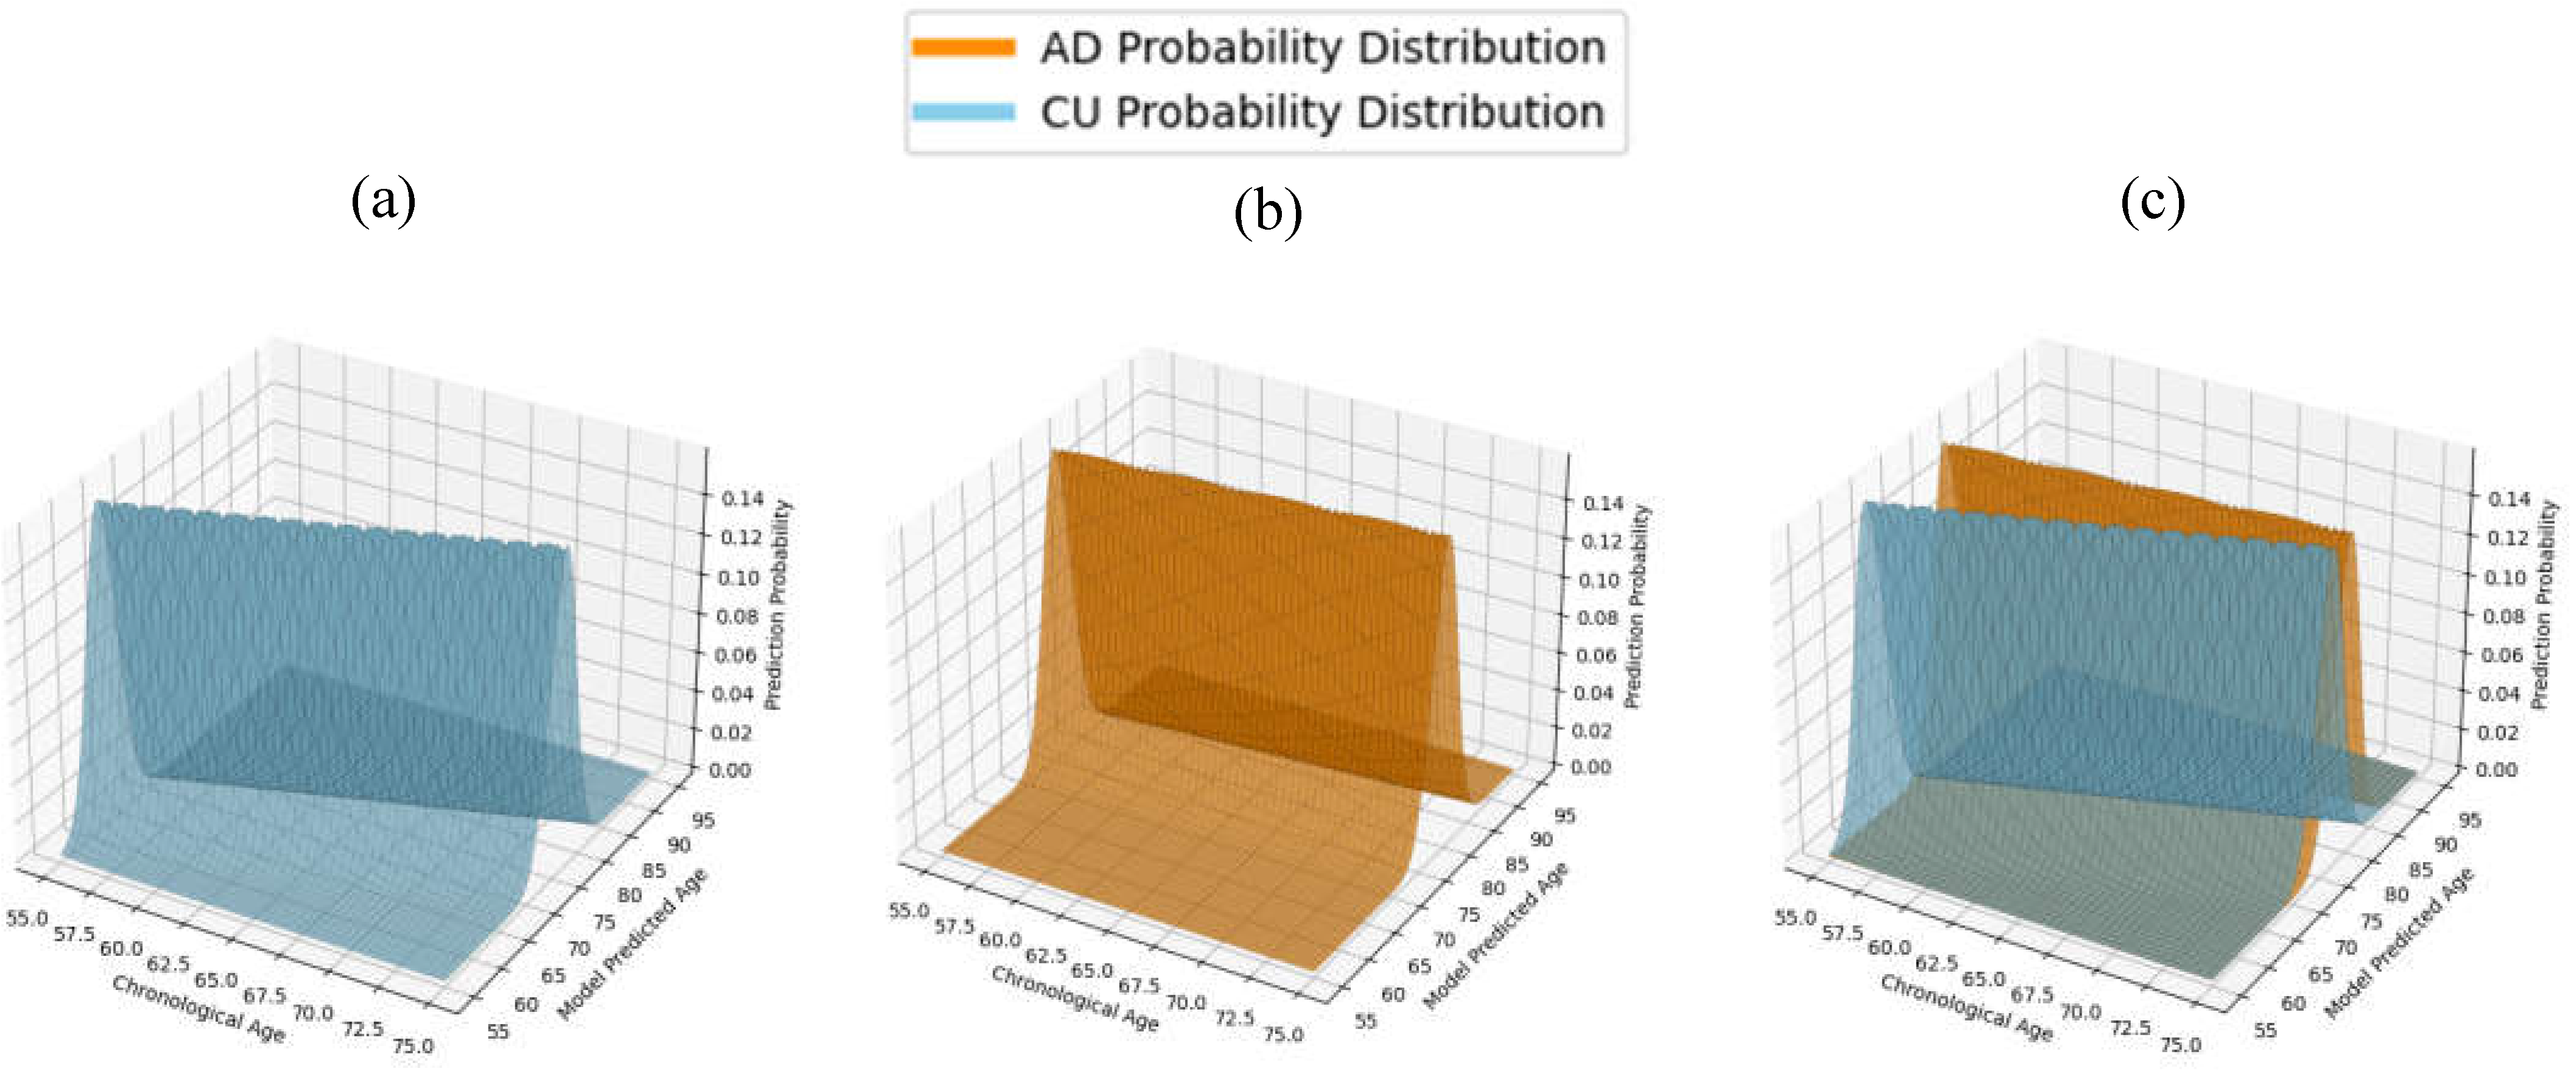
Figure 3.
Model Results when tested on full range age range of AD subjects. Individuals’ real chronological age is on the x-axis with their model generated age on the y-axis. The crossing of distribution LOBFs demonstrates the model’s deprecating ability to make meaningful predictions for AD subjects at higher ages.
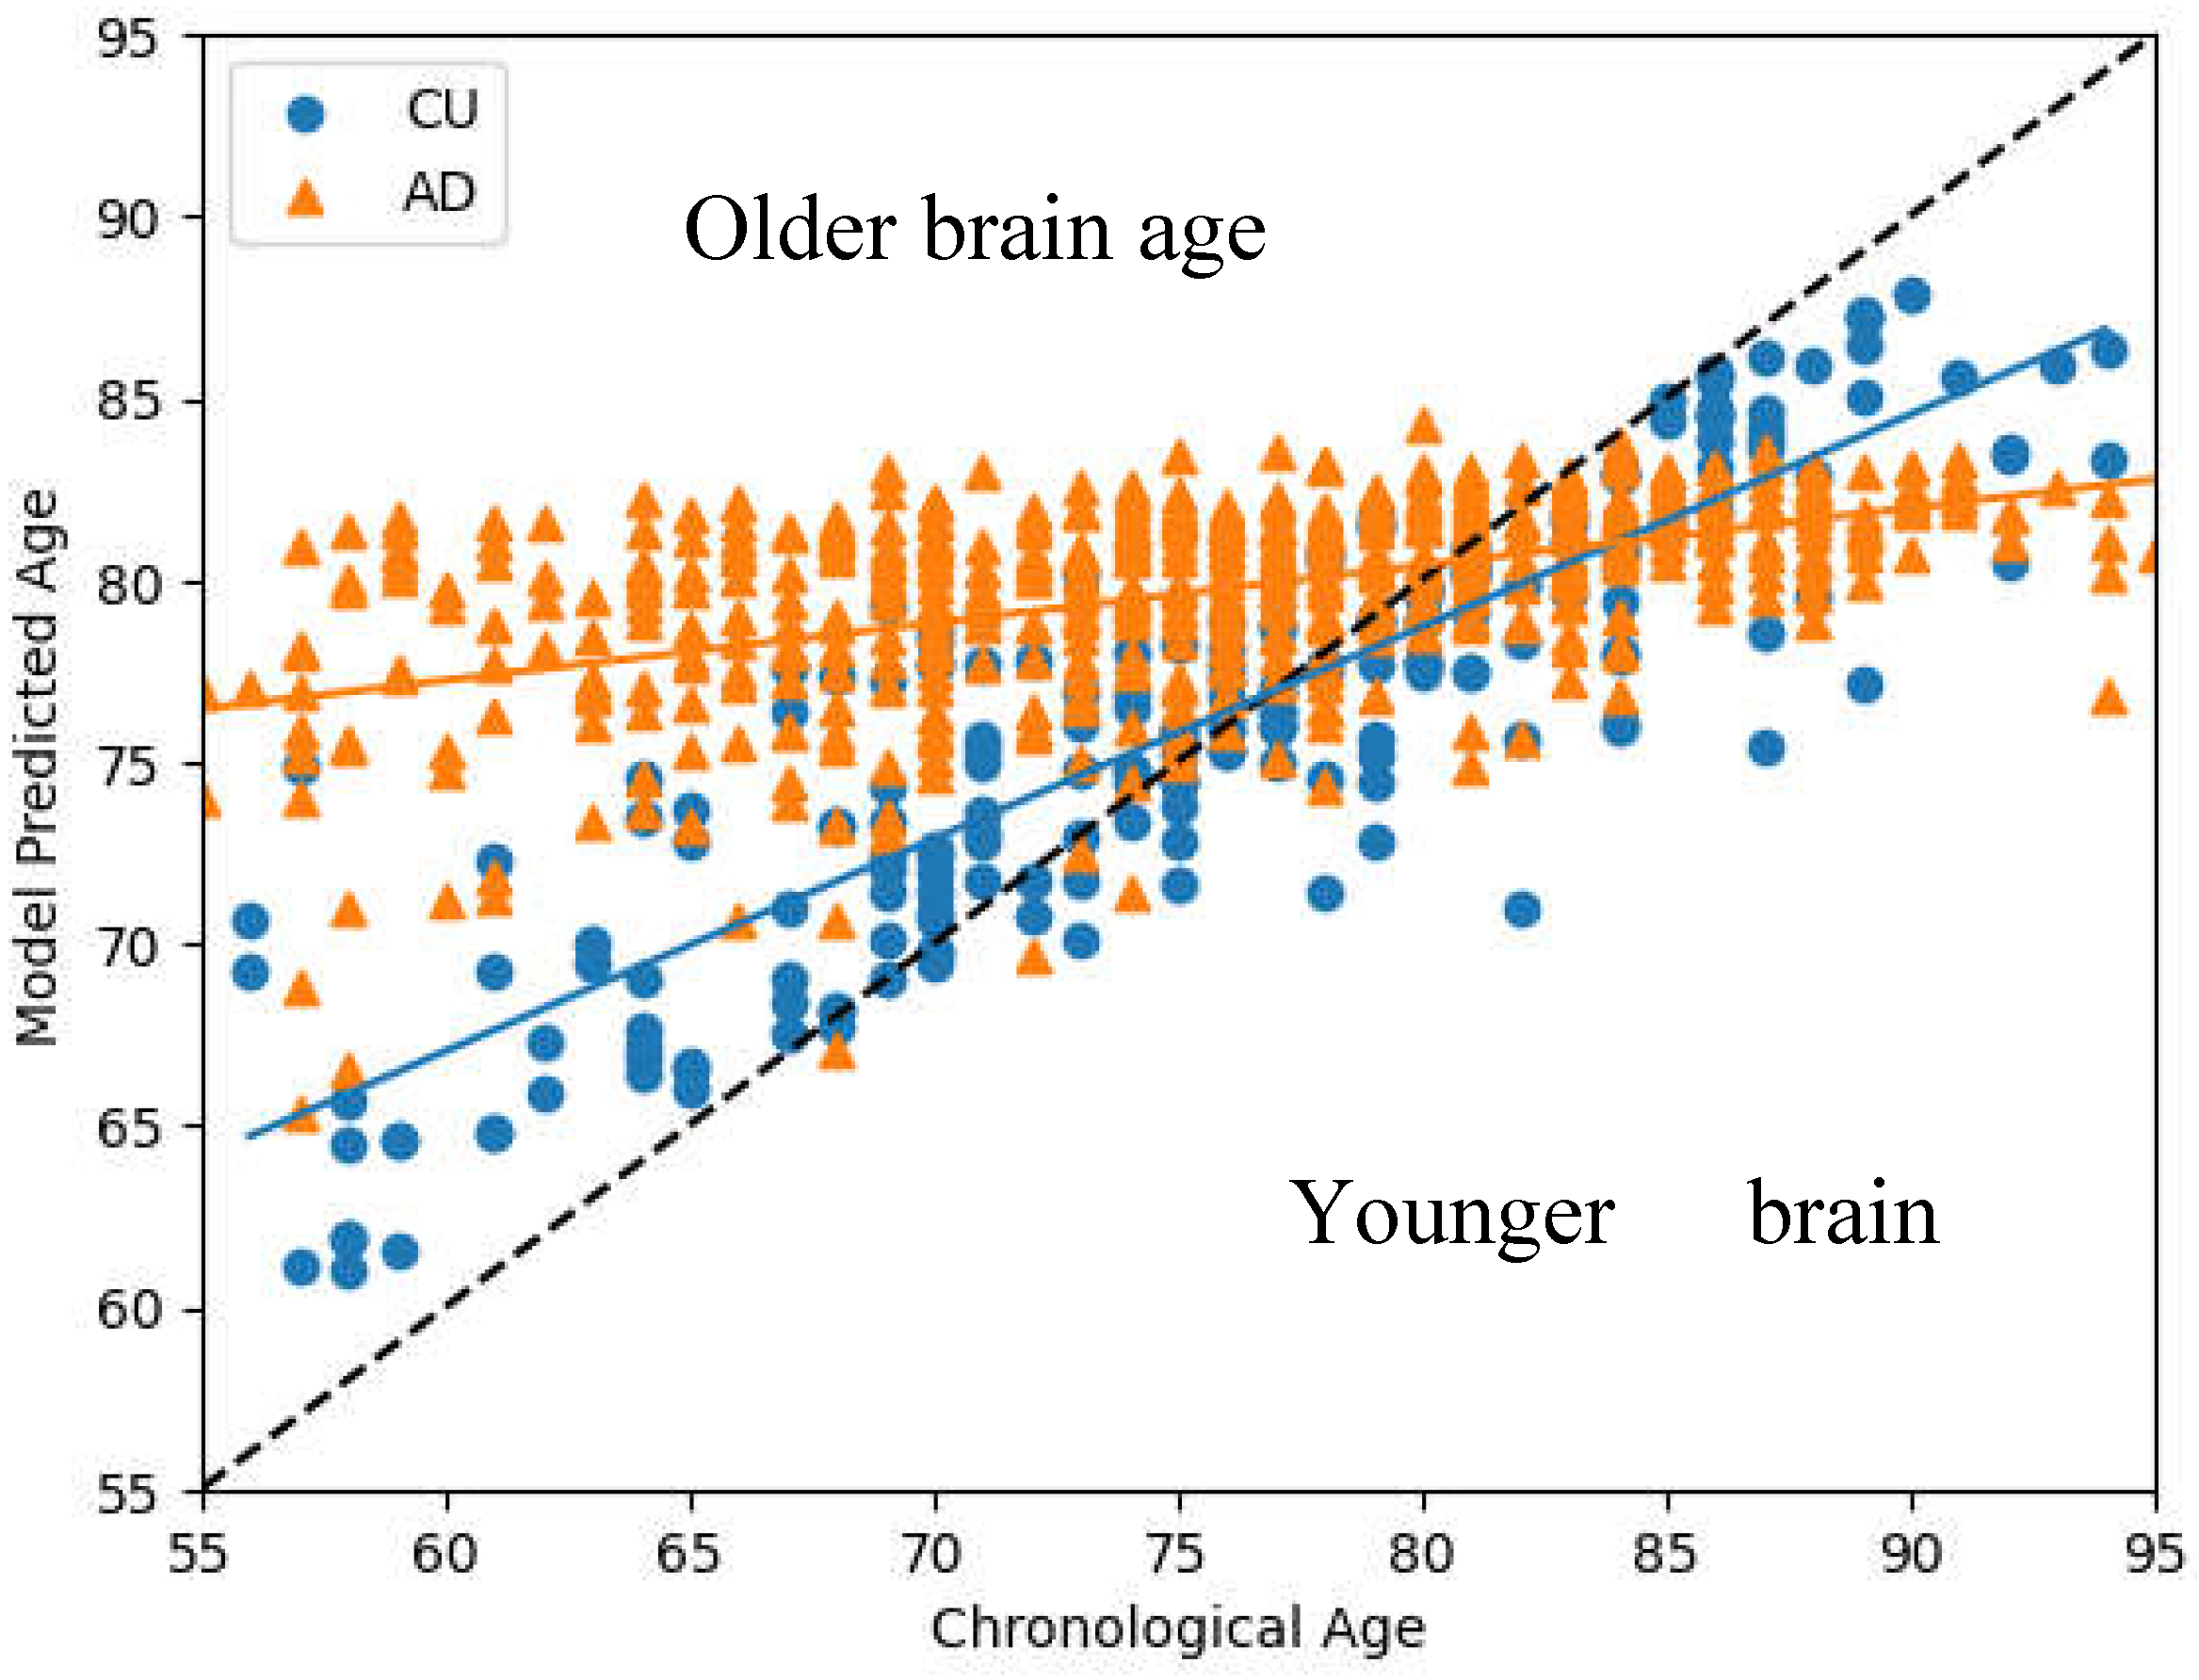
Figure 4.
Age prediction distributions of (a) Linear Regression (b) XGBoost’s (c) Random Forest. RF shows tighter predictive distributions around its LOBFs compared with LR and XGBoost.
Figure 4.
Age prediction distributions of (a) Linear Regression (b) XGBoost’s (c) Random Forest. RF shows tighter predictive distributions around its LOBFs compared with LR and XGBoost.
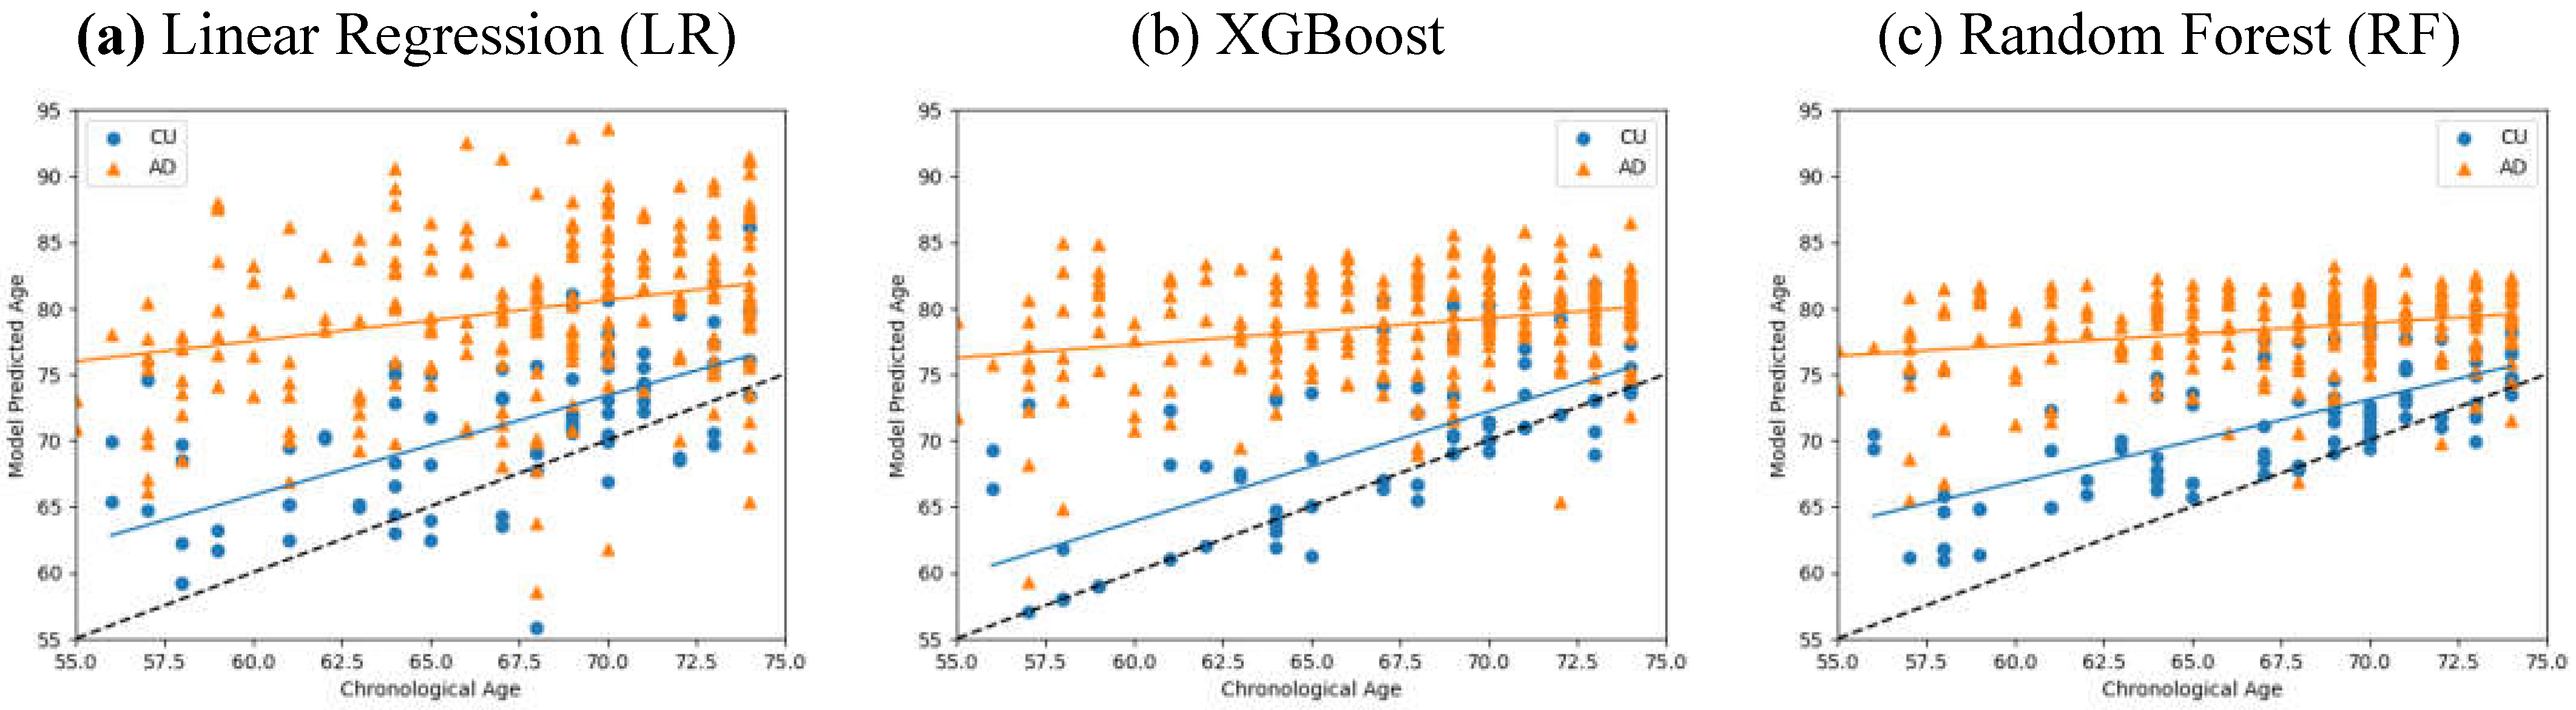
Figure 5.
Comparison of E4-specific training vs. condensed-mixed training. (a) E4-specific Model A tested on E4-carriers (b) Condensed-Mixed Model D tested on the same group of E4-carriers.
Figure 5.
Comparison of E4-specific training vs. condensed-mixed training. (a) E4-specific Model A tested on E4-carriers (b) Condensed-Mixed Model D tested on the same group of E4-carriers.
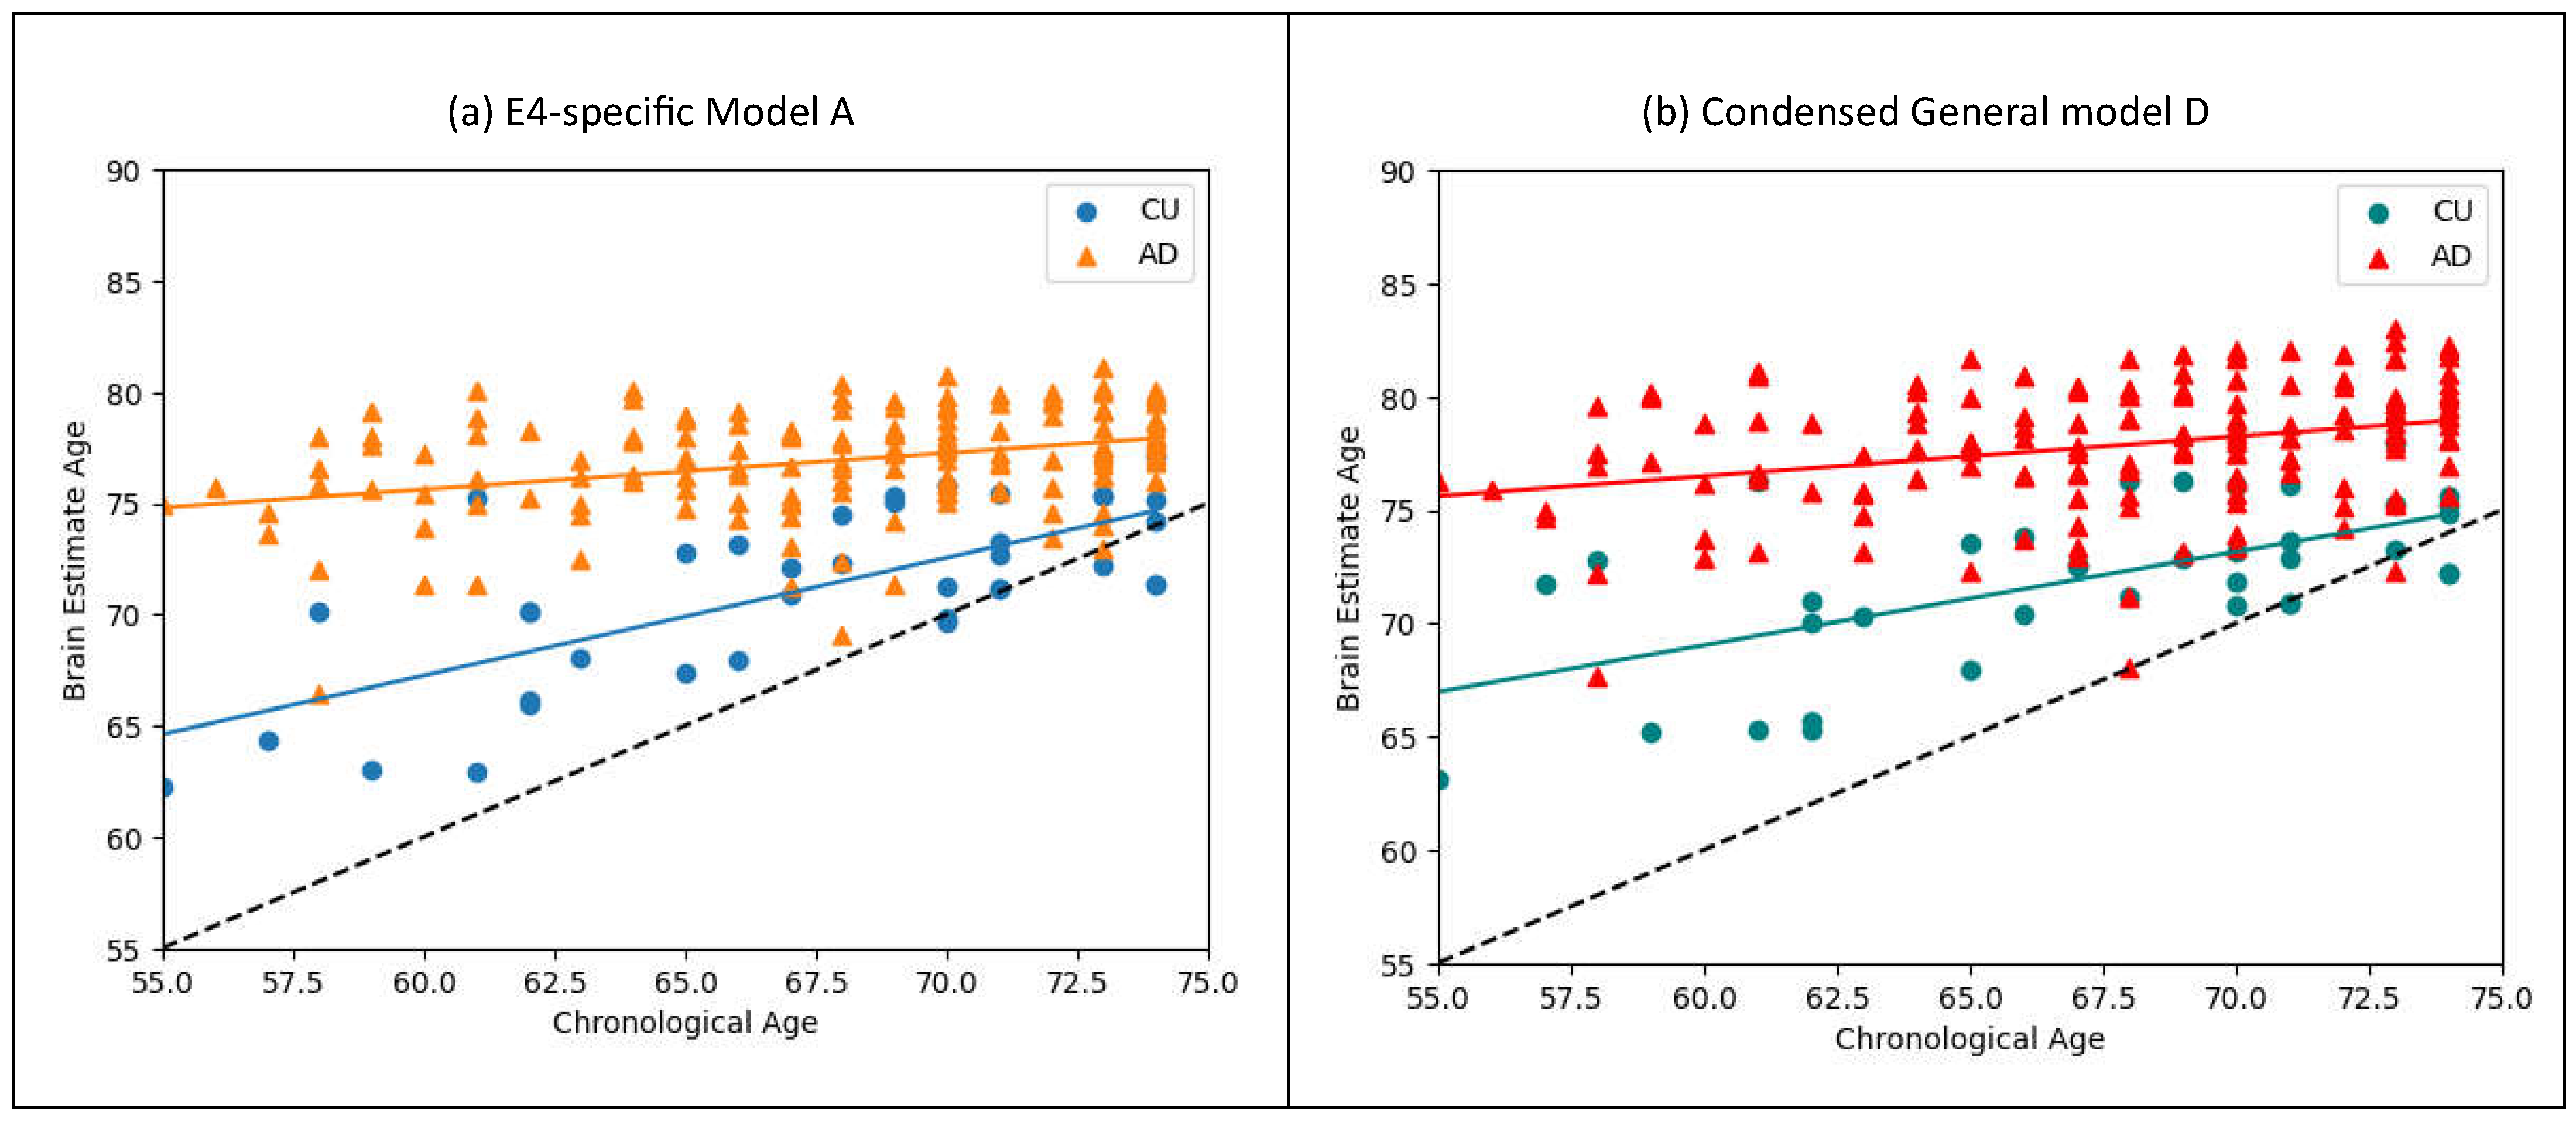

Table 1.
Subject Sampling results.
| Subject Characteristics | CU | AD | P-value |
|---|---|---|---|
| Number | 1100 | 602 | |
| APOE4 (% Carrier) | 32% | 58% | <0.001* |
| Age | 76.1±8.3 | 76.1±8.5 | 0.93 |
| Gender (% Female) | 64% | 47% | <0.001* |
| Education | 15.5±3.6 | 14.7±3.8 | <0.001* |
Table 2.
Most significant differences volumetric features.
| Feature Rank | Feature Description | CU (mean ± STD) |
AD (mean ± STD) |
P-Value |
|---|---|---|---|---|
| 1 | Right entorhinal mean cortical thickness (mm) | 3.76± 0.58 | 2.80± 0.86 | <0.001* |
| 2 | Left entorhinal mean cortical thickness (mm) | 3.56±0.62 | 2.73± 0.80 | <0.001* |
| 3 | Segmented total hippocampi volume (cc) | 6.28± 0.39 | 5.37± 1.00 | <0.001* |
| 4 | Segmented left hippocampus volume (cc) | 3.11± 0.30 | 2.63± 0.52 | <0.001* |
| 5 | Left isthmus cingulate mean cortical thickness (mm) | 2.30±0.30 | 1.97± 0.35 | <0.001* |
| 6 | Segmented right hippocampus volume (cc) | 3.19± 0.39 | 2.73± 0.53 | <0.001* |
| 7 | Right superior temporal mean cortical thickness (mm) | 2.23± 0.30 | 1.90 ± 0.30 | <0.001* |
| 8 | Right isthmus cingulate mean cortical thickness (mm) | 2.33± 0.31 | 2.00 ± 0.38 | <0.001* |
| 9 | Right fusiform mean cortical thickness (mm) | 2.56± 0.48 | 2.13 ± 0.42 | <0.001* |
| 10 | Left superior temporal mean cortical thickness (mm) | 2.12± 0.25 | 1.85 ± 0.33 | <0.001* |
Table 3.
Differentiation Metrics.
| Model type | BAD | CU (STD) | AD (STD) | ID |
|---|---|---|---|---|
| Linear Regression | 9.4 | 4.5 | 6.5 | 0.604 |
| XGBoost | 10.2 | 4.6 | 4.6 | 0.750 |
| Random Forest | 8.1 | 3.3 | 3.0 | 0.762 |
Table 4.
Limited range ID values.
| Years of age | 55-59 | 59-63 | 63-67 | 67-71 | 71-75 |
|---|---|---|---|---|---|
| Linear Regression ID | 0.764 | 0.695 | 0.614 | 0.522 | 0.422 |
| XGBoost ID | 0.940 | 0.884 | 0.792 | 0.657 | 0.477 |
| Random Forest ID | 0.938 | 0.883 | 0.799 | 0.676 | 0.512 |
Table 5.
Training group composition of APOE4 comparison.
| Training Group | Training Method | Total size | Training group makeup |
|---|---|---|---|
| A | E4-specific | 280 | 280 E4-carriers, 0 E4-NCs |
| B | E4-specific | 599 | 0 E4-carriers, 599 E4-NCs |
| C | Mixed | 879 | 280 E4-carriers, 599 E4-NCs |
| D | Mixed-Condensed | 280 | 140 E4-carriers, 140 E4-NCs |
| E | Mixed-Condensed | 599 | 280 E4-carriers, 319 E4-NCs |
Table 6.
Statistical measurements of model discrepancies.
| Training Group | Test group | BAD | CU (STD) | AD (STD) | ID |
|---|---|---|---|---|---|
| A | E4-carriers | 6.5 | 2.7 | 2.2 | 0.783 |
| B | E4-NCs | 8.2 | 2.7 | 3.2 | 0.766 |
| C | E4-carriers | 8.5 | 3.0 | 2.6 | 0.789 |
| C | E4-NCs | 8.4 | 2.7 | 3.4 | 0.787 |
| D | E4-carriers | 6.3 | 2.7 | 2.7 | 0.740 |
| E | E4-NCs | 7.5 | 3.2 | 3.2 | 0.701 |
Table 7.
Training group composition of Gender comparison.
| Training Group | Training Method | Total size | Training group makeup |
|---|---|---|---|
| A | Gender-Specific | 564 | 564 Females, 0 Males |
| B | Gender-Specific | 316 | 0 Females, 316 Males |
| C | Mixed | 880 | 564 Females, 316 Males |
| D | Condensed-Mixed | 564 | 282 Females, 282 Males |
| E | Condensed-Mixed | 316 | 158 Females, 158 Males |
Table 8.
Performance statistics of Random Forest.
| Training Group | Test group | BAD | CU (STD) | AD (STD) | ID |
|---|---|---|---|---|---|
| A | Female | 7.9 | 3.1 | 2.7 | 0.812 |
| B | Male | 7.9 | 2.9 | 2.9 | 0.809 |
| C | Female | 8.0 | 3.3 | 2.6 | 0.819 |
| C | Male | 8.1 | 2.5 | 2.9 | 0.813 |
| D | Female | 6.9 | 2.3 | 3.0 | 0.802 |
| E | Male | 7.6 | 2.7 | 3.0 | 0.799 |
Disclaimer/Publisher’s Note: The statements, opinions and data contained in all publications are solely those of the individual author(s) and contributor(s) and not of MDPI and/or the editor(s). MDPI and/or the editor(s) disclaim responsibility for any injury to people or property resulting from any ideas, methods, instructions or products referred to in the content. |
© 2024 by the authors. Licensee MDPI, Basel, Switzerland. This article is an open access article distributed under the terms and conditions of the Creative Commons Attribution (CC BY) license (http://creativecommons.org/licenses/by/4.0/).
Copyright: This open access article is published under a Creative Commons CC BY 4.0 license, which permit the free download, distribution, and reuse, provided that the author and preprint are cited in any reuse.


