Submitted:
10 August 2024
Posted:
12 August 2024
You are already at the latest version
Abstract
This paper investigates optimal maintenance strategies for centrifugal compressors with electrical motor drivers using a Weibull analysis approach combined with rank regression, Fisher matrix, and median ranks. By leveraging data from Oreda 6, the study proposes a methodology to establish baseline intervals for corrective, preventive, predictive, and proactive maintenance in the absence of comprehensive historical data. The analysis reveals key Weibull parameters, including shape and scale factors, and calculates reliability metrics such as the mean time to failure (MTTF) and mean remaining life (MRL). The results suggest effective maintenance intervals and highlight the utility of Weibull analysis in enhancing maintenance strategies. This approach offers a robust framework for optimizing maintenance practices, even with limited historical data.
Keywords:
Weibull Analysis
; Maintenance Optimization
; Rank Regression
; Fisher Matrix
; Reliability Engineering
1. Introduction
In industrial settings, determining optimal maintenance strategies for centrifugal compressors with electrical motor drivers is crucial for ensuring operational reliability and minimizing downtime [21]. Traditional methods rely heavily on historical maintenance data, which is often incomplete or unavailable, posing challenges for developing effective baseline strategies [1]. This paper explores an alternative approach by leveraging Weibull analysis, rank regression, the Fisher matrix, and median ranks to recommend maintenance intervals in the absence of comprehensive historical data [2]. By utilizing available resource data from Oreda 6, we propose a systematic method to establish baseline intervals for corrective, preventive, predictive, and proactive maintenance [3]. In my view, this approach offers a valuable framework for optimizing maintenance strategies even when historical data is sparse.
2. Materials and Methods
2.1. Materials
The study utilizes Oreda 6 Taxonomy 1.1.1.1, which provides detailed mean failure rate (FR) data for centrifugal compressors with electrical motor drivers, measured every 106 operating hours [1,14]. This data is converted into Mean Time Between Failures (MTBF), expressed in hours per year, by normalizing it with the 106-hour benchmark [4]. Subsequent calculations involve adapting this data for Weibull analysis to derive maintenance intervals [5]. This study expect to facilitate more accurate Weibull calculations, streamlining the process of optimizing maintenance strategies.
2.2. Software
The analysis in this study employs ReliaSoft Weibull++ software from HBK © 2024 Hottinger Bruel & Kjaer Inc, which is specialized for Weibull reliability analysis and life data modeling [8]. This software supports various statistical methods, including rank regression, Fisher matrix, and median rank, essential for evaluating the failure data [8,9,10]. This study believe that using this software simplifies and accelerates Weibull calculations, enhancing the efficiency of maintenance strategy optimization.
2.3. Analysis Methods
The analysis employs rank regression on X, where data pairs (x1,y1), (x2,y2),...,(xn,yn) are plotted, and the best-fitting straight line is determined by minimizing the horizontal distances between data points and the fitted line, according to the least squares principle [8]. This method yields a straight line x=a+by that best represents the relationship between variables [8]. By focusing on the vertical deviations rather than the horizontal, rank regression is robust to outliers and can handle non-normal distributions effectively [11]. This study believe that using this analysis method enhances robustness in parameter estimation and provides reliable results despite data irregularities. Rank Regression Equations on X © 2024 Hottinger Bruel & Kjaer Inc, as follows [8].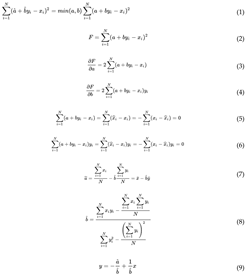
2.4. Confidence Bounds Methods
Confidence bounds are crucial for assessing the precision of reliability estimates, providing a range within which the true parameter values are likely to fall [9]. This section explains confidence intervals (or bounds) and their importance in reliability engineering, aiming to present the concept in straightforward terms while maintaining technical accuracy [9]. Fisher Matrix Confidence Bounds (FM) are utilized to approximate confidence intervals for censored data, as detailed by Nelson and Lloyd & Lipow [9]. These bounds, while commonly used, may be more optimistic than non-parametric rank-based bounds, especially for small sample sizes [9]. This study believe, that understanding these methods enhances the accuracy of parameter estimation and optimizes maintenance strategies. Fisher matrix bounds (FM) equations, described in Nelson, Lloyd and Lipow, as follows [11,13].

2.5. Ranking Methods
The Median Ranks method estimates the unreliability of each failure by determining the median rank, which represents the 50% confidence level probability of failure for each specific failure out of a sample [10]. The rank for any percentage point P is derived by solving the cumulative binomial equation for Z, representing the unreliability estimate [10]. The median rank is obtained by solving this equation at P = 0.50, using numerical methods for accurate calculation [10]. For instance, with N = 4 and four failures, the median rank equation is solved four times for each failure [10]. This study believe this method provides a reliable estimate of unreliability for plotting and analysis, enhancing the robustness of maintenance strategies. Median Ranks Equations © 2024 Hottinger Bruel & Kjaer Inc, as follows [10].


2.6. Procedure
The study follows these steps:
- Data Acquisition and Conversion: Obtain failure rate data for centrifugal compressors with electrical motor drivers from Oreda 6 Taxonomy 1.1.1.1, which is provided in terms of failures per 106 hours [14]. Convert this failure rate into Mean Time Between Failures (MTBF) by normalizing it to hours per year.
- Weibull Parameters Calculation:
- Beta (β): Calculate the shape parameter β using the Rank Regression on X, which characterizes the failure rate's variability. Beta (β) equation © 2004 Nelson, as follows [15].

- 2.
- Eta (η): Determine the scale parameter η in hours, representing the characteristic life of the equipment. Eta (η) equation © 2006 Abernethy, R. B. as follows [16].

- 3.
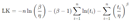
- LK Value: Compute the log-likelihood (LK) value for model fit assessment. LK Value equation © 2003 Lawless, J. F. as follows [17].
- 4.
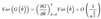
- Rho (ρ): Calculate the reliability at time t = 8760 hours to determine R(t=8760 hr), the probability of survival. Rho (ρ) equation © 2003 Meeker as follows [18].

- Reliability and Probability Calculations:
- Reliability (R): Compute reliability at t = 8760 hours using the the Weibull reliability function. Reliability (R) equation © 1981 Barlow as follows [20].

- 2.
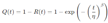
- Probability of Failure (Q): Compute the probability of failure at t = 8760 hours using the Weibull cumulative distribution function. Probability of Failure (Q) equation © 2004 Nelson as follows [16].
- 3.
- Reliable Life: Determine the reliable life for a reliability level R = 0.99, which indicates the time at which 99% of the units are expected to still be operational. Reliable Life equation © 2014 Meeker as follows [19].

- 4.
- Mean Life (MTTF): Calculate the Mean Time To Failure (MTTF) using the Weibull distribution parameters. Mean Life (MTTF) equation © 2003 Lawless, J. F. as follows [17].

- 5.
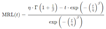
- Mean Remaining Life (MRL): Estimate the Mean Remaining Life, which is the average time remaining before failure, given a unit is still operational. Mean Remaining Life (MRL) equation © 2014 Meeker as follows [19].
- 6.
- Failure Rate: Calculate the failure rate at any given time, which can be derived from the Weibull distribution’s probability density function. Failure rate equation © 1981 Barlow as follows [20].

- Repeat Calculations: Ensure all calculations are performed iteratively to validate and refine the parameters, ensuring accurate results for the Weibull analysis.
- This procedure outlines the steps to perform Weibull analysis from acquisition data, providing a comprehensive approach to assessing and optimizing maintenance strategies.
3. Results
The Weibull analysis yielded key parameters and calculations that guide the optimization of maintenance strategies for centrifugal compressors.
3.1. Probability Weibull Graph
The graph illustrates the Weibull probability of unreliability (%) versus hours (hr), demonstrating that unreliability increases as the operational hours of the centrifugal compressors increase.
4. Conclusions
The Weibull analysis applied to centrifugal compressors with electrical motor drivers has provided insightful results, as detailed in the parameter calculations. The shape parameter β of 0.899782 suggests a decreasing failure rate over time, which is consistent with typical degradation patterns observed in such equipment. The scale parameter η of 312,718.5886 hours indicates a high characteristic life, reflecting the equipment's durability. Reliability at 8760 hours is approximately 0.9607, indicating a high level of operational performance, while the probability of failure at this time is relatively low at 0.0393. The reliable life at a 99% reliability level is 1882.85 hours, with MTTF of 329,080.80 hours and MRL of 333,610.83 hours. These findings underscore the effectiveness of the Weibull analysis and the reliability of the equipment, though ongoing monitoring and analysis are essential to refine maintenance strategies.
5. Patents
ReliaSoft Weibull++ software from HBK © 2024 Hottinger Bruel & Kjaer Inc.
OREDA Offshore and Onshore Reliability Data Handbook. Vol-1 Topside Equipment 6th Edition © 2015 DNV GL, SINTEF, & NTNU.
References
- Spüntrup, F. , Londono, J., Skourup, C., Thornhill, N., & Imsland, L. (2018). Reliability improvement of compressors based on asset fleet reliability data. IFAC-PapersOnLine, 51, 217-224. [CrossRef]
- Silver, E., & Fiechter, C. (1995). Preventive maintenance with limited historical data. European Journal of Operational Research, 82, 125-144. [CrossRef]
- Genschel, U. , & Meeker, W. (2010). A Comparison of Maximum Likelihood and Median-Rank Regression for Weibull Estimation. Quality Engineering, 22, 236 - 255. [CrossRef]
- Langseth, H. , & Lindqvist, B. (2006). Competing risks for repairable systems : A data study. Journal of Statistical Planning and Inference, 136, 1687-1700. [CrossRef]
- Amari, S. (2006). Bounds on MTBF of Systems Subjected to Periodic Maintenance. IEEE Transactions on Reliability, 55, 469-474. [CrossRef]
- Dhanisetty, V. , Verhagen, W., & Curran, R. (2015). Optimising maintenance intervals for multiple maintenance policies: a cross-industrial study. International Journal of Agile Systems and Management, 8, 219-242. [CrossRef]
- Hottinger Bruel & Kjaer Inc. (2024). Introduction to Life Data Analysis. https://bit.ly/3YGKoqk.
- Hottinger Bruel & Kjaer Inc. (2024). Appendix A: Least Squares/Rank Regression Equations on x. bit.ly/4fCs7QR.
- Hottinger Bruel & Kjaer Inc. (2024). Fisher Matrix Confidence Bounds. https://bit.ly/46IXjtu.
- Hottinger Bruel & Kjaer Inc. (2024). Parameter Estimation Median Ranks. https://bit.ly/3YXIYIb.
- Chen, T. , Kowalski, J., Chen, R., Wu, P., Zhang, H., Feng, C., & Tu, X. (2016). Rank-preserving regression: a more robust rank regression model against outliers. Statistics in Medicine, 35, 3333 - 3346. [CrossRef]
- Jongerius, S. (2022). Coverage of lifetime confidence bounds for highly censored and few Weibull distributed data.
- Taneja, V. S. (1992). An overview of reliability growth models and their potential use for NASA applications.
- DNV GL, SINTEF, & NTNU. (2015). OREDA Offshore and Onshore Reliability Data Handbook. Vol-1 Topside Equipment 6th Edition.
- Jiang, R. , & Murthy, D. (2011). A study of Weibull shape parameter: Properties and significance. Reliab. Eng. Syst. Saf., 96, 1619-1626. [CrossRef]
- Nelson, W. B. (2004). Accelerated testing: statistical models, test plans, and data analysis. John Wiley & Sons.
- Abernethy, R. B. (2006). Reliability Engineering and Risk Analysis: A Practical Guide. CRC Press.
- Lawless, J. F. (2003). Statistical Models and Methods for Lifetime Data. John Wiley & Sons.
- Meeker, W. Q. , & Escobar, L. A. (2014). Statistical Methods for Reliability Data. John Wiley & Sons.
- Barlow, R. E. , & Proschan, F. (1981). Mathematical Theory of Reliability. John Wiley & Sons.
- Bianchini, A., Pellegrini, M., & Rossi, J. (2019). Maintenance scheduling optimization for industrial centrifugal pumps. International Journal of System Assurance Engineering and Management, 10, 848-860. [CrossRef]
Figure 1.
Weibull probability of unreliability (%) versus hours (hr).
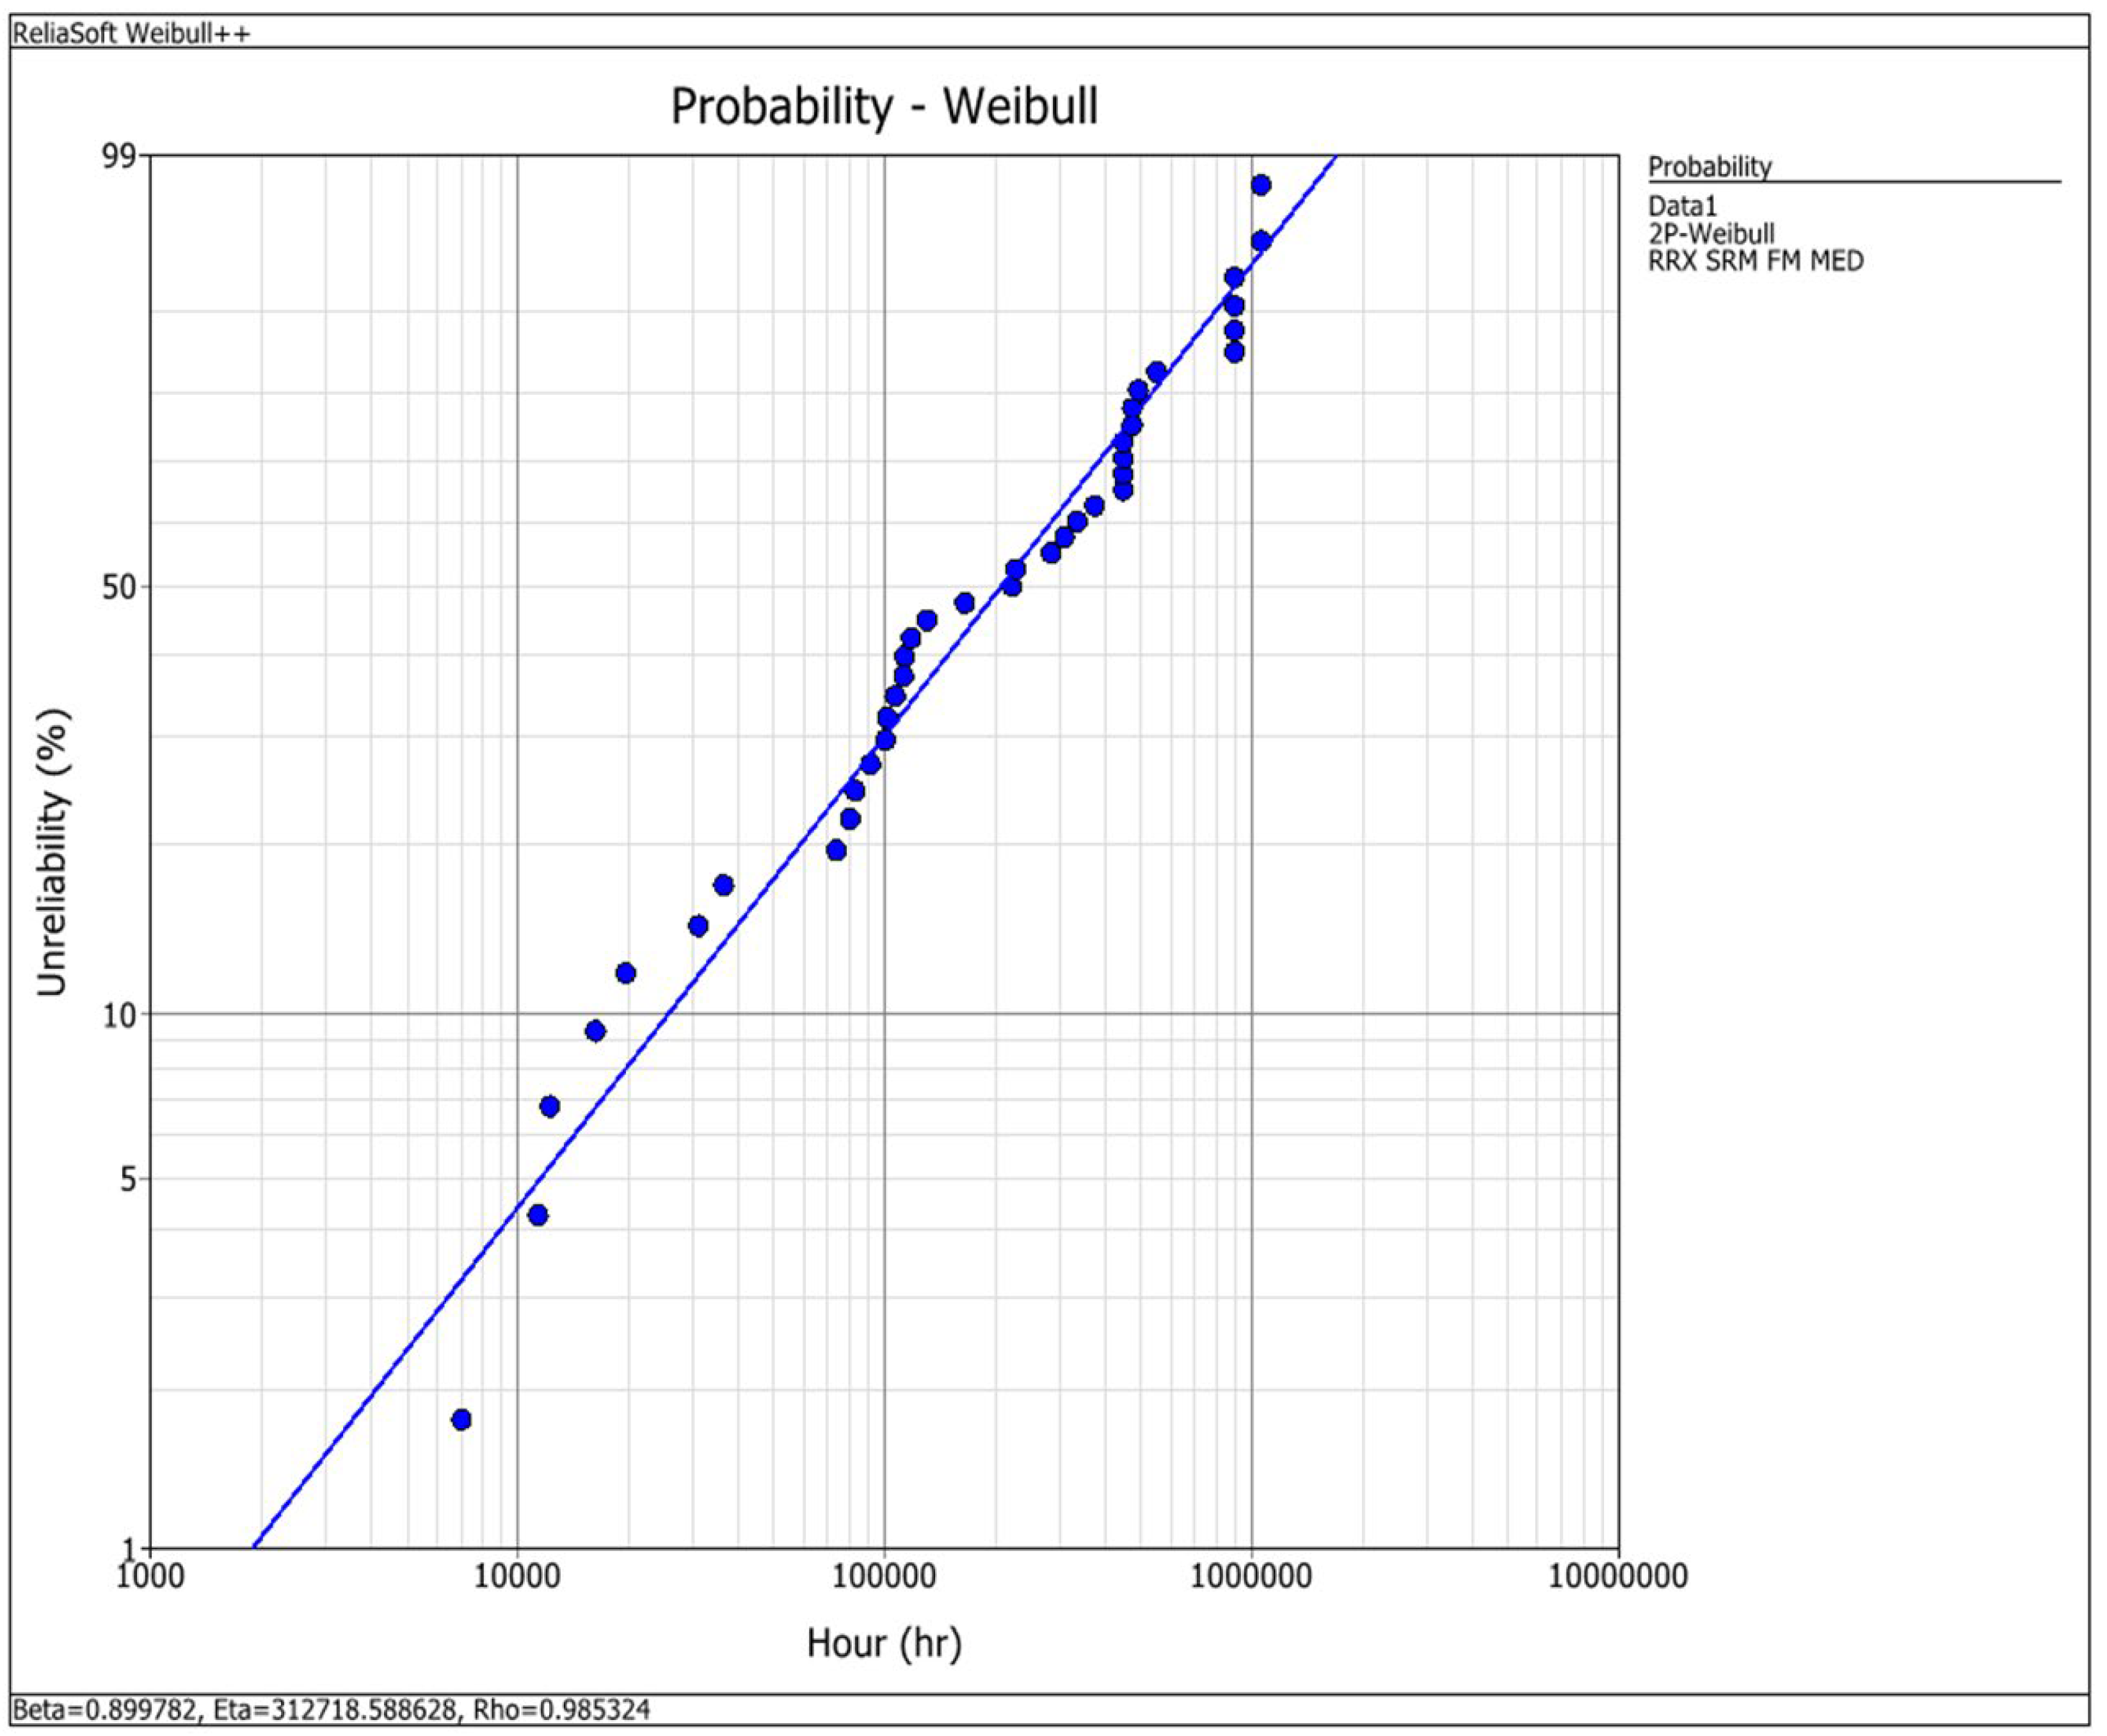

Table 1.
This is Oreda 6 Taxonomy 1.1.1.1 mean failure rate (106 hours) data [14].
Table 1.
This is Oreda 6 Taxonomy 1.1.1.1 mean failure rate (106 hours) data [14].
| Failure Mode | Mean FR/(106hours) | MTBF (hours) |
|---|---|---|
| Critical | 81,31 | 12298,61 |
| Critical Abnormal Instrument Reading | 32,02 | 31230,48 |
| Critical Breakdown | 0,94 | 1063829,79 |
| Critical Erratic Output | 3,23 | 309597,52 |
| Critical External Leakage Process medium | 1,81 | 552486,19 |
| Critical External Leakage Utility medium | 4,38 | 228310,50 |
| Critical Fail to start on demand | 9,33 | 107181,14 |
| Critical internal leakage | 3,51 | 284900,28 |
| Critical Plugged/choked | 2,03 | 492610,84 |
| Critical spurious stop | 12,38 | 80775,44 |
| Critical vibration | 8,79 | 113765,64 |
| Critical Other | 9,82 | 101832,99 |
| Critical Unknown | 1,11 | 900900,90 |
| Degraded | 87,7 | 11402,51 |
| Degraded Abnormal Instrument Reading | 27,39 | 36509,68 |
| Degraded Erratic Output | 8,86 | 112866,82 |
| DegradedExternal Leakage Process medium | 12 | 83333,33 |
| Degraded External Leakage Utility medium | 13,49 | 74128,98 |
| Degraded internal leakage | 8,44 | 118483,41 |
| Degraded Low Output | 0,94 | 1063829,79 |
| Degraded Parameter deviation | 4,49 | 222717,15 |
| Degraded plugged/choked | 2,98 | 335570,47 |
| Degraded spurious stop | 2,11 | 473933,65 |
| Degraded structural deficiency | 1,11 | 900900,90 |
| Degraded vibration | 10,89 | 91827,36 |
| Degraded other | 2,23 | 448430,49 |
| Degraded unknown | 2,23 | 448430,49 |
| incipient | 141,7 | 7057,16 |
| incipient Abnormal Instrument Reading | 50,6 | 19762,85 |
| incipient External Leakage Process medium | 9,93 | 100704,93 |
| incipient External Leakage Utility medium | 7,64 | 130890,05 |
| incipient High Output | 1,11 | 900900,90 |
| incipient internal leakage | 2,23 | 448430,49 |
| incipient Minor in-service problems | 61,1 | 16366,61 |
| incipient other | 6,03 | 165837,48 |
| incipient unknown | 2,23 | 448430,49 |
| unknown | 2,67 | 374531,84 |
| unknown Abnormal Instrument Reading | 2,11 | 473933,65 |
1 Raw material data.
Table 2.
Weibull Parameters Calculation.
| Weibull Parameters | Value |
|---|---|
| Beta (β) | 0.899782 |
| Eta (η) | 312718.5886 hours |
| LK Value | -533.917585 |
| Rho (ρ) | 0.985324 |
2 ReliaSoft Weibull++ software from HBK © 2024 Hottinger Bruel & Kjaer Inc.
Table 3.
Reliability and Probability Calculations.
| Reliability & Probability | Value |
|---|---|
| Reliability R(t=8760 hours) | 0.960710 |
| Probability of Failure Q(t=8760 hours) | 0.039290 |
| Reliable Life (R=99%) | 1882.852877 hours |
| Mean Life (MTTF) | 329080.800992 hours |
| Mean Remaining Life (MRL) | 333610.832804 hours |
| Failure Rate | 0.000004/hour |
3 ReliaSoft Weibull++ software from HBK © 2024 Hottinger Bruel & Kjaer Inc.
Disclaimer/Publisher’s Note: The statements, opinions and data contained in all publications are solely those of the individual author(s) and contributor(s) and not of MDPI and/or the editor(s). MDPI and/or the editor(s) disclaim responsibility for any injury to people or property resulting from any ideas, methods, instructions or products referred to in the content. |
© 2024 by the authors. Licensee MDPI, Basel, Switzerland. This article is an open access article distributed under the terms and conditions of the Creative Commons Attribution (CC BY) license (https://creativecommons.org/licenses/by/4.0/).
Copyright: This open access article is published under a Creative Commons CC BY 4.0 license, which permit the free download, distribution, and reuse, provided that the author and preprint are cited in any reuse.


