
Submitted:
11 August 2024
Posted:
13 August 2024
You are already at the latest version
Abstract
Pakistan is an agricultural country, and an exporter of crops in many countries. The crop production is an important factor to earn revenue for the country. But the agriculture of Pakistan is still not revolutionized and no modern system has been deployed commonly. Whereas the farmers face difficulty in growing some crops because those crops needs more care and calculated steps. Moreover the farmers face difficulty at different stages of the crop growth like to check fertility of soil and if the soil is non-fertile then which chemical property is lacking. The objective of this research is to provide digitize the agriculture of Pakistan. An emerging technology IoT and Deep learning based system will be developed. The IoT part contains some devices like sensors,gateways and communication technologies whereas the software part consists of Deep learning models that can make predictions about the fertility of the soil. The motive of this system is to provide best results in term of accuracy. Whereas the dataset used is publicly available on kaggle but it was of non-fertile values, so data augmentation is also performed to generate data for fertile values. We have implemented LSTM,RNN,CNN among them LSTM performed best for the prediction of soil fertility.
Keywords:
Internet of things
; Smart Agriculture
; Deep Learning
1. Introduction
Technology has evolved rapidly, and scientists and researchers have been working on making living better and better. Different technologies and techniques have been developed so far, Such as the Internet of things (IoT). IoT has many different applications in many different fields like industry, health, smart homes, etc.
IoT is a rapidly emerging field based on sensors. We can deploy sensors anywhere based on our requirements. These sensors then collect different types of data based on their design and functionality. Like âvideo doorbellsâ are commonly used in homes that display pictures of guests on their arrival. Other sensors include the âwater pressure sensor G1/4â used in the circulatory system, âpulse-oximeterâ, and âfluid level sensorsâ used in health care. These sensors generate data in bulk and are difficult to store whole data in a database or even in the cloud. The data is centralized, so the storage of data with a cloud or database requires a lot of security measures to keep the data protected from unauthorized users [1]
By combining different technologies we can make lives easier and comfortable. Like the use of machine learning (ML) and its variants like deep learning (DL) can be amalgamated with IoT to make a significant impact on different fields. Like the use of DL with IoT can have a major impact on agriculture.
1.1. Introduction of IoT
Internet of Things (IoT) is a system in which different computing devices, digital machines, and objects are related to each other and have the ability to transfer data over the internet without human interaction. The word âthingsâ are the devices or sensors that are the main part of the system. Sensors are devices that have some specific functionality of sensing like the sensors named MQ135 sensor is used to sense different gasses from the air and is used in air pollution monitoring system.
IoT has gained popularity and now the industries are using sensors to enhance their process. IoT also saves money and time because it automates the process which is done manually. It monitors the overall activities and thus enhance the customer experience.
IoT is merged with different other techniques and fields to make the IoT more advanced and up-to-date as well. This also helps to overcome the shortcomings of IoT and to make it more and more efficient and effective for almost ale industries.
The IoT is used to gather data from different devices and with the help of internet that data can be stored in databases or servers or can also be accessed, several calculations can be performed using that data. The Basic working of IoT is illustrated in Figure 1.
The IoT work with sensors as well. The concept of WSN(wireless sensor network) is really important in IoT. In WSN the sensors have energy resources and are capable of sensing, storing and sending the data. So, the IoT works with sensors deployed. The sensors with some specific functionalities are deployed in some areas. The sensor senses the data and according to the network, architecture sends the data onto the cloud or database what so ever is attached to it. The data is sent to the cloud for storing purposes. Deployment might be done using two different methods i) Fix deploying ii) Deploying using copter
1.1.1. Fix Deploying
The sensors are deployed in some specific areas that gather data from their surroundings using actuators. All the data is sent to the central point which is a cluster. And then that cluster is responsible for sending data onto the cloud. Then that data is used for several calculations and other analysis purposes [2]. The working of IoT using fix deploying is illustrated in Figure 2.
1.1.2. Deployment using copter
In this type of deployment, the sensors are deployed onto the copter. A copter is flying object like a drone. The copter will have sensors deployed on it, the sensors might be of different type according to the requirement but the WiFi module is a must. After reaching the area, turn on the sensors and while hovering the copter over a specific area to gather data from there. The WiFi module can be used to transfer sensed data with the help of internet over the cloud. That data then can be saved and used for various purposes.
This deployment is really useful if we want some data from villages or other areas where 24/7 surveillance is not necessary. So we can save time and space in storing data while using this because we hover the copter over a specific field for a specific time. [3] The working of IoT with deploying using copter is illustrated in Figure 3.
1.1.3. Introduction of Deep learning
Deep learning (DL) is a technique of ML, DL is really complex as compared to ML. As the name indicates, it has a very complex structure that includes several layers of neurons. DL works with Artificial neural network (ANN) and works similar to a human brain. And like the human brain, DL has the capability of understanding, analyzing and solving complex problems. Whereas the DL has revolutionized lives in many ways. DL is based on models, which are trained on large datasets to get the desired outcome or results. DL is used in driverless cars and the model is trained to recognize various important signs of traffic and hence the car can be driven without the need of a human driver. There are countless implementations of DL in different fields. [4]
The DL is divided into many layers and each layer has a different number of neurons. The layers have their own tasks and functionalities that are to be fulfilled to get the desired results. Some important requirements of DL are:
- The DL needs labeled data and can handle large datasets.
- The DL required GPUs for computations because of the large architecture and the huge amount of dataset.
The DL required GPUs for computations because of the large architecture and the huge amount of dataset.
DL models are trained with the help of a dataset and after the training is completed it can predict several things. For instance if the model is trained in diseases and their medicines, then the model can recognize the cancer cells and can suggest the medication for that particular patient.
2. Smart Agriculture
Pakistan is an agricultural country. Farms are a really important part of the country, moreover, the product produced has significance because that product is supplied to the whole country and exported as well. The farmers have to work hard on fields to manage the crops’ growth. There are various steps that are performed by the farmers.
Smart agriculture can also be termed as precision agriculture as we will be collecting, storing, analyzing and visualizing the results of the crops. The crop growth mainly focuses on various factors such as soil fertility, weather conditions and crop type. So the data used will be of all these factors.[5]
We can use data to train our DL models to perform various analyses and get different predictions from the model. The data can be used to:
- Next crop prediction will be based on region data, soil chemical detail dataset.
- Suggest pesticides for the disease that will require dataset of crop images
Smart agriculture can revolutionize this industry in many ways like it can reduce wastage of water, increase crop yield and most importantly the quality of food can be improved.
Smart agriculture is amalgamation of different technologies like IoT and Deep learning.
- Sensors are deployed on the fields to gather information. The sensors are related to soil that will monitor soil moisture, and other chemical properties that are important for crop growth. Environmental sensors that will monitor humidity of the field are also deployed.
- The data is gathered from sensors, stored and then analyzed. Based on that some important decisions are made by the stakeholders.
- The data gathered from the fields are huge so we need some model that can handle such a huge amount of data. So we can use DL for this. Because DL has several layers and due to complex data structures it can handle large data. DL models can be trained and based on that model working we can perform various tasks like prediction and suggestions related to crops.
- After that a system can be devised with a user interface that can be accessible to the layman. So that they can use the system to have a significant increase in crop production.
Lorem ipsum dolor sit amet, consectetuer adipiscing elit. Ut purus elit, vestibulum ut, placerat ac, adipiscing vitae, felis. Curabitur dictum gravida mauris. Nam arcu libero, nonummy eget, consectetuer id, vulputate a, magna. Donec vehicula augue eu neque. Pellentesque habitant morbi tristique senectus et netus et malesuada fames ac turpis egestas. Mauris ut leo. Cras viverra metus rhoncus sem. Nulla et lectus vestibulum urna fringilla ultrices. Phasellus eu tellus sit amet tortor gravida placerat. Integer sapien est, iaculis in, pretium quis, viverra ac, nunc. Praesent eget sem vel leo ultrices bibendum. Aenean faucibus. Morbi dolor nulla, malesuada eu, pulvinar at, mollis ac, nulla. Curabitur auctor semper nulla. Donec varius orci eget risus. Duis nibh mi, congue eu, accumsan eleifend, sagittis quis, diam. Duis eget orci sit amet orci dignissim rutrum.
3. Literature Review
Literature review comprises of three sections first one is the review of papers based on IoT and second part reviews the papers that used IoT and ML and third part reviews the papers that used IoT and DL for Smart agriculture.
3.1. Studies IoT
The author [6] has collaborated IoT with in agriculture Iot Agro and particularly the sugarcane crop. The system is developed to closely monitor the environment in which the crop grows by using RFID tags. We can enhance crop growth by monitoring the water level and soil moisture. Moreover, we can also utilize resources like water, soil, and land optimally.The crops have residue that is usually burned after harvesting, which causes air pollution and many other problems. This paper addresses the problem of wastage minimization. The proposed system consists of three perceptron layers, a network layer, and a service layer. The perceptron layer works with sensors and collecting data is its main task, after the collection of data like water level, soil moisture, etc the data is transmitted onto a network layer that will work like a transmission medium and is equipped with WiFi, Ethernet, etc. whereas the application layer is further divided into two sub-layers: data management sub-layer that works with cloud computing technology and service sub-layer that works to get meaningful data out of raw data. State-of-the-art technologies like Blockchain can also be used to make farming technical and to overcome problems as well.
With the passage of time diseases, soil conditions, and weather conditions have changed which calls for the need for smart agriculture. The term smart refers to some technical things like the Internet of Things (IoT). We can make our farming smart by adding some sensors and monitoring the soil conditions, weather conditions, and other factors to make our farming good. A system has been proposed in this paper [7] that provides the user, and investor the facility to keep an eye on field conditions while at a distance.The system is composed of three layers: the perception layer consists of sensors that are deployed on the fields the sensor used in this proposed system is Ubi-sense mode which is a generic sensing board that can sense light intensity, temperature, and humidity, and can transmit the sensed data as well.The second layer is the network layer, it is the middle layer and works to transmit data gathered from the perception layer to the application layer. So the Ubi-sense mote is combined with IEEE 802.15.4. Whereas to transmit data the WINGZ is used.The final layer is the application layer. It is connected to databases that can store the sensed data gathered by the sensors from the field. After gathering data at the server side the analysis is performed to make the crops grow better. The weather data stored in databases can be used to forecast the weather conditions. Whereas the proposed system is neither deployed nor tested in a real environment and no results are predicted.
To provide ease to our farmers is the need of today. We need to make our agriculture smart so that we can maximize crop production. To make agriculture smart there are several technologies that can be used. A system has been proposed to monitor humidity, and soil moisture conditions [8]. The proposed system uses LoRaWAN for the transmission of the data gathered from the fields. The nodes are divided into two parts collectors and actuators. Whereas the data is stored in the cloud and is accessible online or offline. Whereas the data is not further analyzed nor any predictions are made based on that data.
3.2. Studies IoT, ML
To make agriculture smart, there are several things that need to be smart. One of the important is the irrigation system. A system has been proposed in [9] that caters to the irrigation system. The proposed system is based on IoT, sensors are deployed in fields where they gather data on humidity and temperature data to the model. The model developed works with environmental conditions and predicts the ETo rate. The DHT 2 sensors are deployed that can sense humidity in the fields. NodeMCU is used to transmit data to the server with the help of the internet as the device works with a WiFi module. The model will classify the ET0 rate as âlowâ, âmediumâ, and âhighâ, the temperature and humidity are classified. The model is compared with the kNN, GNB, and SVM, and got 92% accuracy.
This author [10] has proposed a monitoring system that uses machine learning and IoT technology to detect grape diseases at an early stage. The system includes wireless sensor networks, IoT devices, and a hidden Markov model for disease classification. The system aims to prevent the excessive use of pesticides and improve the quality and quantity of grape production. For this a comparison is conducted between Hidden Markov Model and statistical Method. Whereas for testing purpose the system need to have more sensors so that they can cover a large area and can gather data and have more accurate results based on bulk data this need to be catered.
In paper [11] the concept of machine learning is combined with IoT to make the fields talk and convert agriculture to smart agriculture. A smart irrigation system has been proposed that will be predicting the requirement of water for crops using machine learning algorithms. The sensors deployed in fields are temperature sensors, humidity sensors, and moisture sensors. For the data transmission microprocessor is used that is attached to an IoT device and then connected to cloud. Whereas the algorithm used is a Decision Tree, whose main purpose is to predict the quantity of water required by the crop. The results are sent to farmers through email alerts, helping them make informed decisions about water supply in advance. By using this system we can save water for other usage as well. The accuracy of the model is dependent on data given to the model, but the paper hasnât discussed the accuracy of their model either.
The author [12] has discussed the development and implementation of an Agriculture Automation System using Machine Learning (ML) and Internet of Things (IoT). The system aims to improve crop yield, reduce irrigation wastage, and enhance agricultural efficiency. It includes sensors to monitor environmental conditions such as temperature, humidity, and moisture content in the crops. ML algorithms, specifically the algorithm used is Decision Tree, that is applied to the data collected from sensors that are deployed on the field, and the data will be used to predict results and assist with decision-making regarding water supply. The integration of IoT and ML in agriculture automation systems offers benefits such as remote monitoring, data-driven insights, and cost reduction. The paper also presents results and showcases a prototype system along with an accompanying mobile application for farmers. The future scope of the proposed system includes advancements in sensor technology, satellite imaging, swarm robotics, and blockchain integration to further optimize and improve agricultural practices. More innovation is still required.
The author [13] mainly focuses on the large data collection from the fields using IoT, and further this data can be used to make predictions using machine learning algorithms. The proposed system works with some important soil and agricultural parameters like pH level, humidity, moisture, etc. The proposed system will help the farmers to predict yield crop based on the information provided by the user. The system will work with the internet as well. This will help farmers to get a good yield crop. Whereas the proposed system has not been tested on different datasets nor in different environments. Moreover the important factors like pests and weed are also not mentioned in this paper.
There are various factors that can damage the crop and on top is the environmental damage. The paper [14] discusses the use of AI, sensors and ML to manage the environmental damage and to have a significant increase in crop as well. The proposed system uses drones to monitor crop conditions, with the help of automated irrigation systems based on distant sensing and GPS the wastage of water can be prevented, whereas precision weeding is proposed to increase productivity and AI robots are proposed to lessen the use of pesticides because pesticides make crops less nutritious. To increase crop productivity the important step is to monitor crops and to detect the disease at an early stage and this can be done and modern technology is really important in this phase. Whereas the proposed system needs to be tested on a large dataset to improve its accuracy on detecting the plant diseases.
The decision making related to crops is really important to have a good crop production and to prevent crops from damage in dry spells. For this the paper [15] has proposed a system that is based on ML and IoT. The crop productivity is done using WPART that is based on ML. And for dry spell prediction the ML based PART classification technique is used. The system predicts the dry spells that could save the crops from damage and hence an increase in productivity can be ensured. The system is tested on the basis of accuracy, precision and robustness. Whereas the proposed system has not catered to other important factors like pests and soil conditions for the crop productivity.
Diseases are really common in crops that can damage the crop productivity. The paper [16] has proposed a dataset named FieldPlant that has the images of diseases of crops. The main goal of the author is to make the disease prediction and prevention easy for the farmers, so that farmers can take necessary steps to save their crops and hence increase the crop productivity. The dataset contains pictures of plants from different zones and at different stages of growth. The dataset contains 27 diseased classes. The paper also highlighted the importance of deep learning models in prediction and prevention of diseases in crops. Whereas the dataset contains three crops disease pictures, there is a need for more crops disease to be added, to make it general from specific the dataset needs to have pictures of diseases of other crops as well.
3.3. Studies IoT, DL
Deep learning and IoT make a good combination and have really good results in agriculture as well. The author [17] has proposed a system that is based on AI and cloud computing. The main purpose of the system is to increase the food production. The system is divided into four main layers that are first layer is data collection that is from sensors, second layer is edge computing, third layer is data transmission and final layer is cloud computing. Furthermore they will be expanding the research and combining deep computation and multi-task learning.
The paper [18] discusses the implementation of deep learning and IoT technologies for smart agriculture. The main objectives of the smart agricultural system are to predict which crop will be best suitable crop to grow next and to improve the irrigation system through selective irrigation. The system uses a WSN for data collection about soil parameters and periodically uploads it to the cloud for analysis. LSTM networks are considered suitable algorithms for predicting crop suitability. SMS service is used to communicate to users to inform about best crop. Whereas the system must also be capable of predicting time to apply pesticides and fertilizers.

Table 1.
Literature Review IoT and DL/ML papers
| Type | Paper | Year | Contribution | Tech | Sensors | Model/Method | Accuracy |
|---|---|---|---|---|---|---|---|
| DL | [18] | 2017 | Predicting suitable crop to grow, Improve irrigation system | Deep Learning, IoT, WSN | DHT11, LM35, NTC | Feed Forward, LSTM, GRU | NA |
| [17] | 2019 | Increase food production | IoT, DL | NA | Deep RL | NA | |
| ML | [16] | 2023 | DL | NA | NA | NA | NA |
| [9] | 2022 | Calculate ETo Rate | IoT, ML | DHT 2, NodeMCU | KNN | 92% | |
| [13] | 2022 | Crop prediction using ML | ML, IoT | NA | WEKA, JRip | 98.2% | |
| [14] | 2022 | Smart agriculture and precision farming | IoT, ML, AI | NA | NA | NA | |
| [15] | 2021 | Decision support system | ML, IoT | WPART, PART | NA | 92.51% - 98.15% | |
| [11] | 2020 | Water prediction for crops | IoT, ML, Cloud | DHT11 | Decision Tree | NA | |
| [10] | 2016 | Early detection of grapes disease | ML, IoT | ADC | Hidden Markov model (HMM) | HMM perform good | |
| [12] | 2023 | Improve crop yield, Reduce irrigation wastage | ML, IoT | DHT11, ACS712, ZMPT101B AC | Decision Tree | NA |
4. Proposed Methodology
As per our research, almost all the research is done on datasets that were already available and mostly ML models were applied. But in our case we intend to take our system to a large scale so we will implement the DL model. And for that we have to first perform data collection and data augmentation.
4.1. Datasets
Dataset 1 Kaggle Crop Recommendation dataset
The dataset used to train the model is âcrop predictionâ and is taken from kaggle. The dataset contains values of nitrogen(N), phosphorus(P), potassium(K), temperature and humidity. As the dataset is from Asia so has various numbers of crops that grow in this region and are mentioned in the dataset as well. [19] Whereas the dataset is not labeled so we donât know the condition of soil whether it is fertile or non-fertile. This classification is important because we can further see if there is need for the fertilizer or not. The dataset consists of 2200 instances whereas all the instances are of non-fertile soil.
Dataset 2: Augmented data
The dataset contains augmented instancs of data from different sources and have generated sufficent number of instances for fertile and non-fertile.
Dataset 3: Combined dataset
The dataset that is used in our models is combined dataset that consists of Dataset 1 and Dataset 2. and have total of 12550 instances among which 5300 are fertile and 7250 are non-fertile
4.2. Data Labeling
We have found the range of values of NPK and ph that are fertile from . The ranges are N(200-250),P(100-150),K(200-250) and ph(7.2-7.5) [20] [21]. where the pH value explains whether itâs alkaline or not. If the value is below 7.2 or above 7.5 this means that the crop will not be able to get nutrients properly from the soil and ultimately the health, growth of the crop will be compromised [22]. And hence explains the need of the fertilizers in the soil.
We have labeled our dataset based on these range of values. We have used "Kmeans clustering" to classify the instances into two classes that are fertile and non-fertile.
The range used for this research is based on average becuase the fertility of the soil depends on crop, region and other factors. The ph range used in this research is 7.2 to 7.5 that is of the moderate soil becuase if the soil ph is in this range means its not that alkaline and can grow a crop well enough, whereas same goes with the N,P,and K values. And this range of chemical properties is of loamy soil. Loamy soil is well balanced soil and is a mixture of sand,silt,clay moreover has good fertility. The major crops that can be grown with this kind of soil are wheat, rice, fruits and vegetables. Which are really common crops in Gujranwal, Lahore and surrounding cities.
4.3. Data Augmentation
We have found that the dataset is imbalanced as out of 2200 values, all are non-fertile.
Now we need to balance the dataset because an imbalanced data set can lack training and hence the results will not be as accurate as we want them to be.
5. Data Split
The dataset 3 is used for testing and training purpose. Whereas the model will classify the data into 0 and 1. Where the 0 indicates non-fertile and 1 indicates fertile soil instance.
6. Implemented Models
There can be various models that can be used for smart agriculture. We can use Machine learning or Deep learning models as well. Moreover the model choice can be made based on the problem that needs to be solved. Some of the important and frequently used models in smart agriculture are:
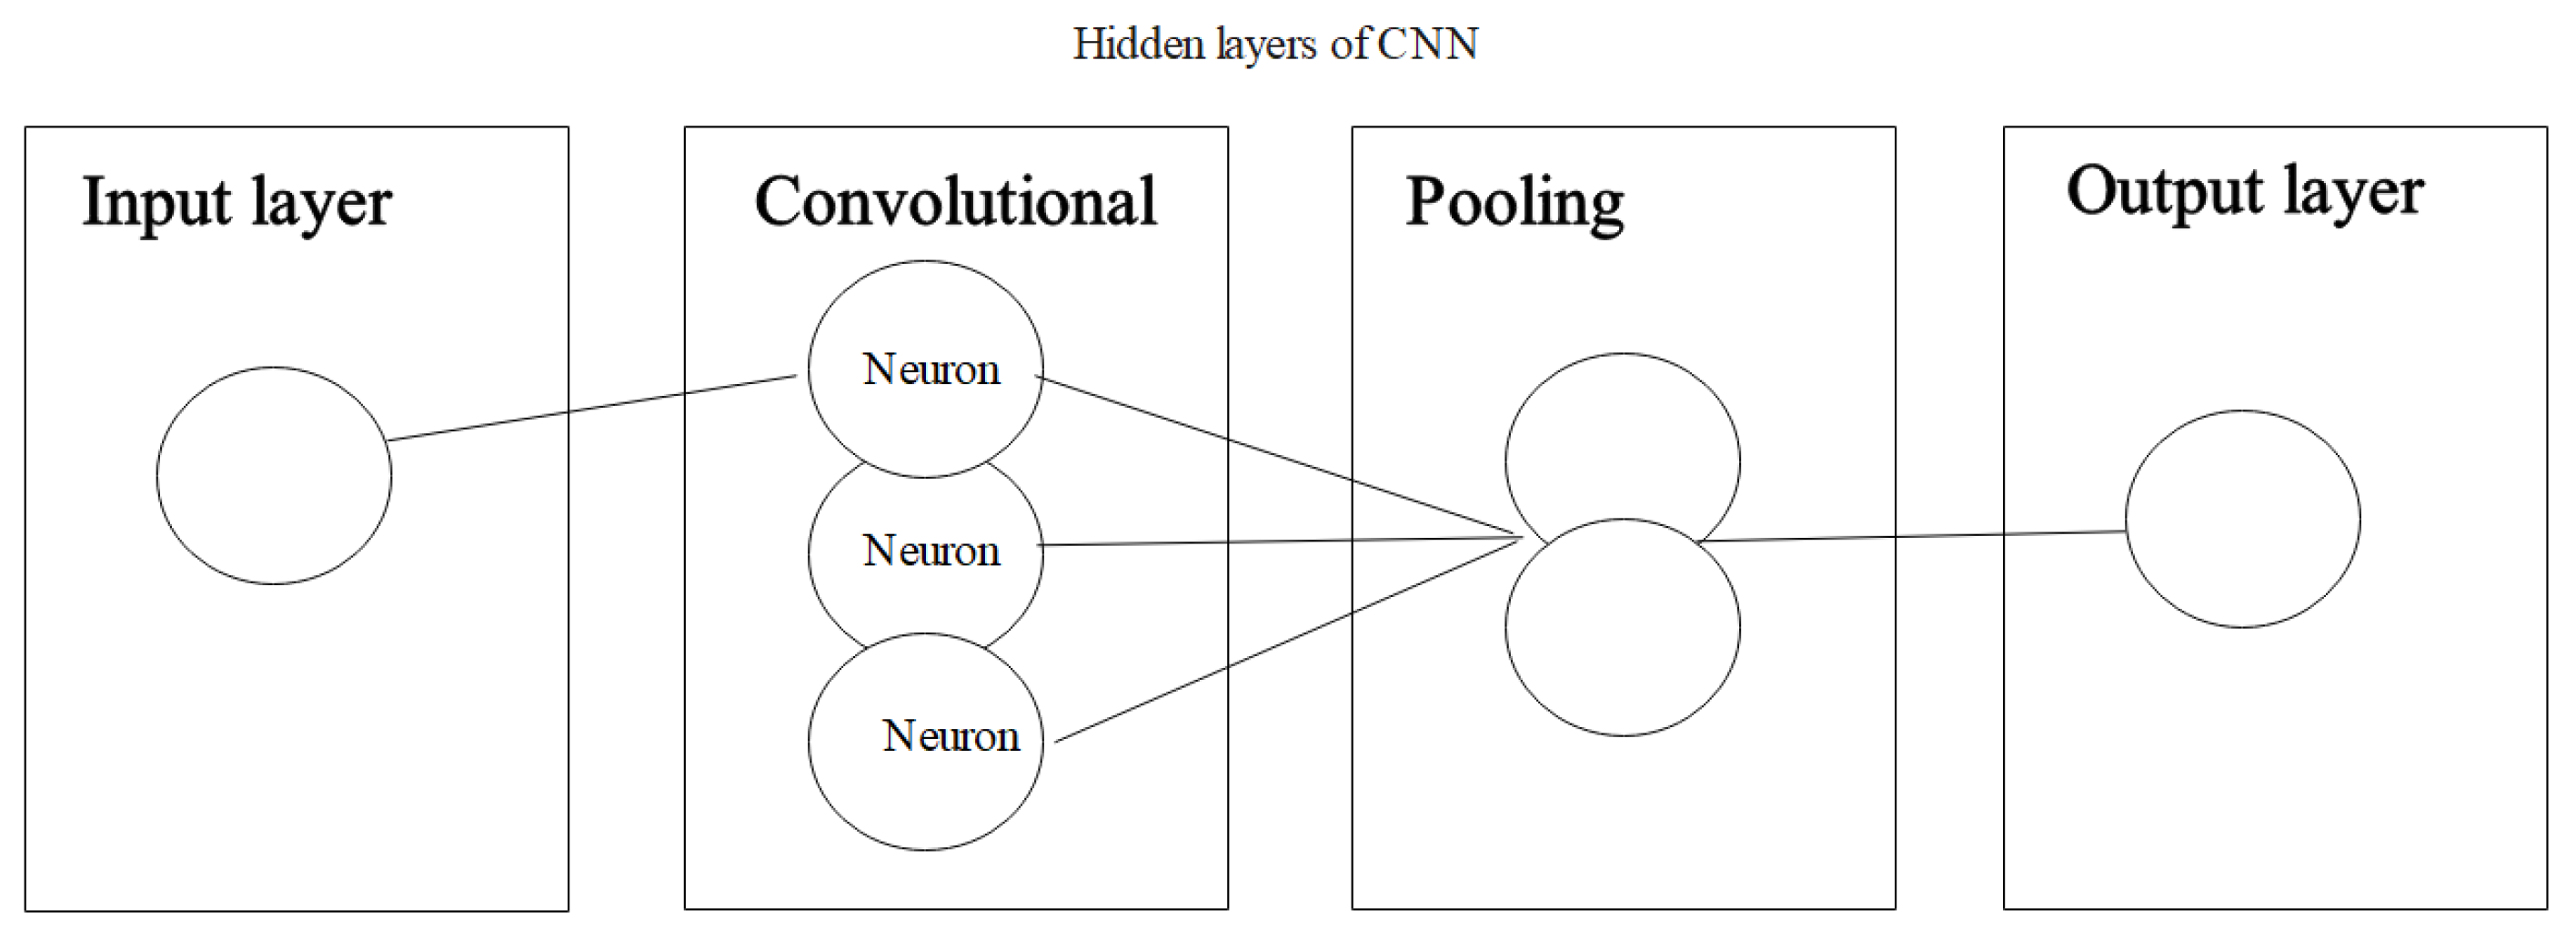
6.1. Convolutional Neural Network (CNN)
CNN is related to NN and have speciality working with images. So if the problem is related to images like the disease detection in plants or to track the growth of the plant we can use CNN. Because the plant/ crop disease datasets contain images of plants that have caught disease. The working of CNN model is shown in diagram 3.1.
Figure 4.
CNN model working
6.2. Recurrent Neural Network (RNN)
RNN is related to artificial neural network (ANN), and is usually used to work with sequential data. The problems can be precision farming and water demand prediction. The working of RNN model is shown in diagram 3.2.
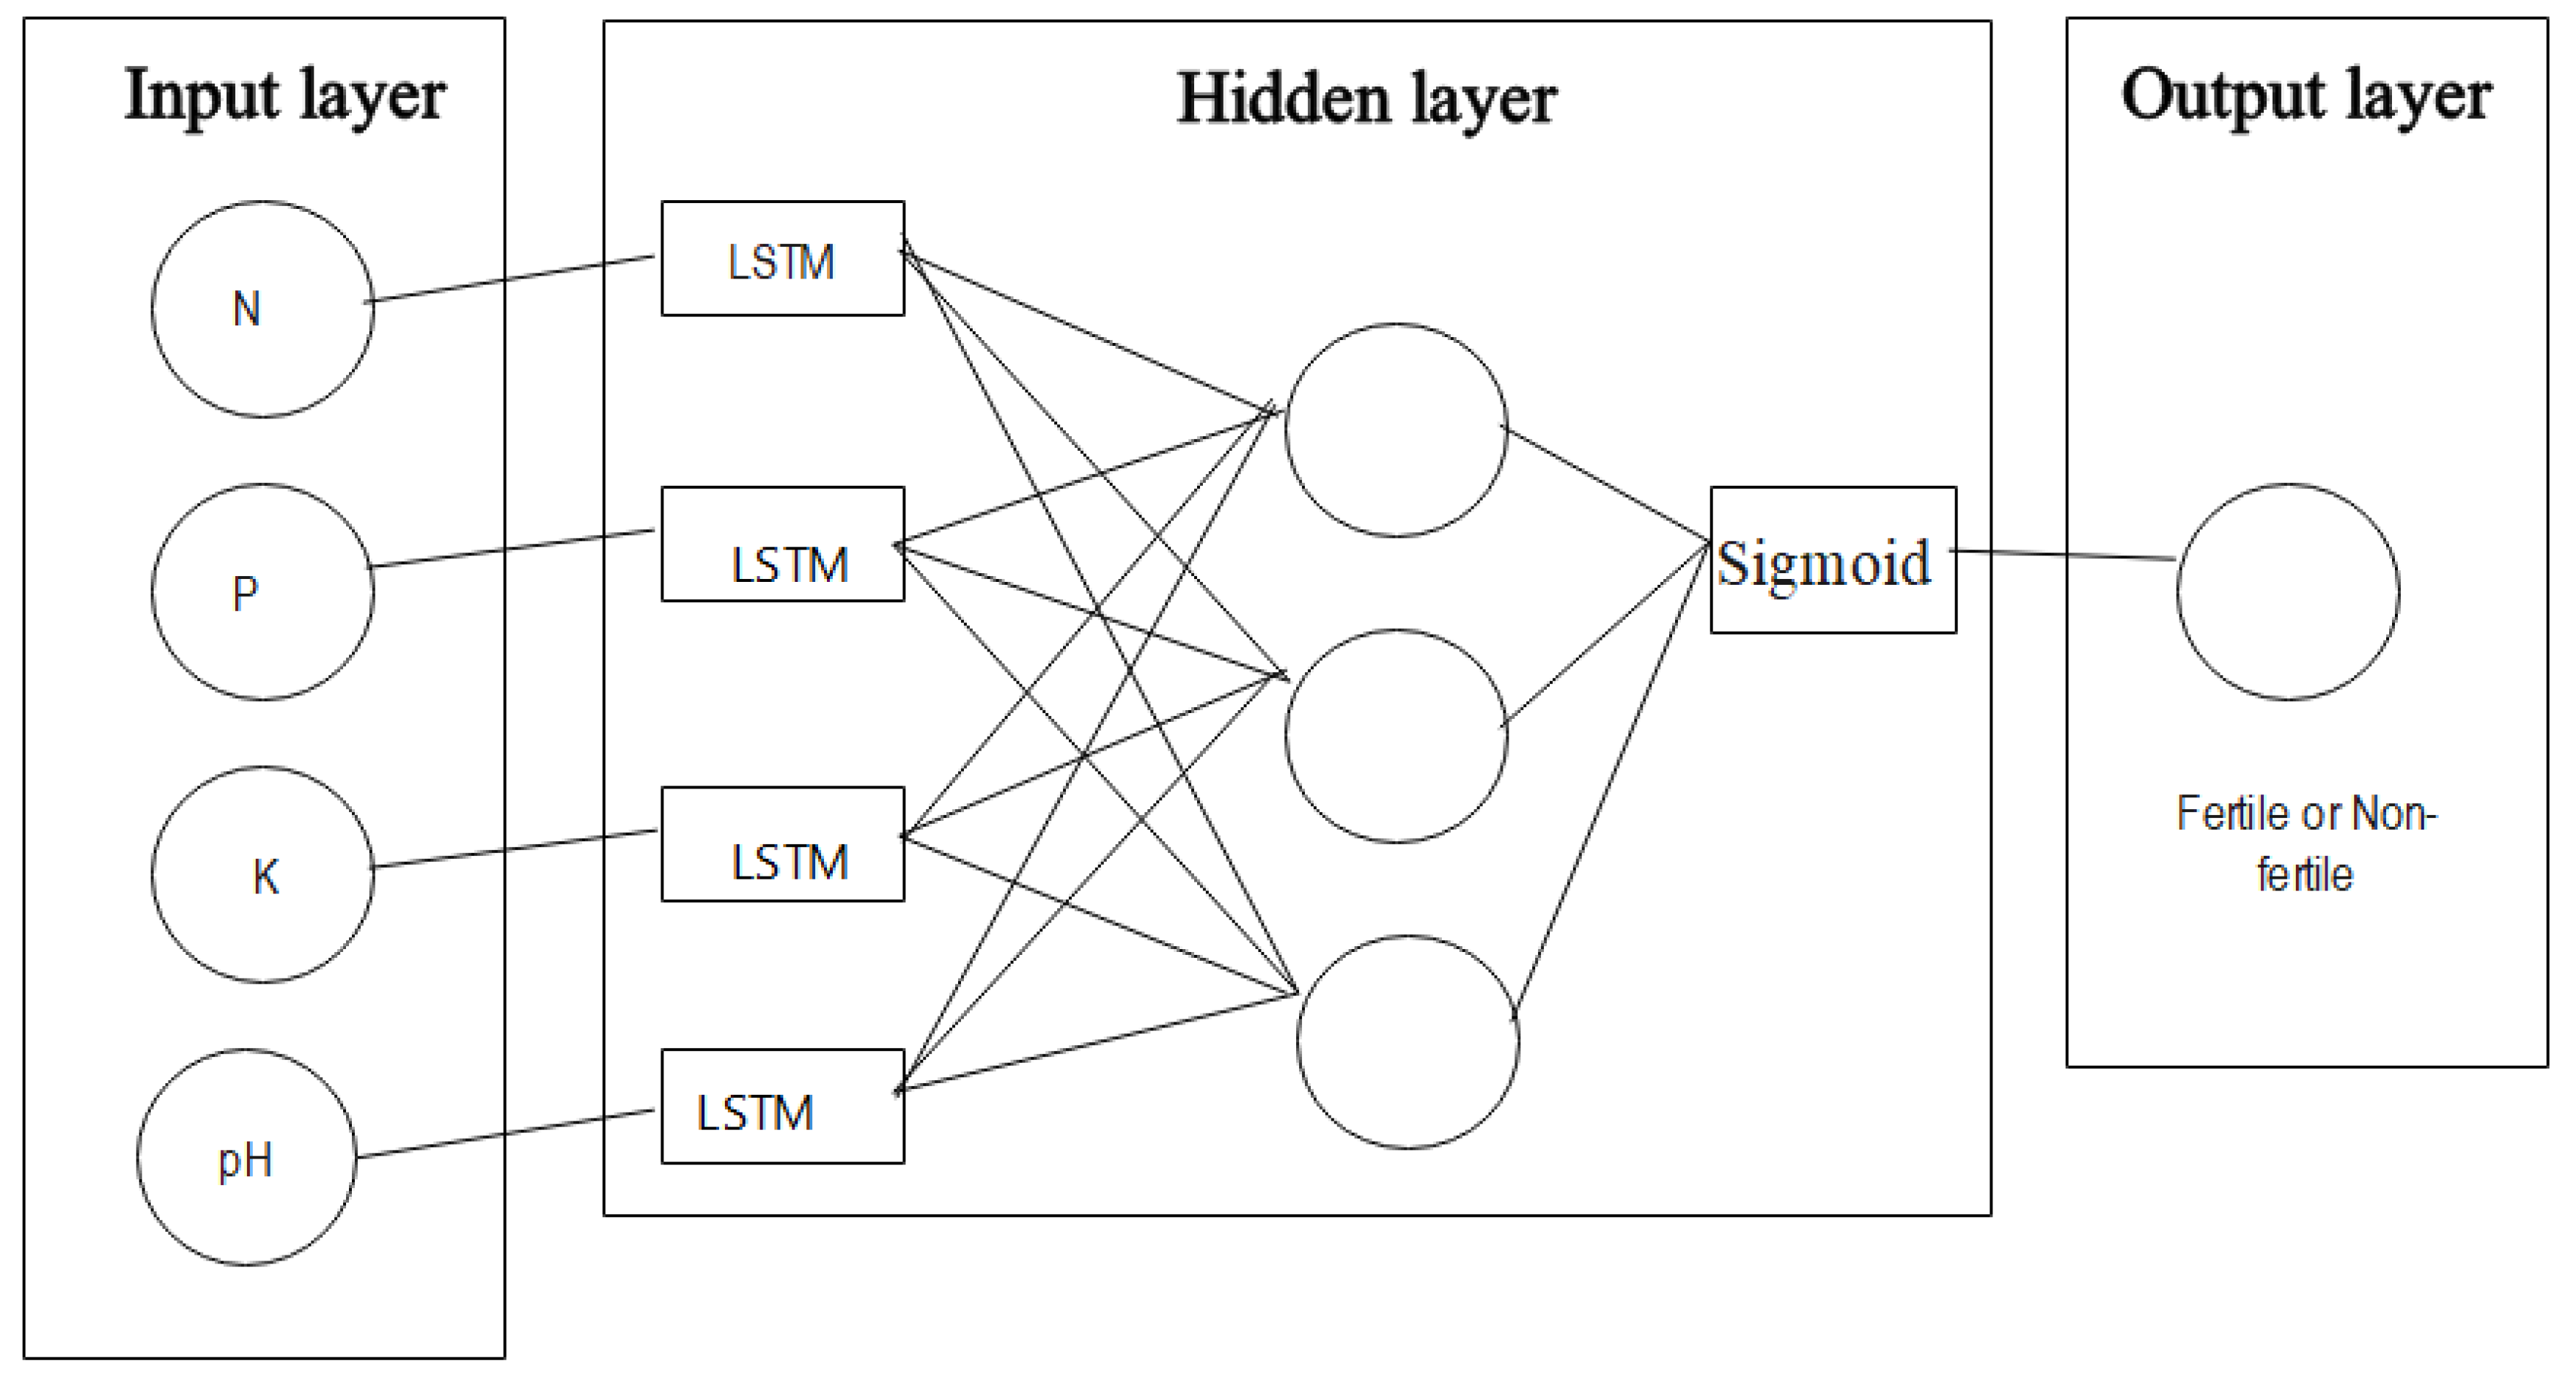
6.3. Long-Short Term Memory (LSTM)
LSTM is a type of RNN and is widely used in smart agriculture. We can use LSTM to predict crop yield, weed control and other such tasks. No doubt LSTM is a complex model to implement and also LSTM needs bulky dataset to be trained. But despite all the negative aspects LSTM has promising results as discussed in [23] the model has recall value 95% in crop prediction. The working of LSTM model is shown in diagram 3.3
Figure 5.
RNN Model Working
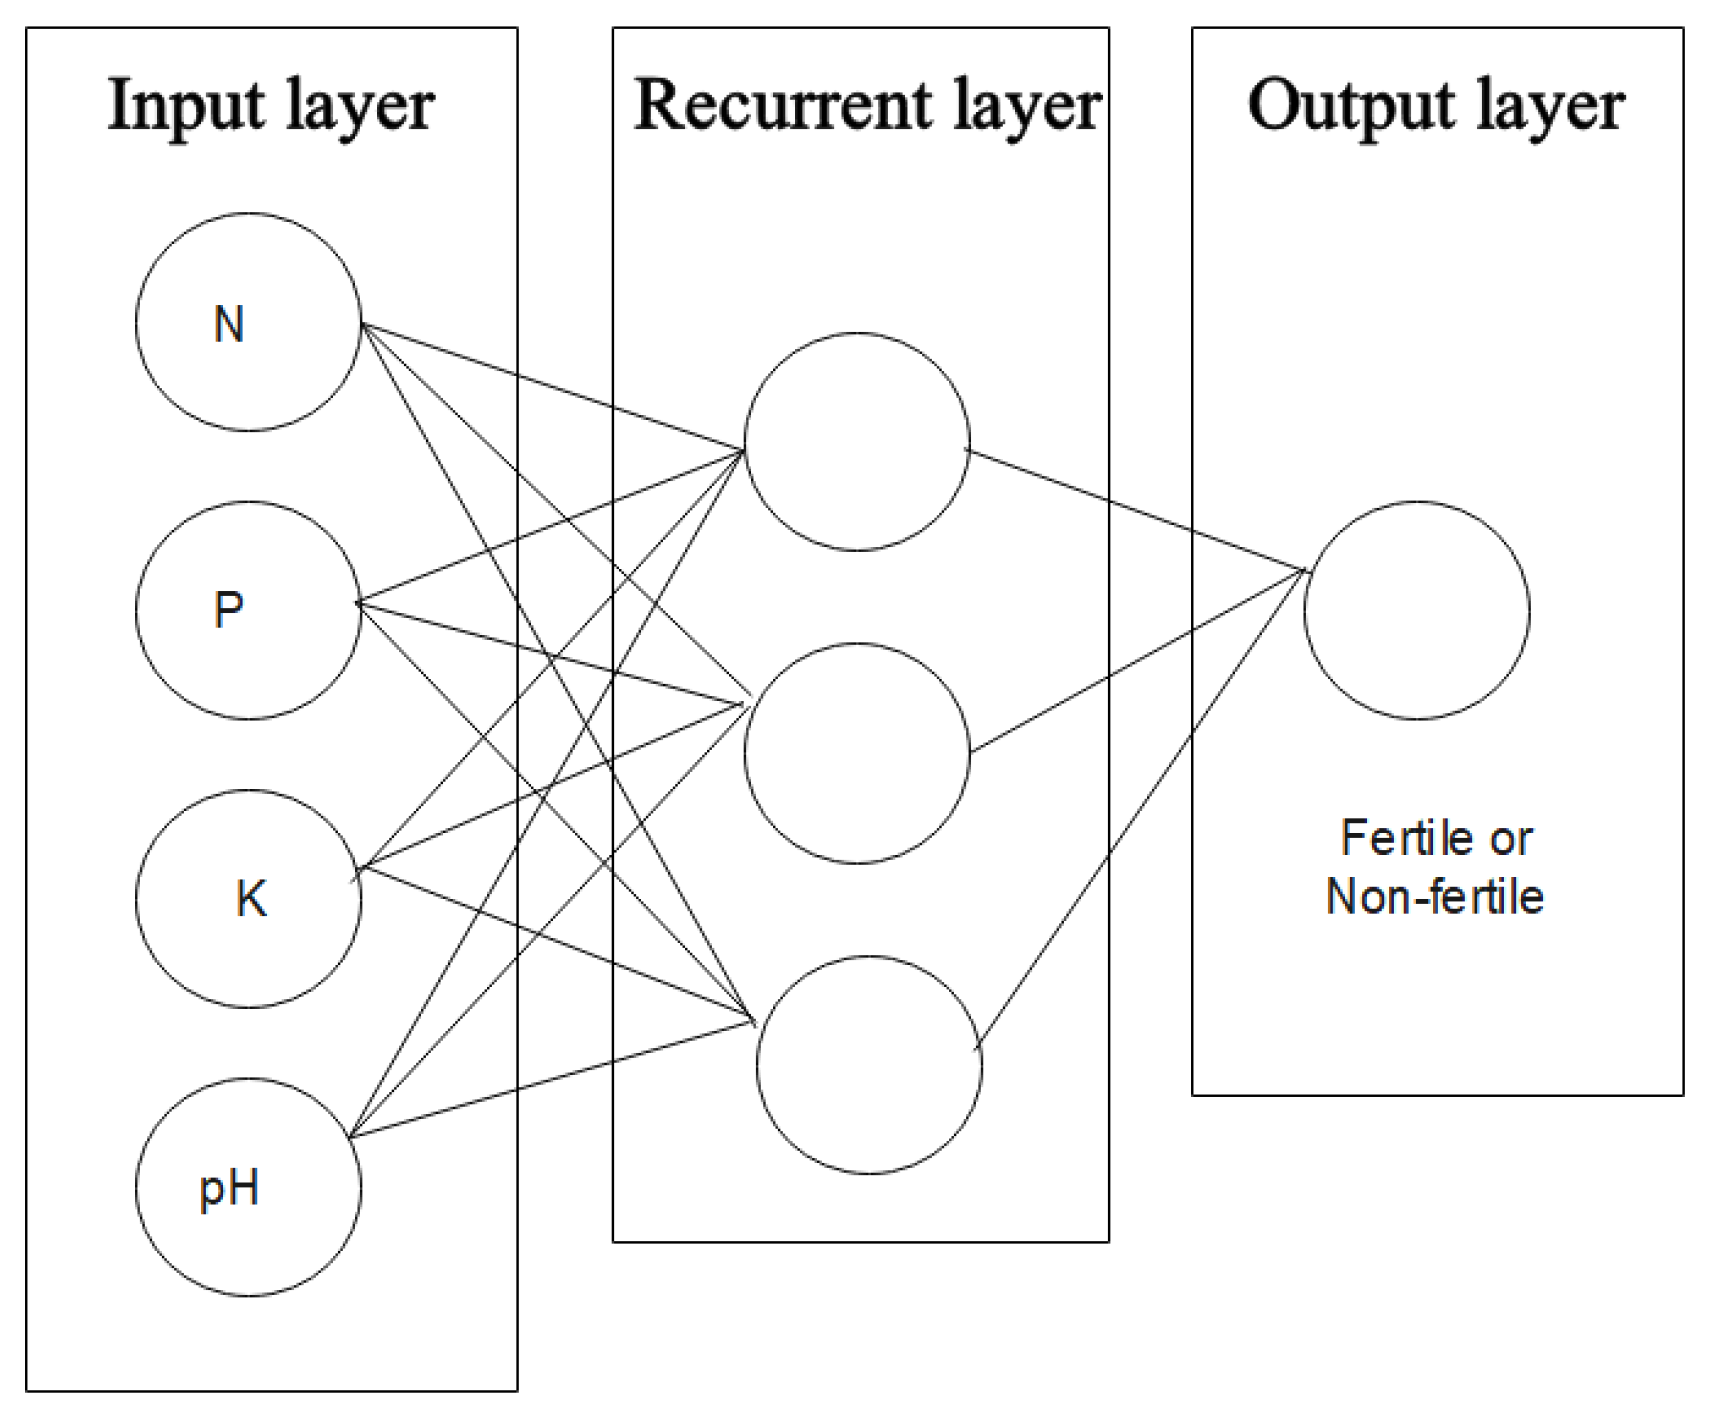
Figure 6.
LSTM model working
7. Hyper-Parameter Tuning
Hyper-parameter tuning We have tested our models with different activation functions and different epochs that results into different results. Activation functions tested are Relu, Sigmoid, Tanh and elu. We have tried them in output layer of the model to see impact of activation function clearly on results. Moreover the epochs does not have significant impact on results but makes a little difference so we have tried it as well.
- Sigmoid function has really good results for classification problems. And we want to classify the dataset into 0,1 on basis of fertile and non-fertile.
- Relu function is mostly not used as output layers. But it can be used in smart agriculture as it can be used to predict crop yield but still various factors can be involved.
- Tanh function is used to layout the output in a range of -1 to 1 but is similar to sigmoid.
- Elu function has really smooth results with positive and negative inputs. This will enhance the results of model as well.
8. Real-Time System
We have tested our system on a real-time environment. The system is based on two parts IoT and DL. Whereas the IoT devices are listed below:
- Arduino Nano
- Node Mcu
- NPK sensor
- PH sensor
- Zigbee module
- Connecting Wires
8.1. System Detail
The system consists of IoT devices that are listed above. Moreover the sensor devices ph sensor and NPK sensor are connected with micro-controller. And then a wifi module is connected to the system so that the readings from the sensors can used to train the model. Whereas the readings can be stored on cloud or in a json file and further used as input data for the model. The zigbee module is used to make packets of the data and then transmit it to the user. The connectivity of the system is shown in Figure 7. The Figure 8,9 are of the real-time system.
9. Results and Analysis
This implemented deep learning models in this work are: LSTM, RNN and CNN. And there are four activation functions used on each model to test its output. And the LSTM out performs rest of the models and gave 100% accuracy with all the activation functions. And the second best accuracy is of CNN with 98.8%. Whereas the epochs are 10, batch size is 32 for all the models and activation functions. And mostly the dropout is 0% in all models with all activation functions tested.
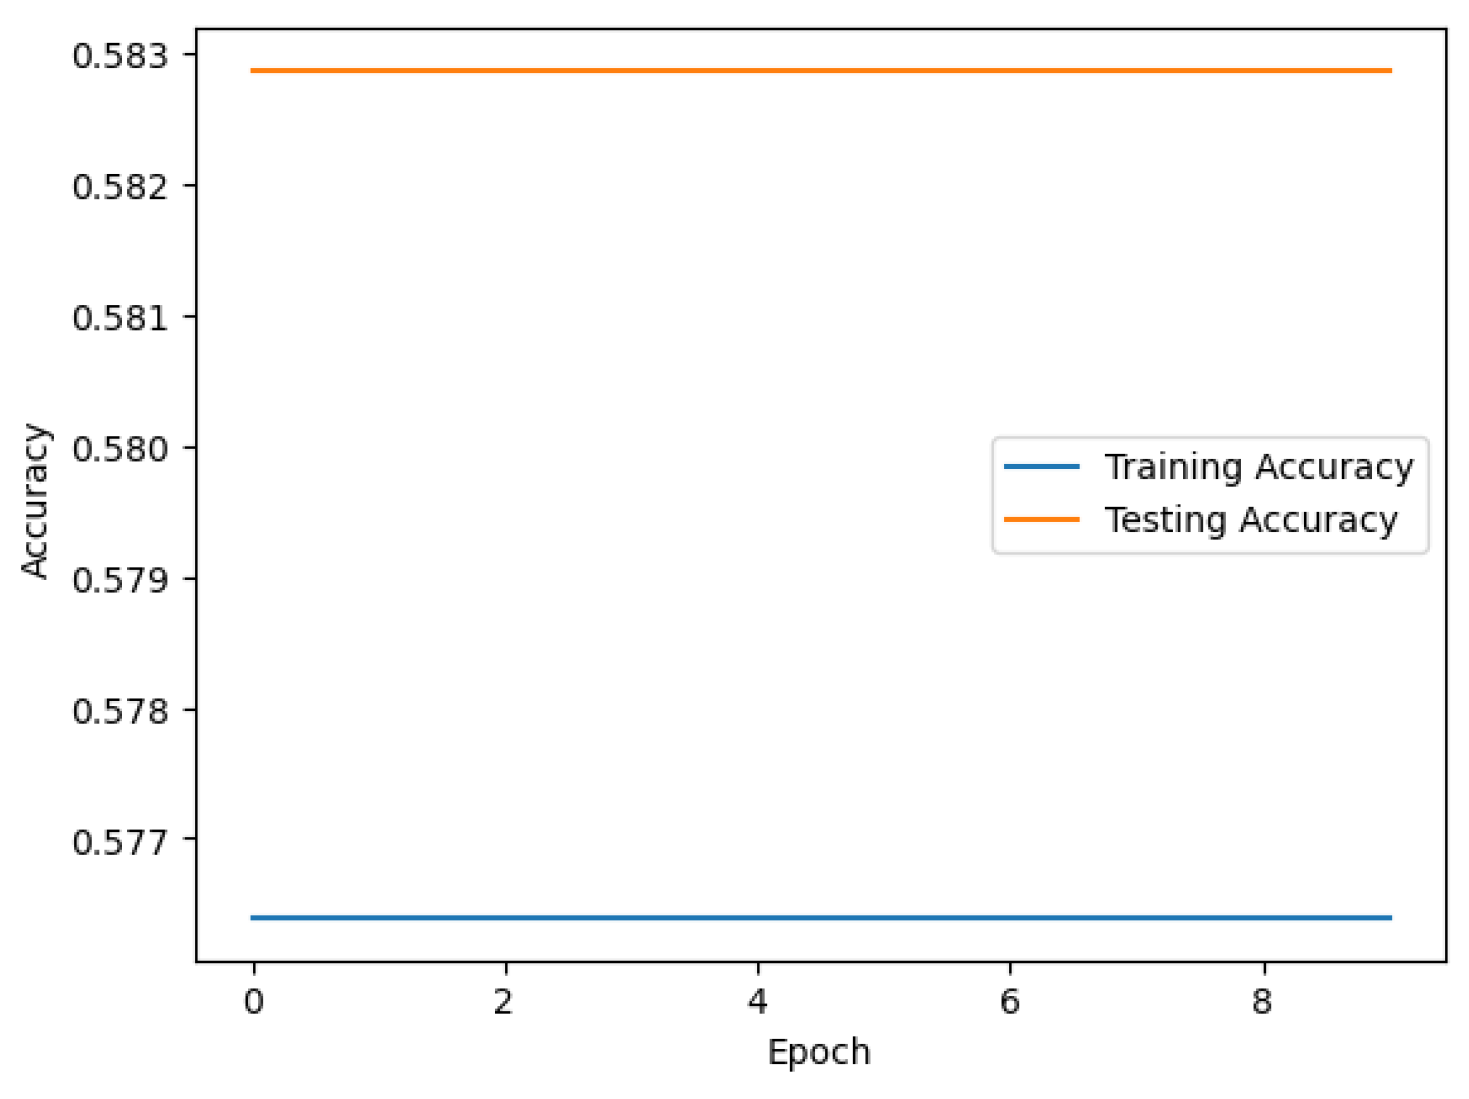
9.1. RNN
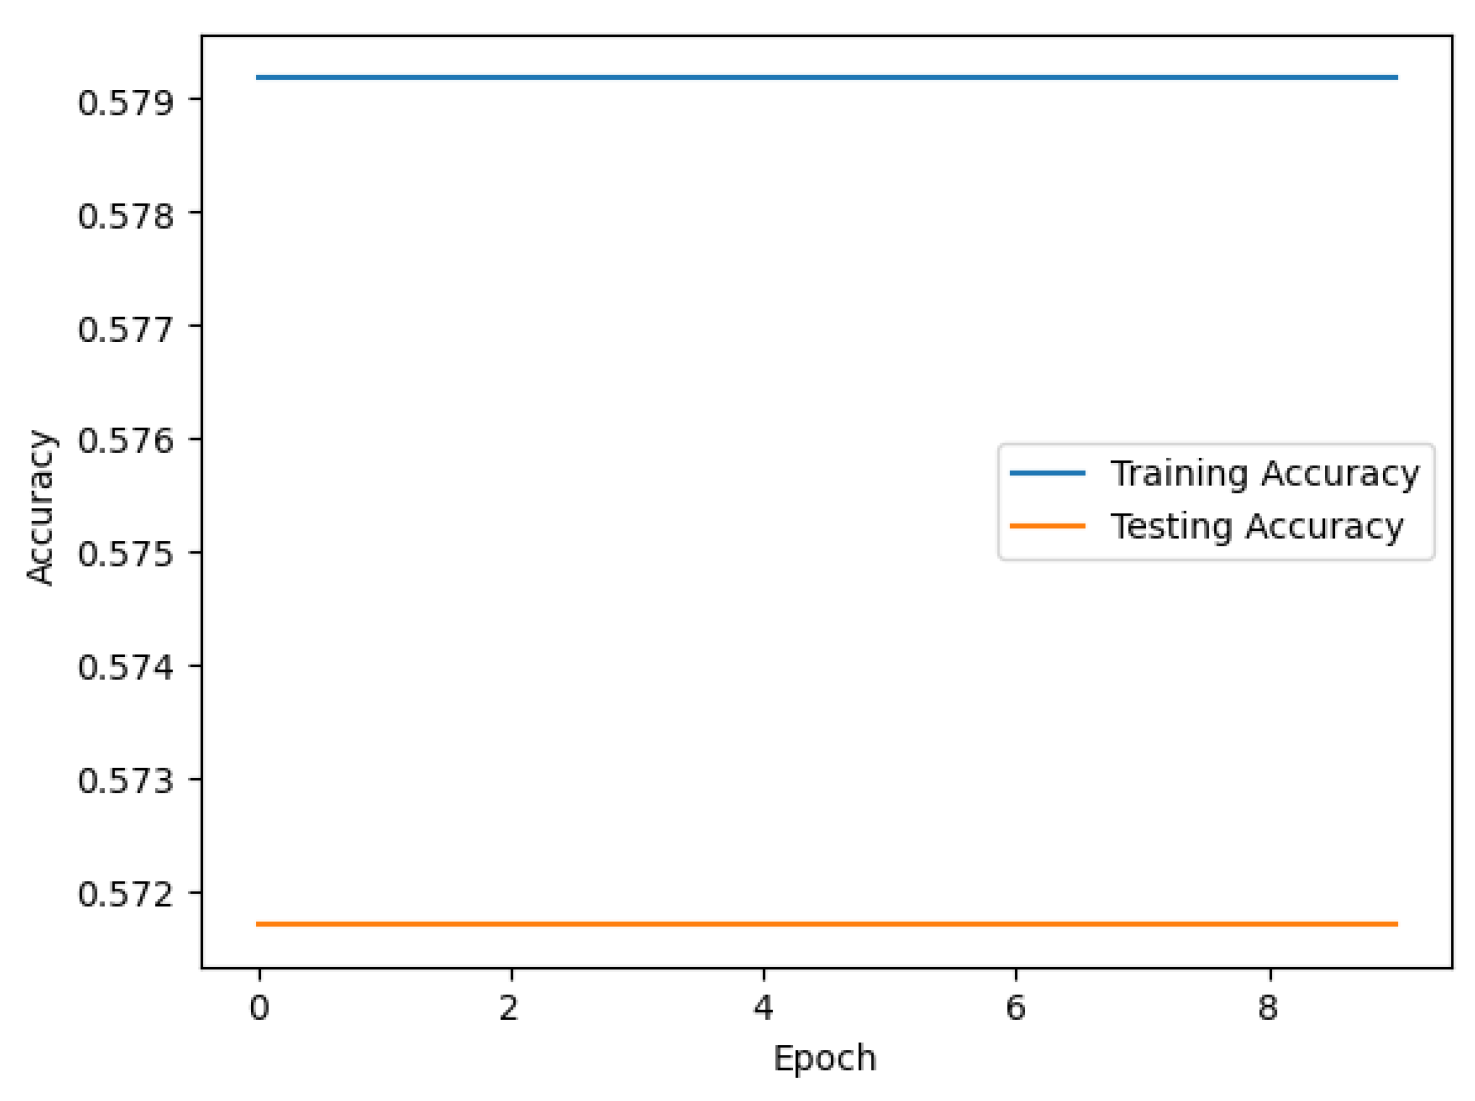
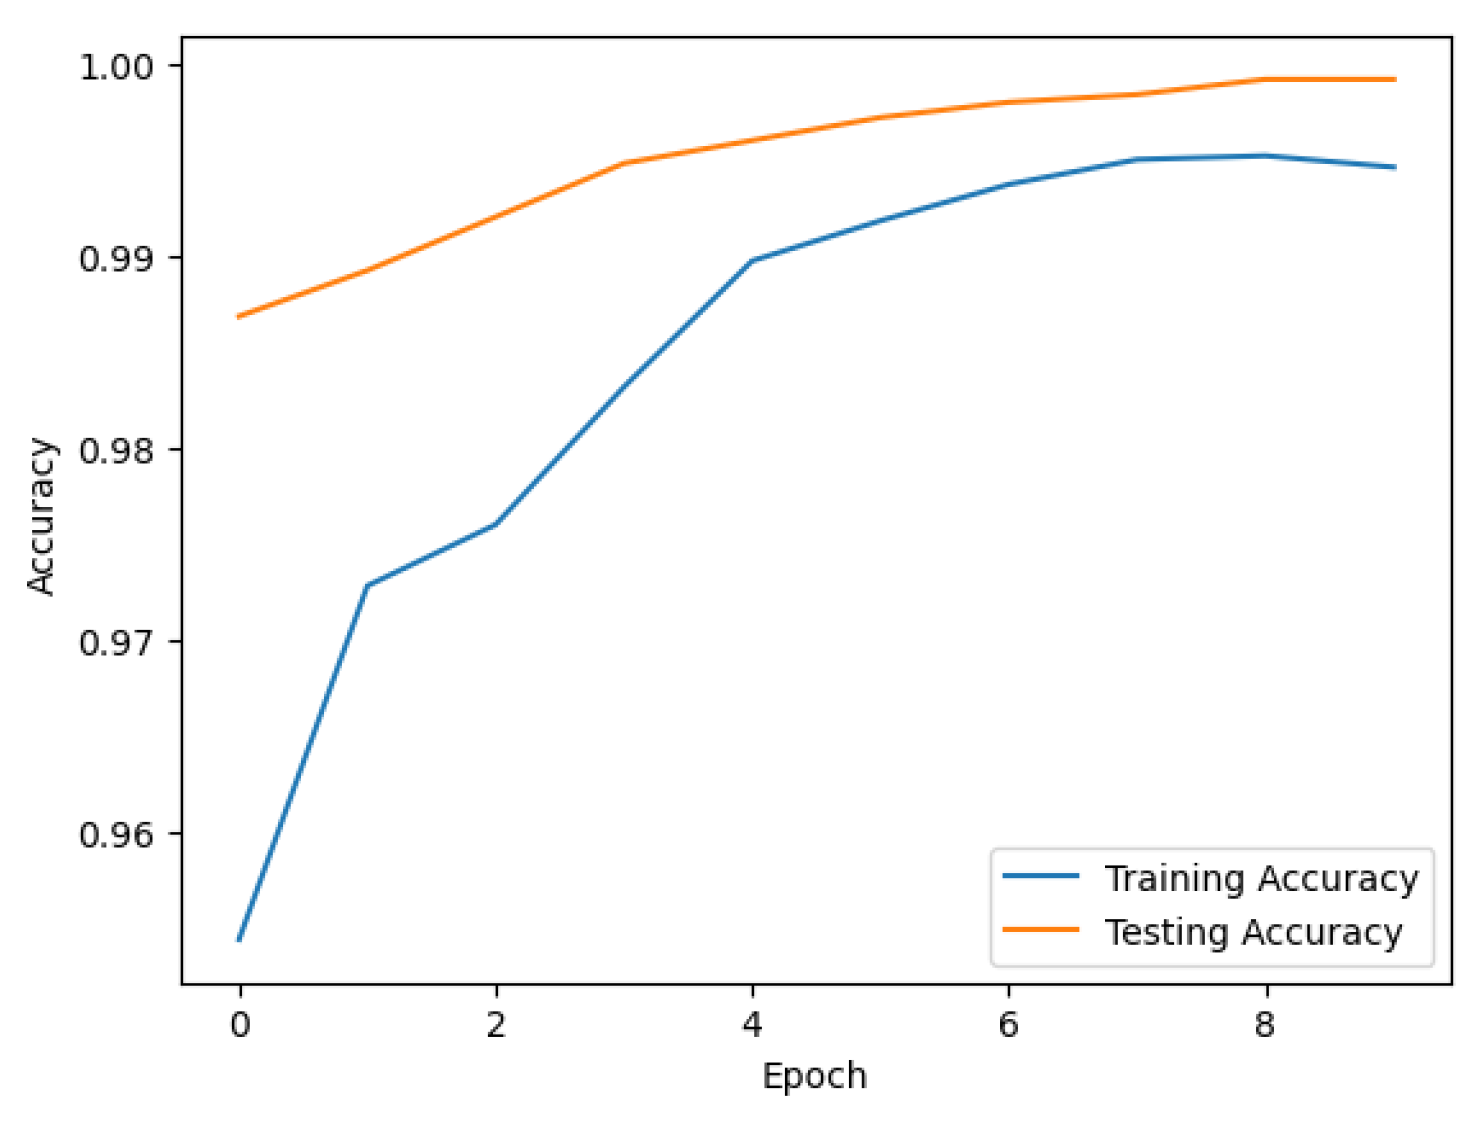
The RNN was trained on 10 epochs, whereas its testing and training accuracy fluctuated when training to a different activation function. The graphs represents the training and testing accuracy. The y-axis represents accuracy and x-axis represents epochs. The RNN has good accuracy with sigmoid and tanh activation function and worst accuracy with relu and elu. The Table 2 explains detail of accuracy. The appendix 1 represents graphs for test and train accuracy of RNN with activation function Sigmoid, Relu, Elu and Tanh.
9.2. CNN
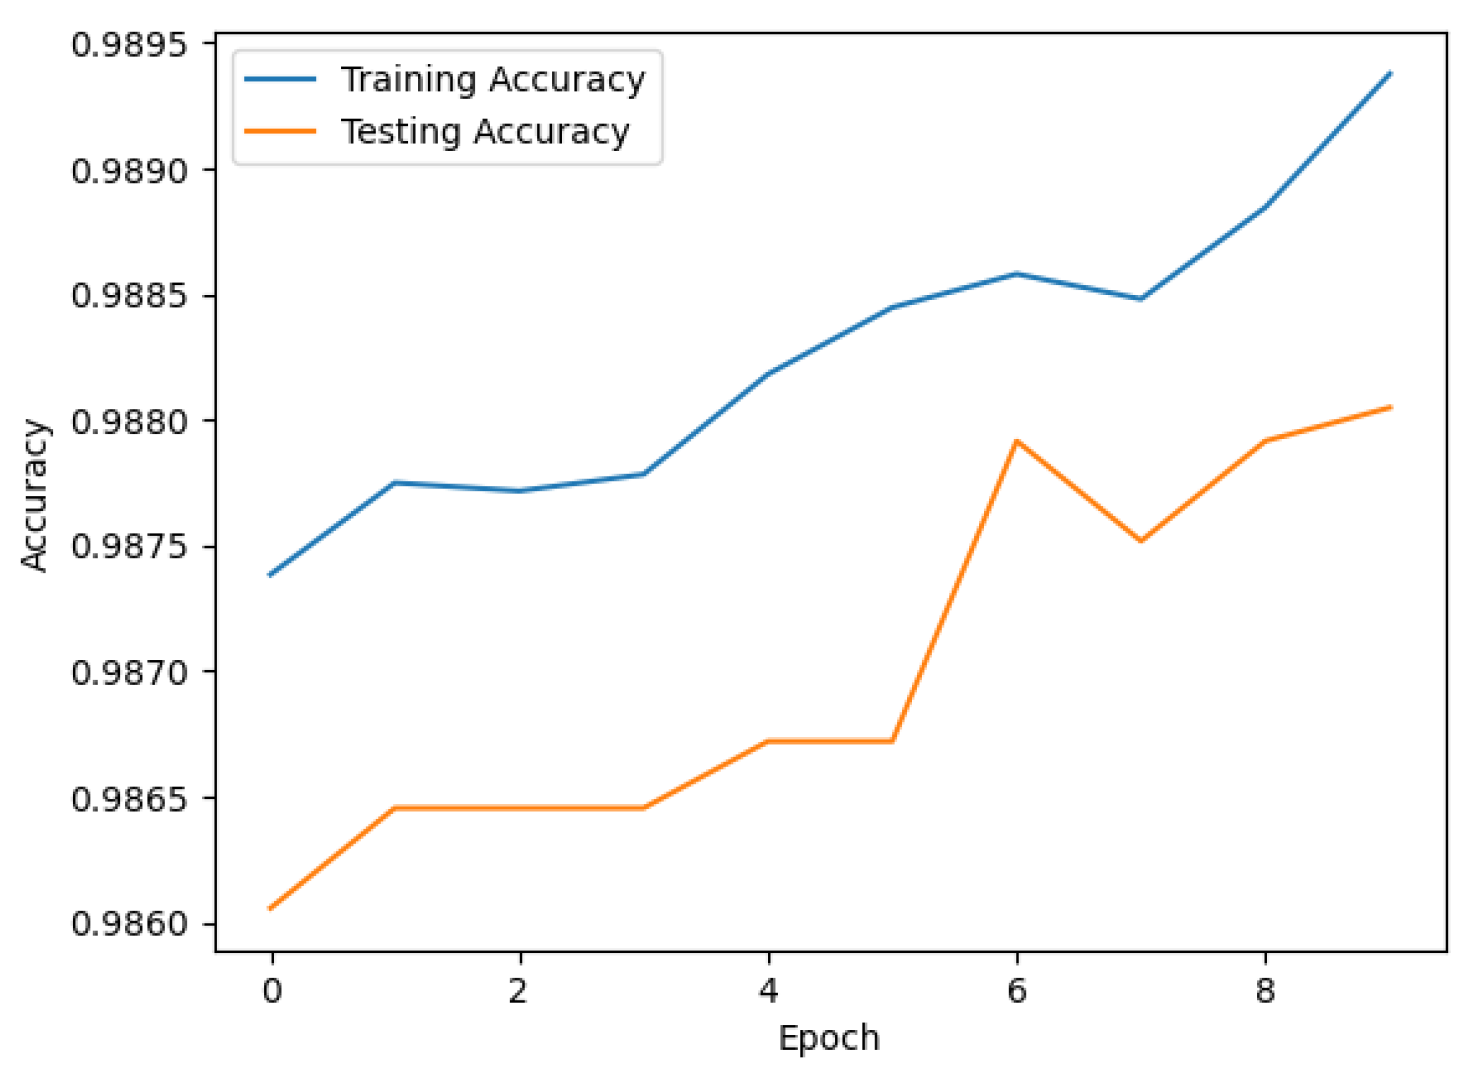
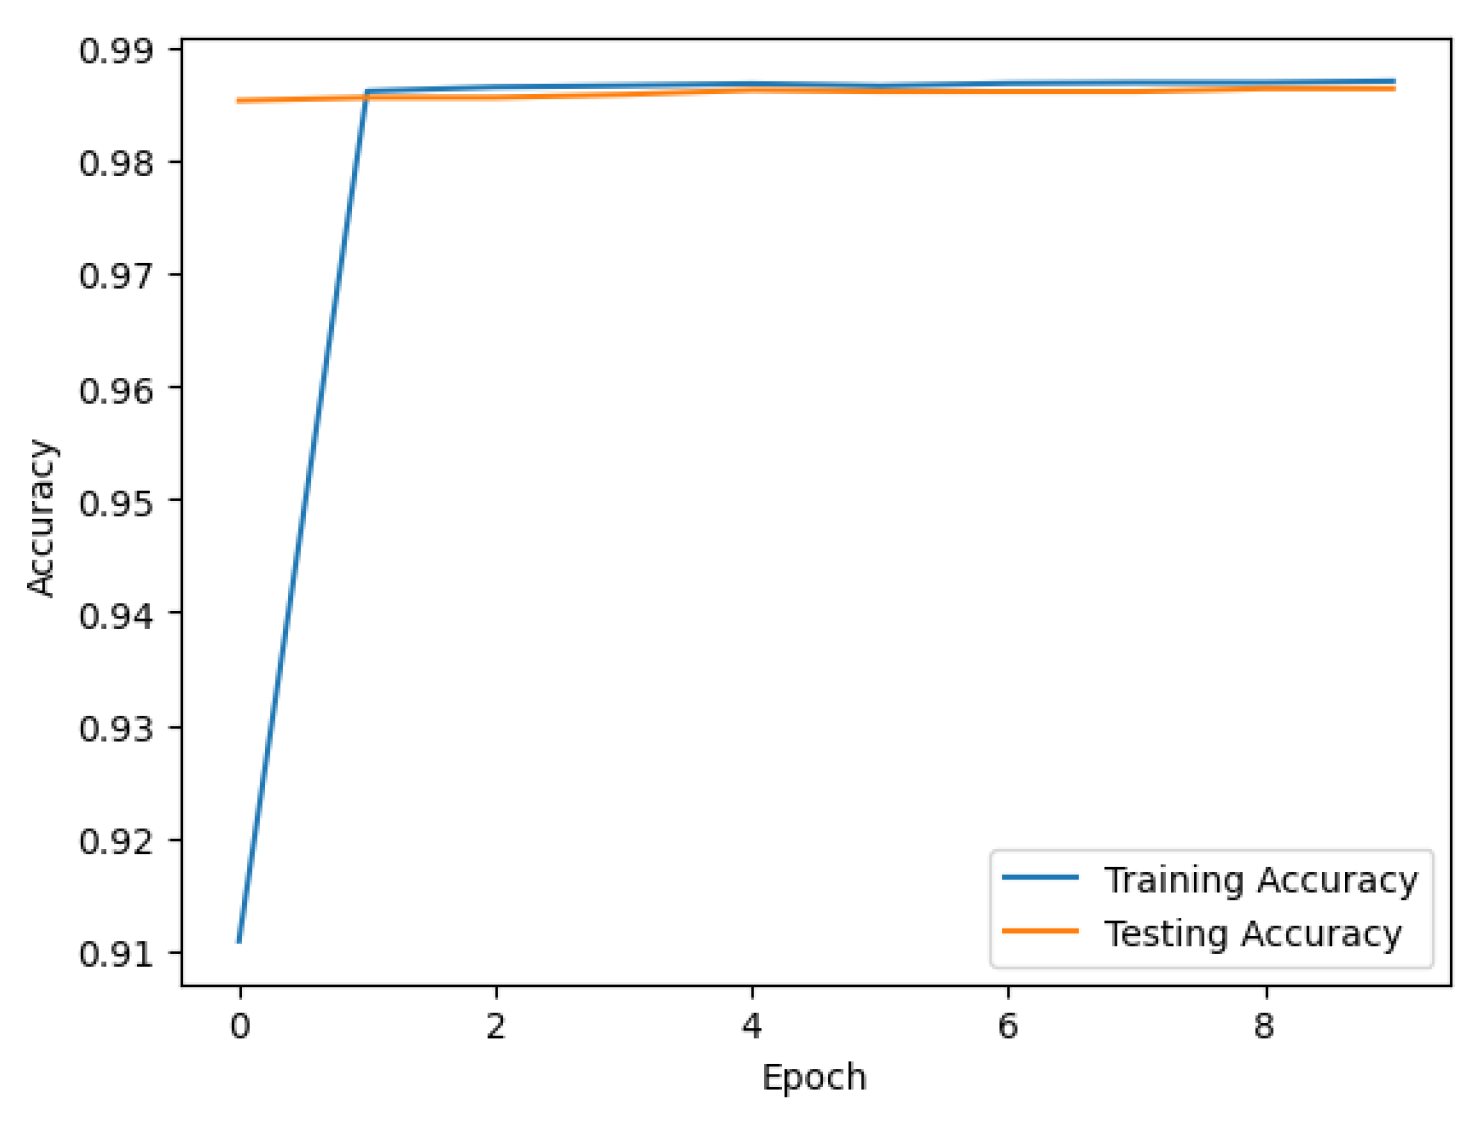
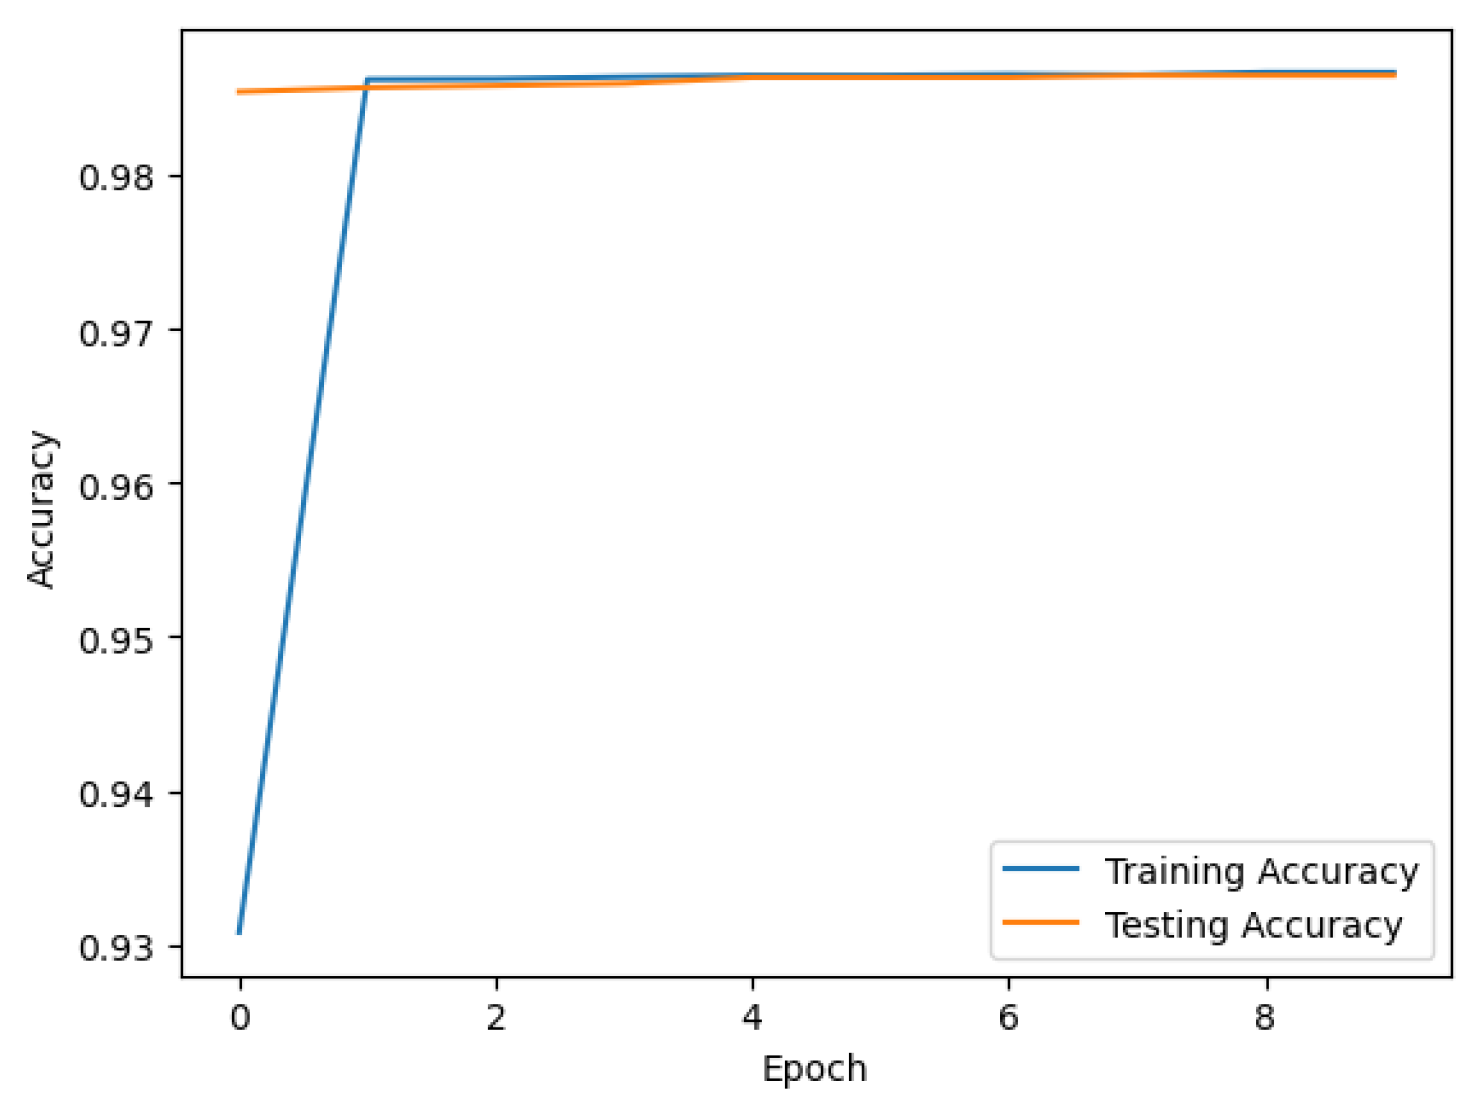
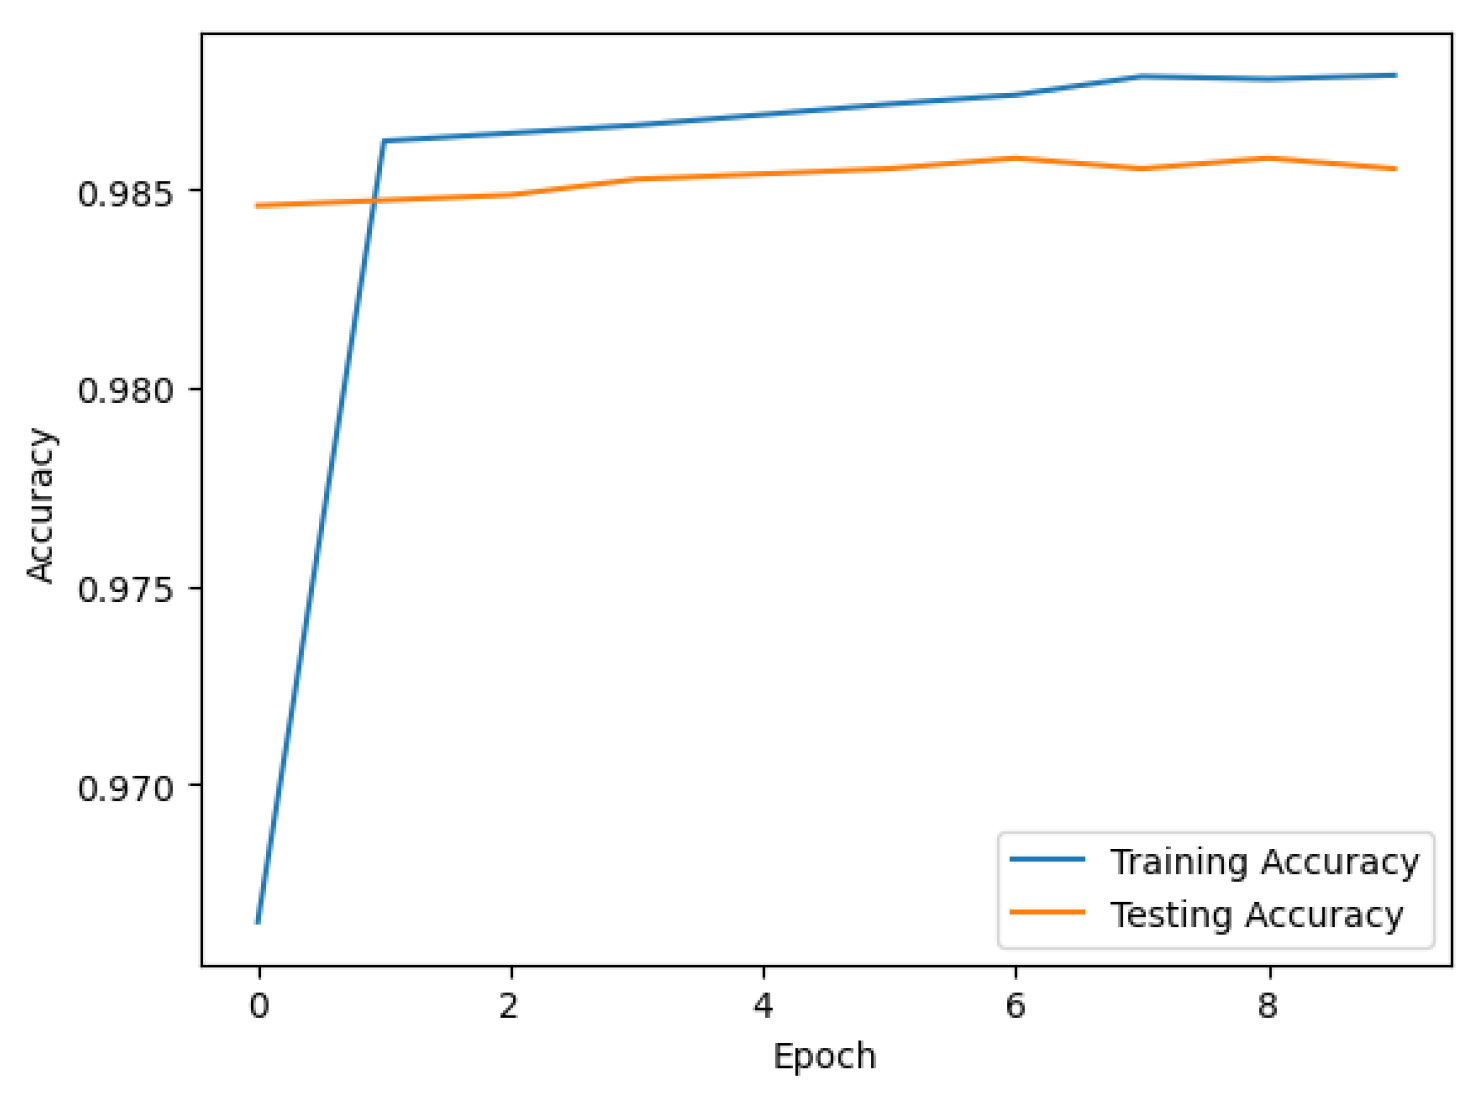
The CNN was trained on 10 epochs, whereas its testing and training accuracy remains stable unlike RNN, when training to a different activation function. The graphs represents the training and testing accuracy. The y-axis represents accuracy and x-axis represents epochs. The CNN has good testing accuracy 98.8% with sigmoid function and worst 98.6 with relu,elu and tanh. The Table 3 represents the detail of accuracy and loss according to activation functions. And the drop out is 0%. The appendix 2 represents graphs for test and train accuracy of CNN with activation function Sigmoid, Relu, Elu and Tanh.
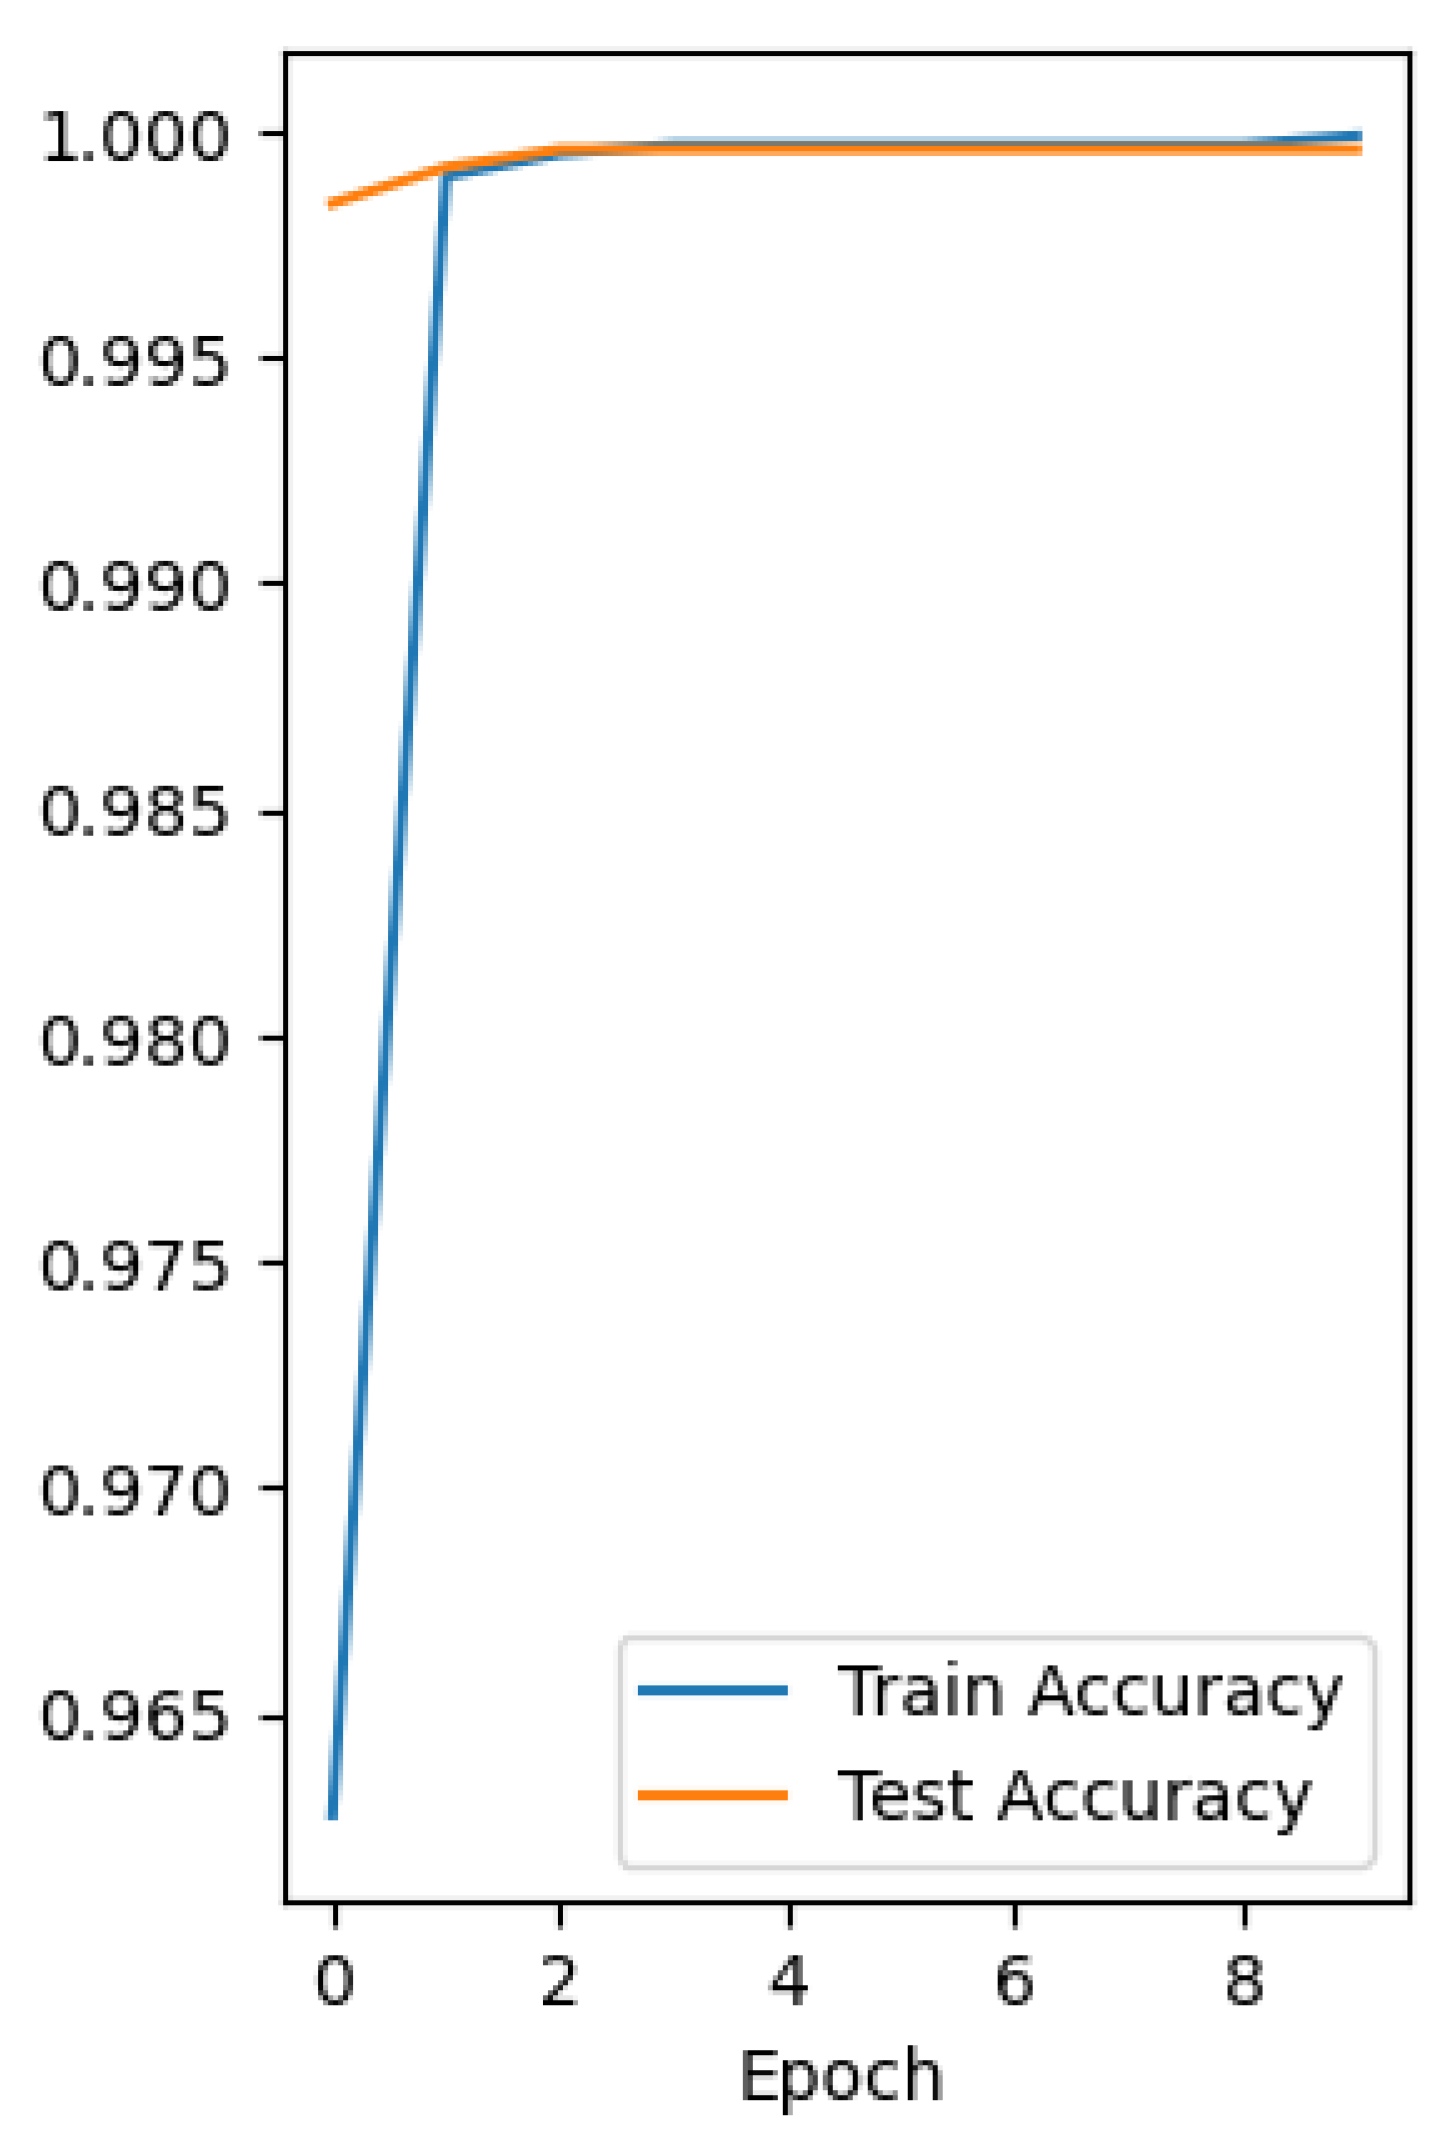
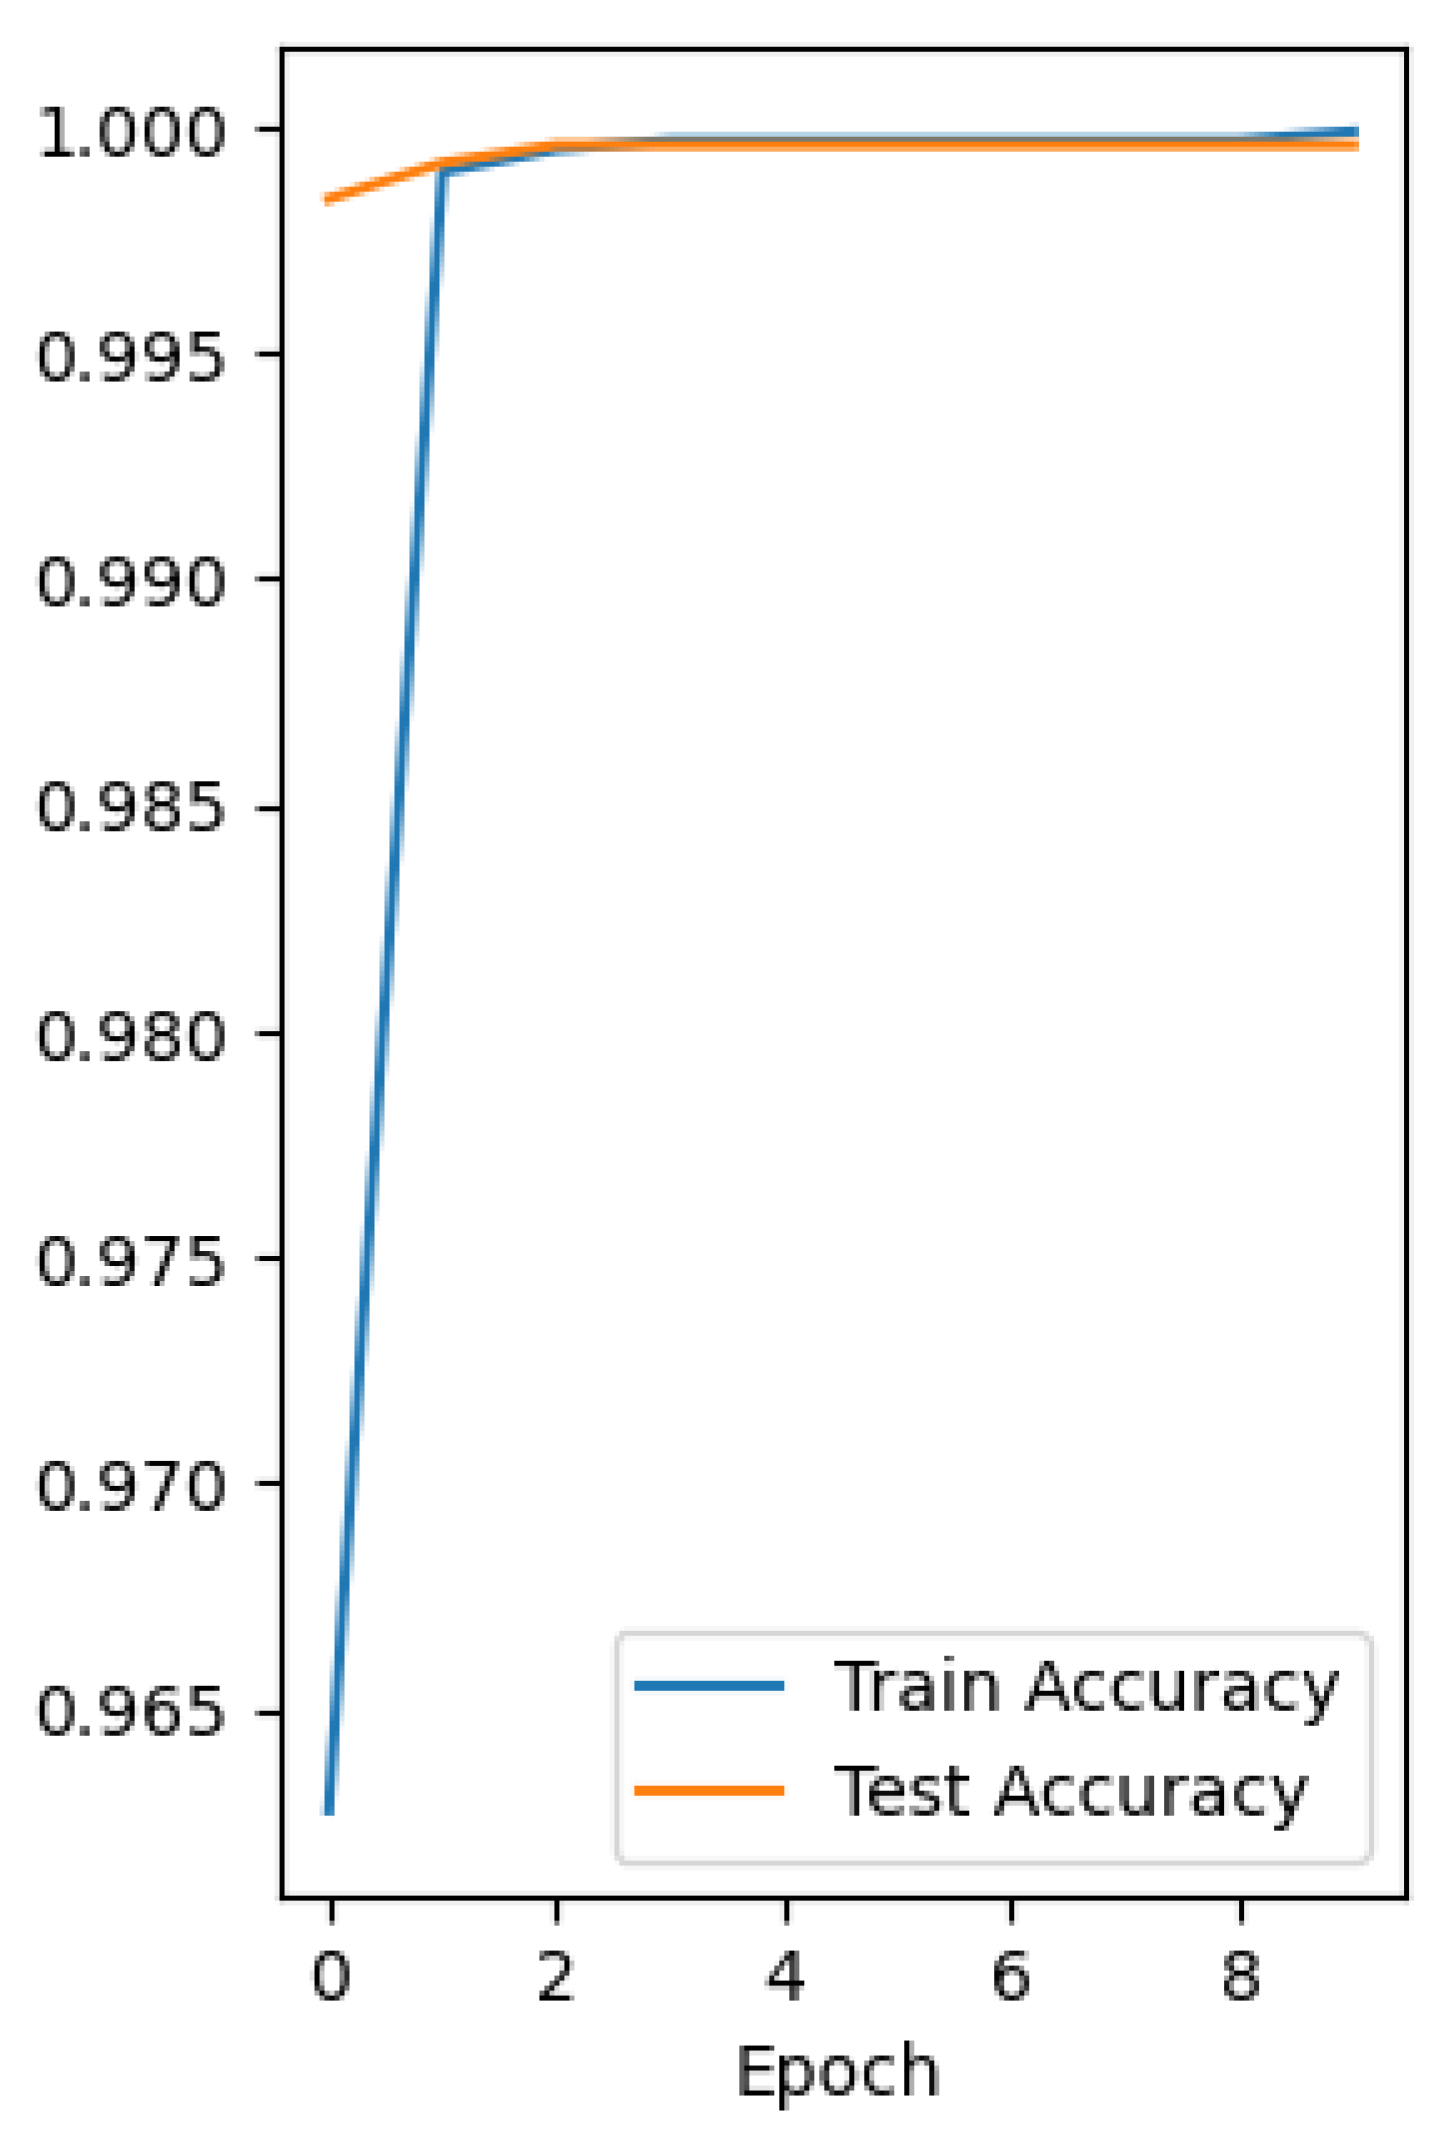
9.3. LSTM
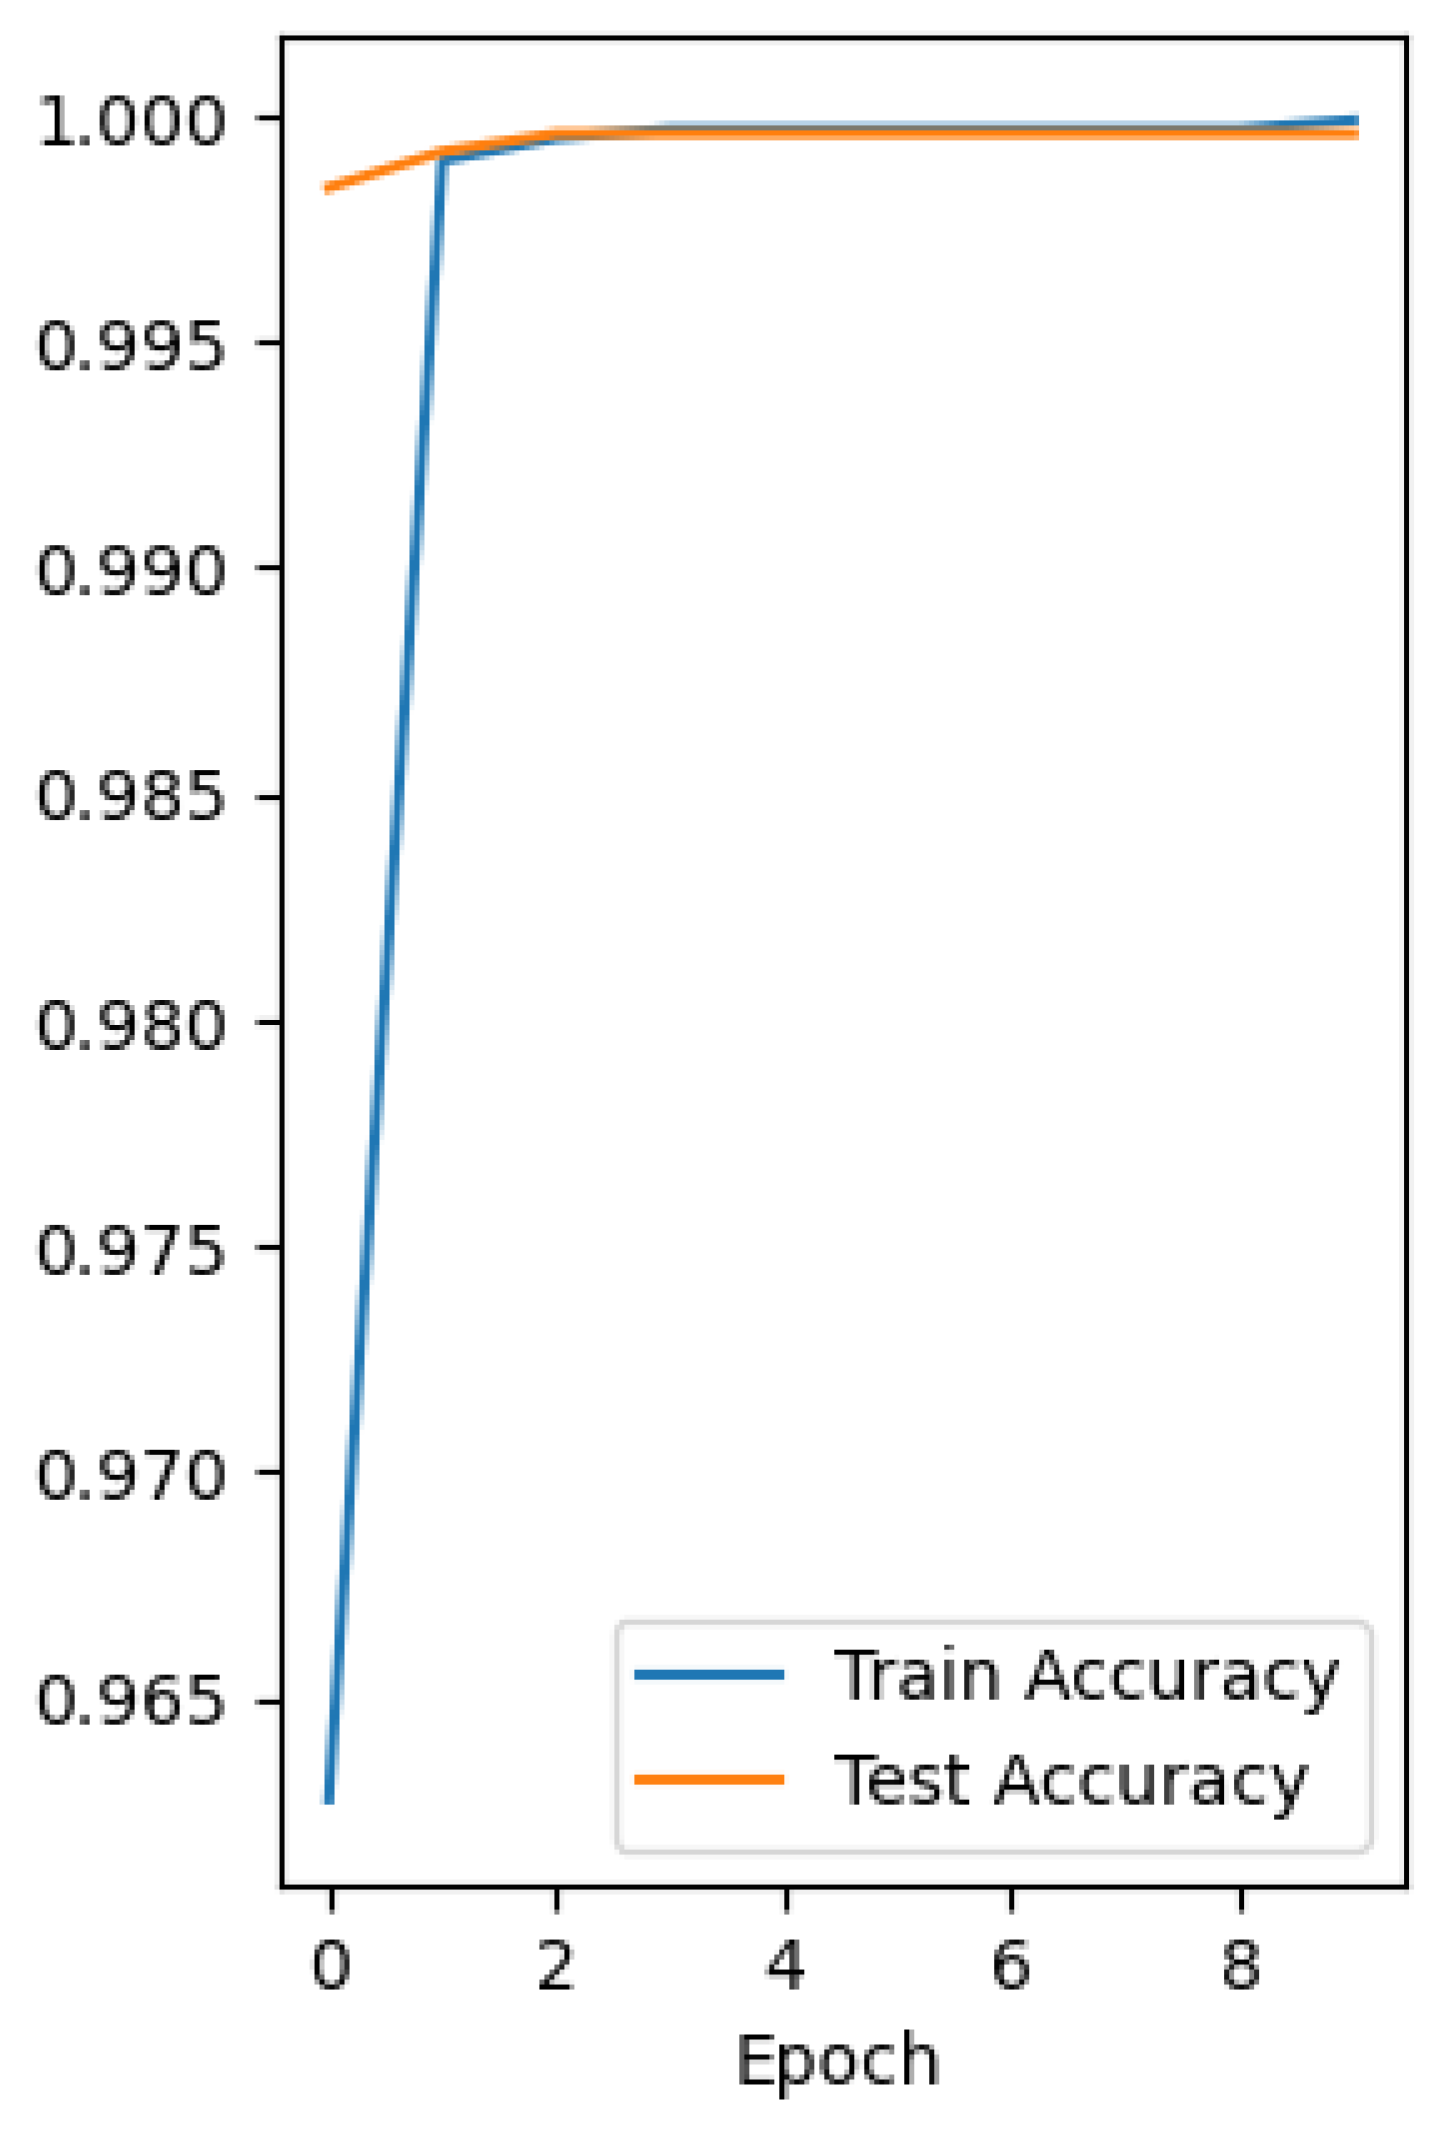
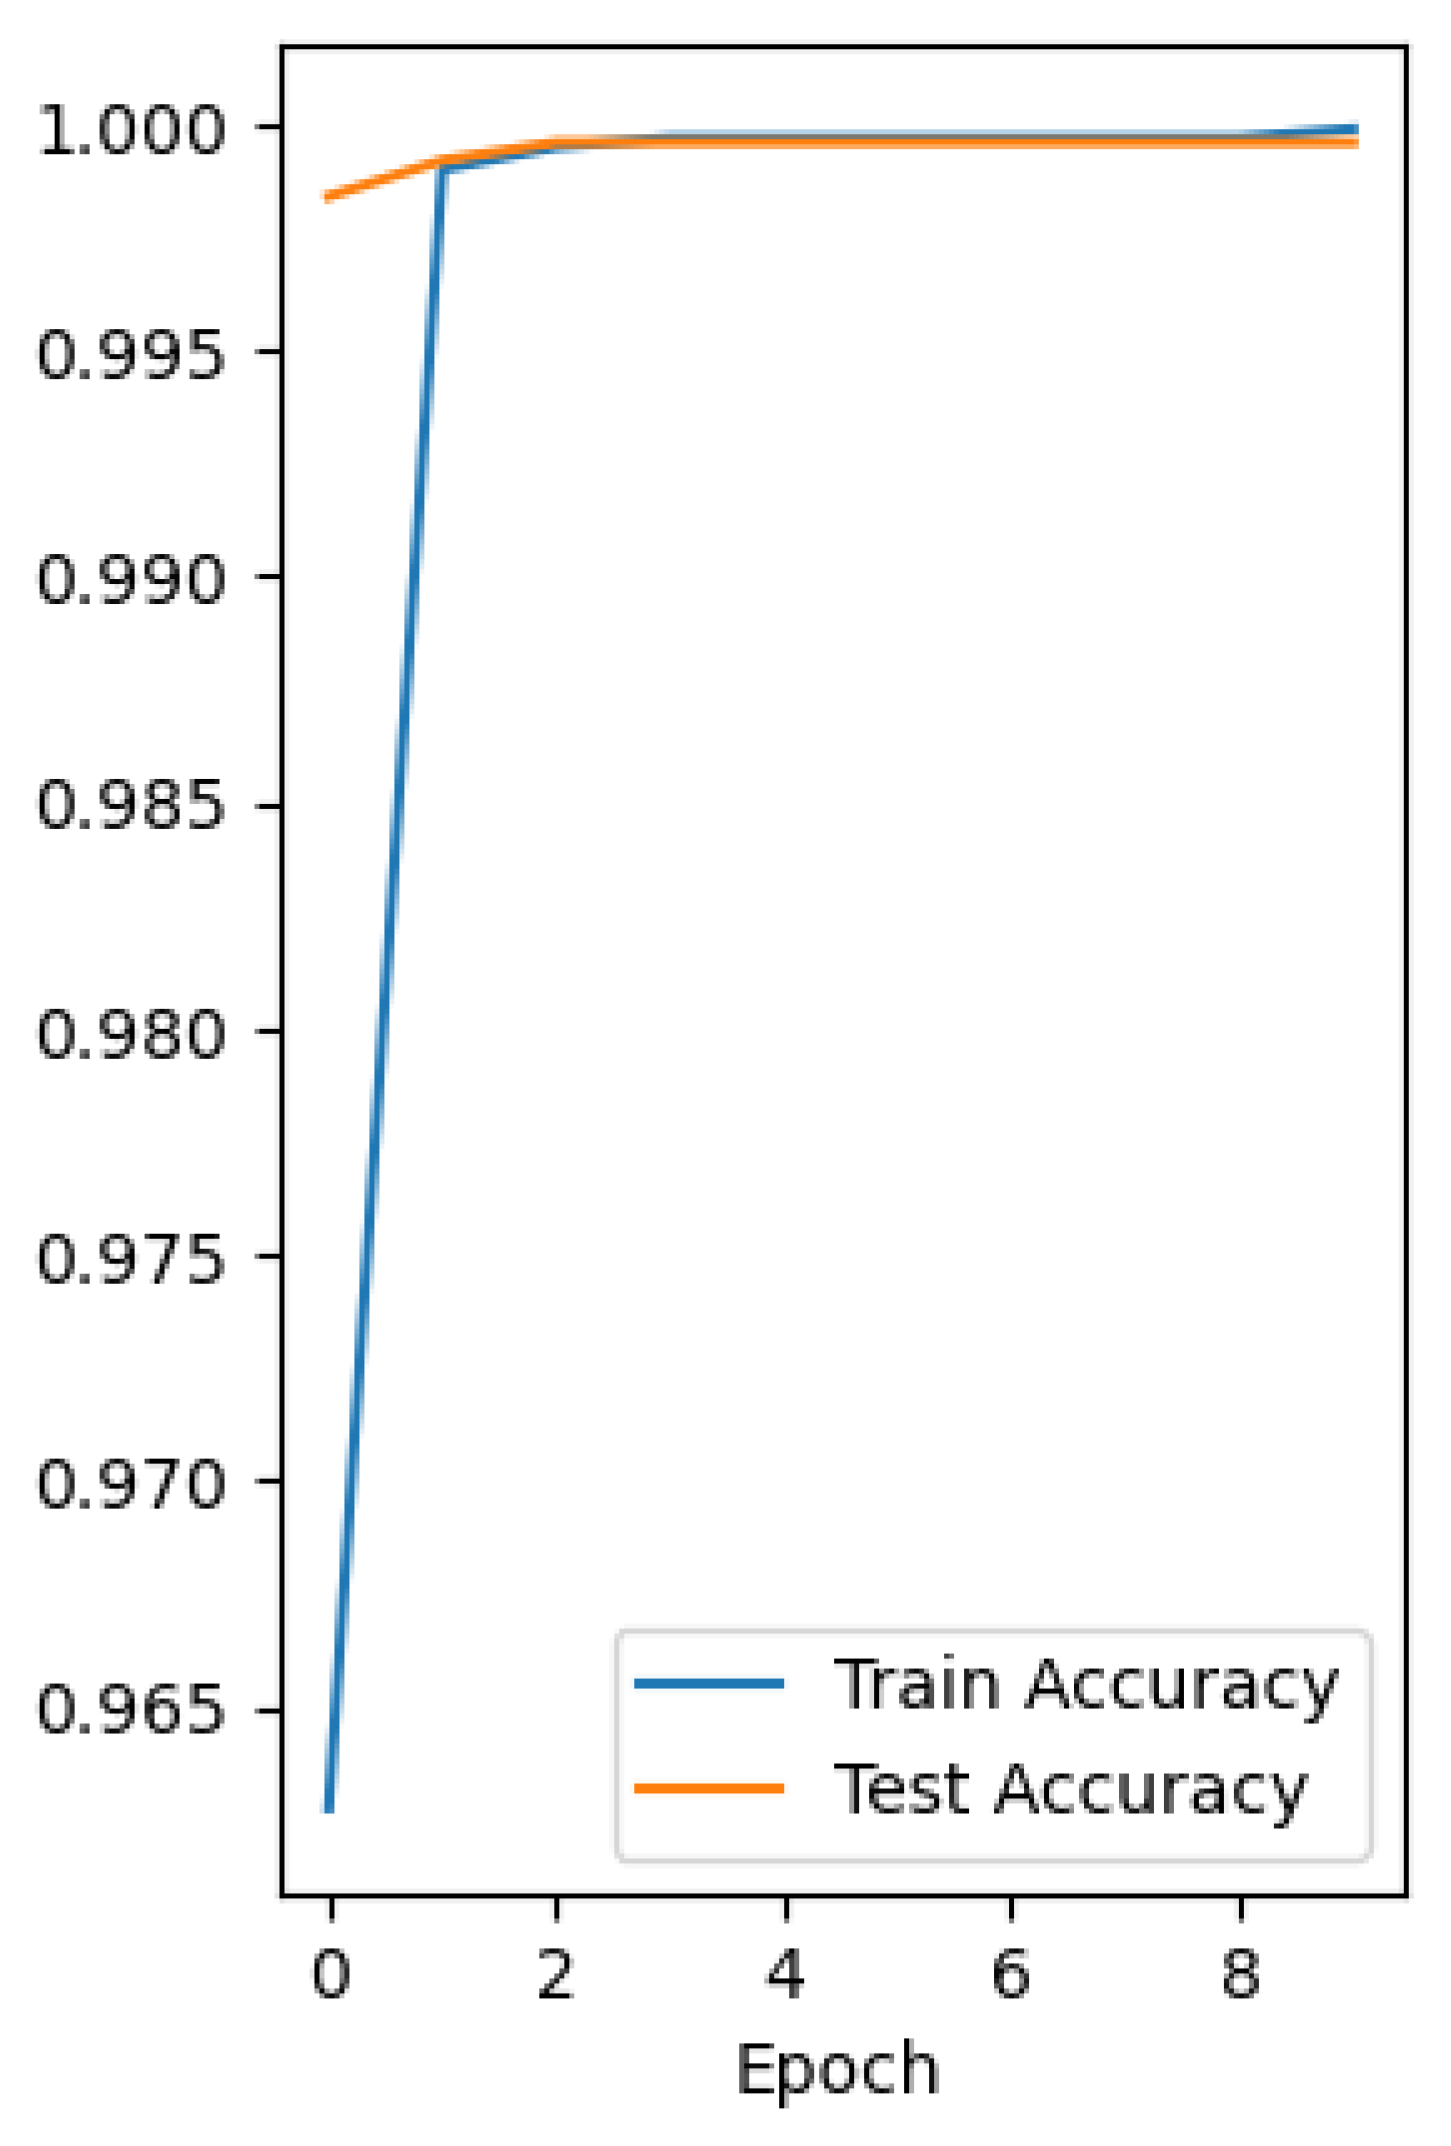
The LSTM was trained on 10 epochs, whereas its testing and training accuracy remains same unlike RNN and CNN, when training to a different activation function. The graphs represents the training and testing accuracy. The y-axis represents accuracy and x-axis represents epochs. LSTM out performs and can perform all tasks like labeling, training, testing of a large dataset in 24.4 seconds. Whereas test loss is 0 only with activation function elu and rest activaton functions used have a little bit of test loss. The LSTM has good testing accuracy 100% with sigmoid, relu,elu and tanh. The Table 4 represents the detail of accuracy and loss according to activation functions. And the drop out is 0%. The appendix 3 represents graphs for test and train accuracy of LSTM with activation function Sigmoid, Relu, Elu and Tanh.
10. Conclusion
This study aimed to revolutionize the agriculture of Pakistan. The system has integrated IoT and Deep learning that are advance and emerging technologies. The dataset is amalgamation of data augmentation and a crop recommendation dataset from kaggle. The study has explored deep learning models CNN, RNN and LSTM with hyper-parameter tuning. There are four activation functions used to test the models performs. The research findings are that LSTM out performs on all four activation functions and gave 100% results. So the LSTM with IoT makes a good combination and has promising results. Implementation of this model can digitize the agriculture and can provide ease to farmers to help them crop crops on even larger scale.
11. Future Work
- Further we will be enhancing our lab and the model predict fertilizer after analyzing the input values from the sensors.
- Then the water system will also be integrated into this model such that motor will be automated to start and give water to the plant as well. For this we will setup some more IoT devices like temperature sensor, humidity sensor, DC motor,water pump, moisture sensor, DHT11 sensor and DS18B20.
Appendix A Appendix 1
Appendix A.1. Figure A1: RNN with Sigmoid Graph
Figure A1.
RNN model test and train accuracy with Sigmoid

Appendix A.2. Figure A2: RNN with ReLU Graph
Figure A2.
RNN model test and train accuracy with Relu
Appendix A.3. Figure A3: RNN with ELU Graph
Figure A3.
RNN model test and train accuracy with Elu
Appendix A.4. Figure A4: RNN with Tanh Graph
Figure A4.
RNN model test and train accuracy with Tanh
Appendix B Appendix 2
Appendix B.1. Figure B1: CNN with Sigmoid Graph
Figure A5.
CNN model test and train accuracy with Sigmoid
Appendix B.2. Figure B2: CNN with ReLU Graph
Figure A6.
CNN model test and train accuracy with Relu
Appendix B.3. Figure B3: CNN with ELU Graph
Figure A7.
CNN model test and train accuracy with Elu
Appendix B.4. Figure B4: CNN with Tanh Graph
Figure A8.
CNN model test and train accuracy with Tanh
Appendix C Appendix 3
Appendix C.1. Figure C1: LSTM with Sigmoid Graph
Figure A9.
LSTM model test and train accuracy with Sigmoid
Appendix C.2. Figure C2: LSTM with ReLU Graph
Figure A10.
LSTM model test and train accuracy with Relu
Appendix C.3. Figure C3: LSTM with ELU Graph
Figure A11.
LSTM model test and train accuracy with Elu
Appendix C.4. Figure C4: LSTM with Tanh Graph
Figure A12.
LSTM model test and train accuracy with Tanh
References
- Koohang, A.; Sargent, C.S.; Nord, J.H.; Paliszkiewicz, J. Internet of Things (IoT): From awareness to continued use. International Journal of Information Management 2022, 62, 102442. [Google Scholar] [CrossRef]
- Alablani, I.; Alenazi, M. EDTD-SC: An IoT sensor deployment strategy for smart cities. sensors 2020, 20, 7191. [Google Scholar] [CrossRef] [PubMed]
- Fan, Q.; Ansari, N. Towards traffic load balancing in drone-assisted communications for IoT. IEEE Internet of Things Journal 2018, 6, 3633–3640. [Google Scholar] [CrossRef]
- Kelleher, J.D. Deep learning; MIT press, 2019.
- Ray, P.P. Internet of things for smart agriculture: Technologies, practices and future direction. Journal of Ambient Intelligence and Smart Environments 2017, 9, 395–420. [Google Scholar] [CrossRef]
- Pachayappan, M.; Ganeshkumar, C.; Sugundan, N. Technological implication and its impact in agricultural sector: An IoT Based Collaboration framework. Procedia Computer Science 2020, 171, 1166–1173. [Google Scholar] [CrossRef]
- Anusha, A.; Guptha, A.; Rao, G.S.; Tenali, R.K. A model for smart agriculture using IOT. International Journal of Innovative Technology and Exploring Engineering (IJITEE) 2019, 8. [Google Scholar]
- Davcev, D.; Mitreski, K.; Trajkovic, S.; Nikolovski, V.; Koteli, N. IoT agriculture system based on LoRaWAN. 2018 14th IEEE International Workshop on Factory Communication Systems (WFCS). IEEE, 2018, pp. 1–4. [CrossRef]
- Hu, Z.; Bashir, R.N.; Rehman, A.U.; Iqbal, S.I.; Shahid, M.M.A.; Xu, T. Machine learning based prediction of reference evapotranspiration (et 0) using iot. IEEE Access 2022, 10, 70526–70540. [Google Scholar] [CrossRef]
- Patil, S.S.; Thorat, S.A. Early detection of grapes diseases using machine learning and IoT. 2016 second international conference on Cognitive Computing and Information Processing (CCIP). IEEE, 2016, pp. 1–5. [CrossRef]
- Reddy, K.S.P.; Roopa, Y.M.; LN, K.R.; Nandan, N.S. IoT based smart agriculture using machine learning. 2020 Second international conference on inventive research in computing applications (ICIRCA). IEEE, 2020, pp. 130–134. [CrossRef]
- Asha, K.; Gahana, N.; Gowda, S.; Harsha, C.; Chandana, D. Agriculture Automation System using Machine Learning and Internet of Things. International Journal of Engineering and Management Research 2023, 13, 163–167. [Google Scholar]
- Bakthavatchalam, K.; Karthik, B.; Thiruvengadam, V.; Muthal, S.; Jose, D.; Kotecha, K.; Varadarajan, V. IoT framework for measurement and precision agriculture: predicting the crop using machine learning algorithms. Technologies 2022, 10, 13. [Google Scholar] [CrossRef]
- Shaikh, T.A.; Mir, W.A.; Rasool, T.; Sofi, S. Machine learning for smart agriculture and precision farming: towards making the fields talk. Archives of Computational Methods in Engineering 2022, 29, 4557–4597. [Google Scholar] [CrossRef]
- Rezk, N.G.; Hemdan, E.E.D.; Attia, A.F.; El-Sayed, A.; El-Rashidy, M.A. An efficient IoT based smart farming system using machine learning algorithms. Multimedia Tools and Applications 2021, 80, 773–797. [Google Scholar] [CrossRef]
- Moupojou, E.; Tagne, A.; Retraint, F.; Tadonkemwa, A.; Wilfried, D.; Tapamo, H.; Nkenlifack, M. FieldPlant: A Dataset of Field Plant Images for Plant Disease Detection and Classification With Deep Learning. IEEE Access 2023, 11, 35398–35410. [Google Scholar] [CrossRef]
- Bu, F.; Wang, X. A smart agriculture IoT system based on deep reinforcement learning. Future Generation Computer Systems 2019, 99, 500–507. [Google Scholar] [CrossRef]
- Varman, S.A.M.; Baskaran, A.R.; Aravindh, S.; Prabhu, E. Deep learning and IoT for smart agriculture using WSN. 2017 ieee international conference on computational intelligence and computing research (ICCIC). IEEE, 2017, pp. 1–6. [CrossRef]
- .
- Technical report.
- Tabbasum, S.; Akhtar, M.; Sarwar, N.; Tipu, M.I.; Ikram, W.; Ashraf, A.; Ejaz, A.; Murtaza, B.; Khan, M.R. Relative effectiveness of phosphorus and potassium along with compost and organic acids on maize crop grown in calcareous soil: A multivariate analysis. Journal of Soil Science and Plant Nutrition 2021, 21, 437–449. [Google Scholar] [CrossRef]
- Syed, A.; Sarwar, G.; Shah, S.H.; Muhammad, S. Soil salinity research in 21st century in Pakistan: its impact on availability of plant nutrients, growth and yield of crops. Communications in Soil Science and Plant Analysis 2021, 52, 183–200. [Google Scholar] [CrossRef]
- Dharani, M.; Thamilselvan, R.; Natesan, P.; Kalaivaani, P.; Santhoshkumar, S. Review on crop prediction using deep learning techniques. Journal of Physics: Conference Series. IOP Publishing, 2021, Vol. 1767, p. 012026. [CrossRef]
Figure 1.
This figure elaborate the working of Internet of Things (IoT). The main medium to connect user and devices is Internet
Figure 1.
This figure elaborate the working of Internet of Things (IoT). The main medium to connect user and devices is Internet
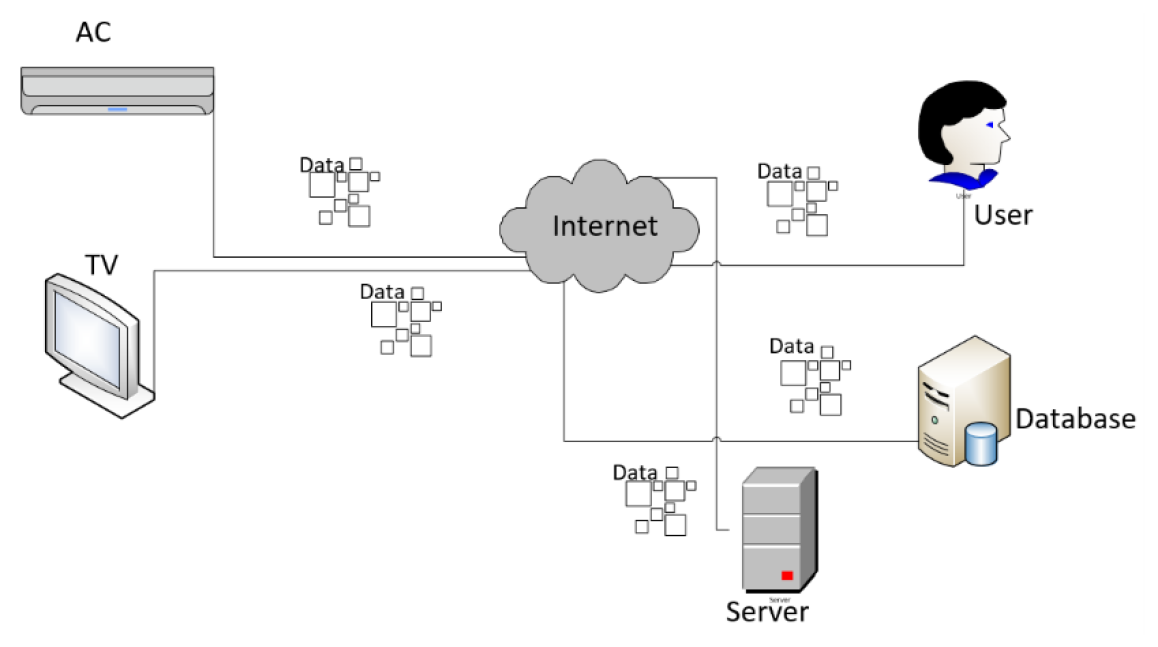
Figure 2.
The Fix Deployment of sensors are shown in figure. Cluster is the main device in this scenario
Figure 2.
The Fix Deployment of sensors are shown in figure. Cluster is the main device in this scenario
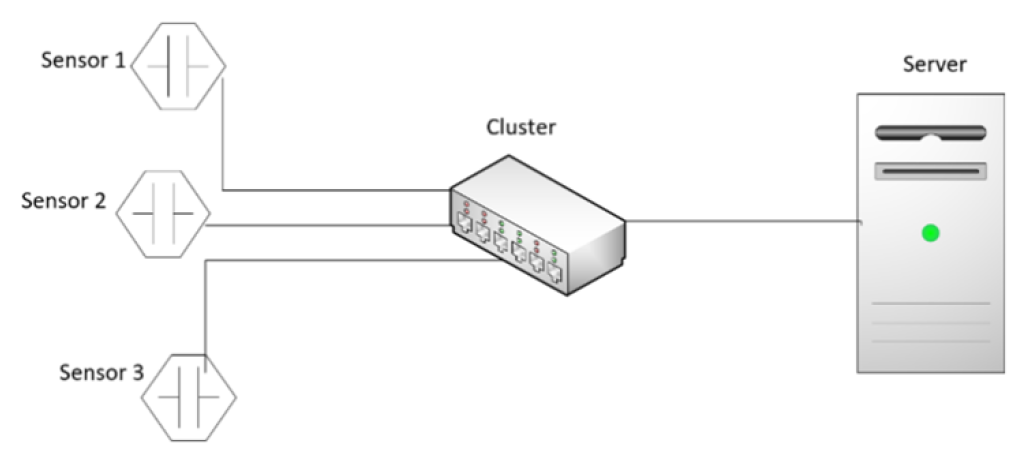
Figure 3.
The is deployment using copter. Copter is a flying object that carry sensors and gather data.
Figure 3.
The is deployment using copter. Copter is a flying object that carry sensors and gather data.
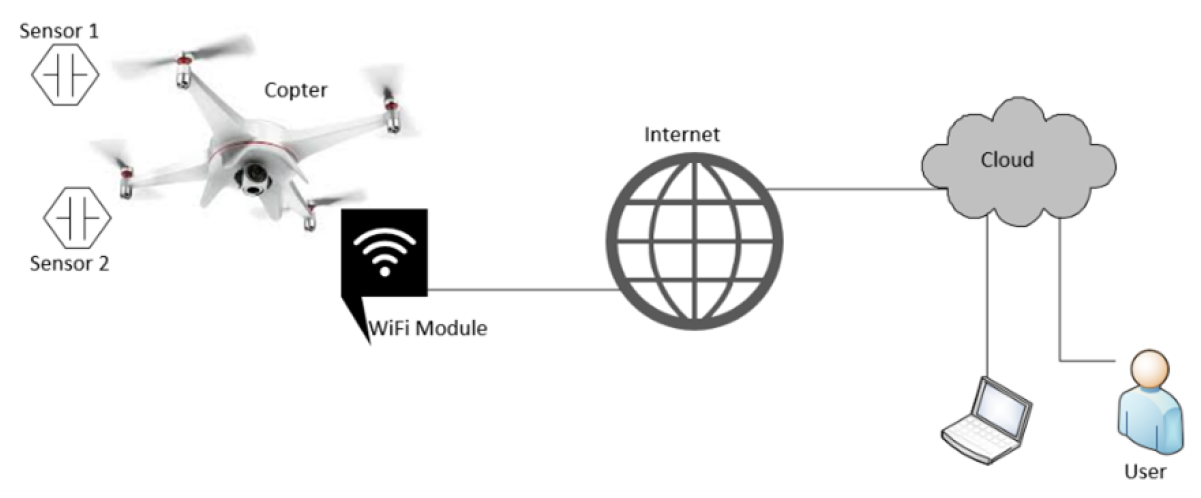
Figure 7.
Connectivity of the integrated system
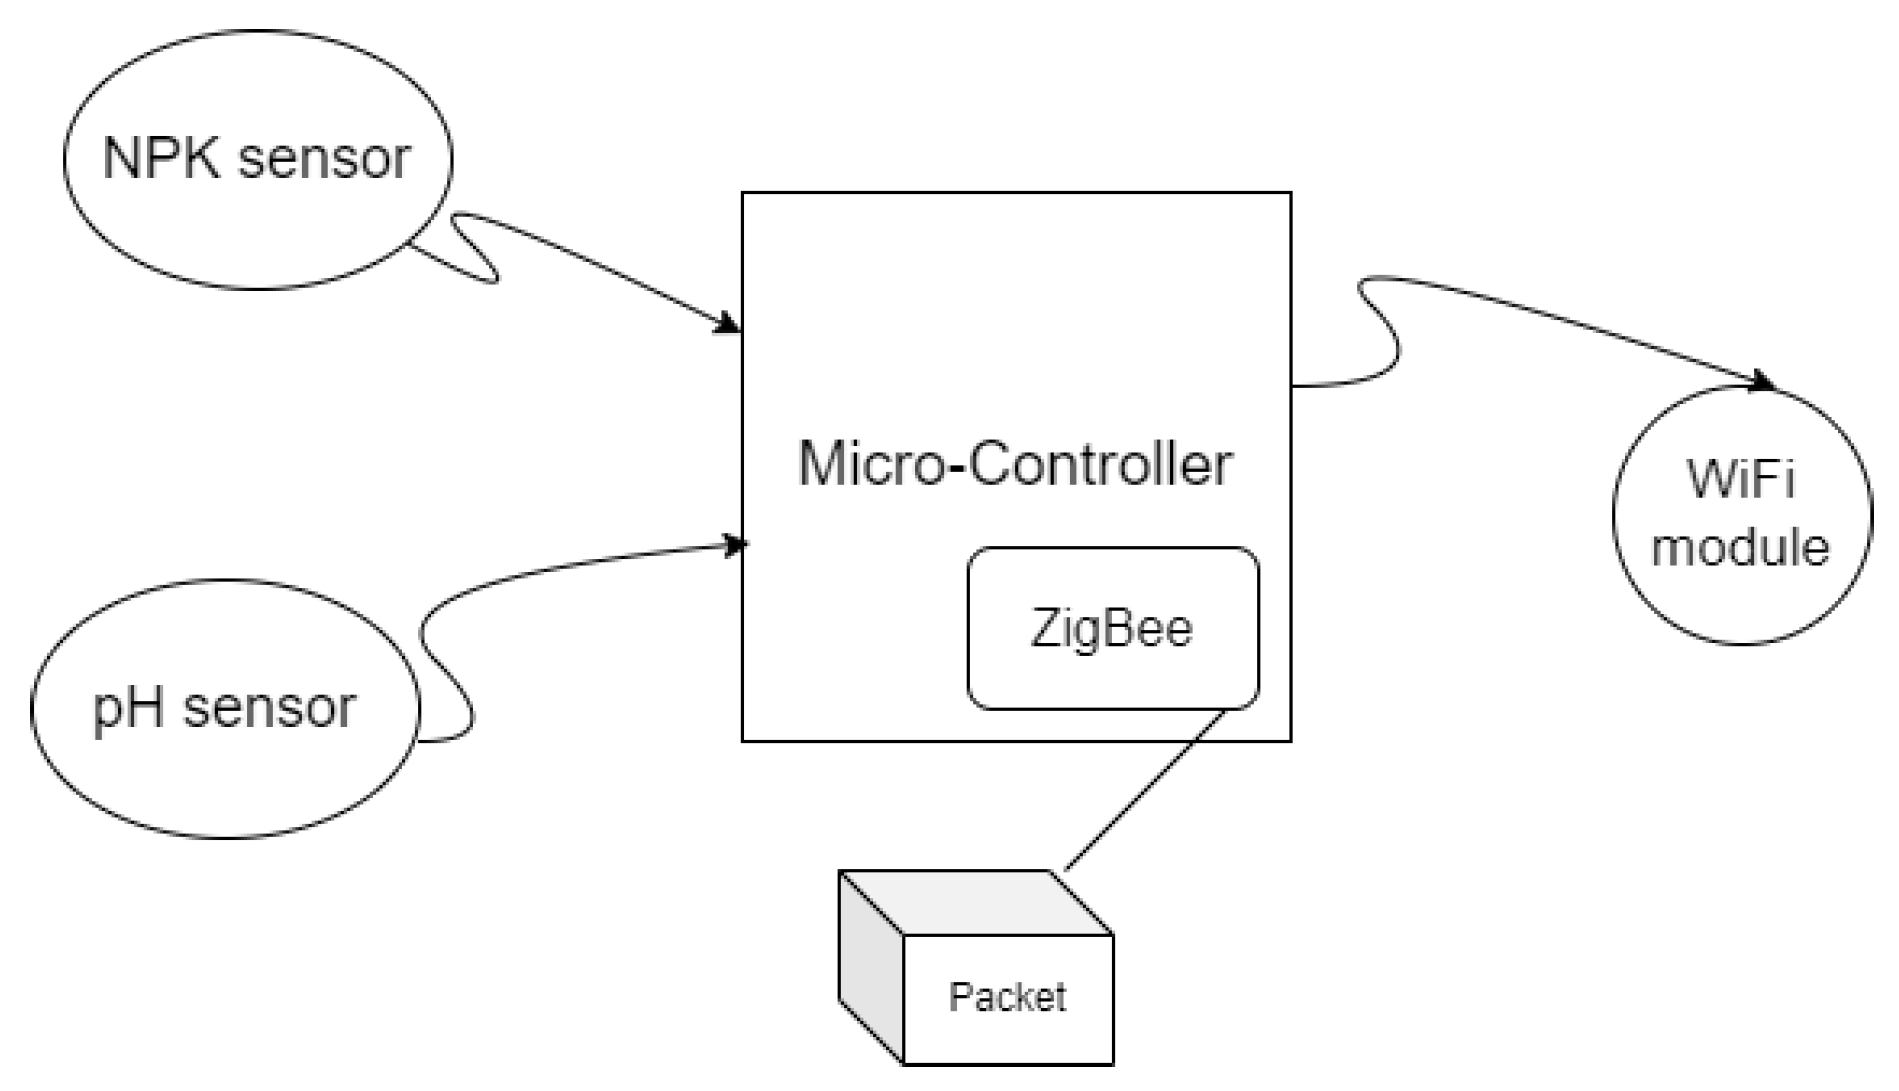
Figure 8.
Real-time Integrated System
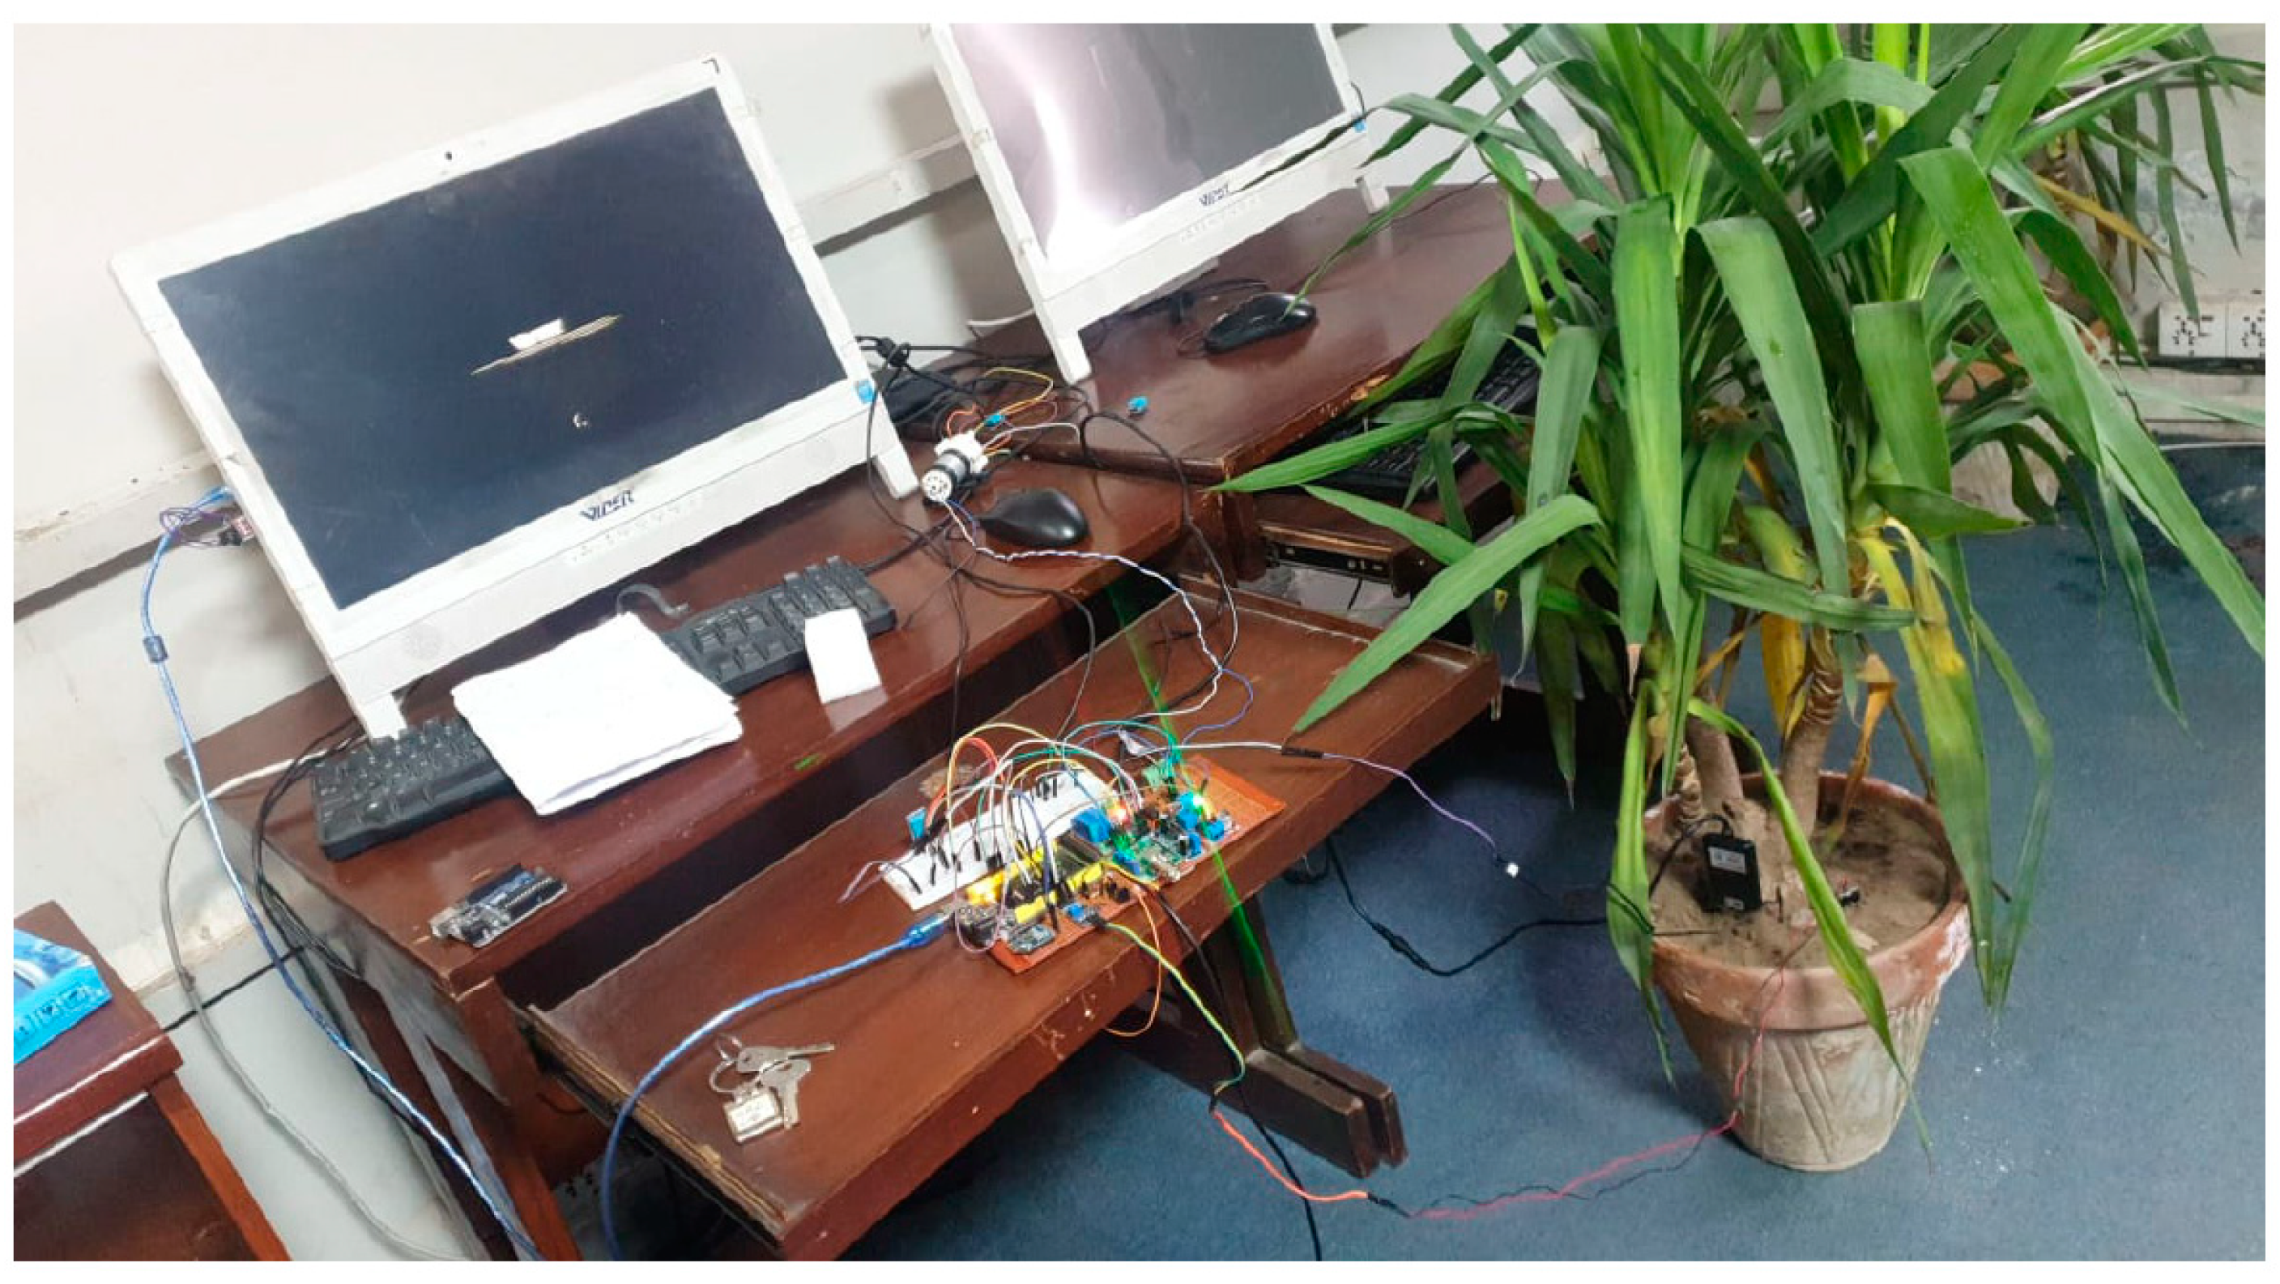
Figure 9.
Real-time Integrated System
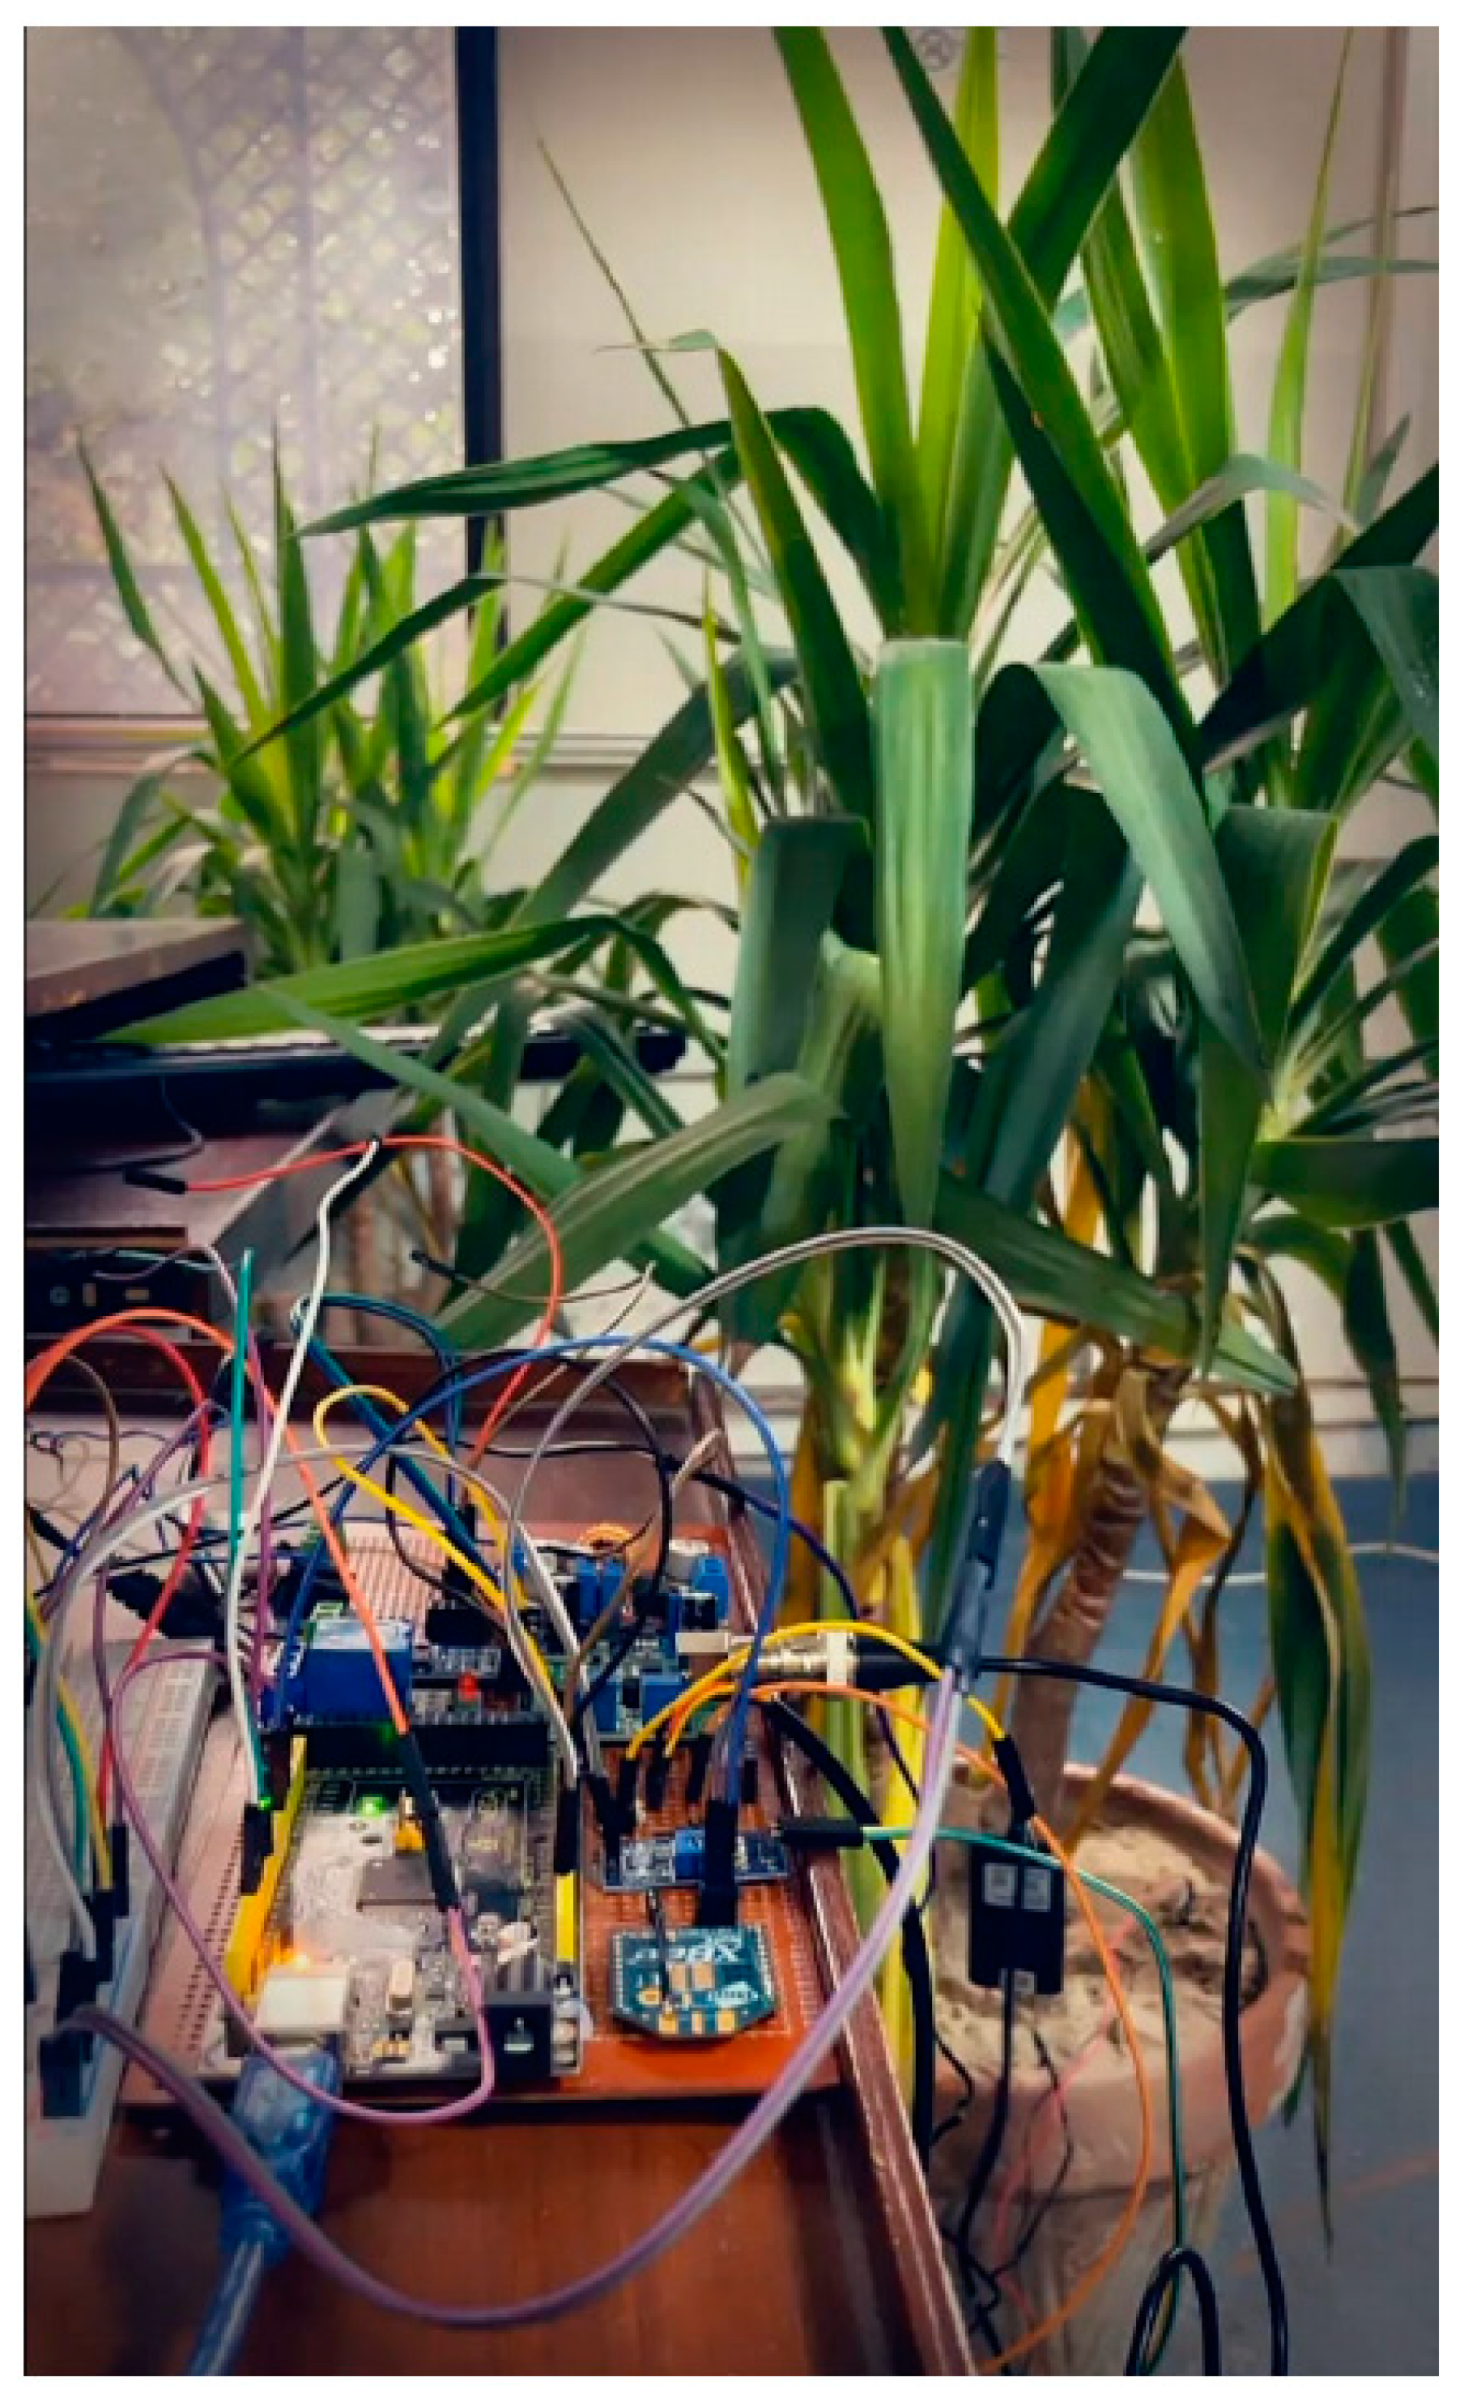
Table 2.
RNN Accuracy with Activation Functions
| Activation Function | Training Accuracy (%) | Test Accuracy (%) | Test Loss |
|---|---|---|---|
| Sigmoid | 98.2 | 99.6 | 0.0100 |
| Relu | 57.6 | 58.3 | 6.43 |
| Tanh | 99.5 | 99.9 | 0.0042 |
| elu | 57.9 | 57.2 | 6.60 |
Table 3.
CNN Accuracy with Activation Functions
| Activation Function | Training Accuracy (%) | Test Accuracy (%) | Test Loss |
|---|---|---|---|
| Sigmoid | 98.9 | 98.8 | 0.045 |
| ReLU | 98.7 | 98.6 | 0.20 |
| Tanh | 98.8 | 98.6 | 0.208 |
| ELU | 98.7 | 98.6 | 0.056 |
Table 4.
LSTM Accuracy with Activation Functions
| Activation Function | Training Accuracy (%) | Test Accuracy (%) | Test Loss |
|---|---|---|---|
| Sigmoid | 100 | 100 | 0.0008 |
| ReLU | 100 | 100 | 0.002 |
| Tanh | 100 | 100 | 0.0009 |
| ELU | 100 | 100 | 0 |
Disclaimer/Publisher’s Note: The statements, opinions and data contained in all publications are solely those of the individual author(s) and contributor(s) and not of MDPI and/or the editor(s). MDPI and/or the editor(s) disclaim responsibility for any injury to people or property resulting from any ideas, methods, instructions or products referred to in the content. |
© 2024 by the authors. Licensee MDPI, Basel, Switzerland. This article is an open access article distributed under the terms and conditions of the Creative Commons Attribution (CC BY) license (http://creativecommons.org/licenses/by/4.0/).
Copyright: This open access article is published under a Creative Commons CC BY 4.0 license, which permit the free download, distribution, and reuse, provided that the author and preprint are cited in any reuse.


