Submitted:
07 August 2024
Posted:
08 August 2024
You are already at the latest version
Abstract
Tunnel fires are generally detected using various sensors, including measuring temperature, CO concentration, and smoke concentration. To address the ambiguity and inconsistency in multi-sensor data, this paper proposes a tunnel fire detection method based on an improved Dempster-Shafer (DS) evidence theory for multi-sensor data fusion. To solve the problem of evidence conflict in DS theory, a two-level multi-sensor data fusion framework is adopted. The first level of fusion involves feature fusion of the same type of sensor data, removing ambiguous data to obtain characteristic data, and calculating the basic probability assignment (BPA) function through the feature interval. The second level fusion derives basic probability numbers from the BPA, calculates the degree of evidence conflict, normalizes to obtain the relative conflict degree, and optimizes the BPA using the trust coefficient. The classical DS evidence theory is then used to integrate and obtain the probability of tunnel fire occurrence. Different heat release rates, tunnel wind speeds, and fire locations are set, forming four fire scenarios. Sensor monitoring data under each simulation condition are extracted and fused using the improved DS evidence theory. The results show that the proposed improved DS evidence theory method detects the probability of fire occurrence in the four scenarios as 67.5%, 71.0%, 82.8%, and 83.5%, respectively, and identifies fire occurrence in approximately 2.4 seconds, an improvement of 64.7% to 70% over traditional methods. This demonstrates the feasibility and superiority of the proposed method, highlighting its significant importance in ensuring personnel safety.
Keywords:
Tunne
; Fire Detection
; Multi-Sensor Data Fusion
; DS Evidence TheoryDS
; PyroSim
1. Introduction
Multi-sensors play a crucial role in the detection of tunnel fires. Due to the unique environment of tunnels, the data collected by these sensors may contain ambiguous and conflicting information, leading to issues such as false alarms and missed detections of fires [1]. Therefore, studying how to improve the accuracy of tunnel fire detection and the timeliness of fire discovery is of significant practical importance for tunnel safety.
Currently, common data fusion algorithms include artificial neural networks [2], Bayesian methods [3], Kalman filtering [4], and Dempster-Shafer (DS) evidence theory [5]. Bayesian methods and DS evidence theory are often used to address multi-sensor data fusion issues [6]. However, the Bayesian method's reliance on prior estimates can hinder its ability to accurately reflect changes in tunnel conditions, making it unsuitable for multi-sensor data fusion in tunnel fire scenarios [7]. On the other hand, DS evidence theory is well-suited for situations where prior probabilities are unknown, allowing various sensor monitoring data to be integrated as evidence sources [8]. Despite its advantages in handling uncertainty, DS evidence theory can produce paradoxical results when there is a high degree of evidence conflict. Solutions to the evidence conflict problem in DS evidence theory can be categorized into two types: altering fusion rules [9] and optimizing the BPA [10].
In terms of altering fusion rules, Xiao et al. [11] proposed a weighted combination method for conflict evidence in multi-sensor data fusion. This method adjusts the evidence weights by modifying the cosine similarity and confidence entropy to address the issue of highly conflicting evidence fusion. However, it essentially preprocesses the evidence without considering the characteristics of the evidence itself. Wang et al. [12] introduced an adaptive evidence fusion method based on power probability distance, but it uses a single evidence relation to represent and manage conflicts and uncertainties in the Internet of Things environment, failing to effectively address the impact of unreliable evidence sources on the fusion results. Hamda et al. [13] proposed an improved evidence combination method for representing conflict and uncertainty in data fusion to improve the accuracy of decision-making, mainly relying on the Hellinger distance. Murphy [14] simply averaged the mass functions and then applied the classical DS combination rule, without considering the correlation between pieces of evidence, and assigned the same weight to all evidence sources. Tang et al. [15] proposed a new method for uncertain information fusion based on a new evidence confidence coefficient, using the evidence distance in DS evidence theory to handle conflict and uncertain information fusion, but it introduces a single confidence function to determine the weights between evidence. Hu et al. [26] proposed a new confidence entropy method based on internal cross-information of evidence, which adjusts the comprehensive credibility of evidence and optimizes the evidence fusion process of the DS combination rule.
In terms of optimizing the BPA, Shahpari et al. [16] proposed a pixel-based transformation uncertainty measure based on BPA, but it has been proven in [17] that this measure does not satisfy certain properties and leads to paradoxes. Deng et al. [18] below introduced an improved DS evidence theory framework based on the Hellinger distance within uncertain intervals, which is more sensitive to changes in evidence. Xiao et al. [19] suggested a multi-sensor data fusion method based on evidence and information entropy confidence measure, using information entropy to assess the characteristics of the evidence itself. Qiao et al. [20] proposed a multi-sensor data fusion method based on evidence theory that assigns weights according to the degree of data deviation, demonstrating high fusion accuracy. Xiao [21] introduced the concept of evidence credibility measure and designed a hybrid multi-sensor data fusion method. Song et al. [22] presented a time evidence adaptive fusion method based on a negotiation strategy, constructing evidence set through cumulative time fusion, using probability distance to evaluate conflicts, and adapting the fusion of time evidence according to the degree of conflict. Zhao et al. [23] proposed a new distribution distance measure method to gauge the degree of conflict between pieces of evidence, introducing a modified information amount calculation method to evaluate the role of evidence and adjust evidence credibility. Zhou et al. [24] combined indirect conflict measurement indicators with evidence information measurement indicators for data fusion, addressing issues of high conflict and poor robustness. Wang et al. [25] developed a multi-attribute fusion algorithm based on fuzzy clustering and improved evidence theory, which uses fuzzy clustering for group measurement and then applies improved evidence theory for advanced fusion. Although these methods incorporate relationships between pieces of evidence and the characteristics of the evidence itself, they fuse the probabilities of target attributes collected by sensors for target recognition and fault diagnosis, failing to integrate the measurement results of the sensors. Moreover, using information entropy alone cannot comprehensively evaluate the characteristics of the evidence itself.
To more accurately measure the relationship between evidence and its intrinsic characteristics and to enhance the accuracy of data fusion, this paper proposes a tunnel fire detection method based on improved DS evidence theory for multi-sensor data fusion. To address the issue of DS evidence conflict, a two-level multi-sensor data fusion framework is employed. In the first level of fusion, feature fusion of the same type of sensor data is performed to eliminate ambiguous data and calculate the BPA. The second level of fusion addresses conflict issues by optimizing the BPA and then applying classical DS evidence theory for data fusion to obtain the probability of fire occurrence. This method aims to quickly and accurately detect tunnel fires under various fire conditions.
2. The Proposed Method
This section describes the relevant knowledge of DS evidence theory and explains the conflict issues in multi-sensor data fusion for tunnel fires. Finally, it proposes methods and steps for improving DS evidence theory.
2.1. Dempster-Shafer Evidence Theory
In DS evidence theory, the frame of discernment consists of a finite set of mutually exclusive elements. denoted as the power set of the discursive framework, which is composed of elements, is represented as follows:
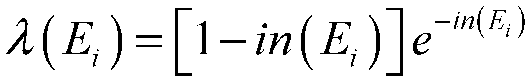
m is referred to as the Basic Probability Assignment (BPA) function, if , {A} is referred to as a proposition, and m (A) denotes the degree of belief assigned to the proposition {A}.
In the frame of discernment , , If the function satisfies:
is said to Bel (A) as the belief function of proposition {A}, which represents the likelihood that proposition {A} is true.
In the frame of discernment , , If the function satisfies:
is said to Pl (A) as the plausibility function of proposition {A}, which represents the likelihood that proposition {A} is not false.
Defined Pl (A) and Bel (A) as the upper and lower bounds of the confidence in proposition {A}. The interval [Bel (A) , Pl (A) ] represents the degree of uncertainty of the proposition, with the relationship between Bel (A) and Pl (A) illustrated in Figure 1.
The combination rule of DS evidence theory involves merging multiple sources of evidence. Given two pieces of evidence with basic BPA m1 and m2 in the frame of discernment, the DS evidence theory fusion formula [27] for proposition {A} is :
where,
when k=1, DS evidence theory is unable to fuse the evidence.
when there are three or more pieces of evidence, the combination rule of DS evidence theory is as follows:
In the frame of discernment , let A, B, and C represent the data from temperature sensors, CO sensors, and smoke sensors monitoring tunnel fires, respectively:
Using the DS evidence theory combination rule, k was calculated to be 0.98975. The data fusion results m (A) , m (B) , and m (C) are shown in Table 1.
Relying solely on individual sensor data may result in temperature and smoke sensors indicating a higher likelihood of fire, while the CO sensor may indicate a normal state, leading to a paradox in data fusion based on Dempster-Shafer (DS) evidence theory. According to the data in Table 1, under fire conditions, the value of m2 (CO) is 0, which results in a post-fusion judgment of 0 for fire conditions. This causes a conflict in the DS evidence theory's judgment.
2.2. The Method for Improving D-S Evidence Theory
In the processing of data from similar sensors, the feature-level data fusion method can effectively eliminate ambiguous data and enhance the monitoring accuracy of environmental characteristics by similar sensors. For data from multiple types of sensors, decision-level fusion enables the complementary integration of multi-source data obtained from multiple sensors, thereby improving the accuracy of the monitoring results.
In tunnel fire detection, the raw data from temperature, CO concentration, and smoke concentration sensors are first subjected to feature extraction and correlation analysis of similar data. These features are then fused to form a comprehensive decision based on multi-source monitoring data, including temperature, CO concentration, and smoke concentration. On this basis, a decision-level fusion of multi-source data (temperature, CO concentration, smoke concentration) is performed to obtain the BPA of the evidence theory. The data fusion algorithm is then used to integrate these decision results, yielding the final fire probability. The proposed tunnel multi-sensor data fusion algorithm based on the improved DS evidence theory is illustrated in Figure 2.
Step 1: Primary fusion of data from sensors of the same type to obtain BPA.
The key aspect of data fusion using Dempster-Shafer (DS) evidence theory is obtaining the BPA. Following the primary fusion process for similar sensor data, multi-sensor monitoring data are first collected, and invalid data are removed to obtain feature data. Then, a primary fusion of similar sensor data is performed. Finally, the BPA is preliminarily calculated based on the feature intervals.
Step 2: Secondary fusion of data from multiple types of sensors to obtain tunnel condition information.
The improved DS evidence theory addresses evidence conflict issues and yields the final fusion results of multi-sensor data. According to the secondary fusion process for multi-sensor data, the basic probability numbers are first derived from the BPA. Then, an evidence distance matrix is constructed to calculate the degree of conflict between pieces of evidence, and normalization is performed to obtain the relative conflict degree. Subsequently, the trust coefficients between pieces of evidence are calculated to further optimize the BPA. Finally, classical DS evidence theory is used to fuse the evidence and determine the tunnel conditions.
2.2.1. Primary Fusion of Data from Sensors of the Same Type
The process for obtaining the improved DS evidence theory BPA function for the fusion of data from sensors of the same type involves the following steps:
(1) Similar data screening based on Euclidean distance
To exclude anomalous data when calculating the BPA, this paper proposes a similar data screening algorithm based on Euclidean distance. The primary method involves measuring the similarity between data points by calculating the Euclidean distance between similar data. A smaller distance indicates a higher degree of similarity and greater data authenticity, while a larger distance indicates a lower degree of similarity and lesser data authenticity. Therefore, by calculating the pairwise distances between all similar data points and setting an appropriate threshold, anomalies can be identified and excluded [29].
Let the number of sensors be n, and the distance between the collected like data, The distance [28] between and other similar data excluding can be expressed as:
The distance of anomalous data is greater than the distance of normal data. Therefore, the difference between the distances of anomalous and normal data can be used to identify anomalous data. In the equation, represents the median of .
Eliminating the magnitude of by the following equation.
where represents the median of the set of sensor data of the same type .
when , the sensor is considered to have a large error and should be rejected.
(2) Primary fusion of homogeneous sensor data using a weighted averaging method
If the weights are the same between sensors of the same type, then it is known that
We defined as the fused value of data from the same type of sensors and as the distance from to other sensors. When reached its minimum value, was closest to the local multi-sensor monitoring result.
derived that.
derivation on the left and right sides yields that
when , The minimum value of is obtained, which corresponds to the average of the data from all sensors.
(3) Acquisition of BPA functions based on feature intervals
To monitor tunnel fire conditions in real-time, it is essential to collect three key types of data: carbon monoxide (CO) concentration, smoke concentration, and temperature. The identification framework is , categorizes the tunnel fire status into three levels: {Normal Conditions, Warning Conditions, and Fire Conditions}.
Interval T represents the range within which the identification framework is situated. This interval divides the n objects within the identification framework into n characteristic intervals , , which describe the range where the identification object is located. The midpoint of each interval is set as the characteristic value for that feature interval.
where represents the left boundary of the characteristic interval , while represents the right boundary of the characteristic interval .
Let represent the distance between the sensor's measured value and each characteristic value:
Dividing by the length of each characteristic interval yields the dimensionless distance between the sensor's measured value and each interval's characteristic value:
Taking the reciprocal of and normalizing it yields the probability assignment function and the basic probability number for the measured value .
where is a constant.
According to equation (18) , the closer the sensor's measured value is to the characteristic value of the interval, the larger becomes, indicating that is closer to the identification object . However, during a tunnel fire, some sensor measurements may exceed the right boundary of the characteristic interval , causing to become too large and, consequently, to decrease, which moves further away from the identification object . Therefore, when calculating , if is too large, it should be replaced with . Based on the characteristic interval , this adjustment ensures that remains close to the corresponding characteristic value .
where is a constant.
2.2.2. Secondary Fusion of Multi-Type Sensor Data
The improved DS evidence theory for multi-type sensor data fusion is applied to a secondary fusion process.
First, let the identification framework be , where represents the n-Th condition of tunnel fire, and denotes the evidence set, with being the m-Th piece of evidence related to the tunnel fire. The definition of the distance between evidence and is given by:
where
As approaches 1, it indicates a higher degree of mutual support between the pieces of evidence. Conversely, as approaches e, it signifies a higher level of conflict between the pieces of evidence. Based on this, an evidence distance matrix D can be constructed:
Defined as the level of conflict between evidence.
Normalize the evidence conflict degree to obtain the relative conflict degree of the evidence [30].
Let be the trust coefficient of the evidence, representing the importance of evidence and its influence on the fusion result. The definition of is:
Let be the original probability assignment function. The optimized probability assignment function is:
In summary, the specific steps for improving the DS evidence theory for the secondary fusion of multi-sensor data in tunnels are as follows:
Firstly, an evidence distance matrix D is constructed to calculate the degree of conflict between the evidence and normalized to obtain the relative degree of conflict.
Secondly, calculates the trust coefficients between the evidence to optimize the BPA.
Finally, the evidence is fused using the classical DS theory of evidence.
3. Numerical Examples and Simulation Verification
This section evaluates and simulates the proposed method based on the improved DS evidence theory to verify its feasibility and effectiveness.3.1Improvement of DS theory of Evidence.
3.1. Improved DS Evidence Theory
To validate the effectiveness of the proposed improvement, sensor monitoring data from Section 2.1 are used to compare the proposed improved algorithm with the methods developed by Dempster-Shafer [31], Yanger [32], Sun [33], and Murphy [14]. The fusion results are shown in Table 2. and the comparison of the fusion results is illustrated in Figure 3.
From Table 3. it can be observed that under fire condition A, when m1 = 0.8, m2 = 0, and m3 = 0.7, the BPA m (A) for Yanger's method is 0, which results in a paradox. In contrast, the BPA for fire conditions in this paper is 0.50247, indicating the detection of a fire. When dealing with different types of conflicting evidence, classical DS and Yager's fusion methods lead to contradictions with the actual facts. Although the method proposed by Sun et al. points to the correct result, it exhibits a higher degree of uncertainty. Therefore, traditional DS fusion rules may fail or mismatch the actual tunnel fire conditions when confronted with conflicting evidence. This paper addresses the problem of evidence conflict by reducing the proportion of conflicting evidence, gradually decreasing the number of conflicting evidence, and increasing the amount of valid evidence, thus minimizing the uncertainty interval and enhancing reliability. The improved DS evidence theory fusion algorithm proposed in this paper provides more accurate results in handling evidence and conflicting evidence, demonstrating the rationality and effectiveness of the proposed method.
3.2. The Proposed Holistic Approach
To further demonstrate the feasibility and effectiveness of the data fusion method, this subsection applies the proposed improved DS evidence theory data fusion method to tunnel fire detection.
In tunnel fire detection, temperature sensors, CO sensors, and smoke sensors are commonly used to monitor fires [34]. The PyroSim software, based on Fire Dynamics Simulator (FDS) and Computational Fluid Dynamics [35], can simulate large-scale slow-moving vortices and accurately obtain critical parameters such as fire heat release, fire smoke, CO concentration, and temperature.
The fire simulation process using PyroSim is illustrated in Figure 4. First, a comprehensive tunnel geometric model is created, including elements such as lining, vehicles, and ventilation systems, to accurately describe the internal structure of the tunnel. Next, multiple sensors, including temperature, CO, and smoke sensors, are installed to enable real-time monitoring of the fire scene. The heat release rate is determined based on the actual fire conditions. Subsequently, a tunnel fire simulation model is established, and simulation parameters such as temperature and velocity are set to realistically simulate the fire situation. Finally, FDS is run to perform the fire simulation and obtain multi-sensor monitoring data.
3.2.1. Simulation Model
(1) Establishing the tunnel geometric model
The tunnel geometric model is constructed with the following specifications: a height of 8.5 meters, a width of 14.5 meters, and a length of 600 meters. The tunnel is lined with 31 concrete walls forming the lining and surrounding rock structure. The wall material has a density of 2280.0 kg/m3, a specific heat capacity of 1.04 kJ/ (kg·K) , and a thermal conductivity of 1.8 W/ (m·K) . In consideration of practical scenarios, the dimensions of the vehicles are set as follows: width 2.4 meters, height 2.5 meters, and length 7 meters. The fire materials carried by large trucks are wood and plastic. In the tunnel model, a blue square on the top represents the jet fan, which has an outlet area of 1.21 m² and a wind speed of 27.9 m/s. These parameters are used to establish the tunnel geometric model, with the specific structure illustrated in Figure 5.
(2) Installation of fire monitoring equipment
A 3x3 sensor matrix is arranged on the tunnel ceiling, with each matrix containing 3 temperature sensors, 3 CO sensors, and 3 smoke sensors. The distance between adjacent sensor matrices is 10 meters. Additionally, pairs of smoke sensors are installed on the right side of the tunnel at heights of 2 meters and 3 meters from the ground, with a distance of 100 meters between adjacent pairs. The specific arrangement of the sensors is illustrated in Figure 6.
(3) Establishing the fire model
The tunnel accommodates various vehicle types, including large trucks and small cars, so the corresponding heat release rates are set to 20 MW for large trucks and 5 MW for small cars. During a fire, higher wind speeds result in faster smoke spread and greater disruption to the smoke layer, increasing danger. Based on traffic volume survey data, the simulation wind speed is set to 2.5 m/s, with 3 m/s and zero wind speed used as control conditions. The tunnel is set with a pressure of 94.5 kPa, an initial temperature of 20°C, an initial CO concentration of 42 cm3/m3, and an initial smoke concentration K of 0.004 m-1.
When a fire occurs at the midpoint of the tunnel, the distance for personnel evacuation to the exits is maximized, which is unfavorable for evacuation; simultaneously, the tunnel fan is located farthest from the fire source, making smoke control less effective. In Figure 7. ignition point 1 is located at the midpoint of the tunnel, representing the main fire condition, while ignition point 2 is near the entrance fan, serving as the control condition. The farther the sensor is from the ignition point, the more challenging it is to monitor the tunnel fire. Therefore, the distance between the ignition point and the downstream sensor matrix is set to 7.5 meters.
Based on the established fire conditions, with other fire conditions remaining consistent, four types of tunnel fire conditions are set as shown in Table 3.

Table 3.
Tunnel fire conditions.
| Condition Number | Ignition Point L | Heat Release Rate (MW) | Wind Speed (m/s) |
|---|---|---|---|
| LZ-R5-S2.5 | Tunnel Midpoint-Z | 5 | 2.5 |
| LZ-R20-S0 | Tunnel Midpoint-Z | 20 | 0 |
| LZ-R20-S2.5 | Tunnel Midpoint-Z | 20 | 2.5 |
| LEN-R20-S3 | Tunnel Entrance 200m-EN | 20 | 3 |
3.2.2. Tunnel Fire Simulation
Based on the tunnel fire conditions set in Section 3.2.1, simulations are conducted in PyroSim. Using the condition LZ-R5-S2.5 as an example, the multi-sensor monitoring data for tunnel fires are obtained. The monitoring data for temperature sensors, smoke sensors, and CO sensors in the fire monitoring nodes are shown in Table 4.
3.2.3. Tunnel Fire Simulation Data Fusion
Based on the "Highway Tunnel Ventilation Design Specifications" and relevant design standards for tunnel engineering, the characteristic intervals for temperature, smoke concentration, and CO concentration are categorized as shown in Table 5.
The primary fusion data of sensor readings under four different operating conditions, combined with Table 5, were used to calculate the probability assignment functions as shown in Table 6, according to Equations (18) and (19) .
The probability assignment function is optimized using Equations (26) and (27) , and the probability assignment function for unknown conditions is calculated. Combining the optimized probability assignment function with Equation (6) , the probabilities of normal operation, fire warning, fire state, and unknown state under various tunnel conditions are determined, as shown in Table 7.
For the different conditions mentioned above, the simulation results using the same method are shown in Figure 8.
The fire occurrence probabilities under various conditions are analyzed, and the resulting curves for the four types of fire conditions are shown in Figure 9.
Based on the multi-sensor monitoring data and fusion results for tunnel fires under different conditions, the following conclusions can be drawn:
A higher heat release rate and wind speed make it easier to detect tunnel fires. The fire condition LZ-R5-S2.5, with a lower heat release rate, presents the greatest challenge for fire detection. The improved DS evidence theory multi-sensor data fusion algorithm reached a conclusion of fire occurrence at 7.2 seconds based on changes in tunnel temperature and smoke concentration. Thus, the improved DS evidence theory multi-sensor data fusion algorithm demonstrates good fusion performance under zero wind speed and low heat release rate conditions.
The probabilities of tunnel fire occurrence under the four conditions are 67.5%, 82.8%, 83.5%, and 71%, respectively. This indicates that the proposed method has a high monitoring accuracy.
The comparison results of the improved DS evidence theory multi-sensor fusion algorithm with those of Sun and the original methods are shown in Figure 10.
4. Conclusion
This paper proposes a multi-sensor data fusion algorithm based on improved DS evidence theory, which effectively monitors the environment and fire conditions within a tunnel, significantly enhancing the accuracy and efficiency of monitoring.
Propose a multi-sensor data fusion algorithm based on an improved DS evidence theory, employing a two-level fusion architecture. Initially, the data collected by different sensors is screened to eliminate inaccurate data. Subsequently, primary fusion is performed on data from sensors of the same type. Next, BPA functions for fire, fire warning, and normal operating conditions are extracted from the results of the primary fusion. Evidence conflicts are treated as a manifestation of uncertainty, and BPA functions are optimized. Finally, the optimized evidence is fused using DS evidence theory to achieve an accurate assessment of the tunnel's operational status.
To address the conflict issue in DS evidence theory, an improved DS evidence theory fusion algorithm is proposed. Comparisons with other data fusion algorithms show that the proposed method achieves a smaller uncertainty interval (0.19679) . By making full use of tunnel fire data information, the fusion results exhibit higher credibility.
The proposed multi-sensor data fusion algorithm was validated using multi-sensor monitoring data. The results indicate that the method consistently achieves a fire detection probability of no less than 65% across four different operational conditions. Compared to other research methods, the proposed algorithm offers faster analysis speeds and makes more comprehensive use of tunnel environment information. This demonstrates its potential for practical application in tunnel safety monitoring systems and suggests that it could enhance the early warning capabilities for tunnel fires.
Author Contributions
H.W. designed the experiment; Y.S. performed the experiments and wrote the manuscript; L.C. analyzed the experimental data; X.Z. supervised version of the manuscript. All authors have read and agreed to the published version of the manuscript.
Funding
This research was funded by the Transport Research Project of the Department of Transport of Shaanxi Province. (Grant nos. 21-04X) .
Institutional Review Board Statement
Not applicable.
Informed Consent Statement
Not applicable.
Data Availability Statement
Not applicable.
Acknowledgments
The authors greatly appreciate the reviews, the suggestions from reviews, and the editor’s encouragement.
Conflicts of Interest
The author declare no conflict of interest.
References
- Yu, L.F. Tunnel Fire Monitoring and Alarm Technology Based on Multi-Sensor Data Fusion. Tunn. Constr. 2022, 42, 261–266. [Google Scholar] [CrossRef]
- Li, N. The Construction of a Fire Monitoring System Based on Multi-Sensor and Neural Network. Int. J. Inf. Technol. Syst. Approach, 2023, 16: 1-12. [CrossRef]
- Wu, P.; Imbiriba, T.; Elvira, V.; Closas, P. Bayesian data fusion with shared priors. IEEE Tran. Signal Process. 2023, 72, 275–288. [Google Scholar] [CrossRef]
- Li, L.; Li, A.; Yan, Y.J. Analysis of data fusion method for multiple temperature sensors based on improved Kalman filtering. Electron. Technol. 2024, 53, 214–215. [Google Scholar] [CrossRef]
- Huang, Z.Y.; Lin, R.M.; Liu, H.; Zhu, J.Y.; Li, J.K. A multi-source network security data fusion model based on DS evidence theory. Mod. Electron. Technol. 2024, 47, 115–121. [Google Scholar] [CrossRef]
- Xiang, X.J.; Li, K.H.; Huang, B.Q.; Cao, Y. A multi-sensor data-fusion method based on cloud model and improved evidence theory. Sensors 2022, 22, 5902. [Google Scholar] [CrossRef]
- Zhang, F.X.; Zhang, L.M.; Liu, Z.Y.; Meng, F.Z.; Wang, X.S.; Wen, J.H.; Gao, L.Y. An Improved Dempster-Shafer Evidence Theory Based on the Chebyshev Distance and Its Application in Rock Burst Prewarnings. ASCE-ASME J. of Risk Uncertain. Eng. Syst. Part A.-Civ. Eng. 2024, 10, 04023055. [Google Scholar] [CrossRef]
- Ye, F.; Chen, J.; Li, B.Y. Improvement of DS evidence theory for multi-sensor conflicting information. Symmetry 2017, 9, 69. [Google Scholar] [CrossRef]
- Du, Y.W.; Zhong, J.J. Generalised combination rule for evidential reasoning approach and Dempster-Shafer theory of evidence. In. Sci. 2021, 547, 1201–1232. [Google Scholar] [CrossRef]
- Shi, X.; Liang, F.; Qin, P.J.; Yu, L.; He, G.J. A Novel Evidence Combination Method Based on Improved Pignistic Probability. Entropy 2023, 25, 948. [Google Scholar] [CrossRef]
- Xiao, F.Y.; Qin, B.W. A weighted combination method for conflicting evidence in multi-sensor data fusion. Sensors 2018, 18, 1487. [Google Scholar] [CrossRef]
- Wang, J.; Zhu, J.W.; Song, Y.F. A self-adaptive combination method in evidence theory based on the power pignistic probability distance. Symmetry 2020, 12, 526. [Google Scholar] [CrossRef]
- Hamda, N.E.; Hadjali, A.; Lagha, M. Multisensor Data Fusion in IoT Environments in Dempster-Shafer Theory Setting: an Improved Evidence Distance-Based Approach. Sensors 2023, 23, 5141. [Google Scholar] [CrossRef] [PubMed]
- Murphy, C.K. Combining belief functions when evidence conflicts. Decis. Support Syst. 2000, 29, 1–9. [Google Scholar] [CrossRef]
- Tang, Y.C.; Wu, S.H.; Zhou, Y.; Huang, Y.B.; Zhou, D.Y. A new reliability coefficient using betting commitment evidence distance in Dempster-Shafer evidence theory for uncertain information fusion. Entropy 2023, 25, 462. [Google Scholar] [CrossRef] [PubMed]
- Shahpari, A.; Seyedin, S.A. Using mutual aggregate uncertainty measures in a threat assessment problem constructed by Dempster-Shafer network. IEEE Tran. Syst. Man Cybern. Syst. 2015, 45, 877–886. [Google Scholar] [CrossRef]
- Abellan, J.; Bosse, E. Drawbacks of uncertainty measures based on the pignistic transformation. IEEE Tran. Syst. Man Cybern. Syst.. 2016, 48, 382–388. [Google Scholar] [CrossRef]
- Deng, Z.; Wang, J.Y. Measuring total uncertainty in evidence theory. Int. J. Intell. Syst. 2021, 36, 1721–1745. [Google Scholar] [CrossRef]
- Xiao, F. Multi-sensor data fusion based on the belief divergence measure of evidences and the belief entropy. Inf. Fusion 2019, 46, 23–32. [Google Scholar] [CrossRef]
- Qiao, S.H.; Fan, Y.S.; Wang, G.F.; Zhang, H.Y. Multi-sensor data fusion method based on improved evidence theory. J. Mar. Sci. Eng. 2023, 11, 1142. [Google Scholar] [CrossRef]
- Xiao, F. Evidence combination based on prospect theory for multi-sensor data fusion. ISA Tran. 2020, 106, 253–261. [Google Scholar] [CrossRef]
- Song, Y.F.; Zhu, J.W.; Lei, L.; Wang, X.D. Self-adaptive combination method for temporal evidence based on negotiation strategy. Sci. China Inf. Sci. 2020, 63, 1–13. [Google Scholar] [CrossRef]
- Zhao, K.Y.; Sun, R.T.; Li, L.; Hou, M.M.; Yuan, G.; Sun, R.Z. An improved evidence fusion algorithm in multi-sensor systems. Appl. Intell. 2021, 51, 7614–7624. [Google Scholar] [CrossRef]
- Zhou, K.Y.; Lu, N.Y.; Jiang, B. Information fusion-based fault diagnosis method using synthetic indicator. IEEE Sens. J. 2023, 23, 5124–5133. [Google Scholar] [CrossRef]
- Wang, W.Q.; Yan, Y.; Zhang, R.D.; Wang, Z.; Fan, Y.Q.; Yang, C.J. Multi-attribute fusion algorithm based on improved evidence theory and clustering. Sensors 2019, 19, 4146. [Google Scholar] [CrossRef] [PubMed]
- Hu, Z.T.; Su, Y.J.; Hou, W.; Ren, X. Multi-sensor data fusion method based on divergence measure and probability transformation belief factor. Appl. Soft. Comput. 2023, 145, 110603. [Google Scholar] [CrossRef]
- Chu, L.Y.; Wang, M.Y.; Chen, X.Q. Risk assessment of maritime supply chain based on improved DS evidence theory and Bayesian network. Supply Chain Manag. 2024, 5, 82–96. [Google Scholar] [CrossRef]
- Peng, D.G.; Duan, R.J.; Wang, D.H. Two-tier fusion-based multi-sensor data fusion algorithm research. Instrum. Tech. Sens. 2024, 87–93. [Google Scholar] [CrossRef]
- Zhou, E.F.; Ma, J.; Zhou, Y.J.; Wang, Q.Q.; Chen, B.H. Multi-sensor data fusion algorithm based on D-S evidence theory. J. Chin. Comput. Syst. 2022, 43, 795–800. [Google Scholar] [CrossRef]
- Wu, L.S.; Chen, L.; Hao, X.R. Multi-Sensor Data Fusion Algorithm for Indoor Fire Early Warning Based on BP Neural Network. Information 2021, 12, 59. [Google Scholar] [CrossRef]
- Dempster, A.P. Upper and Lower Probabilities Induced by a Multi-valued Mapping. Ann. Math. Stat. 1967, 38, 325–339. [Google Scholar] [CrossRef]
- Yager, R.R. On the Dempster-Shafer framework and new combination rules. Information sciences. Inf. Sci. 1987, 41, 93–137. [Google Scholar] [CrossRef]
- Sun, Q.; Ye, X.Q.; Gu, W.K. A New Combination Rules of Evidence Theory. Acta Electonica Sin. 2000, 28, 117–119. [Google Scholar] [CrossRef]
Disclaimer/Publisher’s Note: The statements, opinions and data contained in all publications are solely those of the individual author (s) and contributor (s) and not of MDPI and/or the editor (s) . MDPI and/or the editor (s) disclaim responsibility for any injury to people or property resulting from any ideas, methods, instructions or products referred to in the content. |
Figure 1.
DS evidence theory confidence interval.
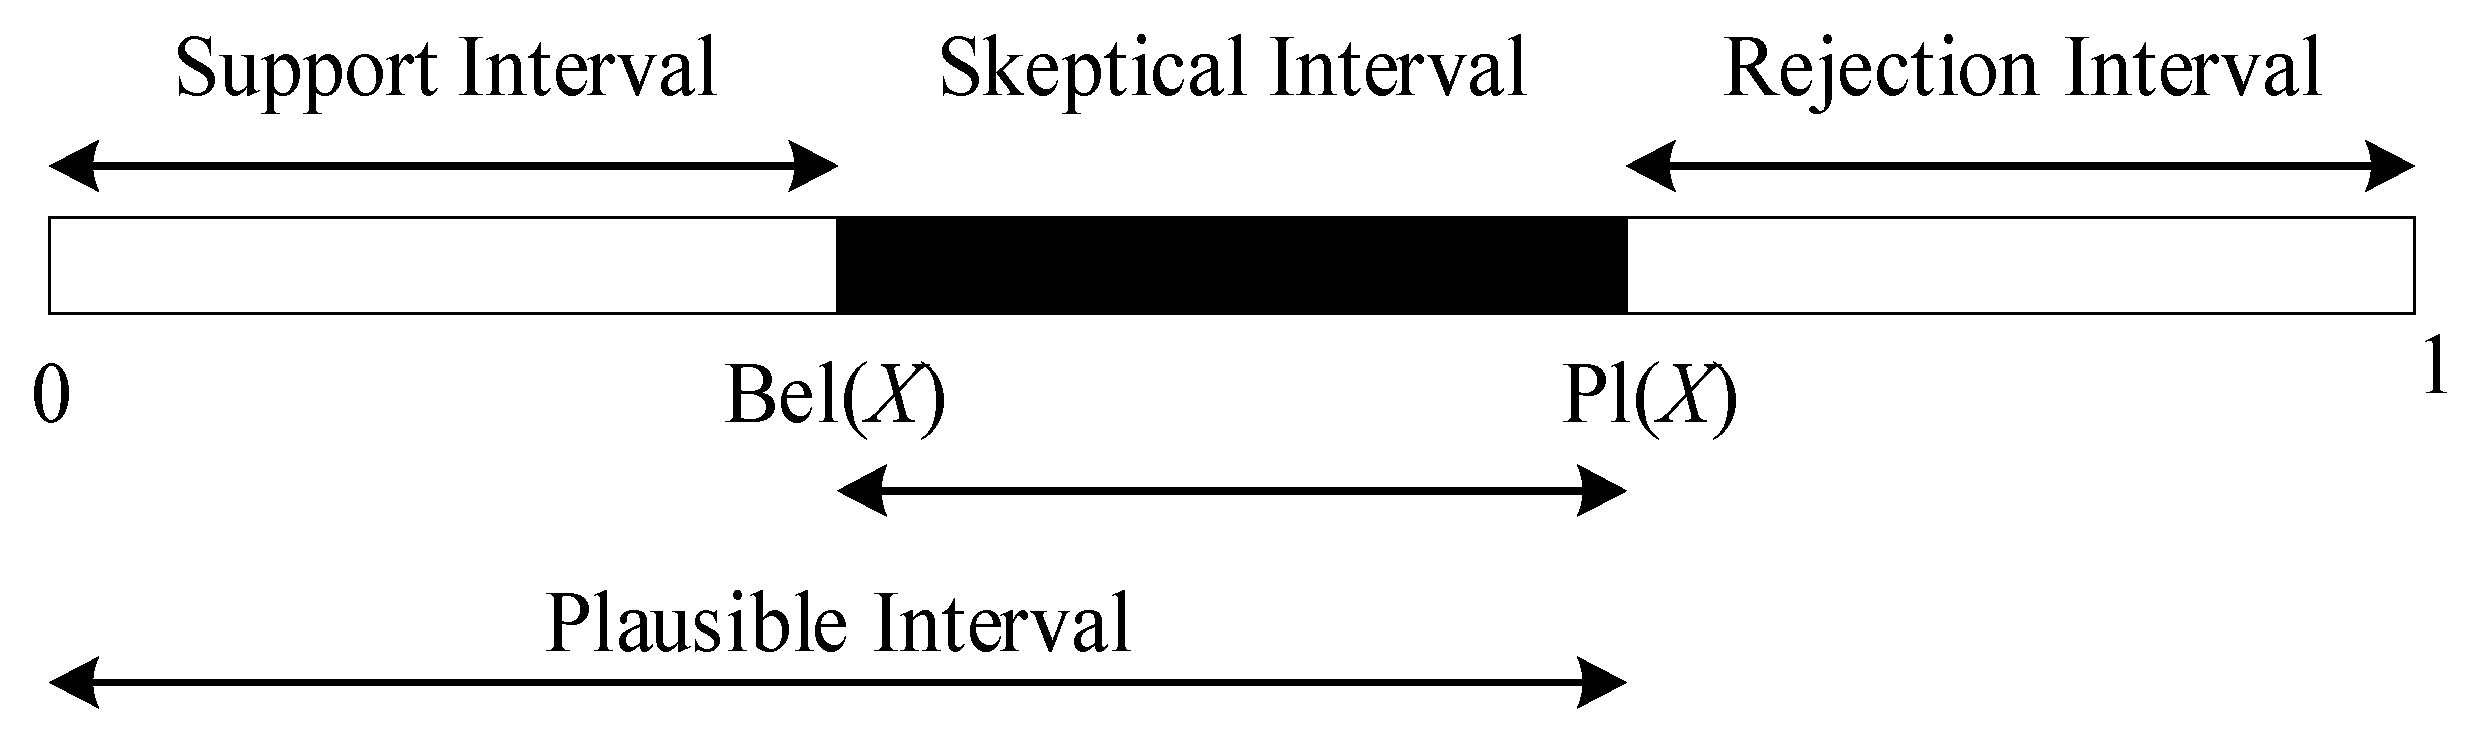
Figure 2.
Multi-sensor data fusion algorithm based on improved DS evidence theory.
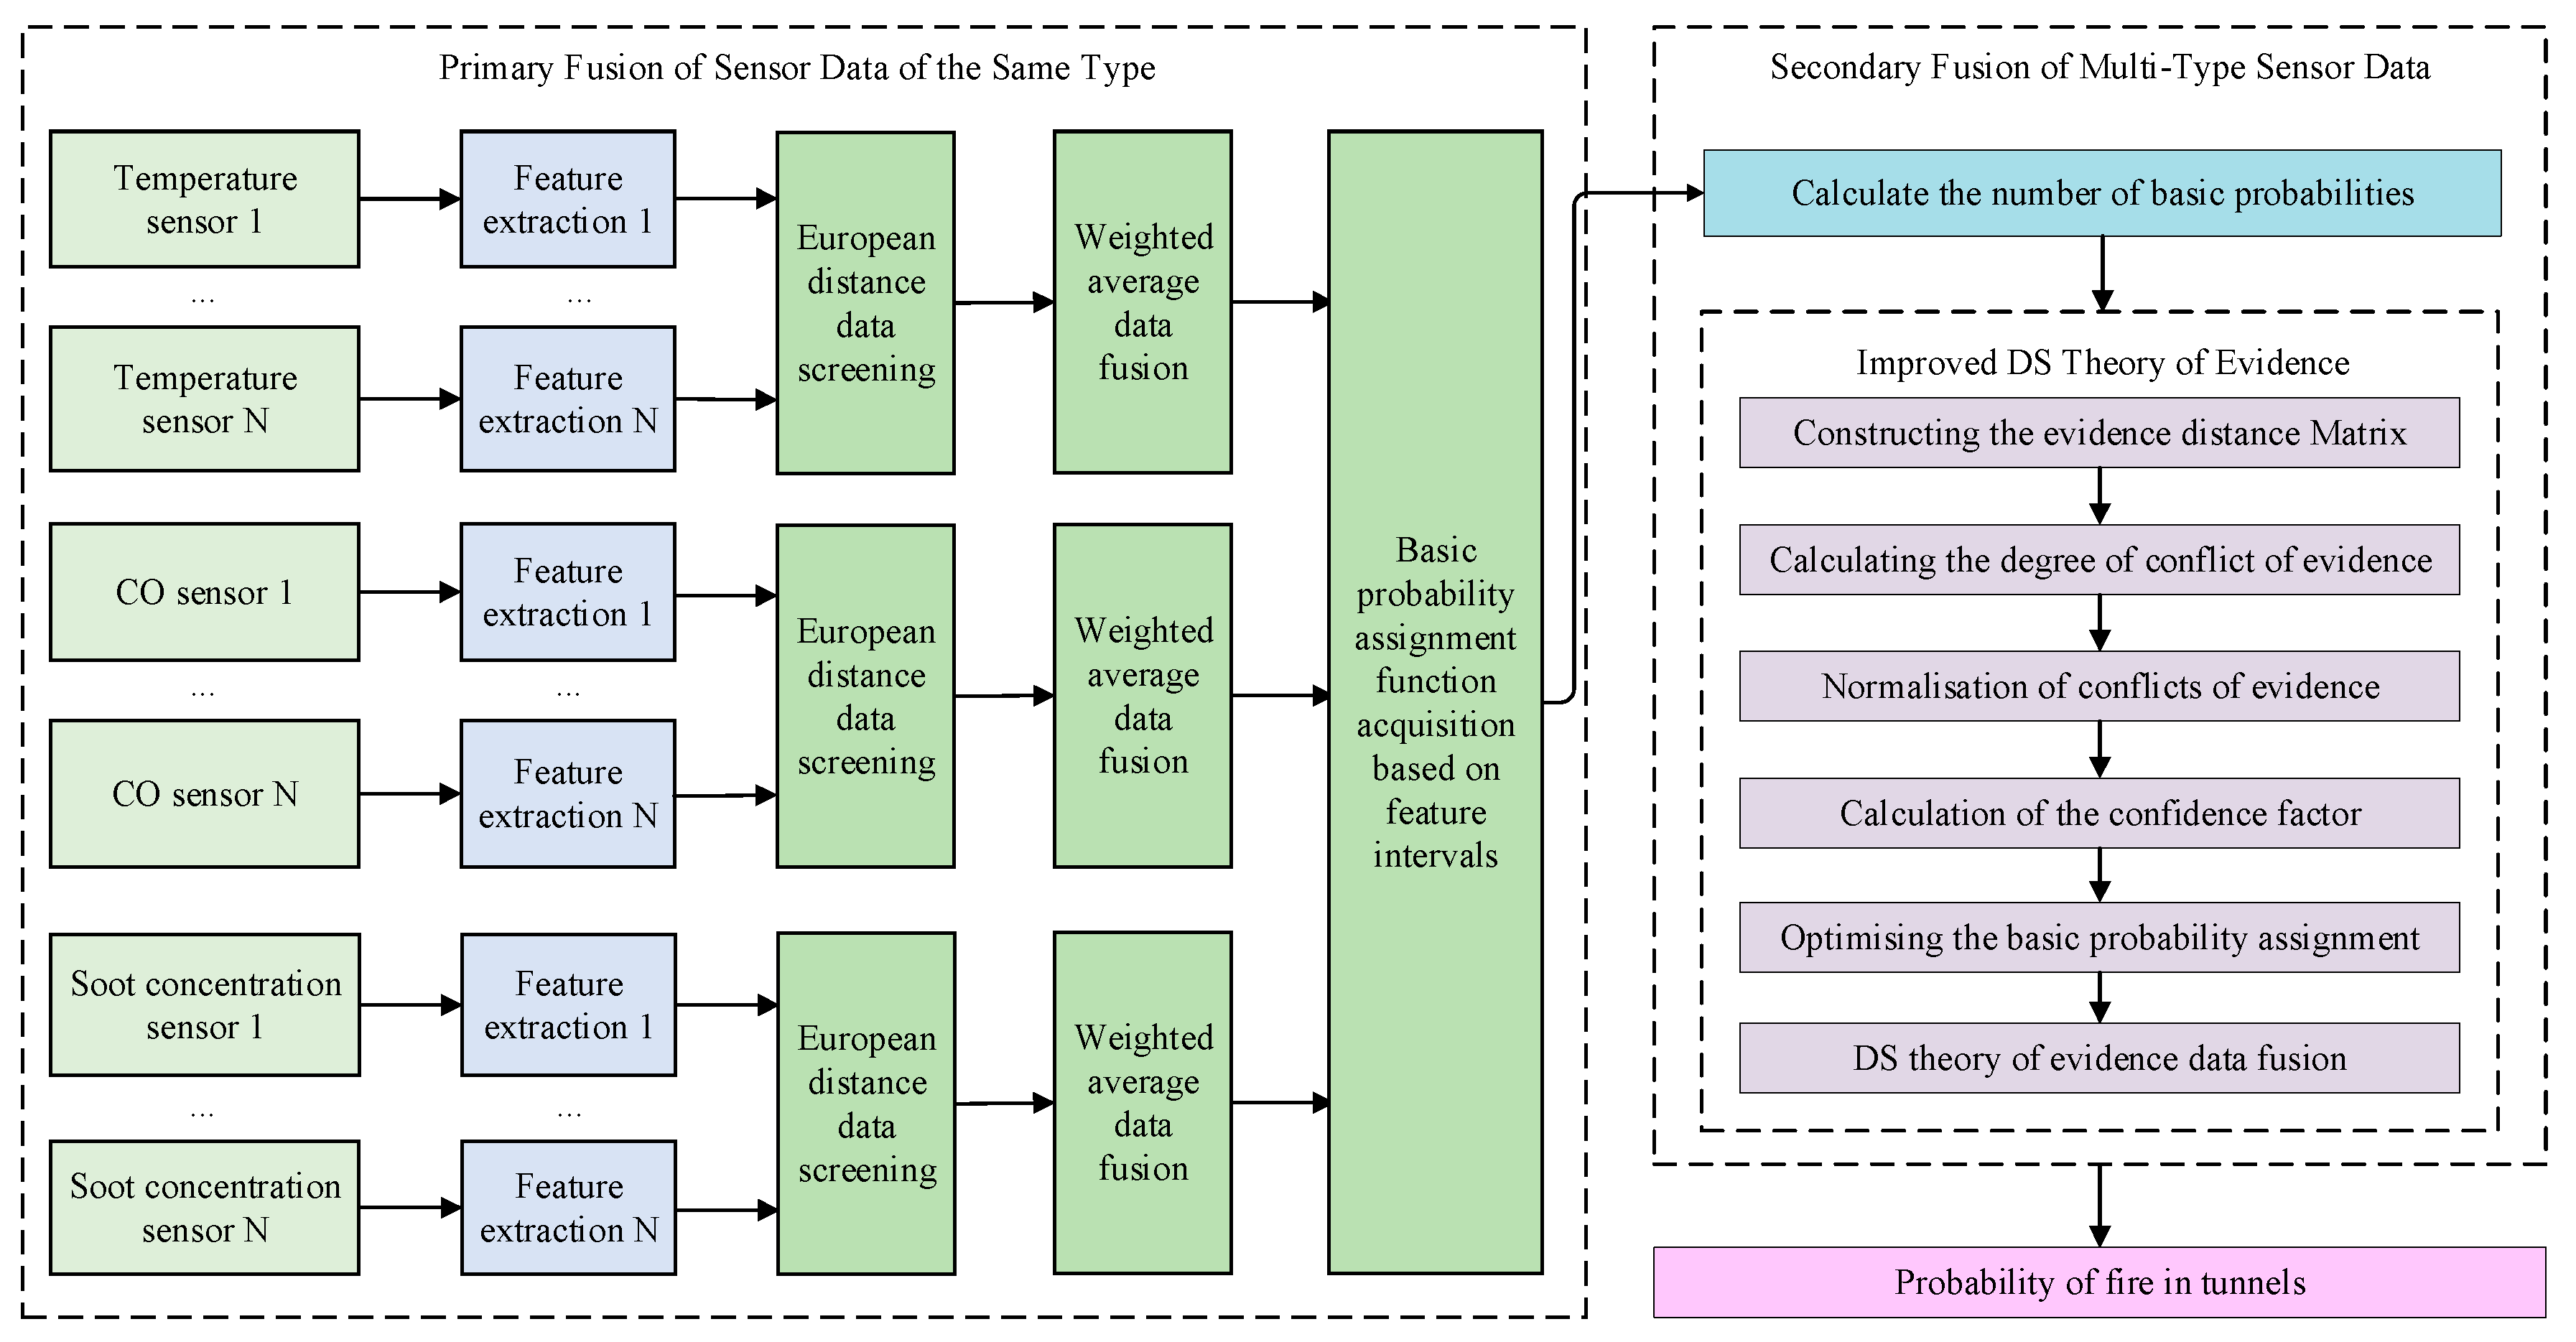
Figure 3.
Comparison of data fusion results for five algorithms.
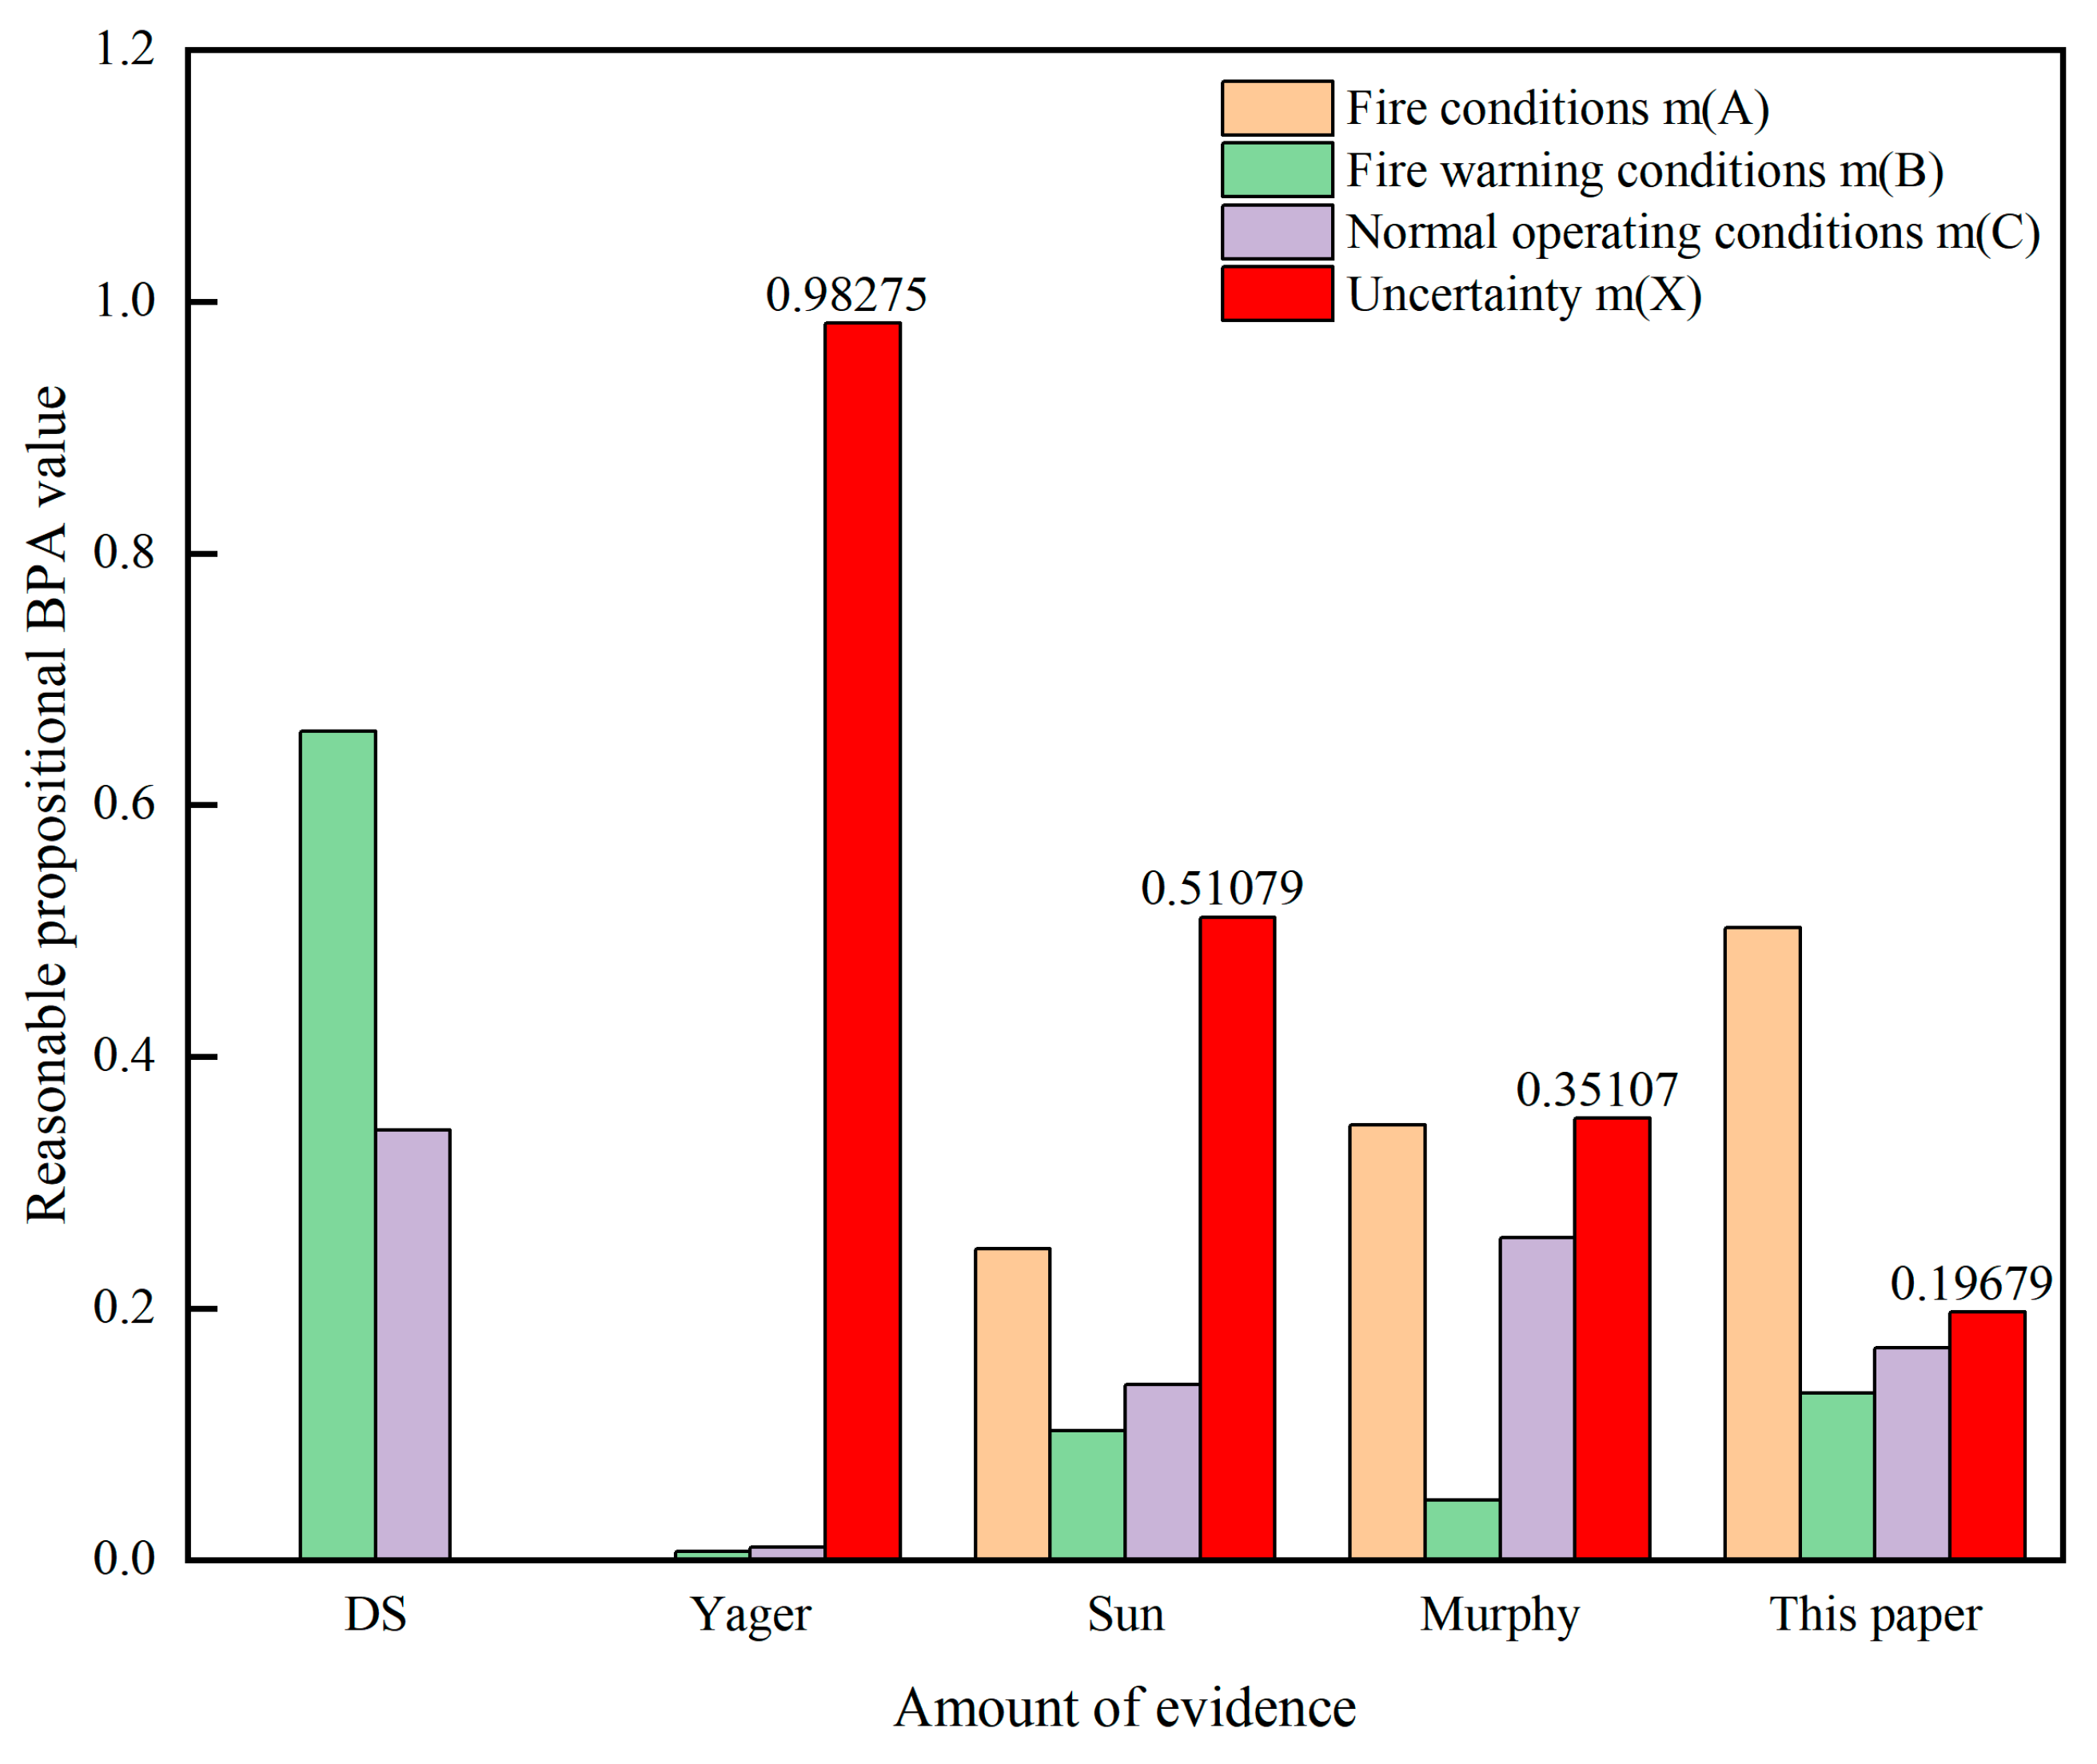
Figure 4.
Tunnel fire simulation process.
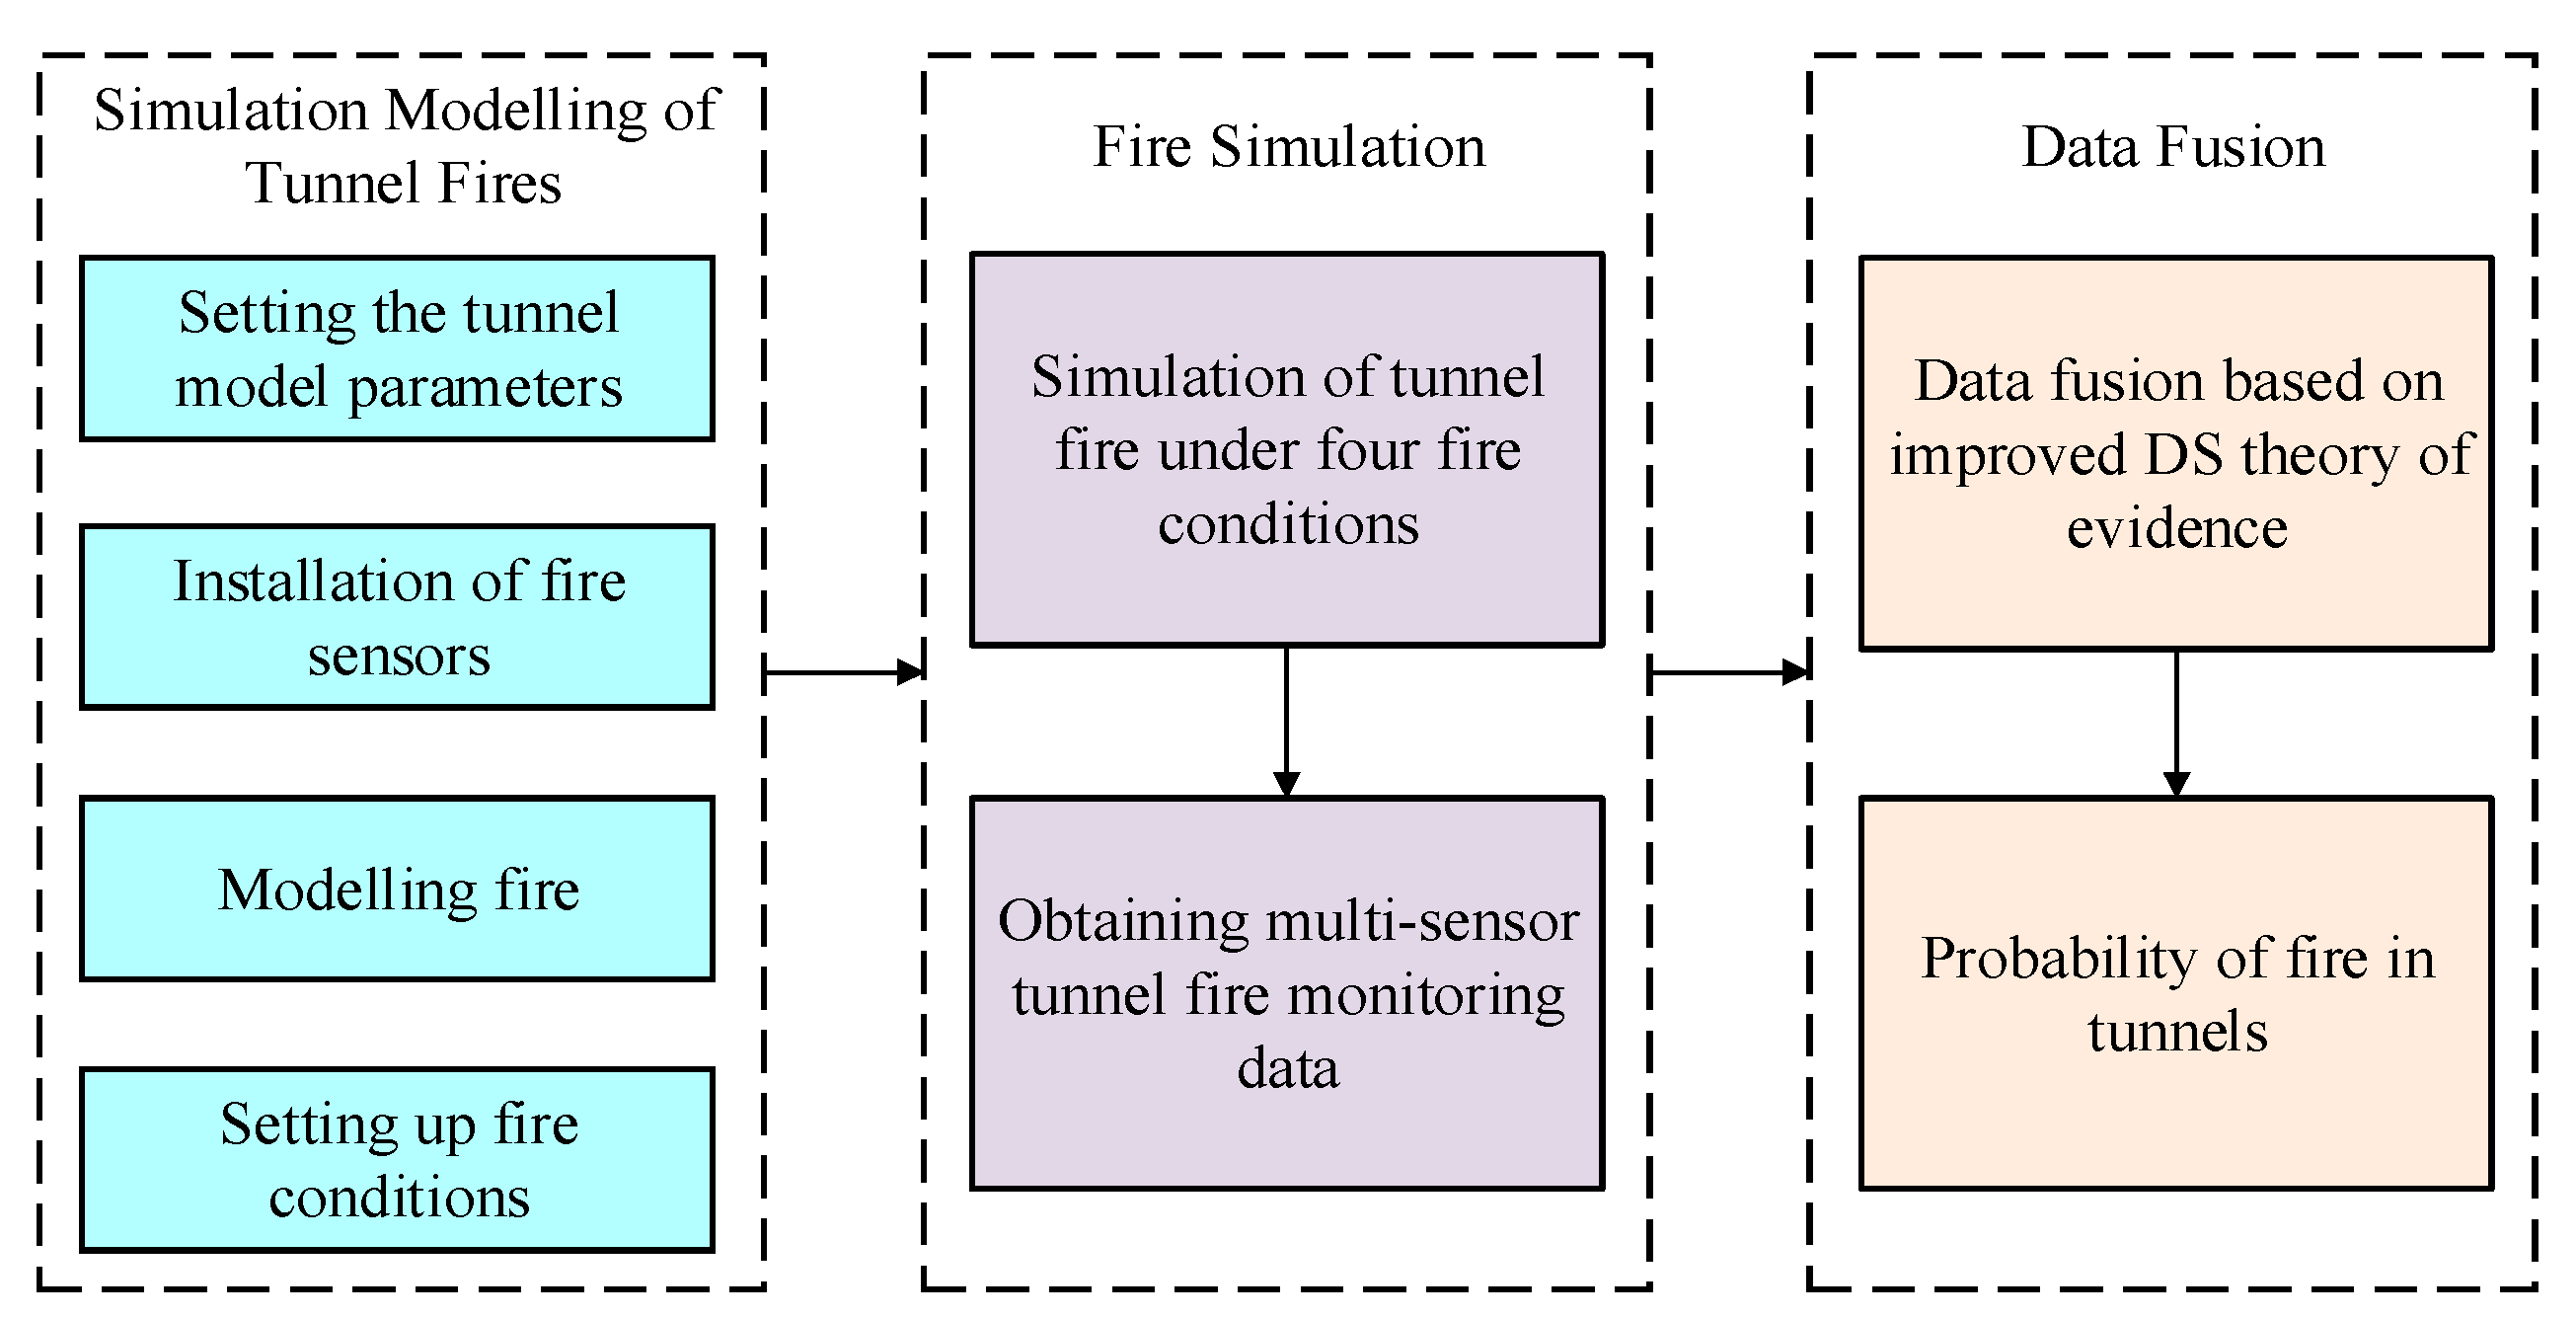
Figure 5.
Tunnel geometric model.
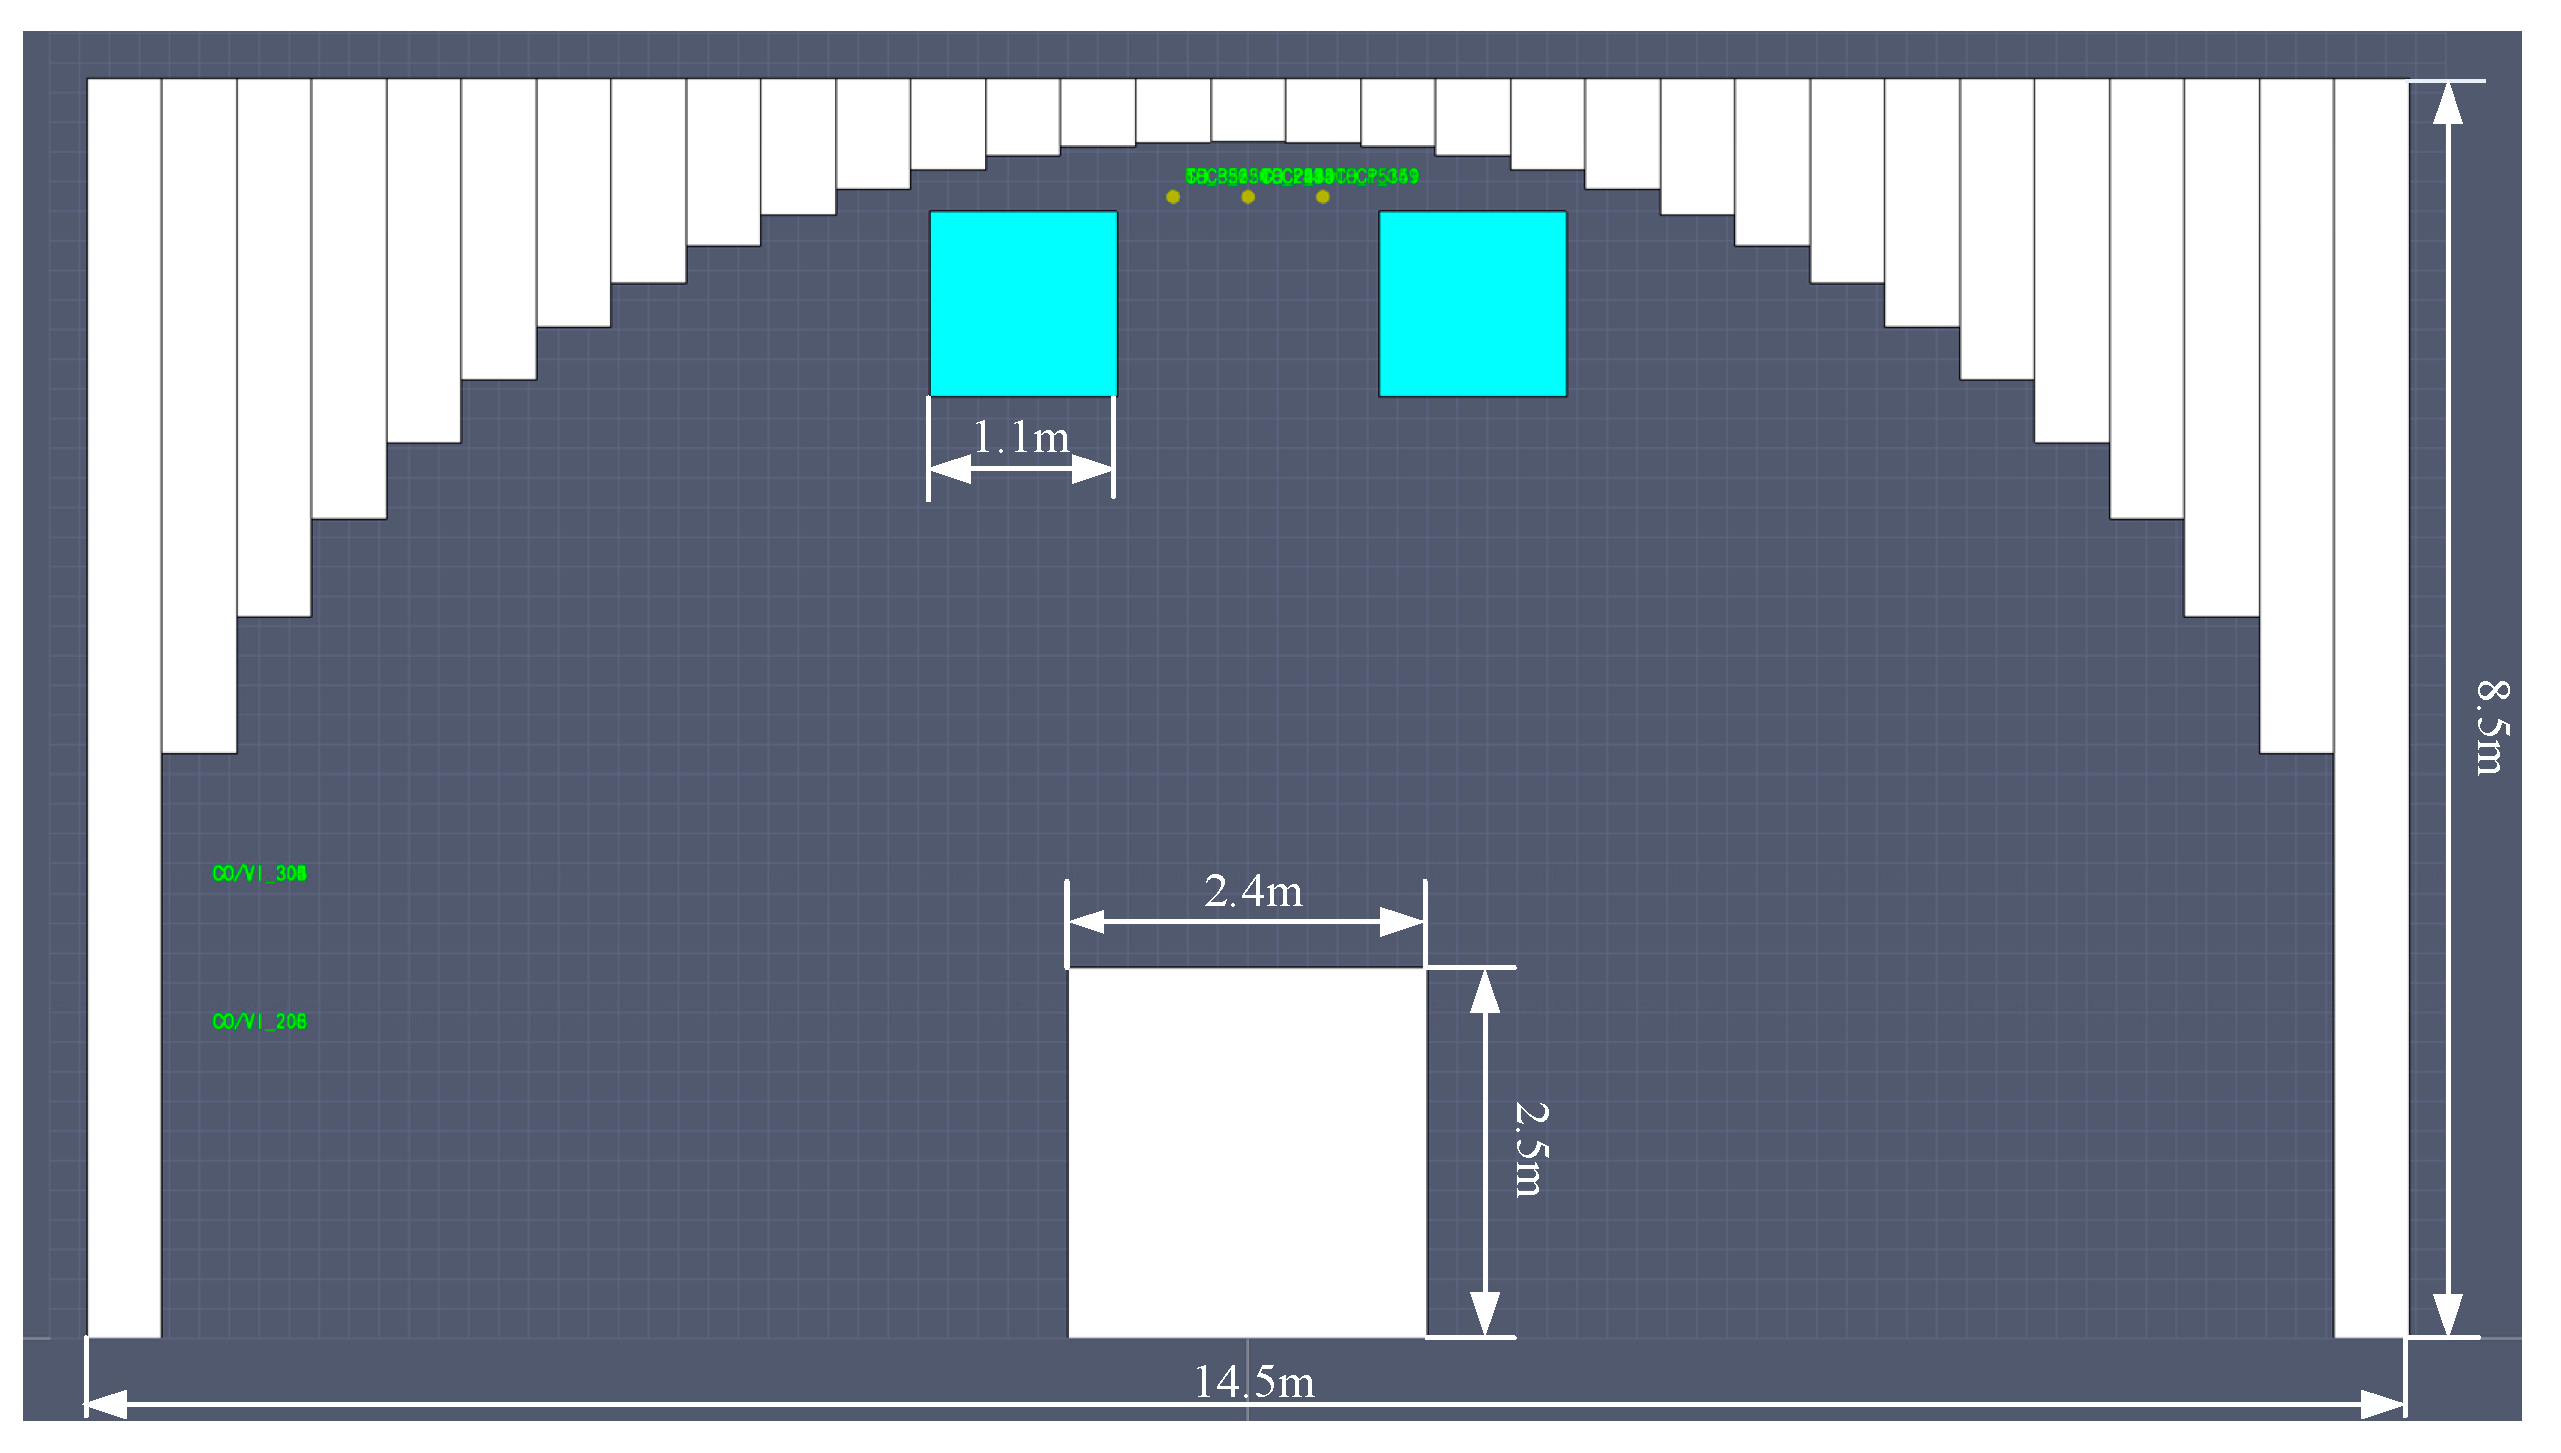
Figure 6.
Tunnel fire monitoring sensor layout.
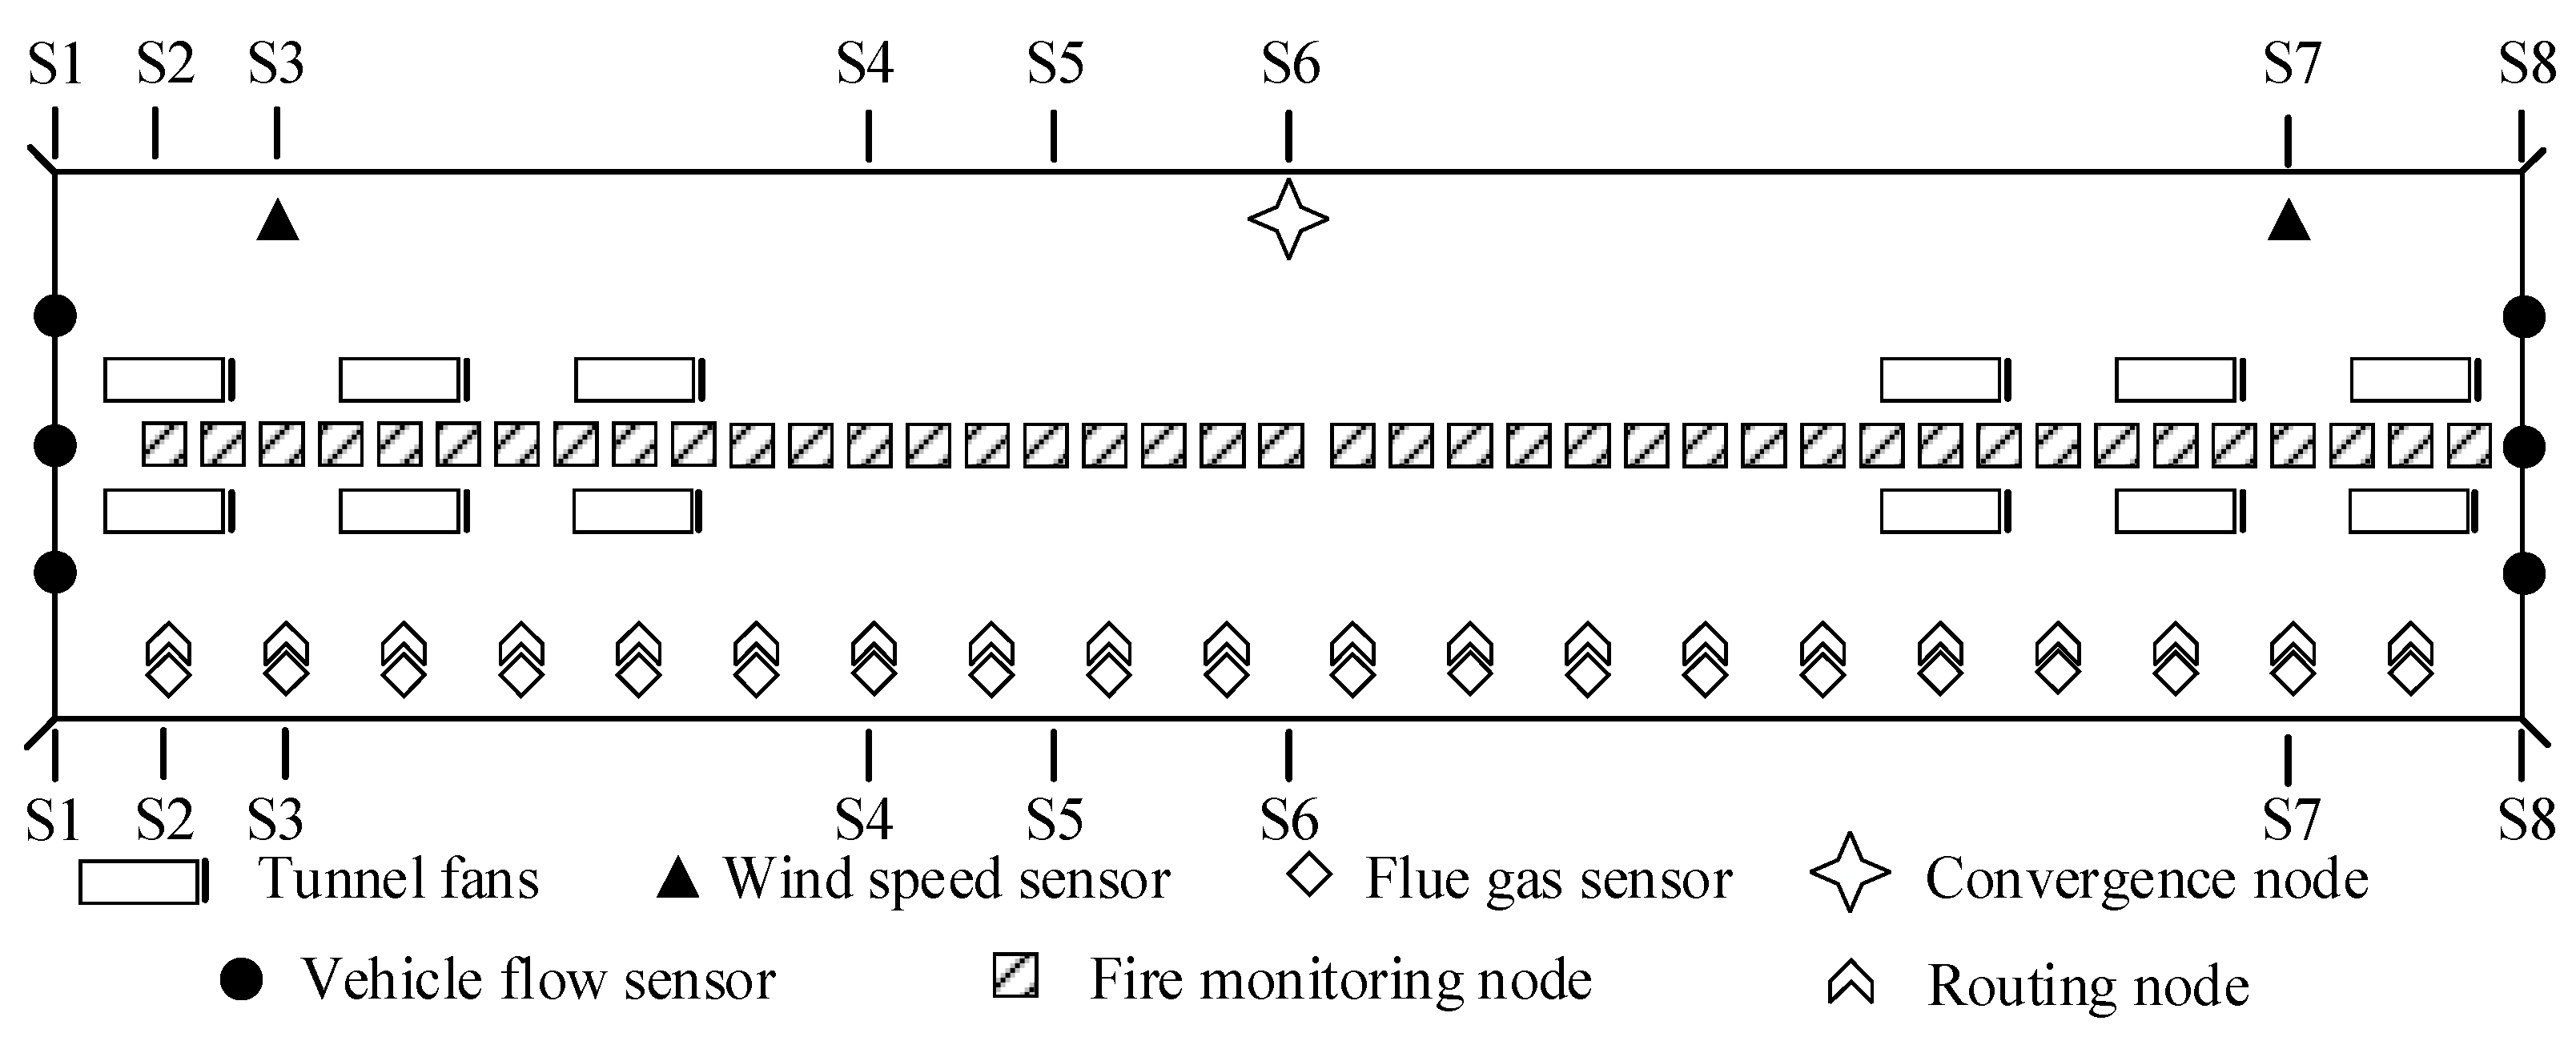
Figure 7.
Tunnel ignition point locations.
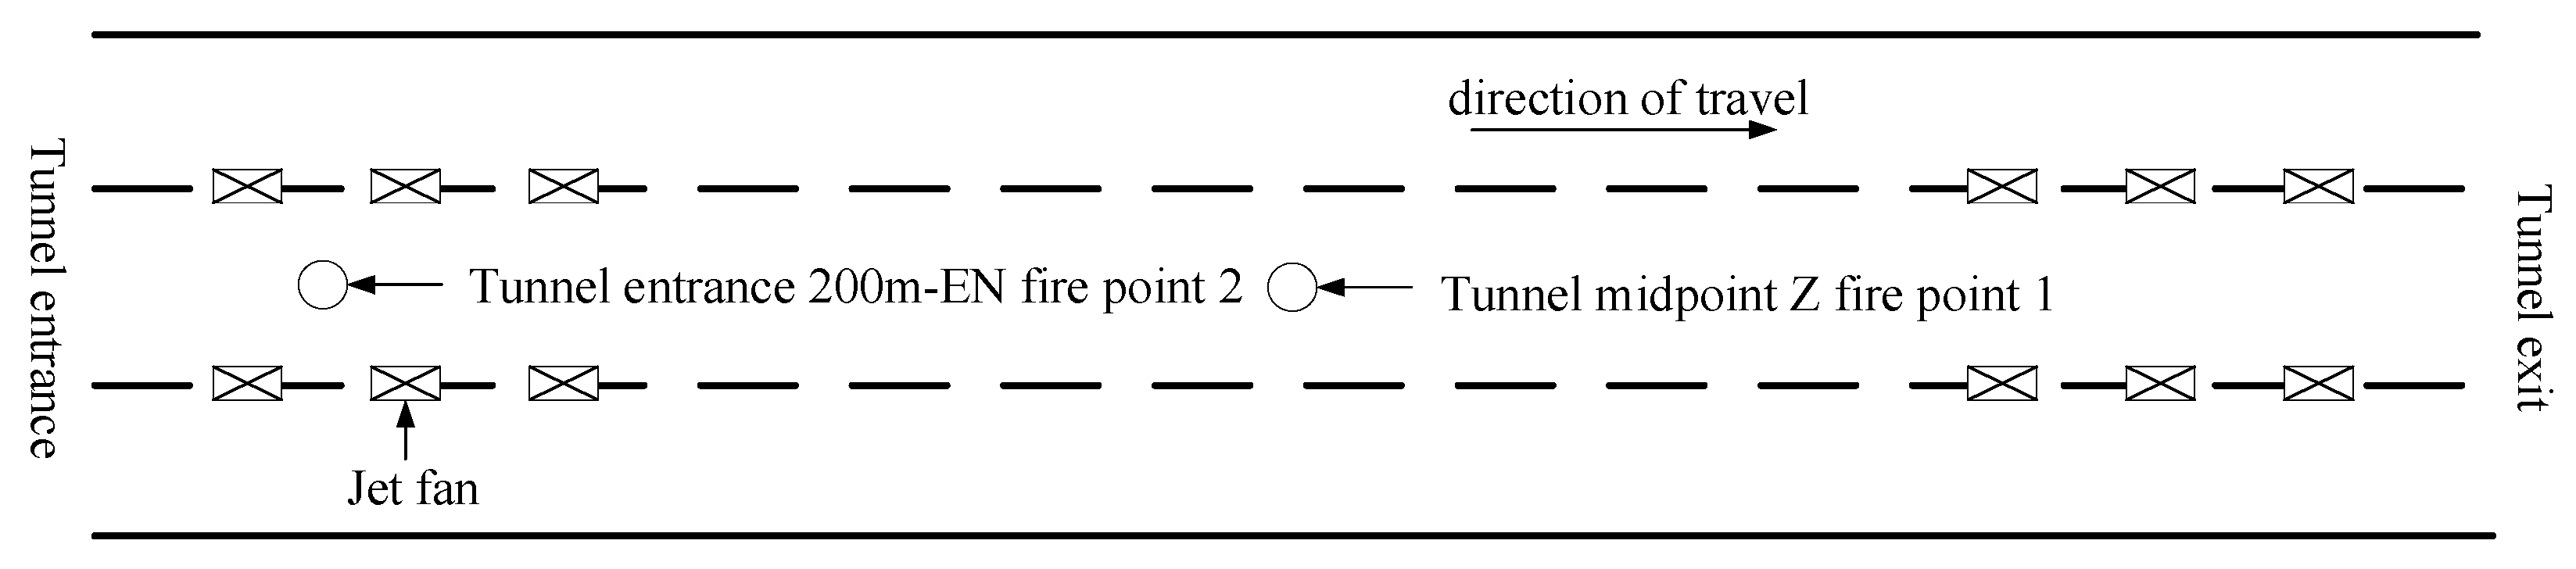
Figure 8.
Probability curves of tunnel fire occurrence under different conditions. (a) LZ-R5-S2.5. (b) LZ-R20-S0. (c) LZ-R20-S2.5. (d) LEN-R20-S3.
Figure 8.
Probability curves of tunnel fire occurrence under different conditions. (a) LZ-R5-S2.5. (b) LZ-R20-S0. (c) LZ-R20-S2.5. (d) LEN-R20-S3.
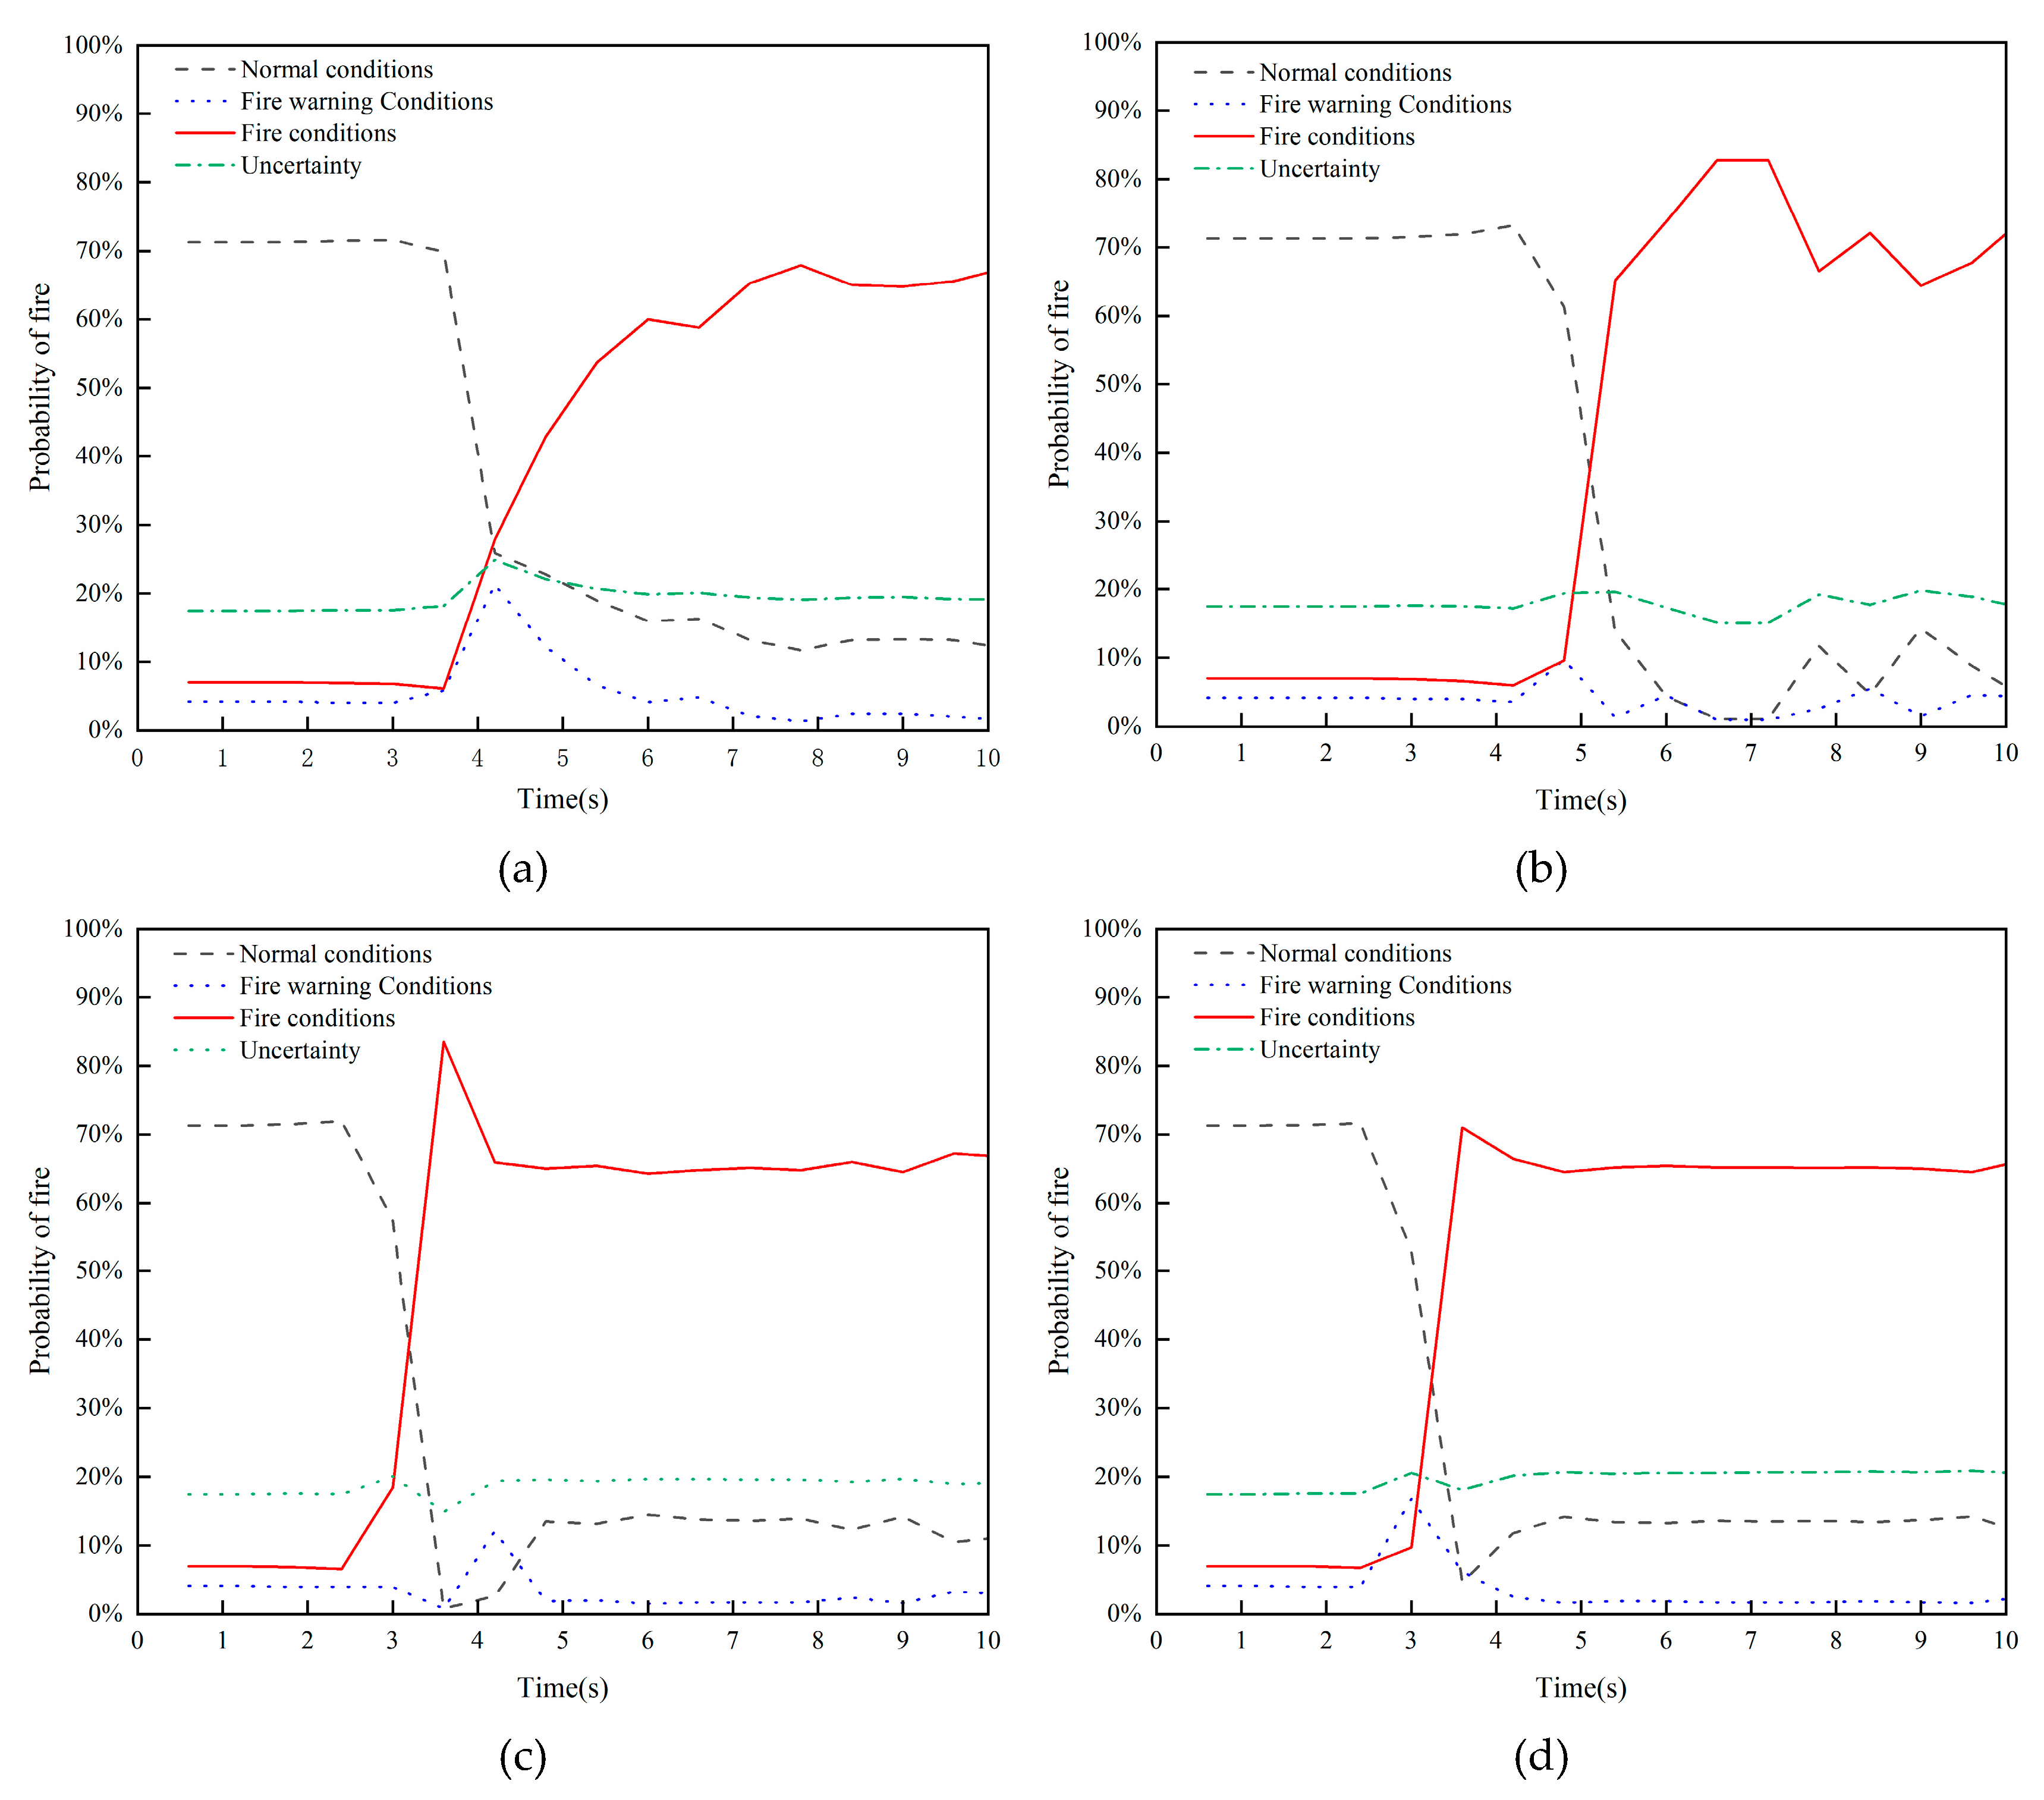
Figure 9.
Comparison of tunnel fire occurrence probability curves under four conditions.
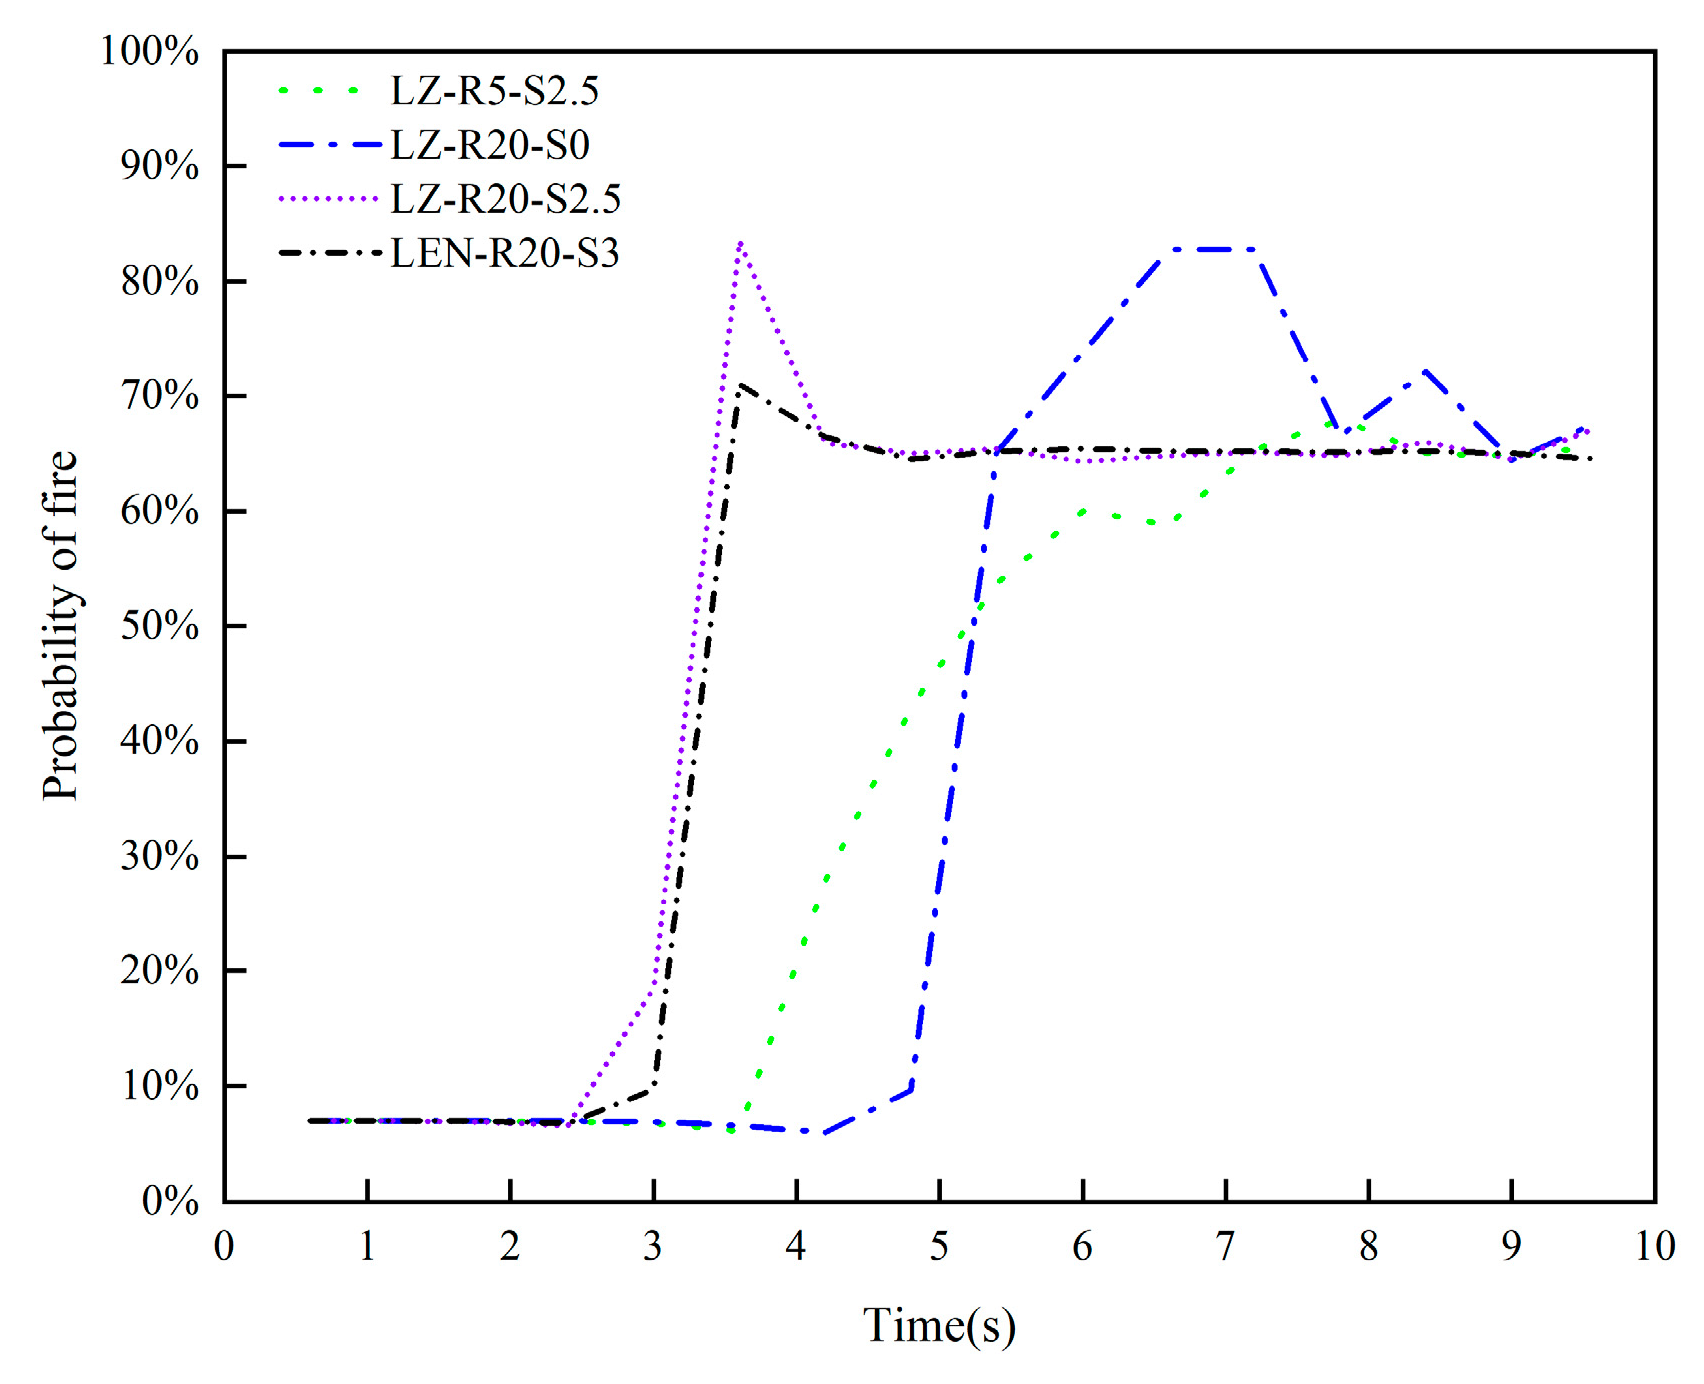
Figure 10.
Comparison of fire state prediction curves.Figure 10. presents the fire occurrence probabilities for various methods. Compared to other methods, the approach proposed in this paper improves fire detection accuracy by 5% to 10.2%, reduces the time required to identify a fire to approximately 2.4 seconds (64.7% to 70% improvement over other methods) , and simultaneously enhances both the timeliness and accuracy of monitoring. This demonstrates its feasibility and effectiveness in multi-sensor data fusion.
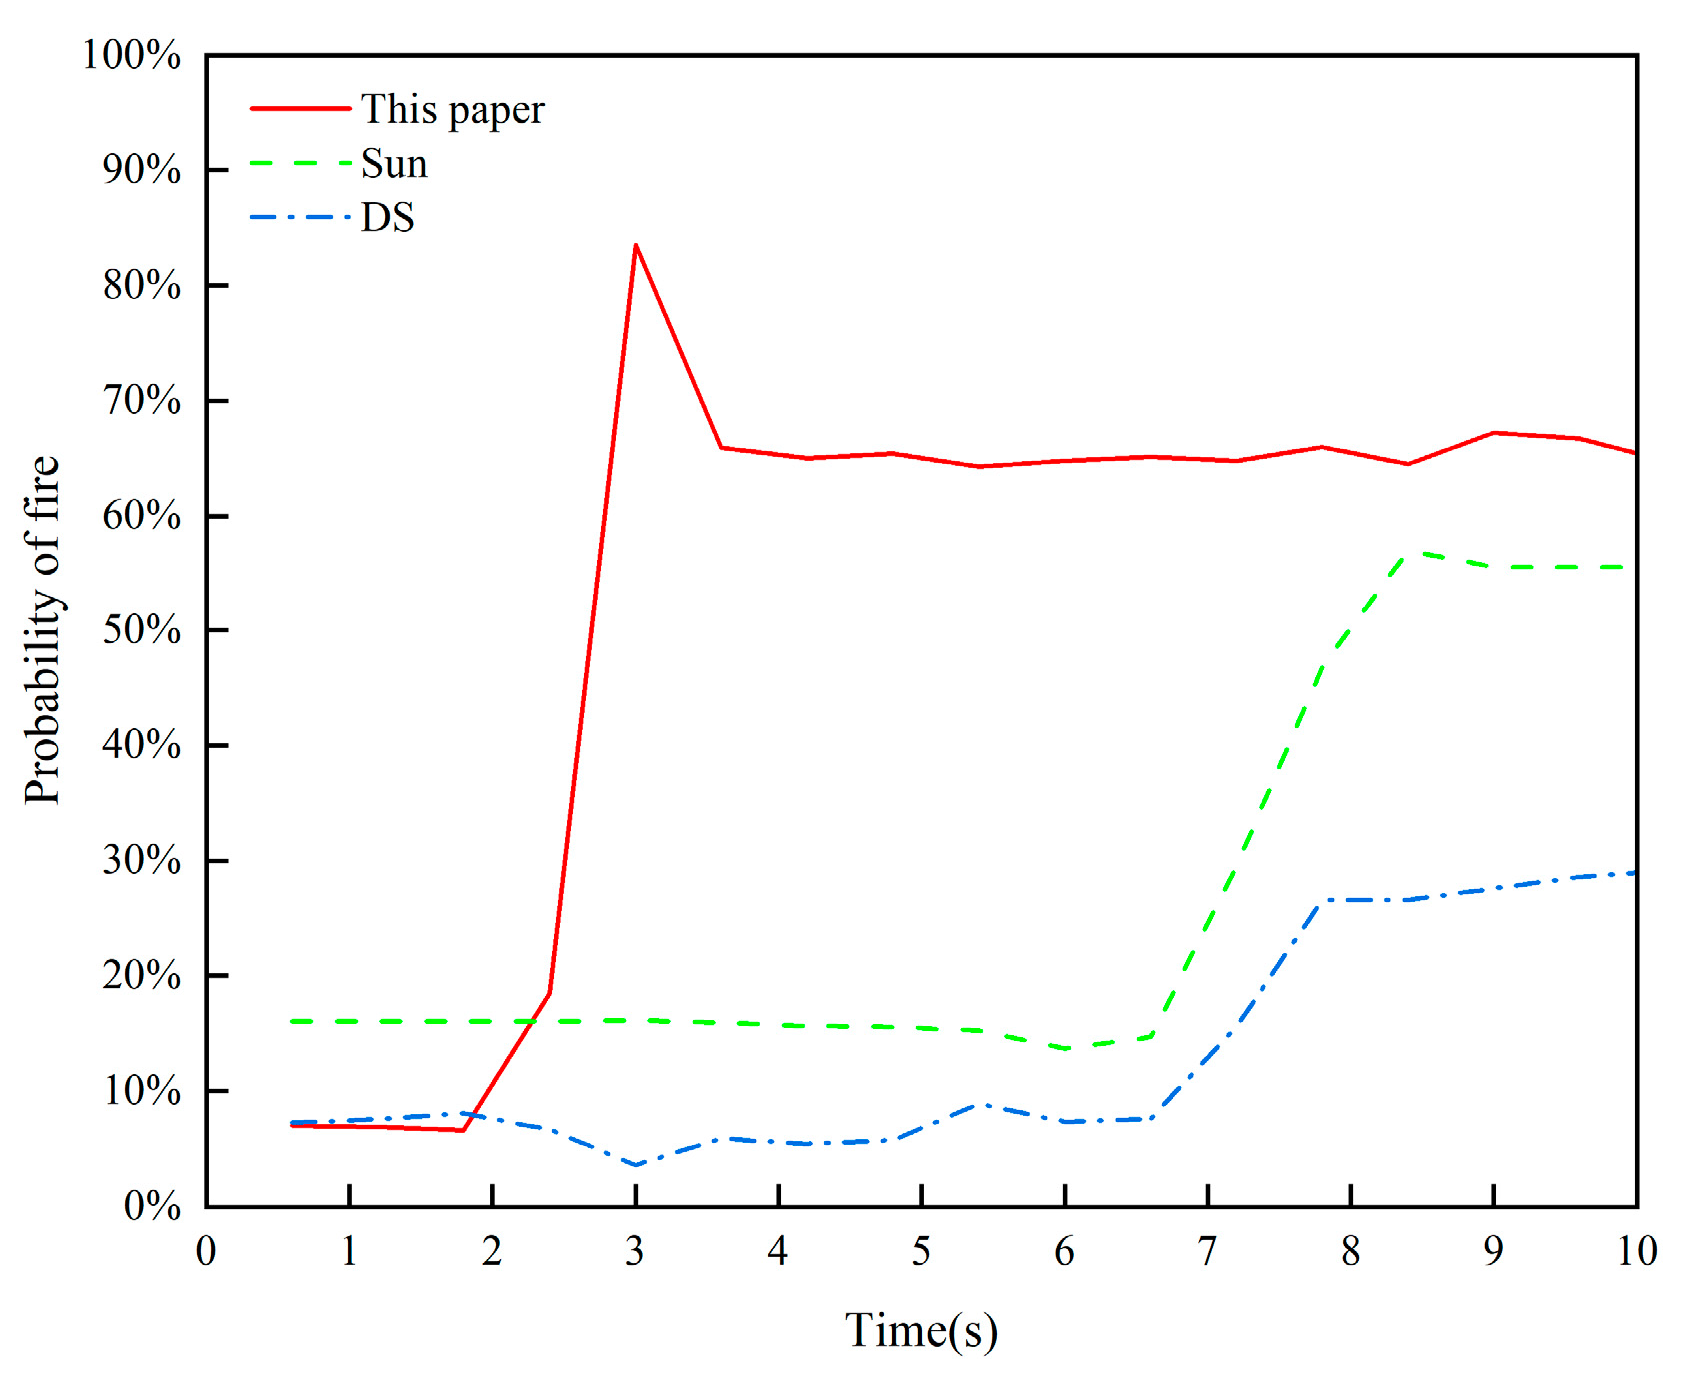
Table 1.
DS theory of evidence data fusion results.
| Actual tunnel conditions | Multi-sensor fire BPA | Data fusion fire probability decision | ||
|---|---|---|---|---|
| Temperature m1 | CO m2 | Soot concentration m3 | Data fusion results | |
| Fire conditions A | 0.75 | 0 | 0.8 | 0 |
| Fire warning conditions B | 0.15 | 0.3 | 0.15 | 0.6585 |
| Normal operating conditions C | 0.1 | 0.7 | 0.05 | 0.3415 |
Table 2.
Data fusion results of five algorithms.
| Fire conditions m (A) | Fire warning conditions m (B) | Normal operating conditions m (C) | Uncertainty m (X) | |
|---|---|---|---|---|
| DS | 0 | 0.65850 | 0.34150 | |
| Yager | 0 | 0.00675 | 0.01050 | 0.98275 |
| Sun | 0.24746 | 0.10254 | 0.13921 | 0.51079 |
| Murphy | 0.34536 | 0.04751 | 0.25606 | 0.35107 |
| This paper | 0.50247 | 0.13253 | 0.16821 | 0.19679 |
Table 4.
Multi-sensor monitoring data for tunnel fire condition LM-R5-S2.5.
| Time (s) | Temperature (℃) | Soot concentration (m-1) | CO concentration (cm3/m3) | ||||||
|---|---|---|---|---|---|---|---|---|---|
| 1 | 2 | 3 | Gas 1 | Gas 2 | Gas 3 | CO_1 | CO_2 | CO_3 | |
| 0.6 | 20 | 20 | 20 | 0.0040 | 0.0040 | 0.0040 | 42 | 42 | 42 |
| 1.2 | 20.01 | 20.01 | 20.01 | 0.0040 | 0.0040 | 0.0040 | 42 | 42 | 42 |
| 1.8 | 20.04 | 20.04 | 20.04 | 0.0040 | 0.0040 | 0.0040 | 42 | 42 | 42 |
| 2.4 | 20.23 | 20.23 | 20.23 | 0.0040 | 0.0040 | 0.0040 | 42 | 42 | 42 |
| 3 | 50 | 20.55 | 20.55 | 0.0040 | 0.0040 | 0.0040 | 42 | 42 | 42 |
| 3.6 | 28.95 | 28.99 | 28.9 | 0.0070 | 0.0070 | 0.0070 | 51 | 51 | 51 |
| 4.2 | 46.22 | 46.7 | 46.22 | 0.0707 | 0.0706 | 0.0708 | 48 | 48 | 48 |
| 4.8 | 54.75 | 55.73 | 54.75 | 0.0597 | 0.0595 | 0.0599 | 43 | 43 | 43 |
| 5.4 | 62.03 | 63.39 | 62.03 | 0.0588 | 0.0587 | 0.0589 | 44 | 44 | 44 |
| 6 | 67.59 | 68.72 | 67.59 | 0.0591 | 0.0591 | 0.0591 | 44 | 44 | 44 |
| 6.6 | 66.65 | 67.46 | 66.65 | 0.0624 | 0.0624 | 0.0625 | 43 | 43 | 43 |
| 7.2 | 72.59 | 73.28 | 72.59 | 0.0394 | 0.0396 | 0.0392 | 44 | 44 | 44 |
| 7.8 | 78.1 | 78.77 | 78.1 | 0.0569 | 0.0587 | 0.0551 | 43 | 43 | 43 |
| 8.4 | 82.01 | 82.82 | 75 | 0.0604 | 0.0598 | 0.0610 | 42 | 42 | 42 |
| 9 | 82.05 | 82.7 | 82.05 | 0.0662 | 0.0655 | 0.0669 | 42 | 42 | 42 |
| 9.6 | 79.91 | 80.46 | 79.91 | 0.0719 | 0.0724 | 0.0715 | 42 | 42 | 42 |
| 10.2 | 79.08 | 79.77 | 79.08 | 0.0525 | 0.0539 | 0.0512 | 43 | 42 | 44 |
| 10.8 | 75.8 | 77.15 | 75.8 | 0.0536 | 0.0518 | 0.0554 | 43 | 42 | 43 |
Table 5.
Feature interval classification.
| State Space | Normal conditions | Fire warning Conditions | Fire conditions |
|---|---|---|---|
| Temperature range (°C) | 0~40 | 40~55 | 55~100 |
| Soot concentration range (m-1) | 0.0000~0.0075 | 0.0075~0.0120 | 0.0120~0.0750 |
| CO concentration interval (cm3/m3) | 0.00~107.50 | 107.50~150.00 | 150.00~350.00 |
Table 6.
Probability assignment functions for operating condition LM-R5-S2.5.
| Time (s) | Temperature mass1 | Soot concentration mass2 | CO concentration mass3 | ||||||
|---|---|---|---|---|---|---|---|---|---|
| A | B | C | A | B | C | A | B | C | |
| 0.6 | 0.60 | 0.17 | 0.24 | 0.91 | 0.03 | 0.06 | 0.85 | 0.05 | 0.10 |
| 1.2 | 0.60 | 0.17 | 0.24 | 0.91 | 0.03 | 0.06 | 0.85 | 0.05 | 0.10 |
| 1.8 | 0.60 | 0.17 | 0.24 | 0.91 | 0.03 | 0.06 | 0.85 | 0.05 | 0.10 |
| 2.4 | 0.60 | 0.16 | 0.23 | 0.91 | 0.03 | 0.06 | 0.85 | 0.05 | 0.10 |
| 3 | 0.61 | 0.16 | 0.23 | 0.91 | 0.03 | 0.06 | 0.85 | 0.05 | 0.10 |
| 3.6 | 0.90 | 0.05 | 0.05 | 0.42 | 0.29 | 0.29 | 0.95 | 0.02 | 0.03 |
| 4.2 | 0.08 | 0.82 | 0.10 | 0.05 | 0.03 | 0.92 | 0.91 | 0.03 | 0.06 |
| 4.8 | 0.17 | 0.41 | 0.42 | 0.04 | 0.02 | 0.94 | 0.87 | 0.05 | 0.09 |
| 5.4 | 0.14 | 0.22 | 0.64 | 0.04 | 0.02 | 0.94 | 0.87 | 0.04 | 0.08 |
| 6 | 0.09 | 0.13 | 0.78 | 0.04 | 0.02 | 0.94 | 0.87 | 0.04 | 0.09 |
| 6.6 | 0.10 | 0.14 | 0.76 | 0.04 | 0.03 | 0.93 | 0.86 | 0.05 | 0.09 |
| 7.2 | 0.05 | 0.06 | 0.89 | 0.02 | 0.01 | 0.97 | 0.87 | 0.04 | 0.08 |
| 7.8 | 0.01 | 0.01 | 0.98 | 0.03 | 0.02 | 0.95 | 0.86 | 0.05 | 0.09 |
| 8.4 | 0.04 | 0.05 | 0.91 | 0.04 | 0.03 | 0.94 | 0.85 | 0.05 | 0.10 |
| 9 | 0.04 | 0.05 | 0.91 | 0.04 | 0.03 | 0.93 | 0.85 | 0.05 | 0.10 |
| 9.6 | 0.03 | 0.03 | 0.95 | 0.05 | 0.03 | 0.92 | 0.85 | 0.05 | 0.10 |
| 10.2 | 0.02 | 0.02 | 0.96 | 0.02 | 0.02 | 0.96 | 0.87 | 0.05 | 0.09 |
| 10.8 | 0.02 | 0.02 | 0.97 | 0.03 | 0.02 | 0.96 | 0.86 | 0.05 | 0.09 |
Table 7.
Tunnel states computed using improved DS evidence theory for fire condition LM-R5-S2.5.
| Time (s) | Normal conditions | Fire warning conditions | Fire conditions | Uncertainty |
|---|---|---|---|---|
| 0.6 | 71.30% | 4.20% | 7.00% | 17.50% |
| 1.2 | 71.30% | 4.20% | 7.00% | 17.50% |
| 1.8 | 71.30% | 4.20% | 7.00% | 17.50% |
| 2.4 | 71.50% | 4.00% | 6.90% | 17.60% |
| 3 | 71.60% | 4.00% | 6.80% | 17.60% |
| 3.6 | 69.90% | 5.80% | 6.10% | 18.20% |
| 4.2 | 25.90% | 21.30% | 27.90% | 24.90% |
| 4.8 | 22.80% | 12.20% | 42.90% | 22.10% |
| 5.4 | 19.00% | 6.60% | 53.70% | 20.70% |
| 6 | 16.00% | 4.10% | 60.00% | 19.90% |
| 6.6 | 16.30% | 4.80% | 58.80% | 20.10% |
| 7.2 | 13.20% | 2.10% | 65.30% | 19.40% |
| 7.8 | 11.70% | 1.30% | 67.90% | 19.10% |
| 8.4 | 13.20% | 2.40% | 65.00% | 19.40% |
| 9 | 13.30% | 2.40% | 64.80% | 19.50% |
| 9.6 | 13.20% | 2.00% | 65.60% | 19.20% |
| 10.2 | 11.90% | 1.50% | 67.50% | 19.10% |
| 10.8 | 12.00% | 1.50% | 67.50% | 19.00% |
Disclaimer/Publisher’s Note: The statements, opinions and data contained in all publications are solely those of the individual author(s) and contributor(s) and not of MDPI and/or the editor(s). MDPI and/or the editor(s) disclaim responsibility for any injury to people or property resulting from any ideas, methods, instructions or products referred to in the content. |
© 2024 by the authors. Licensee MDPI, Basel, Switzerland. This article is an open access article distributed under the terms and conditions of the Creative Commons Attribution (CC BY) license (http://creativecommons.org/licenses/by/4.0/).
Copyright: This open access article is published under a Creative Commons CC BY 4.0 license, which permit the free download, distribution, and reuse, provided that the author and preprint are cited in any reuse.


