Submitted:
07 August 2024
Posted:
08 August 2024
You are already at the latest version
Abstract
African yam bean (Sphenostylis stenocarpa Hochst, Ex. A. Rich. Harms) is an important grain legume in sub-Saharan Africa because of its nutritional value and adaptability to various agroecological zones. To foster the varietal development of improved African yam bean (AYB) genotypes with economic traits, it is necessary to validate parental polymorphism for key markers in selecting progenies from crosses between desired parents. The study aims to analyze the genetic fidelity between parents and F1 progenies in African yam bean through putative cowpea Simple sequence repeat (SSR) markers. Hence, a total of seventy-seven progenies were derived from four sets of biparental crossings using drought-susceptible (TSs-96, TSs-363, and TSs-274) and drought-tolerant (TSs-417, TSs-111, and TSs-78) AYB accessions. These were validated using 120 cowpea primers targeting SSR under optimal PCR conditions, and the size of the PCR-amplified DNA fragments was checked using gel electrophoresis. Twenty primers exhibited polymorphism in the parental lines, while ten displayed higher levels of the same polymorphism. The average polymorphism level for the surveyed SSR markers was 0.36. Given these findings, our study demonstrates that cowpea SSR markers are a reliable method for regular testing and clear identification of AYB crosses, indicating potential AYB improvements.
Keywords:
African yam bean
; sub-Saharan Africa
; cowpea SSR markers
; biparental crossings
; drought tolerance
1. Introduction
In developing countries, legumes are the primary plant protein source in the average home. Staple legumes include cowpea (Vigna unguiculata L. Walp), soybean (Glycine max), and groundnut (Arachis hypogaea L.). Only a few local farmers cultivate most grain legumes needed to meet the dietary needs of the rural population. The widespread underutilization of most grain legumes led to their classification as orphan crops [1], some of which includeAfrican yam bean (Sphenostylis stenocarpa) (AYB), Bambara groundnut (Vigna subterranea), and pigeon pea (Cajanus cajan).
It is a dual crop with protein-rich edible seeds and underground swollen roots [3]. It belongs to the Fabaceae family and is the most cultivated species in the genus Sphenostylis [5].AYB has been reported to contain about 29 and 19% crude protein content in its grain and tuber, respectively (34).Regarding amino acid content (lysine and methionine), The grain has a considerably higher amount when compared to major staple legumes like cowpea and soybean (35). Also, its tubers are like sweet potatoes and Irish potatoes in size and appearance but contain a higher amount of crude protein content twice that of sweet potatoes and ten times higher than that of cassava roots [7]. The potential of this crop, particularly in terms of nutrition can help mitigate widespread malnutrition and chronic food insecurities in sub-Saharan Africa (SSA) [2].
It is cultivated as a major legume in the eastern part of Nigeria, serving as an important source of food and income for rural dwellers [4]. It is indigenous to tropical Africa and can grow to a height of about 1-3 meters high. Agro-ecologies ranging from savannah to rainforest support AYB cultivation, so long as there is a combination of adequate rainfall of about 100 cm or more during the growing season and good drainage. AYB seeds can be cooked as porridge or puddings, processed into flour, fermented as a soup condiment, and fortified with cassava or other cereal-based products. The milk from its seeds helps boost breast milk production in lactating mothers [3]. Some parts of Ghana prepare AYB at various local festivals, including puberty rites for maidens [8]. The serum uric acid concentration of AYB is minimal and compares well with that of soybeans [9]. Some tribes in Central Africa commonly incorporate AYB tuber into their meals and consume the leaves as cooked vegetables [10]. Despite this crop’s food and nutritional security potential, constraints such as drought, photoperiod, reduced yield potential, seed coat hardiness, laborious staking needs, long maturation period, presence of anti-nutritional factors (ANF) or secondary metabolites, and insect infestation have greatly limited its cultivation and use [11,12].
Attempts at making crosses in AYB plants have been largely unsuccessful; hence no improved variety has been developed to date. The entire available germplasm to geneticists and breeders is cultivated landraces collected from gene banks. Quite a few molecular markers have been employed to obtain information at the molecular level of AYB. Previously used DNA-based molecular markers include random amplified polymorphic DNA (RAPD) (19) and fragment length polymorphisms (AFLPs) (20, 21), simple sequence repeat (SSR) (17), more recently restriction site-associated DNA sequencing (RADseq) (36) and DArTseq (37, 10).
SSR markers have been used in a wide range of applications, especially in the identification of true hybrids in breeding programs. Simple sequence repeats (SSR), and single nucleotide polymorphism (SNP) has been the most extensively used marker technologies. SSRs are DNA sequences with a few (1~6) nucleotides in tandem repeats that are widely distributed in eukaryotic genomes. SSR markers have the advantages of good repeatability, high polymorphism, and resolution, as well as ease of operation [13,14,15]. Diverse legume species, such as yam bean, lima bean, and mung bean, have been studied extensively widely using SSRs for variety identification [16].
When breeding for new crop varieties, hand pollination is the most used technique in population development. Hybridization easily produces spurious hybrids, potentially misleading the breeder in selecting the ideal candidates during the improvement phase. Before proceeding with future breeding programs, an accurate mechanism for determining the true-to-type nature of any hybrid must be established. Therefore, this study seeks to ascertain the identities of 77 AYB progenies obtained from four sets of biparental crosses and estimate the genetic diversity in the parental genotypes for varietal development and crop improvement in AYB using SSR cowpea derived markers.
2. Materials and Methods
2.1. Plant Material and Crosses
Six parental AYB lines that are susceptible and resilience to drought were obtained from the Genetic Resources Centre of the International Institute of Tropical Agriculture (IITA), Ibadan, Nigeria. These lines were evaluated using the Carolina II mating design, with drought-tolerant accessions (TSs-417, TSs-111, and TSs-78) used as male progenitors and drought-susceptible accessions (TSs-96, TSs-363, and TSs-274)as female progenitors (Table 1). The hybridization block was established at the research screen house of the IITA, Ibadan, and the crossings produced seventy-seven F1 progenies resulting from the four chosen sets of bi-parental crossings.
2.2. Leaf Sample Collection and DNA Extraction
The young leaves of the parents and progenies were collected in liquid nitrogen 21 days after planting and stored at −80 °C for later use. Genomic DNA (gDNA) of AYB genotypes was extracted using a modified CTAB extraction method [22]. A DNA quality check was completed using electrophoresis on a 1% (w/v) agarose gel. The DNA concentration and quality were determined using a nanodrop spectrophotometer of 1000 v3.3.1 (Thermo Scientific Nanodrop, USA) by measuring the absorption at 260 and 280 nm and agarose gel electrophoresis. Genomic DNA samples were diluted to a final concentration of 20 ng/µl and stored at −20 °C.
2.3. SSR Marker Selection and PCR Amplification
The study considered 120 selected SSR markers from the cowpea linkage mapping studies conducted by Andargie et al., 2011 [23] for genotyping purposes in validating true crosses. These primers were chosen based on their ability to target simple sequence repeats (SSR) regions. Information on the nucleotide sequences was sent to Integrated DNA Technologies (IDT), USA for primer synthesis. Polymerase chain reactions were conducted using the Applied biosystem thermal cycler GeneAmp PCR System 9700 (Applied Biosystems, USA). DNA from the parent and progenies of AYB were fingerprinted using SSR markers in a 25 μl reaction volume of master mix containing, 2.5 μl of 10X reaction buffer 1μl of 50 mM MgCl2, 2 μl of 10 mM of dNTPs (Deoxynucleotide Triphosphates), 0.6 μM each of forward and reverse primer and 0.1 μl of Taq polymerase. Water was added to make the final volume. Reactions were conducted at an initial denaturation step at 94 ⁰C for 5 min. The annealing step was 65 ⁰C for 30s reducing at -1 ⁰C per cycle 10 times, followed by 94 ⁰C for 30 s, 55 ⁰C for 30 s; 72 ⁰C for 1 min for 30 cycles, and a final extension/elongation step at 72 ⁰C for 10 min and then held at 4 ⁰C. The amplified products were stored at -20 ⁰C before gel electrophoresis.
The amplified DNA fragments were separated on 2 % Agarose gel at 100 V for 45 min – 1 h in 1X TBE (Tris-boric ethylene diamine tetra acetic acid) (1X) using a gel electrophoresis apparatus (MS Major Science, UK) and BIO-RAD (Criterion TM cassettes). A 6 X DNA loading dye was added to the PCR products for visual tracking of DNA fragment migration during electrophoresis. A 50 bp DNA marker (New England, Bio Labs) was used as a reference to estimate the size of the specific DNA bands in the PCR-amplified products visualized on a UV transilluminator and photographed using a Gel Documentation System (Apelegen). The preliminary screening using 120 SSR markers on the parental genotypes for polymorphism allowed the selection of informative loci used to confirm the identity of the 77 AYB progenies.
2.4. Gel Electrophoresis
The PCR-amplified products were resolved on a 3% agarose gel stained with ethidium bromide. Gel electrophoresis was conducted at 100V for 2 hours in 1X TBE buffer. The DNA fragments were visualized under UV light and photographed using a gel documentation system.
2.5. Polymorphism Analysis
The SSR primers exhibiting polymorphism among the parental lines and their F1 progenies were identified. Polymorphic bands were scored as present (1) or absent (0) to create a binary data matrix. The polymorphism information content (PIC) for each primer was calculated using the formula:
where Pi is the frequency of the ith allele.
2.6. Determination of True Progeny
It is possible to differentiate between genuine and false hybrids by comparing the alleles of the parents and their offspring. If a progeny exhibited bi-parental inheritance, meaning it inherited one allele from the mother and one from the father, we classified it as true. Conversely, we categorized a descendant as false or contaminated if it possessed at least one allele that did not originate from its parents at two or more microsatellite markers. The absence of paternal alleles does not completely rule out the possibility that self-pollination, rather than a cross between the presumed parents, created the offspring. Also, when an unexpected allele is present alongside a maternal allele, pollen from a different plant enters the system and produces non-hybrid offspring.
2.7. Statistical Analysis
The percentage of hybrid genetic purity was calculated using the scored data and purity index of Bohra et al. 2011 [24]. Hybrid purity was determined by dividing the number of true hybrids, which include alleles from both parents, by the total number of hybrids screened, then multiplying the results by 100. We estimated genetic diversity parameters using the power marker software (version 3.25) and data generated from 20 SSR markers. The polymorphic information content (PIC), percentage of polymorphic loci, mean number of alleles per polymorphic locus, observed heterozygosity (Ho), and gene diversity (He) were used to estimate the diversity index. A simple matching dissimilarity index determines pairwise comparisons of the proportion of shared alleles between individual genotypes. The resulting genetic dissimilarity coefficient was then transformed into a distance matrix averaging over 1000 bootstraps. We generated a cluster analysis from the distance matrix using the unweighted pair group method and the arithmetic averages (UPGMA) algorithm to enhance the visualisation of the genetic relationships between the parents. We used the ape package in R to cluster the progeny based on genetic distance, and pedigree information was used as a cofactor to confirm the genetic relatedness of the hybrids from respective parental crosses [25].
3. Results
3.1. Screening the Parents and Progenies Using SSR Markers
The selection of SSR markers from the synthesized 120 SSR primers, which were used to screen AYB parental genotypes and their hybrids, was based on their capacity to produce polymorphic bands under optimum PCR conditions. The findings indicated that out of the 120 SSR markers used, 100 markers were either monomorphic or do not amplify in the AYB DNA. After screening for variation, we identified 10 of the total 20 primers as polymorphic for all six parents. This is illustrated in Figure 1. The gel fragment analysis (Table 2) revealed that 52 (68%) of the 77 hybrids were true-to-type. We obtained these hybrids from the crosses TSs-274 x TSs-78, TSs-363 x TSs-111, TSs-96 x TSs-111, and TSs-96 x TSS-417, yielding 28 (64%), 7 (100%), 15 (71%), and 12 (57%) hybrids, respectively. The genotyping findings showed a total of 24 alleles that varied in number from 2 to 4 across different loci and groups. The average number of alleles was 2.4. The SSR 6466 and SSR 6171 markers exhibited the greatest number of alleles, with a count of 4, whereas the other primers displayed 2 alleles each. The mean gene diversity, also known as expected heterozygosity (He), varied from 0.42 (SSR-6577) to 0.50 (SSR-6466), with an overall average of 0.45. The range of observed heterozygosity varied from 0.24 (SSR-6225) to 0.64 (SSR-6466), with an average of 0.44. The polymorphic information content (PIC) of loci in the two groups was highest in SSR 6466 and SSR 6171 (0.42), and lowest in SSR 6577 (0.33), with an average of 0.36 (Table 3).
3.2. Cluster analysis And F-Statistics
Figure 2 presents a dendrogram based on the hybrid pedigree. The phylogenetic relationship showed two main clusters, or genetic groups. The first cluster has the largest number of members, combining true F1 hybrids and progenies from all four biparental crosses. This cluster grouped progenies from respective cross combinations as a genetic sub-group. However, out of the four biparental offspring, only the F1 progenies from the cross TSs-363 x Tss-111 showed no evidence of false hybrids. In the other three cross combinations, namely, TSs-274 x TSs78, TSs-96 x 111, and TSs-96 x 417, the true progenies that aligned to their respective parental identities were 18, 15, and 12, respectively. Cluster two comprises two sub-groups, A and B, each containing F1 progenies identified as false F1 hybrids. These cluster’s progenies were a cross-combination involving TSs-274 x TSs-78 (10 progenies), TSs-96 x TSs-111 (6 progenies), and TSs-96 x TSs-417 (9 progenies).
The phylogenetic tree of the parental lines (Figure 3) revealed three genetic groups, with cluster one having four parental lines (TSs-78, TSs-363, TSs-96, and TSs-417), cluster two having one line (TSs-111), and cluster three having one member (TSs-274) (Figure 4). Analysis of molecular variance (AMOVA) showed that most of the variation was partitioned among the population (57%). The variability partitioned among individuals was 7%, while within individuals it was 36%, with a remarkably high level of genetic differentiation (Table 4).
4. Discussion
Twenty primers showed polymorphism for the six parental lines; however, ten of these primers provided low levels of polymorphism. The remaining ten primers with high levels of polymorphism were further used to screen the AYB parental lines and their corresponding progenies in the hybrid verification process. 68% of the progenies, specifically fifty-two, were true-to-type and could proceed to the next stage of inbreeding through selfing. Additionally, only progenies from the cross TSs-363 x TSs-111 had perfect clustering. This population has the least number of progenies among the four crosses, which may account for why the progenies showed no contamination from another parental cross as observed in the other three populations. The offspring from the crosses TSs-363 x TSs-111, TSs-96 x TSs-111, and TSs-96 x TSS-417 are not grouped together perfectly. This could be because the crosses were not labeled correctly or there were other problems with the pollination. This study reported that the set of ten SSR loci, which were highly informative and provided good distribution coverage of the cowpea genome, was adequate for genetic diversity in cowpea accessions [17]. The cross-transferability of cowpea markers among different legume crops, particularly legume species, without reference genome information and/or genomic tools (markers) such as African yam bean increases their usefulness in diversity assessment [17,26].
The ten SSR markers showed a mean PIC of 35.6%, which is lower than some results obtained in some previous studies on African yam bean [17,18,19,20]. The markers’ nature could be the reason for the low mean PIC. Additionally, dissimilarity in genotype and the number of accessions could be probable factors [27]. Furthermore, DArT-SNP markers in winged bean [28] and sugar beet [29] found similar PIC values, indicating their ability to distinguish between the different accessions used in this study. The most informative markers were SSR 6466 and SSR 6171, with a mean PIC of 0.43, while SSR-6701, SSR-6924, SSR-6225, SSR-6982, and SSR-6294 were the least informative (0.34). Earlier research on African yam beans using different markers, like ISSR [18], AFLP [21], and SSR [17], found that the average PICs for accessions from Nigeria were 0.52, 0.25, and 0.78. These results are in line with those findings. The average number of alleles found at each locus (2.4) was in line with what other genetic diversity studies in winged beans using SSR markers [28,30,31] had found. The small number of alleles per locus corresponds to the African yam bean’s nature as a self-pollinating crop.
The study found a remarkably high level of genetic differentiation among the parental lines of African yam beans, indicating that these lines are extremely far apart in terms of their allele constituents and therefore suitable for breeding population development. Apart from the remarkably high genetic differentiation, the populations partitioned most of the variability among themselves. This is contrary to findings from previous genetic diversity studies in African yam beans using diverse DNA molecular markers that have shown low to medium genetic differentiation and diversity [17,32]. Both expected and observed heterozygosity averaged 0.45 and 0.44, respectively. When using isozyme markers, the study found more heterozygosity than the average for self-pollinating plants (He = 33%) [19]. Consequently, the mechanism of mutations and their high rate of occurrence are associated with high levels of polymorphism in SSR markers. Heterozygosity is an indication that two randomly selected alleles from an accession are different [33]. The expected heterozygosity observed in this study affirmed that the parental materials have moderate to high levels of heterozygosity, as expected for African yam bean.
5. Conclusion
The selected SSR markers had enough polymorphism to verify the hybrids generated from crosses involving three drought-tolerant and three drought-susceptible Africa yam bean genotypes. We identified fifty-two offspring as being true-to-type, allowing them to advance to the next phase of inbreeding by self-pollination. The F-statistics indicated that genetic differences account for 57% of the variability among the parental lines, thereby confirming the presence of genetic dissimilarity. This is the first study to examine biparental crossings of the African yam bean to determine the success of four distinct, unique populations, Cowpea SSR markers is a tool for analysing genetic variation in African yam bean species. Furthermore, the study displayed the effectiveness of SSR markers in confirming the parentage of hybrid offsprings, a crucial component of breeding schemes.
Funding
This research is funded by the Global Crop Diversity Trust and Consortium of International Agricultural Research Centers (CGIAR) through GRC-IITA.
Data Availability Statement
The original contributions presented in the study are included in the article/supplementary material; further inquiries can be directed to the corresponding authors.
Acknowledgements
The Authors express their gratitude to the members of staff seed bank GRC-IITA, Ibadan, Internship students, IITA Ibadan staff in other units and the staff cowpea breeding unit, IITA Kano, for their technical assistance. We also thank The Bioscience Centre IITA, for field and technical assistance.
Conflicts of Interest
The Authors disclose that there are no conflicts of interest. The funders had no role in the design of this study; in the collection, analysis, or interpretation of data; the writing of the manuscript; or in the decision with the results.
References
- Popoola, J.O.; Aworunse, O.S.; Ojuederie, O.B.; Adewale, B.D.; Ajani, O.C.; Oyatomi, O.A.; Eruemulor, D.I.; Adegboyega, T.T.; Obembe, O.O. The Exploitation of Orphan Legumes for Food, Income, and Nutrition Security in Sub-Saharan Africa. Front. Plant Sci. 2022, 13, 782140. [Google Scholar] [CrossRef] [PubMed] [PubMed Central]
- Baiyeri, S.; Uguru, M.; Ogbonna, P.; Samuel-Baiyeri, C.; Okechukwu, R.; Kumaga, F.; Amoatey, C. Evaluation of the nutritional composition ofthe seeds of some selected African yam bean (Sphenostylis stenocarpa Hochst Ex. A. Rich (Harms)) accessions. Agro-Science 2018, 17, 37. [Google Scholar] [CrossRef]
- Adewale, B.D.; Nnamani, C.V. Introduction to food, feed, and health wealth in African yam bean, a locked-in African indigenous tuberous legume. Front. Sustain. Food Syst. 2022, 6, 726458. [Google Scholar] [CrossRef]
- Enujiugha, V.N.; Talabi, J.Y.; Malomo, S.A.; Olagunju, A.I. DPPH Radical Scavenging Capacity of Phenolic Extracts from African Yam Bean (Sphenostylisstenocarpa). Food Nutr. Sci. 2012, 3, 7–13. [Google Scholar] [CrossRef]
- Potter, D.; Doyle, J.J. Origins of the African Yam bean (Sphenostylis stenocarpa, leguminosae): Evidence from morphology, isozymes, chloroplast DNA, and linguistics. Econ. Bot. 1992, 46, 276–292. [Google Scholar] [CrossRef]
- Duodu, K.G.; Apea-Bah, F.B. African Legumes: Nutritional and Health-Promoting Attributes, in Gluten-Free Ancient Grains. Cereals, Pseudocereals, and Legumes: Sustainable, Nutritious, and Health-Promoting Foods for the 21st Century.Woodhead Publishing, Elsevier Ltd. 2017. [CrossRef]
- National Research Council, 2006. Lost Crops of Africa, Volume II: Vegetables National Academic Press, Washington, DC. No Title.
- Klu, G.Y.P.; Amoatey, H.M.; Bansa, D.; Kumaga, F.K. Cultivation and use of African yam bean (Sphenostylisstenocarpa) in the Volta Region of Ghana. J. Food Technol. Africa 2001, 6. [Google Scholar] [CrossRef]
- Eneh, U.F.; Orjionwe, R.N.; Adindu, C.S. Effect of African Yam Bean (Sphenostylisstenocarpa) on Serum Calcium, Inorganic Phosphate, Uric Acid, and Alkaline Phosphatase Concentration of Male Albino Rats. J. Agric. Sci. 2015, 8, 148–153. [Google Scholar] [CrossRef]
- Shitta, N.S.; Edemodu, A.C.; Abtew, W.G.; Tesfaye, A.A. A Review on the Cooking Attributes of African Yam Bean (Sphenostylisstenocarpa). Legumes Res. 2022, 2. [Google Scholar] [CrossRef]
- Chinonyerem, A.; Obioha, O.; Ebere, U. Amino acid Composition, Amino Acid Scores and Predicted Protein Efficiency Ratio of Raw and Cooked African Yam Bean (Sphenostylissternocarpa). J. Appl. Life Sci. Int. 2017, 13. [Google Scholar] [CrossRef]
- Okeola, O.G.; Machuka, J.; Fasidi, I.O. Insecticidal activities of the African yam bean seed lectin on the development of the cowpea beetle and the pod-sucking bug.In C.A. Fatokun, S.A. Tarawali, B.B. Singh, P.M. Kormawa and M. Tamo” Challenges and opportunities for enhancing sustainable cowpea production. Proceedings of the World Cowpea Conference III held at the International Institute of Tropical Agriculture (IITA), Ibadan, Nigeria, 4–8 September 2000. Ibadan, Nigeria: IITA.223-230.
- Duhan, N.; Kaundal, R. LegumeSSRdb: A Comprehensive Microsatellite Marker Database of Legumes for Germplasm Characterization and Crop Improvement. Int. J. Mol. Sci. 2021, 22, 11350. [Google Scholar] [CrossRef]
- Srivastava, S.; Avvaru, A.K.; Sowpati, D.T.; Mishra, R.K. Patterns of microsatellite distribution across eukaryotic genomes. BMC Genom. 2019, 20, 153. [Google Scholar] [CrossRef] [PubMed] [PubMed Central]
- Sari, D.; Sari, H.; Ikten, C.; Toker, C. Genome-wide discovery of di-nucleotide SSR markers based on whole genome re-sequencing data of Cicer arietinum L. and Cicer reticulatum Ladiz. Sci. Rep. 2023, 13, 10351. [Google Scholar] [CrossRef] [PubMed] [PubMed Central]
- Popoola, J.; Ojuederie, O.; Adegbite, A. Neglected and Underutilized legume crops: Improvement and future prospect. Recent Advances in Grain Crops Research. Agricultural and Food Sciences, Environmental science 2019. [CrossRef]
- Shitta, N.S.; Abberton, M.T.; Adesoye, A.I.; Adewale, D.B.; Oyatomi, O. Analysis of genetic diversity of African yam bean using SSR markers derived from cowpea. Plant Genet. Resour. Charact. Util. 2015, 14, 50–56. [Google Scholar] [CrossRef]
- Nnamani, C.V.; Afiukwa, C.A.; Oselebe, H.O.; Igwe, D.O.; Uhuo, C.A.; Idika, K.O.; Ezigbo, E.; Oketa, C.N.; Nwankwo, V.O.; Ukwueze, C.K.; et al. Genetic Diversity of some African Yam Bean Accessions in Ebonyi State Assessed using Inter Simple Sequence Repeat (ISSR) markers. J. Underutilized Legumes 2019, 1, 20–33. [Google Scholar]
- Moyib, O.; Gbadegesin, M.; Aina, O.O. Genetic variation within a collection of Nigerian accessions of African yam bean (Sphenostylisstenocarpa) revealed by RAPD primers. Afr. J. Biotech. 2008, 7, 1839–1846. [Google Scholar] [CrossRef]
- Omena, B.O.; Morufat, O.B.; Iyiola, F.; David, O.I.; Mercy, O.O. Assessment of the genetic diversity of African yam bean (SphenostylisstenocarpaHochst ex. A Rich.Harms) accessions using amplified fragment length polymorphism (AFLP) markers. Afr. J. Biotechnol. 2014, 13, 1850–1858. [Google Scholar] [CrossRef]
- Adewale, B.D.; Vroh-Bi, I.; Dumet, D.J.; Nnadi, S.; Kehinde, O.B.; Ojo, D.K.; Adegbite, A.E.; Franco, J. Genetic diversity in African yam bean accessions based on AFLP markers: Towards a platform for germplasm improvement and utilization. Plant Genet. Resour. Charact. Util. 2014, 13, 111–118. [Google Scholar] [CrossRef]
- Murray, M.G.; Thompson, W.F. Rapid isolation of high molecular weight plant DNA. Nucleic Acids Res. 1980, 8, 4321–4326. [Google Scholar] [CrossRef]
- Andargie, M.; Pasquet, R.S.; Gowda, B.S.; Muluvi, G.M.; Timko, M.P. Construction of a SSR-based genetic map and identification of QTL for domestication traits using recombinant inbred lines from a cross between wild and cultivated cowpea (V. unguiculata (L.) Walp.). Mol. Breed. 2011, 28, 413–420. [Google Scholar] [CrossRef]
- Bohra, A.; Dubey, A.; Saxena, R.K.; Penmetsa, R.V.; Poornima, K.; Kumar, N.; Farmer, A.D.; Srivani, G.; Upadhyaya, H.D.; Gothalwal, R.; et al. Analysis of BAC-end sequences (BESs) and development of BES-SSR markers for genetic mapping and hybrid purity assessment in pigeonpea (Cajanus spp.). BMC Plant Biol. 2011, 11, 56. [Google Scholar] [CrossRef]
- Paradis, E.; Schliep, K. ape 5.0: An environment for modern phylogenetics and evolutionary analyses in R. Bioinformatics 2018, 35, 526–528. [Google Scholar] [CrossRef]
- Paliwal, R.; Adegboyega, T.T.; Abberton, M.; Faloye, B.; Oyatomi, O. Potential of genomics for the improvement of underutilized legumes in sub-Saharan Africa. Legum. Sci. 2021, 3. [Google Scholar] [CrossRef]
- Chander, S.; Garcia-Oliveira, A.L.; Gedil, M.; Shah, T.; Otusanya, G.O.; Asiedu, R.; Chigeza, G. Genetic diversity and population structure of soybean lines adapted to sub-Saharan Africa using single nucleotide polymorphism (SNP) markers. Agronomy. 2021, 11, 604. [Google Scholar] [CrossRef]
- Paliwal, R.; Abberton, M.T.; Faloye, B.; Oyatomi, O.A. Developing the role of legumes in West Africa under climate change. Current Opinion in Plant Biology, 2020, 56. [CrossRef]
- Simko, I.; Eujayl, I.; van Hintum, T.J.L. Empirical evaluation of DArT, SNP, and SSR marker-systems for genotyping, clustering, and assigning sugar beet hybrid varieties into populations. Plant Sci. 2012, 184. [Google Scholar] [CrossRef] [PubMed]
- Shonde, T.E.O.; Adebayo, M.A.; Bhadmus, A.A.; Adejumobi, I.I.; Oyatomi, O.A.; Faloye, B.; Abberton, M.T. Diversity Assessment of Winged Bean [Psophocarpustetragonolobus (L.) DC.] Accessions from IITA GenBank. Agronomy 2023, 13, 2150. [Google Scholar] [CrossRef]
- Wong, Q.N.; Tanzi, A.S.; Ho, W.K.; Malla, S.; Blythe, M.; Karunaratne, A.; Massawe, F.; Mayes, S. Development of Gene-Based SSR Markers in Winged Bean (Psophocarpustetragonolobus (L. ) DC.) for Diversity Assessment. Genes 2017, 8, 100. [Google Scholar] [CrossRef]
- Adewale, B.D.; Vroh, I.; Dumet, D.; Nnadi, S.; Kehinde, O.; Ojo, D.; Adegbite, A.; Franco, J. Genetic diversity in African yam bean accessions based on AFLP markers: Towards a platform for germplasm improvement and utilization. PlantGenet. Resour. Characterisation Util. 2015, 13, 1–8. [Google Scholar] [CrossRef]
- Njoku, D.; Gracen, V.; Offei, S.; Asante, I.; Danquah, E.; Egesi, C.; Okogbenin, E. Molecular marker analysis of F1 progenies and their parents for carotenoids inheritance in African cassava (Manihot esculenta Crantz). African J. Biotechnology, 2014, vol. 13, no. 40. [CrossRef]
- Adewale DB and Dumet DJ (2011). Descriptors for African yam bean, Sphenostylis stenocarpa (Hochst ex. A. Rich.) Harms. IITA Res Newsletter 1-12.
- Uguru, M.I.; Madukaife, S.O. Studies on the variability in agronomic and nutritive characteristics of African yam bean (Sphenostylis stenocarpa Hochst ex. A. Rich. Harms). Plant Prod. Res. J. 2001, 6, 10–19. [Google Scholar]
- Aina, A.; Garcia-Oliveira, A.L.; Ilori, C.; Chang, P.L.; Yussuf, M.; Oyatomi, O.; Abberton, M.; Potter, D. Predictive genotype-phenotype relations using genetic diversity in African yam bean (Sphenostylis stenocarpa (Hochst. ex. A. Rich) Harms). BMC Plant Biol 2021, 21, 547. [Google Scholar] [CrossRef]
- Olomitutu, O.E.; Paliwal, R.; Abe, A.; Oluwole, O.O.; Oyatomi, O.A.; Abberton, M.T. Genome-Wide Association Study Revealed SNP Alleles Associated with Seed Size Traits in African Yam Bean (Sphenostylis stenocarpa (Hochst ex. A. Rich.) Harms). Genes 2022, 13, 2350. [Google Scholar] [CrossRef]
Figure 1.
PCR results of ten SSR primers showing polymorphism across the six parental lines.
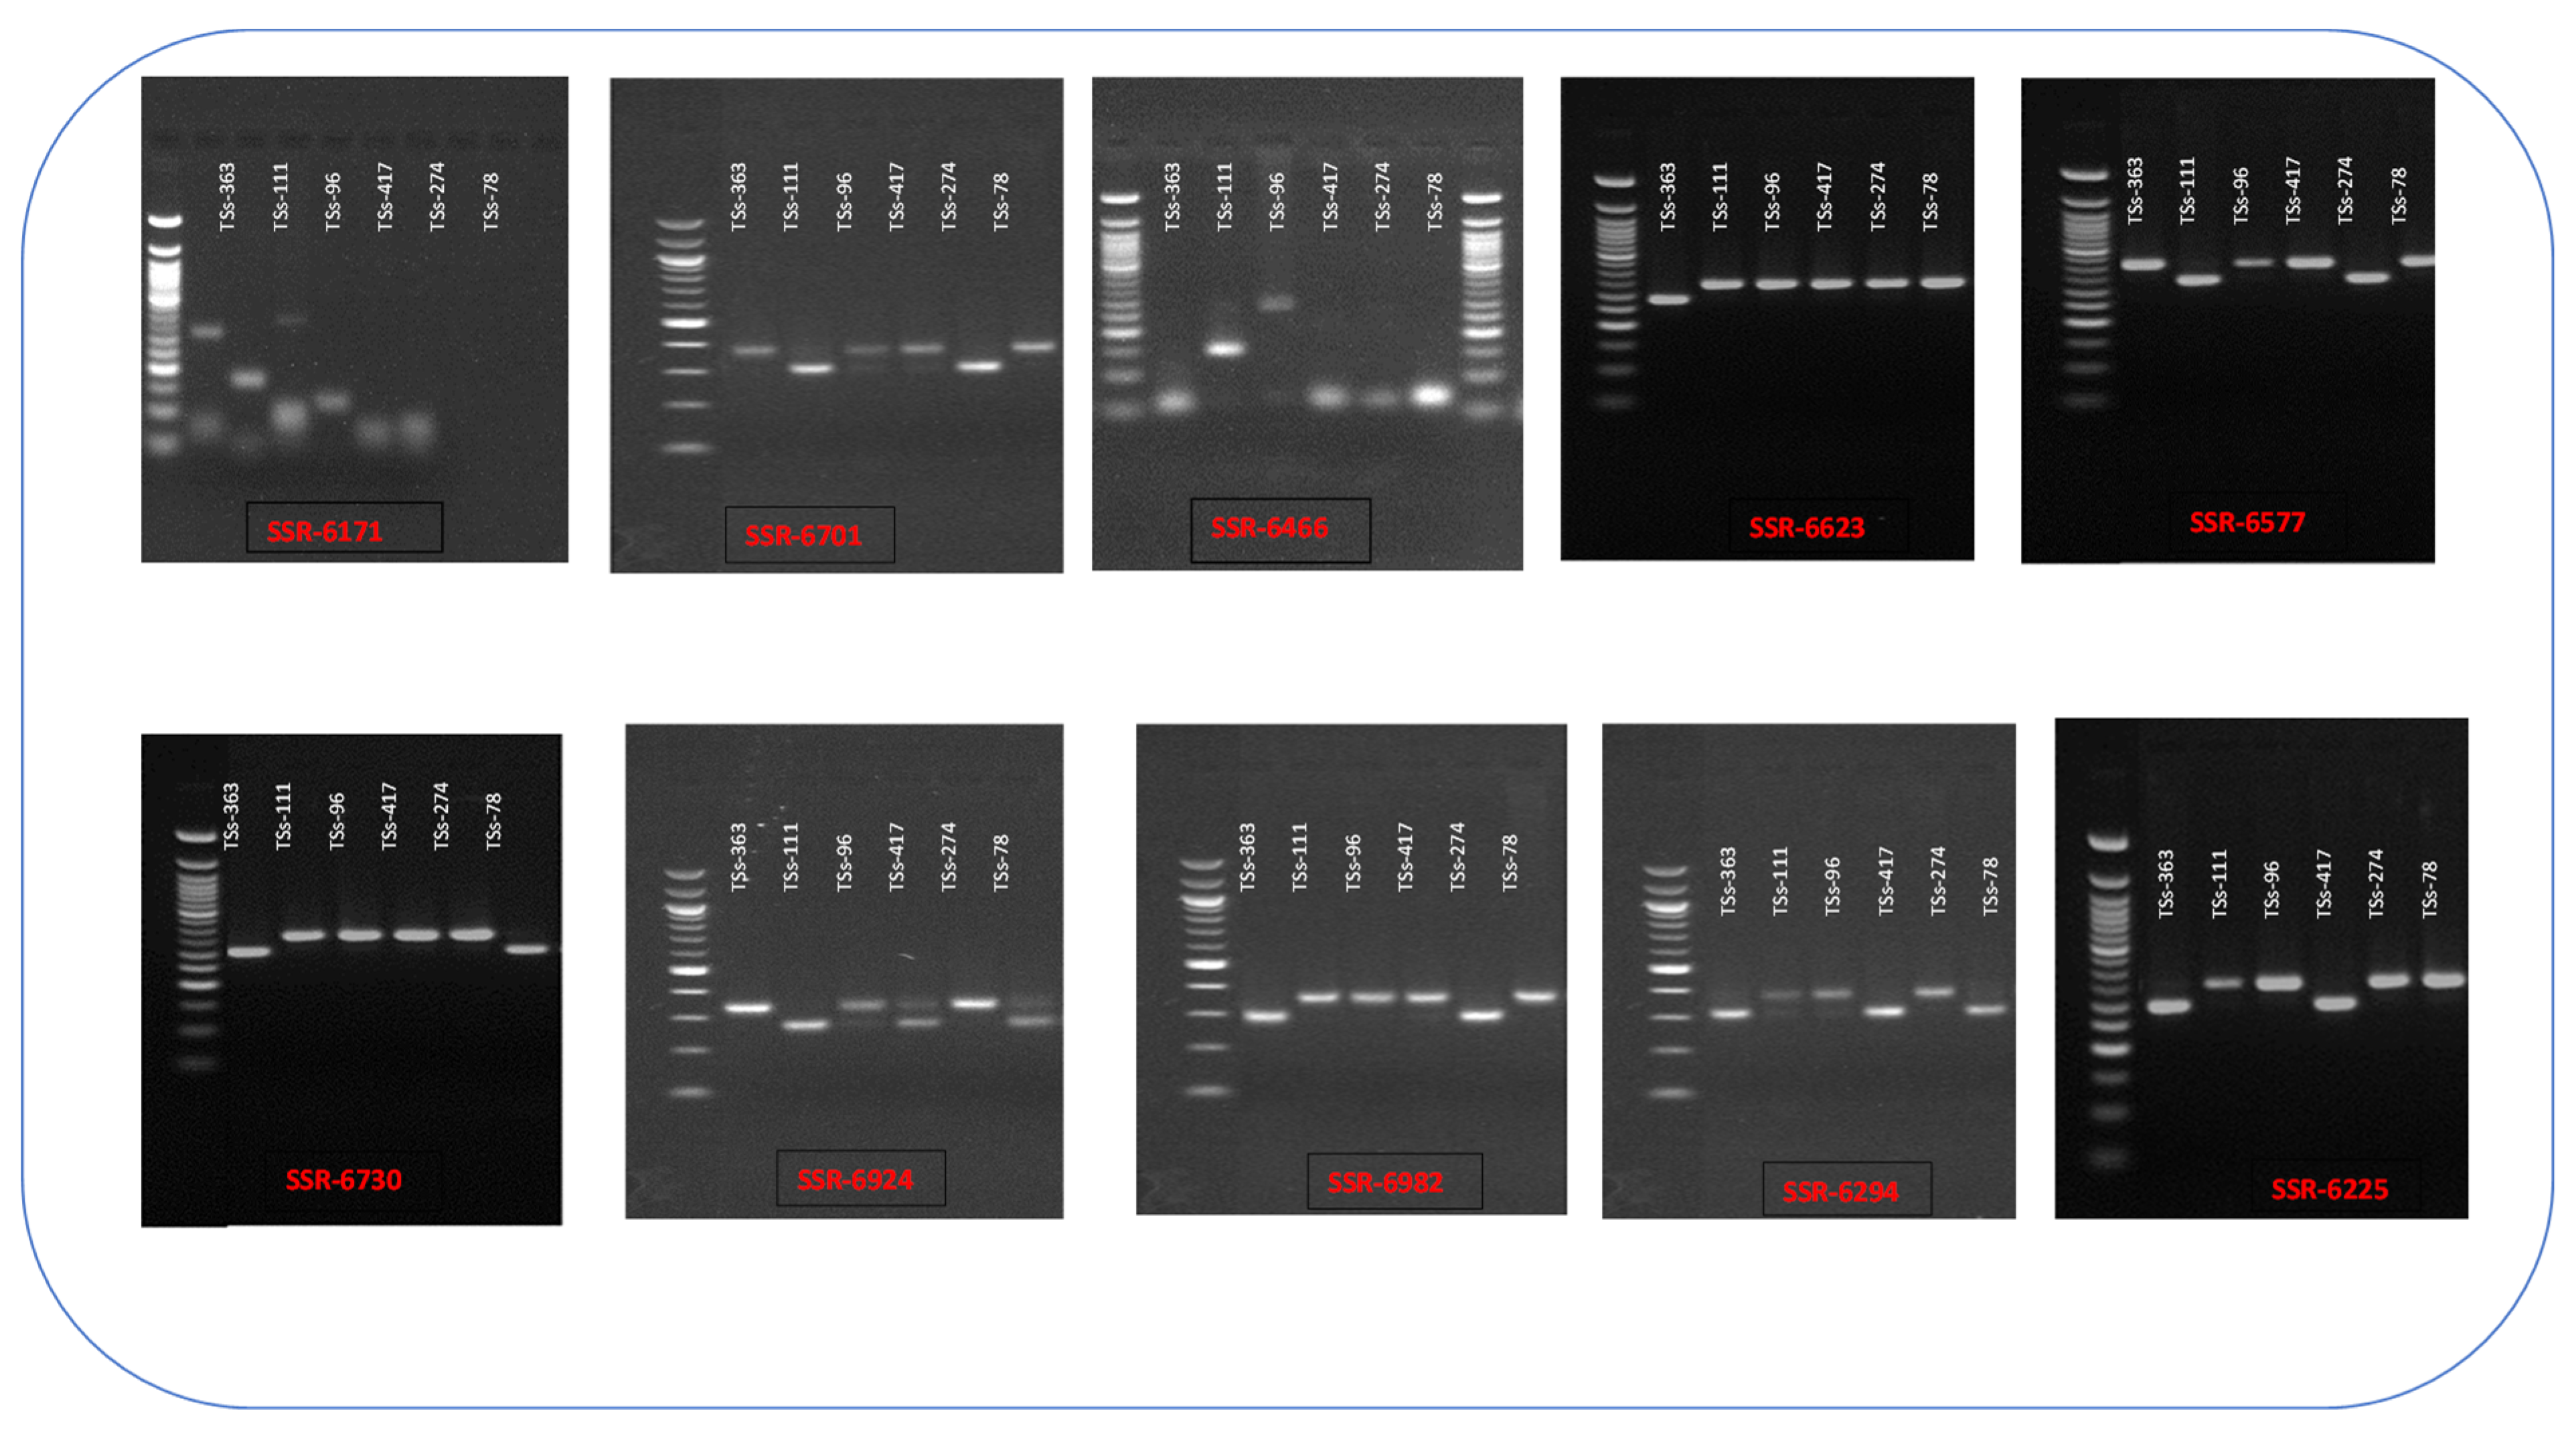
Figure 2.
Dendrogram of 77 progenies derived from four biparental crosses of African yam bean based on Euclidean genetic distance revealed a cluster of true F1 hybrids and another for false F1 hybrids.
Figure 2.
Dendrogram of 77 progenies derived from four biparental crosses of African yam bean based on Euclidean genetic distance revealed a cluster of true F1 hybrids and another for false F1 hybrids.
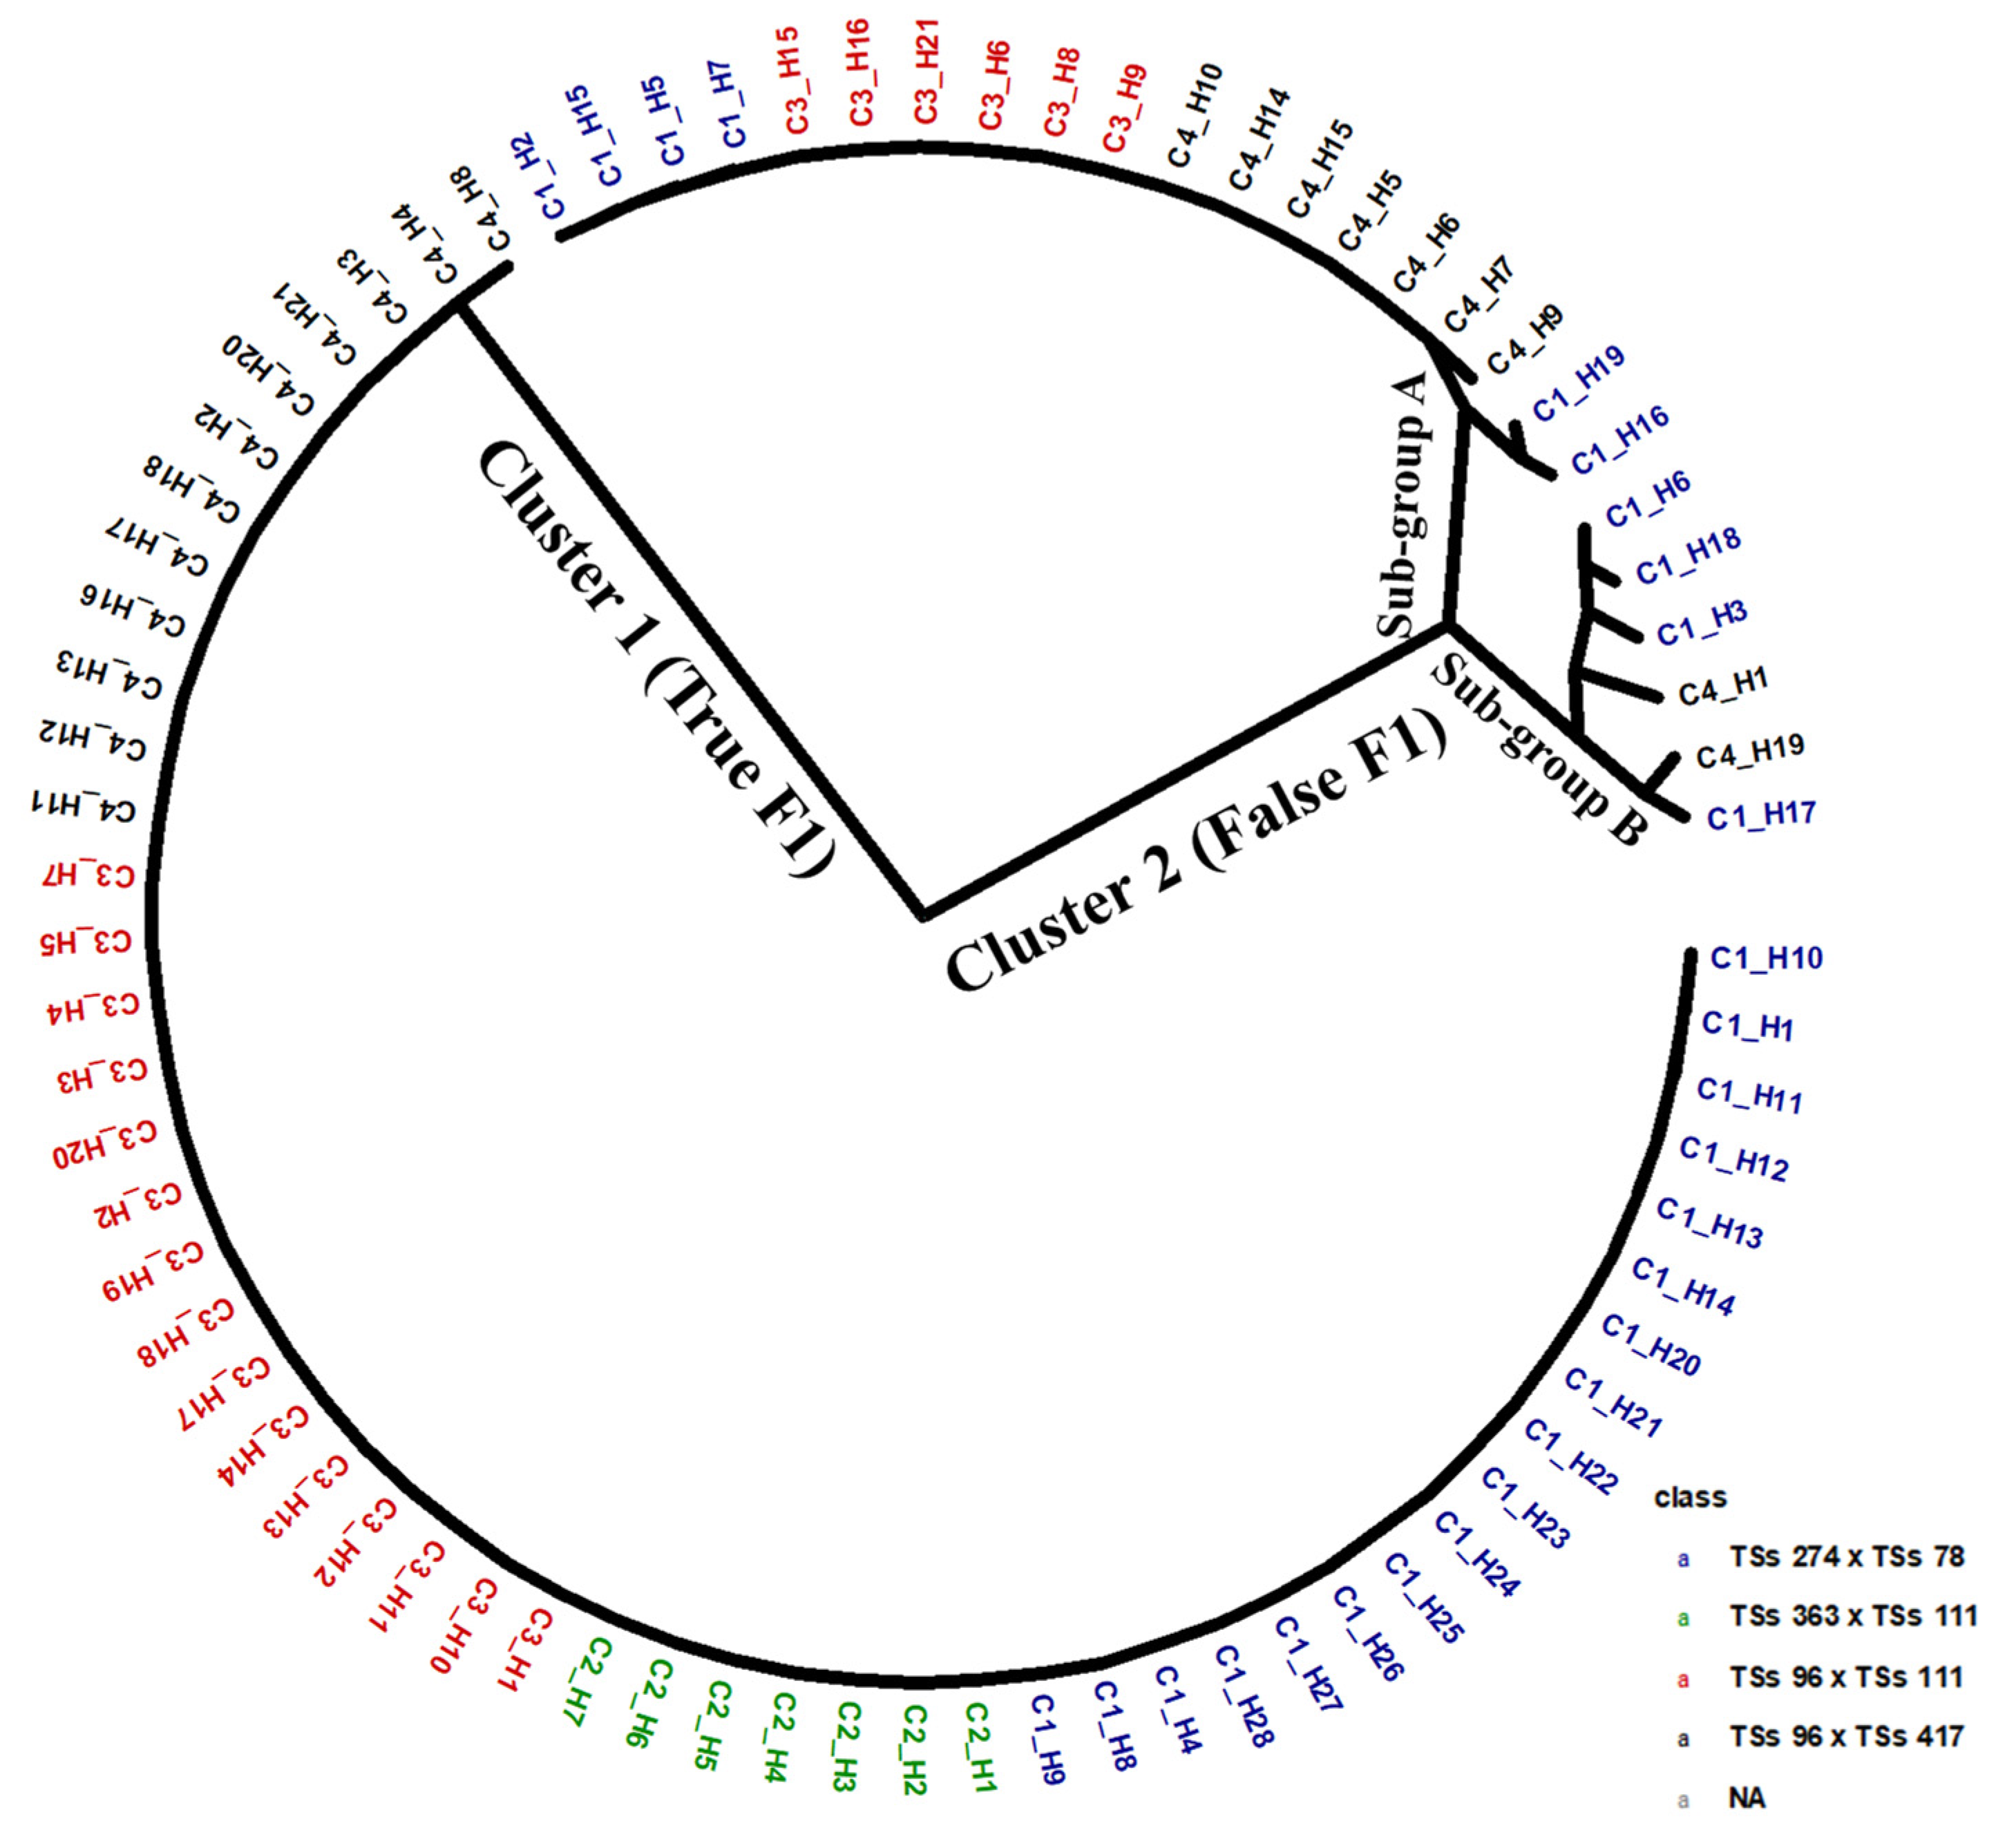
Figure 3.
Dendrogram of the six parental lines based on Euclidean genetic distance derived from 10 SSR markers revealed three clusters with cluster one having four parents while clusters two and three have one parent each.
Figure 3.
Dendrogram of the six parental lines based on Euclidean genetic distance derived from 10 SSR markers revealed three clusters with cluster one having four parents while clusters two and three have one parent each.
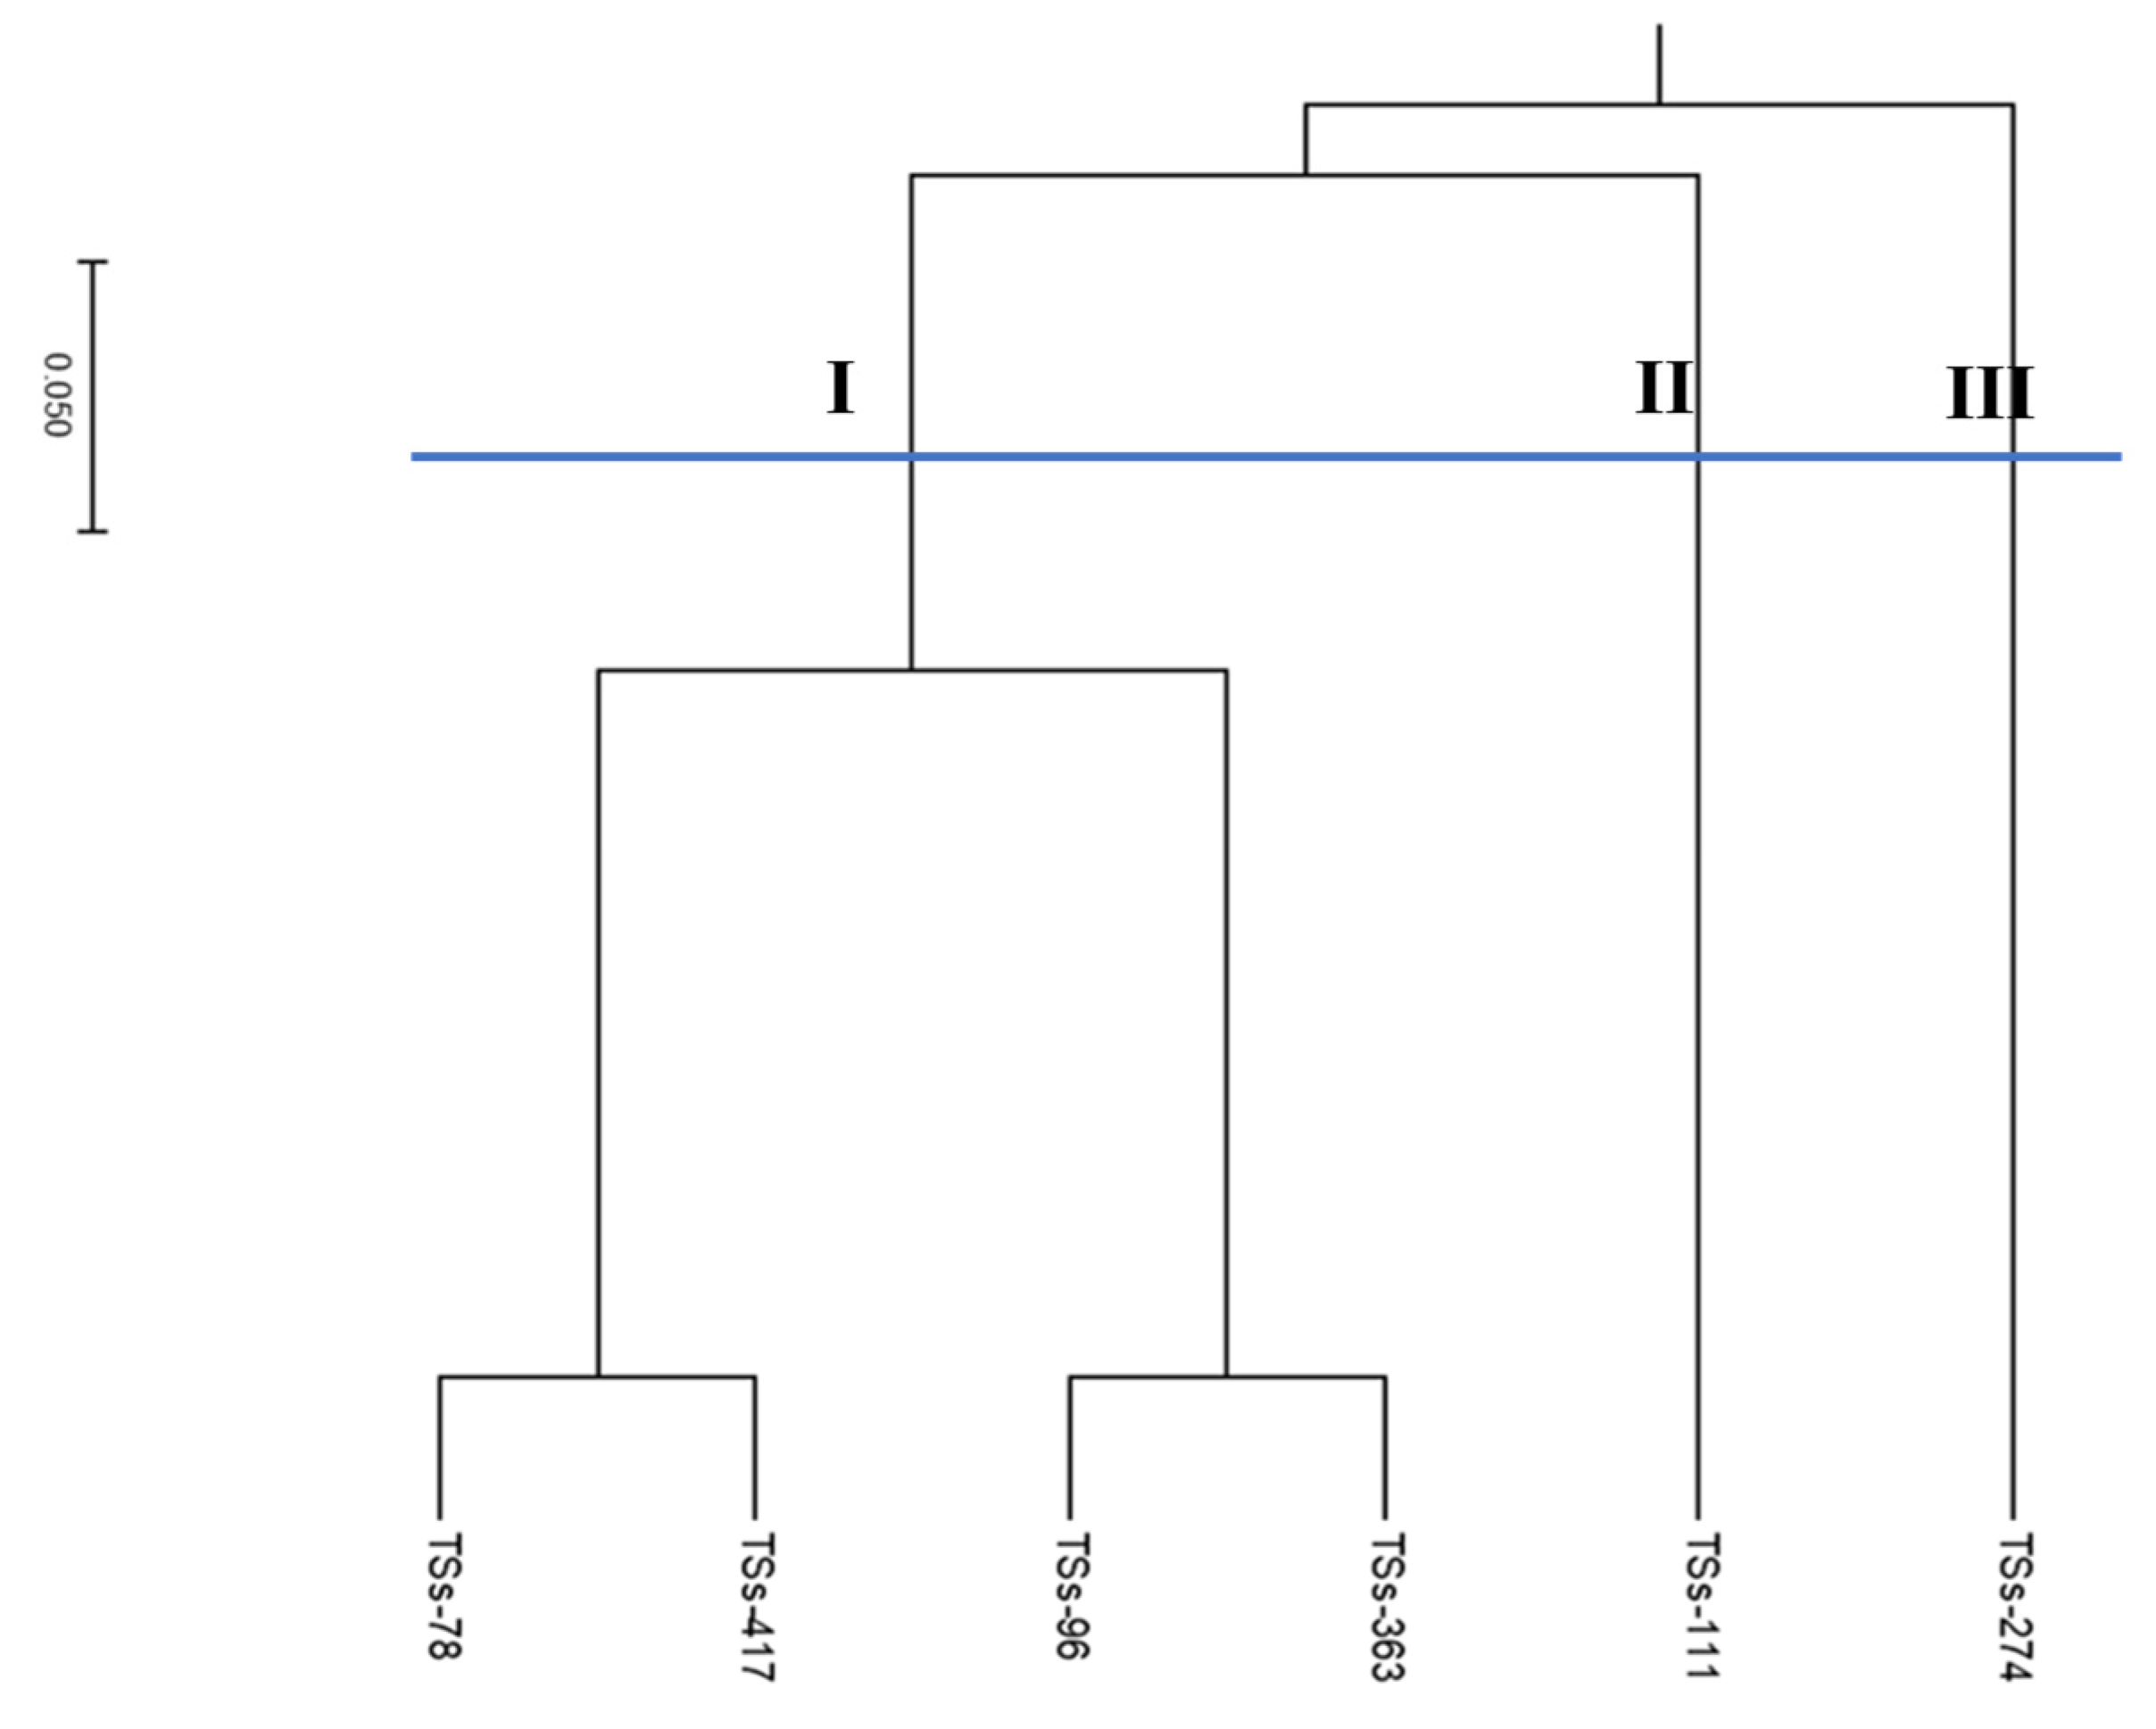

Table 1.
Accession numbers, sources, and qualitative morphological characters of the studied six parental lines of African yam bean (S. stenocarpa).
Table 1.
Accession numbers, sources, and qualitative morphological characters of the studied six parental lines of African yam bean (S. stenocarpa).
| S/N | Accession No | Source | GT | Trait | FC | SC | SS | PD | SB | ST | PP | BP | SP |
|---|---|---|---|---|---|---|---|---|---|---|---|---|---|
| 1 | TSs-417 | Unknown | Male | Tolerant | Purplish-Pink | Reddish-Brown | Oval | Shattering | Shiny | Smooth | Present | Absent | Red |
| 2 | TSs-111 | Nigeria | Male | Tolerant | Pale Violet | Dark-Brown | Oval | Non- Shattering | Shiny | Smooth | Absent | Absent | Green |
| 3 | TSs-78 | Nigeria | Male | Tolerant | Purplish-Pink | Brown/ Dark Brown | Oval | Non- Shattering | Medium | Rough | Present | Absent | Red |
| 4 | TSs-363 | Nigeria | Female | Susceptible | Pale Violet | Reddish/Light Brown | Oblong | Non- Shattering | Shiny | Rough | Absent | Absent | Green |
| 5 | TSs-274 | Nigeria | Female | Susceptible | Purplish-pink | Dark- Brown | Round | Shattering | Shiny | Smooth | Present | Present | Red |
| 6 | TSs-96 | Nigeria | Female | Susceptible | Violet-white | Brown/ Dark brown | Rhomboid | Shattering | Shiny | Smooth | Present | Present | Red |
GT= Gamete type, FC= Flower Colour, SC= Seed Colour, SS= Seed Shape, PD= Pod Dehiscence, SB=Seed Brilliance, ST= Seed Texture, PP= Pod pigmentation, BP= Branch pigmentation, SP= Stem pigmentation.
Table 2.
Summary of SSR alleles for identification of true-to-type in seventy-seven progenies from four sets of bi-parental crosses of African yam bean.
Table 2.
Summary of SSR alleles for identification of true-to-type in seventy-seven progenies from four sets of bi-parental crosses of African yam bean.
| Hybrid crosses | True-to-type | Total progeny |
|---|---|---|
| TSs-274 x TSs-78 | 18 | 28 |
| TSs-363 x TSs-111 | 7 | 7 |
| TSs-96 xTSs-111 | 15 | 21 |
| TSs-96 x TSs-417 | 12 | 21 |
Table 3.
The genetic diversity estimates for six parents and seventy-seven progenies from four sets of bi-parental African Yam bean crosses.
Table 3.
The genetic diversity estimates for six parents and seventy-seven progenies from four sets of bi-parental African Yam bean crosses.
| Marker | MAF | Allele No | He | Ho | PIC |
|---|---|---|---|---|---|
| SSR-6701 | 0.687 | 2 | 0.430 | 0.333 | 0.338 |
| SSR-6623 | 0.675 | 2 | 0.439 | 0.453 | 0.343 |
| SSR-6466 | 0.639 | 4 | 0.500 | 0.643 | 0.424 |
| SSR-6577 | 0.699 | 2 | 0.421 | 0.321 | 0.332 |
| SSR-6924 | 0.687 | 2 | 0.430 | 0.453 | 0.338 |
| SSR-6982 | 0.675 | 2 | 0.439 | 0.566 | 0.343 |
| SSR-6294 | 0.675 | 2 | 0.439 | 0.423 | 0.343 |
| SSR-6225 | 0.675 | 2 | 0.439 | 0.246 | 0.343 |
| SSR-6171 | 0.639 | 4 | 0.500 | 0.643 | 0.424 |
| SSR-6730 | 0.687 | 2 | 0.430 | 0.356 | 0.338 |
| Mean | 0.673 | 2.4 | 0.447 | 0.4437 | 0.356 |
MAF: minor allele frequency; He: expected heterozygosity/gene diversity; Ho: observed heterozygosity; PIC: polymorphic information content.
Table 4.
Analysis of Molecular Variance (AMOVA) of the parental lines involved in the development of the biparental population as assessed through SSR markers.
Table 4.
Analysis of Molecular Variance (AMOVA) of the parental lines involved in the development of the biparental population as assessed through SSR markers.
| Source | DF | SS | MS | Est. Var. | % | Fst | P |
|---|---|---|---|---|---|---|---|
| Among Populations | 2 | 13.000 | 6.500 | 1.333 | 57% | 0.571 | 0.009 |
| Among Individual | 3 | 3.500 | 1.167 | 0.167 | 7% | ||
| Within Individual | 6 | 5.000 | 0.833 | 0.833 | 36% | ||
| Total | 11 | 21.500 | 2.333 | 100% |
DF: degree of freedom; SS: sum of squares; MS: mean squares; Est. Var: estimated variance; %: percentage variance; Fst: pairwise differentiation; P: significance level .
Disclaimer/Publisher’s Note: The statements, opinions and data contained in all publications are solely those of the individual author(s) and contributor(s) and not of MDPI and/or the editor(s). MDPI and/or the editor(s) disclaim responsibility for any injury to people or property resulting from any ideas, methods, instructions or products referred to in the content. |
© 2024 by the authors. Licensee MDPI, Basel, Switzerland. This article is an open access article distributed under the terms and conditions of the Creative Commons Attribution (CC BY) license (http://creativecommons.org/licenses/by/4.0/).
Copyright: This open access article is published under a Creative Commons CC BY 4.0 license, which permit the free download, distribution, and reuse, provided that the author and preprint are cited in any reuse.


