Submitted:
06 August 2024
Posted:
07 August 2024
You are already at the latest version
Abstract
Polarizable continuum methods (PCM) have been widely employed for simulating solvent effects, in spite of the fact that they either ignore specific interactions in solution or only partially reproduce non-specific contributions. Examples of three solvatochromic dyes with a negative, a positive and a reverse behavior illustrate the achievements and shortcomings of PCM calculations, and the causes for their variable success. As shown with a theoretical model that rationalizes and predicts the solvatochromism of phenolate merocyanines based on structural parameters, PCM shortcomings are to be held responsible for their eventual failure in reproducing experimental data.
Keywords:
merocyanines
; types of solvatochromism
; solvent effects
; PCM calculations
; Fukui electrophilic function
1. Introduction
Polarizable continuum models (PCM) constitute a rather crude, but nevertheless useful approach [1] to mimic the solvatochromic behavior of dyes in solution. As a simple and inexpensive approach, employing few parameters to characterize a solvent, they allow an overview of the solvatochromic response of a dye in different media, being frequently used to rationalize experimental observations [2,3,4,5]. Thus, they have been employed to validate theoretical models that tried to interpret and predict the solvatochromic behavior of phenolate betaines, classified as negative, positive or reverse [6,7,8,9]. A negative behavior is characterized by a hypsochromic shift of the dye’s solvatochromic band with the increased medium polarity, a positive behavior by a bathochromic shift, and a reverse or inverted solvatochromism by the change from a positive to a negative behavior at some polarity value [10].
Attempts to relate the experimentally observed solvatochromism of a family of dyes with particular structural features have utilized PCM calculations at various levels of theory. Phenolate betaines are a conspicuous example of such compounds, where a phenolate donor group is conjugated with aryl or heteroaryl electron-accepting fragments, giving rise to a positive, reverse or negative solvatochromic behavior [6]. In many instances, their experimental behavior has been qualitatively reproduced by theoretical calculations employing continuum models [4,9]. In other cases, however, PCM calculations have failed to reproduce experimental solvatochromic trends. This is often due to the inability of continuum models to mimic specific effects, such as hydrogen-bond interactions, responsible for the basicity (SB) and the acidity (SA) of a solvent [11,12]. By contrast, non-specific effects, such as the dipolarity (SdP) and the polarizability (SP) [13,14] of a solvent should be more adequately reproduced by PCM calculations. In fact, a recent publication has confirmed this expectation, showing that, irrespective of the employed level of calculations, solvatochromic trends are reproduced reasonably well with dyes that are the basis of polarizability and dipolarity scales [15] An important corollary of these observations is that a proper knowledge of the major effects that contribute to the solvatochromism of a given dye can a priori decide whether PCM calculations will be successful in the reproduction of its behavior. Compounds whose solvatochromic response is mainly determined by non-specific solvent effects should have their behavior adequately reproduced by PCM calculations. Specific effects do not invalidate PCM calculations unless they significantly oppose non-specific effects, in which case theoretical results can lead to completely erroneous predictions. This is the case of many reverse dyes, with opposite contributions of the medium polarizability/dipolarity and acidity/basicity to their solvatochromism.
In the present work we tested these predictions with three phenolate betaines, with a negative, a reverse and a positive behavior.
Figure 1.
Structures of merocyanine dyes exhibiting a negative (1) [16,17,18], reverse (2) [19] and positive (3) [20] solvatochromism.
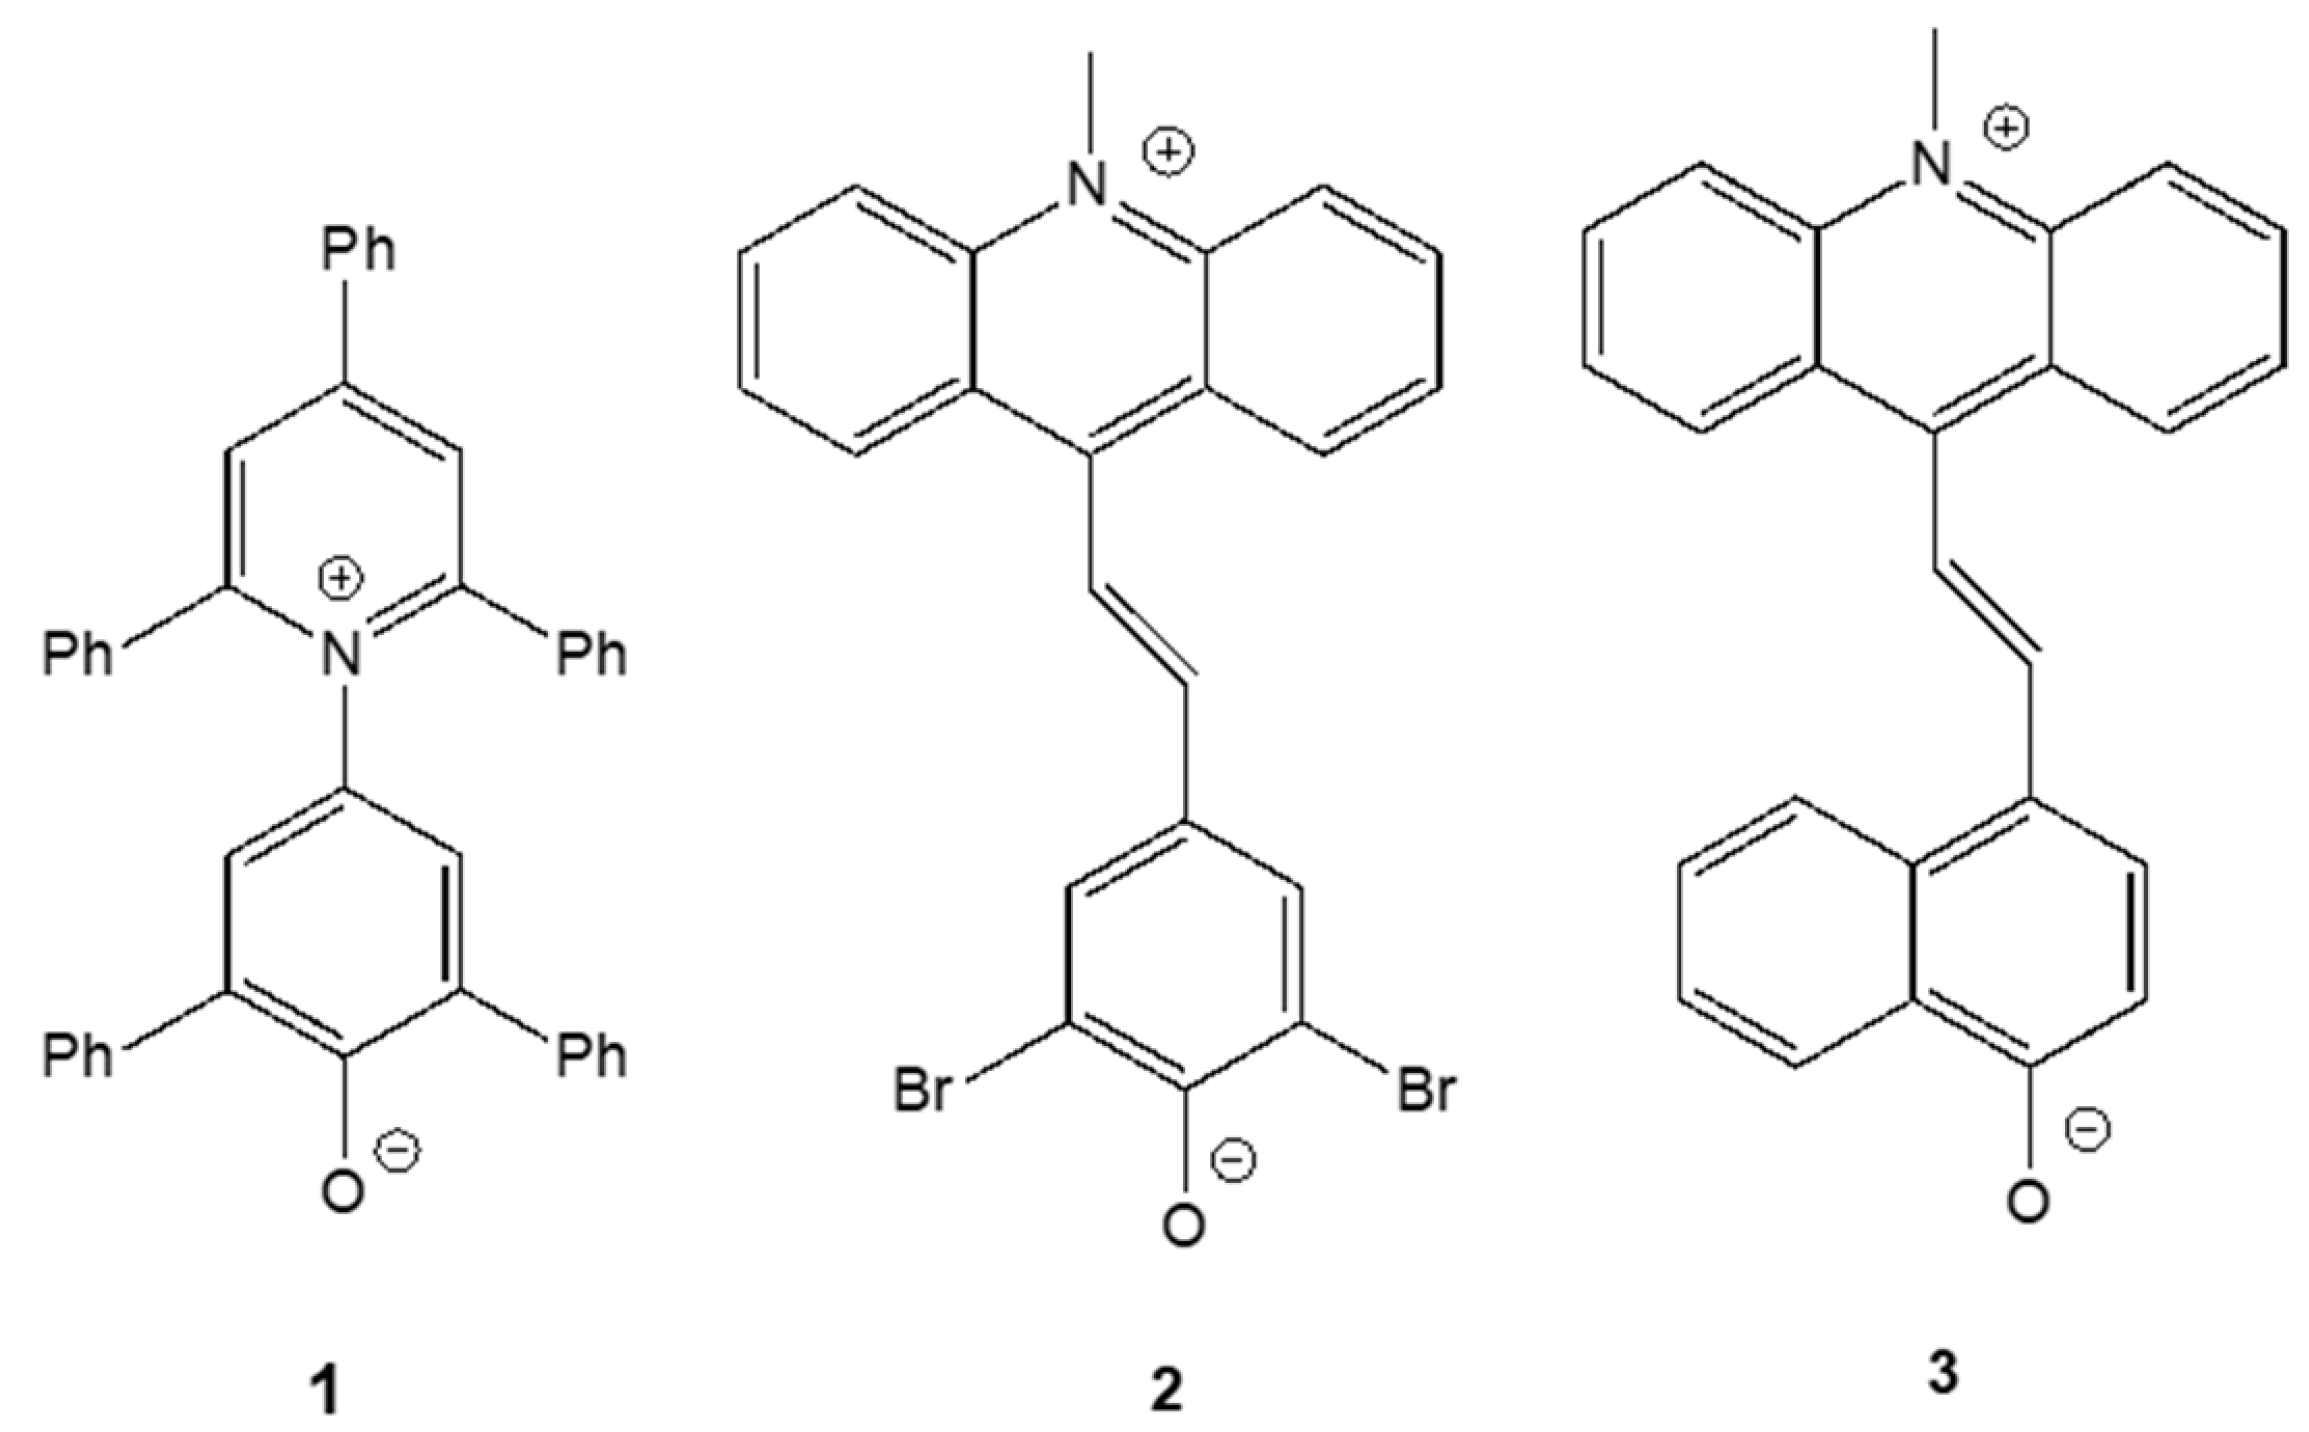
Compound 1, Reichardt’s betaine [16,17,18], has been the subject of a plethora of theoretical investigations, because of its various applications as an indicator and basis of the ET(30) polarity scale. It is a classic example of a dye that exhibits a negative solvatochromism. Compound 2 has been described by El Seoud et al. as a merocyanine that unquestionably exhibits a reverse behavior [19]. Finally, compound 3 is a classic example of another merocyanine showing positive solvatochromism [20].
Comparison of their experimental behavior with the theoretical solvatochromism resulting from PCM calculations illustrates the achievements and shortcomings of the continuum approach. As it still constitutes an inexpensive alternative for the simulation of solvent effects, employed for testing theoretical models and predictions of solvatochromic behavior in various solvents, it must be held responsible for their occasional failure to reproduce experimental data. This is shown in the second part of this communication, where the theoretical predictions based on structural considerations of a family of phenolate betaines are compared with the results obtained with PCM calculations for compounds 1-3.
2. Results
2.1. PCM Calculations of Betaines 1-3
After having their structures optimized in the gas-phase, transition energies of betaines 1-3 were calculated in various solvents, employing the polarizable continuum model to mimic the solvent, and a TD-DFT single-point calculation, at the same level of theory. The obtained theoretical S0→S1 transition energies ET, in kcal.mol-1, are listed in Table 1.
An initial evaluation of the standard PCM vs. the SMD option was carried out with Reichardt’s dye 1. Plots of the two methods against the corresponding ET(30) values are reproduced in Figure 2.
Figure 2.
Comparison of the plots of the calculated transition energies of dye 1 (ET(calc.)) against the solvent ET(30) values, employing the standard PCM and the SMD option.
Figure 2.
Comparison of the plots of the calculated transition energies of dye 1 (ET(calc.)) against the solvent ET(30) values, employing the standard PCM and the SMD option.
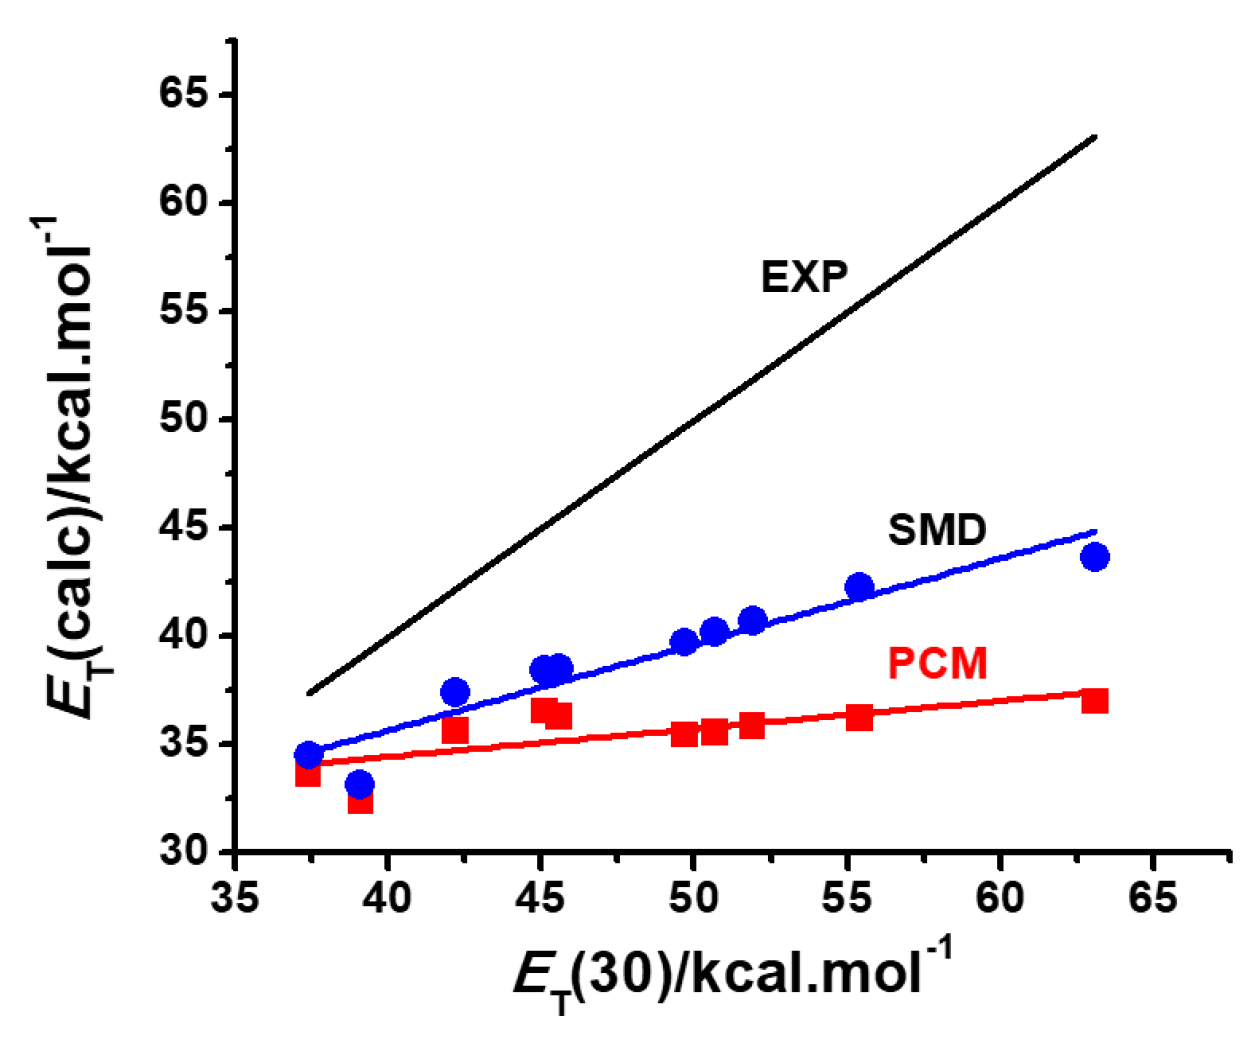
Both methods reproduced qualitatively the negative solvatochromism of Reichardt’s betaine, although the SMD option proved superior to the standard PCM, as being more sensitive to its solvatochromic behavior in protic solvents, where non-specific hydrogen-bond interactions play a major role. Although the SMD option does not take into account any specific solvent effects, being a variation of a continuum model, the corrections introduced in the values of the radii of some atoms lead to a better agreement with experimental results in protic solvents, where HBD contributions are important. For this reason, we limited our calculations with merocyanines 2 and 3 to TD-DFT methods employing the SMD option.
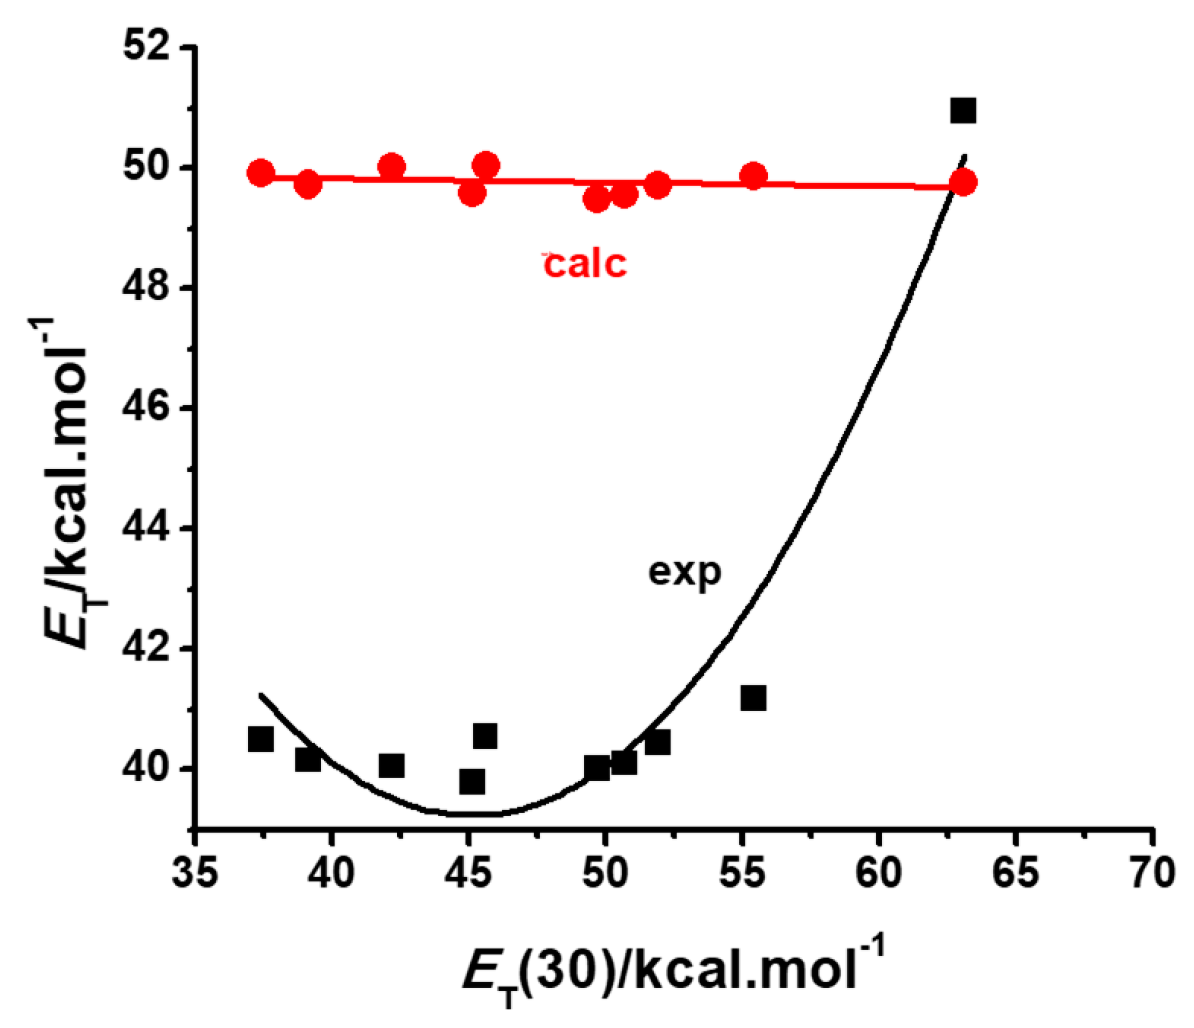
In contrast with the reasonable qualitative reproduction of the negative solvatochromism of Reichardt’s betaine by continuum models, Figure 3 shows that PCM utterly fails to reproduce the inverted behavior of dye 2, predicting a practically constant spectral response of the dye solutions to the medium polarity.
Figure 3.
Comparison of the experimental [19] and calculated solvatochromic plots of dye 2 in various solvents.
Figure 3.
Comparison of the experimental [19] and calculated solvatochromic plots of dye 2 in various solvents.
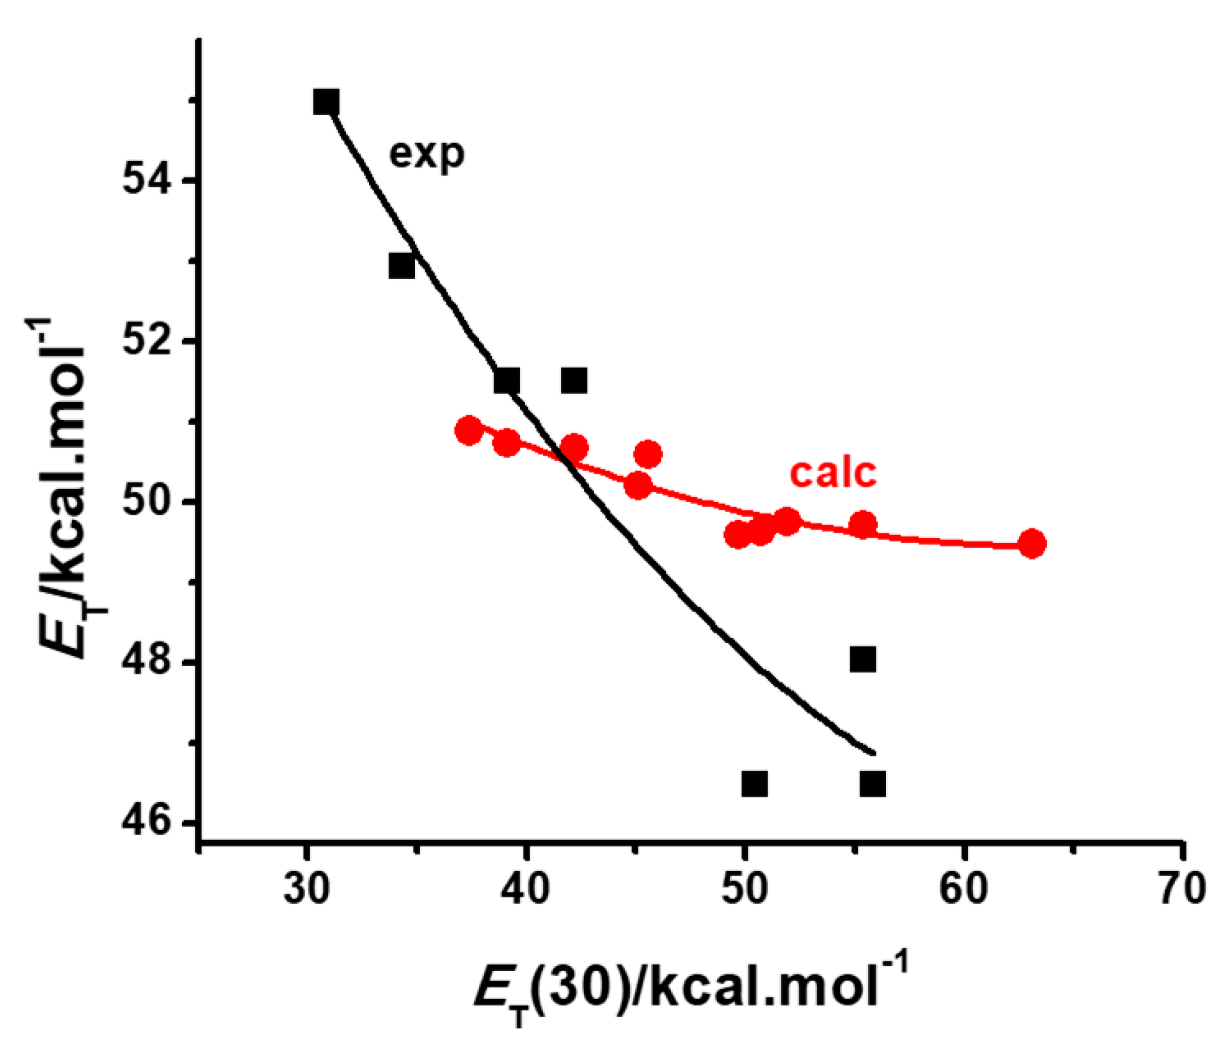
A better performance is shown by the continuum model, when trying to reproduce the positive solvatochromic behavior of dye 3, as can be seen in Figure 4. Although far from showing the same sensitivity to the medium polarity exhibited by the dye, the model correctly predicts a positive behavior for this solvatochromic betaine.
Figure 4.
Comparison of the experimental [20] and calculated solvatochromic plots of dye 3 in various solvents.
Figure 4.
Comparison of the experimental [20] and calculated solvatochromic plots of dye 3 in various solvents.
The above results can be rationalized by a comparison of the sensitivity of the dyes to specific and non-specific solvent effects. Linear regressions of the experimental solvatochromic transition energies for each dye, as a function of the non-specific medium polarizability (SP) and dipolarity (SdP), and specific acidity (SA) and basicity (SB), yielded equations (1)-(3) for the corresponding betaines. For the sake of comparison, data from the same solvents were employed in the regression analyses of compounds 1 and 2 [17,19]. Equation (3) was obtained from the reported values [20].
ET(1)= 31.13 + 10.39 SdP + 21.37 SA + 3.98 SB
N= 27, r2 = 0.96
ET(2)= 47.74 – 6.53 SdP + 6.23 SA – 5.57 SB
N= 27, r2 = 0.60
ET(3)= 56.51 - 6.94 SP – 1.74 SdP – 6.45 SA – 4.82 SB
N= 7, r2 = 0.79
The negative solvatochromism of Reichardt’s dye 1 is known to be determined by the medium dipolarity (SdP) and acidity (SA). Although the contribution of this latter, specific solvent effect is more important than the former, both enhance the solvatochromic transition energy of the dye, leading to a negative behavior as polarity increases. The polarizable continuum model ignores specific contributions, being capable of reproducing to some extent the medium dipolarity only [15]. As a result, it still achieves a reasonable qualitative reproduction of the observed solvatochromism, as shown in Figure 2.
The results of the multilinear regression analysis of compound 3 (equation 3) show that all solvent effects reduce the solvatochromic transition energy of the dye, leading to a positive behavior with the increased medium polarity. Although the continuum model ignores the specific effects, like medium acidity and basicity, their contributions do not mask the non-specific effects of polarizability (SP) and dipolarity (SdP), which are takeninto account, albeit in a smaller extent, by the PCM calculations [15]. As a result, also here, the continuum model achieves a reasonable qualitative reproduction of the observed solvatochromism, though much less sensitive to the increased polarity of the medium, as shown in Figure 4.
The total failure of the PCM calculations to reproduce the inverted solvatochromism of dye 2 (Figure 3) can be readily understood by inspection of equation (2). The specific positive contribution by the medium acidity counterbalances the negative effect of the medium dipolarity, but this is not registered by the continuum model. As a result, PCM calculations predict a small decrease of the solvatochromic transition energy, even in the region where the solvent acidity becomes a major contributor to the observed increase of the ET values.
2.2. PCM and Model Validations
Several attempts are found in the literature to rationalize and predict the solvatochromic behavior of dyes based on a priori considerations and theoretical calculations [23,24]. Among them, a general model for the solvatochromism of merocyanines postulates a gradual change from a positive to an inverted and to a negative behavior as donor and acceptor fragments or the solvating medium are changed [8].
Such changes are reflected in theoretical descriptors derived from the density-functional theory, such as the fragment hardnesses [22] or electrophilicities [6,7]. Thus, it should be possible, by calculations of a family of related dyes in the gas phase, to arrive at predictions of their solvatochromic behavior in solution.
For a solvatochromic dye with a general structure A-B, its solvent-dependent band in a solvent arises from an internal charge-transfer from A to B. The correct determination of the electrophilicities of its fragments A and B defines the amount and direction of the electronic flow in that solvent. As an example, the structures of ten different solvatochromic merocyanines, exhibiting a positive, a reverse, or a negative behavior, are reproduced in Figure 5. All structures have in common a phenolate group conjugated with a heterocyclic moiety.
This section may be divided by subheadings. It should provide a concise and precise description of the experimental results, their interpretation, as well as the experimental conclusions that can be drawn.
Figure 5.
Examples of solvatochromic phenolate betaines exhibiting a positive [25,26,27], reverse [28,29] or negative [30,31] behavior.
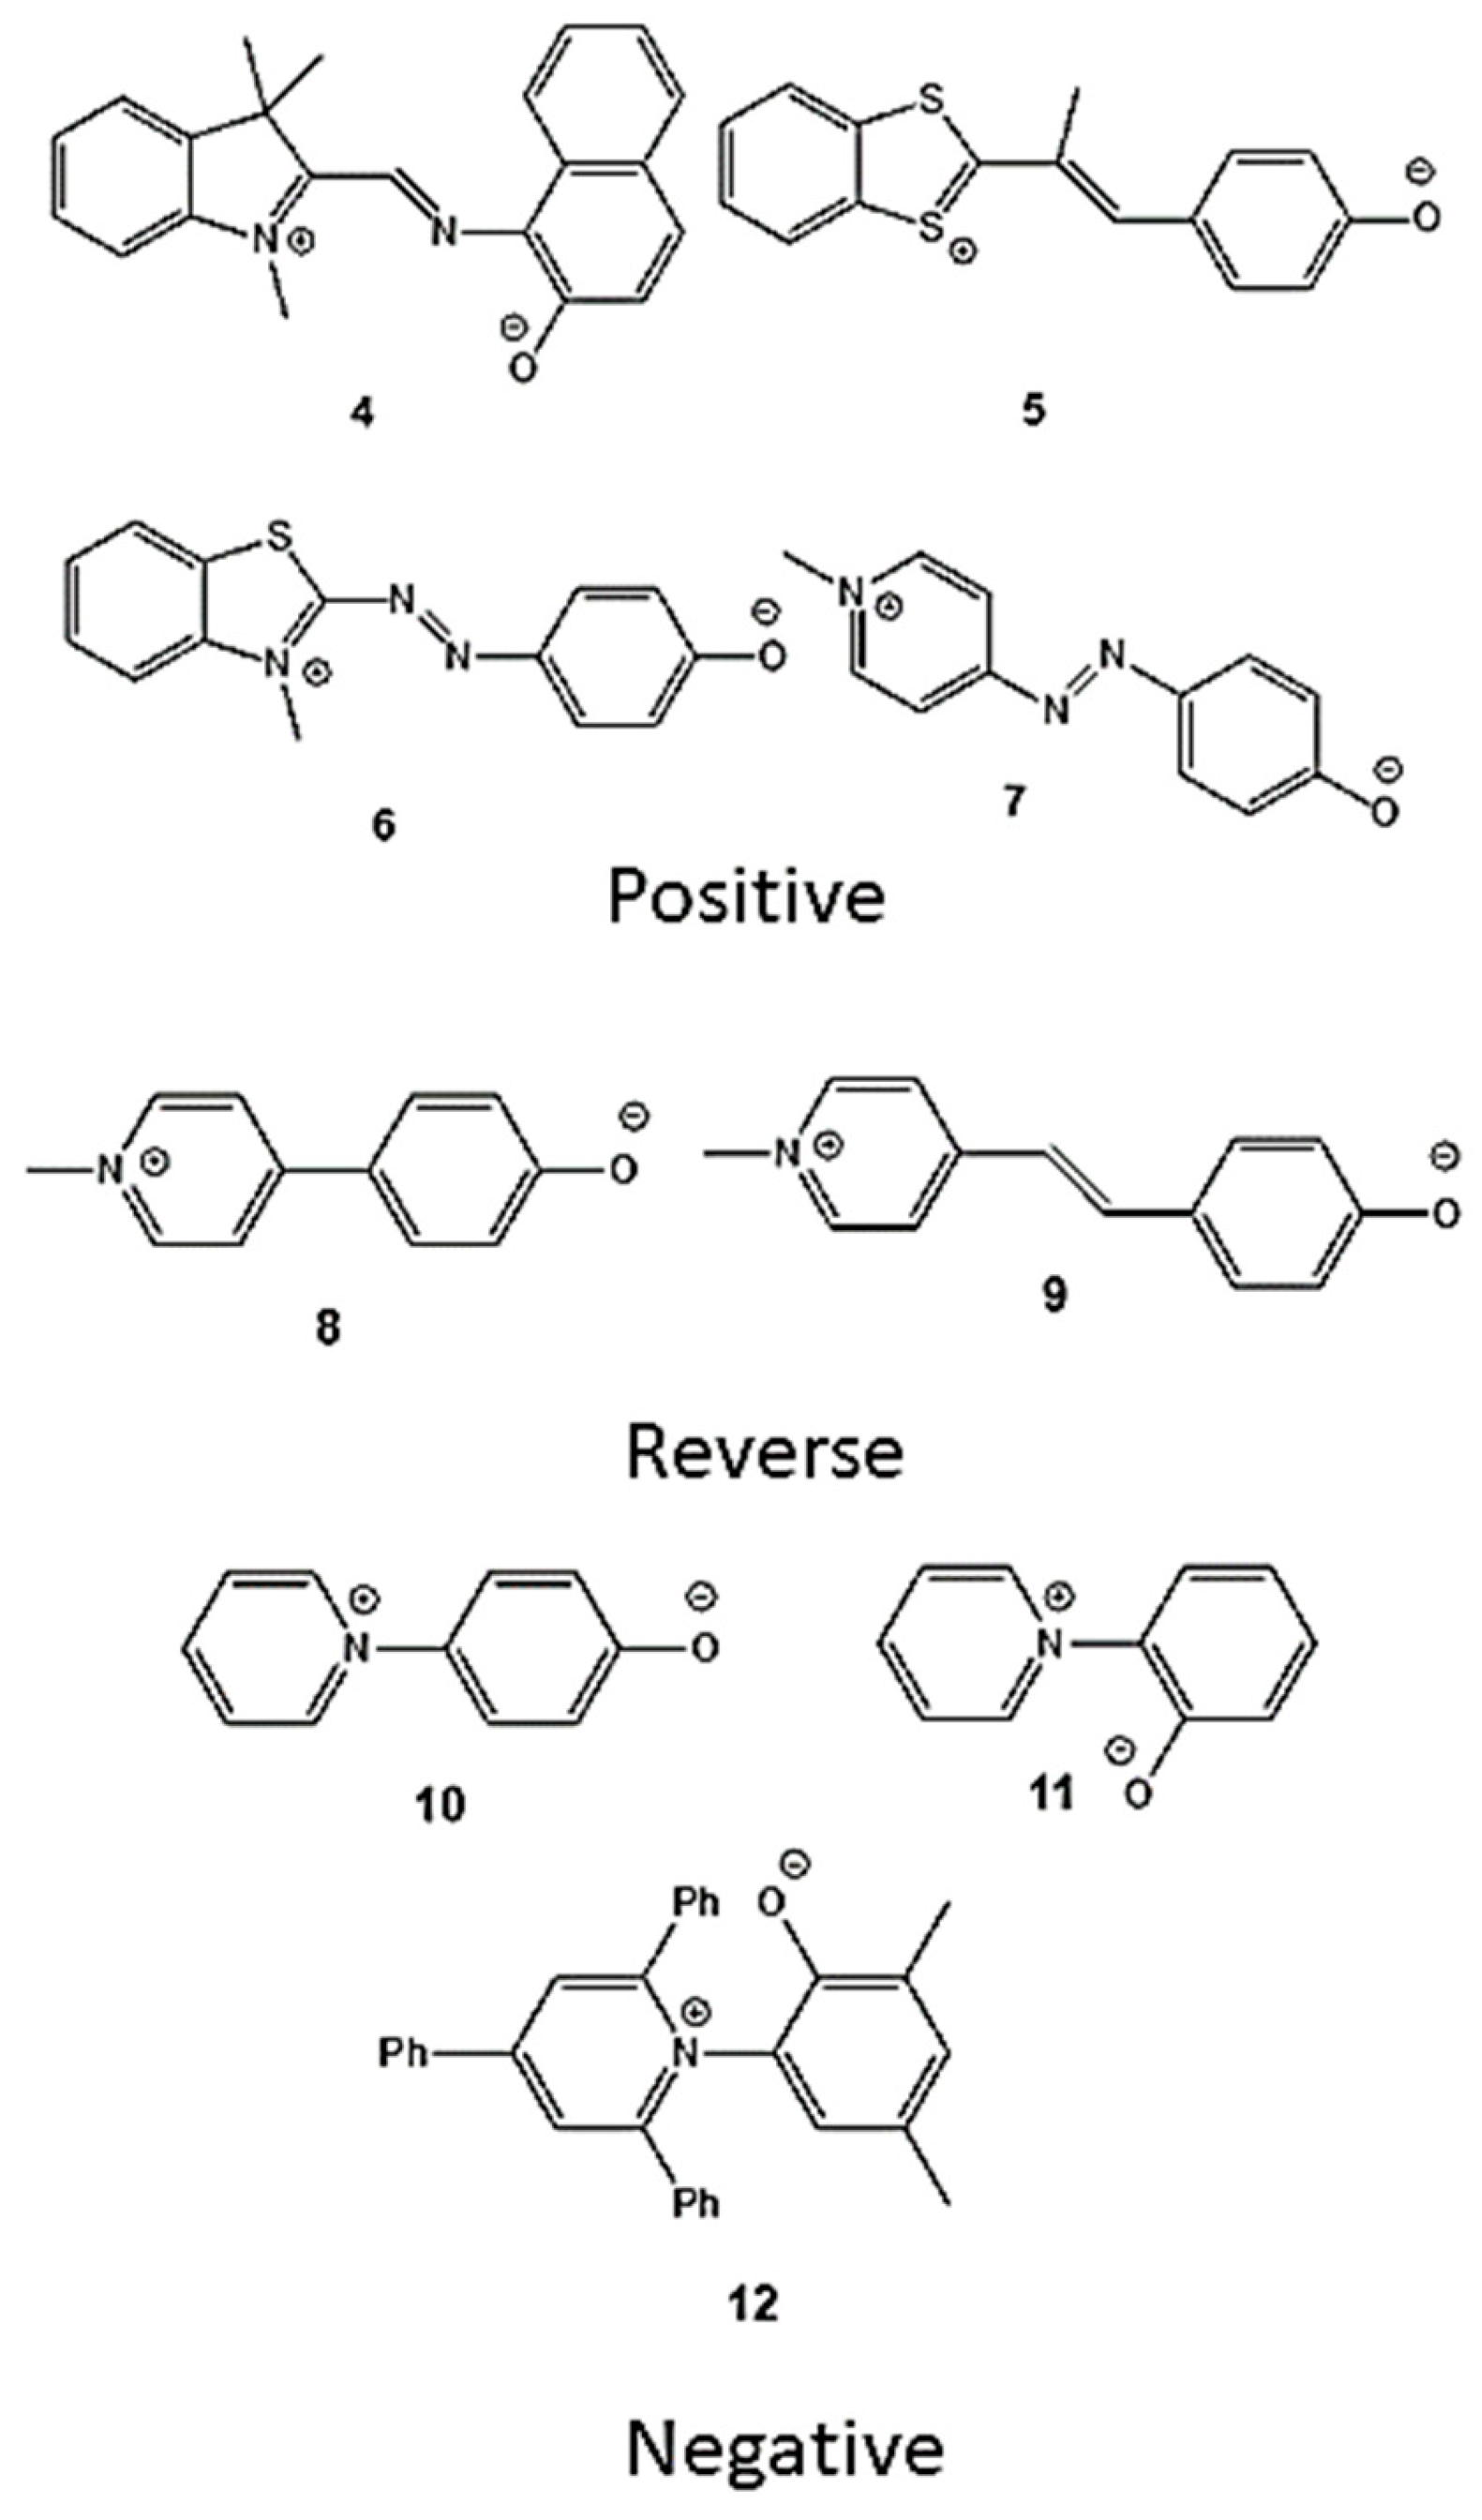
The electrophilicities of the two conjugated fragments are proportional to the group Fukui electrophilic function for the molecular fragment (fG+) obtained by summation of the condensed-to-atom Fukui functions fk+ of all atoms belonging to group G [6,7].
Values for these group Fukui functions are given in Table 2 for dyes 1-12. The corresponding differences ΔfG+ = fG+ (heterocyclic) - fG+ (phenolate) are also given. They are an indication of the nature of the expected solvatochromism. Large positive values correspond to a truly negative solvatochromic behavior, where transition energies increase with the solvent polarity, measured with Reichardt’s ET(30) scale. Large negative values correspond to a truly positive solvatochromic behavior, where the opposite dependence of transition energies on solvent polarities is observed. Finally, small values, either negative or positive, define an inverted behavior.
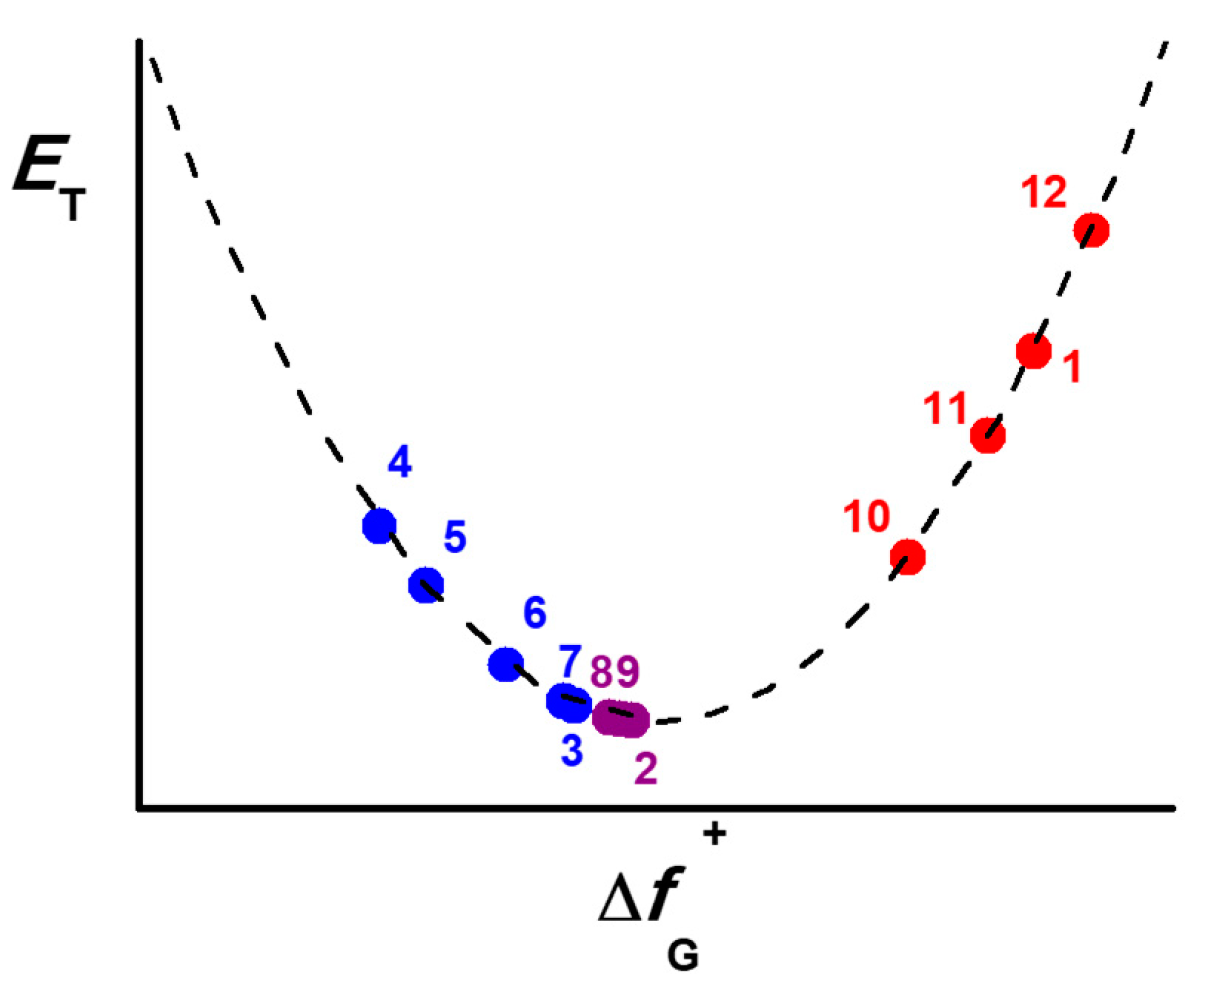
Figure 6 is a schematic representation of this general model [8] where the predicted behavior of a dye is situated along a coordinate expressing its difference in group Fukui functions ΔfG+. Notice, that, in agreement with experiment, positively solvatochromic dyes have a relatively large negative ΔfG+ value. As this value approaches zero, so does the dye assume a borderline positive, and then a reverse behavior, which evolves to a borderline negative, and then a truly negative behavior, as the ΔfG+ value becomes larger and positive. Notice also that dyes 1, 2 and 3 are also theoretically predicted to be examples of a truly negative, reverse and borderline positive behavior, in agreement with the experimental plots of Figures 2–4.
Figure 6.
Schematic representation of the solvatochromic behavior of phenolate betaines 1-12 as a function of the difference ΔfG+ between the group Fukui electrophilic functions of their charge-transferring fragments A-B. Dyes exhibiting negative solvatochromism (1,10-12) are shown in red, those exhibiting a positive behavior (3-7) are depicted in blue, those with an inverted behavior (2,8,9) in purple.
Such predictions are made with gas-phase calculations only. Their confirmation would require correct estimates of the group Fukui electrophilic functions in solution. However, if this is done with a PCM calculation, the results, as shown in Figures 2–4, are only qualitatively reasonable, in the case of dyes 1 or 3, or obviously false, in the case of the inverted behavior of 2. Such a failure is not due to the theoretical postulates of the model, but to the poor simulation of the solvent effects on the dye electrophilicities, resulting from the PCM calculations.
3. Materials and Methods
Calculations employed the Gaussian 16 package [32]. All molecules had their structures initially optimized in the gas-phase with the DFT (Density Functional Theory) method using B3LYP functional and the 6-311G(d) basis set. Their structures were then optimized in solution with the aid of the PCM or SMD (Solvation Model Density) option, employing the same method of calculation. Their solvatochromic transition energies were then obtained by single-point TD-DFT calculations employing the PCM or SMD over the optimized structures with their respective continuum model. Molecules 1, 2 and 3 were optimized using B3LYP/6-31G(d) level in the gas phase previous to the calculations of the Fukui electrophilic functions to keep the same theory level than the reported solvatochromic molecules [6,7]. The Fukui electrophilic functions were calculated by the method of Yang and Mortier [21] as the difference between the charges of an atom in the molecule, with N and N+1 electrons. Summation of the function values thus obtained over all atoms of a group yielded the corresponding Fukui function fG+ of group G [6,7].
4. Conclusions
Several attempts to interpret or predict the solvatochromic behavior of phenolate betaines by structural considerations and theoretical calculations are found in the literature. The positive, negative or inverted behavior of these dyes in solution has been related with theoretical descriptors, such as the hardness [22], or the electrophilicity [6,7,24]
of the donor and acceptor fragments, or the zwitterionic character of their ground state, expressed in terms of their bond-length (BLA) or bond-order alternation (BOA) [9,33]. In spite of being apparently sound, these theoretical approaches have relied on continuum models when simulating the dye behavior in solution, with the result that, in many instances, they fail to reproduce their experimental behavior.
Continuum models are not capable of reproducing specific solvent effects, derived, for example, from hydrogen-bond interactions in solution. They are more effective in reproducing non-specific solvent effects, like the medium polarizability and dipolarity, although the reproduced trends describe a diminished sensitivity to the medium, when compared with experimental data from actual polarizability and dipolarity sensors [15]. Such limitations must be taken into account, when trying to reproduce the solvatochromism of new dyes with theoretical continuum models.
In the present communication, the limitations of the PCM model in the description and prediction of the solvatochromism of phenolate betaines have been illustrated by comparing three dyes that exhibit a negative, a positive and an inverted behavior. Though ignoring specific solvent effects, continuum models provide qualitatively reasonable results when contributions from those effects are not significant, or simply add to the contributions from non-specific (polarizability and dipolarity) solvent effects. However, the model utterly fails to reproduce or predict the behavior of phenolate betaines for which specific solvent contributions are significant and oppose those derived from non-specific effects.
In spite of the limitations of continuum models, they still represent a valid option in studies of solvent-dependent spectra in different media. This is due to their simplicity and the need of a few parameters to characterize a solvating environment. However crude and fraught with approximations, polarizable continuum models are still useful for the theoretical design and description of the behavior of new solvatochromic dyes.
Author Contributions
Conceptualization, A.A. and M.C.R.; Methodology, A.A., M.C.R and S.P.; Formal analysis, A.A. and M.C.R.; Investigation, A.A., M.C.R. and S.P.; writing—review and editing, A.A. and M.C.R.; visualization, A.A.; supervision, A.A., M.C.R.; funding acquisition, A.A. All authors have read and agreed to the published version of the manuscript.
Funding
The APC was funded by by Vicerrectoría de Investigación de Universidad de LasAméricas and by the Fondo Nacional de Desarrollo Científico y Tecnológico FONDECYT, project number 11220544.
Institutional Review Board Statement
Not applicable.
Informed Consent Statement
Not applicable.
Data Availability Statement
Not applicable.
Acknowledgments
This research was supported by the Fondo Nacional de Desarrollo Científico y Tecnológico FONDECYT, project numbers 11220544 (A.A.) and 1230004 (M.C.R.). This research was partially supported by the supercomputing infrastructure of the NLHPC (ECM-02). The support of the high-performance computing system of PIDi-UTEM (SCC-PIDi-UTEM CONICYT-FONDEQUIPEQM180180) is greatly appreciated.
Conflicts of Interest
The authors declare no conflicts of interest.
References
- Herbert, J. M. Dielectric continuum methods for quantum chemistry. WIREs Computational Molecular Science 2021, 11, 1–87. [Google Scholar] [CrossRef]
- Caricato, M.; Mennucci, B.; Tomasi, J. Solvent polarity scales revisited: a ZINDO-PCM study of the solvatochromism of betaine-30. Molecular Physics 2006, 104, 875. [Google Scholar] [CrossRef]
- Eilmes, A. Solvatochromic probe in molecular solvents: implicit versus explicit solvent model. Theoretical Chemistry Accounts 2014, 1538. [Google Scholar] [CrossRef]
- Rezende, M. C.; Domínguez, M. The solvatochromism of phenolate betaines: comparing different cavities of a polarized continuum model. Journal of Molecular Modeling 2015, 21, 212. [Google Scholar] [CrossRef] [PubMed]
- Baryshnikov, G. V.; Bondarchuk, S. V.; Minaeva, V. A.; Ågren, H.; Minaev, B. F. Solvatochromic effect in absorption and emission spectra of star-shaped bipolar derivatives of 1,3,5-triazine and carbazole. A time-dependent density functional study. Journal of Molecular Modeling 2017, 23, 55–63. [Google Scholar] [CrossRef] [PubMed]
- Rezende, M. C.; Dominguez, M.; Aracena, A.; Millán, D. Solvatochromism and electrophilicity. Chemical Physics Letters 2011, 514, 267–273. [Google Scholar] [CrossRef]
- Rezende, M. C.; Aracena, A. Electrophilicity and solvatochromic reversal of pyridinium phenolate betaine dyes. Chemical Physics Letters 2012, 542, 147–152. [Google Scholar] [CrossRef]
- Rezende, M. C. A generalized reversal model for the solvatochromism of merocyanines. Journal of Physical Organic Chemistry 2016, 29, 460–467. [Google Scholar] [CrossRef]
- Aracena, A.; Domínguez, M. Computational Quantification of the Zwitterionic/Quinoid Ratio of Phenolate Dyes for Their Solvatochromic Prediction. Molecules 2022, 27, 9023. [Google Scholar] [CrossRef]
- Mera-Adasme, R.; Moraga, D.; Medina, R.; Domínguez, M. Mapping the solute–solvent interactions for the interpretation of the three types of solvatochromism exhibited by phenolate-based dyes. Journal of Molecular Liquids 2022, 359, 119302. [Google Scholar] [CrossRef]
- Catalán, J.; Díaz, C.; López, V.; Pérez, P.; de Paz, J.-L.G.; Rodriguez, J.G. A generalized solvent basicity scale: The solvatochromism of 5-nitroindoline and its homomorph 1-methyl-5-nitroindoline. Liebigs Ann. 1996, 11, 1785–1794. [Google Scholar] [CrossRef]
- Catalán, J.; Díaz, C. A generalized solvent acidity scale: The solvatochromism of o-tert-butylstilbazolium betaine dye and its homomorph o,o ′ -di-tert-butylstilbazolium betaine dye. Liebigs Ann. 1997, 9, 1941–1949. [Google Scholar] [CrossRef]
- Kamlet, M.J.; Abboud, J.L.; Taft, R.W. The solvatochromic comparison method. The π* scale of solvent polarities. J. Am. Chem. Soc 1977, 99, 6027–6038. [Google Scholar] [CrossRef]
- Catalán, J.; López, V.; Pérez, P.; Martín-Villamil, R.; Rodriguez, J.G. Progress towards a generalized solvent polarity scale: The solvatochromism of 2-(dimethylamino)-7-nitrofluorene and its homomorph 2-fluoro-7-nitrofluorene. Liebigs Ann. 1995, 2, 241–252. [Google Scholar] [CrossRef]
- Ormazábal-Toledo, R.; Rezende, M. C.; Vidal, M. The Simulation of Solvent Polarizabilities and Dipolarities with Polarizable Continuum Model. The Journal of Physical Chemistry B 2024, 128, 7208–7218. [Google Scholar] [CrossRef] [PubMed]
- Dimroth, K.; Reichardt, C.; Siepmann, T.; Bohlmann, F. Über Pyridinium-N-phenol-betaine und ihre Verwendung zur Charakterisierung der Polarität von Lösungsmitteln. Justus Liebigs Annalen Der Chemie 1963, 661, 1–37. [Google Scholar] [CrossRef]
- Reichardt, C. Solvatochromic Dyes as Solvent Polarity Indicators. Chem. Rev. 1994, 94, 2319–2358. [Google Scholar] [CrossRef]
- Machado, V.G.; Stock, R.I.; Reichardt, C. Pyridinium N-Phenolate Betaine Dyes. Chem. Rev. 2014, 114, 10429–10475. [Google Scholar] [CrossRef]
- Martins, C.T.; El Seoud, O.A. Thermo-Solvatochromism of Merocyanine Polarity Probes—What Are the Consequences of Increasing Probe Lipophilicity through Annelation? Eur. J. Org. Chem. 2008, 2008, 1165–1180. [Google Scholar] [CrossRef]
- Hünig, S.; Rosenthal, O. Farbe und Konstitution II: Phenolbetainfarbstoffe. Justus Liebigs Annalen Der Chemie 1955, 592, 161–179. [Google Scholar] [CrossRef]
- Yang, Weitao.; Mortier, W. J. The use of global and local molecular parameters for the analysis of the gas-phase basicity of amines. Journal of the American Chemical Society 1986, 108, 5708–5711. [CrossRef] [PubMed]
- Domínguez, M.; Rezende, M. C. Towards a unified view of the solvatochromism of phenolate betaine dyes. Journal of Physical Organic Chemistry 2009, 23, 156–170. [Google Scholar] [CrossRef]
- Pinheiro, J. M. F.; de Melo, C. P. Ab Initio Study of the Anomalous Solvatochromic Behavior of Large Betaines. The Journal of Physical Chemistry A 2011, 115, 7994–8002. [Google Scholar] [CrossRef]
- Rezende, M. C.; Aracena, A. A general framework for the solvatochromism of pyridinium phenolate betaine dyes. Chemical Physics Letters 2013, 558, 77–81. [Google Scholar] [CrossRef]
- Keum, S.-R.; Hur, M.-S.; Kazmaier, P. M.; Buncel, E. Thermo- and photochromic dyes: indolino-benzospiropyrans. Part 1. UV–VIS spectroscopic studies of 1,3,3-spiro(2H-1-benzopyran-2,2′-indolines) and the open-chain merocyanine forms; solvatochromism and medium effects on spiro ring formation. Canadian Journal of Chemistry 1991, 69, 1940–1947. [Google Scholar] [CrossRef]
- Le Beuze, A.; Samat, A.; Botrel, A.; Appriou, P.; Guglielmetti, R. Détermination expérimentale du moment dipolaire de mérocyanines hétérocycliques. Journal de Chimie Physique 1978, 75, 46–52. [Google Scholar] [CrossRef]
- Rajagopal, S.; Buncel, E. Synthesis and Electronic Spectral Characteristics of Some New Azo Merocyanine Dyes. Dyes Pigment 1991, 17, 303–321. [Google Scholar] [CrossRef]
- Diemer, V.; Chaumeil, H.; Defoin, A.; Jacques, P.; Carré, C. Synthesis of 4-[N-methyl-4-pyridinio]-phenolate (POMP) and negative solvatochromism of this model molecule in view of nonlinear optical applications. Tetrahedron Letters 2005, 46, 4737–4740. [Google Scholar] [CrossRef]
- Jacques, P. On the Relative Contributions of Nonspecific and Specific Interactions to the Unusual Solvatochromism of a Typical Merocyanine Dye. J. Phys. Chem. 1986, 90, 5535–5539. [Google Scholar] [CrossRef]
- Minkovska, S.; Jeliazkova, B.; Borisova, E.; Avramov, L.; Deligeorgiev, T. Substituent and solvent effect on the photochromic properties of a series of spiroindolinonaphthooxazines. Journal of Photochemistry and Photobiology A: Chemistry 2004, 163, 121–126. [Google Scholar] [CrossRef]
- Paley, M. S.; Meehan, E. J.; Smith, C. D.; Rosenberger, F. E.; Howard, S. C.; Harris, J. M. Synthesis and characterization of a novel betaine dye: 2,4-dimethyl-6-(2,4,6-triphenyl-N-pyridinio)phenolate. The Journal of Organic Chemistry 1989, 54, 3432–3436. [Google Scholar] [CrossRef]
- Frisch, M. J.; Trucks, G. W.; Schlegel, H. B.; Scuseria, G. E.; Robb, M. A.; Cheeseman, J. R.; Scalmani, G.; Barone, V.; Petersson, G. A.; Nakatsuji, H.; et al. Gaussian 16, Revision C.01. Gaussian, Inc.: Wallingford, CT, USA, 2016. [Google Scholar]
- Manzoni, V.; Coutinho, K.; Canuto, S. An insightful approach for understanding solvatochromic reversal. Chemical Physics Letters 2016, 655–656, 30–34. [Google Scholar] [CrossRef]

Table 1.
Calculated transition energies ET, in kcal.mol-1 in various solvents, employing the PCM and TD-DFT/6-311G (d) calculations.
Table 1.
Calculated transition energies ET, in kcal.mol-1 in various solvents, employing the PCM and TD-DFT/6-311G (d) calculations.
| Solvent | Solvent ET(30) value | Dye 1 | Dye 2a | Dye 3b | |
|---|---|---|---|---|---|
| PCM | SMD | SMD | SMD | ||
| Cyclohexane | 30.9 | - | - | - | (54.98) |
| Benzene | 34.3 | - | - | - | (52.94) |
| Tetrahydrofuran | 37.4 | 33.66 | 34.51 | 49.93 (40.50) | 50.89 |
| Chloroform | 39.1 | 32.42 | 33.13 | 49.73 (40.16) | 50.73 (51.51) |
| Acetone | 42.2 | 35.63 | 37.41 | 50.02 (40.06) | 50.68 (51.51) |
| Dimethylsulfoxide | 45.1 | 36.57 | 38.42 | 49.60 (39.78) | 50.21 |
| Acetonitrile | 45.6 | 36.30 | 38.51 | 50.05 (40.54) | 50.60 |
| 1-Butanol | 49.7 | 35.46 | 39.73 | 49.48 (40.02) | 49.60 |
| Benzyl alcohol | 50.4 | - | - | - | (46.49) |
| 1-Propanol | 50.7 | 35.60 | 40.24 | 49.56 (40.11) | 49.63 |
| Ethanol | 51.9 | 35.88 | 40.74 | 49.72 (40.44) | 49.75 |
| Methanol | 55.4 | 36.23 | 42.27 | 49.86 (41.18) | 49.71 (46.49) |
| Formamide | 55.8 | - | - | - | (46.49) |
| Water | 63.1 | 37.00 | 43.64 | 49.78 (50.96) | 49.48 |
Table 2.
Values of group Fukui electrophilic functions for dyes 1-12, calculated in the gas phase.a.
Table 2.
Values of group Fukui electrophilic functions for dyes 1-12, calculated in the gas phase.a.
| Compound | fG+ (phenolate) | fG+ (heterocyclic) | fG+ |
|---|---|---|---|
|
1b 2b 3b 4c 5c 6c 7c 8d 9d 10c 11c 12c |
0.17 0.54 0.57 0.74 0.70 0.63 0.58 0.48 0.53 0.28 0.21 0.12 |
0.83 0.46 0.43 0.26 0.30 0.37 0.42 0.52 0.47 0.72 0.79 0.88 |
0.66 -0.08 -0.14 -0.48 -0.40 -0.26 -0.16 -0.04 -0.06 0.44 0.58 0.76 |
Disclaimer/Publisher’s Note: The statements, opinions and data contained in all publications are solely those of the individual author(s) and contributor(s) and not of MDPI and/or the editor(s). MDPI and/or the editor(s) disclaim responsibility for any injury to people or property resulting from any ideas, methods, instructions or products referred to in the content. |
© 2024 by the authors. Licensee MDPI, Basel, Switzerland. This article is an open access article distributed under the terms and conditions of the Creative Commons Attribution (CC BY) license (http://creativecommons.org/licenses/by/4.0/).
Copyright: This open access article is published under a Creative Commons CC BY 4.0 license, which permit the free download, distribution, and reuse, provided that the author and preprint are cited in any reuse.


