
Submitted:
05 August 2024
Posted:
07 August 2024
You are already at the latest version
Abstract
A diet with low content of fermentable oligo-, di-, and monosaccharides and polyols (FODMAP) are established treatment for irritable bowel syndrome (IBS), with well-documented efficiency. A starch- and sucrose-reduced diet (SSRD) has shown similar promising effects. This randomized, non-inferiority study aimed to test SSRD against low FODMAP and compare the responder rates to a 4-week dietary intervention of either diet. 155 IBS patients were randomized to SSRD (n=77) or low FODMAP (n=78) for 4 weeks, with a follow-up 5 months later without food restrictions. The questionnaires Rome IV, IBS-severity scoring system (IBS-SSS), and visual analog scale for IBS (VAS-IBS) were completed at baseline and after 2 and 4 weeks and 6 months. Weight, height, waist circumference, and blood pressures were measured. Comparisons were made within the groups and between changes in the two groups. There were no differences between groups at baseline. The responding rate (RR=∆Total IBS-SSS ≥−50) of SSRD was non-inferior compared with low FODMAPs at week 2 (79.2% vs. 73.1%;p=0.661;95% confidence interval (CI)=-20-7.2) and week 4 (79.2% vs. 78.2%;p=1.000;95%CI=-14-12), with borderline-significance at follow-up (36.4% vs. 42.3%;p=0.252;95%CI=-9.4-21). All gastrointestinal and extraintestinal symptoms were equally improved (p<0.001 in most variables). SSRD rendered greater reductions in weight (p=0.006), body mass index (BMI) (p=0.005), and sugar craving (p=0.05), whereas waist circumference and blood pressure were equally decreased. Weight and BMI were regained at follow-up. In the SSRD group, responders at 6 months still had lowered weight (-0.7 (-2.5-0.1) vs. 0.2 (-0.7-2.2) kg; p=0.005) and BMI (-0.25 (-0.85-0.03) vs. 0.07 (-0.35-0.77) kg/m2; p=0.009) compared with baseline in contrast to non-responders. Those who had tested both diets preferred SSRD (p=0.032). A 4-week SSRD intervention was non-inferior to low FODMAP regarding effects on gastrointestinal and extraintestinal IBS symptoms. Reductions of weight, BMI, and sugar craving were most pronounced following SSRD.
Keywords:
dietary intervention
; irritable bowel syndrome
; low FODMAP
; randomized trial
; SSRD
1. Introduction
Irritable bowel syndrome (IBS) is the most common disorder of gut-brain interaction (DGBI) with a global prevalence of 4% according to the Rome IV criteria [1,2]. Functional gastrointestinal (GI) symptoms are observed in 40% of the general population [2]. Most patients experience aggravated GI symptoms after food intake [3]. The established treatment of IBS is dietary modification with the National Institute for Health and Care Excellence (NICE) guidelines and low content of fermentable oligo-, di-, and monosaccharides and polyols (FODMAP) [4,5]. However, some patients complain about the complicated low FODMAP advice, and the challenge to personalize the diet. Increased prevalence of rare variants of sucrase-isomaltase (SI) genes in IBS patients has raised the hypothesis that a subgroup of IBS may represent enzymatic SI deficiency [6,7]. Therefore, the efficacy of a starch- and sucrose-reduced diet (SSRD) has been examined in IBS, with marked improvement of symptoms [8,9]. SSRD focus on reduction of sucrose, starch, and added sugar, but allows intake of gluten, lactose, and sweeteners [5,10]. The aim of the present non-inferiority study was to test SSRD against the established low FODMAP and compare the responder rates to a 4-week dietary intervention of either diet. Secondary aims were to estimate the effects on extraintestinal symptoms, saturation, sugar craving, anthropometric parameters, and blood pressure.
2. Materials and Methods
2.1. Study Design
An open randomized, non-inferior trial, with two parallel groups, was conducted at the Department of Internal Medicine, Skåne University Hospital. Malmö, Sweden, between March 2022-February 2024 [11]. After a 10-day run-in period (baseline), a dietary intervention of either SSRD or low FODMAP was given for 4 weeks. When completing the intervention, participants received information about the diet not randomized to, which they were free to test, and were followed up 5 months later without any mandatory dietary restrictions. The study questionnaire, food diary, Rome IV [12], irritable bowel syndrome-severity scoring system (IBS-SSS) [13], and visual analog scale for irritable bowel syndrome (VAS-IBS) [14] were completed and weight, height, waist circumference, and blood pressure were measured at all three physical visits. IBS-SSS and VAS-IBS were also completed at home after 2 weeks of intervention.
2.2. Patients
Patients with a diagnosis of IBS according to Rome IV [1] and age 18–70 years with symptoms >175 scores on IBS-SSS [13], and without alcohol and/or drug abuses, current eating disturbances, pregnancy, presence of any organic GI disease, severe GI surgery in the past, severe organic and psychiatric diseases, severe food allergy, or on gluten-free-, vegan-, low FODMAP-, or LCHF diets were recruited to the study (Supplementary Figure S1). Celiac disease was excluded by measuring transglutaminase antibodies at the Department of Clinical Chemistry [15].
A detailed description of the recruitment process has been published [11]. Briefly, a data search was performed from medical records in the County of Region Skane using the International Classification of Diseases (ICD) revision 10 for patients who had received any of the diagnoses K58.1, K58.2, K58.3, and K58.8 during 2019–2022. Of these, 744 were randomly contacted by letter and phone call. Information letters with leaflets for distribution to waiting rooms were sent to 203 primary healthcare centers (PCC) in the County and several lectures were held for healthcare staff. Campaigns in social media were performed by a professional company (Trialy, Gothenburg, Sweden), to recruit persons with a known diagnosis of IBS. From 300 eligible patients, 214 patients were randomized to either SSRD or low FODMAP according to block randomization (BR), and 155 (72.4% of randomized cases) could enter the dietary intervention since many did not come to first visit or did not fulfill inclusion criteria (Supplementary Figure S1) (BO). This means an inclusion rate of 42.7% in the group from social media and 6.5% in the group from medical records. Seven of the included IBS patients had total IBS-SSS just below 175 but were included due to clear diagnosis of IBS [1].
2.3. Dietary Advice
Verbal and written dietary advice were given at the first visit. Patients randomized to SSRD focused on starch- and sucrose reduction, and increased intake of certain fruits and vegetables, meat, fish, and dairy products. The dietary advice was modified from dietary guidelines for patients with congenital sucrase-isomaltase deficiency (CSID), and previously described in detail [10]. Briefly, all sucrose-containing foods were to be avoided. One serving per day was allowed for 1) whole-grain bread or oatmeal porridge and 2) fiber-rich alternatives of rice or pasta. For those not tolerating fibers, smaller amounts of regular processed rice and pasta was allowed. Whole grains were recommended instead of processed breakfast cereals. Pork, beef, lamb, fish, turkey, chicken, and egg could be ingested without any restrictions. Processed meat such as bacon, sausage, and pies should be avoided if containing sugar or starch. Natural dairy products, but not oat milk and soya milk, were allowed. Butter and oil intake was unrestricted, but margarine should be avoided. Salt, pepper, and fresh herbs could be used unrestrictedly. Nuts and seeds were recommended in place of sugary snacks. Increased fat and/or protein intake and prolonged chewing was encouraged, to enhance salivary amylase breakdown of starch and to delay GI transport. Patients were provided lists of suitable fruits and vegetables with less starch content (Supplementary Tables S1 and S2).
Participants randomized to the low FODMAP received written and oral information how to avoid or reduce intake of fructans (e.g., wheat, onion, garlic), galacto-oligosaccharides (e.g., pulses), lactose (e.g., milk), fructose more than glucose (e.g., honey), and polyols (e.g., apples, pears) during the 4-week intervention [16]. After the 4 weeks, they had to reintroduce food FODMAP-containing food again, one by one, to finally find their personalized form of food [17,18].
Both groups received recipes and menu suggestions to enable compliance to the diet. All participants had to continue with their ordinary energy intake, degree of physical activity, medications, probiotics, or supplements, without making any changes or introductions of new drugs or other diets. No advice was given regarding food intake frequency or regularity. The participants could reach the study staff by telephone or email throughout the study.
2.4. Questionnaires
2.4.1. Study Questionnaire
All study participants completed a questionnaire regarding sociodemographic factors, lifestyle habits, pregnancies and childbirth, medical history, drug treatments, and family history. Two 100 mm visual analog scales (VAS) were used to estimate saturation and sugar craving, respectively.
Food intake was registered digitally for 3 days (Wednesday-Friday) at baseline, and at week 4 and month 6 at the platform called Riksmaten Flex 2021 of the Swedish Food Agency [19].
Screening for symptoms of eating disorders was performed by the SCOFF (Sick, Control, One, Fat, Food) screening tool, which was also completed after 4 weeks and at follow-up [20].
2.4.2. Rome IV Questionnaire
Questions No 40–48 in the Swedish version of the Rome IV questionnaire was used, after having received license from The Rome Foundation, Inc. Raleigh, NC, USA [12].
2.4.3. Irritable Bowel Syndrome-Severity Scoring System
Abdominal pain, abdominal distension, satisfaction with bowel habits, and the impact of bowel habits on daily life was estimated using VAS ranging from absent (0 mm) to very severe (100 mm) symptoms, and days with abdominal pain the last 10 days was reported. The maximum achievable score is 500. Scores ranging 75–174 indicate mild disease, 175–299 indicate moderate disease, and ≥300 indicate severe disease. Extraintestinal symptoms (nausea, difficulties to eat a whole meal, reflux, belching/excess wind, headache, back pain, leg pain, muscle/joint pain, urinary urgency, and fatigue) were estimated on VAS scales with maximal achievable score of 500 [13].
2.4.4. Visual Analog Scale for Irritable Bowel Syndrome
The VAS-IBS covers the symptoms abdominal pain, diarrhea, constipation, bloating and flatulence, vomiting and nausea, psychological well-being, and intestinal symptoms’ influence on daily life, ranging from absent (0 mm) to very severe (100 mm) symptoms. The values are inverted from the original format and validated to measure changes over time [14,21,22].
2.5. Statistical Analyses
Power calculation was based on non-inferiority where SSRD was tested against a standard treatment (low FODMAP). Primary outcome was responder rate (RR=∆Total IBS-SSS ≥−50) and was assumed to be 65% in both treatment groups at week 4. A difference in responder rate as large as 20% in favor of the standard treatment, would allow SSRD to be non-inferior. Sample size based on 80% power, a one-sided confidence level of 97.5% and an expected loss of follow-up of 10% to confirm non-inferiority was calculated to be 100 patients in each group. Due to few dropouts, the study was closed after inclusion of 155 patients, after a second consultation with the statistician.
The statistical calculations were performed as intention-to-treat in IBM SPSS, version 29. Two participants had acute gastroenteritis at the end of the 4-week period, why the questionnaires reflecting GI symptoms from the 2-week follow-up was used. According to the Kolmogorov-Smirnov test, anthropometric and symptom data were not normally distributed and therefore presented as median (interquartile ranges) or number (percentages). Mann-Whitney U-test, Wilcoxon Signed Ranks, and Spearman’s correlation test was used for continuous variables and Fisher’s exact test was used for dichotomous variables, as well as Proportionality test for 95% confidence interval (CI). Normally distributed data in nutritional variables were presented as mean ±standard deviation (SD) and calculated by Independent-Sample or Paired-Samples T Test. One sample t-test were used for proportional differences. ANOVA with Bonferroni correction was performed to calculate response differences due to IBS subgroups. P≤0.05 was considered statistically significant.
3. Results
3.1. Basal Characteristics
In total, 155 patients were included in the study categorized as constipation-predominated IBS (IBS-C) (n=26, 16.8%), diarrhea-predominated IBS (IBS-D) (n=44, 28.4%), mixed IBS (IBS-M) (n=54, 34.8%), unspecified IBS (IBS-U) (n=7, 4.5%), and unspecific functional bowel disorder (FBD) (n=24, 15.5%) with weekly abdominal pain but weak (<30%) association between the pain and bowel habits. Seventy-seven participants were randomized to SSRD of which 72 (93.5%) completed the 4-week intervention in comparison to 72 (92.3%) of the 78 participants randomized to low FODMAP (p=1.00). Fifty-three in the SSRD group (68.8%) and 49 (62.8%) in the low FODMAP group completed the 6-month follow-up (p=0.499). There was no difference in sex distribution, age, weight, body mass index (BMI), sociodemographic factors, or lifestyle habits between groups (Table 1).
Overweight/obesity was observed in 50.3% of the participants. The most common comorbidities were eczema (n=19, 12.3%), allergy (n=17, 11.0%), and reflux/hiatus hernia (n=18, 11.6%). The most common used drugs were paracetamol (n=54, 34.8%), proton pump inhibitors (n=48, 31.0%), allergy medicines (n=24, 15.5%), and hormonal anticonception (n=24, 15.5%). As many as 55 participants (35.5%) were using any nutritional supply in the form of minerals and vitamins (Supplementary Table S3). At inclusion, 19 (12.3%) had gluten-reduced diet, 63 (40.6%) lactose-free diet, and 14 (9%) were vegetarians. Altogether, 78 (50.3%) were already on any food-restriction diet. Twenty-eight (18.1%) participants had a history of any eating disorders.
3.2. Gastrointestinal and Extraintestinal Symptoms
The compliance to diet seemed good, with reduction of energy, carbohydrate, sucrose, and monosaccharides in both groups, whereas starch, disaccharides, added sugar, and alcohol only were decreased in SSRD group. Protein intake was increased in the SSRD group (p=0.002), whereas fiber intake was reduced (p=0.001), and alcohol intake was increased at follow-up (p<0.001), in the low FODMAP group. The reductions were most pronounced in the SSRD group for carbohydrates, sucrose, starch, disaccharides, and added sugar (p<0.001 for all), with differences also in fat intake between groups (p=0.007) (Supplementary Table S4). The vast majority were responders to the diet, without any differences in the responding rate between the groups when calculated as intention-to-treat at week 2 (79.2% vs. 73.1%; p=0.661; 95% CI=-20-7.2) and week 4 (79.2% vs. 78.2%; p=1.000; 95% CI=-14-12), but with borderline significance for SSRD at follow-up (36.4% vs. 42.3%; p=0.252; 95% CI=-9.4-21). Responding rate was still high when defined stricter (∆Total IBS-SSS ≥−100), both at week 2 (63.6% vs. 52.6%), week 4 (67.5% vs. 65.4%), and month 6 (20.8% vs. 28.2%). Also, a considerable responding rate was found when defined as a 50% decrease of total IBS-SSS (Figure 1).
Calculations per protocol showed similar results (Supplementary Figure S2). There were fewer responders in those with a vegetarian diet when considering >100 points and 50% reduction of total IBS-SSS (p=0.016 and p=0.018, respectively). When calculating all who had any diet such as gluten-reduced, lactose-free, or vegetarians, the 50% responder rate was lower compared with those without any dietary restrictions (p=0.031). Responders had slightly higher total IBS-SSS at baseline compared with non-responders both considering week 2 (316 (240-352) vs. 255 (235-340); p=0.274), week 4 (316 (240-352) vs. 262 (222-356); p=0.428), and month 6 (322 (258-366) vs. 282 (228-345); p=0.116). Those who were responders (∆Total IBS-SSS ≥−50) at 6 months in the SSRD group, were those who still had lowered weight (-0.7 (-2.5-0.1) vs. 0.2 (-0.7-2.2) kg; p=0.005) and BMI (-0.25 (-0.85-0.03) vs. 0.07 (-0.35-0.77) kg/m2; p=0.009) compared with baseline (Figure 2A). Similar results were found of 50% decrease regarding BMI (p=0.027) and weight (Figure 2B).
All specific GI symptoms, as well as total IBS-SSS, decreased already after 2 weeks. The improvement remained in all symptoms except for constipation in the SSRD group (Table 2). About one-quarter of the participants were without symptoms after 4 weeks (<75 scores in total IBS-SSS), and 40-50% experienced abdominal pain only 2-3 times/monthly after 6 months, thus, not fulfilling the IBS criteria (Table 3).
The total burden av extraintestinal symptoms at baseline correlated with constipation (rs=0.260, p=0.001), bloating and flatulence (rs=0.214, p=0.008), vomiting and nausea (rs=0.366, p<0.001), and impaired psychological well-being (rs=0.243, p=0.003). All extraintestinal symptoms, except leg pain in the SSRD group, were improved after the dietary intervention, which remained throughout the study period in most variables (Table 4).
The effect on total IBS-SSS or extraintestinal IBS-SSS was not affected of gluten-reduced, lactose-free, or vegetarian diets (data not shown). There was a strong correlation between the improvements in total IBS-SSS and total extraintestinal IBS-SSS at both week 2, week 4 and month 6 (rs=0.390, rs=0.409, and rs=0.439, respectively; p<0.001 for all) and psychological well-being (rs=0.272, rs=0.309, and rs=0.366, respectively; p<0.001 for all). Fatigue (rs=0.363 and p<0.001, rs=0.431 and p<0.001, and rs=0.204 and p=0.040, respectively) and belching/excess wind (rs=0.239 and p=0.004, rs=0.419 and p<0.001, and rs=0.324 and p<0.001, respectively) showed the strongest correlations among extraintestinal symptoms (Supplementary Table S5). The IBS-D group differed from IBS-C and IBS-M in improvements of diarrhea and from IBS-M in improvements of constipation in the SSRD group at week 4, whereas IBS-C differed from IBS-D and IBS-M in improvements of diarrhea in the low FODMAP group (Supplementary Table S6). Sugar craving was decreased, especially following SSRD, whereas the degree of saturation was unaffected (Table 5).
In the SSRD group, there was a weak correlation between decreased bloating and disaccharide intake (rs=0.245, p=0.044). In the low FODMAP group, there was a weak correlation between decreased bloating and monosaccharide (rs=0.252, p=0.040) and fiber intake (rs=0.244, p=0.046), as well as decreased total IBS-SSS and monosaccharide intake (rs=0.258, p=0.034).
3.3. Anthropometric Data
Weight and BMI were decreased in both groups (p<0.001) but was most pronounced following SSRD (p=0.006 and p=0.005, respectively). After the intervention, weight and BMI were regained, but waist circumference was still reduced after 6 months (Table 5). The difference in weight and BMI from baseline at month 6 correlated with the difference of total IBS-SSS (Supplementary Table S5). The systolic blood pressure was slightly decreased, whereas the diastolic blood pressure was significantly decreased, and remained decreased in the low FODMAP group (Table 5).
3.4. Follow-Up
Between week 4 and month 6, participants were instructed to eat whatever they preferred. At month 6, the majority (68 out of 102) had only tested the diet they were initially randomized to. Of those 34 participants who had tested both diets, 22 (64.7%) preferred SSRD and 10 (29.4%) preferred low FODMAP (p=0.032), whereas 2 participants (5.9%) experienced the diets equal. The reason for preferring either diet was: easier to follow (n=16, 47.0%), had better effect (n=9, 26.5%), easier to follow and better effect (n=7, 20.6%), or other (n=2, 5.9%).
In the SSRD group (n=53), 28 (52.8%) had continued with a modified SSRD (see below), 16 (30.2%) had returned to their ordinary diet, and the rest ingested a variety of different diets. In the low FODMAP group (n=49), 18 (36.7%) continued with a personalized low FODMAP, 23 (46.9%) had returned to their ordinary food habits, and the other ingested different diets. A greater portion of participants in the SSRD group planned to continue with a modified SSRD (n=28) instead of returning to normal diet (n=11) (p=0.005). In the low FODMAP group, the distribution between a continued personalized low FODMAP (n=19) or normal diet (n=16) was equal (p=0.619).
As a free comment, several participants mentioned how they had modified SSRD to avoidance of sucrose and restricted intake of bread, potatoes, rice, and pasta, which rendered sustained effect of the diet also at follow-up. Thus, these modifications were the easiest to adhere to, and the listed fruits, berries, and vegetables were of less importance in the long-term coherence.
4. Discussion
The responding rate of the 4-week SSRD intervention was not inferior to the responding rate of low FODMAP. In addition to reduced GI and extraintestinal symptoms, also sugar craving, weight, and BMI were reduced, especially following SSRD, whereas blood pressure was most reduced after low FODMAP. A quarter of the participants had no symptoms after the 4-week intervention, and at follow-up 5 months later, 40-50% did not fulfill the IBS criteria but were classified as unspecific FBD or healthy.
The most pronounced dietary effect has been found in patients with higher GI symptoms [23], in line with the present findings. Extraintestinal symptoms, which correlated with specific GI symptoms, are common in IBS and may be as bothersome as the GI symptoms for the patient [24]. Therefore, it is important to measure improvements in both GI and extraintestinal symptoms, to ensure an improved quality of life.
The objective of the present study was to compare the effect on symptoms of a starch- and sucrose reduction and a low FODMAP. As found in the diary books, SSRD led to markedly more reductions of carbohydrates, sucrose, starch, disaccharides, and added sugar than low FODMAP. The greatest differences between the diets are gluten (due to fructan reduction)- and lactose restrictions in low FODMAP but not in SSRD. However, there are many overlaps between current diets. Garlic, leek, and beans should be avoided in both diets. Also, low FODMAP renders lower starch and sucrose intake, since a lot of cakes and candies contain gluten and/or lactose, leading to avoidance of similar food items as SSRD [10,18]. Furthermore, sucrose reduction leads to fructose reduction. The concept of avoiding sucrose and starch is easier to adhere to, in comparison to fermentable carbohydrates, which was reflected by the preference of SSRD both in the present and the first SSRD intervention [25]. At follow-up, those who still adhered to SSRD experienced marked improvement of GI symptoms, and they had found out that avoidance of sucrose and reduction of bread, potatoes, rice, and pasta was enough to remain asymptomatic. Thus, the restrictions of other fruits, berries, and vegetables should be used by caution, to avoid unnecessary reduction of important micronutrients. The reduced wight and BMI in responders at 6 months in the SSRD group suggest better compliance in responders than non-responders.
Our interventional study supports previous findings in a large population-based cohort (366,432 individuals) of the importance of human carbohydrate-active enzymes (hCAZyme) genotype in relation to IBS risk [26]. SI genes codes for the brush-border disaccharidase sucrase-isomaltase that break down sucrose and starch whereas AMY1B and AMY2A code for amylase that break down starch into smaller sugars and disaccharides. Hypomorphic variants of SI, AMY1B, and AMY2A genes have been found to be associated with increased risk of IBS [26]. Hence, reduced enzymatic activity may lead to excess carbohydrates in the bowel, leading to IBS symptoms through bacterial fermentation and osmotic diarrhea. In alignment, decreased intake of disaccharides in the SSRD group correlated with less bloating. Future studies are warranted to identify the individual saccharides most likely to exert therapeutic effects, eventually in relation to their breakdown capacity in individual patients (i.e., battery of hCAZymes and relative efficiency of these). The marked improvement of symptoms after SSRD cannot be explained solely due to genetic variants. Other mechanisms such as microbiota modification, endocrine effects, and fructose intolerance may be involved, although more studies are needed to confirm the importance of these components [27,28].
Several reports have shown that the symptoms in IBS patients are not explained by food allergy or food intolerances [29]. Instead, poor dietary habits with food intake that trigger GI symptoms as well as leads to micronutrient deficiency are common in IBS [25,30]. Therefore, overloading of the physiological mechanisms when ingesting Western processed food with additives of sugar and starch may be one cause of symptoms in a subset of IBS patients. Sugar has not only an adverse effect on GI symptoms but is also associated with overweight and obesity [31], leading to several diseases including metabolic diseases, pain hypersensitivity, and malignancies [32,33]. A systematic review has shown obesity to be a risk factor for IBS [34], and IBS was associated with the metabolic syndrome in a large population-based study [35]. This underlines the importance of reduced weight and blood pressure in IBS, and not only improvement of symptoms. Total sugar and fructose intake are associated with all-cause mortality and cardiovascular disease mortality [36]. Thus, decrease of carbohydrate intake, especially sucrose, is of benefit for the whole society [10]. The high prevalence of previous eating disorders in IBS is in alignment with other studies [37].
Due to the great challenge to recruit participants [12], the study was completed before 200 participants were included, which may have affected the statistical calculations. However, the study cohort is still big in comparison to several others [38,39]. The main inclusion of participants from social media led to highly dedicated participants, with higher motivation than observed in the prior study when recruitment was performed from medical records [24]. The high responding rate is in line with 83% responders by Mediterranean diet [39], and 50-80% by low FODMAP [5], with at least 50% of individuals´ experiencing symptom relief in the long term [38].
One of the strengths of the present study was the follow-up for another 5 months. The results suggest that IBS patient can be offered different diets depending on their preferences. The study has several limitations, one being that the power calculation was performed for the 4-week intervention. Thus, the high rate of dropouts at month 6, with most dropouts in the low FODMAP group, led to that an obvious non-inferiority for SSRD could not be shown in the long-term.
In conclusion, the SSRD effect on GI and extraintestinal IBS symptoms was not inferior to the low FODMAP effect in a 4-week intervention. Reductions of weight, BMI, and sugar craving were most pronounced following SSRD.
Supplementary Materials
The following supporting information can be downloaded at: www.mdpi.com/xxx/s1, Supplementary Figure S1: CONSORT flow chart. SSRD = starch-and sucrose-reduced diet. Low FODMAP = low content of fermentable oligo-, di-, and monosaccharides and polyols. LCHF = low carbohydrate high fat. SCOFF = Sick, Control, One, Fat, Food questionnaire [20]; Supplementary Figure S2: Responder rates given in percentage and calculated as per protocol with A) ≥50 decrease of total IBS-SSS score, B) ≥100 decrease of total IBS-SSS score, and C) ≥50% decrease of total IBS-SSS score. SSRD = starch- and sucrose-reduced diet with 72 patients at week 2 and 4 and 53 at month 6. Low FODMAP = low content of fermentable oligo-, di-, and monosaccharides and polyols with 72 patients at week 2 and 4 and 49 at month 6. Fisher´s exact test. P≤0.05 was considered statistically significant. Supplementary Table S1: Recommendations of fruit intake according to a starch- and sucrose-reduced diet; Supplementary Table S2: Recommendations of vegetable and legume intake according to a starch- and sucrose-reduced diet; Supplementary Table S3: Previous or present comorbidity and drug treatments; Supplementary Table S4: Energy and nutrient intake; Supplementary Table S5: Correlations between improvements of gastrointestinal and extraintestinal symptoms; Supplementary Table S6. The effect of dietary intervention at week 4 depending on IBS subgroup.
Author Contributions
Conceptualization, B.R. and B.O.; methodology, B.R., H.J., M.D. and B.O.; software, B.R., M.N. and B.O.; validation, B.R., M.N., H.J. and B.O.; formal analysis, B.R., M.N. and B.O.; investigation, B.R. and B.O.; resources, M.D. and B.O.; data curation, B.R., M.N. and B.O.; writing—original draft preparation, B.O.; writing—review and editing, M.N., M.D. and K.S.; visualization, B.O.; supervision, B.O.; project administration, B.R. and B.O.; funding acquisition, M.D., K.S. and B.O. All authors have read and agreed to the published version of the manuscript.
Funding
Development Foundation of Region Skane (BO); Foundation of Skane University Hospital (BO); Dir Albert Påhlsson´s Foundation (BO); and the Spanish Government MCIN/AEI/10.13039/501100011033 (PID2020-113625RB-I00 to MD’A).
Institutional Review Board Statement
This study was performed in accordance with the declaration of Helsinki and approved by the Swedish Ethical Review Authority (2021-05407-01, date of approval 10/11/2021). The study was registered at ClinicalTrials.gov, NCT05192603, 29/11/2021.
Informed Consent Statement
The participants gave written, informed consent to participate and publish the data before entering the studies.
Data Availability Statement
The data presented in this study are available on request from the corresponding author due to ethical reasons.
Acknowledgments
The staff at Clinical Research Unit at Skåne University Hospital and Karolina. Palmér, statistician, for power calculation and block randomization.
Conflicts of Interest
MD’A received consulting fees and unrestricted research grants from QOL. Medical LLC. The funders had no role in the design of the study; in the collection, analyses, or interpretation of data; in the writing of the manuscript; or in the decision to publish the results.
References
- Lacy, B.E.; Mearin, F.; Chang, L.; Chey, W.D.; Lembo, A.J.; Simren, M.; et al. Bowel disorders. Gastroenterology. 2016, 150, 1393–1407. [Google Scholar] [CrossRef]
- Sperber, A.D.; Bangdiwala, S.I.; Drossman, D.A.; Ghoshal, U.C.; Simren, M.; Tack, J.; Whitehead, W.E.; et al. Worldwide prevalence and burden of functional gastrointestinal disorders, results of Rome foundation global study. Gastroenterology. 2021, 160, 99–114. [Google Scholar] [CrossRef]
- Hayes, P.A.; Fraher, M.H.; Quigley, E.M. Irritable bowel syndrome: the role of food in pathogenesis and management. Gastroenterol. Hepatol. 2014, 10, 164–74. [Google Scholar]
- Algera, J.; Colomier, E.; Simrén, M. The Dietary Management of Patients with Irritable Bowel Syndrome: A Narrative Review of the Existing and Emerging Evidence. Nutrients. 2019, 11, 2162. [Google Scholar] [CrossRef]
- Mitchell, H.; Porter, J.; Gibson, P.R.; Barrett, J.; Garg, M. Review article: implementation of a diet low in FODMAPs for patients with irritable bowel syndrome-directions for future research. Aliment Pharmacol Ther. 2019, 49, 124–139. [Google Scholar] [CrossRef]
- Henström, M.; Diekmann, L.; Bonfiglio, F.; Hadizadeh, F.; Kuech, E.M.; von Köckritz-Blickwede, M.; Thingholm, L.B.; Zheng, T.; Assadi, G.; Dierks, C.; Heine, M.; Philipp, U.; Distl, O.; Money, M.E.; Belheouane, M.; Heinsen, F.A.; Rafter, J.; Nardone, G.; Cuomo, R.; Usai-Satta, P.; Galeazzi, F.; Neri, M.; Walter, S.; Simrén, M.; Karling, P.; Ohlsson, B.; Schmidt, P.T.; Lindberg, G.; Dlugosz, A.; Agreus, L.; Andreasson, A.; Mayer, E.; Baines, J.F.; Engstrand, L.; Portincasa, P.; Bellini, M.; Stanghellini, V.; Barbara, G.; Chang, L.; Camilleri, M.; Franke, A.; Naim, H.Y.; D'Amato, M. Functional variants in the sucrase-isomaltase gene associate with increased risk of irritable bowel syndrome. Gut. 2018, 67, 263–270. [Google Scholar] [CrossRef]
- Garcia-Etxebarria, K.; Zheng, T.; Bonfiglio, F.; Bujanda, L.; Dlugosz, A.; Lindberg, G.; Schmidt, P.T.; Karling, P.; Ohlsson, B.; Simren, M.; Walter, S.; Nardone, G.; Cuomo, R.; Usai-Satta, P.; Galeazzi, F.; Neri, M.; Portincasa, P.; Bellini, M.; Barbara, G.; Jonkers, D.; Eswaran, S.; Chey, W.D.; Kashyap, P.; Chang, L.; Mayer, E.A.; Wouters, M.M.; Boeckxstaens, G.; Camilleri, M.; Franke, A.; D'Amato, M. Increased Prevalence of Rare Sucrase-isomaltase Pathogenic Variants in Irritable Bowel Syndrome Patients. Clin Gastroenterol Hepatol. 2018, 16, 1673–1676. [Google Scholar] [CrossRef]
- Nilholm, C.; Roth, B.; Ohlsson, B. A Dietary Intervention with Reduction of Starch and Sucrose Leads to Reduced Gastrointestinal and Extra-Intestinal Symptoms in IBS Patients. Nutrients. 2019, 11, 1662. [Google Scholar] [CrossRef]
- Gayoso, L.; Garcia-Etxebarria, K.; Arzallus, T.; Montalvo, I.; Lizasoain, J.; D’Amato, M.; et al. The effect of starch- and sucrose-reduced diet accompanied by nutritional and culinary recommendations on the symptoms of irritable bowel syndrome patients with diarrhoea. Ther Adv Gastroenterol. 2023, 16, 175628482311566. [Google Scholar] [CrossRef]
- Nilholm, C.; Larsson, E.; Sonestedt, E.; Roth, B.; Ohlsson, B. Assessment of a 4-Week Starch- and Sucrose-Reduced Diet and Its Effects on Gastrointestinal Symptoms and Inflammatory Parameters among Patients with Irritable Bowel Syndrome. Nutrients. 2021, 13, 416. [Google Scholar] [CrossRef]
- Roth, B.; Ohlsson, B. Challenges of recruitment processes to a randomized dietary trial in irritable bowel syndrome. F1000Res. 2024, 13, 323. [Google Scholar] [CrossRef]
- Palsson, O.S.; Whitehead, W.E.; Van Tilburg, M.A.L.; Chang, L.; Chey, W.; Crowell, M.D.; et al. Development and validation of the Rome IV diagnostic questionnaire for adults. Gastroenterology. 2016, 150, 1481–1491. [Google Scholar] [CrossRef]
- Francis, C.Y.; Morris, J.; Whorwell, P.J. The irritable bowel severity scoring system: a simple method of monitoring irritable bowel syndrome and its progress. Aliment Pharmacol Ther. 1997, 11, 395–402. [Google Scholar] [CrossRef]
- Bengtsson, M.; Ohlsson, B.; Ulander, K. Development and psychometric testing of the Visual Analogue Scale for Irritable Bowel Syndrome (VAS-IBS). BMC Gastroenterol. 2007, 7, 16. [Google Scholar] [CrossRef]
- Laboratoriemedicin. Available online: http://www.analysportalen-labmedicin.skane.se [cited 2021-04-12].
- Whelan, K.; Martin, L.D.; Staudacher, H.M.; Lomer, M.C.E. The low FODMAP diet in the management of irritable bowel syndrome: an evidence-based review of FODMAP restriction, reintroduction and personalisation in clinical practice. J Hum Nutr Diet. 2018, 31, 239–255. [Google Scholar] [CrossRef]
- Staudacher, H.M.; Ralph, F.S.E.; Irving, P.M.; Whelan, K.; Lomer, M.C.E. Nutrient intake, diet quality, and diet diversity in irritable bowel syndrome and the impact of the low FODMAP diet. J Acad Nutr Diet. 2020, 120, 535–547. [Google Scholar]
- Staudacher, H.M.; Rossi, M.; Kaminski, T.; Dimidi, E.; Ralph, F.S.E.; Wilson, B.; Martin, L.D.; Louis, P.; Lomer, M.C.E.; Irving, P.M.; Whelan, K. Long-term personalized low FODMAP diet improves symptoms and maintains luminal Bifidobacteria abundance in irritable bowel syndrome. Neurogastroenterol Motil. 2022, 34, e14241. [Google Scholar]
- www. livsmedelsverket.se. Downloaded 0304 2024.
- Perry, L.; Morgan, J.; Reid, F.; Brunton, J.; O'Brien, A.; Luck, A.; Lacey, H. Screening for symptoms of eating disorders: reliability of the SCOFF screening tool with written compared to oral delivery. Int J Eat Disord. 2002, 32, 466–472. [Google Scholar] [CrossRef]
- Bengtsson, M.; Ohlsson, B. The brief Visual Analogue Scale for Irritable Bowel Syndrome questionnaire can be used to evaluate psychological well-being in patients with irritable bowel syndrome. Eur J Intern Med. 2013, 24, e82-3. [Google Scholar] [CrossRef]
- Bengtsson, M.; Persson, J.; Sjölund, K.; Ohlsson, B. Further validation of the visual analogue scale for irritable bowel syndrome after use in clinical practice. Gastroenterology nursing 2013, 36, 188–198. [Google Scholar] [CrossRef]
- Algera, J.P.; Demir, D.; Törnblom, H.; Nybacka, S.; Simrén, M.; Störsrud, S. Low FODMAP diet reduces gastrointestinal symptoms in irritable bowel syndrome and clinical response could be predicted by symptom severity: A randomized crossover trial. Clin Nutr. 2022, 41, 2792–2800. [Google Scholar] [CrossRef]
- Pereyra, F.; Bustos Fernández, L.M.; Schlottmann, F.; Zamora, R.; Marconi, A.; Steinberg, L.; Pereyra, L. Prevalence of extra-intestinal symptoms according to irritable bowel syndrome subtype. Neurogastroenterol Motil. 2024, 36, e14796. [Google Scholar] [CrossRef] [PubMed]
- Nilholm, C.; Larsson, E.; Roth, B.; Gustafsson, R.; Ohlsson, B. Irregular Dietary Habits with a High Intake of Cereals and Sweets Are Associated with More Severe Gastrointestinal Symptoms in IBS Patients. Nutrients. 2019, 11. [Google Scholar] [CrossRef]
- Torices, L.; Zamfir-Taranu, A.; Esteban-Blanco, C.; Bozzarelli, I.; Bonfiglio, F.; D'Amato, M. Human CAZyme genes polymorphism and risk of IBS: a population-based study. Gut, 2024; gutjnl-2024-333056. [Google Scholar]
- Ng, Q.X.; Yau, C.E.; Yaow, C.Y.L.; Chong, R.I.H.; Chong, N.Z.; Teoh, S.E.; Lim, Y.L.; Soh, A.Y.S.; Ng, W.K.; Thumboo, J. What Has Longitudinal 'Omics' Studies Taught Us about Irritable Bowel Syndrome? A Systematic Review. Metabolites. 2023, 13, 484. [Google Scholar] [CrossRef]
- Saidi, K.; Nilholm, C.; Roth, B.; Ohlsson, B. A carbohydrate-restricted diet for patients with irritable bowel syndrome lowers serum C-peptide, insulin, and leptin without any correlation with symptom reduction. Nutr Res. 2021, 86, 23–36. [Google Scholar] [CrossRef]
- El-Salhy, M.; Gundersen, D. Diet in irritable bowel syndrome. Nutr J. 2015, 14, 36. [Google Scholar] [CrossRef]
- Bek, S.; Teo, Y.N.; Tan, X.H.; Fan, K.H.R.; Siah, K.T.H. Association between irritable bowel syndrome and micronutrients: A systematic review. J Gastroenterol Hepatol. 2022, 37, 1485–1497. [Google Scholar] [CrossRef]
- Luger, M.; Lafontan, M.; Bes-Rastrollo, M.; Winzer, E.; Yumuk, V.; Farpour-Lambert, N. Sugar-Sweetened Beverages and Weight Gain in Children and Adults: A Systematic Review from 2013 to 2015 and a Comparison with Previous Studies. Obes Facts. 2017, 10, 674–693. [Google Scholar] [CrossRef] [PubMed]
- Garcia, M.M.; Corrales, P.; Huerta, M.Á.; Czachorowski, M.J.; López-Miranda, V.; Medina-Gómez, G.; Cobos, E.J.; Goicoechea, C.; Molina-Álvarez, M. Adults with excess weight or obesity, but not with overweight, report greater pain intensities than individuals with normal weight: a systematic review and meta-analysis. Front Endocrinol (Lausanne). 2024, 15, 1340465. [Google Scholar] [PubMed]
- Shi, X.; Deng, G.; Wen, H.; Lin, A.; Wang, H.; Zhu, L.; Mou, W.; Liu, Z.; Li, X.; Zhang, J.; Cheng, Q.; Luo, P. Role of body mass index and weight change in the risk of cancer: A systematic review and meta-analysis of 66 cohort studies. J Glob Health. 2024, 14, 04067. [Google Scholar] [CrossRef] [PubMed]
- Huang, C.; Liang, Z.; Ma, J.; Hu, D.; Yao, F.; Qin, P. Total sugar, added sugar, fructose, and sucrose intake and all-cause, cardiovascular, and cancer mortality: A systematic review and dose-response meta-analysis of prospective cohort studies. Nutrition. 2023, 111, 112032. [Google Scholar] [CrossRef] [PubMed]
- Zia, J.K.; Lenhart, A.; Yang, P.L.; Heitkemper, M.M.; Baker, J.; et al. Risk factors for abdominal pain-related disorders of gut-brain interaction in adults and children: A systematic review. Gastroenterology. 2022, 163, 995–1023. [Google Scholar] [CrossRef] [PubMed]
- Guo, Y.; Niu, K.; Momma, H.; Kobayashi, Y.; Chujo, M.; Otomo, A.; Fukudo, S.; Nagatomi, R. Irritable bowel syndrome is positively related to metabolic syndrome: A population-based cross-sectional study. PLOS One. 2014, 9, e112289. [Google Scholar] [CrossRef] [PubMed]
- Sultan, N.; Foyster, M.; Tonkovic, M.; Noon, D.; Burton-Murray, H.; Biesiekierski, J.R.; Tuck, C.J. Presence and characteristics of disordered eating and orthorexia in irritable bowel syndrome. Neurogastroenterol Motil. 2024, e14797. [Google Scholar] [CrossRef] [PubMed]
- Whelan, K.; Staudacher, H. Low FODMAP diet in irritable bowel syndrome: a review of recent clinical trials and meta-analyses. Curr Opin Clin Nutr Metab Care. 2022, 25, 341–347. [Google Scholar] [CrossRef]
- Staudacher, H.M.; Mahoney, S.; Canale, K.; Opie, R.S.; Loughman, A.; So, D.; Beswick, L.; Hair, C.; Jacka, F.N. Clinical trial: A Mediterranean diet is feasible and improves gastrointestinal and psychological symptoms in irritable bowel syndrome. Aliment Pharmacol Ther. 2024, 59, 492–503. [Google Scholar] [CrossRef]
Figure 1.
Responder rates given in percentage and calculated as intention-to-treat with A) ≥50 decrease of total IBS-SSS score, B) ≥100 decrease of total IBS-SSS score, and C) ≥50% decrease of total IBS-SSS score. SSRD = starch- and sucrose-reduced diet with 72 patients at week 2 and 4 and 53 at month 6, out of 77. Low FODMAP = low content of fermentable oligo-, di-, and monosaccharides and polyols with 72 patients at week 2 and 4 and 49 at month 6. Fisher´s exact test. P≤0.05 was considered statistically significant.
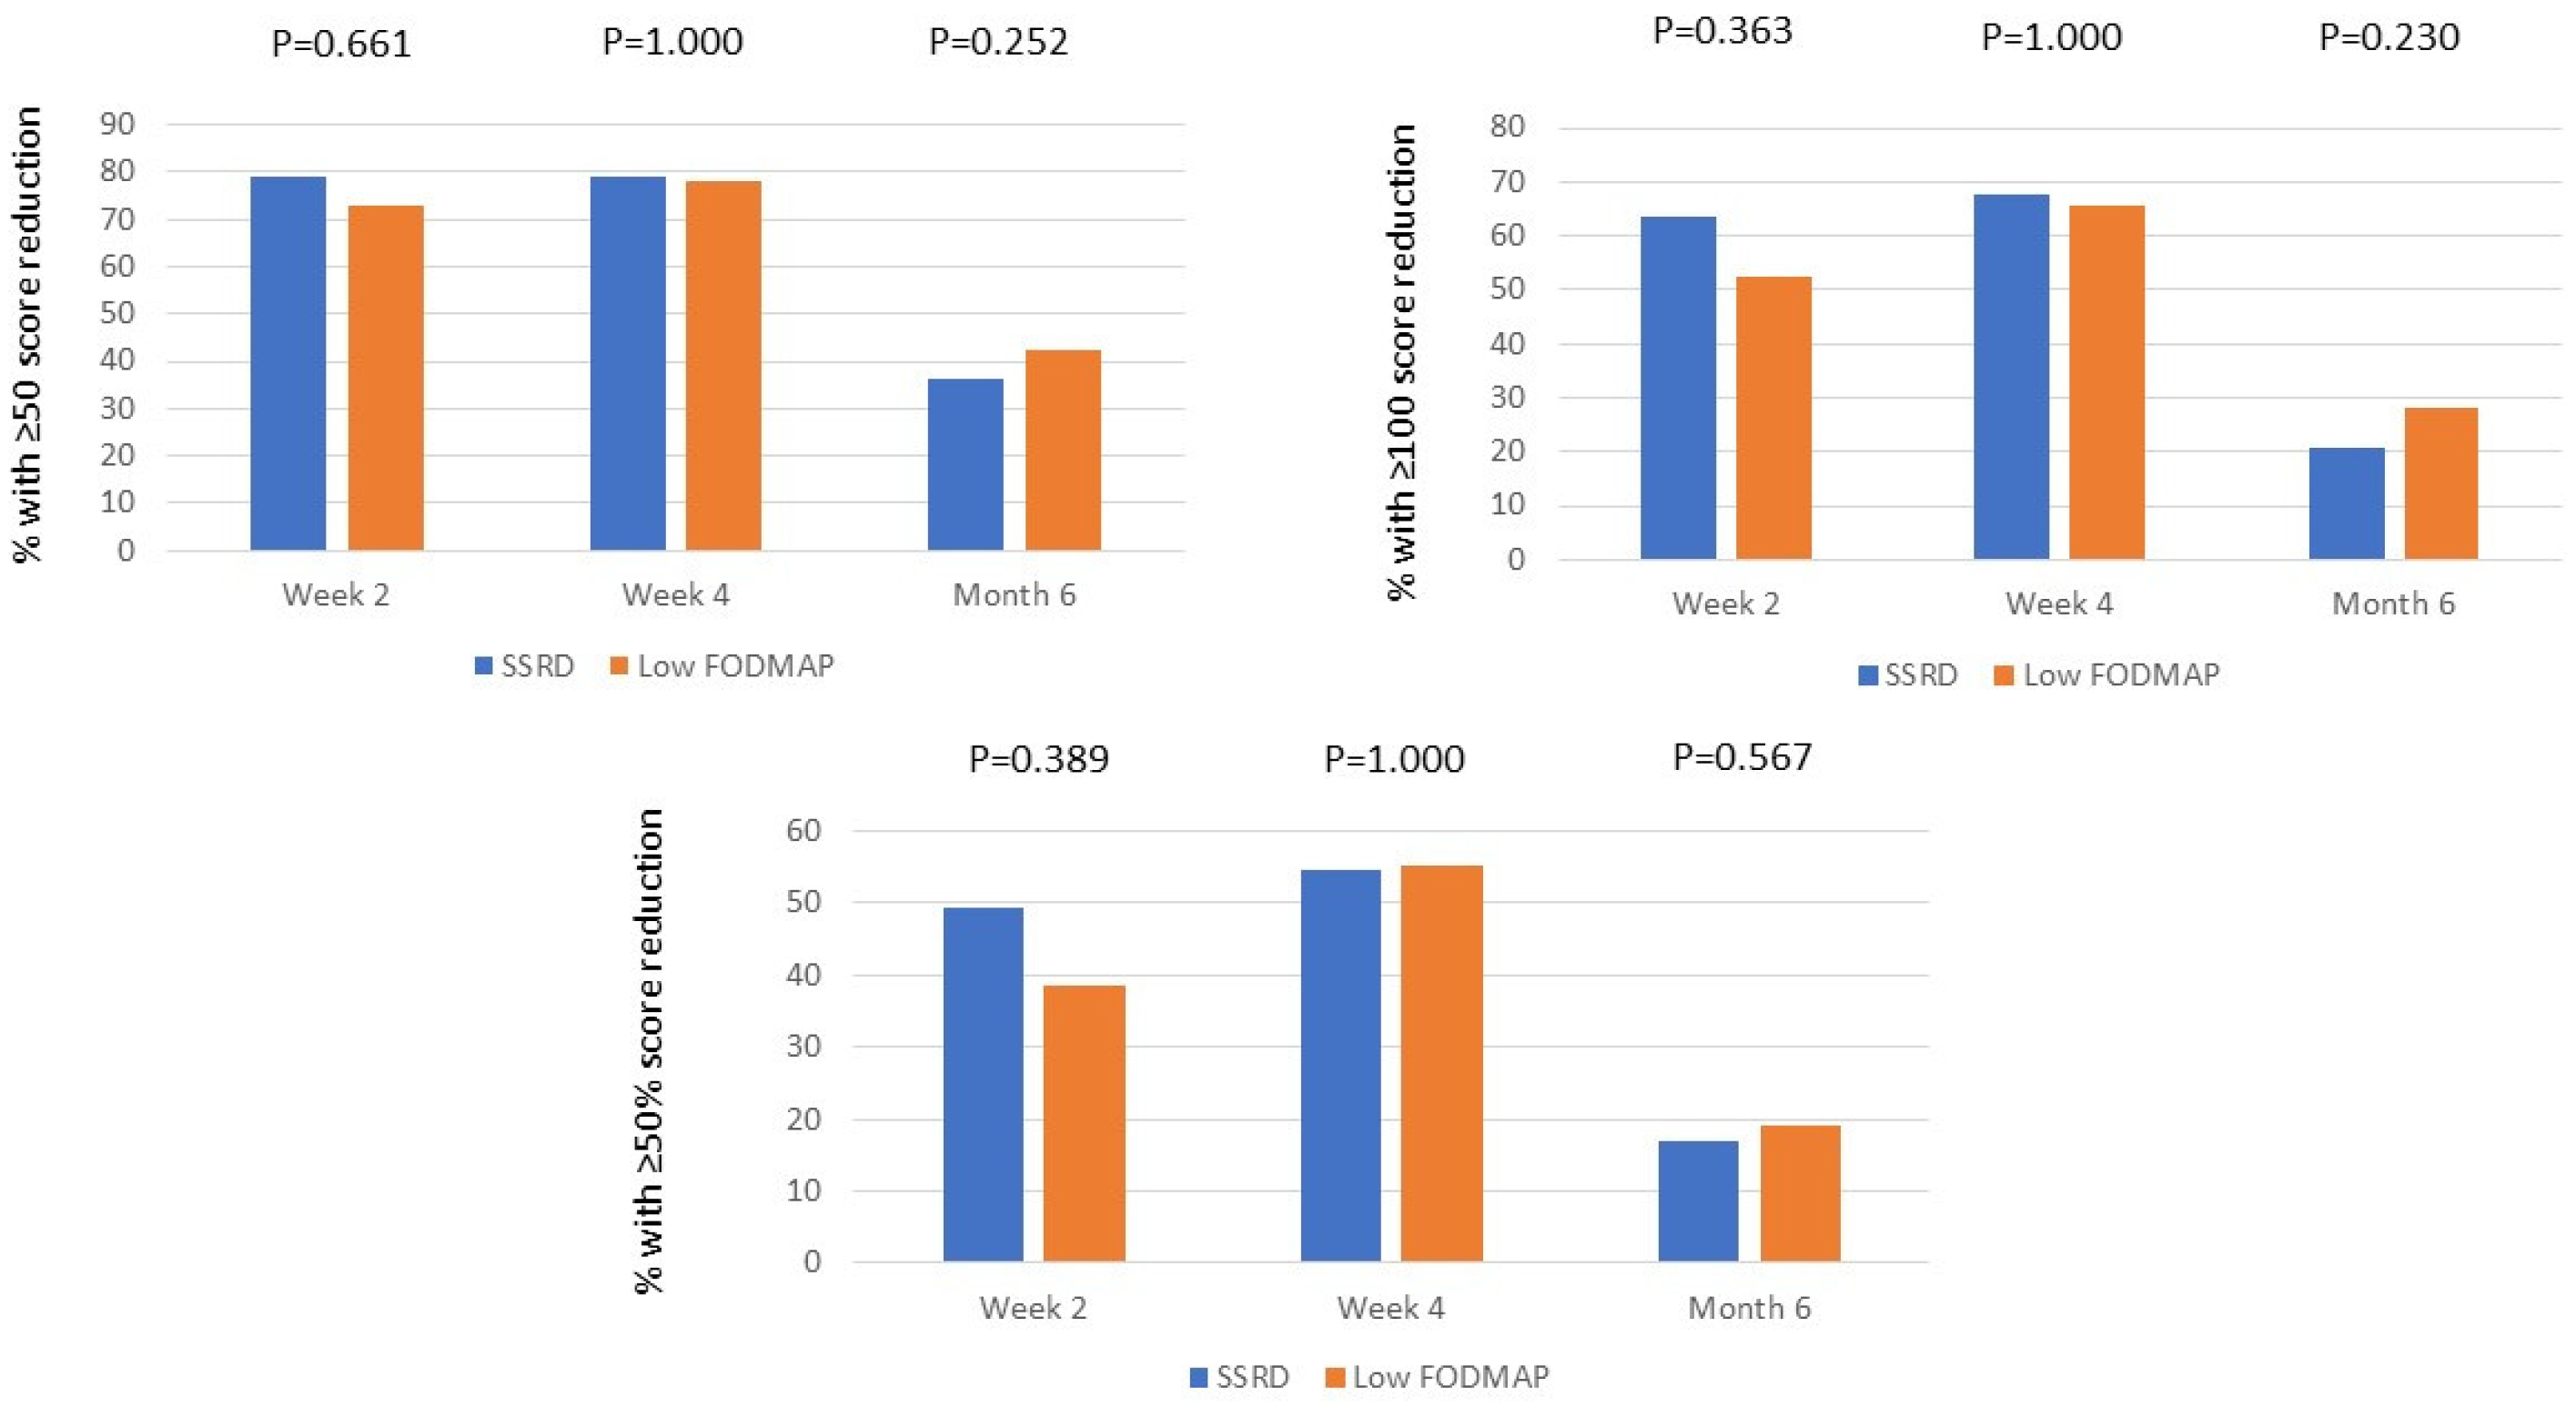
Figure 2.
The differences in weight (kg) between 6 months and baseline in the group with starch-and sucrose-reduced diet (SSRD) divided into non-responders and responders with A) ≥50 decrease of total IBS-SSS score (n=28) and B) ≥50% decrease of total IBS-SSS score (n=13). Median and interquartile range are given. Mann Whitney U-test. P≤0.05 was considered statistically significant.
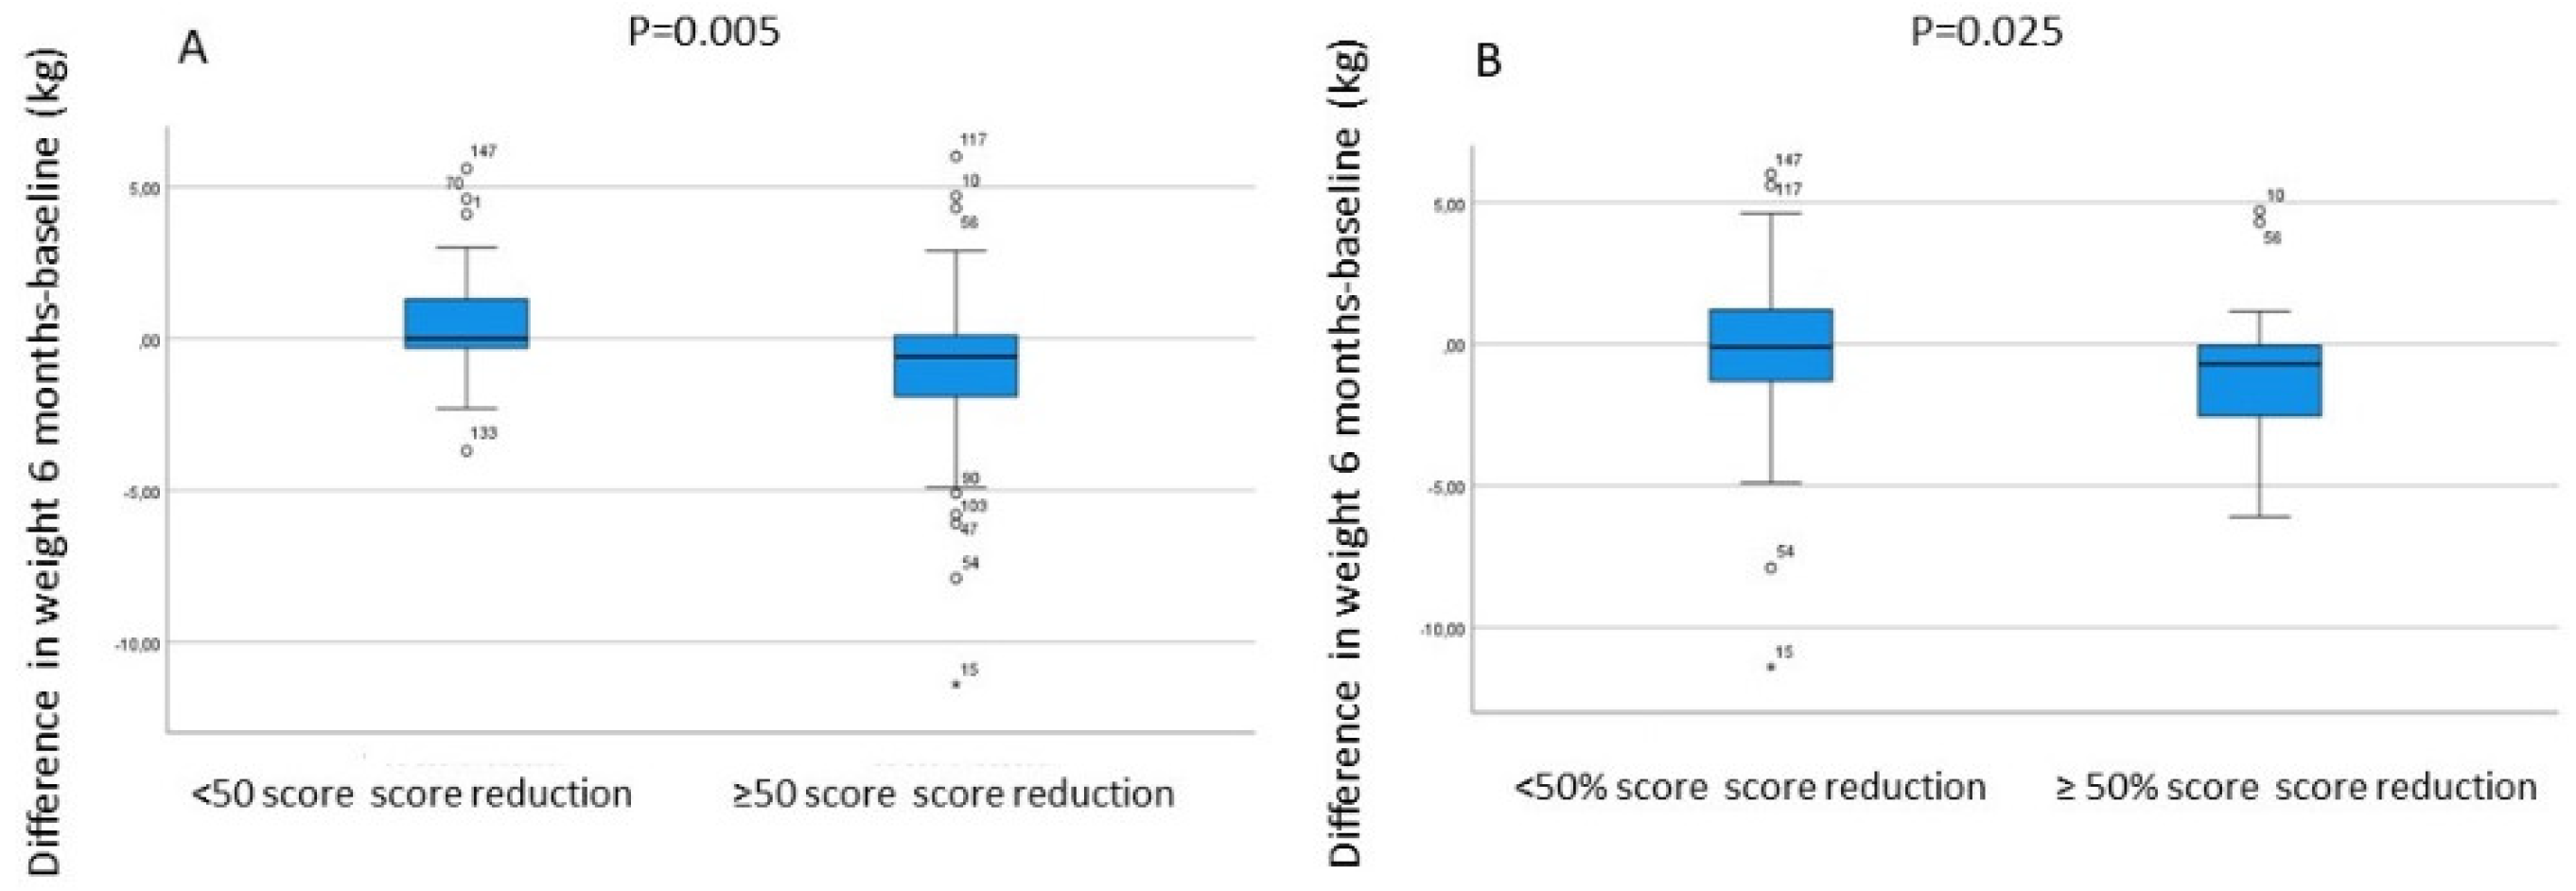

Table 1.
Basal characteristics.
| Parameters | SSRD N = 77 |
Low FODMAP N = 78 |
P-value |
|---|---|---|---|
| Age (year) | 41.0 (29.5-53.0) | 43.0 (33.8-56.0) | 0.227 |
| Gender (male/female) (n,%) | 15 (19.5)/62 (80.5) | 10 (12.8)/68 (87.2) | 0.283 |
| Weight (kg) | 71.5 (63.6-82.8) | 68.6 (63.0-83.4) | 0.389 |
| BMI (kg/m2) | 25.1 (22.6-28.4) | 24.7 (22.1-27.6) | 0.479 |
| Disease duration (year) | 16 (7-27) | 20 (10-30) | 0.261 |
| Education (n,%) | 0.585 | ||
| Primary school | 5 (6.5) | 2 (2.6) | |
| Secondary school | 10 (13.0) | 13 (16.7) | |
| Education after secondary school | 20 (26.0) | 17 (21.8) | |
| Examination at university | 42 (54.5) | 46 (59.0) | |
| Occupation (n,%) | 0.963 | ||
| Working full time | 48 (62.3) | 46 (59.0) | |
| Working 99-51% | 6 (7.8) | 9 (11.5) | |
| Working 50% | 1 (1.3) | 1 (1.3) | |
| Studying | 10 (13.0) | 10 (12.8) | |
| Sick leave | 3 (3.9) | 2 (2.6) | |
| Unemployment | 3 (3.9) | 2 (2.6) | |
| Retirement | 6 (7.8) | 8 (10.3) | |
| Marital status (n,%) | 0.837 | ||
| Living alone | 16 (20.8) | 14 (17.9) | |
| Living together | 55 (71.4) | 56 (71.8) | |
| Other | 6 (7.8) | 8 (10.3) | |
| Smoking (n,%) | 0.086 | ||
| Never | 42 (54.5) | 43 (55.1) | |
| Former | 26 (33.8) | 28 (35.9) | |
| Present un regular | 2 (2.6) | 6 (7.7) | |
| Present regular | 7 (9.1) | 1 (1.3) | |
|
Alcohol intake for 1 week (standard glass) (n,%) Missing |
1 | 1.000 | |
| < 1 | 34 (44.2) | 33 (42.3) | |
| 1-4 | 28 (36.4) | 29 (37.2) | |
| 5-9 | 13 (16.9) | 13 (16.7) | |
| 10-14 | 1 (1.3) | 2 (2.6) | |
| ≥15 | 1 (1.3) | 0 | |
|
Physical activity for 1 week (n,%) Missing |
1 | 0.475 | |
| No time | 10 (13.0) | 8 (10.4) | |
| <30 min | 11 (14.3) | 14 (18.2) | |
| 30-60 min | 16 (20.8) | 14 (18.2 | |
| 60-90 min | 8 (10.4) | 16 (20.8) | |
| 90-120 min | 8 (10.4) | 8 (10.4) | |
| >120 min | 24 (31.2) | 17 (22.1) |
SSRD = starch-and sucrose-reduced diet. Low FODMAP = low content of fermentable oligo-, di-, and monosaccharides and polyols. Physical activity means activity that leads to short of breath. Values are given as number and percentages or median and interquartile values. Fisher´s exact test and Mann-Whitney U test. P≤0.05 was considered statistically significant.
Table 2.
Gastrointestinal symptoms before, during and after the dietary intervention.
| SSRD N = 77 |
Low FODMAP N = 78 |
P-value* | |||||
|---|---|---|---|---|---|---|---|
| VAS-IBS (mm) | Value | P-value | Difference | Value | P-value | Difference | |
| Abdominal pain 5 (1–13) | |||||||
| Baseline | 47(28-64) | - | - | 50(32-65) | - | - | 0.368 |
| 2 weeks | 17(8-30) | <0.001 | -27(-47-(-9)) | 22(13-40) | <0.001 | -19(-36-(-3)) | 0.252 |
| 4 weeks | 16(0-31) | <0.001 | -24(-44-(-9)) | 13(0-27) | <0.001 | -30(-53-(-8)) | 0.425 |
| 6 months | 32(19-63) | 0.003 | -6(-28-3) | 30(16-54) | <0.001 | -16(-38-4) | 0.270 |
| Diarrhea 3 (0–10) | |||||||
| Baseline | 53(19-73) | - | - | 37(4-74) | - | - | 0.245 |
| 2 weeks | 15(4-48) | <0.001 | -14(-51-0) | 10(0-37) | <0.001 | -14(-38-0) | 0.793 |
| 4 weeks | 17(3-39) | <0.001 | -8(-48-2) | 8(0-24) | <0.001 | -16(-53-0) | 0.633 |
| 6 months | 31(8-68) | <0.001 | -12(-39-0) | 11(3-44) | 0.008 | -8(-30-7) | 0.457 |
| Constipation 6 (2–16) | |||||||
| Baseline | 53(6-72) | - | - | 54(10-76) | - | - | 0.439 |
| 2 weeks | 16(2-50) | <0.001 | -12(-36-2) | 20(0-68) | 0.02 | -6(-28-4) | 0.510 |
| 4 weeks | 16(2-43) | <0.001 | -8(-46-0) | 21(0-55) | <0.001 | -13(-33-0) | 0.815 |
| 6 months | 22(0-61) | 0.121 | -3(-24-12) | 42(2-70) | 0.022 | -4(-32-3) | 0.528 |
|
Bloating and flatulence 10 (2–23) |
|||||||
| Baseline | 73(58-88) | - | - | 73(54-86) | - | - | 0.677 |
| 2 weeks | 34(18-53) | <0.001 | -37(-53-(-9)) | 23(13-50) | <0.001 | -39(-56-(-16)) | 0.469 |
| 4 weeks | 24(10-54) | <0.001 | -43(-63-(-11) | 19(8-50) | <0.001 | -44(-61-(-25)) | 0.359 |
| 6 months | 62(30-75) | 0.002 | -15(-38-14) | 56(33-70) | <0.001 | -18(-33-(-3)) | 0.416 |
|
Vomiting and nausea 2 (0–4) |
|||||||
| Baseline | 13(2-34) | - | - | 13(1-36) | - | - | 0.957 |
| 2 weeks | 6(0-12) | <0.001 | -7(-20-0) | 4(0-12) | <0.001 | -7(-22-0) | 0.773 |
| 4 weeks | 3(0-12) | <0.001 | -6(-15-0) | 0(0-11) | <0.001 | -7(-21-0) | 0.743 |
| 6 months | 8(1-21) | 0.002 | -4(-14-1) | 5(0-21) | 0.009 | -2(-17-1) | 0.892 |
|
Intestinal symptom´s influence on daily life 2 (0–14) |
|||||||
| Baseline | 74(57-84) | - | - | 70(54-84) | - | - | 0.694 |
| 2 weeks | 29(15-60) | <0.001 | -36(-52-(-11)) | 30(17-60) | <0.001 | -28(-50-(-15)) | 0.688 |
| 4 weeks | 24(12-62) | <0.001 | -30(-60-(-10)) | 22(10-50) | <0.001 | -33(-53-(-18)) | 0.593 |
| 6 months | 40(23-76) | <0.001 | -12(-45-0) | 48(24-68) | <0.001 | -26(-43-(-2)) | 0.492 |
|
Psychological well-being 5 (2–15) |
|||||||
| Baseline | 39(15-65) | - | - | 45(16-59) | - | - | 0.708 |
| 2 weeks | 24(11-42) | <0.001 | -7(-26-0) | 27(8-46) | 0.021 | -4(-25-5) | 0.339 |
| 4 weeks | 20(5-32) | <0.001 | -12(-29-(-2) | 18(2-34) | <0.001 | -13(-32-1) | 0.788 |
| 6 months | 22(11-50) | 0.009 | -6(-20-4) | 26(8-39) | 0.043 | -2(-30-7) | 0.911 |
| IBS-SSS | |||||||
| Total IBS-SSS | |||||||
| Baseline | 301(233-348) | - | - | 300(238-360) | - | - | 0.845 |
| 2 weeks | 136(87-223) | <0.001 | -138(-212-(-82)) | 151(100-232) | <0.001 | -110(-188-(-68)) | 0.310 |
| 4 weeks | 119(66-230) | <0.001 | -146(-240-(-88)) | 116(63-176) | <0.001 | -153(-231-(-90)) | 0.585 |
| 6 months | 204(146-234) | <0.001 | -55(-130-4) | 220(144-301) | <0.001 | -93(-181-(-20)) | 0.069 |
SSRD = starch-and sucrose-reduced diet. Low FODMAP = low content of fermentable oligo-, di-, and monosaccharides and polyols. Gastrointestinal symptoms estimated by irritable bowel syndrome -severity scoring system (IBS-SSS) [13] and visual analog scale for irritable bowel syndrome (VAS-IBS) [14]. Reference values for healthy within brackets [22]. Values are given as median and interquartile. Wilcoxon Signed Ranks for comparisons within the groups and Mann-Whitney U test* for comparison between baseline and the differences of the two groups. P≤0.05 was considered statistically significant.
Table 3.
IBS categorization.
| SSRD | P-value* | Low FODMAP | P-value* | P-value** | |
|---|---|---|---|---|---|
| Baseline | N=77 | N=78 | 0.078 | ||
| IBS-C | 14 (18.2) | 12 (15.4) | |||
| IBS-D | 29 (37.7) | 15 (19.2) | |||
| IBS-M | 22 (28.6) | 32 (41.0) | |||
| IBS-U | 2 (2.6) | 5 (6.4) | |||
| FBD | 10 (13.0) | 14 (17.9) | |||
| Week 4 | 0.621 | ||||
| IBS-C | 8 (10.4) | 10 (12.8) | |||
| IBS-D | 8 (10.4) | 7 (9.0) | |||
| IBS-M | 14 (18.2) | 9 (11.5) | |||
| IBS-U | 0 | 2 (2.6) | |||
| FBD | 23 (29.9) | 25 (32.1) | |||
| Healthy | 19 (24.7) | 19 (24.4) | |||
| Missing | 5 (6.5) | <0.001 | 6 (7.7) | <0.001 | |
| Month 6 | 0.198 | ||||
| IBS-C | 6 (7.8) | 11 (14.1) | |||
| IBS-D | 8 (10.4) | 6 (7.7) | |||
| IBS-M | 12 (15.6) | 9 (11.5) | |||
| IBS-U | 1 (1.3) | 3 (3.8) | |||
| FBD | 23 (29.9) | 13 (16.7) | |||
| Healthy | 3 (3.9) | 7 (9.0) | |||
| Missing | 24 (31.2) | <0.001 | 29 (37.2) | 0.046 |
SSRD = starch-and sucrose-reduced diet. Low FODMAP = low content of fermentable oligo-, di-, and monosaccharides and polyols. IBS-C = constipation-predominated IBS, IBS-D = diarrhea-predominated IBS, IBS-M = mixed IBS, IBS-U = unspecified IBS according to Rome IV questionnaire.12 Healthy was defined as <75 in total IBS-SSS.13 Unspecific functional bowel disorder (FBD) means at baseline the presence of abdominal pain weekly but with weak association with bowel habits. After 4 weeks and 6 months, FBD represent those with abdominal pain 2-3 times or less/month, but with total IBS-SSS > 75. Values are given as number and percentages. Fisher´s exact test. *=comparisons within the group between baseline and week 4 and month 6. **=comparisons between the groups. P≤0.05 was considered statistically significant.
Table 4.
Extraintestinal symptoms before, during and after the dietary intervention.
| SSRD N = 77 |
Low FODMAP N = 78 |
P-value* | |||||
|---|---|---|---|---|---|---|---|
| Extraintestinal IBS-SSS | Value | P-value | Difference | Value | P-value | Difference | |
| Difficulties to eat a whole meal | |||||||
| Baseline | 10(2-26) | - | - | 6(0-22) | - | - | 0.267 |
| 2 weeks | 4(0-12) | 0.002 | -3(-13-3) | 3(0-13) | 0.005 | -2(-11-0) | 0.951 |
| 4 weeks | 2(0-13) | <0.001 | -4(-16-1) | 0(0-9) | <0.001 | -3(-12-0) | 0.629 |
| 6 months | 4(0-14) | 0.074 | -2(-13-4) | 2(0-18) | 0.053 | -1(-10-0) | 0.940 |
| Headache | |||||||
| Baseline | 33(10-66) | - | - | 27(9-58) | - | - | 0.737 |
| 2 weeks | 14(5-36) | <0.001 | -5(-30-2) | 15(2-47) | <0.001 | -6(-22-0) | 0.993 |
| 4 weeks | 14(2-32) | <0.001 | -9(-27-2) | 12(0-35) | <0.001 | -9(-31-0) | 0.855 |
| 6 months | 24(10-55) | 0.185 | -1(-21-8) | 20(4-50) | 0.001 | -4(-21-2) | 0.324 |
| Back pain | |||||||
| Baseline | 20(4-50) | - | - | 28(4-65) | - | - | 0.395 |
| 2 weeks | 6(0-29) | <0.001 | -6(-21-0) | 14(0-39) | <0.001 | -2(-26-2) | 0.409 |
| 4 weeks | 6(0-30) | <0.001 | -7(-22-0) | 4(0-35) | <0.001 | -7(-32-0) | 0.998 |
| 6 months | 23(4-58) | 0.157 | -4(-18-8) | 24(4-70) | 0.675 | 0(-14-12) | 0.501 |
| Fatigue | |||||||
| Baseline | 57(30-81) | - | - | 74(48-84) | - | - | 0.055 |
| 2 weeks | 33(16-68) | <0.001 | -14(-27-0) | 47(19-70) | <0.001 | -12(-32-0) | 0.660 |
| 4 weeks | 27(9-56) | <0.001 | -18 (-32-(-2)) | 37(14-60) | <0.001 | -19(-38-(-3)) | 0.712 |
| 6 months | 49(18-68) | 0.004 | -7(-20-4) | 48(19-69) | <0.001 | -13(-27-0) | 0.128 |
| Belching/excess wind | |||||||
| Baseline | 72(48-85) | - | - | 75(52-87) | - | - | 0.621 |
| 2 weeks | 24(10-66) | <0.001 | -21(-51-(-6)) | 37(14-66) | <0.001 | -23(-44-(-6)) | 0.804 |
| 4 weeks | 14(6-40) | <0.001 | -41(-67-(-6)) | 21(8-45) | <0.001 | -41(-59-(-19)) | 0.878 |
| 6 months | 47(20-68) | <0.001 | -13(-33-(-2)) | 48(22-70) | <0.001 | -15(-37-(-2)) | 0.599 |
| Reflux | |||||||
| Baseline | 20(7-50) | - | - | 20(2-60) | - | - | 0.678 |
| 2 weeks | 5(0-18) | <0.001 | -12(-27-0) | 7(0-35) | <0.001 | -6(-30-0) | 0.274 |
| 4 weeks | 4(0-20) | <0.001 | -12(-28-0) | 3(0-26) | <0.001 | -10(-30-0) | 0.945 |
| 6 months | 11(4-26) | 0.002 | -6(-20-2) | 21(2-54) | 0.013 | -3(-18-2) | 0.727 |
| Urinary urgency | |||||||
| Baseline | 14(2-64) | - | - | 22(4-64) | - | - | 0.491 |
| 2 weeks | 7(0-24) | <0.001 | -7(-24-0) | 7(0-33) | <0.001 | -8(-29-0) | 0.598 |
| 4 weeks | 4(0-23) | <0.001 | -6(-34-0) | 3(0-22) | <0.001 | -13(-44-0) | 0.290 |
| 6 months | 18(0-44) | 0.003 | -7(-22-1) | 16(0-53) | 0.003 | -7(-19-0) | 0.975 |
| Leg pain | |||||||
| Baseline | 2(0-9) | - | - | 0(0-18) | - | - | 0.995 |
| 2 weeks | 1(0-15) | 0.281 | 0(-4-2) | 0(0-10) | 0.036 | 0(-3-0) | 0.776 |
| 4 weeks | 0(0-7) | 0.024 | 0(-4-0) | 0(0-5) | 0.005 | 0(-4-0) | 0.564 |
| 6 months | 2(0-12) | 0.774 | 0(-2-2) | 0(0-14) | 0.573 | 0(-2-2) | 0.682 |
| Muscle/joint pain | |||||||
| Baseline | 25(5-56) | - | - | 30(4-72) | - | - | 0.506 |
| 2 weeks | 11(0-46) | 0.002 | -5(-20-1) | 18(0-57) | 0.014 | -1(-20-4) | 0.616 |
| 4 weeks | 13(0-30) | <0.001 | -10(-27-0) | 12(0-39) | <0.001 | -3(-35-1) | 0.699 |
| 6 months | 23(5-53) | 0.032 | -3(-17-4) | 19(4-70) | 0.084 | -2(-18-7) | 0.755 |
| Total extraintestinal IBS-SSS | |||||||
| Baseline | 160(110-208) | - | - | 172(120-242) | - | - | 0.268 |
| 2 weeks | 96(50-154) | <0.001 | -60(-89-(-20)) | 115(55-156) | <0.001 | -54(-82-(-30)) | 0.852 |
| 4 weeks | 91(28-140) | <0.001 | -72(-112-(-41)) | 77(44-136) | <0.001 | -83(-118-(-44)) | 0.408 |
| 6 months | 127(71-191) | <0.001 | -44(-75-2) | 133(78-214) | <0.001 | -36(-59-(-10)) | 0.977 |
SSRD = starch-and sucrose-reduced diet. Low FODMAP = low content of fermentable oligo-, di-, and monosaccharides and polyols. Symptoms estimated by irritable bowel syndrome -severity scoring system (IBS-SSS) [13]. Values are given as median and interquartile. Wilcoxon Signed Ranks for comparisons within the groups and Mann-Whitney U test* for comparison between baseline and the differences of the two groups. P≤0.05 was considered statistically significant.
Table 5.
Anthropometric data.
| SSRD N = 77 |
Low FODMAP N = 78 |
P-value* | |||||
|---|---|---|---|---|---|---|---|
| Variables | Value | P-value | Difference | Value | P-value | Difference | |
| Weight (kg) | |||||||
| Baseline | 71.5(63.6-82.8) | - | - | 68.6(63-83.4) | - | - | 0.513 |
| 4 weeks | 70(63.2-81) | <0.001 | -1.6(-2.4-(-0.4)) | 67.8(62.5-82.7) | <0.001 | -0.8(-1.6-(-0.1)) | 0.006 |
| 6 months | 74.1(66.6-85.7) | 0.516 | -0.2(-1.4-1.2) | 68.6(62.8-80.8) | 0.079 | -0.3(-1.6-0.6) | 0.438 |
| BMI (kg/m2) | |||||||
| Baseline | 25.14(22.64-28.45) | - | - | 24.68(22.13-27.64) | - | - | 0.538 |
| 4 weeks | 24.8(21.97-27.6) | <0.001 | -0.55(-0.86-(-0.15)) | 24.63(22-27.32) | <0.001 | -0.26(-0.56-(-0.03)) | 0.005 |
| 6 months | 25.95(22.66-28.57) | 0.504 | -0.07(-0.53-0.44) | 25.08(22.05-26.76) | 0.089 | -0.11(-0.54-0.23) | 0.526 |
| Waist circumference (cm) | |||||||
| Baseline | 88(76-97) | - | - | 86(79-94.8) | - | - | 0.831 |
| 4 weeks | 86(75-94) | <0.001 | -2(-4-0) | 85(79-93) | <0.001 | -2(-3-1) | 0.981 |
| 6 months | 89(77.5-97) | 0.022 | -1(-4-1) | 85.5(80-93.5) | 0.038 | -1(-3-1) | 0.758 |
| Systolic Blood Pressure (mmHg) | |||||||
| Baseline | 125(114-139) | 126(116-139) | 0.657 | ||||
| 4 weeks | 123(114-135) | 0.097 | -2(-10-6) | 124(113-135) | 0.024 | -3(-8-3) | 0.762 |
| 6 months | 127(116-138) | 0.588 | -1(-7-6) | 126(117-136) | 0.138 | -3(-12-8) | 0.399 |
| Diastolic Blood Pressure (mmHg) | |||||||
| Baseline | 81(72-88) | 81(74-90) | 0.403 | ||||
| 4 weeks | 78(70-84) | 0.006 | -3(-6-3) | 80(73-85) | <0.001 | -4(-8-2) | 0.225 |
| 6 months | 80(76-86) | 0.575 | -2(-6-5) | 80(72-86) | 0.044 | -1(-10-3) | 0.190 |
| Sugar craving (mm) | |||||||
| Baseline | 66(40-85) | - | - | 60(29-80) | - | - | 0.384 |
| 4 weeks | 34(17-67) | <0.001 | -15(-41-0) | 41(22-69) | 0.001 | -8(-23-5) | 0.050 |
| 6 months | 53(31-72) | 0.058 | -7(-23-10) | 48(28-72) | 0.246 | -2(-10-8) | 0.448 |
|
Saturation (mm) |
|||||||
| Baseline | 74(52-93) | - | - | 77(68-86) | - | - | 0.833 |
| 4 weeks | 83(69-93) | 0.107 | 4(-12-24) | 80(62-90) | 0.688 | 1(-10-12) | 0.261 |
| 6 months | 77(69-90) | 0.473 | 0(-12-16) | 72(62-87) | 0.464 | -2(-13-16) | 0.275 |
BMI = body mass index. SSRD = starch-and sucrose-reduced diet. Low FODMAP = low content of fermentable oligo-, di-, and monosaccharides and polyols. Sugar craving and saturation estimated on visual analog scales of 100 mm, with higher scores meaning most craving and saturation. Values are given as median and interquartile. Wilcoxon Signed Ranks for comparisons within the groups and Mann-Whitney U test* for comparison between baseline and the differences of the two groups. P≤0.05 was considered statistically significant.
Disclaimer/Publisher’s Note: The statements, opinions and data contained in all publications are solely those of the individual author(s) and contributor(s) and not of MDPI and/or the editor(s). MDPI and/or the editor(s) disclaim responsibility for any injury to people or property resulting from any ideas, methods, instructions or products referred to in the content. |
© 2024 by the authors. Licensee MDPI, Basel, Switzerland. This article is an open access article distributed under the terms and conditions of the Creative Commons Attribution (CC BY) license (http://creativecommons.org/licenses/by/4.0/).
Copyright: This open access article is published under a Creative Commons CC BY 4.0 license, which permit the free download, distribution, and reuse, provided that the author and preprint are cited in any reuse.


