Submitted:
04 August 2024
Posted:
07 August 2024
Read the latest preprint version here
Abstract
In the present research, it has been tried to use the applied research bases in the field of business management with marketing orientation. Since there were wide and diverse spectrum in the field of economic activities in Isfahan province and Isfahan city, the model of economic sectors was used to categorize these activities. In this regard, the specific goals of the research in all five sectors of the model of economic sectors, drawing and prioritizing the components (in-dices) of the 7P marketing mix model in each of these economic sectors by the related individuals and members of subgroups of guilds and non-governmental organizations in Isfahan province, have been formed, specified and determined. Collecting data for processing and answer the question of this research, after designing a questionnaire in accordance with the AHP model standard, by spending a period of 2 months from September 2022 and ended in November 2022 , from the statistical population has been done.
Keywords:
marketing mix (7P)
; economic sectors model
; Hierarchical Analysis Process Model (AHP)
; target market
1. Introduction
The practice of marketing involves developing an institute’s products or services to meet the identified needs and desires of a specific target market. This includes implementing appropriate pricing strategies, communication tactics, and sales techniques to educate, incentivize, and cater to the identified market segments. Also the marketing involves the strategic management of inventory and distribution to meet consumer demand with appropriate product or service offerings at the optimal time and place, while also maximizing customer satisfaction through the organization’s activities. [1]. McCarthy and et al, suggest that the target market and the marketing mix are determined by the marketing strategy. This plan outlines the overall approach the company will take in the market. It consists of two interconnected components: 1- Target market and 2- Marketing mix [2]. The target market refers to a cohesive group of customers whom the company aims to appeal to. Businesses should create marketing plans that are tailored to the needs of consumer groups in order to target the most lucrative segments of the market. The principal measures in creating this analysis involve: 1-market segmentation, 2-market targeting, and 3-positioning [2].
The marketing mix comprises a set of variables observed by a company to effectively address the needs and preferences of a specific target group [2]. In 1946, Neil Borden’s publication of the marketing mix concept in his article led to widespread adoption and popularity of the marketing mix theory within academic circles. The marketing mix framework is an accessible and effective tool that facilitates the segregation of marketing functions from other organizational activities, allowing for specialized delegation of marketing tasks to experts in the field. The elements comprising the marketing mix exert influence on a company’s competitive standing in the marketplace. Therefore, it holds significant potency. Hence, serves dual functions, wherein it plays a communicative role as well as an operational role. The communication function is a vital necessity in conveying to users the significance of services in meeting their needs or preferences. The operational function is directed towards the elimination of barriers in transactions or exchanges in order to facilitate the seamless entry of service users into the exchange process with minimal attempt [3].
The Analytic Hierarchy Process (AHP) was developed by Thomas L. Saaty during the 1970s. Since its inception, AHP has been widely utilized in various research studies to facilitate decision-making processes in complex situations and scenarios. The utilization of the Analytical Hierarchy Process (AHP) commences by decomposing a problem into a hierarchical structure of criteria, facilitating analysis and independent comparison. After establishing the logical hierarchy, decision makers can proceed to systematically evaluate the alternatives by conducting pairwise comparisons for each of the chosen criteria [3]. AHP provides a straightforward method for resolving complicated and ambiguous issues, specifically those that defy complete quantitative analysis. Instead of prescribing the right choice, the AHP assists decision makers in finding the most suitable decision that aligns with their objectives and their comprehension of the issue at hand. The aforementioned method offers a comprehensive and rational framework for organizing decision-making processes, as well as for quantifying and representing the various components of a decision problem. This approach also facilitates the alignment of these components with overarching objectives, and enables the assessment of alternative solutions. Furthermore, the fuzzy comprehensive evaluation method is a synthetic assessment approach that leverages fuzzy mathematical principles to evaluate phenomena impacted by a multitude of factors [4].
Up until the 1950s, different areas of the economy showed limited growth within specific geographic boundaries. The shift in society’s structure marked the move towards the third industrial revolution, or Industry 3.0. This signals a move towards active growth and development. The International Standard Industrial Classification (ISIC) was established by the United Nations in 1958 and has since undergone multiple revisions in 1968, 1989, 2002, and 2008. The three predominant economic sectors encompassing their core activities include: (1) The primary sector, comprising agriculture and natural resource extraction; (2) The industrial and construction sectors collectively constituting the secondary sector; and (3) The tertiary sector, encompassing trade and various service-based activities. Since the 1960s, there has been criticism that the three-model economic sectors are too narrowly defined. In 1961, Jean Gottman was the first to suggest the division of the tertiary sector into tertiary and quaternary sectors. The late 1960s sparked a new conversation in the industry: the emergence of the “Q-Sectors” which encompassed the Quaternary and Quinary sectors of the economy. In 1969, Dean proposed the inclusion of a new segment in the economy called the quinary sector. The government is the primary industry of the quinary sector, and it operates in both the private sector, through administrative corporations, and the voluntary sector, through NGOs and Think-Thanks [5].
Overall, the viewpoints gathered from the statistical community, comprised of professionals engaged in the realm of marketing management, have been instrumental in indicating the potential effectiveness of the marketing mix. Our findings may have implications for researchers, industrialists, companies, and organizations involved in the domestic and foreign marketing field. This research could prove valuable and impactful in various projects, particularly in the areas of resource allocation, time management, and optimal financial management.
1.1. Literature Review
1.1.1. Target Market
Marketing serves to facilitate potential transactions in order to meet the needs and desires of individuals, and has evolved as a management function through the adoption of advanced methodologies. Consumers have an expanded range of options, necessitating the implementation of innovative and assertive marketing tactics in order to maintain and augment a lucrative market share. The implementation of marketing strategies has become a requisite for the establishment of a target market, as well as for the identification of current and future market demands in order to effectively cater to customer needs [6]. Dr. Philip Kotler describes marketing as the systematic process of identifying, generating, and providing value to meet the requirements of a target market while also making a profit. Marketing discovers needs and wants that have not been met yet. It establishes, evaluates, and calculates the scope of the market under consideration and its potential for profitability. It identifies the specific customer groups that the company can serve most effectively and creates and advertises the right products and services for them (https://www.kotlermarketing.com/phil_questions.shtml/) [7]. The concept of target marketing is seen as a key principle in classical marketing. The composition consists of three separate parts. Market segmentation, targeting and positioning (STP for short) (Philip Kotler, 2007) [8]. 1-Market Segmentation: Each buyer in the market exhibits, purchasing behavior, location, financial resources and unique preferences. Market segmentation is a strategic approach utilized by companies to partition the market into smaller, more manageable segments. This enables businesses to more efficiently and effectively target these segments with products and services tailored to the distinctive needs of peerless buyers. 2-Target market: Is that a group of buyers who possess a shared need or characteristic, and are selected by a firm to be served. The target market assesses the different segments’ appeal in the market and chooses one or multiple segments to participate in. Involves the composition of market offerings in order to establish a competitive advantage with competitors, thereby eliciting an indelible impression in the minds of consumers [2]. The guiding ideology reflected in this statement emphasizes the importance of understanding the limitations and possibilities within a given context. Organizations are mandated to possess a comprehensive comprehension of consumer behavior and to deliver tailored products and services to specific target market segments, embodying a fundamental “focus” strategy [8].
1.1.2. Marketing Mix
Numerous corporations employ diverse strategies to effectively appeal to their specific consumer, thereby rendering them susceptible to engage for these tactics. At times, sellers affected in product transformation whereas at other times, they modify the exterior environment. [9]. The field of marketing is focused on establishing and maintaining mutually beneficial exchanges and relationships, with the ultimate goal of achieving optimal efficiency and effectiveness in the marketplace. Numerous frameworks, such as the marketing-mix framework and its subsequent revisions (Tukey, 1962; Neshin & Winer, 2014; Prohit et al. , 2021), have been employed in elucidating marketing-related phenomena [10]. Hung do and Anh Vu (2020), posited that the marketing mix comprises a set of strategic marketing instruments employed by organizations to elicit the desired response from their diverse target markets [11]. Neil Borden is credited with originating the concept of the marketing mix, which was first presented during his speech at the American Marketing Association in 1953. Borden (1964) elucidated the concept of the marketing mix in a formal manner in his article titled as a “The Concept of The Marketing Mix”. In the field of marketing, Jerome McCarthy (1960) was the pioneering scientist to propose the four fundamental elements of the marketing mix. Subsequently, extensive literature has observed widespread utilization of these elements [12]. The traditional mix is a “union of strategies” across four key dimensions: place, product, price, distribution and promotion. McCarthy further broadened this conceptualization by defining the marketing mix as a composite of all available elements at the disposal of a marketing manager in order to meet the needs and preferences of the target market. According to McCarthy and Perreault (1987), the marketing mix encompasses the controllable elements that a company can strategically manage to fulfill the requirements of its target market. In recent years, three additional elements, namely physical evidence, process, and people, have been integrated into the marketing mix. The valuation of each element is influenced not only by the internal factors of the company and its chosen activities, but also by external factors such as competition and the temporal progression of the market. All marketing elements are interconnected and should be evaluated collectively. The relative importance of certain items within a company is primarily determined by the organization’s strategic objectives and operational processes [1]. It is imperative to incorporate the forward-looking behavior of consumers when developing marketing-mix models. This is essential to account for the possibility that consumers may seek to maximize their payoff over a finite or infinite horizon, as opposed to having a short-term, myopic focus. The identification of these models is enhanced by increased diversity and volume of data, however, such models present computational challenges that require resolution. [13].
1.1.2.1. Product
The product plays a critical role in the overall marketing program, exerting influence on various marketing strategies. Acquiring a product extends beyond mere ownership, encompassing the fulfillment of consumer needs and desires. A product can be defined as any tangible or intangible item that is available for offering to a market with the intention of being noticed, acquired, utilized, or consumed, and is capable of satisfying a particular want or need. An alternate conceptualization of a product encompasses any entity capable of being presented to the market for the purpose of garnering attention, acquisition, utilization, or consumption. This broad definition includes intangible products, tangible goods, individual character traits, location, organizational entities, as well as ideas or intellectual concepts. [14].
1.1.2.2. Physical evidence
Rafiq and Ahmed (1995) define physical evidence as the contextual setting in which a service is rendered, as well as the tangible commodities and indicators that aid in the execution and conveyance of the service.[15]. The physical evidence component represents tangible products owned by the organization [14]. Consumers take into consideration a range of factors when evaluating their purchasing decisions, such as the availability of advanced amenities including air conditioning, state-of-the-art telecommunications technology, and superior office furnishings, among other considerations [16]. Physical evidence can encompass the tangible aspects of a business, including its employees and their associated characteristics [17].
1.1.2.3. Process
The process component pertains to the approaches and methods employed by the marketer to deliver effective and suitable customer service [14]. According to Kotler (2006), the process entails addressing the individual demands of each consumer in order to effectively serve them. Commencing from the initiation of consumer orders, the process culminates in the fulfillment of their desired products [16]. The concept of processes pertains to the various activities, methodologies, and procedures that are implemented and offered to consumers. Numerous activities may be associated with each individual process. The form and method of an organization’s operations determine the interconnectedness and coordination of the various activities within the process. The implementation of an efficient overall process is anticipated to yield high levels of customer satisfaction. Nevertheless, in order to achieve a consensus among all employees within the organization, it is important for them to share a common understanding and act cohesively towards a common goal [17].
1.1.2.4. People
The “people aspect” encompasses the individuals who are directly or indirectly involved in delivering products and services. The individuals relevant to corporate clientele are not customers, but rather the employees responsible for executing marketing initiatives. Generally, people are referred to as those who engage with potential customers [14]. Rafiq and Ahmed (1995) characterized individuals who purchase goods or services, as well as other patrons within the service setting, as “customers” [15]. In accordance with Ratih (2005;62), individuals are characterized as active agents involved in the promotion and distribution of services or products, aiming to exert influence on consumer purchasing behavior [16].
1.1.2.5. Promotion
Promotion is widely regarded as one of the most effective marketing and selling strategies to have emerged in the course of human history. It is considered the cornerstone of the marketing mix, with the potential to significantly enhance the likelihood of product purchase [18]. Utilizing all elements of the Marketing Mix, the organization’s promotional efforts are intended to influence prospective customers (7P). In essence, promotion can be understood as a form of marketing communication deployed with the intention of disseminating information, exerting influence and reinforcing awareness among the target audience regarding the company and its products with the ultimate goal of fostering acceptance, acquisition and long-term patronage [16]. The promotional variable is employed by the organization to attain its objectives and capture the intended market segment. The term pertains to the utilization of marketing communications for the purpose of disseminating information to customers and other pertinent stakeholders regarding the products or services available. Promotion encompasses a variety of different strategies and tactics, including strategic sales promotion, advertising, sales force, and public relations efforts [14].
1.1.2.6. Price
The pricing component of the marketing mix is recognized for its exceptional versatility and its ability to directly and immediately influence a company’s profitability performance [3]. Kotler and Keller (2012) assert that price is the monetary value assigned to a product or service, or the perceived value that consumers exchange for the benefits derived from owning or using said product or service [16]. The pricing component of the marketing mix is the sole contributor to revenue generation, in contrast to the other elements which incur costs. Numerous researchers regard pricing as a fundamental component of the market that serves to enhance profits and market share. The element of price is widely recognized as one of the most adaptable components within the marketing mix, capable of swiftly adjusting to shifts in the external environment [14]. In the context of commerce, price denotes the sum that consumers are required to relinquish in order to acquire a specific commodity or service, while the customary amount pertains to the monetary value. Simultaneously, the price of goods frequently exerts a significant influence on consumer purchasing decisions for a given commodity. If individuals are dissatisfied with the pricing of a particular commodity, particularly essential daily items, they are more likely to opt for alternative options [19].
1.1.2.7 Place
The concept of place in business management pertains to the strategic planning and decision-making processes involved in determining the optimal locations for the delivery of services to clients. This may encompass the utilization of both electronic and physical distribution channels, as articulated by Davis (1997). This also suggests that the product is readily available for consumer access [1]. The concept of distribution, also known as place or distribution, pertains to the configuration of channels consisting of institutions and processes utilized for the transportation of products and services from a company to its target market. The entity responsible for bringing products to the intended consumer market is the Marketing Institute. The processes that facilitate the dissemination of goods encompass transportation, warehousing, and inventory management [17].
1.1.3. Hierarchical Analysis Process Model (AHP)
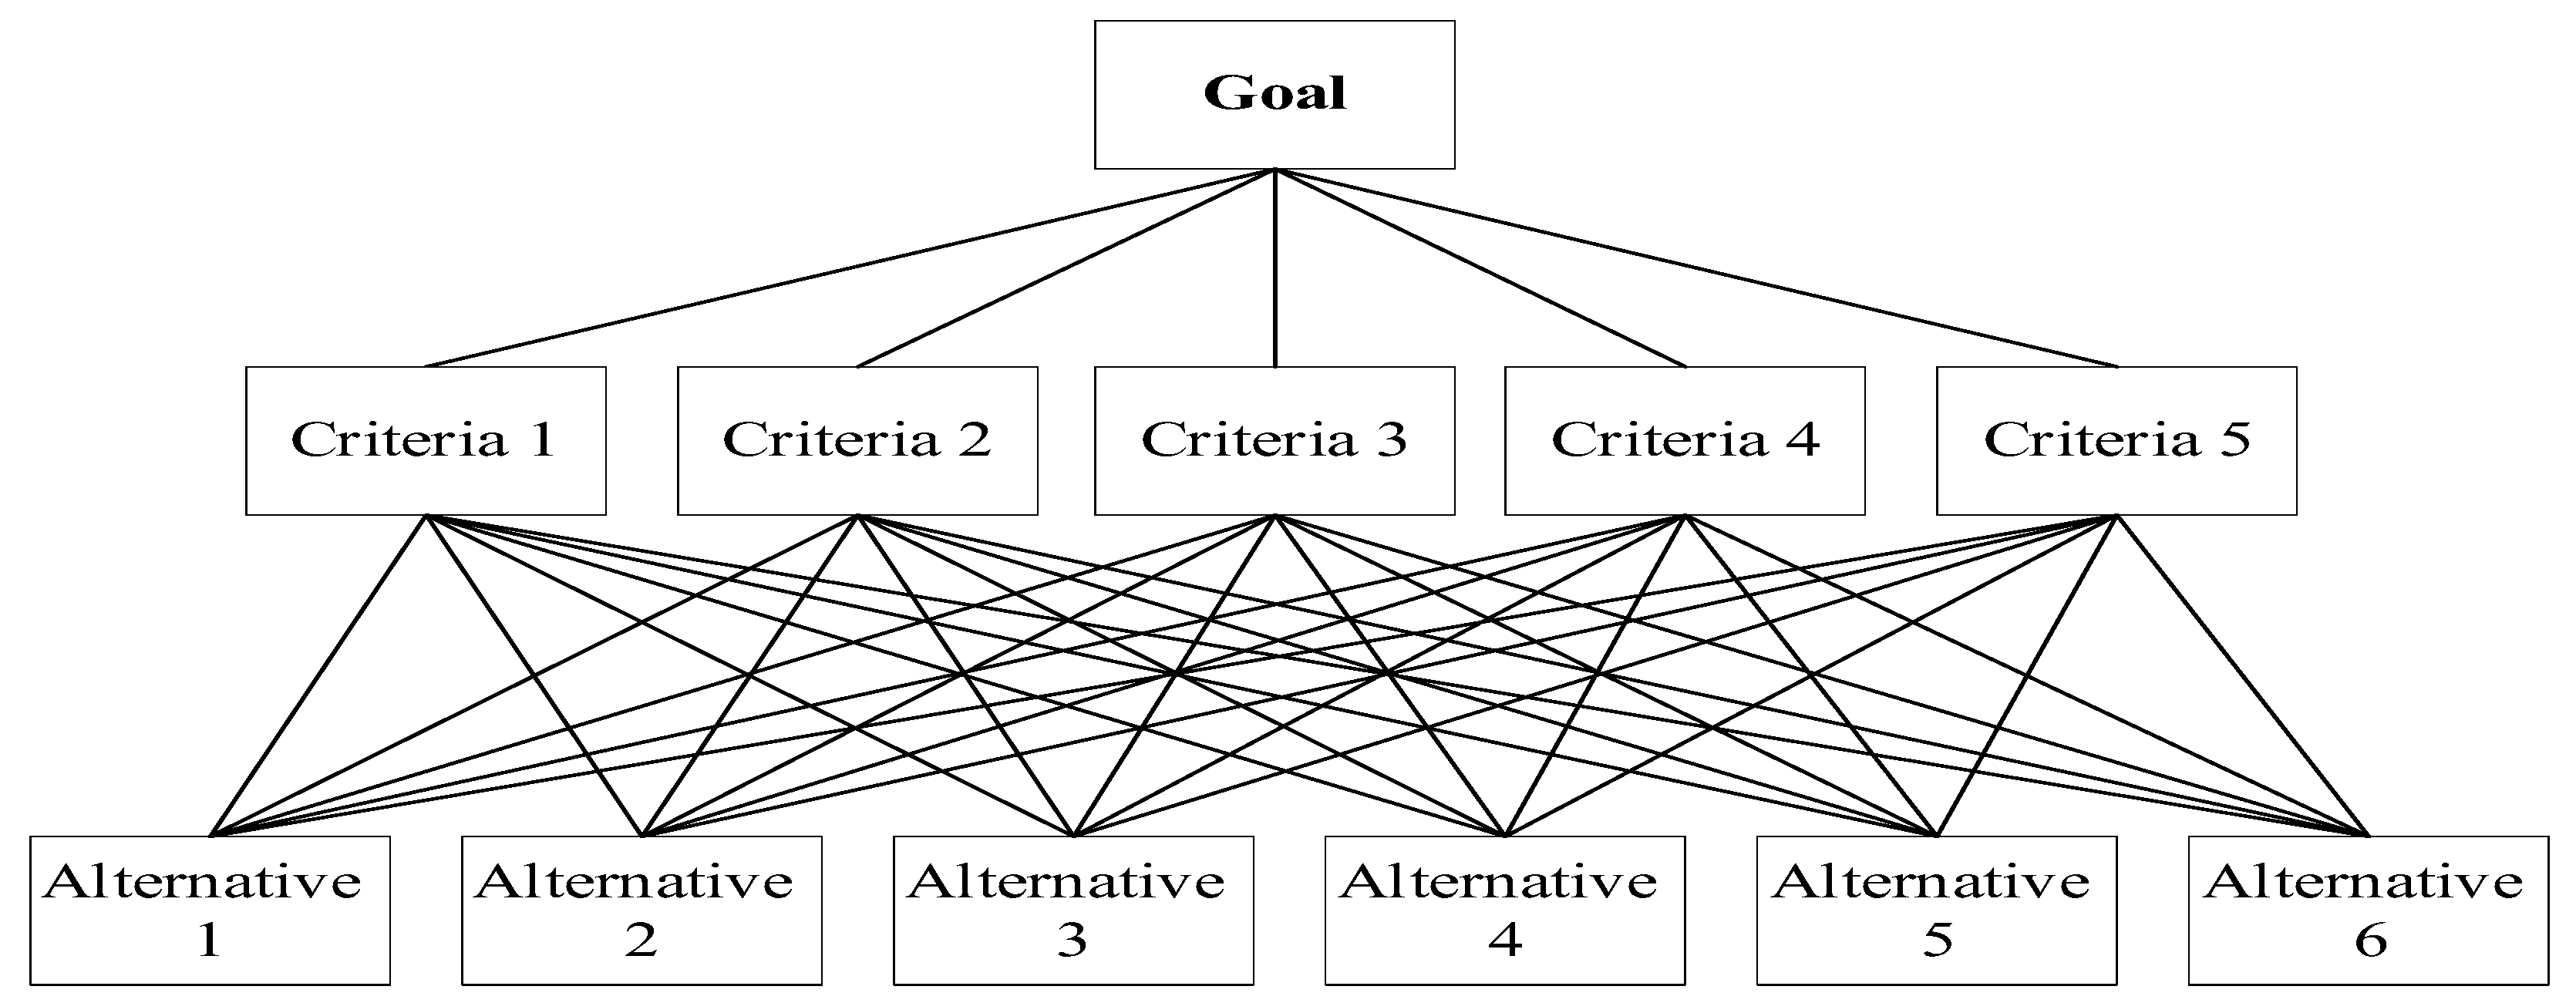
According to LSaaty, decision-makers are often depicted as consistently rational criterions in theory. However, empirical evidence suggests that humans are prone to changing their decisions, either through reevaluation or through the process of acquiring new knowledge [20]. Harker, Vargas, Saaty, Xu, Alexander, Golden et al (1986 to1989) posit that the Analytic Hierarchy Process (AHP) can be considered as a theory of measurement. When employed in decision-making processes, it facilitates the articulation of the overall decision-making operation by breaking down a multifaceted problem into a multi-level hierarchical framework comprising of objectives, criteria, sub-criteria, and alternatives. The AHP offers a basic measurement of the comparative importance of different options by using dominance units to capture judgments made through paired comparisons. A scale of relative sizes expressed in priority units is created based on each set of comparisons. The overall priority scale is combined to create a ranking of the options. The AHP has proven to be a distinct and independent decision-making theory, separate from utility theory, in both its fundamental principles and its methods. [21]. AHP not only assists decision makers in reaching the optimal decision, but also offers a clear justification for why it is the best choice. One of the key benefits of the AHP is that the analysis can be conducted even with a small sample size, without the need for statistical significance. The AHP approach’s simplicity lies in the fact that it does not directly compare the qualities or levels of different attributes, unlike other “conjoint” methods. The AHP method eliminates the necessity for complicated survey structures and can be utilized with only one respondent in an extreme scenario [22].
Figure 1.
Structure of the AHP model [20].
Figure 1.
Structure of the AHP model [20].
1.1.4. Economy Sectors
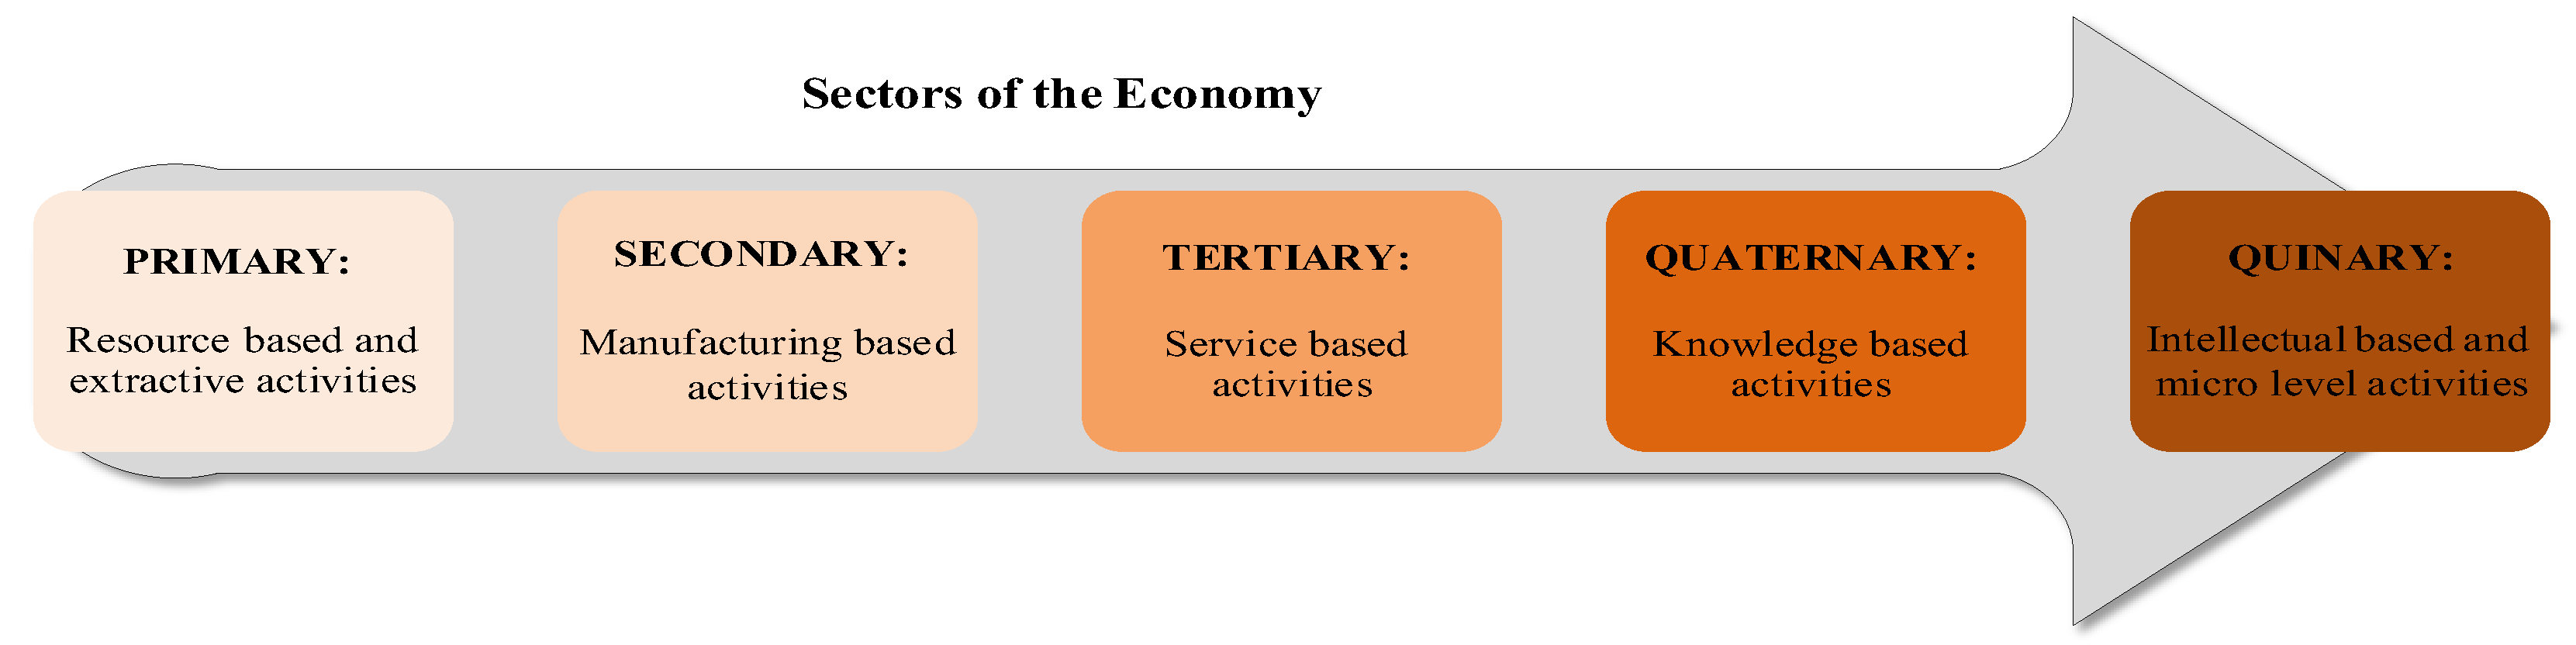
In 1961, Gottmann coined the term “quaternary occupations” to refer to jobs that involve mental work, responsibility, and research, such as management, artistry, government, education, research, and brokerage of goods and services. One of the significant socio-economic changes of the information age began in the 1970s with the swift advancement of communication technologies. In 1977, Abler, Adams, and Gould broadened the definition of the quaternary sector to include “information activities”. They emphasized that activities related to information production and service should be classified as quaternary, rather than being considered part of the secondary or tertiary sector. This method establishes a new classification system that utilizes information for production, transactions, and consumption. It is chosen as its own category, encompassing both physical products and the information associated with them. The fast growth and control of this industry in advanced economies warrant its independent examination, despite its growing ties to all other sectors, making it challenging to fully isolate. Abler and Adams (1977) characterized the quinary sector as encompassing businesses involved in management, information production and processing, and non-standard decision making. [5]. A country’s economy is usually composed of a variety of significant economic pursuits. There are three well-known areas: Primary, Secondary, and Tertiary. There are actually 5 main economic activities that form the foundation of the economy, with the last 2 being Quaternary and Quinary. A makeup of the economy encompasses both direct and indirect activities that result in both positive and negative consequences. These outcomes are measured quantitatively and estimated qualitatively, ultimately impacting the patterns and significance of the economy. In summary, everything is taken into account [23]. The elements needed for production are connected to a specific era of industrial advancement. Over the last century, advanced economies have undergone a shift from agricultural economy to manufacturing based and finally to a service-driven economy. Advanced technology resulted in increased efficiency in labor, allowing for greater production of goods in both manufacturing and agriculture while requiring fewer workers. The improved productivity led to higher earnings for leisure activities and available workforce to be employed in the labor intensive service based acitivities sector. “Advancements in technology have facilitated the emergence of new industries within the service sector.” As this trend has continued to progress, a new quaternary sector has emerged, somewhat seen as a subset of the tertiary sector. It has been upgraded from the tertiary level as it emphasizes knowledge based activities, intellectual pursuits, and is frequently linked to technological advancement. This is why it is often referred to as the “knowledge economy”. Different kinds of electronic services such as IT, the media, government, culture, education, scientific research, and web-based services are now common in “post-industrial” economies. The majority of the workforce is usually highly educated. The quinary sector is another category within the tertiary sector. It includes the top decision-makers in society, who create policy guidelines for various industries, government departments, and scientific and technological fields, with significant effects on the economy [24].
Figure 2.
Sectors of the Economy [23].
Figure 2.
Sectors of the Economy [23].
2. Materials and Methods
In this research, considering that the questionnaire is designed in a hierarchical way, the number of samples is measured based on the number of experts in the Isfahan province, which is at least 10 people. The questionnaire was designed according to the type of this research, which includes two descriptive and inferential parts. In the descriptive part, the variables which includes gender, age, and level of education, activity level, and activity history were measured and in the inferential part, the weighting of the 7P marketing mix components in each part of the model of economic sectors was measured.
2.1. Descriptive Statistics
At the descriptive level, to analyze the data obtained in the descriptive statistics section of the questionnaires mentioned in the statistical population of this research, using SPSS 22 software, statistical indicators such as frequency, percentage, and average separately in each part of the model Economic sectors have been investigated.
2.2. Inferential Statistics
At the inferential level, Expert Choice 11 software has been used to analyze the data in the questionnaires collected from the statistical population of this research. In the AHP method, pairwise comparisons are made between each level of criteria, and with the help of this software, pairwise comparison questionnaires are analyzed and their inconsistency is determined. The indicators have been prioritized for each option separately, then by adjusting the comparison matrix, each of the main indicators has been subjected to the judgment of the interviewees in pairs. Pairwise comparisons are acceptable if the inconsistency rate is less than 0.1. In each economic sector and at the end of each relevant table, the inconsistency rate is calculated and presented as a control lever.
Figure 3.
AHP model structure with considering the number of criteria and alternatives. Source: by own study.
Figure 3.
AHP model structure with considering the number of criteria and alternatives. Source: by own study.
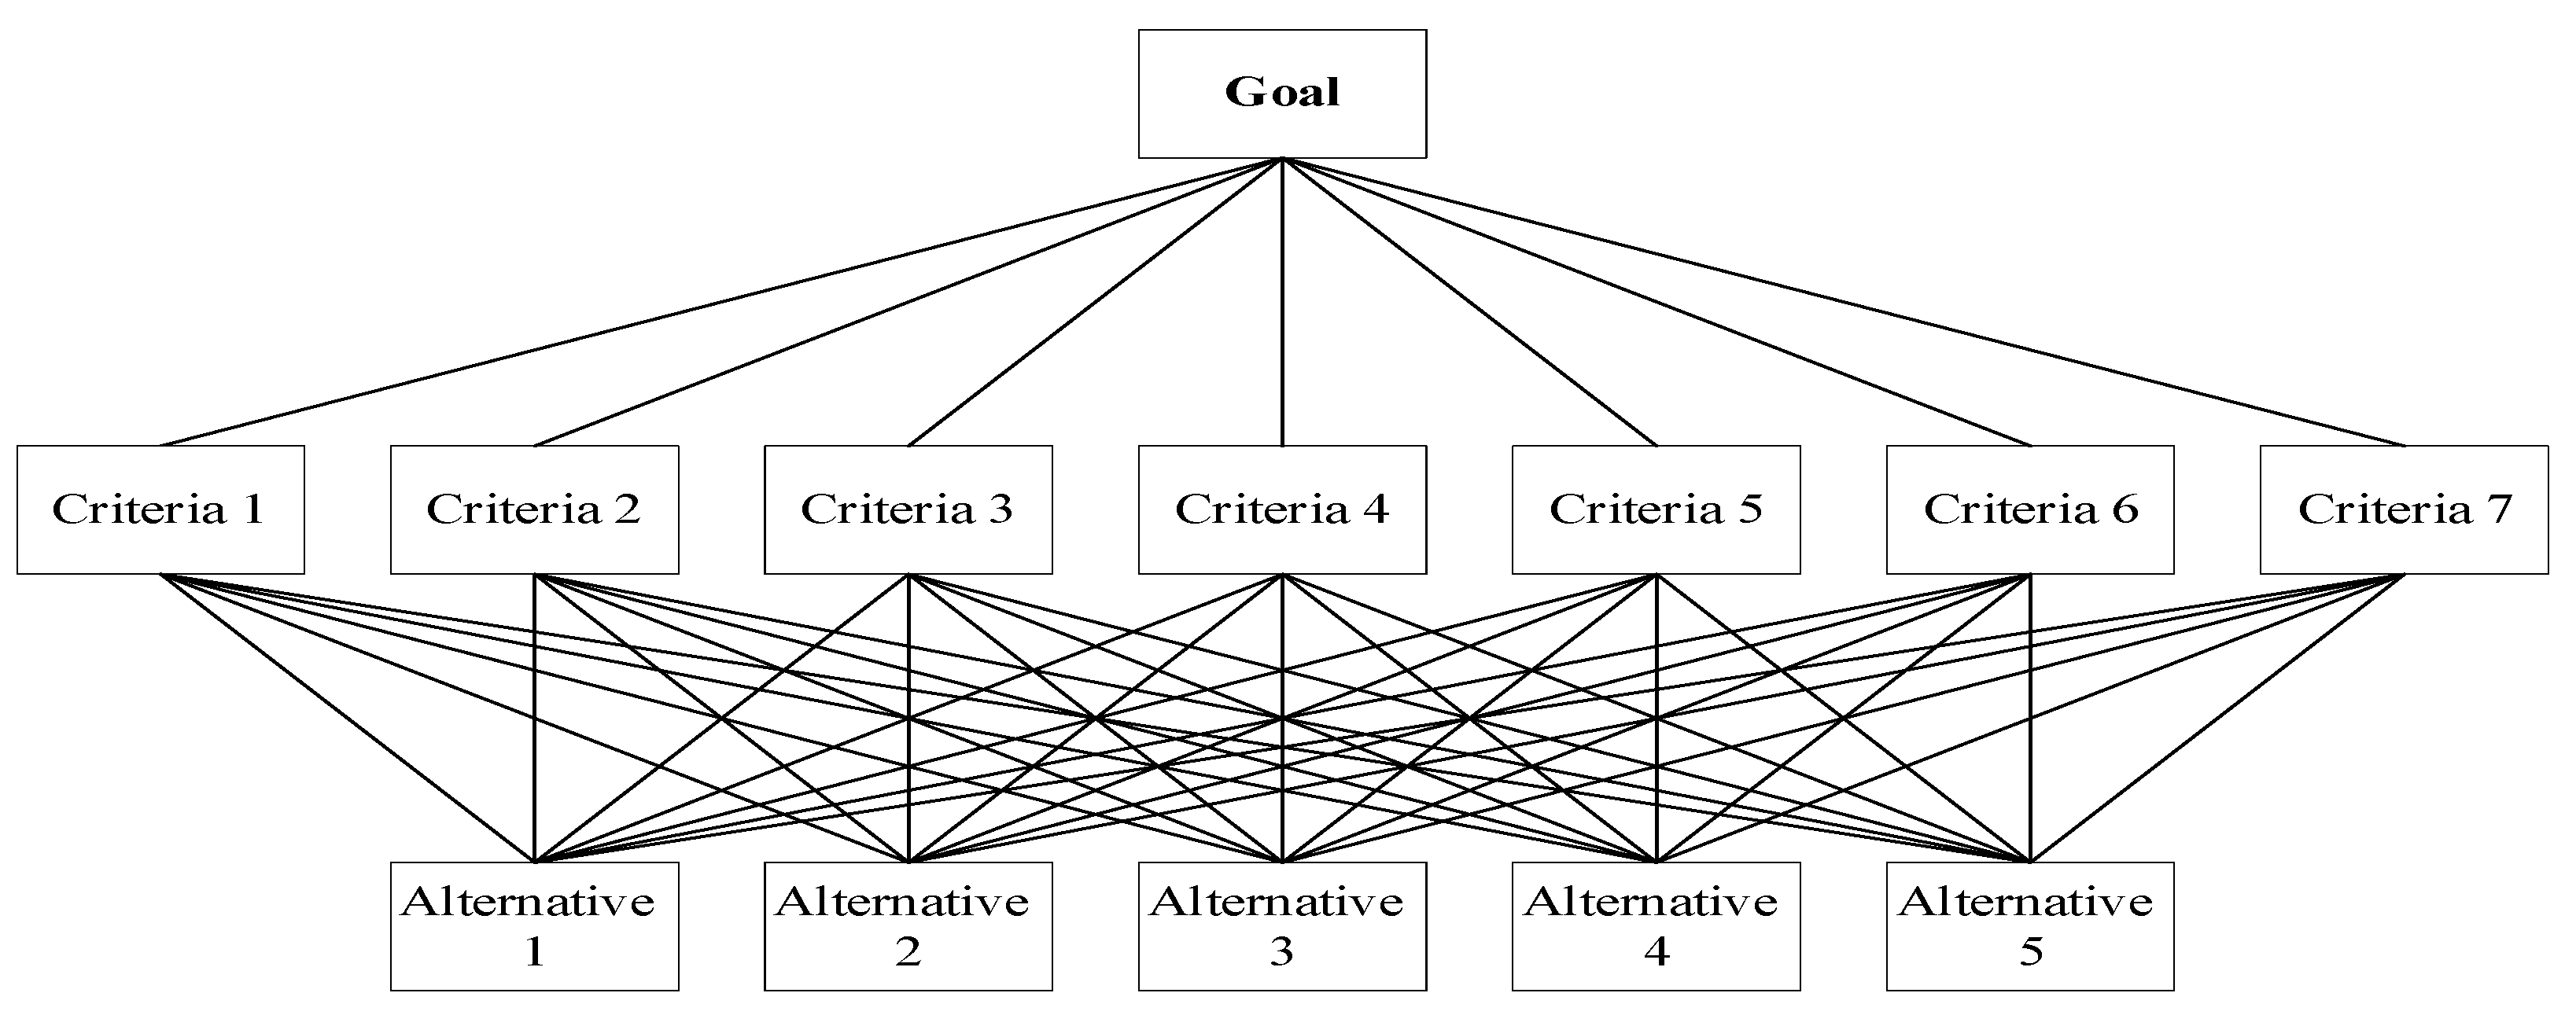
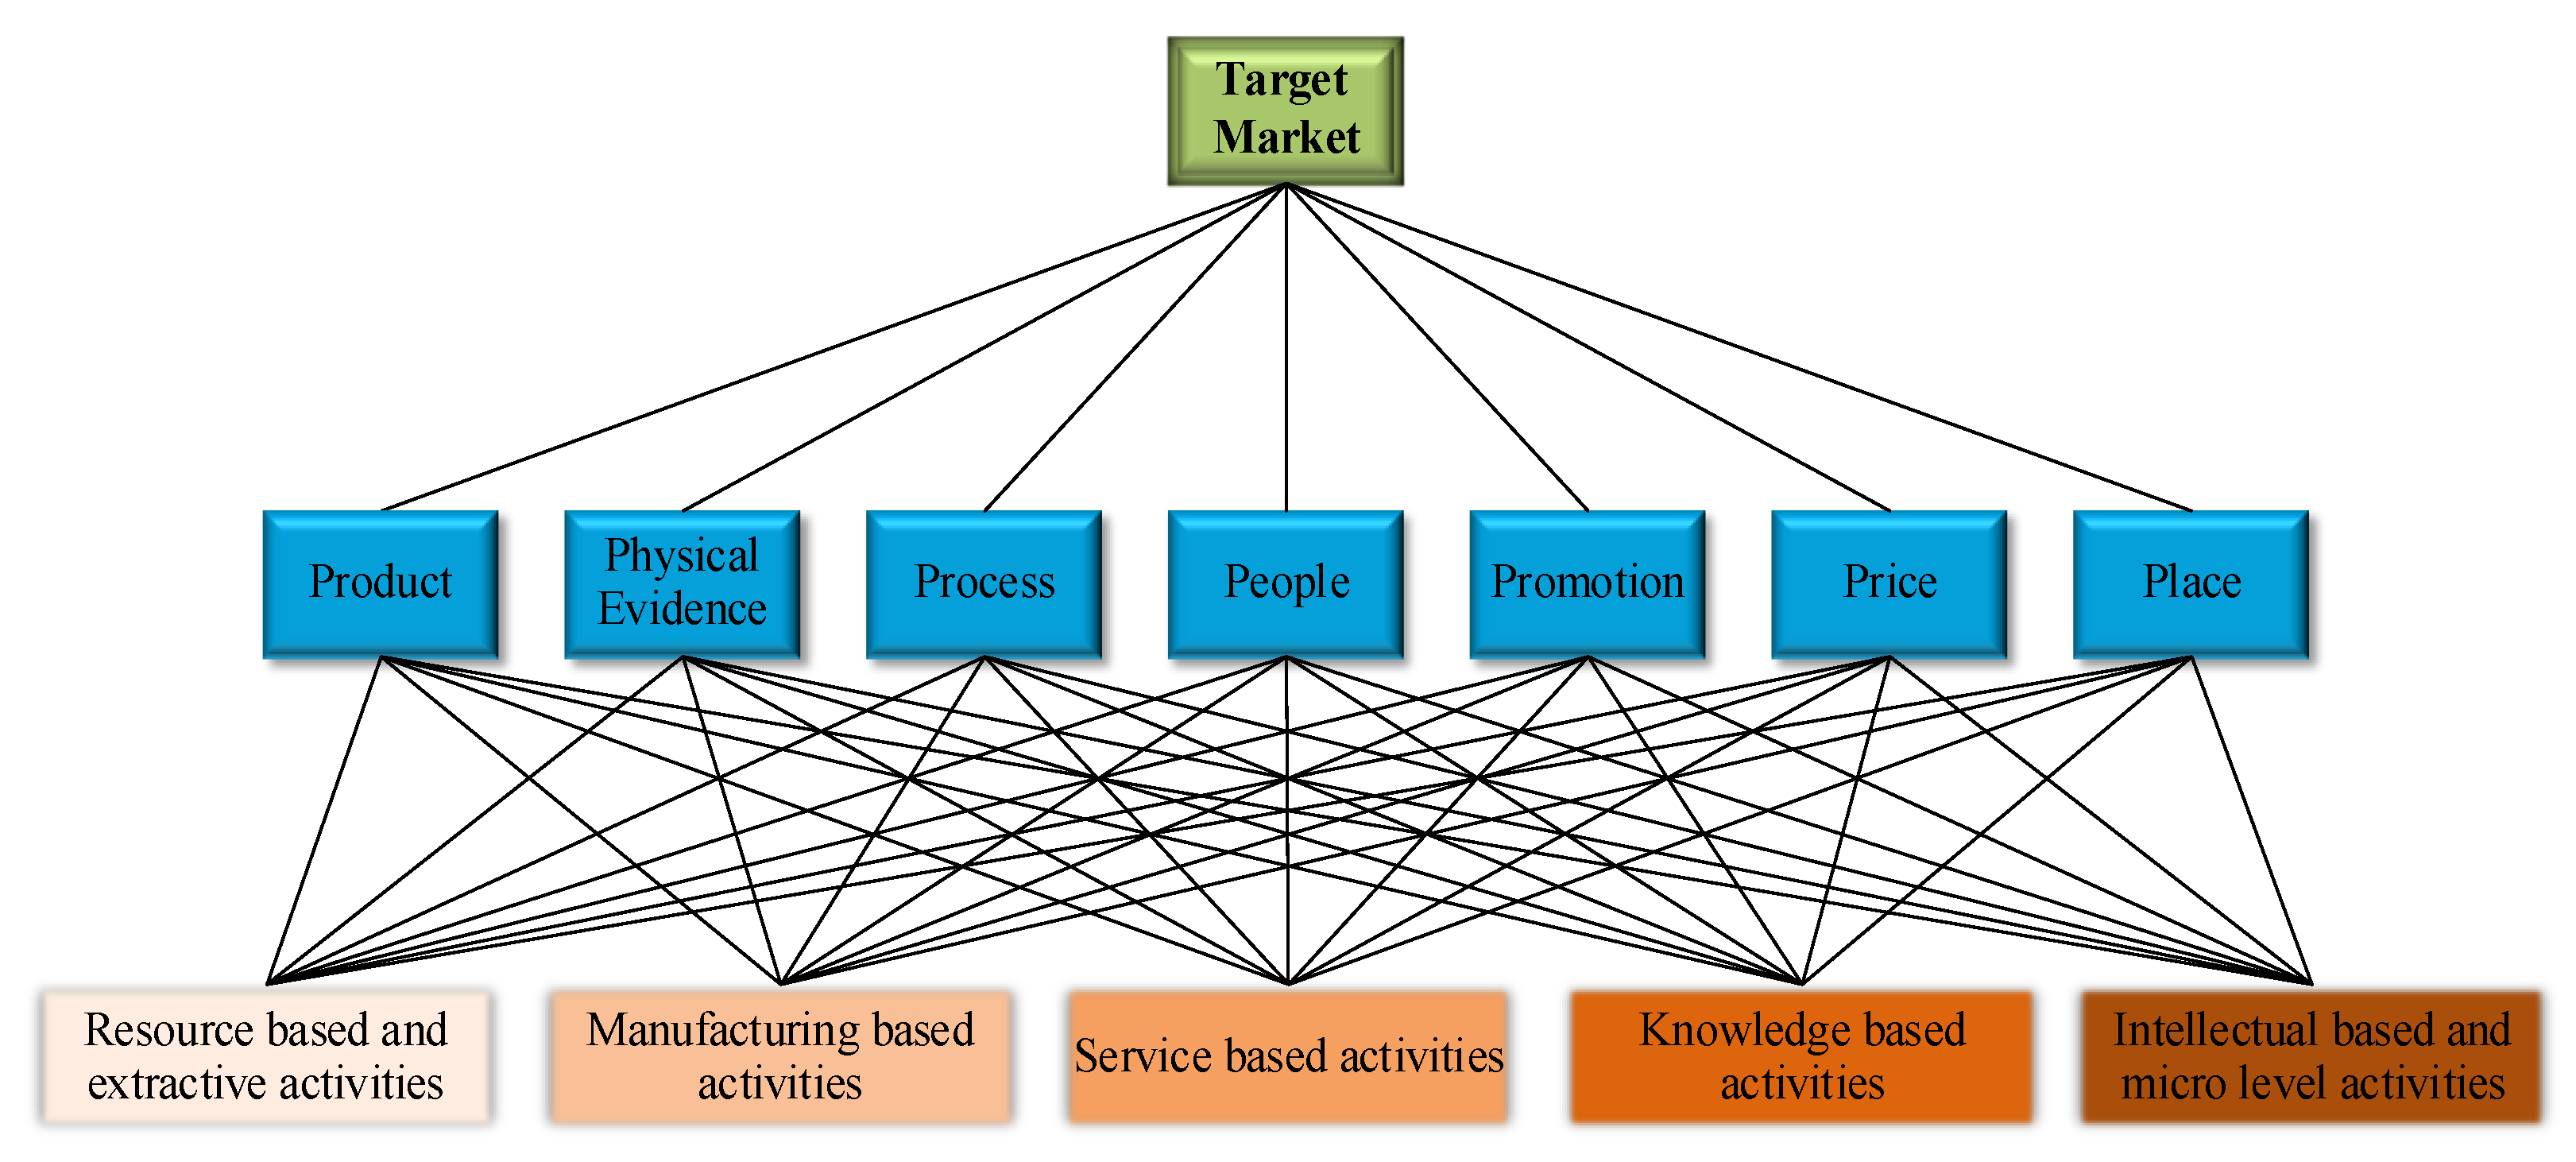
Figure 4.
The structure of the AHP model by considering the criteria based on the 7P components and the alternatives based on the parts of the Economic Sectors model. Source: by own study.
Figure 4.
The structure of the AHP model by considering the criteria based on the 7P components and the alternatives based on the parts of the Economic Sectors model. Source: by own study.
3. Results
3.1. General Descriptive Statistics and Inferential Statistics of Interviewees
The general descriptive statistics and inferential statistics of a total of 82 questionnaires completed by active experts in all five sectors of the model of economic sectors are as follows.
3.1.1. General Descriptive Statistics of Interviewees
The general descriptive statistics of a total of 82 questionnaires completed by active experts in all five sectors of the model of economic sectors are as follows:
- As seen in Figure five, 85% of the statistical population of this research is male and the remaining 15% is female. The descriptive statistical information of gender is more detailed in the table one;
- In figure six, 17% of the interviewees are between 20 and 30 years old, 54% are between 30 and 40 years old, 17% are between 40 and 50 years old, and the remaining 12% have 50 years old and upper. In the table two, the age information of the interviewees is shown separately in each section of the model of economic sectors;
- Figure seven shows, the educational information of the interviewees is generally based on the fact that 15% have a diploma, 9% have an associate degree, 41% have a bachelor’s degree, 27% have a master’s degree, and the remaining of 8% of interviewees, have a PhD degree. The general information on the education level of the interviewees separately in each sector of the model of economic sectors is mentioned in Table three;
- As seen in figure eight, 81% of the interviewees work at senior management levels, 12% work at department management, and the remaining 8% work at department expert levels. More detailed information on the level of organizational employment of the interviewees can be seen separately in each sector of the model of economic sectors in the table four;
- As can be seen in figure nine, 6% of the interviewees have less than 5 years of experience, 26 % have 5 to 10 years, 24% of them have 10 to 15 years, and the 44% remaining of the interviewees, have more than 15 years of work experience. More detailed information on the years of work experience of the interviewees can be seen separately in each sector of the model of economic sectors in table five;
3.1.2. Inferential Statistics Statistics of Interviewees
- Tables six to ten explain the numerical values (weight) of 7P’s marketing mix indicators;
- Figures ten to fourteen, show the preference charts based on the weight of the 7P indicators of the marketing mix;
3.2. Figures, Tables and Schemes
Figure 5.
Gender of interviewees.
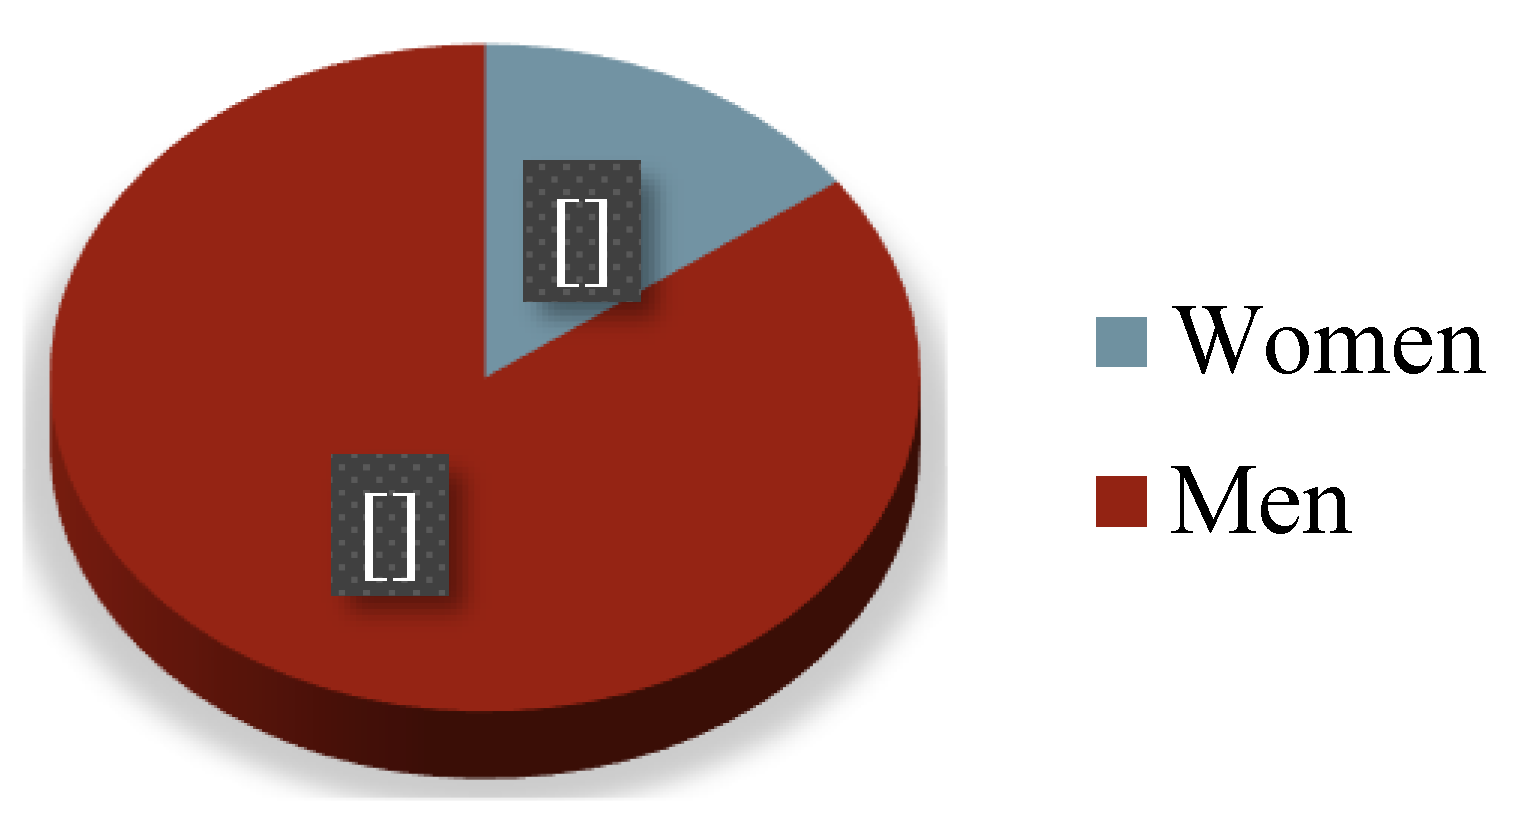
Figure 6.
Age of interviewees.
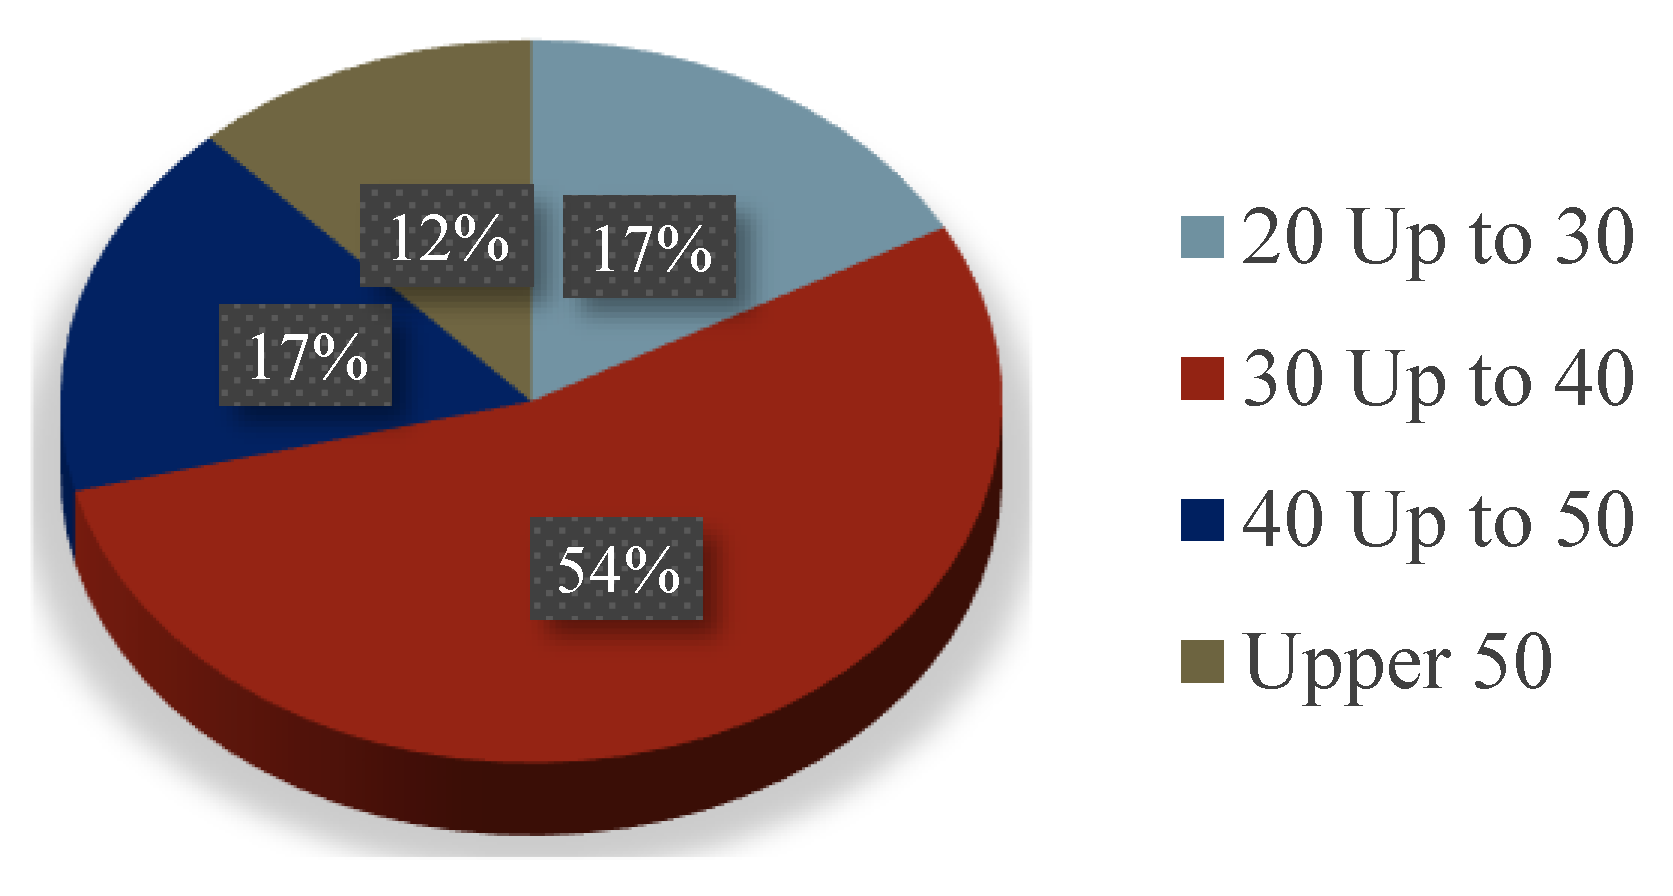
Figure 7.
Education levels of interviewees.
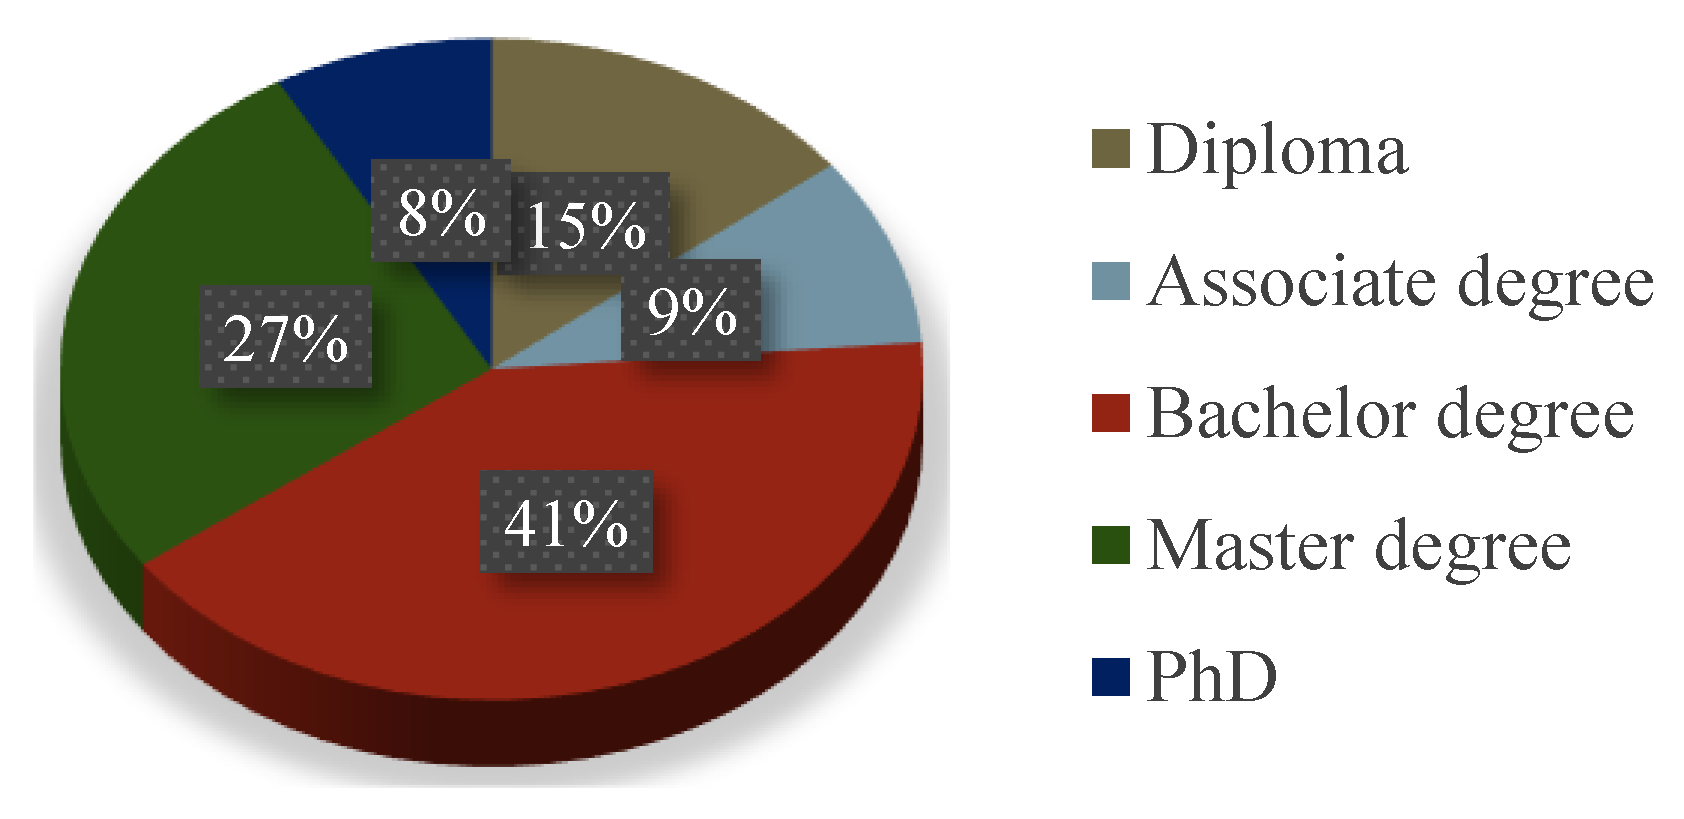
Figure 8.
Organizational employment levels of interviewees.
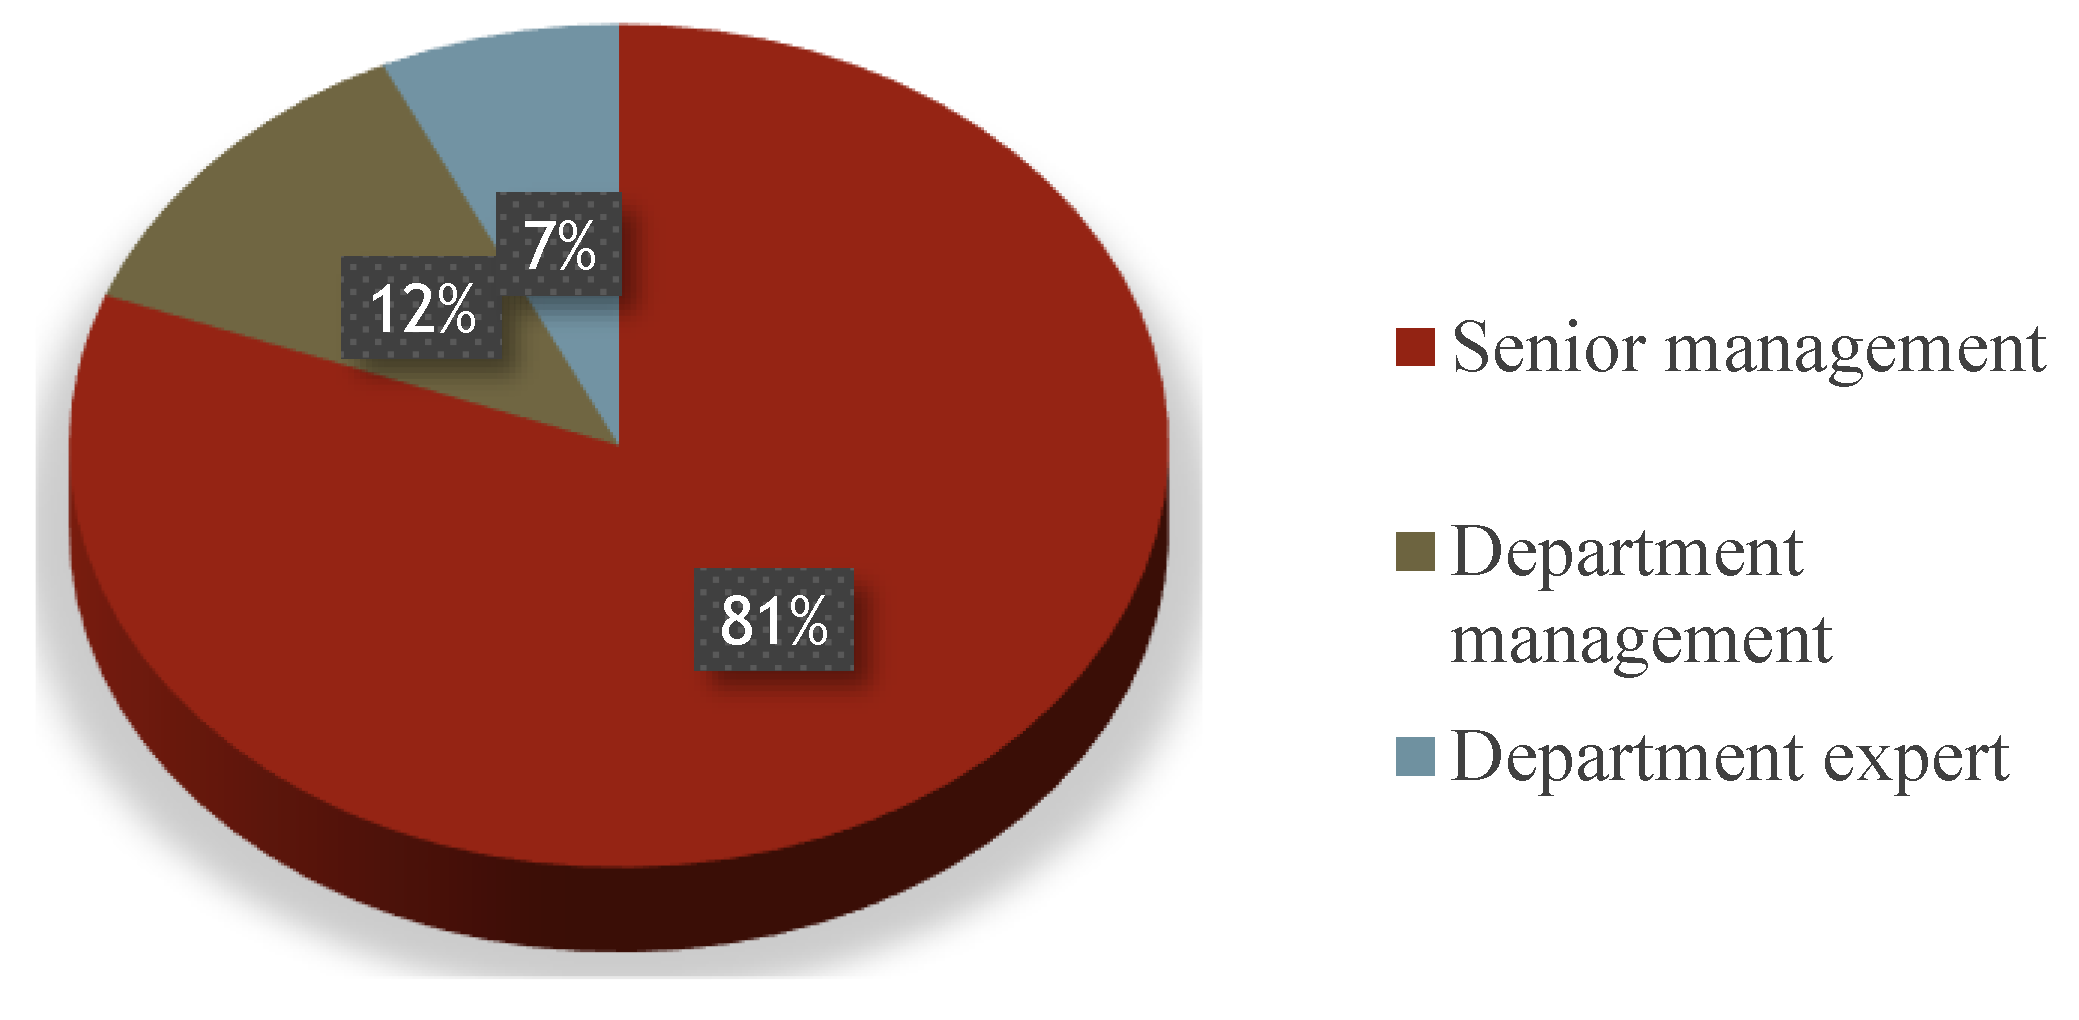
Figure 9.
Work Experience (Years) of interviewees.
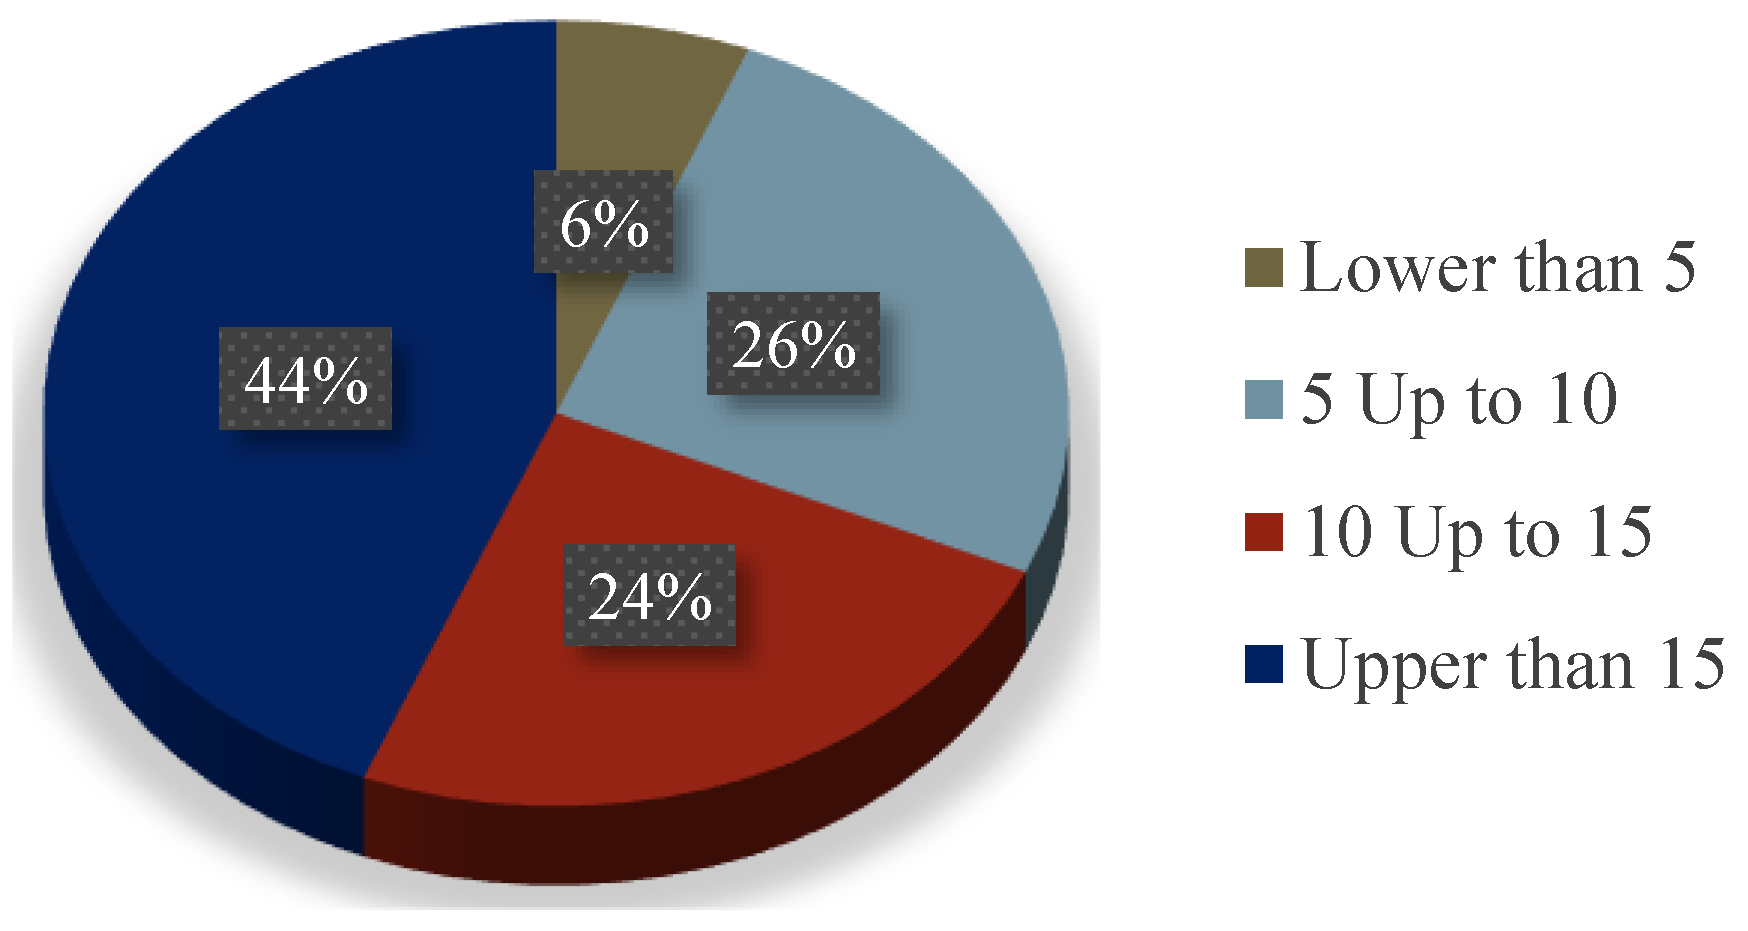
Figure 10.
The bar chart of the weight of the 7P indicators of the marketing mix in Resource based and extractive activities.
Figure 10.
The bar chart of the weight of the 7P indicators of the marketing mix in Resource based and extractive activities.
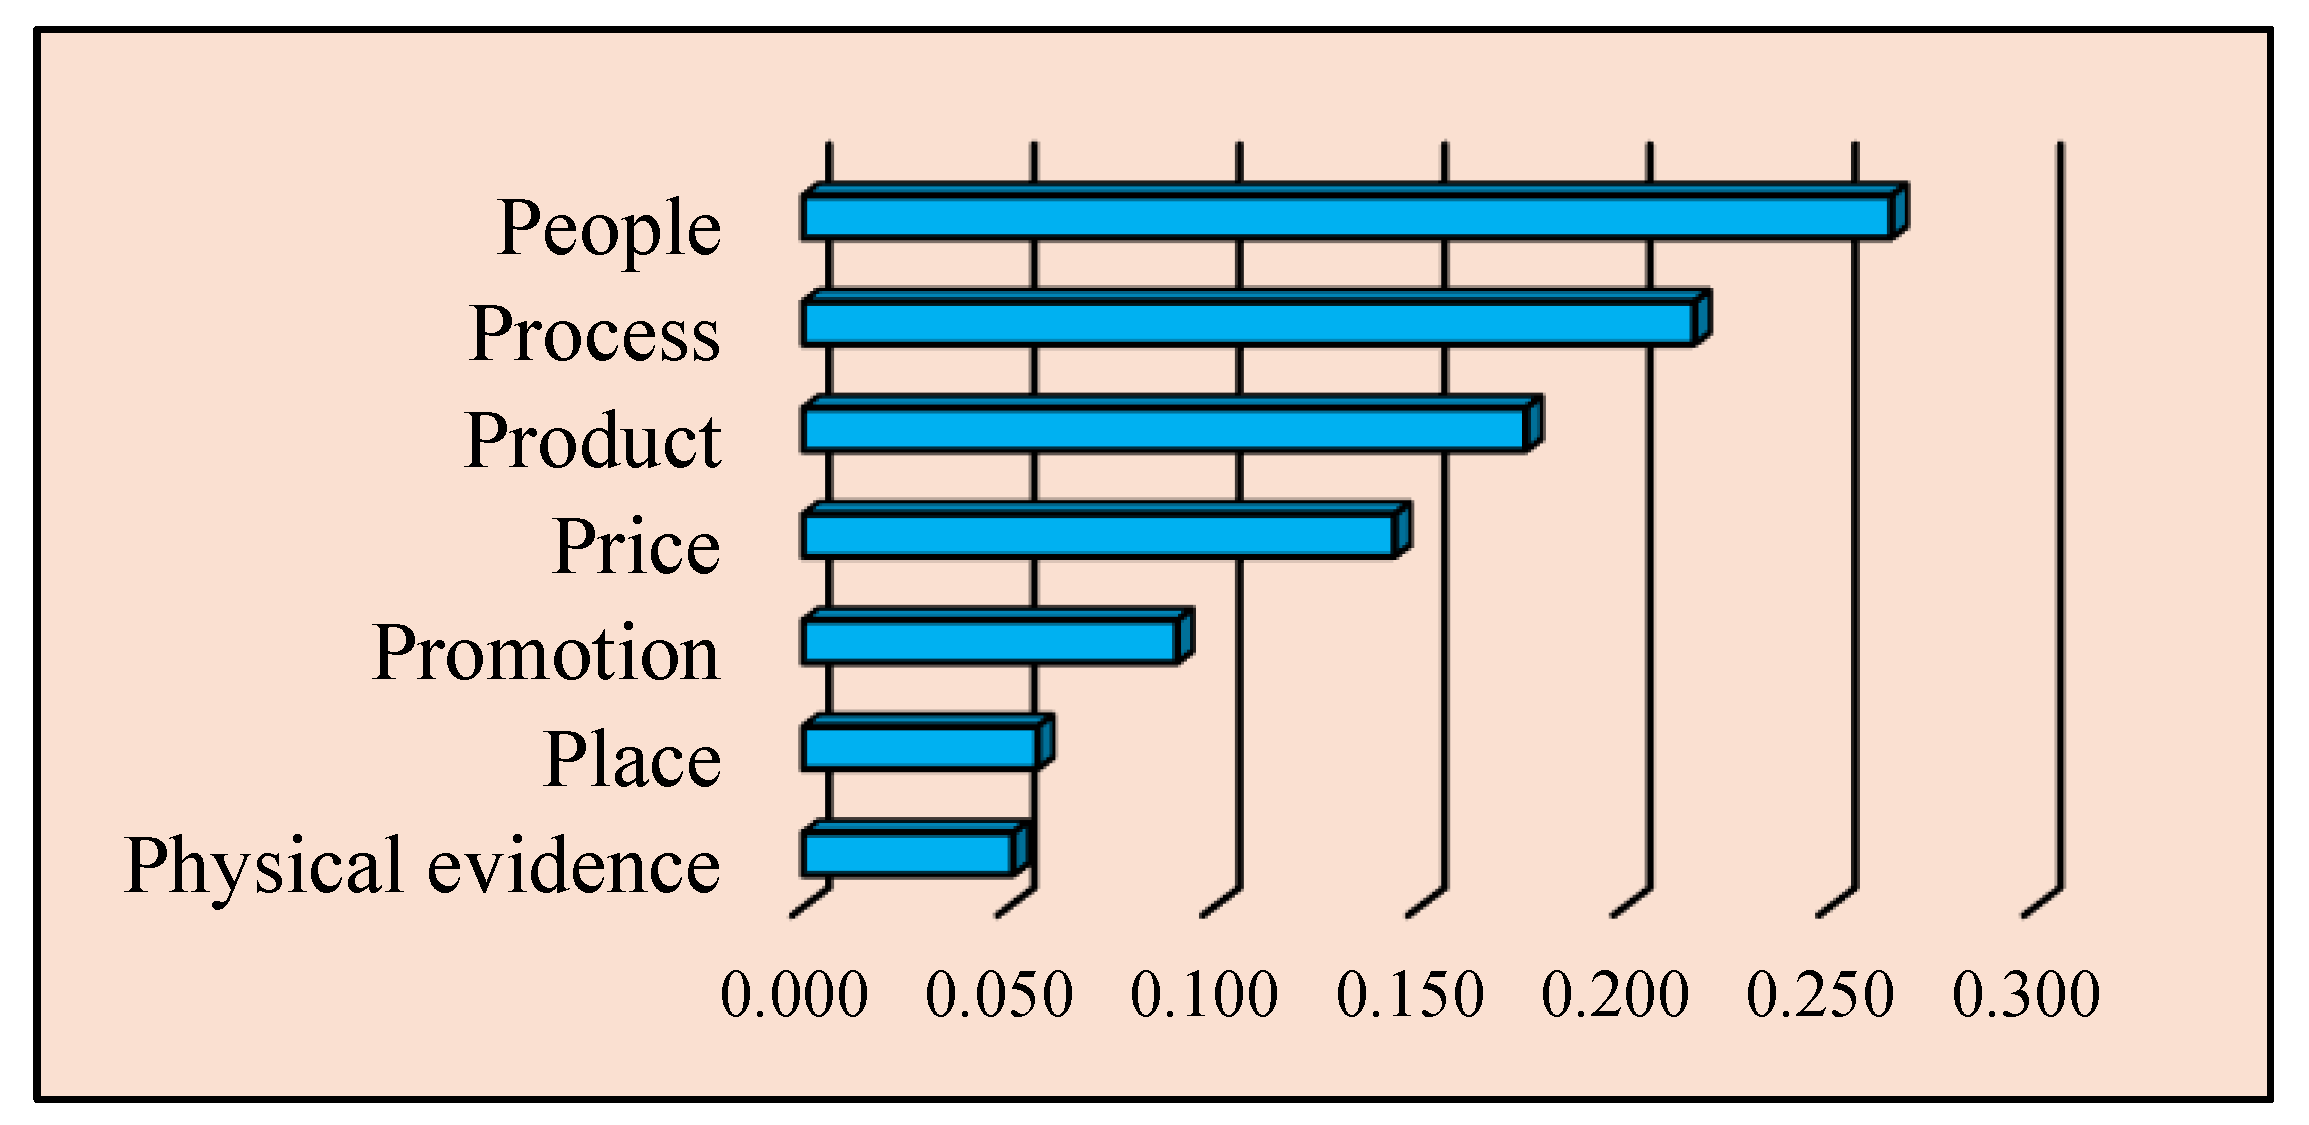
Figure 11.
The bar chart of the weight of the 7P indicators of the marketing mix in the manufacturing based activities.
Figure 11.
The bar chart of the weight of the 7P indicators of the marketing mix in the manufacturing based activities.
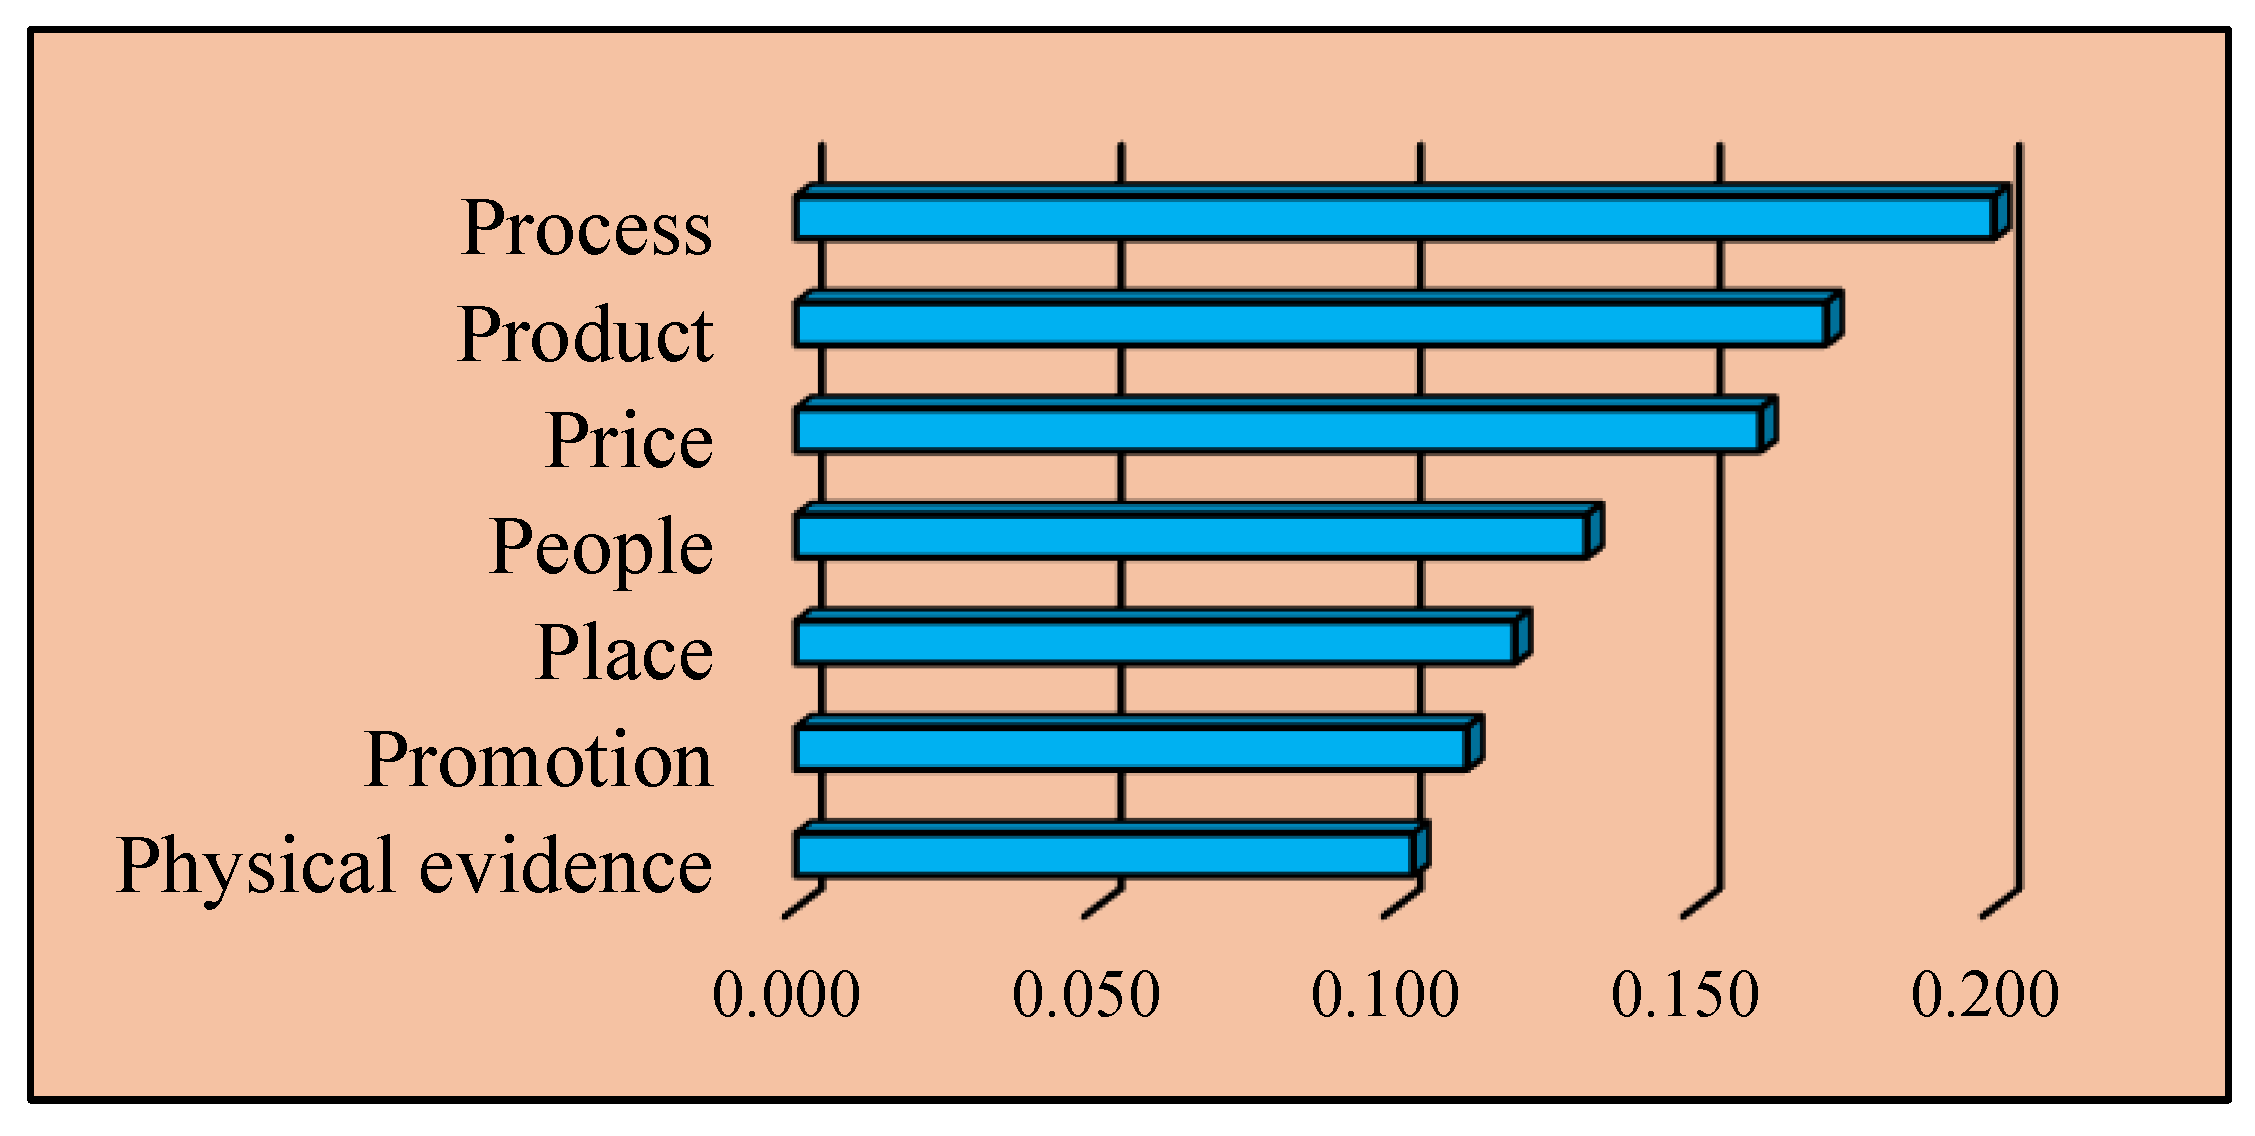
Figure 12.
The bar chart of the weight of the 7P indicators of the marketing mix in the service based activities.
Figure 12.
The bar chart of the weight of the 7P indicators of the marketing mix in the service based activities.
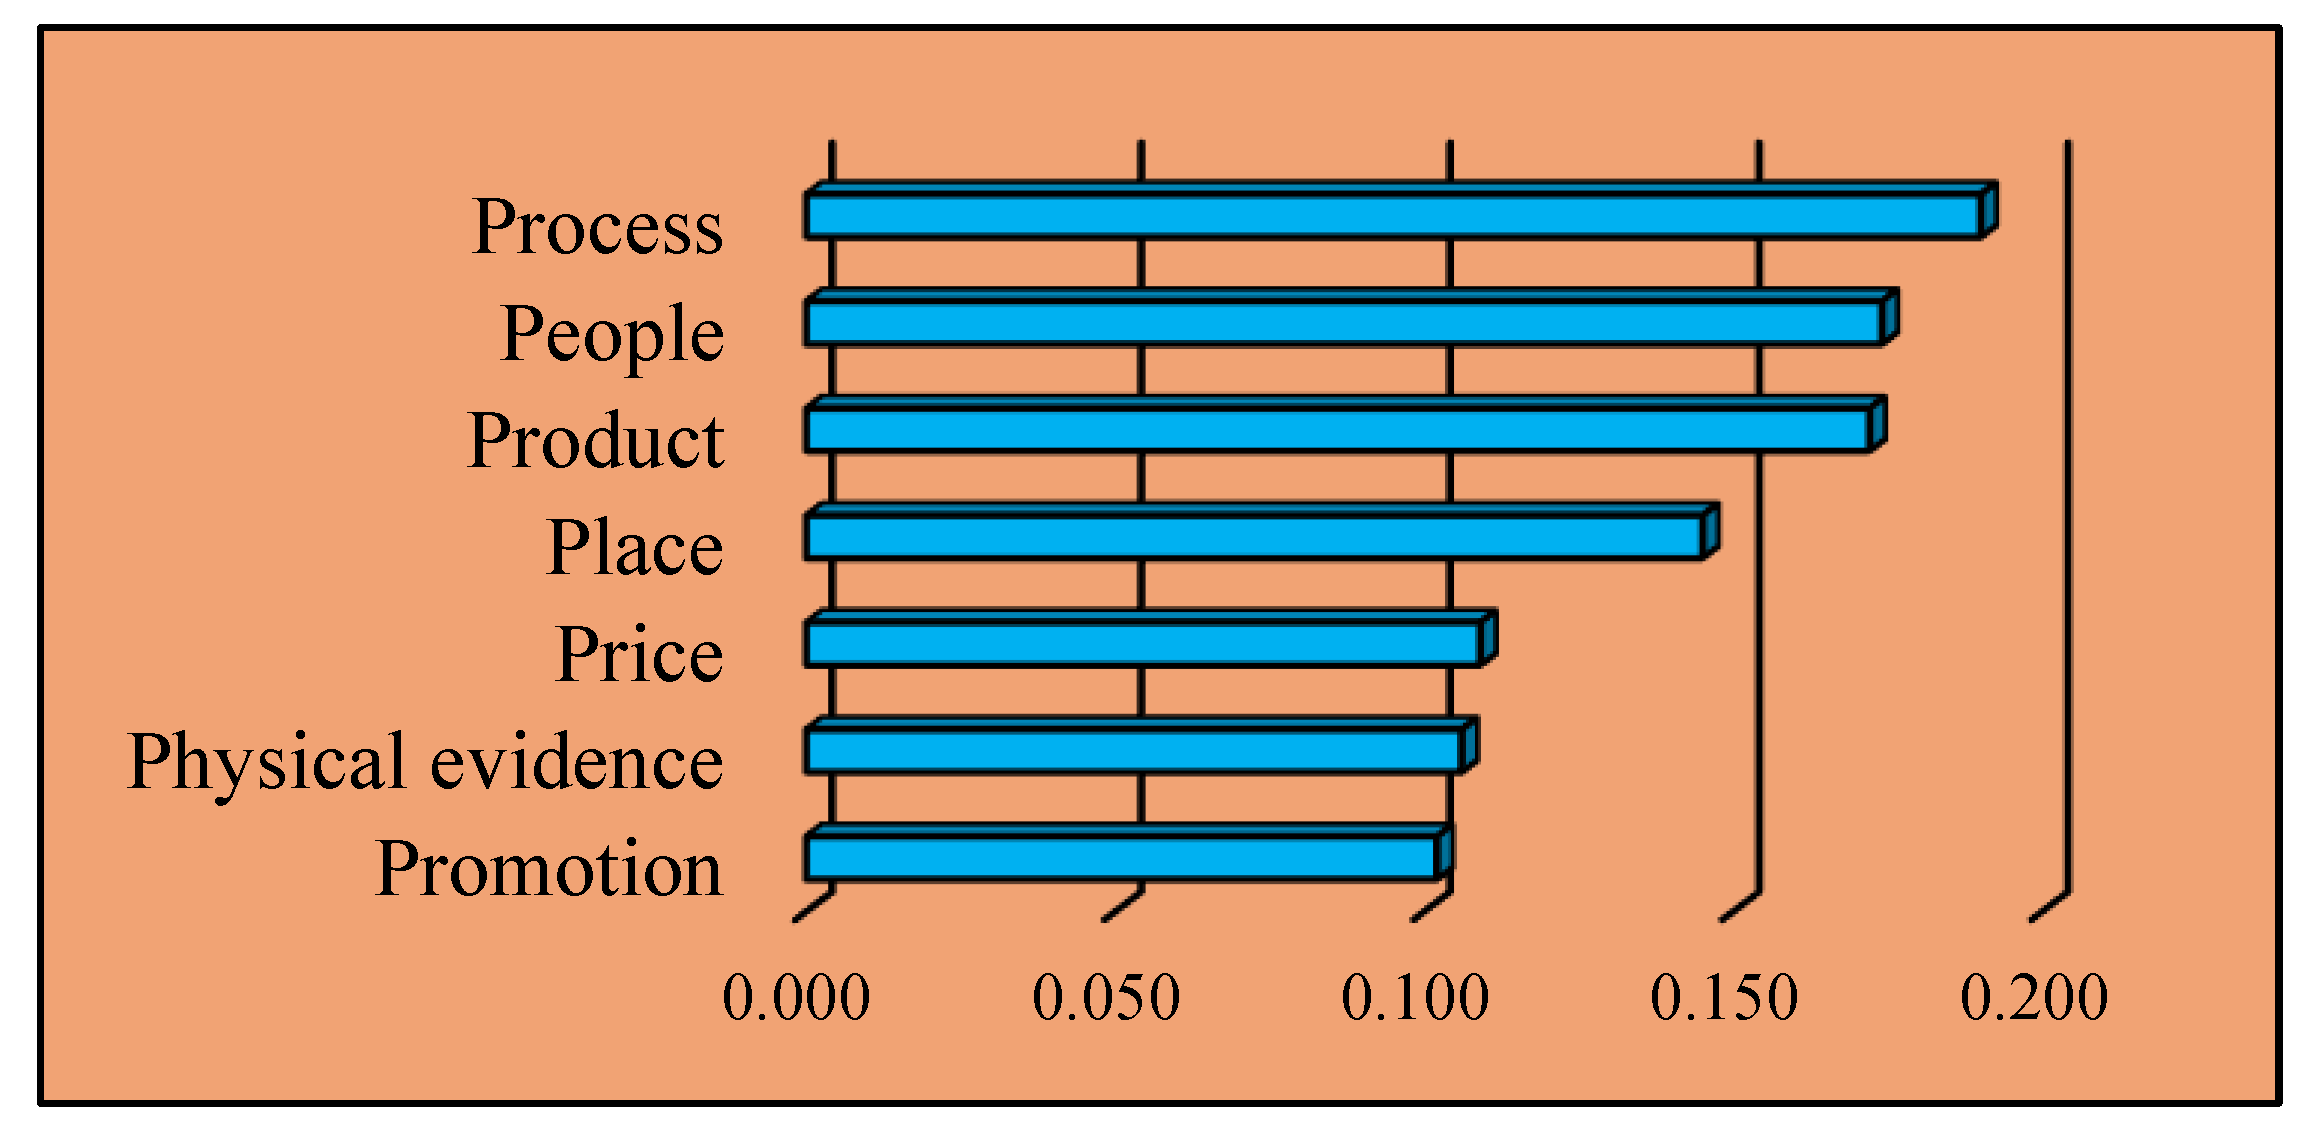
Figure 13.
The bar chart of the weight of the 7P indicators of the marketing mix in the Knowledge based activities.
Figure 13.
The bar chart of the weight of the 7P indicators of the marketing mix in the Knowledge based activities.
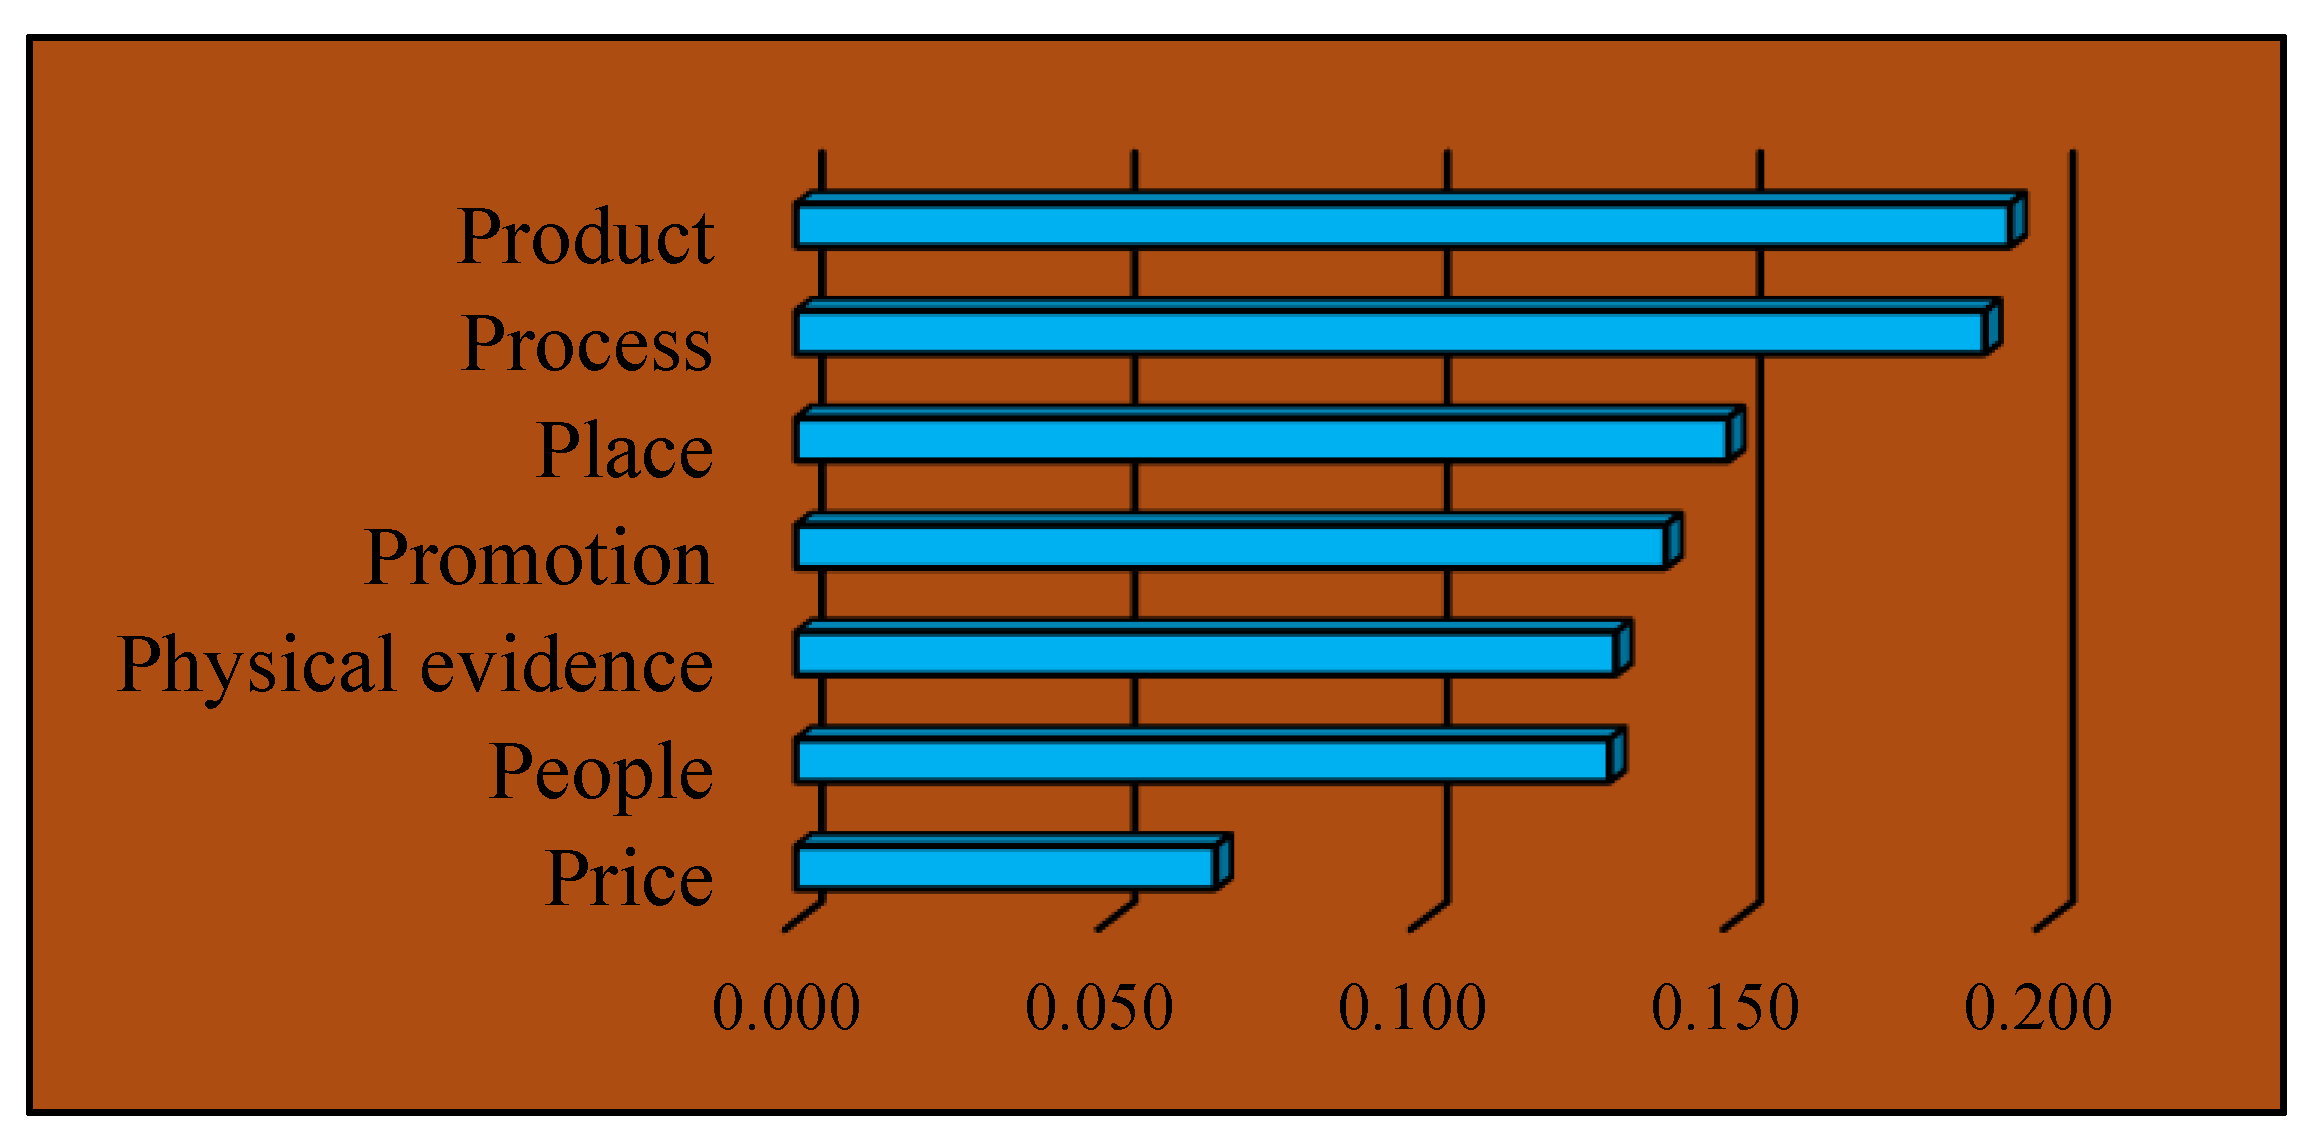
Figure 14.
The bar chart of the weight of the 7P indicators of the marketing mix in the Intellectual based and micro level activities.
Figure 14.
The bar chart of the weight of the 7P indicators of the marketing mix in the Intellectual based and micro level activities.
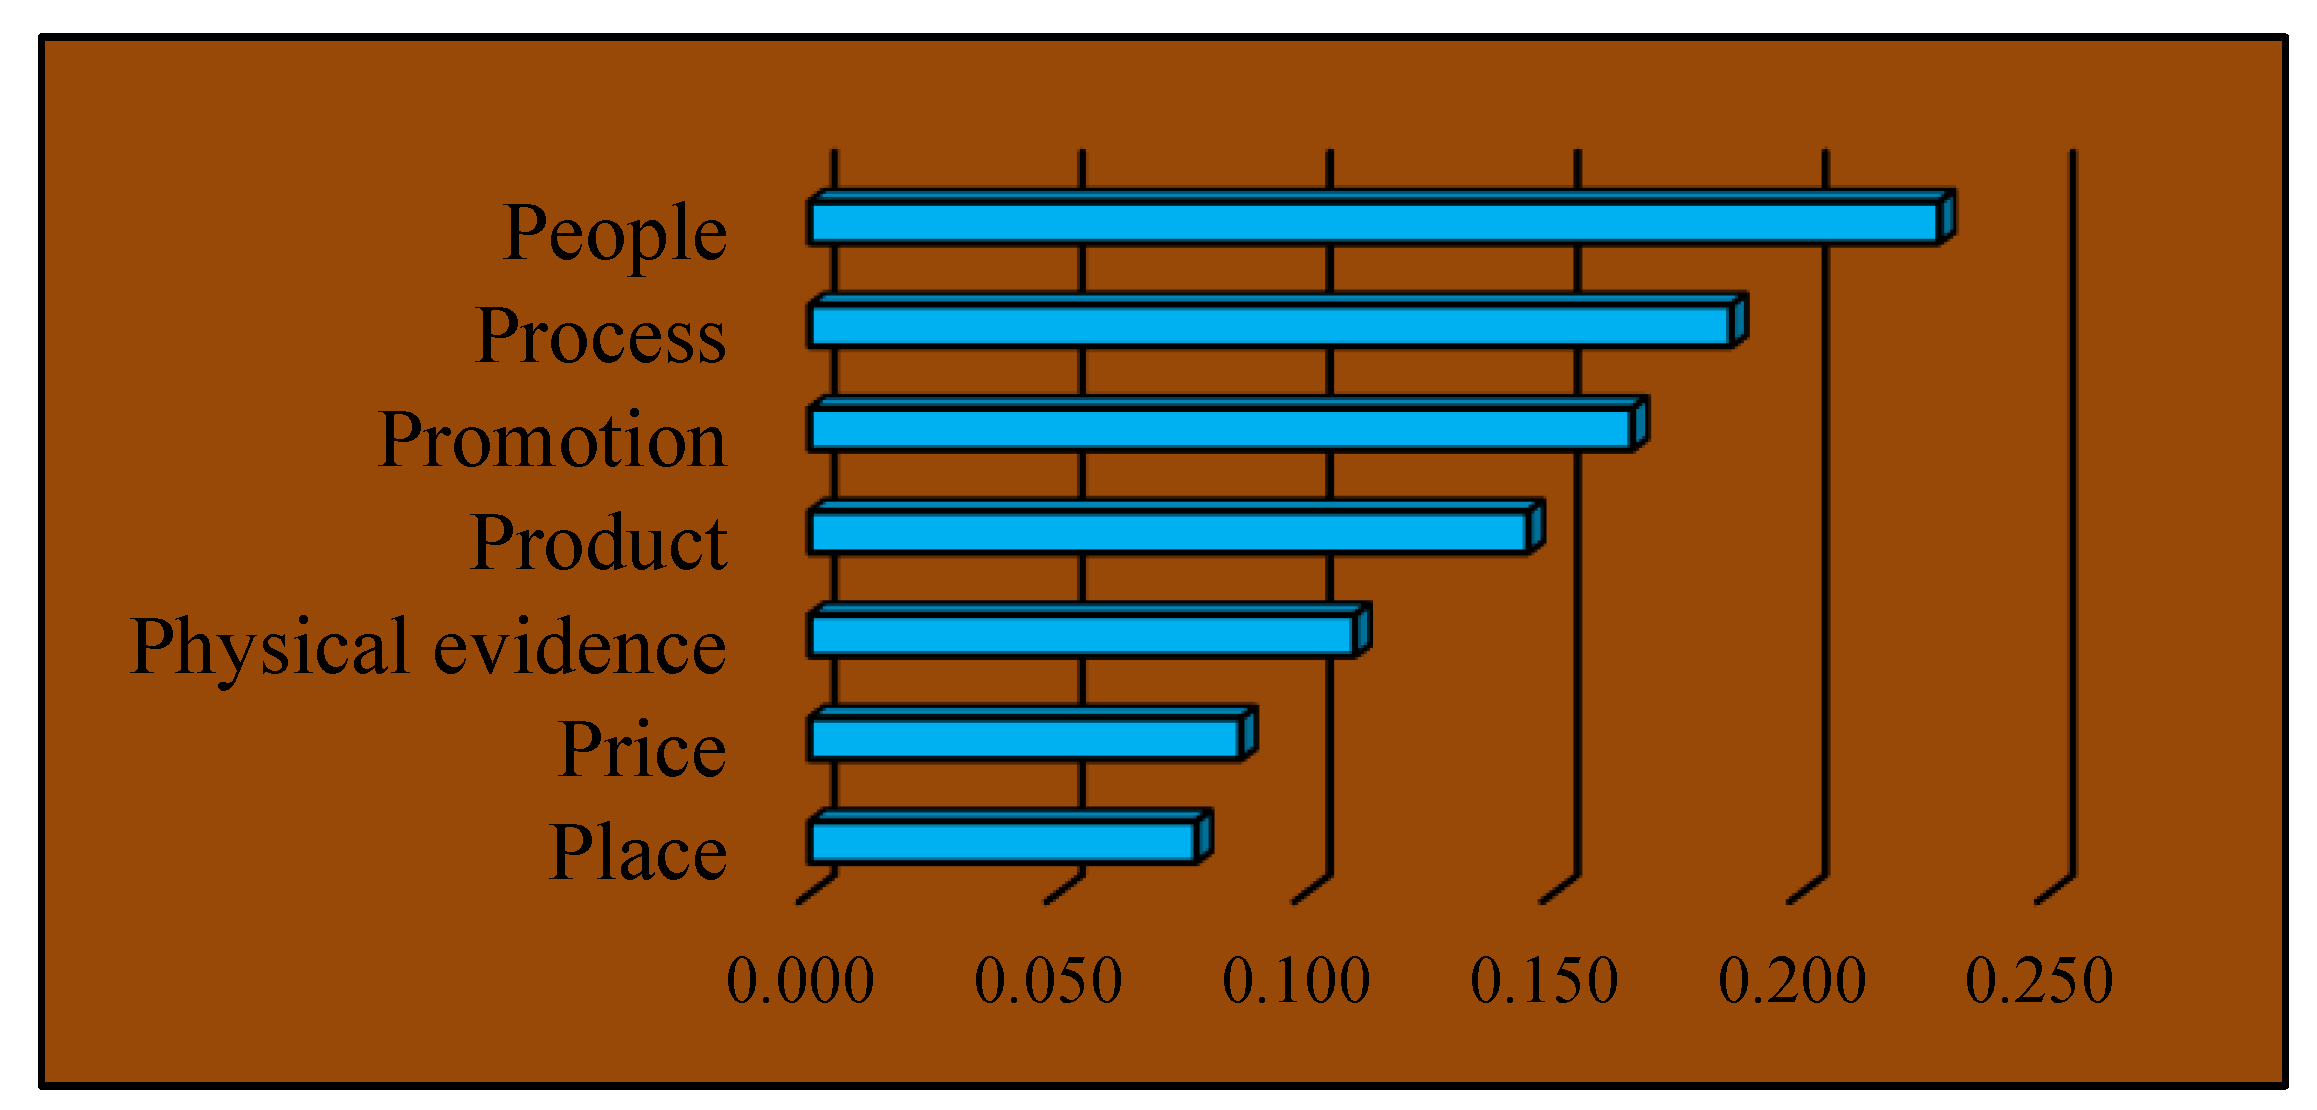

Table 1.
Gender of descriptive statistics of the interviewees in all five sectors of the economic sectors model.
Table 1.
Gender of descriptive statistics of the interviewees in all five sectors of the economic sectors model.
| Frequency | Percentage | Credit percentage | Cumulative percentage | |||
| Men | Women | QTY | ||||
| Resource based and extractive activities | √ | 9 | 90 | 90 | 90 | |
| √ | 1 | 10 | 10 | 100 | ||
| Total | 10 | 100 | 100 | - | ||
| Manufacturing based activities | √ | 13 | 81 | 81 | 81 | |
| √ | 3 | 19 | 19 | 100 | ||
| Total | 16 | 100 | 100 | - | ||
| Service based activities | √ | 29 | 86 | 86 | 86 | |
| √ | 5 | 14 | 14 | 100 | ||
| Total | 34 | 100 | 100 | - | ||
| Knowledge based activities | √ | 10 | 83.84 | 84 | 84 | |
| √ | 2 | 16.16 | 16 | 100 | ||
| Total | 12 | 100 | 100 | - | ||
| Intellectual based and micro level activities | √ | 8 | 80 | 80 | 80 | |
| √ | 2 | 20 | 20 | 100 | ||
| Total | 10 | 100 | 100 | - | ||
Table 2.
Descriptive statistics of the interviewee’s age in all five sectors of the economic sectors model.
Table 2.
Descriptive statistics of the interviewee’s age in all five sectors of the economic sectors model.
| Frequency | Percentage | Credit percentage | Cumulative percentage | |||||
| 20 to 30 | 30 to 40 | 40 to 50 | Over 50 | QTY | ||||
| Resource based and extractive activities | √ | 0 | 0 | 0 | 0 | |||
| √ | 5 | 50 | 50 | 50 | ||||
| √ | 3 | 30 | 30 | 80 | ||||
| √ | 2 | 20 | 20 | 100 | ||||
| Total | 10 | 100 | 100 | - | ||||
| Manufacturing based activities | √ | 2 | 12 | 12 | 12 | |||
| √ | 12 | 75 | 75 | 87 | ||||
| √ | 1 | 6.5 | 6.5 | 93.5 | ||||
| √ | 1 | 6.5 | 6.5 | 100 | ||||
| Total | 16 | 100 | 100 | - | ||||
| Service based activities | √ | 6 | 17.64 | 18 | 18 | |||
| √ | 17 | 50 | 50 | 68 | ||||
| √ | 7 | 20.59 | 20 | 88 | ||||
| √ | 4 | 11.76 | 12 | 100 | ||||
| Total | 34 | 100 | 100 | - | ||||
| Knowledge based activities | √ | 3 | 25.25 | 25 | 25 | |||
| √ | 6 | 50.51 | 51 | 76 | ||||
| √ | 1 | 8.08 | 8 | 84 | ||||
| √ | 2 | 16.16 | 16 | 100 | ||||
| Total | 12 | 100 | 100 | - | ||||
| Intellectual based and micro level activities | √ | 3 | 30 | 30 | 30 | |||
| √ | 4 | 40 | 40 | 70 | ||||
| √ | 2 | 20 | 20 | 90 | ||||
| √ | 1 | 10 | 10 | 100 | ||||
| Total | 10 | 100 | 100 | - | ||||
Table 3.
Descriptive statistics of the interviewee’s education in all five sectors of the economic sectors model.
Table 3.
Descriptive statistics of the interviewee’s education in all five sectors of the economic sectors model.
| Frequency | Percentage | Credit percentage | Cumulative percentage | ||||||
|---|---|---|---|---|---|---|---|---|---|
| Diploma | Associate Degree | Bachelor Degree | Master Degree | PhD | QTY | ||||
| Resource based and extractive activities | √ | 0 | 0 | 0 | 0 | ||||
| √ | 1 | 10 | 10 | 10 | |||||
| √ | 3 | 30 | 30 | 40 | |||||
| √ | 5 | 50 | 50 | 90 | |||||
| √ | 1 | 10 | 10 | 100 | |||||
| Total | 10 | 100 | 100 | - | |||||
| Manufacturing based activities | √ | 0 | 0 | 0 | 0 | ||||
| √ | 1 | 6.25 | 6 | 6 | |||||
| √ | 7 | 43.75 | 44 | 50 | |||||
| √ | 6 | 37.5 | 37 | 87 | |||||
| √ | 2 | 12.5 | 13 | 100 | |||||
| Total | 16 | 100 | 100 | - | |||||
| Service based activities | √ | 7 | 21 | 21 | 21 | ||||
| √ | 3 | 8 | 8 | 29 | |||||
| √ | 19 | 56 | 56 | 85 | |||||
| √ | 5 | 15 | 15 | 100 | |||||
| √ | 0 | 0 | 0 | 100 | |||||
| Total | 34 | 100 | 100 | - | |||||
| Knowledge based activities | √ | 4 | 33.67 | 34 | 34 | ||||
| √ | 2 | 16.33 | 16 | 50 | |||||
| √ | 2 | 16.33 | 16 | 66 | |||||
| √ | 3 | 25.51 | 26 | 92 | |||||
| √ | 1 | 8.16 | 8 | 100 | |||||
| Total | 12 | 100 | 100 | - | |||||
| Intellectual based and micro level activities | √ | 1 | 10 | 10 | 10 | ||||
| √ | 1 | 10 | 10 | 20 | |||||
| √ | 2 | 20 | 20 | 40 | |||||
| √ | 3 | 30 | 30 | 70 | |||||
| √ | 3 | 30 | 30 | 100 | |||||
| Total | 10 | 100 | 100 | - | |||||
Table 4.
Descriptive statistics of the interviewee’s Organizational employment level in all five sectors of the economic sectors model.
Table 4.
Descriptive statistics of the interviewee’s Organizational employment level in all five sectors of the economic sectors model.
| Frequency | Percentage | Credit percentage | Cumulative percentage | ||||
|---|---|---|---|---|---|---|---|
| Senior Management | Department Management | Department Expert | QTY | ||||
| Resource based and extractive activities | √ | 3 | 30 | 30 | 30 | ||
| √ | 4 | 40 | 40 | 70 | |||
| √ | 3 | 30 | 30 | 100 | |||
| Total | 10 | 100 | 100 | - | |||
| Manufacturing based activities | √ | 15 | 93.75 | 94 | 94 | ||
| √ | 1 | 6.25 | 6 | 100 | |||
| √ | 0 | 0 | 0 | 100 | |||
| Total | 16 | 100 | 100 | - | |||
| Service based activities | √ | 33 | 97.98 | 98 | 98 | ||
| √ | 0 | 0 | 0 | 98 | |||
| √ | 1 | 2.02 | 2 | 100 | |||
| Total | 34 | 100 | 100 | - | |||
| Knowledge based activities | √ | 8 | 66.67 | 67 | 67 | ||
| √ | 3 | 25.25 | 25 | 92 | |||
| √ | 1 | 8.08 | 8 | 100 | |||
| Total | 12 | 100 | 100 | - | |||
| Intellectual based and micro level activities | √ | 7 | 70 | 70 | 70 | ||
| √ | 2 | 20 | 20 | 90 | |||
| √ | 1 | 10 | 10 | 100 | |||
| Total | 10 | 100 | 100 | - | |||
Table 5.
Descriptive statistics of the interviewees work experience in all five sectors of the economic sectors model.
Table 5.
Descriptive statistics of the interviewees work experience in all five sectors of the economic sectors model.
| Frequency | Percentage | Credit percentage | Cumulative percentage | |||||
|---|---|---|---|---|---|---|---|---|
| Lower than 5 | 5 Up to 10 | 10 Up to 15 | Upper than 15 | QTY | ||||
| Resource based and extractive activities | √ | 1 | 10 | 10 | 10 | |||
| √ | 0 | 0 | 0 | 10 | ||||
| √ | 5 | 50 | 50 | 60 | ||||
| √ | 4 | 40 | 40 | 100 | ||||
| Total | 10 | 100 | 100 | - | ||||
| Manufacturing based activities | √ | 0 | 0 | 0 | 0 | |||
| √ | 5 | 31.25 | 31 | 31 | ||||
| √ | 6 | 37.5 | 38 | 69 | ||||
| √ | 5 | 31.25 | 31 | 100 | ||||
| Total | 16 | 100 | 100 | - | ||||
| Service based activities | √ | 2 | 5.9 | 5 | 5 | |||
| √ | 8 | 23.52 | 24 | 29 | ||||
| √ | 8 | 23.52 | 24 | 53 | ||||
| √ | 16 | 47.06 | 47 | 100 | ||||
| Total | 34 | 100 | 100 | - | ||||
| Knowledge based activities | √ | 0 | 0 | 0 | 0 | |||
| √ | 5 | 41.41 | 41 | 41 | ||||
| √ | 0 | 0 | 0 | 41 | ||||
| √ | 7 | 58.59 | 59 | 100 | ||||
| Total | 12 | 100 | 100 | - | ||||
| Intellectual based and micro level activities | √ | 2 | 20 | 20 | 20 | |||
| √ | 3 | 30 | 30 | 50 | ||||
| √ | 1 | 10 | 10 | 60 | ||||
| √ | 4 | 40 | 40 | 100 | ||||
| Total | 10 | 100 | 100 | - | ||||
Table 6.
The order table of the numerical values (based on the weighted index) of the seven P’s marketing mix indicators in resource-based and extractive activities (Inconsistency rate: 0.01).
Table 6.
The order table of the numerical values (based on the weighted index) of the seven P’s marketing mix indicators in resource-based and extractive activities (Inconsistency rate: 0.01).
| Name of the index | Weighted value | Rank |
|---|---|---|
| People | 0.265 | 1 |
| Process | 0.217 | 2 |
| Product | 0.176 | 3 |
| Price | 0.144 | 4 |
| Promotion | 0.091 | 5 |
| Place | 0.057 | 6 |
| Physical evidence | 0.051 | 7 |
Table 7.
The order table of the numerical values (based on the weighted index) of the seven P’s marketing mix indicators in the manufacturing based activities (Inconsistency rate: 0.03).
Table 7.
The order table of the numerical values (based on the weighted index) of the seven P’s marketing mix indicators in the manufacturing based activities (Inconsistency rate: 0.03).
| Name of the index | Weighted value | Rank |
|---|---|---|
| Process | 0.200 | 1 |
| Product | 0.172 | 2 |
| Price | 0.161 | 3 |
| People | 0.132 | 4 |
| Place | 0.120 | 5 |
| Promotion | 0.112 | 6 |
| Physical evidence | 0.103 | 7 |
Table 8.
The order table of the numerical values (based on the weighted index) of the seven P’s marketing mix indicators in the service based activities (Inconsistency rate: 0.04).
Table 8.
The order table of the numerical values (based on the weighted index) of the seven P’s marketing mix indicators in the service based activities (Inconsistency rate: 0.04).
| Name of the index | Weighted value | Rank |
|---|---|---|
| Process | 0.190 | 1 |
| People | 0.174 | 2 |
| Product | 0.172 | 3 |
| Place | 0.145 | 4 |
| Price | 0.109 | 5 |
| Physical evidence | 0.106 | 6 |
| Promotion | 0.102 | 7 |
Table 9.
The order table of the numerical values (based on the weighted index) of the seven P’s marketing mix indicators in the Knowledge based activities (Inconsistency rate: 0.06).
Table 9.
The order table of the numerical values (based on the weighted index) of the seven P’s marketing mix indicators in the Knowledge based activities (Inconsistency rate: 0.06).
| Name of the index | Weighted value | Rank |
|---|---|---|
| Product | 0.194 | 1 |
| Process | 0.190 | 2 |
| Place | 0.149 | 3 |
| Promotion | 0.139 | 4 |
| Physical evidence | 0.131 | 5 |
| People | 0.130 | 6 |
| Price | 0.067 | 7 |
Table 10.
The order table of the numerical values (based on the weighted index) of the seven P’s marketing mix indicators in the Intellectual based and micro level activities (Inconsistency rate: 0.05).
Table 10.
The order table of the numerical values (based on the weighted index) of the seven P’s marketing mix indicators in the Intellectual based and micro level activities (Inconsistency rate: 0.05).
| Name of the index | Weighted value | Rank |
|---|---|---|
| People | 0.228 | 1 |
| Process | 0.186 | 2 |
| Promotion | 0.166 | 3 |
| Product | 0.145 | 4 |
| Physical evidence | 0.110 | 5 |
| Price | 0.087 | 6 |
| Place | 0.078 | 7 |
4. Discussion
Our main goal in conducting this research has been to achieve a reasonable prioritization of 7Ps marketing mix components in each part of the economic sectors model. Designing a questionnaire according to the standard of the hierarchical model, data collection through an interview conducted by the statistical community consisting of members, guilds and non-profit institutions has been identified and determined. In addition, the marketing mix is always have been used as an efficient tool to identify the potential of the target market, and the results of our research can be used as a premise to have a positive impact on the implementation methods and ideas of marketers.
In this regard, after collecting data from the statistical population, we processed the data and the obtained results indicate the prioritization and preference of each of the 7Ps marketing mix components in each separate section of the economic sectors model. In connection with research with common topics, researchers have been able to analyze the marketing mix in a specific and separate area in their target market and using different methods and software versions to prioritize their criteria and get the desired results and get optimal access. In line with this research, we tried from the beginning to develop an effective strategy, to have a holistic view of our research topic and especially an efficient tool such as marketing mix.
Therefore, we have focused on the prioritization of the marketing mix components in each part of the economic sectors model to achieve a default in order to express the priority of each of these components in each economic sector. Due to the wide variety in geographic, legal and organizational fields as well as economic activities in each of the five sectors of the economic sectors model, researchers can consider each of the sectors separately in a more detailed manner and conduct their investigations.
5. Conclusions
A. In the realm of resource based and extractive activities, a comprehensive assessment and ranking of the components of the seven P marketing mix suggest that the combination of knowledgeable and adept personnel, coupled with an effective operational procedure, culminates in the generation of a superior quality product. Based on the findings from the interviews, a favorable product regardless of its price is perceived as a form of promotion and is preferred over advertisements, location, and physical evidence.
B. The production of a suitable product in manufacturing activities is contingent upon the implementation of a suitable process. The pricing of a product is determined by the interplay of the production process and the attributes of the product. One potential approach for manufacturers to consider when determining a pricing strategy for their organization is to carefully assess both the production process and the nature of the product itself. The overarching viewpoint expressed by the interview participants within this particular economic domain is that individuals possessing moderate or conventional levels of expertise are capable of acclimating to the professional milieu and ultimately contributing to the creation of high-caliber goods. This is contingent upon the provision of suitable operational procedures and a sufficient passage of time. Typically, the geographical location of a place does not hold significant importance in the context of production-oriented activities, as production can feasibly occur in various locations. However, consideration should be given to geographical suitability for production, as well as the availability of facilities and logistical resources related to production. Within this particular economic sector, similarly to the preceding sector, there exists a prevalent belief that the creation of a high-quality product resulting from an appropriate manufacturing process can serve as an effective form of advertising.
C. In the context of service-based activities, the implementation of an effective process and the utilization of skilled and experienced personnel will significantly influence the quality of the end product. The prevalence of intense competition within the economic sector, coupled with the implementation of diverse pricing strategies, prioritizes emphasis on price over physical evidence and promotion. The participants in the interview place greater emphasis on the constant evaluation of their services and products by customers, leading them to assign less significance to promotion and physical evidence in comparison to other components.
D. In the realm of knowledge-based activities, the ultimate output within this industry will be utilized as a source of knowledge by their stakeholders or clientele. Having a structured methodology for the production and elucidation of a particular product can significantly enhance the development of knowledge-driven products within this economic domain. Moreover, the extent to which an organization is able to access its audience and customers is directly correlated with its operational effectiveness and efficiency. The prioritization of promotion over physical evidence, people, and price is often favored. One example of this phenomenon is the implementation of a strategic and effective promotional campaign, which can persuade a significant portion of contacts or customers to further leverage the products generated within the knowledge-based industry. The interviewees within this particular economic sector assert that knowledge-based activities are not governed by a materialistic viewpoint or price-based thinking. The primary objective of engaging in these activities is to disseminate knowledge and deliver enduring services to stakeholders and clientele associated with the organization.
E. In the domain of intellectual and macro-level activities, it is essential for employees within this economic sector to possess a high level of skills and knowledge. This sector of economic activities assumes a critical role in shaping macro-level decisions that influence society. Despite the presence of a strong and dependable executive process at the intellectual and macro levels, achieving progress and optimal productivity at the societal level, constituted by the organization’s audience and customers, is still feasible. By employing successful promotion strategies, the commodities of this particular economic domain can be presented to the public and consumers in a favorable manner, allowing for a more informed selection of products within this sector. The provision of a suitable product can be achieved despite the presence of skilled employees, a favorable process, and appropriate advertising or information. Hence, the placement of the product component within this ranking appears to be rational. One perspective posits that the decision-making process is predominantly influenced by general and intellectual factors from the standpoint of the interviewees. Consequently, it is argued that the price component carries less significance, and pricing indicators can be implemented using any strategy. In this sector of the economy, geographic location does not significantly impact decision-making processes, as critical decisions can be formulated within the organization and subsequently executed at alternative locations. In this industry, decision-making encompasses vast geographical areas, and precise geographical location is of minimal significance in the formulation of macro-level decisions.
Funding
This research received no external funding
Conflicts of Interest
The authors declare no conflicts of interest.
References
- Jain, R. and S. Jain. Analyzing and Exploring the Effectiveness of Each Element of 7Ps of Marketing Mix. International Journal of All Research Education and Scientific Methods (IJARESM) 2022, 10, 2455–6211. [Google Scholar]
- Ariq, F., N. Muna, and R.F. Syumantra. Analysing Segmenting, Targeting, and Positioning to Formulate Global Marketing Strategy for Asahan’s Opak Crackers. Journal Of Social Research 2022, 1, 91–100. [Google Scholar] [CrossRef]
- Ryńca, R. and Y. Ziaeian. Applying the goal programming in the management of the 7P marketing mix model at universities-case study. PloS one 2021, 16, e0260067. [Google Scholar] [CrossRef] [PubMed]
- Xi, X. and Q. Qin. Product quality evaluation system based on AHP fuzzy comprehensive evaluation. Journal of Industrial Engineering and Management (JIEM) 2013, 6, 356–366. [Google Scholar]
- Dinu, D.G., et al. Competitive Intelligence and Neuro-Technologies: The New Strategic Tools to Boost The Digital Economy. International Journal of Business and Management Invention 2022, 11, 39. [Google Scholar]
- Jadon, R., RELATIONSHIP BETWEEN MARKET ORIENTATION AND SERVICE QUALITY: WITH REFERENCE TO INDIAN BANKS IN RAJASTHAN.
- Jaas, A. E-marketing and its strategies: Digital opportunities and challenges. Open Journal of Business and Management 2022, 10, 822–845. [Google Scholar] [CrossRef]
- Dong, H. Marketing View of Core Competence Cultivating on Business Majors in Private Universities. International Business Research 2022, 15, 110. [Google Scholar]
- Xin, J. Overview and Prospect of Marketing Strategies Categories. in 2022 7th International Conference on Social Sciences and Economic Development (ICSSED 2022). 2022. Atlantis Press.
- Osuagwu, L. SALIENT ISSUES in MARKETING ANALYTICS. British Journal of Marketing Studies 2022, 10, 32–46. [Google Scholar]
- Arceta, N.R. , International Journal of Tourism and Hospitality. 2022.
- Ahmed, Y. and Y. Helhel. The Satisfaction Level of Tourist’s Marketing Mix Components in Aden City. Journal of Global Tourism and Technology Research 2022, 3, 50–67. [Google Scholar] [CrossRef]
- Wedel, M. and P. Kannan. Marketing analytics for data-rich environments. Journal of marketing 2016, 80, 97–121. [Google Scholar] [CrossRef]
- Kusuma, N.C. and A. Furinto, Tapping the New Source of Growth: New Marketing Strategy for a Heavy Equipment Distributor in the Nickel-Mining Sector.
- Ngai, E.W. and Y. Wu. Machine learning in marketing: A literature review, conceptual framework, and research agenda. Journal of Business Research 2022, 145, 35–48. [Google Scholar] [CrossRef]
- Napitulu, F.R., et al. Influence of MarketingMix Strategy onZayurku’s Business Plan. American International Journal of Business Management 2022, 5, 69–77. [Google Scholar]
- Chummee, P. The examination of marketing innovations for community enterprise, Thailand. Turkish Journal of Computer and Mathematics Education (TURCOMAT) 2022, 13, 198–202. [Google Scholar]
- Huang, Y. Meng, and J. Tan. The Impact of Health Consciousness on Organic Lipstick Market. in 2022 7th International Conference on Social Sciences and Economic Development (ICSSED 2022). 2022. Atlantis Press.
- Wang, G. The Application of 7P Analysis Model in the Market Strategy-Taking the Beauty Industry as an Example. in 2022 7th International Conference on Financial Innovation and Economic Development (ICFIED 2022). 2022. Atlantis Press.
- Badri, M.A. A combined AHP–GP model for quality control systems. International Journal of Production Economics 2001, 72, 27–40. [Google Scholar] [CrossRef]
- Saaty, T.L. An exposition of the AHP in reply to the paper “remarks on the analytic hierarchy process. Management science 1990, 36, 259–268. [Google Scholar] [CrossRef]
- Baby, S. AHP modeling for multicriteria decision-making and to optimise strategies for protecting coastal landscape resources. International Journal of Innovation, Management and Technology 2013, 4, 218. [Google Scholar] [CrossRef]
- BALAN, E. and M. SAEED. An efficiency analysis of the Malaysian economic sectors: Policy or institution implications. Journal of Advanced Research in Social Sciences and Humanities 2021, 6, 26–40. [Google Scholar]
- Ilieva-Nawfal, E. Radical innovations as a drive of Industrial Revolutions. Science. Business. Society 2020, 5, 25–28. [Google Scholar]
Disclaimer/Publisher’s Note: The statements, opinions and data contained in all publications are solely those of the individual author(s) and contributor(s) and not of MDPI and/or the editor(s). MDPI and/or the editor(s) disclaim responsibility for any injury to people or property resulting from any ideas, methods, instructions or products referred to in the content. |
© 2024 by the authors. Licensee MDPI, Basel, Switzerland. This article is an open access article distributed under the terms and conditions of the Creative Commons Attribution (CC BY) license (http://creativecommons.org/licenses/by/4.0/).
Copyright: This open access article is published under a Creative Commons CC BY 4.0 license, which permit the free download, distribution, and reuse, provided that the author and preprint are cited in any reuse.


