
Submitted:
04 August 2024
Posted:
05 August 2024
You are already at the latest version
Abstract
The main purpose of this study was to create a prototype of an unmanned aerial system equipped with intelligent hardware and software technologies necessary for monitoring the health and growth of crops in orchards. Another important objective was to use low-cost sensors that accurately measure ultraviolet solar radiation. The device, which needs to be attached to the commercial DJI Mini 4 Pro drone, should be small in size, portable, and have very low energy consumption. For this purpose, the widely used Vishay VEML6075 digital optical sensor was selected and implemented in a prototype, alongside a Raspberry Pi Zero 2W minicomputer. To collect data from these sensors, a program written in Python was used, containing specific blocks for data acquisition from each sensor, to facilitate the monitoring of ultraviolet (UV) radiation, or battery current. By analyzing the data obtained from the sensors, several important conclusions are drawn that may provide valuable pathways for the further development of mobile or modular equipment. Furthermore, the results of the plant condition analysis with proposed models in the Geographic Information System (GIS) environment were also presented. The visualization of maps indicating variations in vegetation condition led to the identification of problem areas like hydric stress.
Keywords:
drone
; sensors
; UV radiation
; orchard
; vineyard
; GIS
1. Introduction
The integrated unmanned aerial vehicle (UAV) system for monitoring orchards and vineyards is an advanced aerial technology solution designed to facilitate the efficient management and supervision of fruit trees and vine crops. This system uses drones equipped with cutting-edge technology to collect valuable data and information about plant health and environmental conditions.
Drones equipped with sensors and high-resolution cameras that allow for the capture of detailed aerial images of orchards and vineyards are capable of covering large areas of land, including regions that are difficult to access using traditional monitoring methods [1,2,3]. Monitoring environmental conditions that affect crop growth and development by accurately measuring parameters with digital sensors for humidity, temperature, and UV radiation, as well as capturing aerial images and videos for visual analysis of plant health, or integrating with GIS software, enables early detection of issues and the taking of proactive measures to optimize plant health and crop yield [4].
In refs. [5,6,7], an analysis is presented on the latest technologies and innovations concerning the equipping of drones with sensors, which are essential for monitoring and data collection. Additionally, Popescu et al. [8] analyze the implementation of the latest neural network systems in UAV-based orchard monitoring. The complex features, databases, software, and performance achieved using such applications are highlighted. A low-cost mobile device, based on a UAV and a Geiger-Müller counter ZP 1200 for real-time detection of environmental gamma radiation, was developed by Signing et al. in ref. [9] The equipment also includes an electronic circuit for processing and modeling the detected pulses, with high resistance to temperature variations. Ji et al. [10] proposed and developed a technical solution based on a drone for monitoring radiation in contaminated areas. The system’s performance using two detectors with high energy resolution was very high. Similarly, Kezoudi et al. [11] present a comprehensive study on the development of new sensor systems implemented in UAV measurements in environmental sciences and the necessity of their integration into global networks.
UV-B radiation, which is part of the ultraviolet spectrum of sunlight, can have significant effects on fruit trees in orchards and grapevines. These effects can be both negative and positive, depending on the intensity of the radiation and the susceptibility of the exposed plant species. UV-B radiation can influence the growth of fruit trees by reducing leaf area and total biomass [12]; leaves may become thicker and more protected against radiation, but this can incur an energy cost and potentially reduce the rate of photosynthesis. Similar responses are observed in grapevines, with a reduction in leaf area and potential impacts on photosynthetic processes, which can negatively influence grape yield and quality [13].
Effects on photosynthesis and physiology include a reduction in the photosynthetic efficiency of plants due to damage to chloroplasts and inhibition of photosynthetic processes. There is also a decrease in stomata conductance and transpiration, thereby affecting the water balance and nutrition of the plants. The quality of fruits and grapes is significantly diminished, with radiation impacting the chemical composition, including the content of sugars, organic acids, and phenolic compounds. In some cases, the antioxidant potential and organoleptic qualities of the products can be altered [14].
Plants can develop adaptations, such as increasing the thickness of the cuticle and epidermal layers, to reduce UV-B penetration. Additionally, growers can use various management practices, such as shading nets, the application of protective treatments, and the selection of UV-B-resistant varieties, to mitigate the negative effects. The increase in UV-B radiation due to ozone layer depletion has potentially harmful effects on plant growth and performance. Pal et al. [15], in studies conducted on dicotyledonous mung beans, highlighted that ambient levels of UV-B radiation appear to inhibit optimal plant growth.
Teramura [16] and Kramer et al. [17], studying the influence of UV-B radiation on the anatomical and morphological characteristics of plants, observed common this induced changes such as reduced plant stature, decreased leaf area and total biomass, as well as alterations in biomass distribution among the different plant organs. In sensitive plants, damage to cells and tissues appears on the upper epidermis of leaves in the form of burns, glazing, and chlorosis [18]. Epidermal transmittance in the UV region decreases in irradiated leaves. This decrease is mainly associated with the stimulation of flavonoid biosynthesis and is considered a protective, screening response against the harmful effects of UV-B radiation. There is considerable variability in UV-B sensitivity between different species.
Mirecki and Teramura [19] indicate that both anatomical/morphological and physiological/biochemical factors contribute to plants’ sensitivity to UV-B radiation. UV-B irradiated leaves also exhibited a decrease in stomata conductance compared to non-irradiated leaves. These reductions are significantly correlated with the observed decrease in photosynthesis rates. UV-B radiation also significantly reduced transpiration rates. Longo-Minnolo et al. [20] determined vegetation indices using the QGIS program by combining spectral bands detected with the raster method, as evaluating the water status of the crop is fundamental for implementing precision irrigation criteria in the field. Their results indicated that there is a weak correlation between the spectral bands and the traditional stem water potential during the rapid fruit growth stage.
Understanding UV-B radiation intensity values thus becomes an important aspect for implementing protection strategies by developing and applying appropriate measures to shield crops from the harmful effects of radiation, minimize the impact on the quality and quantity of agricultural products, and ensure healthy plant growth.
The aim of this work includes the development of an innovative modular digital system that can be easily integrated into a low-cost commercial drone for quantifying UV-B radiation values. This system, together with its other components, aims to be a valuable tool for agronomists, domain experts, or farmers in monitoring the health of crops in orchards and vineyards, ultimately ensuring that interventions are appropriate and effective. The proposed aim leads to the following research objectives:
a) Designing adaptive hardware and software architectures for UV-B radiation monitoring systems;
b) Ensuring compliance with local regulations regarding the use of drones and specialized sensors, as well as decision-support procedures and rules under conditions of uncertainty;
c) Storing data in an easily accessible and analyzable format, preferably with loca-tion and time metadata for seamless integration into GIS systems.
2. Materials and Methods
2.1. Bibliometric Analysis
The present study assumes a bibliometric analysis to evaluate academic performance and identify innovative approaches, and emerging research trends related to this topic. This understanding of current research allows us to incorporate the latest discoveries and stay up-to-date with the state of the art in the field. The selected scientific databases are presented in Table 1 and contain scientific information focused on the interdisciplinary field, including drone technology. The key terms defined in the paper title were searched in these databases [21].
Table 1 presents the search results and includes the name of the digital database, the search period, and the number of articles found. During the searches, approximately 1,500 documents were identified. The data show the number of available articles in four different scientific databases over three time periods: 2010-2015, 2015-2020, and 2020-2024. It is notable that the Google Scholar database has shown a significant increase in the number of articles over time, from 85 articles in the 2010-2015 periods to 362 in the 2015-2020 period, and 1,190 in the 2020-2024 periods. This increase may indicate a growing research interest in the specific field, a rise in the number of available publications, or an expansion of the database’s coverage. Additionally, the most rapid growth is evident in the last 5 years, which may reflect both a broader coverage, including a diverse range of sources and fields, and a typical period for technological development.
The databases such as IEEE Xplore, Springer Link, and ACM Digital Library show more moderate increases, possibly due to a focus on more specific fields or more selective publications. Through consultation and evaluating these works, methodologies, experimental configurations, and presented results were examined. Finally, we also need to validate a significant portion of the findings and conclusions, ensuring that the work is based on solid scientific evidence and contributes to the overall reliability of the field.
2.2. Route Planning
Route planning for a drone (Figure 1) using Bézier curves involves utilizing these to define a smooth and controlled path between various points of interest (Figure 2).
Bézier curves are often used in autonomous navigation to plan precise and controlled routes. To guide a drone from an initial position to a final position while following specific reference points that are randomly distributed within the workspace with predefined coordinates, predictive control, and Bézier curve generation algorithms are applied. Generally, the quadratic Bézier curve algorithm is used to enable the mobile robot to avoid obstructing obstacles during flight maneuvers.
A quadratic Bézier curve is a parametric curve used in computer graphics and several related fields. In the literature, the Bézier curve algorithm has been used to generate trajectories for various systems. The equation for a Bézier curve of degree n is described by the following equation [22]:
where: Pi - are the i points on the curve and - is the Bernstein polynomial, t0 - is initial time, ti - is time correspondent to points i, h - is prediction horizon time, with values in range (0 … 1). This term) is determined by relation:
with, i ∈ {0, 1, 2,.. ,n}.
It is well known that if constructed with a large number of control points, Bézier curves become numerically unstable (Figure 3). For this reason, in practice, it is preferable to combine low-degree Bézier curves smoothly for route planning [23]. The basic requirement for route planning is to pass through the starting point and the final point at different desired speeds. The lowest degree of Bézier curve that can satisfy this requirement is three.
Cubic Bézier curves used for route planning are denoted by:
with, i ∈ {0,..,M} where M is the total number of Bézier curves.
The planned trajectory P(t) for, t ∈ [t0,tM] is represented as:
2.3. Hardware Components
2.3.1. The VEML6075 sensor
The VEML6075 sensor (Figure 4) is a UV radiation sensor that measures the intensity of UV-A and UV-B radiation. It uses two separate channels to detect UV-A (315-400 nm) and UV-B (280-315 nm) radiation (Figure 5a) [26]. Using these measurements, an ultraviolet index (UVI) can also be calculated, providing an assessment of the potential for sunburn caused by UV radiation exposure [3]. An I2C interface (Figure 5b) ensures communication with a microcontroller or other host device. Compensation algorithms used in signal processing minimize interference effects and ensure more accurate measurements [27]. These algorithms eliminate any initial offset or sensor non-uniformity, ensuring that the recorded values accurately reflect the UV radiation present. Additionally, the sensor employs a filter to minimize the influence of visible light and infrared light, which could affect UV radiation measurements. The recorded values are adjusted to compensate for any contamination outside the UV spectrum. Since optical sensors can be sensitive to temperature changes, measurements are adjusted to account for temperature variations, ensuring accuracy in varying environmental conditions [28,29]. This aspect is particularly important. The sensor is used in various applications, including portable devices, weather stations, and environmental monitoring systems, to assess UV radiation exposure and help prevent sunburn and other related health issues.
2.3.2. UPS HAT Waveshare 19739
Functional characteristics of the UPS HAT Waveshare 19739 Device are shown in Table 2.
The UPS HAT Waveshare 19739 (Figure 6a) is an accessory designed to provide an uninterrupted power supply for development boards, such as the Raspberry Pi Zero 2W (Figure 6b). It mounts directly onto the development board via the GPIO interface and offers a range of functionalities and features that make it ideal for applications requiring continuity and reliability. The compact dimensions allow for easy integration without taking up much space or affecting access to other ports and connectors. It is equipped with a protection circuit to prevent damage to the battery (Figure 6c) and development board by avoiding situations of overcharging or complete discharge. The Waveshare 19739 HAT is equipped with a 1000mAh Li-Po battery (see Figure 6c), which provides a significant energy reserve to keep the measurement device operational during the monitoring process [30]. The functional specifications of the device are detailed in Table 2. Additionally, it includes status LEDs that indicate the battery charging status, power level,
The connection with Raspberry Pi Zero series boards is made through the 6 Pogo pins mounted on the board [8]. For optimal battery charging while protecting the battery from overcharging and excessive discharge, an ETA6003 integrated circuit is used [31]. To increase the input voltage to a higher output voltage, the TPS61088 DC-DC boost regulator from Texas Instruments can provide an output voltage of up to 5V or more, depending on the circuit configuration. The TPS61088 is an essential component for applications requiring efficient voltage conversion, offering a reliable solution for voltage boosting in a variety of electronic devices [32].
Used in battery management systems (BMS) to measure the state of charge and energy consumption, the INA219 is a voltage and current monitoring integrated circuit manufactured by Texas Instruments [33,34]. It is designed to accurately measure the voltage over a range of up to ±32V between the power and reference terminals. It supports currents up to ±3.2A (depending on configuration and the values of the shunt resistors used). It uses the I2C interface for communication with microcontrollers and other devices, allowing measurements to be read and configured through a two-wire connection (SDA and SCL).
Protection chips, such as the S8261, are essential for the safe and efficient use of Li-Po batteries, which are sensitive to extreme operating conditions [35]. Also in this category is the FS8205, a dual MOSFET chip that allows current switching both on the charging and discharging paths of the battery [36]. These chips are widely used in portable electronic devices, drones, electric vehicles, and other applications where battery reliability and safety are critical [37].
2.3.3. The Raspberry Pi Zero 2 W
The Raspberry Pi Zero 2 W is a compact single-board computer developed by the Raspberry Pi Foundation, ideal for a wide range of applications that require a small and energy-efficient device [38]. Featuring a 1 GHz ARM Cortex-A53 quad-core processor, part of the Broadcom BCM2710A1, System on Chip (SoC), and 512 MB LPDDR2 SDRAM, it offers notable performance for various automation projects, Internet of Things ( IoT) applications, as a data collection node or control unit in IoT networks, or for controlling robots and other mobile devices [39]. The general purpose input/output (GPIO) pins are compatible with other modules and accessories developed for Raspberry Pi, allowing users to add additional functionalities. It includes Wi-Fi: 802.11b/g/n/ac (dual-band) for wireless connectivity and Bluetooth: Bluetooth 4.2, Bluetooth Low Energy (BLE) for connecting peripheral devices. The operating system is compatible with Raspberry Pi OS (Raspbian) as well as other Linux distributions optimized for ARM [40,41,42,43].
2.3.4. The DJI Mini 4 Pro
The DJI Mini 4 Pro is one of the smallest and lightest drones in the DJI series, weighing less than 250 grams. It is equipped with a high-performance camera capable of capturing high-resolution images and 4K video at 60 frames per second. The camera features a 1-inch sensor, which provides superior image quality even in low-light conditions. Video stabilization is ensured by a 3-axis Gimbal, which helps capture smooth and stable footage.
The flight time is up to 34 minutes, depending on flight conditions and usage. It includes advanced obstacle avoidance systems with sensors on the front, rear, and bottom for safe navigation, reducing the risk of accidents. GPS and GLONASS technology offers precise positioning and accurately set the drone’s trajectory. Intelligent features allow the drone to automatically return to the takeoff point in case of weak signal, low battery, or at the user’s command. It supports video transmission over a distance of up to 10 km, providing a stable and high-quality data stream.
3. Results and Discussion
The experimental location is a 3765 m² plot of clayey soil with a fine texture but poor drainage, situated at the Faculty of Biotechnical Systems Engineering within the campus of the National University of Science and Technology POLITEHNICA Bucharest (takeoff/landing coordinates 44.440218° N and 26.045350° E), as shown in Figure 7a. The site’s topography is relatively homogeneous and flat. The plot is oriented north-south, with an average slope of less than 0.23%. Monitoring activities were conducted in an orchard containing various species, such as apple trees, pear trees, plum trees, cherry trees, peach trees, apricot trees, and sour cherry trees, located near the vineyard.
The experiments presented in this study, which can be classified as open-type operations, were carried out under maximum safety conditions concerning other aircraft, infrastructure, and individuals. According to the regulations of the Romanian Civil Aeronautical Authority (AACR), flight activities must occur within the visual line of sight of the UAS Pilot (VLOS), in a controlled/ uncontrolled airspace at a maximum altitude of 120 meters above ground level to avoid collisions.
Therefore, the flight missions were designed in compliance with these regulations (according to flight request No. 10139 – 202473091447 approved by the Ministry of National Defense). To analyze vegetation indices, several flight missions were conducted [44]. A photogrammetric test was performed to map the crop height by capturing images focused on the point of interest (POI) defined during the flight trajectory design (see Figure 2). Processing of aerial images captured at the selected points along the route (Figure 7b) and photogrammetry was done using the open-source platform WebODM.
Processing a Digital Surface Model (DSM) involves several steps, from data acquisition to analysis [45]. Figure 8 illustrates the use of aerial photos taken by a drone equipped with a high-quality camera, capturing multiple overlapping images from different angles to create the 3D DSM. The camera features a 1/1.3-inch CMOS sensor, with a photo resolution of 48 MP and a video resolution of up to 4K at 60fps. The lens used has an equivalent focal length of 24 mm, an aperture of f/1.7, and a field of view of 82.1°. The three-dimensional digital model (DSM) represents the elevation of features on the Earth’s surface and includes all elements above ground level, such as buildings, trees, and other structures, to characterize and analyze the heights of these elements. The 2D element is removed by extending the 3D model to a certain height. Various parameters, such as the length, circumference, perimeter, and area of the building under reconstruction, can be calculated using the DSM [46].
Green Leaf Index (GLI) is a vegetation index used to assess the presence and health of green vegetation. Like other vegetation indices, GLI is calculated based on the reflectance of light in different spectral bands and is used to highlight differences between green vegetation and other types of surfaces, as shown in Figure 9. The formula for calculating the GLI index is [47]:
where: G is the reflectance value in the green channel, R is the reflectance value in the red channel, and B is the reflectance value in the blue channel.
GLI = (2G – R - B) /(2G + R + B)
The GLI index leverages the fact that green vegetation reflects more light in the green band and absorbs more light in the red and blue bands. By increasing the weight of the green channel and decreasing the contribution of the red and blue channels, GLI enhances signals from green vegetation. Because it is simple to calculate and can be derived from images captured with standard RGB cameras, it is highly accessible for a wide range of applications in ecology, agriculture, and natural resource management [48,49].
To detect water content in vegetation and water-covered surfaces, a spectral index called the Normalized Difference Water Index (NDWI) is used. NDWI helps identify areas with high moisture or water and is useful in various applications, including agricultural monitoring, water resource management, and natural disaster assessment [20]. NDWI is calculated using reflectance values in specific spectral bands, typically near-infrared (NIR) and the green band. The general formula/relationship for NDWI is:
Reflectance in the green band G (typically around 0.55 µm) is chosen because this wavelength is sensitive to leaf moisture and water content in vegetation. Reflectance in the near-infrared band NIR (typically between 0.76 and 0.90 µm) is reduced in the presence of water, as water strongly absorbs this wavelength [50]. High positive NDWI values, as shown in Figure 10, indicate the presence of water or vegetation with high water content; healthy and moist vegetation has lower reflectance in the NIR band and higher reflectance in the green band, leading to positive NDWI values. Low positive NDWI values suggest healthy vegetation but with lower water content or a moist area. Negative or near-zero values observed on the NDWI index map in Figure 10 predominantly indicate dry soils, exposed soil surfaces, or vegetation stressed by water scarcity.
To quantify vegetation density and reduce the influence of soil reflectance on measurements, the Soil Adjusted Vegetation Index (SAVI) is used. It is a modification of the Normalized Difference Vegetation Index (NDVI). The SAVI index (see Figure 11) is particularly useful in areas where vegetation is sparse or there is significant soil exposure, which can affect NDVI measurements. The calculation relationship for the SAVI index includes a soil adjustment factor, which helps to compensate for this effect [51], and is:
where: L is a soil adjustment factor that ranges between 0 and 1. A typical value for L is 0.5, but it can be adjusted depending on the specific soil and vegetation conditions.
The main advantage of SAVI is that it enhances the ability to differentiate between vegetation and soil, particularly in conditions where vegetation is sparse and soil reflectance significantly influences measurements.
The Excess Green Index (EXG) is a vegetation index used in remote sensing to emphasize the presence of green vegetation in images. Unlike indices such as NDVI or SAVI, which use information from the near-infrared spectrum, the EXG index relies solely on color channels from the visible spectrum, specifically differentiating between the green, red, and blue channels [52]. The formula/relationship for calculating the EXG index is:
High values of the EXG index, as shown in Figure 12, indicate a greater presence of green vegetation, while low or negative values indicate the absence of vegetation or the presence of other types of land cover, such as soil or buildings.
Burn Area Index (BAI) is a vegetation index used to identify and assess areas affected by wildfires. The BAI index (Figure 13) is based on the differences in spectral reflectance between green vegetation and burned soil or vegetation [53,54].
Green and healthy vegetation reflects more light in the visible and near-infrared spectrum, while burned vegetation exhibits different spectral characteristics, often reflecting less light in these ranges. The formula/relationship for calculating the BAI index is:
Evaluating repeatability is essential to ensure that an instrument or measurement process produces reliable and consistent results. Measurement repeatability refers to the consistency and stability of results obtained when a measurement is repeated under the same conditions. To determine repeatability and deviations due to temperature, the UV sensor Veml6075 was exposed to constant irradiation for 1 minute from a known 10W source, with temperature variation measured using the Bosch BME 680 digital sensor [55], as shown in Figure 14.
Four sets of consecutive measurements were taken, with repeatability assessed by calculating the coefficient of variation (CV), expressed as a percentage. This provides a relative measure of variation with respect to the mean and is determined using the following formula/relationship:
where: σ - is the standard deviation, Mean - is the mean of the series of values.
The coefficient of variation of 0.49% (Mean = 105 μW/cm²; σ = 0.52 μW/cm²) indicates good repeatability of the measurements, as the relative variation from the mean is small.
In Figure 15, the four data sets used to identify the temperature deviation coefficient of the VEML6075 sensor are presented. This data set indicates a systematic change in measurements after irradiation (of nearly 2.5°C) but without a significant increase in the variability of the measurements. The calculated temperature deviation coefficient of 1.093 (μW/cm²)/°C indicates that the sensor remains consistent in its measurements [56], even though there is a systematic change in the measured value.
In Figure 16, the graph shows the variation of UV-B radiation over time measured with the VEML6075 sensor during the planned flight mission. The data set does not indicate a significant increase in values within the range of 138-143 μW/cm² (with an average value of 140.74 μW/cm² and a standard deviation of 1.12). The coefficient of variation of 1.27% indicates that the sensor is stable in measurements. Figure 17 shows the histogram of the distribution of the obtained measurements, highlighting the variation and frequency of values recorded during the experiment. The histogram shows the frequency distribution for each bin. The x-axis represents the bins, and the y-axis shows the frequency of occurrences for each bin. The most frequent values are found in the range of 140 and 141, indicating a higher concentration of data values, around 61%, in these ranges.
Figure 18 prese Figure 18 presents the data obtained for monitoring the battery of the energy-independent modular system used to measure UV radiation attached to the drone. To determine the absolute error (Ea), the difference between the measured value (Vm) and the reference value (Vr) was calculated, with the relationship:
To determine the relative error (Er), the ratio between the absolute error (Ea) and the reference value (Vr) was calculated, expressed as a percentage:
In Figure 18a, the graph of the voltage measured with the INA 219 sensor can be seen; it shows that the average voltage value is 3.99 ∓ 0.007 V, resulting in a relative error of 0.15%. The maximum error of the measured voltage was 0.78% in the standard configuration, while the minimum error was 0.02%. From Figure 18b, it can be observed that the average current consumed by the module is 0.215 ∓ 0.035 A, resulting in an average relative error of 12.81%. According to the technical specifications of the INA219 sensor, it can detect a bidirectional current of up to 3200 mA [57,58]. Figures 18c and 18d present the graphs of the calculated data for energy consumption and battery charge level. Figure 18c illustrates the power consumption measured in watts (W) of the system during monitoring operations. The average consumption is 0.89 ∓ 0.16 W and varies depending on factors such as processor load, sensor activity, and other operational parameters [59,60]. Figure 18d shows the variation in battery charge level over time, from 84.4% to approximately 80.9%. The graph highlights how the battery discharges as the system operates, providing insight into battery life and energy consumption efficiency. The conclusion drawn from these results indicates that the INA219 sensor is accurate, and integrating these methods aims to monitor the energy consumption of autonomous mobile robots or industrial equipment.
Analyzing the aircraft’s behavior during the flight mission is essential for ensuring the success of future missions and optimizing the aircraft’s performance. This process helps identify and address issues, thereby improving the efficiency and safety of flight operations.
Communication between the drone and GPS satellites is fundamental for the navigation and efficient operation of UAVs. In Figure 19a, it can be seen that the drone’s GPS module received signals from multiple satellites (the minimum number was 15, and the maximum was 24) to calculate the three-dimensional position (latitude, longitude, and altitude) with precision [61,62]. The use of a high-quality GPS antenna indicates excellent signal reception capability and minimal interference effects. The good GPS signal level, with a value of 5, as well as the number of connected satellites, shows that the drone has excellent GPS coverage and can perform precise navigation.
Altitude measurement of the drone relative to the ground is performed using a barometric altimeter or a distance sensor and is useful for obstacle avoidance and maintaining a constant flight level relative to the terrain. In the diagram in Figure 19b, the variation in the drone’s altitude measured in meters is represented, with real-time information displayed on the remote control screen. The figure shows that a constant flight level of 24 meters was maintained along the planned trajectory. Then, to return to the takeoff position, the drone ascends to an altitude of approximately 35 meters to avoid certain obstacles, after which it lands at ground level, at the departure position.
The attitude of the drone represents the orientation of the drone’s coordinate system relative to the inertial coordinate system (ground-based). It reflects the rotation of the drone around its x, y, and z axes. In this case, applying the right-hand rule results in the three classic movements encountered in aircraft: roll, pitch, and yaw. Wind speed has a strong impact on the drone’s attitude and performance. Although artificial intelligence algorithms automatically adjust responses to commands based on wind conditions, improving stability and control, the drone’s stabilization systems must work harder, leading to increased energy consumption and, consequently, shorter flight duration. Figure 19c shows the variation in wind speed recorded during the flight, while Figure 19d presents the flight controller’s response, through the variation in pitch and roll angles, to counteract the effects of the wind and maintain the aircraft’s stability [63].
Analysis of the aircraft’s speed (especially during a flight mission) involves evaluating and interpreting data related to the aircraft’s flight speed to understand its performance and optimize the flight [64,65]. Optimizing speed helps achieve clear and detailed images. Figure 20 presents speed data recorded during the planned mission, taking into account the impact of wind, temperature, and other weather conditions on the speed of movement. The horizontal speed values recorded in the flight file are shown in the graph in Figure 20a, while the ascent/descent speed values are displayed in Figure 20d. These graphs (in the middle section) show that during the planned route, the speed is relatively constant, and there were no issues with stability and maneuverability, highlighting the control capability to maintain a steady trajectory. The speed values recorded in the movements along the OX and OY axes of the coordinate system are presented in Figs. 20b and 20c, respectively.
Generally, the speed values along the OX and OY axes are used to control and adjust the drone’s trajectory, allowing precise navigation. The maximum speed achieved by the drone in the OX direction was 3.89 m/s, while in the OY direction, the maximum speed was 5.29 m/s. Data recording occurred at an interval of 0.1 s. These data are also displayed on the remote control screen, used for real-time monitoring of the aircraft’s movement, ensuring precise navigation and effective mission management.
5. Conclusions
UV-B radiation has a complex impact on orchards and vineyards, and understanding these effects through continuous monitoring is essential for managing and optimizing agricultural production in the face of current climate changes. For this purpose, low-cost sensors were attached to the commercial drone used, to accurately measure the ultraviolet solar radiation
The use of drones and GIS in analysing plant health provides a significant ad-vantage in precision agriculture management. This combination of technologies enables efficient monitoring, rapid interventions, and resource optimization, contributing to improved production and reduced costs. Flight path planning using Bézier curves allows for smooth and controlled trajectories, which are crucial for the safe and efficient operation of drones, especially in complex or urban environments.
Analysis of data obtained from sensors can provide valuable avenues for further development of mobile or modular equipment. In addition, the results of the analysis of the state of the plantations with the model proposed in the GIS environment indicate the variations of the vegetation conditions and led to the identification of areas with problems such as water stress.
The study conducted has fully demonstrated its utility by expanding the knowledge base in the field of monitoring orchards and vineyards with a very low-cost solution compared to existing solutions.
Looking ahead, the use of AI algorithms to automatically detect diseases, pests or nutrient deficiencies based on drone images to predict future problems or optimizing harvest of the plantations is increasingly required.
Author Contributions
Conceptualization, G.I..; methodology G.I. F.I.; software, G.I.; validation, G.I., F.I.; formal analysis, F.I.,; investigation, G.I. F.I.,.; resources, G.I., F.I.; data curation, G.I., F.I.; writing—original draft preparation, G.I.; writing—review and editing, G.I., F.I.; visualization, G.I.,F.I.; supervision, G.I., F.I.,; project administration, F.I.; funding acquisition, G.I. All authors have read and agreed to the published version of the manuscript.
Funding
This research received no external funding.
Institutional Review Board Statement
Not applicable.
Informed Consent Statement
Not applicable.
Data Availability Statement
Data is contained within the article.
Conflicts of Interest
The authors declare no conflict of interest.
References
- Hung, C. , Xu Z., Sukkarieh S., Feature learning based approach for weed classification using high resolution aerial images from a digital camera mounted on a UAV. Remote Sensing 2014, 6, 12037–12054. [Google Scholar] [CrossRef]
- Malveaux, C. , Hall S.G., Price R., Using drones in agriculture: unmanned aerial systems for agricultural remote sensing applications, Paper number 141911016, 2014 Montreal, Quebec Canada July 13 – July 16, 2014. @2014. [CrossRef]
- Aasen, H. , Honkavaara E., Lucieer A., Zarco-Tejada P. J., Quantitative remote sensing at ultra-high resolution with UAV spectroscopy: a review of sensor technology, measurement procedures, and data correction workflows. Remote Sensing 2018, 10, 1091. [Google Scholar] [CrossRef]
- Ipate, G. , Voicu G., Dinu I., Research on the use of drones in precision agriculture. University Politehnica of Bucharest Bulletin Series 2015, 77, 1–12. [Google Scholar]
- Popescu, D. , Vlasceanu E., Dima M., Stoican F., Ichim L., Hybrid sensor network for monitoring environmental parameters. 28th Mediterranean Conference on Control and Automation (MED) 2020, 933–938. [Google Scholar] [CrossRef]
- Stamate, M.A. , Pupaza C., Nicolescu F.A., Moldoveanu, C.E., Improvement of Hexacopter UAVs Attitude Parameters Employing Control and Decision Support Systems. Sensors 2023, 23, 1446. [Google Scholar] [CrossRef] [PubMed]
- Digulescu, A. , Despina-Stoian C., Popescu F., Stanescu D.; Nastasiu D.; Sburlan D, UWB Sensing for UAV and Human Comparative Movement Characterization. Sensors 2023, 23, 1956. [Google Scholar] [CrossRef] [PubMed]
- Popescu, D. , Ichim L., Stoican F., Orchard monitoring based on unmanned aerial vehicles and image processing by artificial neural networks: a systematic review. Front. Plant Sci. 2023, 14, 1237695. [Google Scholar] [CrossRef] [PubMed]
- Signing, V.R.F. , Taamte J.M., Noube M.K., Abanda Z.S.O., Abba H.Y., Real-time environmental radiation monitoring based on locally developed low-cost device and unmanned aerial vehicle. Journal of Instrumentation 2023, 18, P05031. [Google Scholar] [CrossRef]
- Ji, Y.Y. , Min B.I., Suh K.S., Joung S., Kim K.P., Park J.H., Technical Status of Environmental Radiation Monitoring using a UAV and Its Field Application to the Aerial Survey. Journal of Korea Society of Industrial Information Systems 2020, 25, 31–39. [Google Scholar] [CrossRef]
- Kezoudi, M. , Keleshis C., Antoniou P., Biskos G., Bronz M., Constantinides C., Sciare J., The Unmanned Systems Research Laboratory (USRL): A new facility for UAV-based atmospheric observations. Atmosphere 2021, 12, 1042. [Google Scholar] [CrossRef]
- Dou, H. , Niu G., Gu M., Pre-harvest UV-B radiation and photosynthetic photon flux density interactively affect plant photosynthesis, growth, and secondary metabolites accumulation in basil (Ocimum basilicum) plants. Agronomy 2019, 9, 434. [Google Scholar] [CrossRef]
- Cambrolle, J. , García J.L., Ocete R., Figueroa M. E., Cantos M., Growth and photosynthetic responses to copper in wild grapevine. Chemosphere 2013, 93, 294–301. [Google Scholar] [CrossRef] [PubMed]
- Bonilla, V.; Campoverde, B. , Yoo S.G., A Systematic Literature Review of LoRaWAN: Sensors and Applications. Sensors 2023, 23, 8440. [Google Scholar] [CrossRef] [PubMed]
- Pal, M. , Sharma A., Abrol Y.P., Sengupta U.K., Exclusion of UV-B radiation from normal solar spectrum on the growth of mung bean and maize Agriculture. Ecosystems & Environment 1997, 61, 29–34. [Google Scholar] [CrossRef]
- Teramura, A.H. , Effects of ultraviolet-B radiation on the growth and yield of crop plants. Physiologia Plantarum 1983, 58, 415–427. [Google Scholar] [CrossRef]
- Kramer, G.F. , Krizek D.T., Mirecki R.M., Influence of photosynthetically active radiation and spectral quality on UV-B-induced polyamine accumulation in soybean. Phytochemistry 1992, 31, 1119–1125. [Google Scholar] [CrossRef]
- Dubey, R. , Gupta D.K., Sharma G.K., Chapter: Chemical stress on plants, In book: New frontiers in stress management for durable agriculture, Publisher: Springer 2020, 101-128. [CrossRef]
- Mirecki, R.M. , Teramura A.H., Effects of ultraviolet-B irradiance on soybean: V. The dependence of plant sensitivity on the photosynthetic photon flux density during and after leaf expansion. Plant physiology 1984, 74, 475–480. [Google Scholar] [CrossRef] [PubMed]
- Longo-Minnolo, G. , Consoli S., Vanella D., Guarrera S., Manetto G., Cerruto E., Appraising the stem water potential of citrus orchards from UAV-based multispectral imagery, IEEE International Workshop on Metrology for Agriculture and Forestry (MetroAgriFor), Pisa, Italy, 2023, 120-125. [CrossRef]
- Bonilla-Chaves, F.F. , Palos-Sánchez, P.R. Exploring the evolution of human resource analytics: a bibliometric study. Behavioral Sciences 2023, 13, 244. [Google Scholar] [CrossRef]
- Al-Mayyahi, A. , Aldair A.A., Rashid, A.T., Intelligent Control of Mobile Robot Via Waypoints Using Nonlinear Model Predictive Controller and Quadratic Bezier Curves Algorithm. J. Electr. Eng. Technol. 2020, 15, 1857–1870. [Google Scholar] [CrossRef]
- Choi, J. , Elkaim G.H., Bezier Curve for Trajectory Guidance, Proceedings of the World Congress on Engineering and Computer Science 2008, WCECS 2008, October 22 - 24, 2008, San Francisco, USA.
- Elhoseny, M. , Tharwat A., Hassanien, A.E., Bezier Curve Based Path Planning in a Dynamic Field using Modified Genetic Algorithm. Journal of Computational Science 2018, 25, 339–350. [Google Scholar] [CrossRef]
- Lai, R. , Wu Z., Liu X., Zeng N., Fusion Algorithm of the Improved A* Algorithm and Segmented Bézier Curves for the Path Planning of Mobile Robots. Sustainability 2023, 15, 2483. [Google Scholar] [CrossRef]
- Jiang, J. , High Altitude Balloon, PhD diss., Worcester Polytechnic Institute, 2020.
- Hassani, S. , Dackermann, U.A., Systematic Review of Advanced Sensor Technologies for Non-Destructive Testing and Structural Health Monitoring. Sensors 2023, 23, 2204. [Google Scholar] [CrossRef]
- Van de Giesen, N.; Steele-Dunne, S.C. , Jansen, J., Hoes, O., Hausner, M.B., Tyler, S., Selker, J., Double-Ended Calibration of Fiber-Optic Raman Spectra Distributed Temperature Sensing Data. Sensors 2012, 12, 5471–5485. [Google Scholar] [CrossRef] [PubMed]
- Zhang, D. , Zhou G., Estimation of Soil Moisture from Optical and Thermal Remote Sensing: A Review. Sensors 2016, 16, 1308. [Google Scholar] [CrossRef]
- Cicioni, G. , De Angelis A., Janeiro F.M., Ramos P.M., Carbone, P., Battery Impedance Spectroscopy Embedded Measurement System. Batteries 2023, 9, 577. [Google Scholar] [CrossRef]
- Zhang, Q. , Qu M., Liu X., Cui Y., Hu H., Li Q., Jin M., Xian J., Nie Z., Zhang C., Three-in-One Portable Electronic Sensory System Based on Low-Impedance Laser-Induced Graphene On-Skin Electrode Sensors for Electrophysiological Signal Monitoring. Adv. Mater. Interfaces 2023, 10, 2201735. [Google Scholar] [CrossRef]
- Xu, Q. , Yang D., Li M., Ren X., Yuan X., Tang L., Wang X., Liu S., Yang M., Liu Y., Yang M., Design and Verification of Piano Playing Assisted Hand Exoskeleton Robot. Biomimetics 2024, 9, 385. [Google Scholar] [CrossRef] [PubMed]
- Lambert, J. , Monahan R., Casey K., Power Consumption Profiling of a Lightweight Development Board: Sensing with the INA219 and Teensy 4.0 Microcontroller. Electronics 2021, 10, 775. [Google Scholar] [CrossRef]
- Maroşan, A. , Constantin G., Gîrjob C.E., Chicea A.L., Crenganis, M. Real time data acquisition of low-cost current sensors acs712-05 and ina219 using raspberry pi, daqcplate and node-red. Proceedings in Manufacturing Systems 2023, 18, 51–59. [Google Scholar]
- Huang, K. , Li Z. Yang C., Design of Battery System of Emergency Power Supply for Auxiliary Fan in the Coal-Mine, International Conference on Control, Automation and Systems Engineering (CASE), Singapore 2011, 1-6. [CrossRef]
- Guo C-Y., Lin T-L., Hsieh T-L., A Solar-Rechargeable Radiation Dosimeter Design for Radiation Hazard Zone Located with LoRa Network. Quantum Beam Sci. 2022, 6, 27. [CrossRef]
- Stoica, D. , Gmal Osman M., Strejoiu C. V., Lazaroiu G., Exploring Optimal Charging Strategies for Off-Grid Solar Photovoltaic Systems: A Comparative Study on Battery Storage Techniques. Batteries 2023, 9, 470. [Google Scholar] [CrossRef]
- Yamanoor, N.S. , Yamanoor S., High quality, low cost education with the Raspberry Pi, IEEE Global Humanitarian Technology Conference (GHTC), San Jose, CA, USA, 2017, 1-5. [CrossRef]
- Sunehra, D. , Jhansi B., Sneha R., Smart Robotic Personal Assistant Vehicle Using Raspberry Pi and Zero UI Technology, 6th International Conference for Convergence in Technology (I2CT), Maharashtra, India, 2021, 1-6. [CrossRef]
- Schwart, M. , Building Smart Homes with Raspberry Pi Zero, Packt Publishing Ltd. 2016.
- Alarcón-Paredes, A. , Francisco-García V., Guzmán-Guzmán I.P., Cantillo-Negrete J., Cuevas-Valencia R.E., Alonso-Silverio G.A., An IoT-based non-invasive glucose level monitoring system using raspberry pi. Applied Sciences 2019, 9, 3046. [Google Scholar] [CrossRef]
- Halfacree, G. The official Raspberry Pi Beginner’s Guide: How to use your new computer, 5th Edition, Raspberry Pi Press 2023.
- Janakiram, S. , Babu M., Jain S., Rai R., Mohan R., Safonova M., Murthy J., Development Of Raspberry Pi-based Processing Unit for UV Photon-Counting Detectors. Journal of Astronomical Instrumentation arXiv:2401.01443 or arXiv:2401.01443v2. 2024, 01443v2. [Google Scholar] [CrossRef]
- Sona,G. Sona,G., Passoni D., Pinto L., Pagliari D., Masseroni D., Ortuani B., Facchi A., UAV multispectral survey to map soil and crop for precision farming applications. The international archives of the photogrammetry. remote sensing and spatial information sciences 2016, 41, 1023–1029. [Google Scholar] [CrossRef]
- Alganci, U. , Besol B., Sertel E., Accuracy Assessment of Different Digital Surface Models. ISPRS Int. J. Geo-Inf. 2018, 7, 114. [Google Scholar] [CrossRef]
- Kim, S. , Rhee S., Kim T., Digital Surface Model Interpolation Based on 3D Mesh Models. Remote Sens. 2019, 11, 24. [Google Scholar] [CrossRef]
- Lu, Z. , Deng L., Lu H., An improved LAI estimation method incorporating with growth characteristics of field-grown wheat. Remote Sensing 2022, 14, 4013. [Google Scholar] [CrossRef]
- Thanyapraneedkul, J. , Muramatsu K., Daigo M., Furumi S., Soyama N., Nasahara K.N., Muraoka H., Noda H.M., Nagai S., Maeda T., Mano M., Misoguchi Y., A Vegetation Index to Estimate Terrestrial Gross Primary Production Capacity for the Global Change Observation Mission-Climate (GCOM-C)/Second-Generation Global Imager (SGLI) Satellite Sensor. Remote Sens. 2012, 4, 3689–3720. [Google Scholar] [CrossRef]
- Ribeiro, A.L.A. , Macie, G.M., Siquieroli A.C.S., Luz J.M.Q., Gallis R.B.d.A., Assis P.H.d.S., Catão H.C.R.M., Yada R.Y., Vegetation Indices for Predicting the Growth and Harvest Rate of Lettuce. Agriculture 2023, 13, 1091. [Google Scholar] [CrossRef]
- Ngo Thi, D. , Ha N.T.T., Tran Dang Q., Koike K., Mai Trong N., Effective band ratio of landsat 8 images based on VNIR-SWIR reflectance spectra of topsoils for soil moisture mapping in a tropical region. Remote Sensing 2019, 11, 716. [Google Scholar] [CrossRef]
- Zhen, Z. , Chen S., Yin T., Chavanon E., Lauret N., Guilleux J., Gastellu-Etchegorry J.P., Using the negative soil adjustment factor of soil adjusted vegetation index (SAVI) to resist saturation effects and estimate leaf area index (LAI) in dense vegetation areas. Sensors 2021, 21, 2115. [Google Scholar] [CrossRef] [PubMed]
- Zheng, H. , Cheng T., Li D., Zhou X., Yao X., Tian Y., Zhu, Y., Evaluation of RGB, color-infrared and multispectral images acquired from unmanned aerial systems for the estimation of nitrogen accumulation in rice. Remote Sensing 2018, 10, 824. [Google Scholar] [CrossRef]
- Fornacca, D. , Re, G., Xiao W. Evaluating the best spectral indices for the detection of burn scars at several post-fire dates in a mountainous region of Northwest Yunnan, China. Remote Sensing 2018, 10, 1196. [Google Scholar] [CrossRef]
- Han, A. , Qing S., Bao Y., Na L., Bao Y., Liu X., Wang C., Short-term effects of fire severity on vegetation based on sentinel-2 satellite data. Sustainability 2021, 13, 432. [Google Scholar] [CrossRef]
- Sunny, A.I. , Zhao A., Li L., Sakiliba S.K., Low-cost IoT-based sensor system: A case study on harsh environmental monitoring. Sensors 2020, 21, 214. [Google Scholar] [CrossRef] [PubMed]
- Goumopoulos, C. , A high precision, wireless temperature measurement system for pervasive computing applications. Sensors 2018, 18, 3445. [Google Scholar] [CrossRef] [PubMed]
- Wiyadi, E. , Wati A., Hamzah Y., Umar L. Simple IV acquisition module with high side current sensing principle for real time photovoltaic measurement. Journal of Physics: Conference Series IOP Publishing. 2020, 1528, 012040. [Google Scholar] [CrossRef]
- Prasetyawati, F.Y., Harjunowibowo, D., Fauzi, A., Utomo, B., Harmanto, D., Calibration and Validation of INA219 as Sensor Power Monitoring System using Linear Regression. AIUB Journal of Science and Engineering (AJSE) 2023, 22, 240–249. [CrossRef]
- Athanasadis, C. , Doukas D., Papadopoulos T., Chrysopoulos A., A scalable real-time non-intrusive load monitoring system for the estimation of household appliance power consumption. Energies 2021, 14, 767. [Google Scholar] [CrossRef]
- Khudhair, A.B. , Hussein F.I., Obeidi M.A., Creating a LabVIEW Sub VI for the INA219 sensor for detecting extremely low-level electrical quantities. Al-Khwarizmi Engineering Journal 2023, 19, 88–97. [Google Scholar] [CrossRef]
- Upadhyay, J. , Rawat A., Deb D., Multiple drone navigation and formation using selective target tracking-based computer vision. Electronics 2021, 10, 2125. [Google Scholar] [CrossRef]
- Liu, S. , Lu H., Hwang S.H., Three-Dimensional Indoor Positioning Scheme for Drone with Fingerprint-Based Deep-Learning Classifier. Drones 2024, 8, 15. [Google Scholar] [CrossRef]
- Stamate, M.A. , Pupaza C., Nicolescu F.A., Moldoveanu C.E., Improvement of hexacopter UAVs attitude parameters employing control and decision support systems. Sensors 2023, 23, 1446. [Google Scholar] [CrossRef] [PubMed]
- Chu, T. , Starek M. J., Berryhill J., Quiroga C., Pashaei M., Simulation and characterization of wind impacts on UAS flight performance for crash scene reconstruction. Drones 2021, 5, 67. [Google Scholar] [CrossRef]
- Doroftei D., De Cubber G., Bue S L., De Smet H., Quantitative Assessment of Drone Pilot Performance, preprints.org 2024, 2024071957. [CrossRef]
Figure 1.
Equipping the DJI Mini 4 Pro drone with the Vishay VEML 6075 digital sensor.
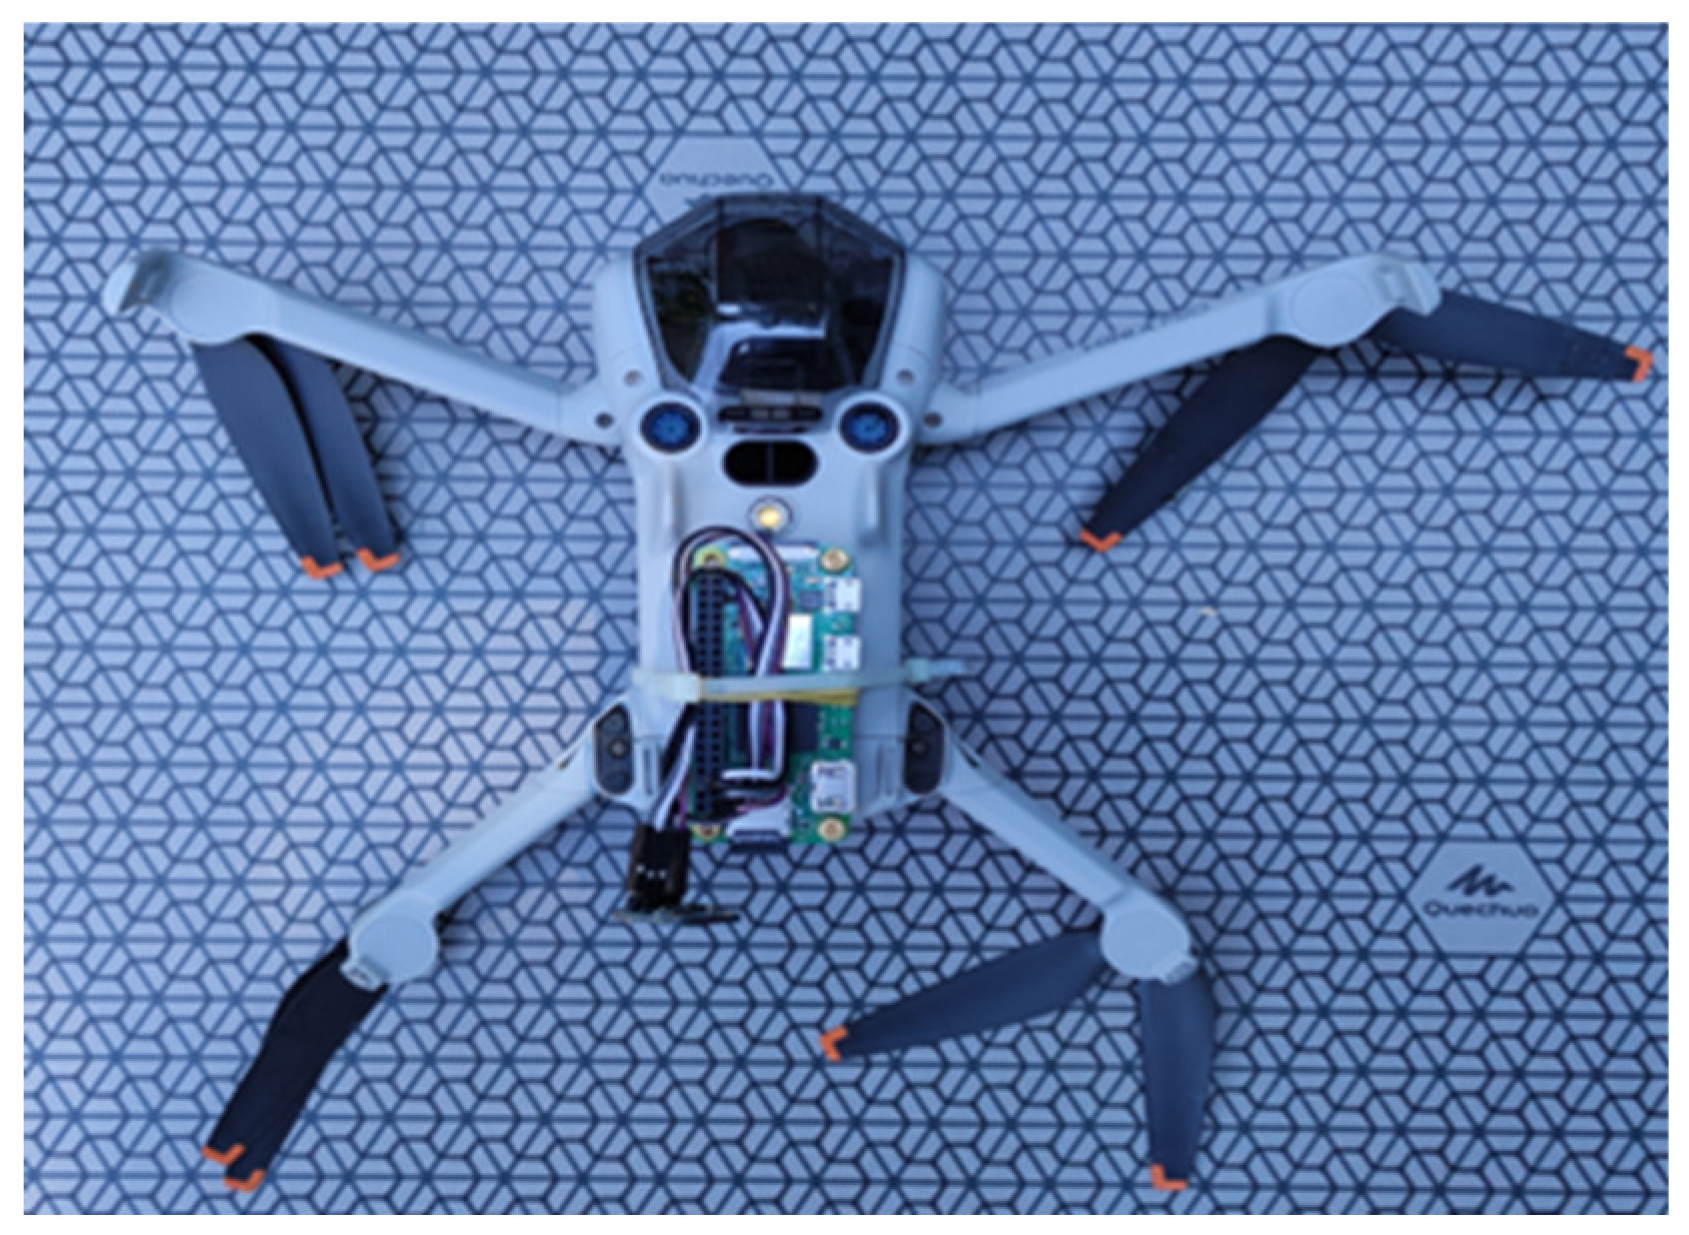
Figure 2.
Route Planning through Waypoints (screenshot).
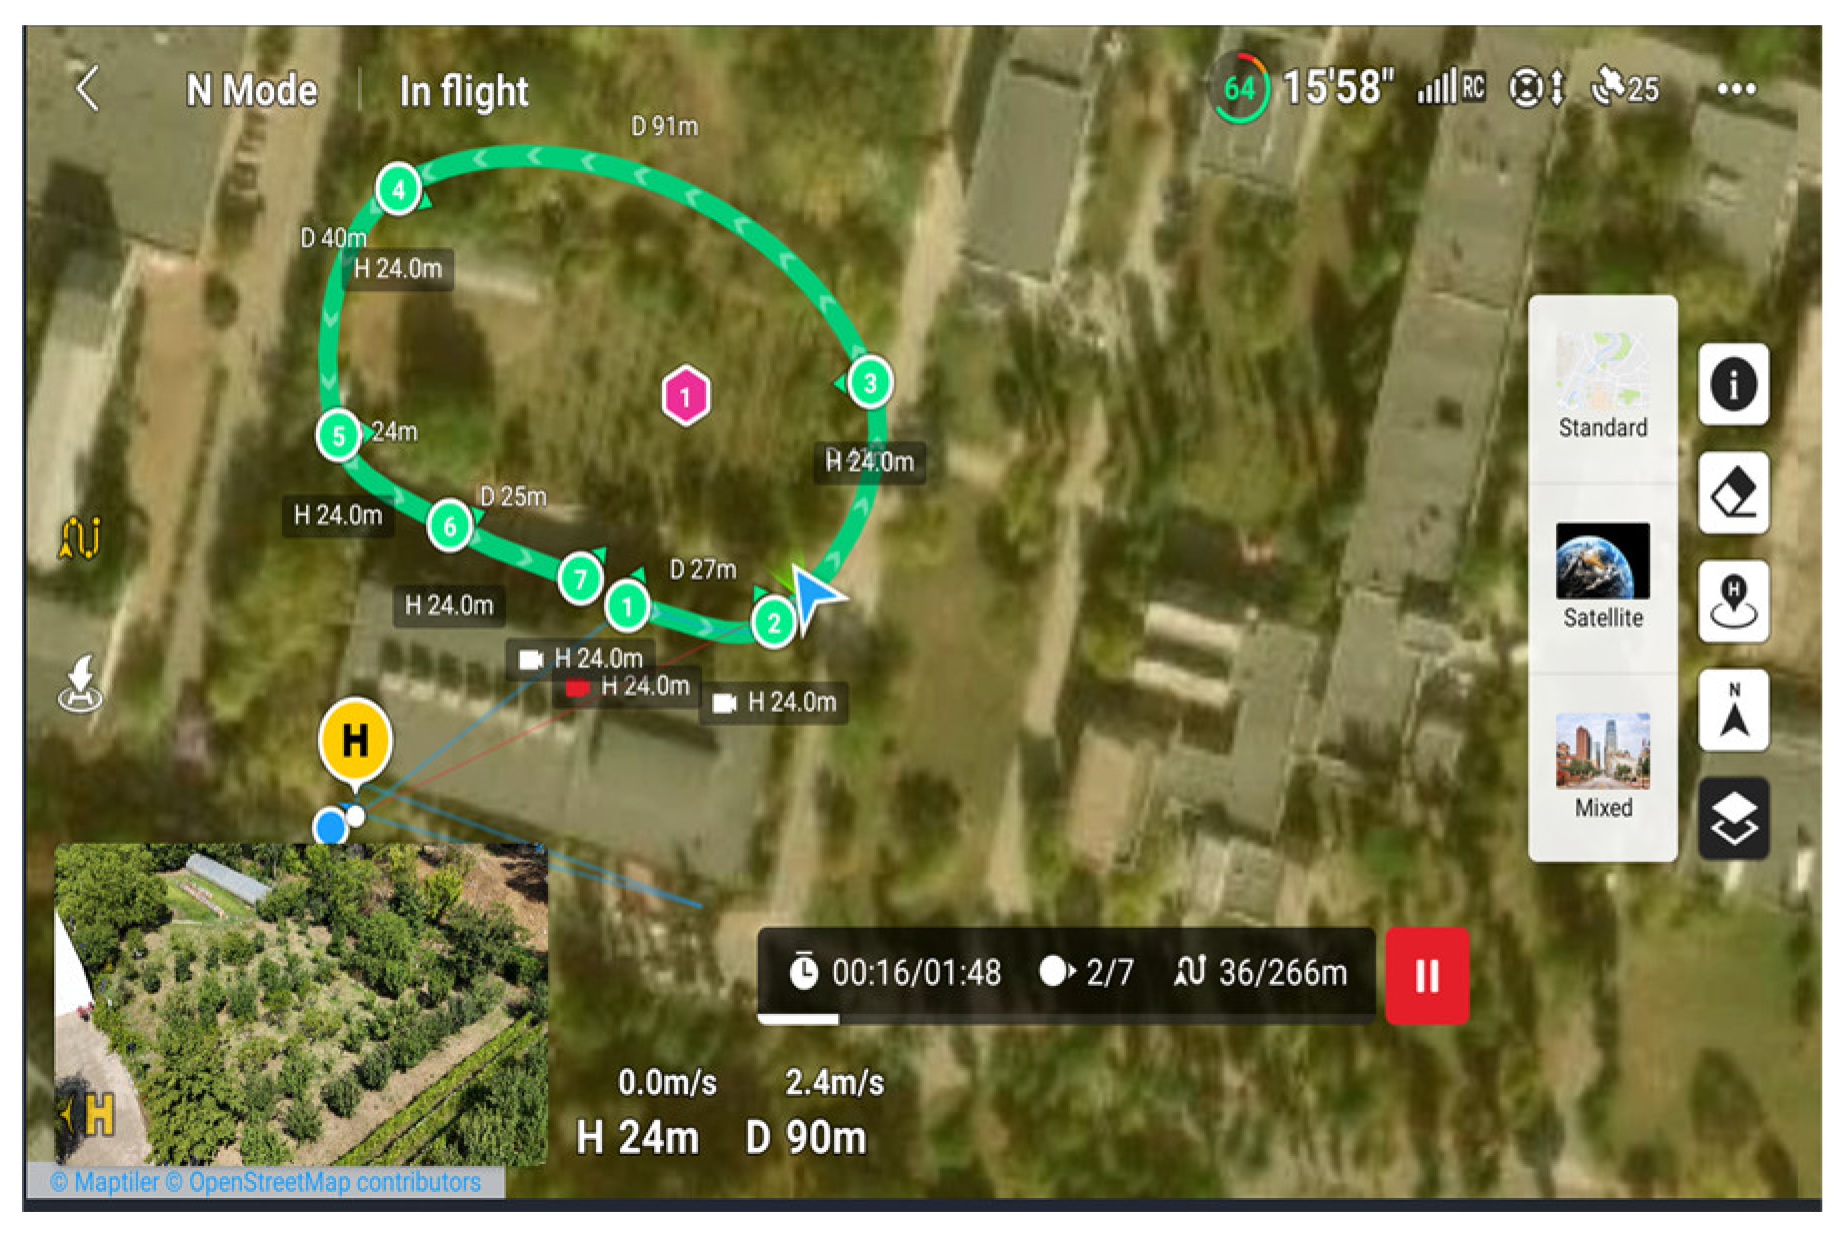
Figure 3.
Tracking simulation results (blue, orange, green) over the planned paths (red).
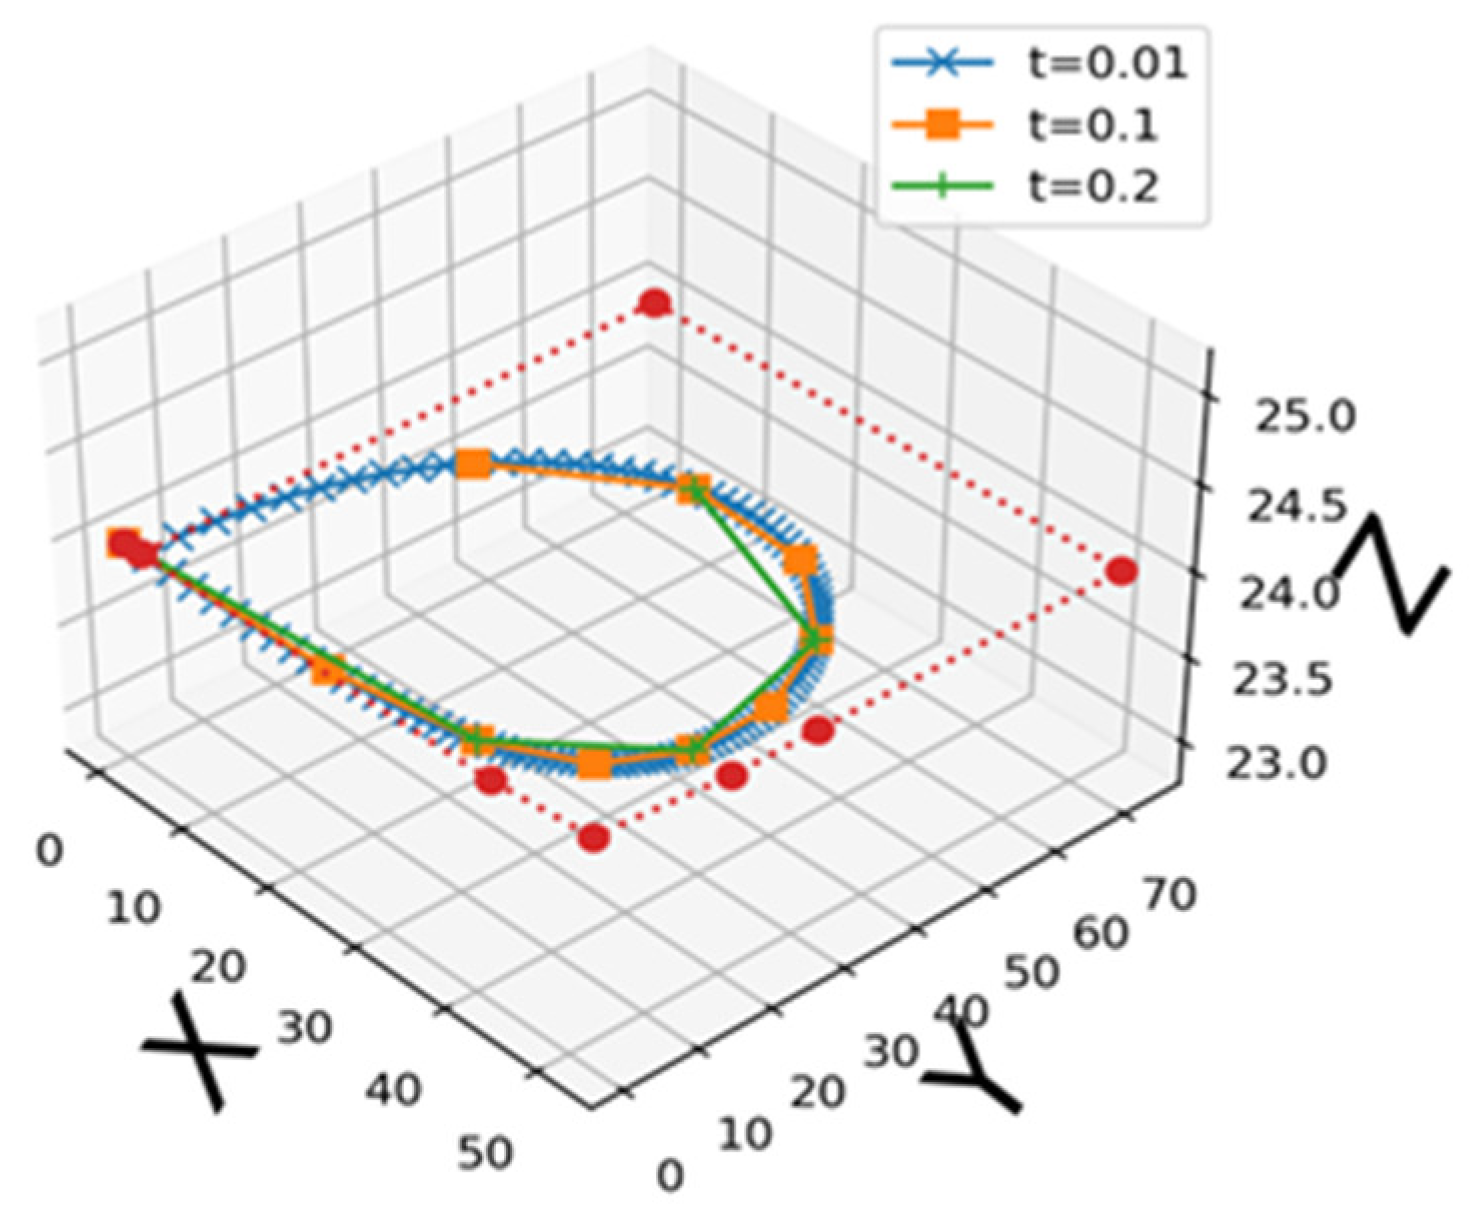
Figure 4.
Measurement process, UV Index calculation, and alarm diagram with Vishay VEML6075 sensor.
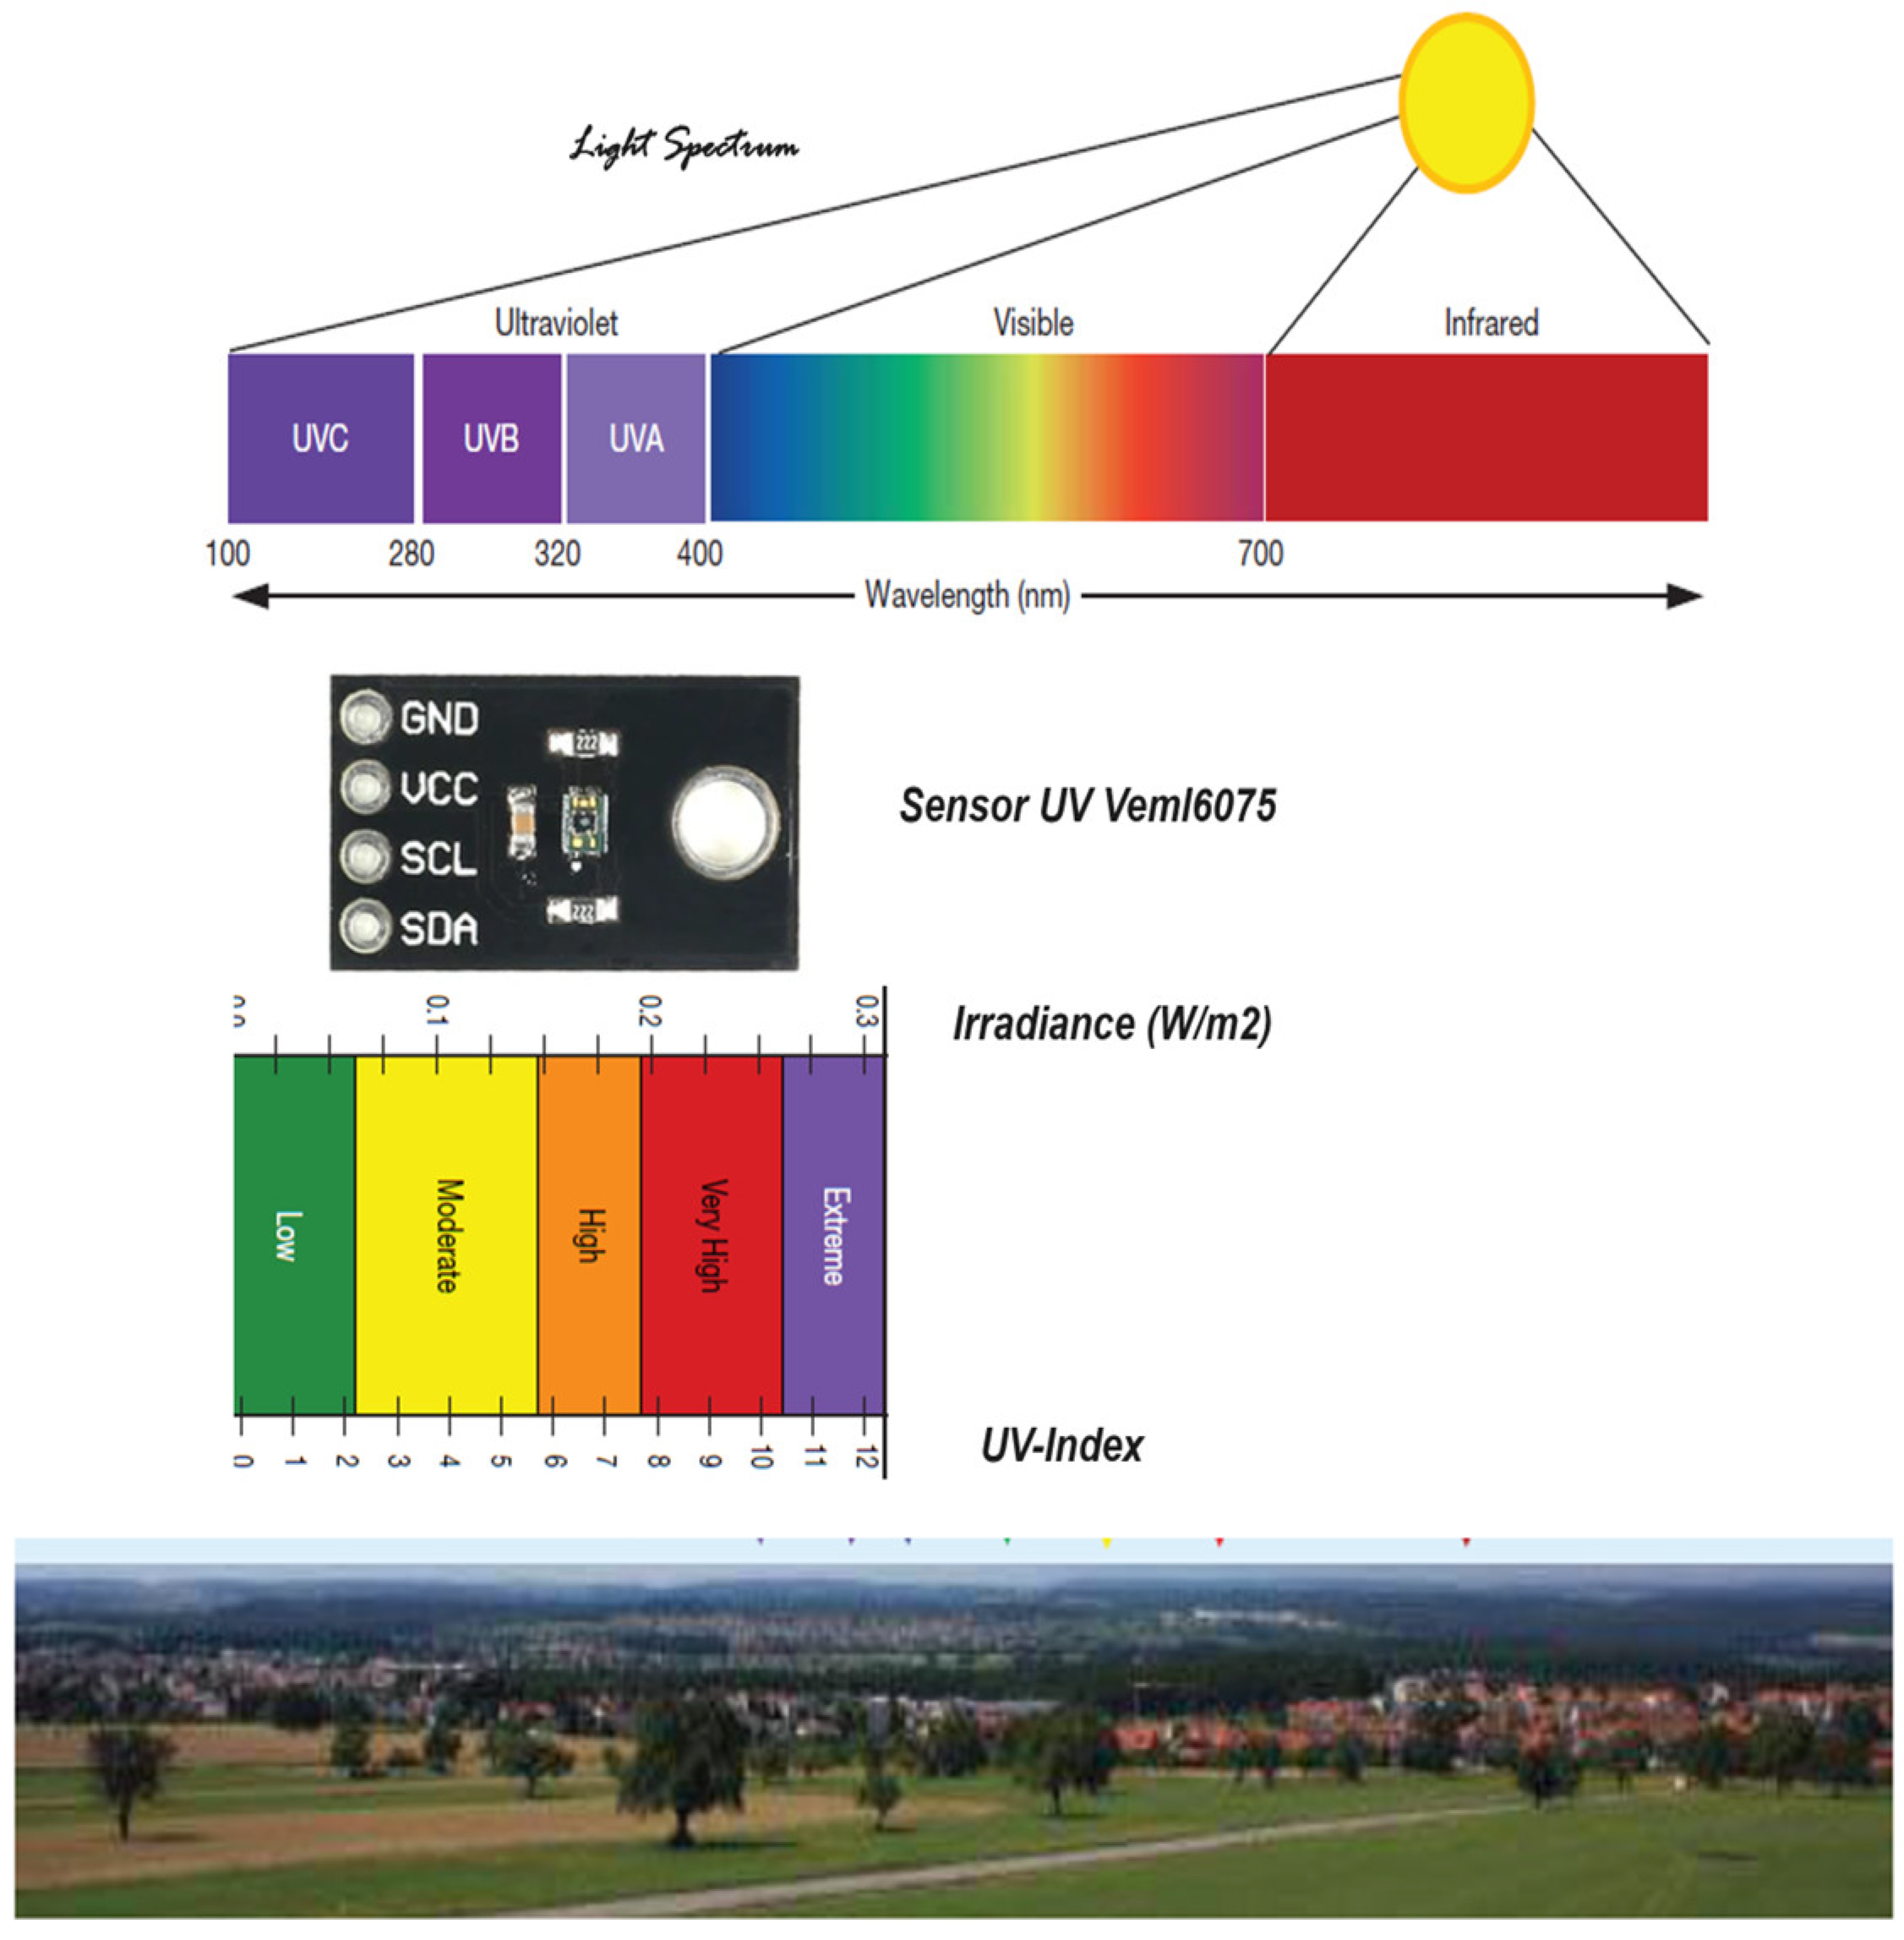
Figure 5.
Sensor VEML6075 specifications: (a) Spectral response function of sensors VEML6075; (b) I2C protocol interface.
Figure 5.
Sensor VEML6075 specifications: (a) Spectral response function of sensors VEML6075; (b) I2C protocol interface.
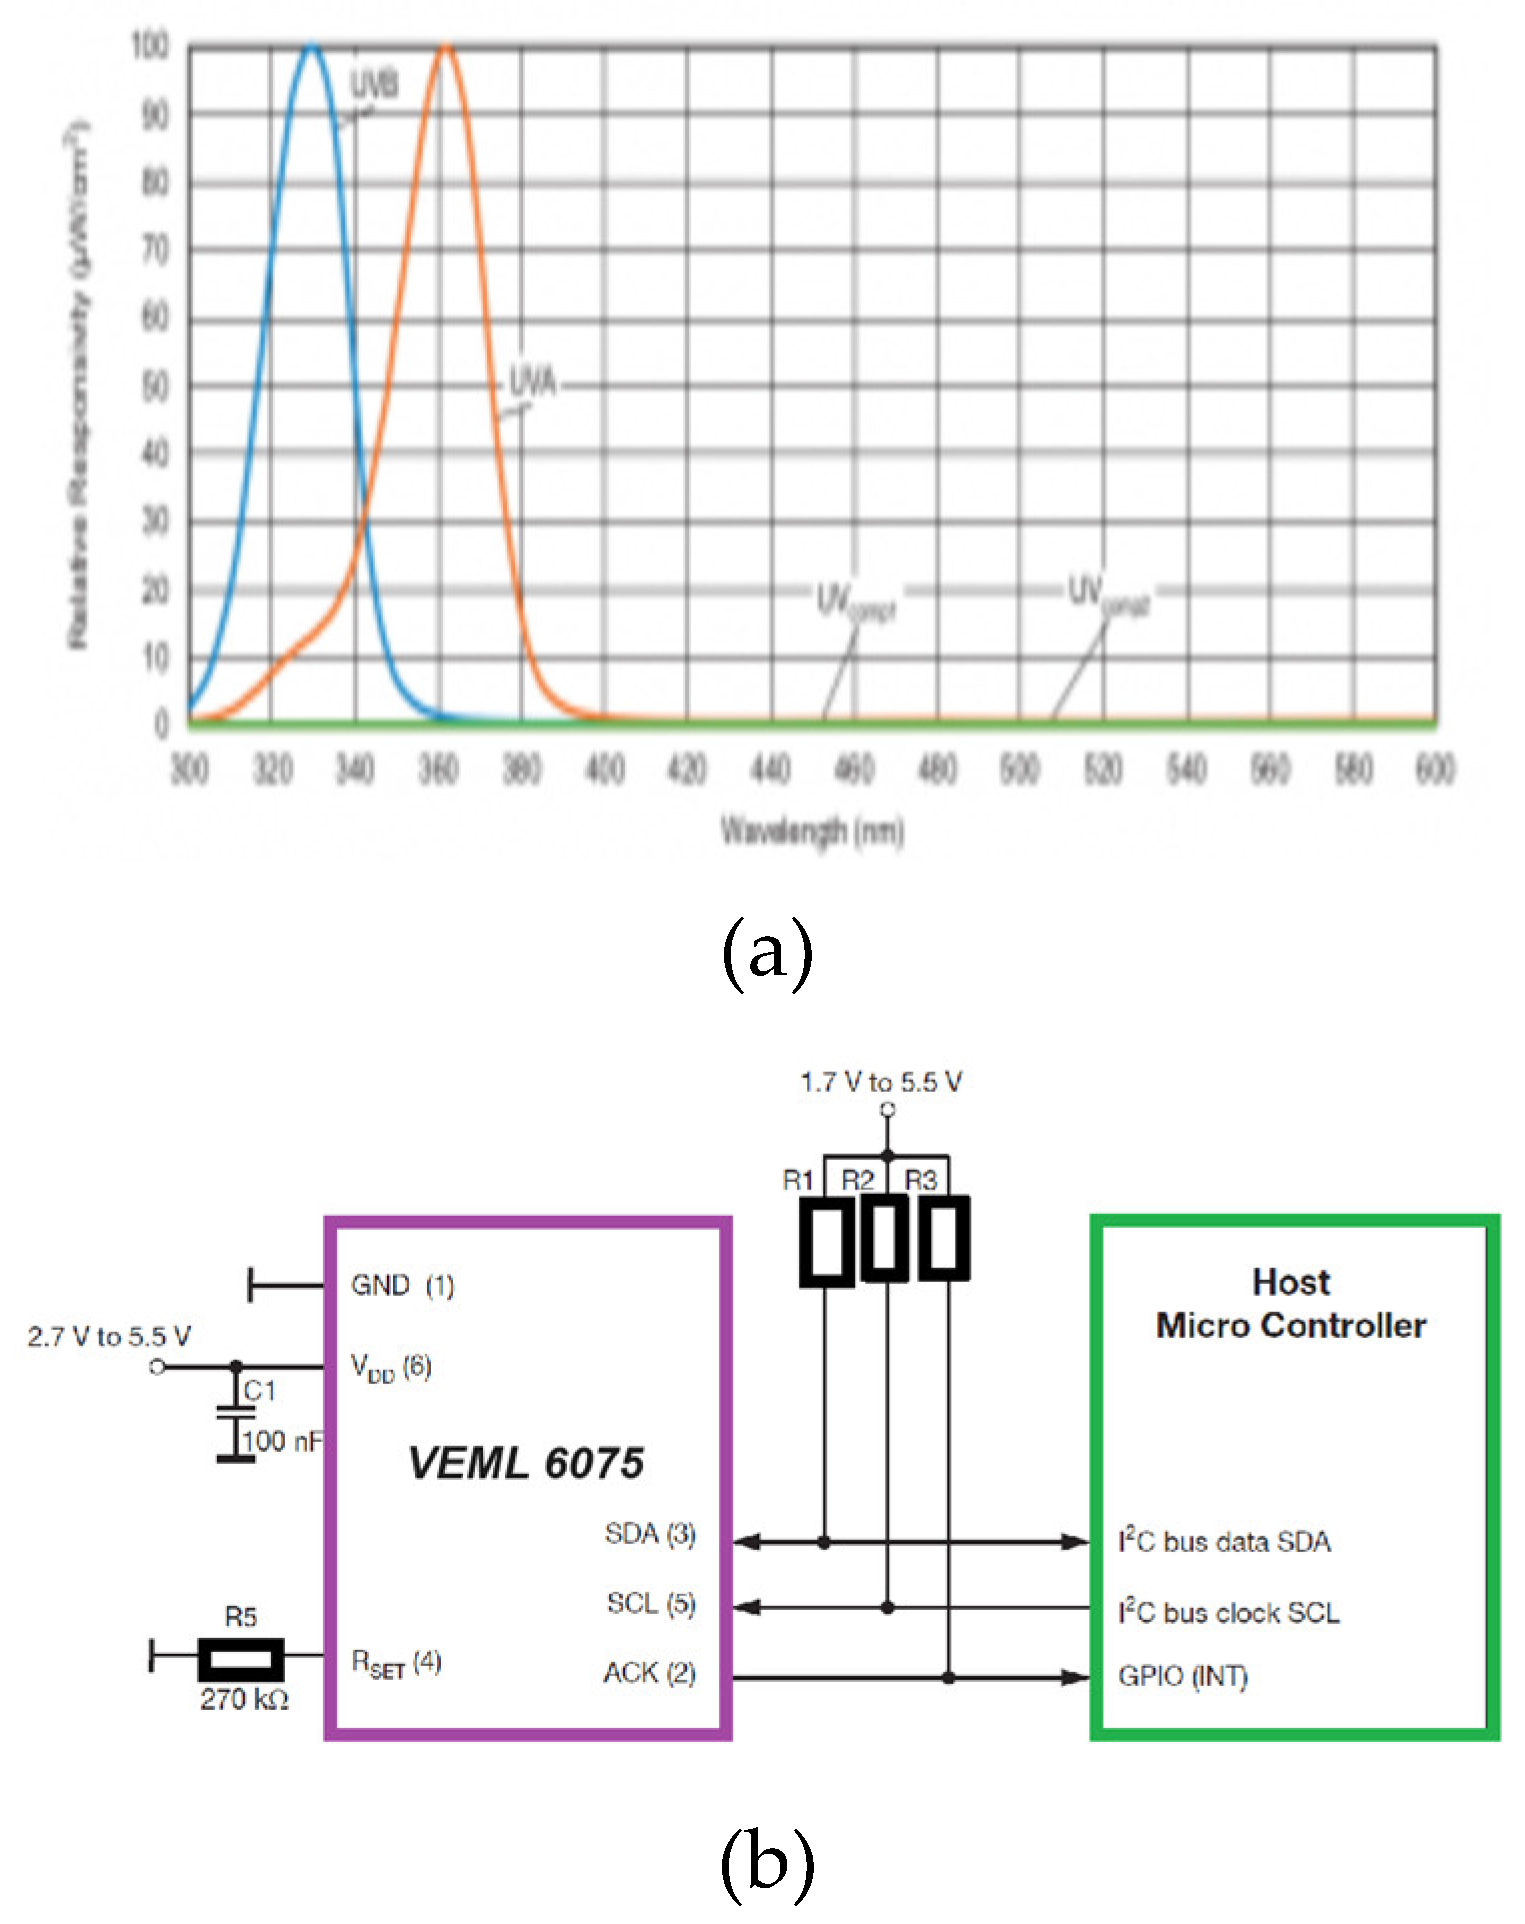
Figure 6.
The UPS HAT Waveshare 19739 diagram : (a) Component elements of devices; (b) Raspberry Pi Zero 2W attached on top; (c) 1000 mAh, 3.7 V Li-Po Battery.
Figure 6.
The UPS HAT Waveshare 19739 diagram : (a) Component elements of devices; (b) Raspberry Pi Zero 2W attached on top; (c) 1000 mAh, 3.7 V Li-Po Battery.
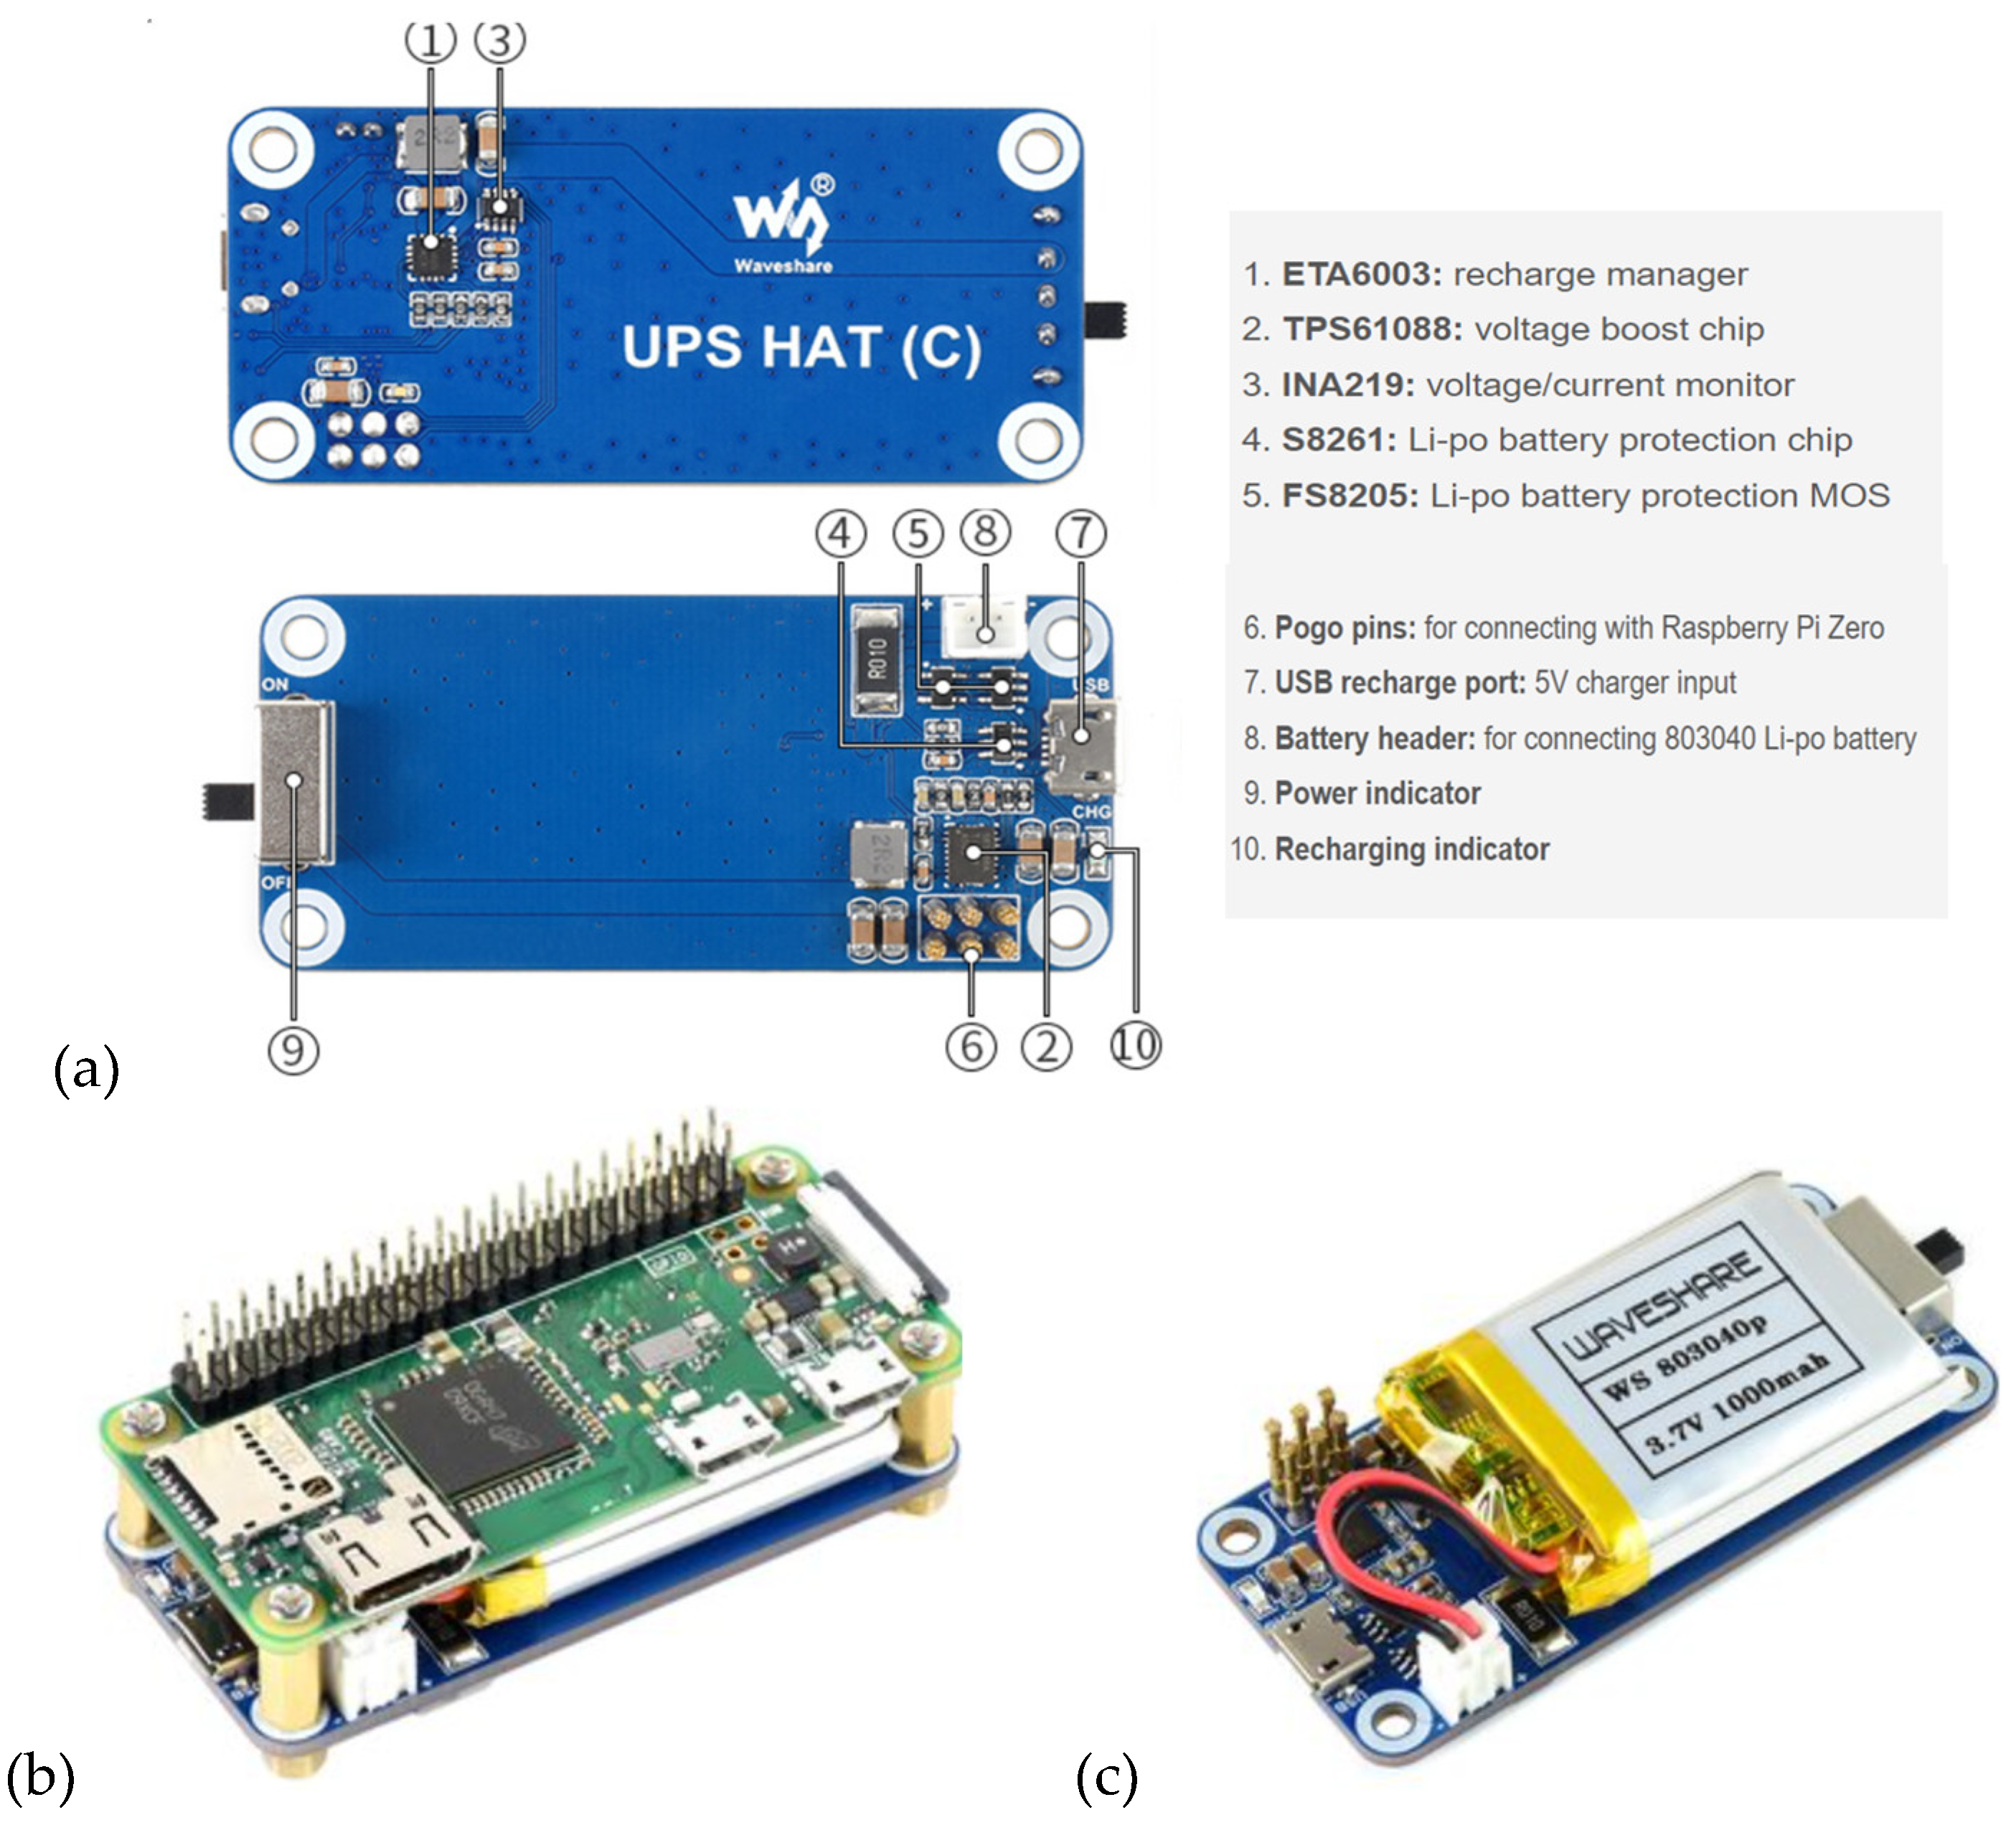
Figure 7.
Location of the experiments – National University of Science and Technology POLITEHNICA Bucharest Campus: (a) 3D visualization of the flight mission – Google Earth screenshot; (b) location of points along the route for image capture.
Figure 7.
Location of the experiments – National University of Science and Technology POLITEHNICA Bucharest Campus: (a) 3D visualization of the flight mission – Google Earth screenshot; (b) location of points along the route for image capture.
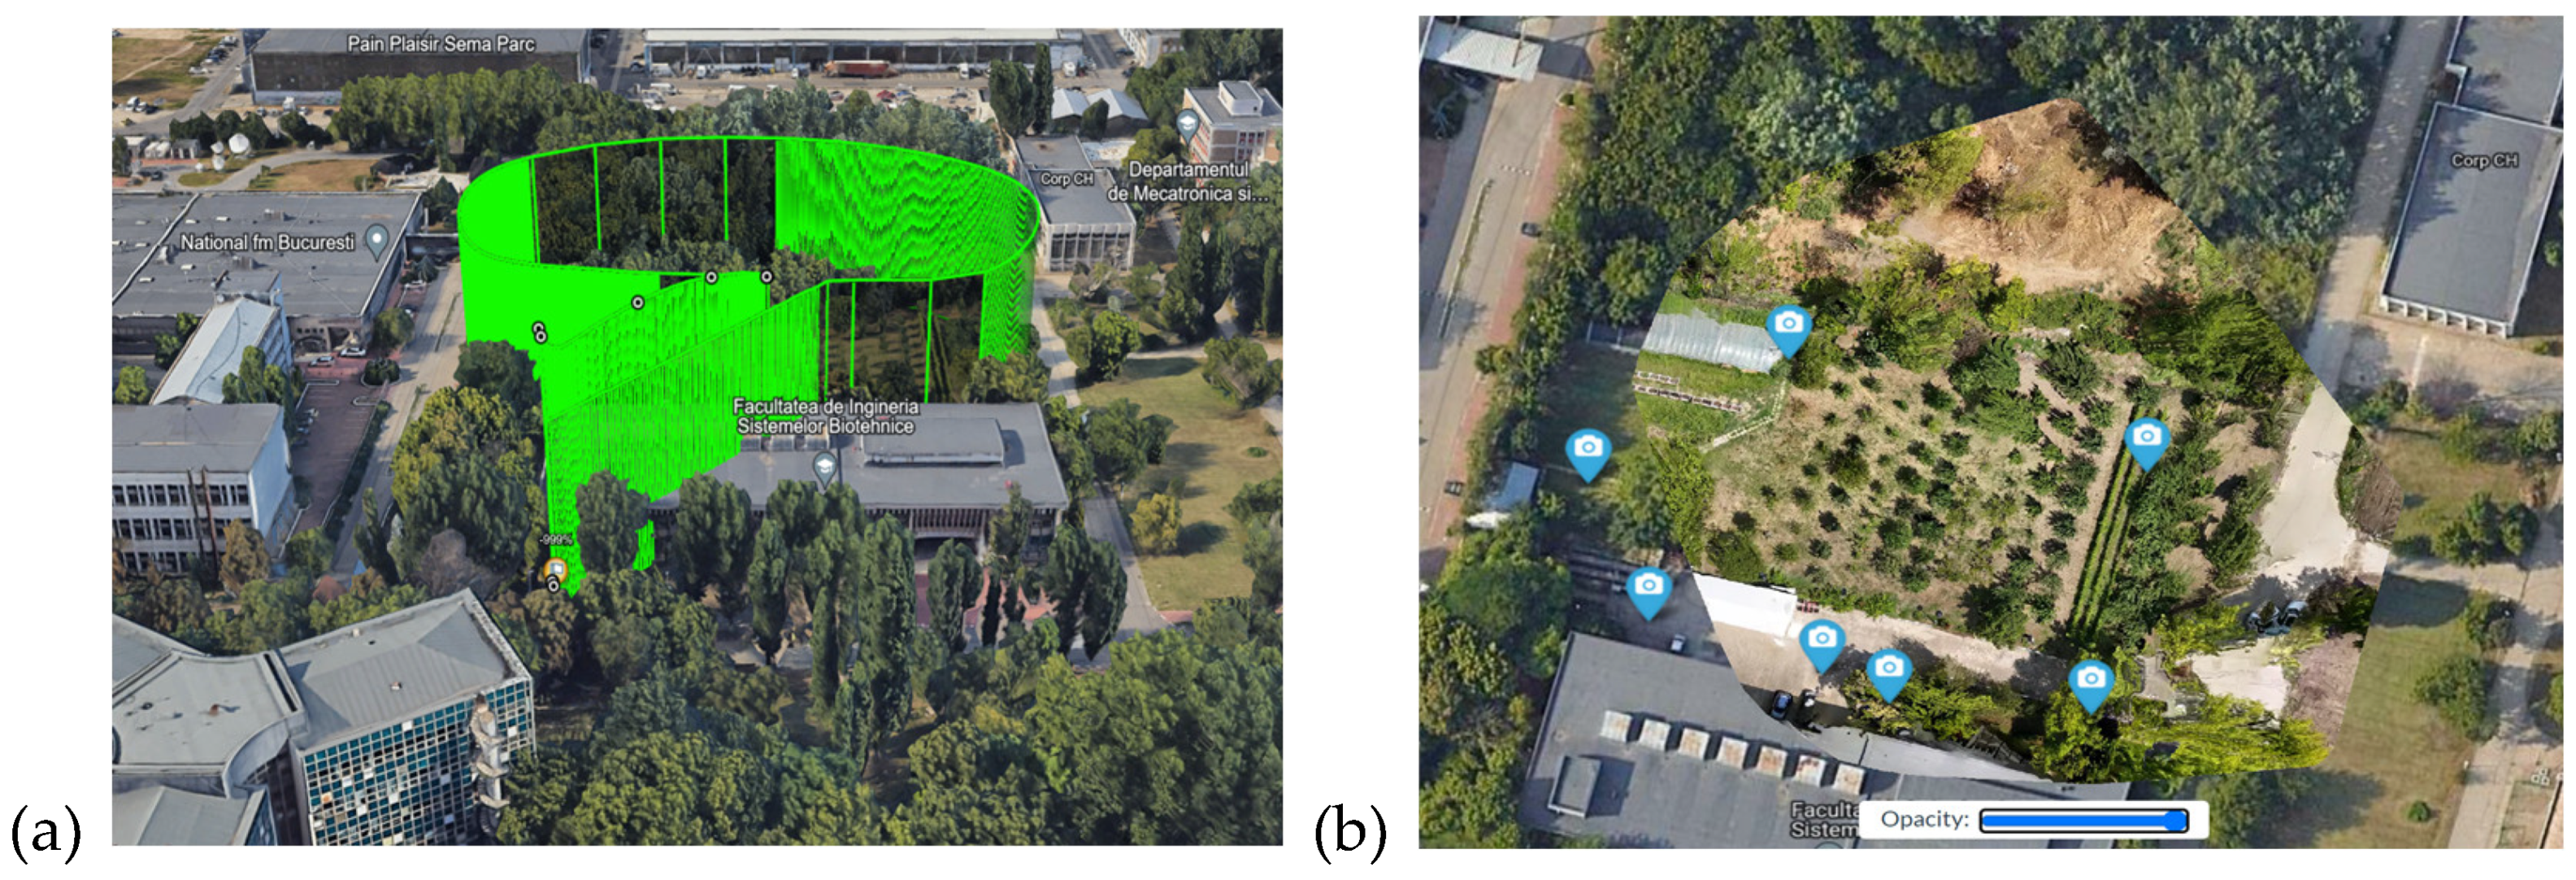
Figure 8.
The control action digital surface model DSM : (a) ortophoto image; (b) DSM model.
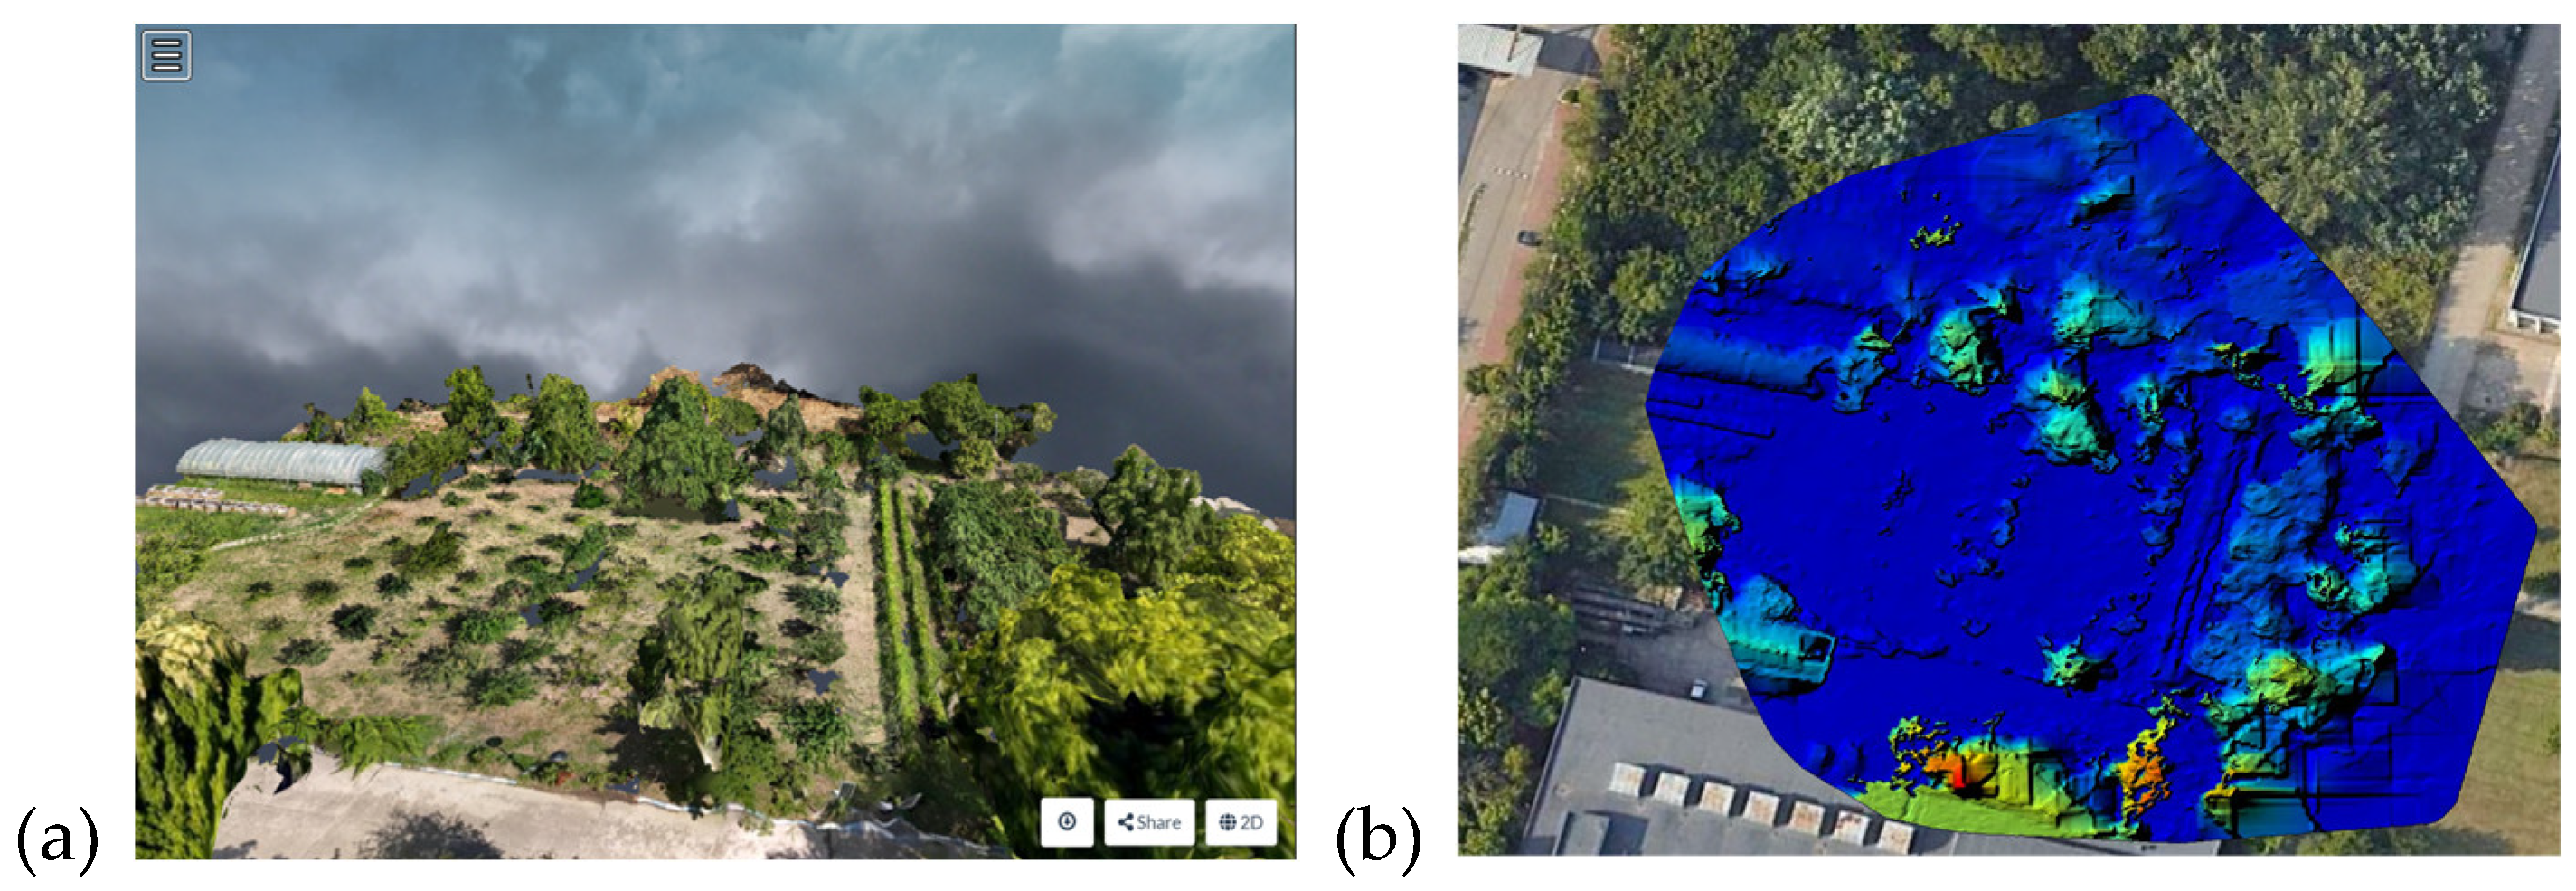
Figure 9.
Green Leaf Index GLI.
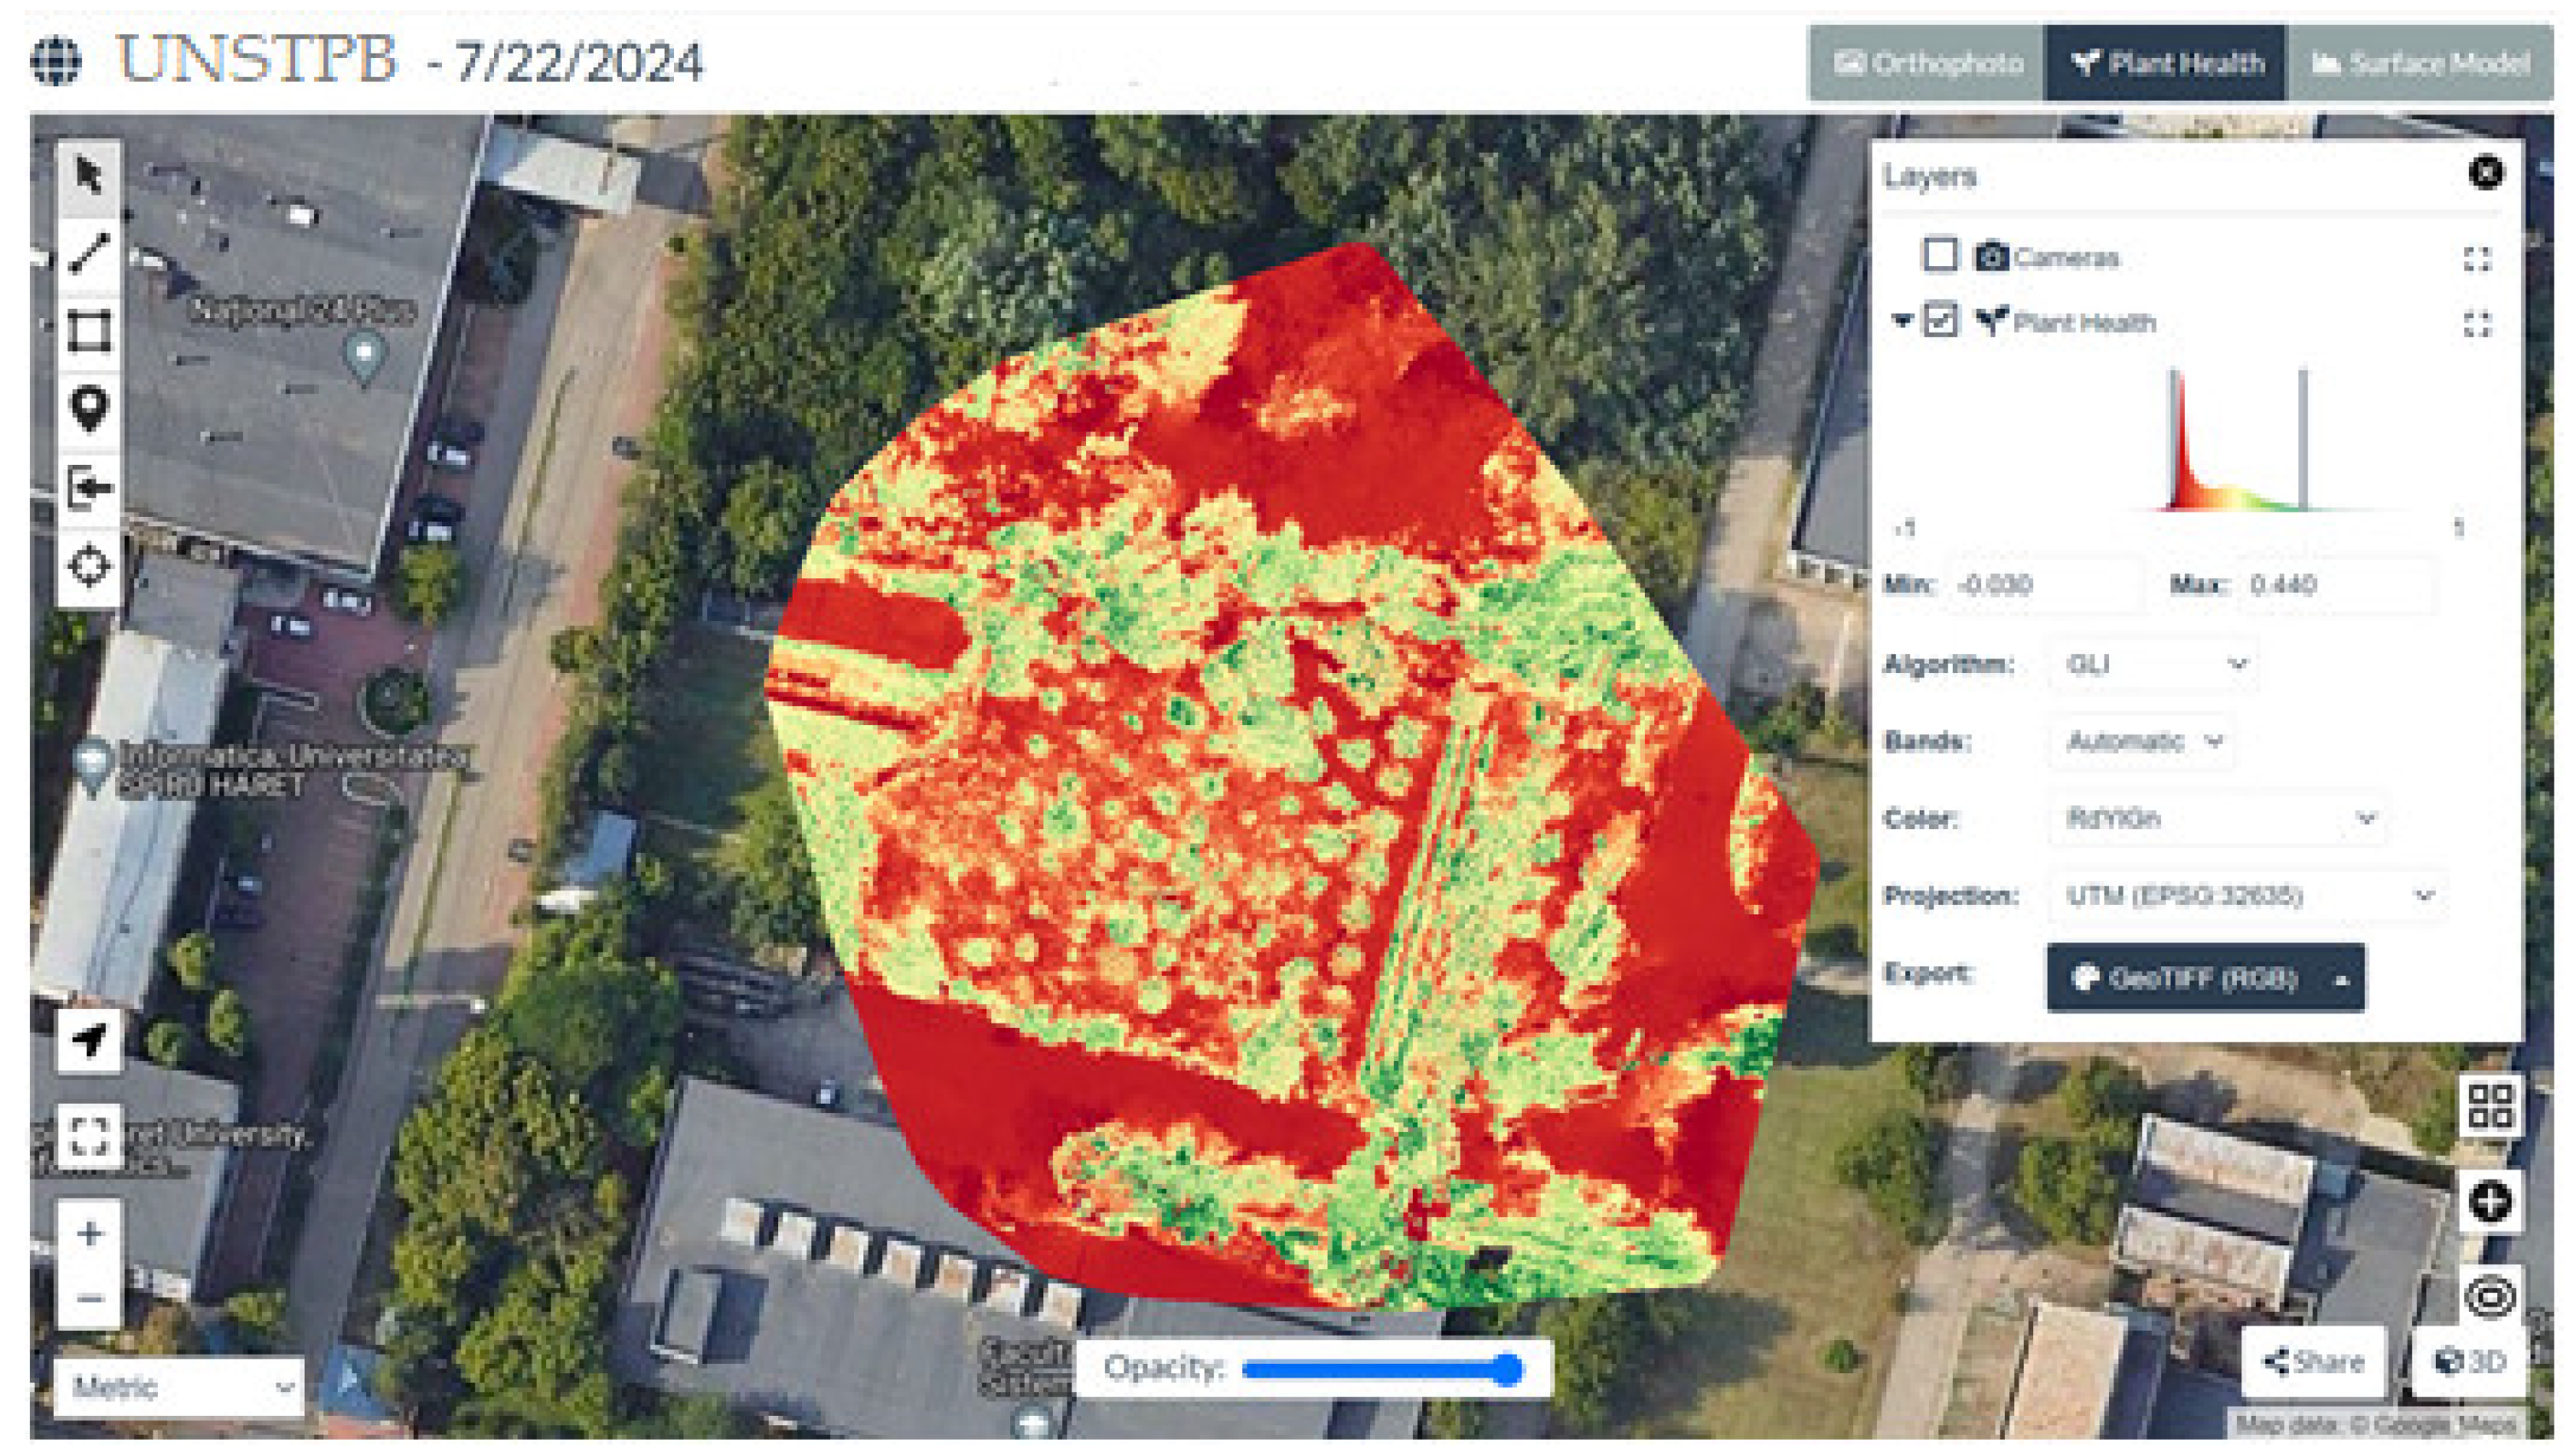
Figure 10.
NDWI Normalized Difference Water Index.
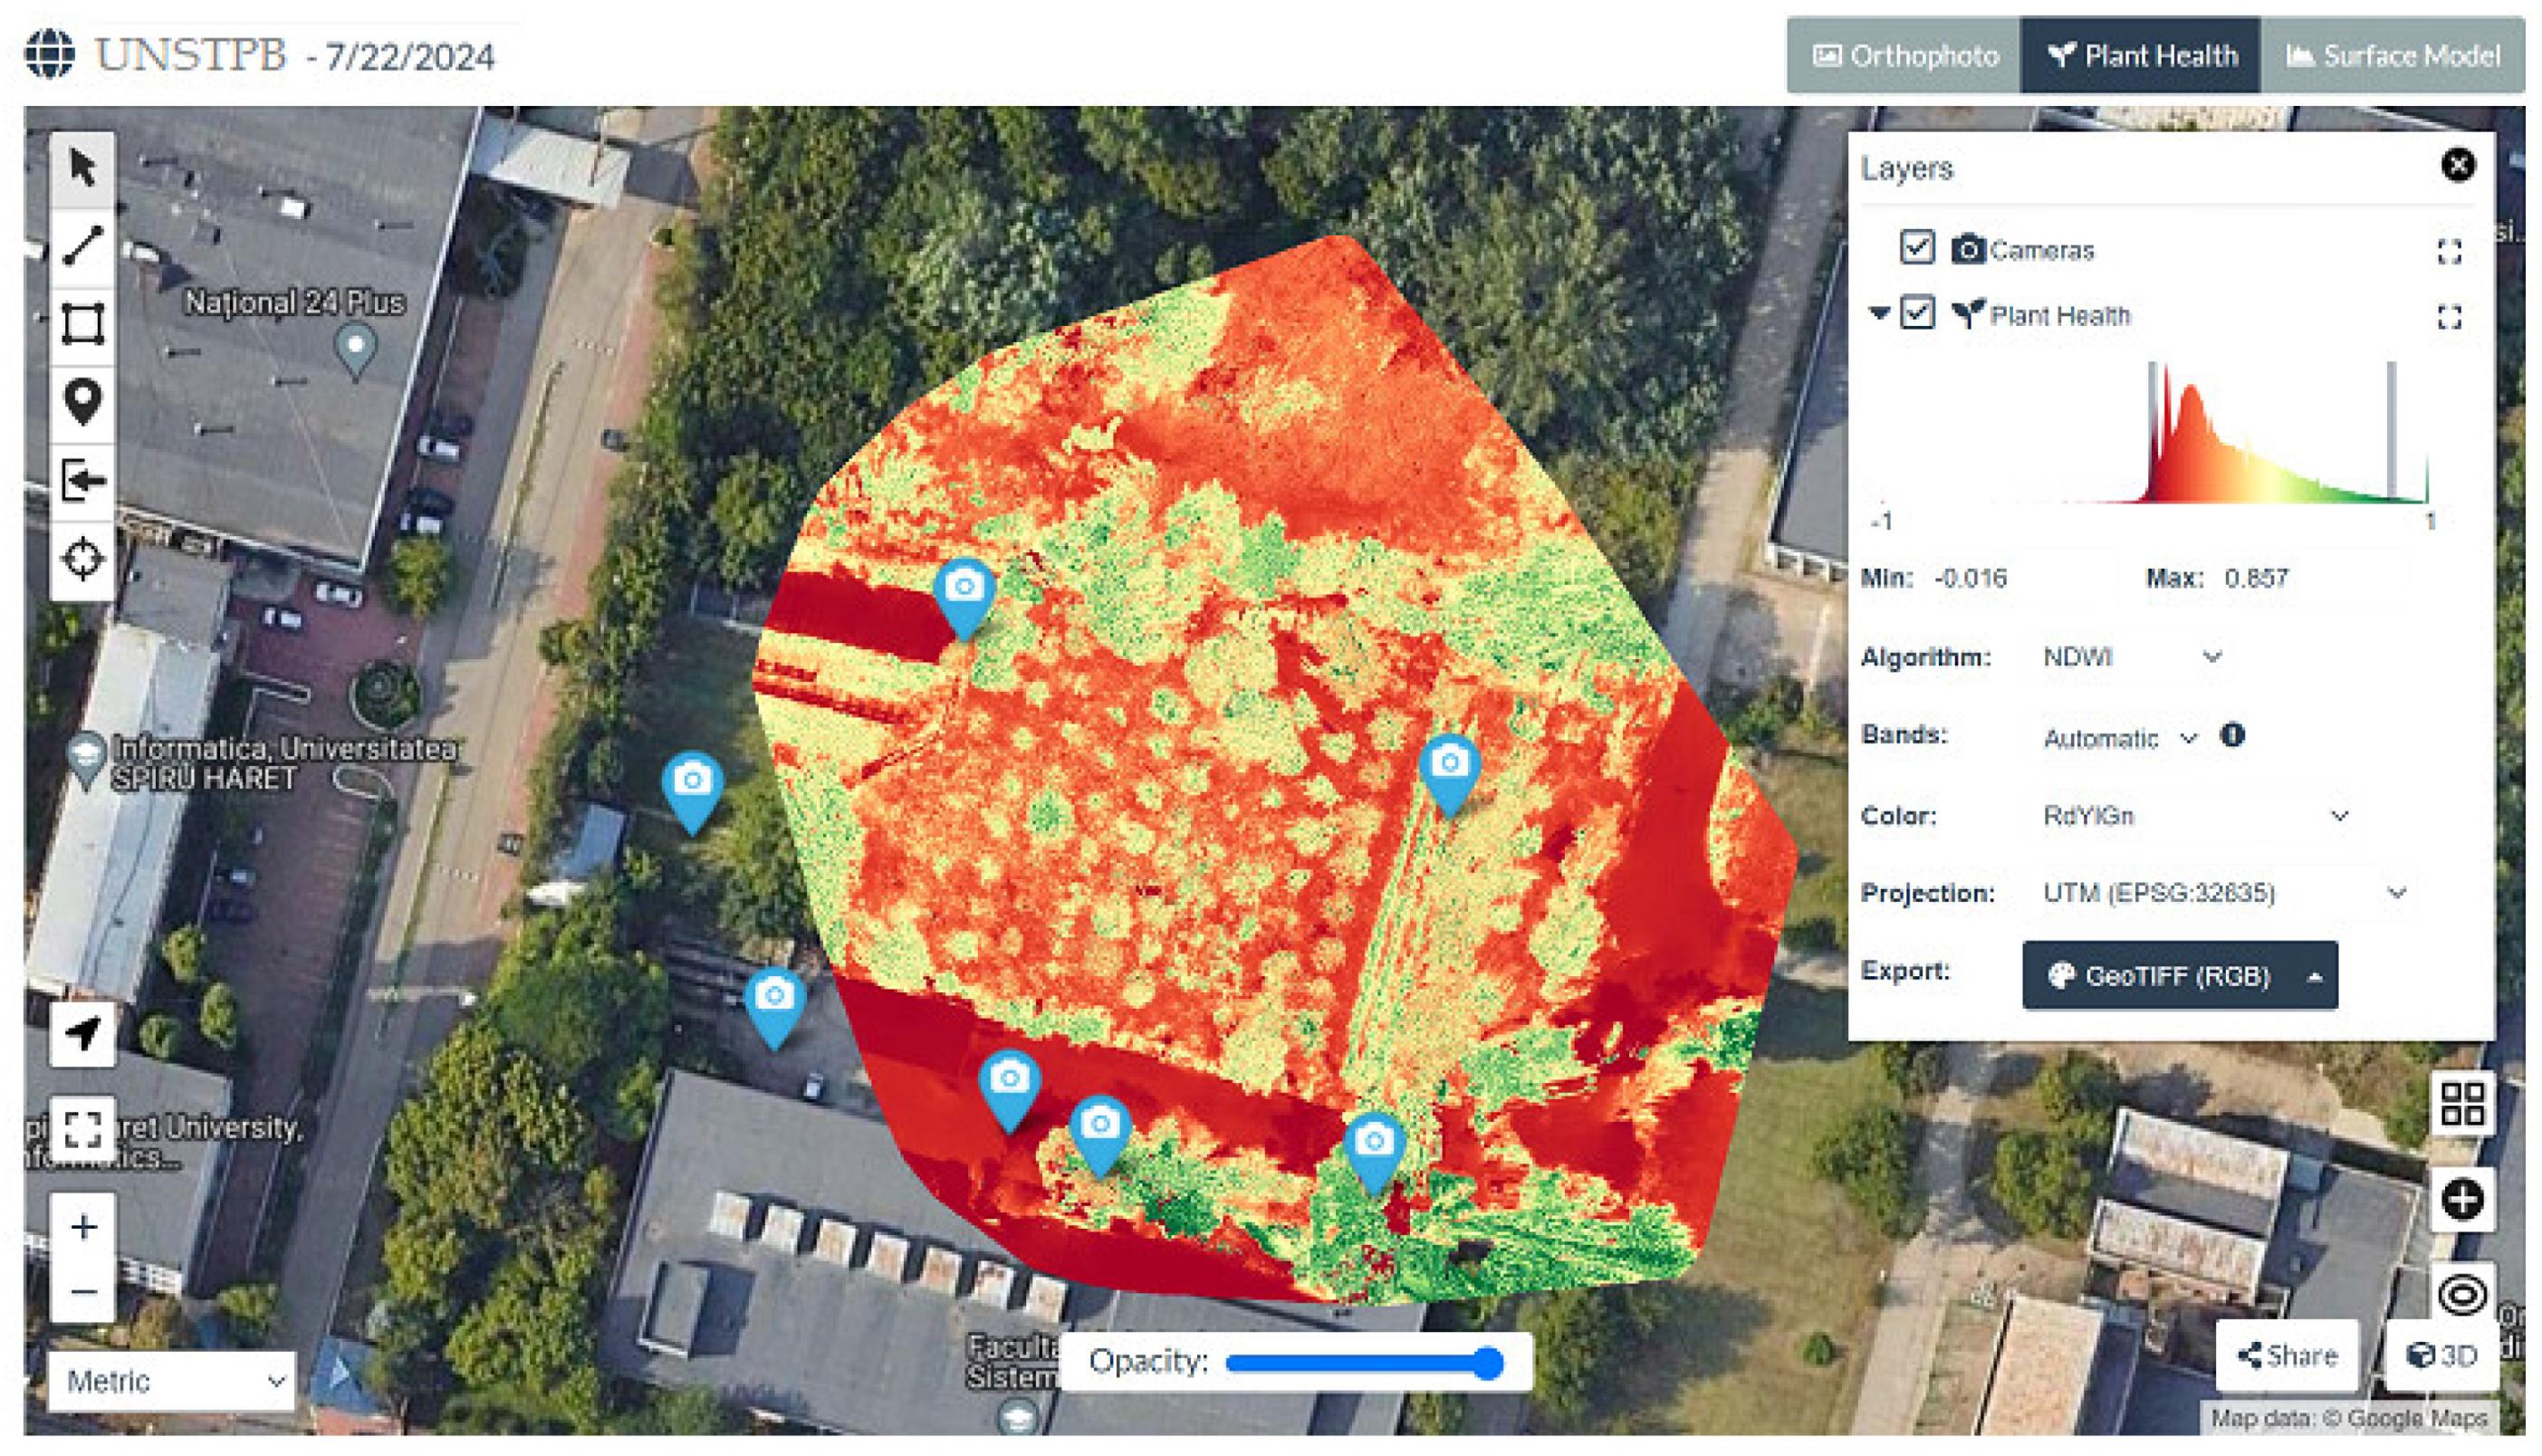
Figure 11.
SAVI Soil Adjusted Vegetation Index.
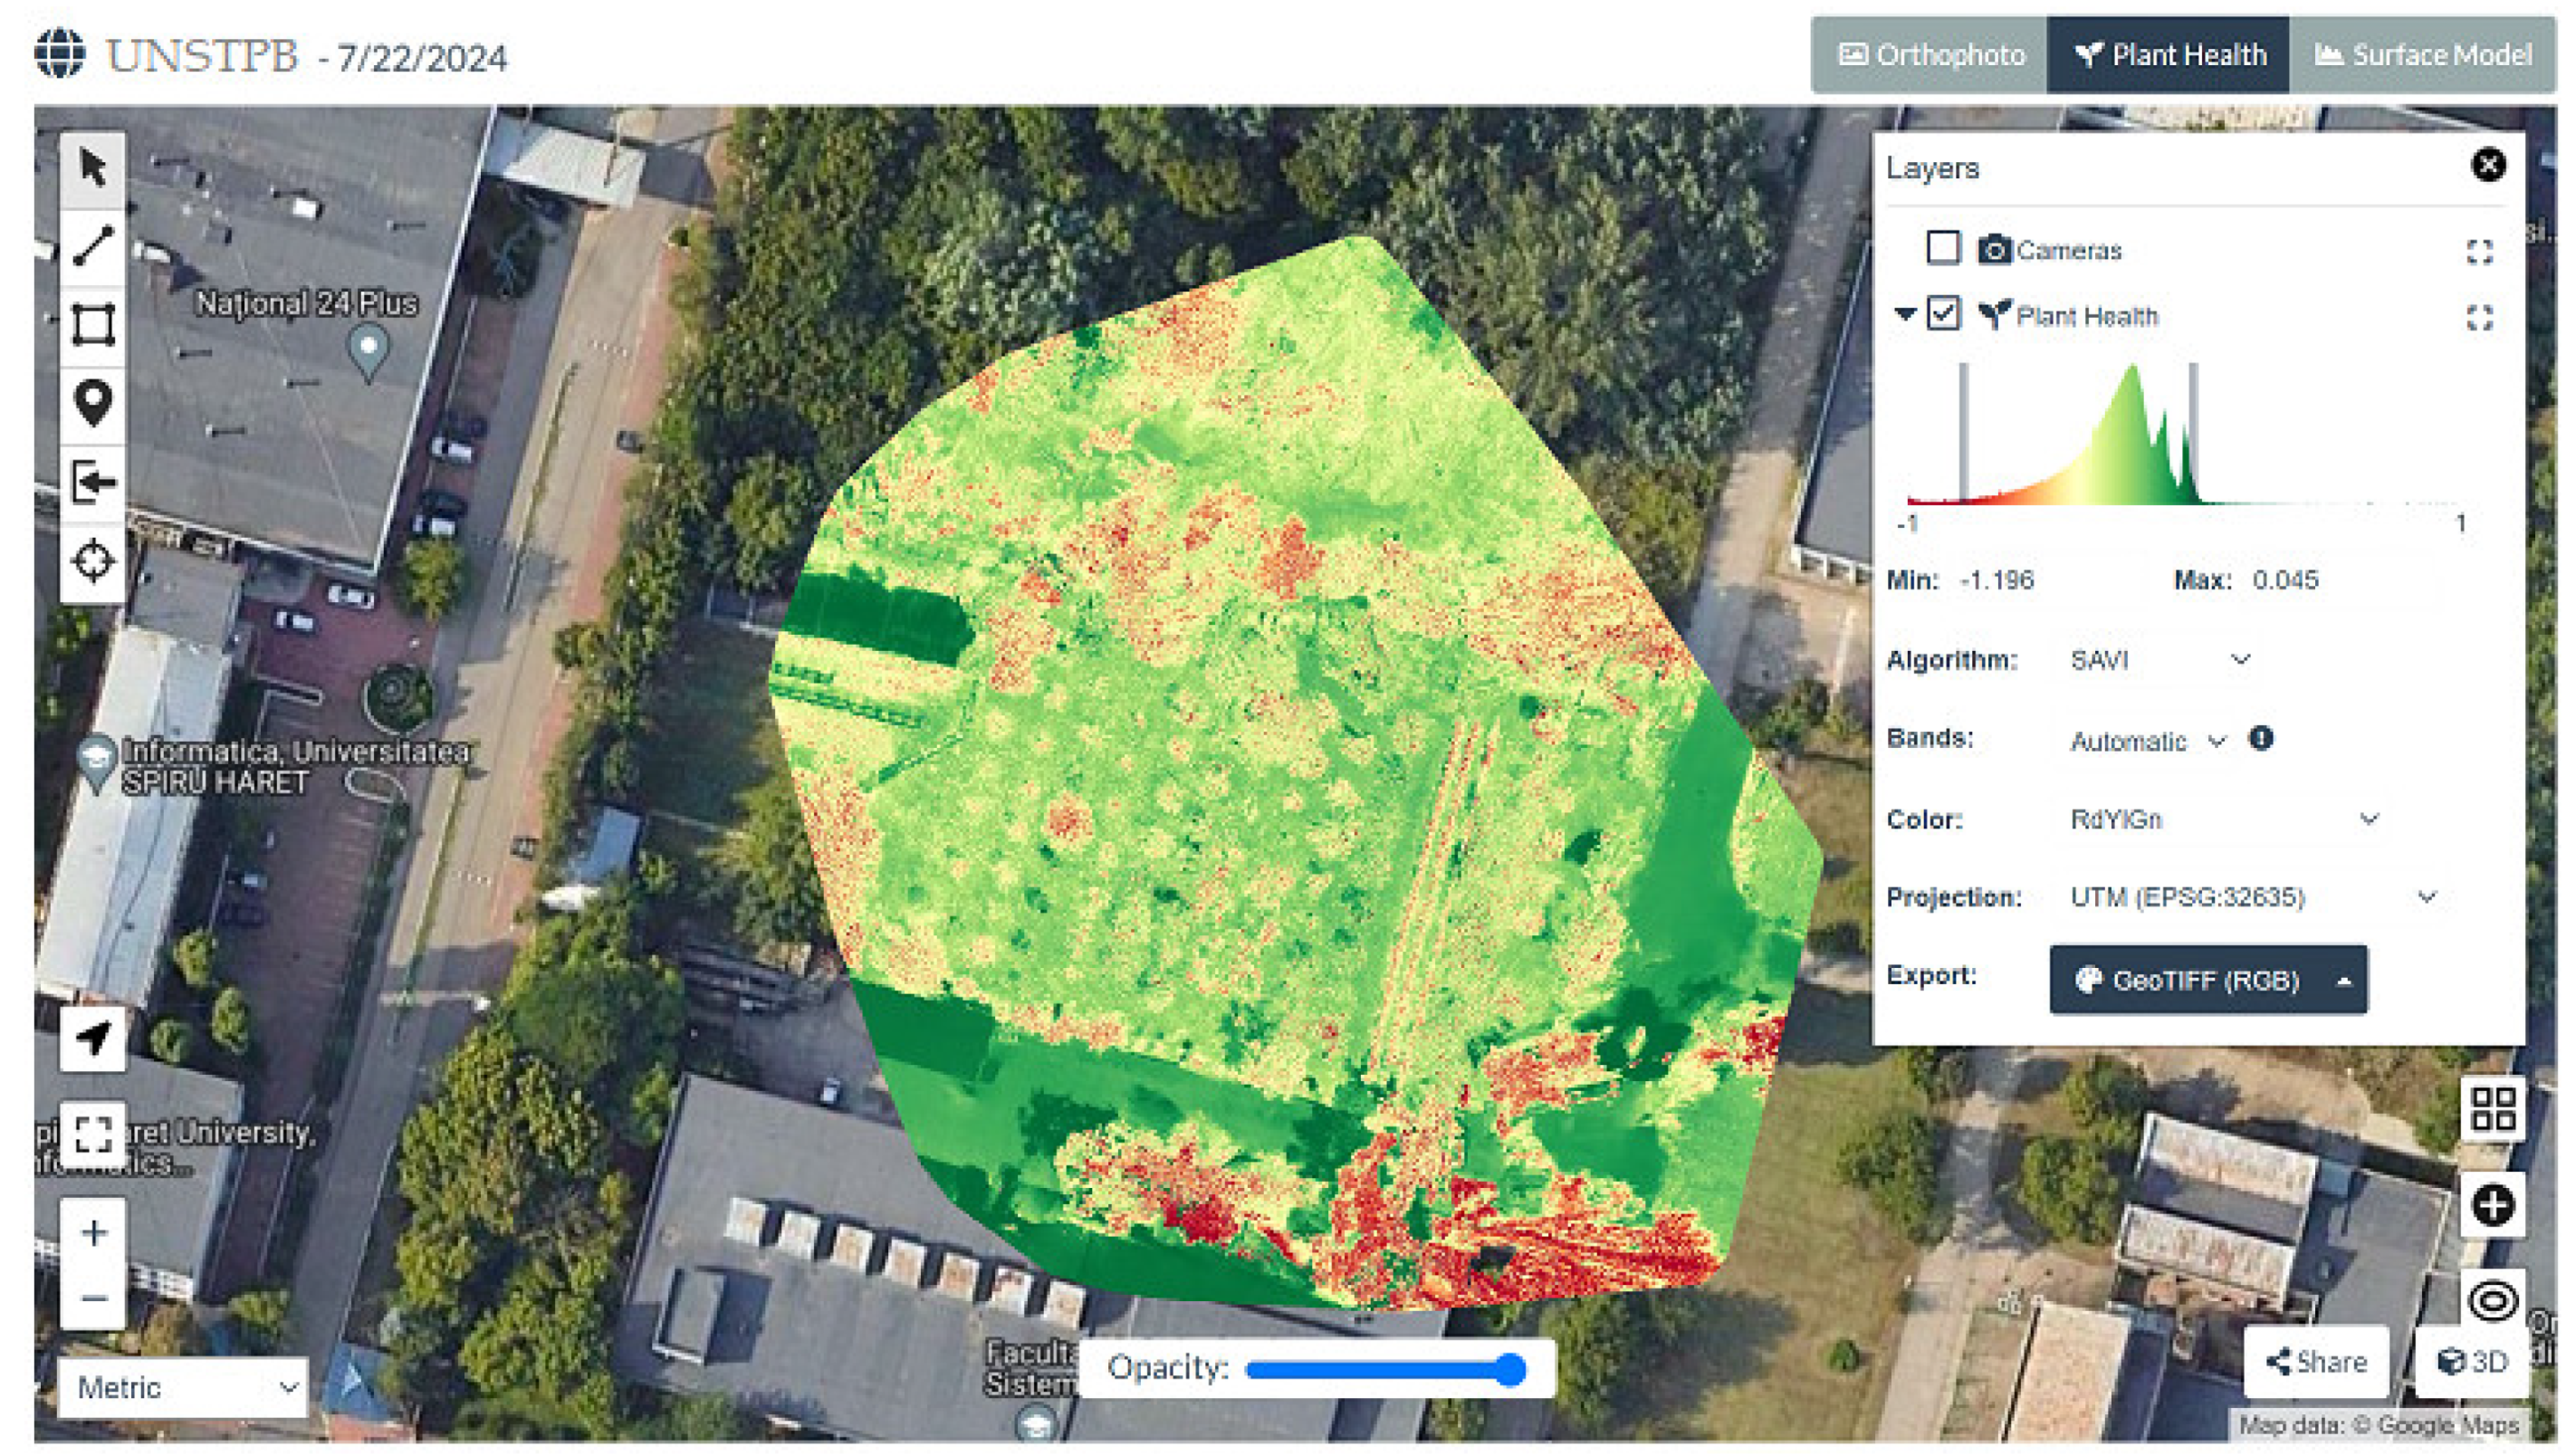
Figure 12.
EXG Excess Green Index.
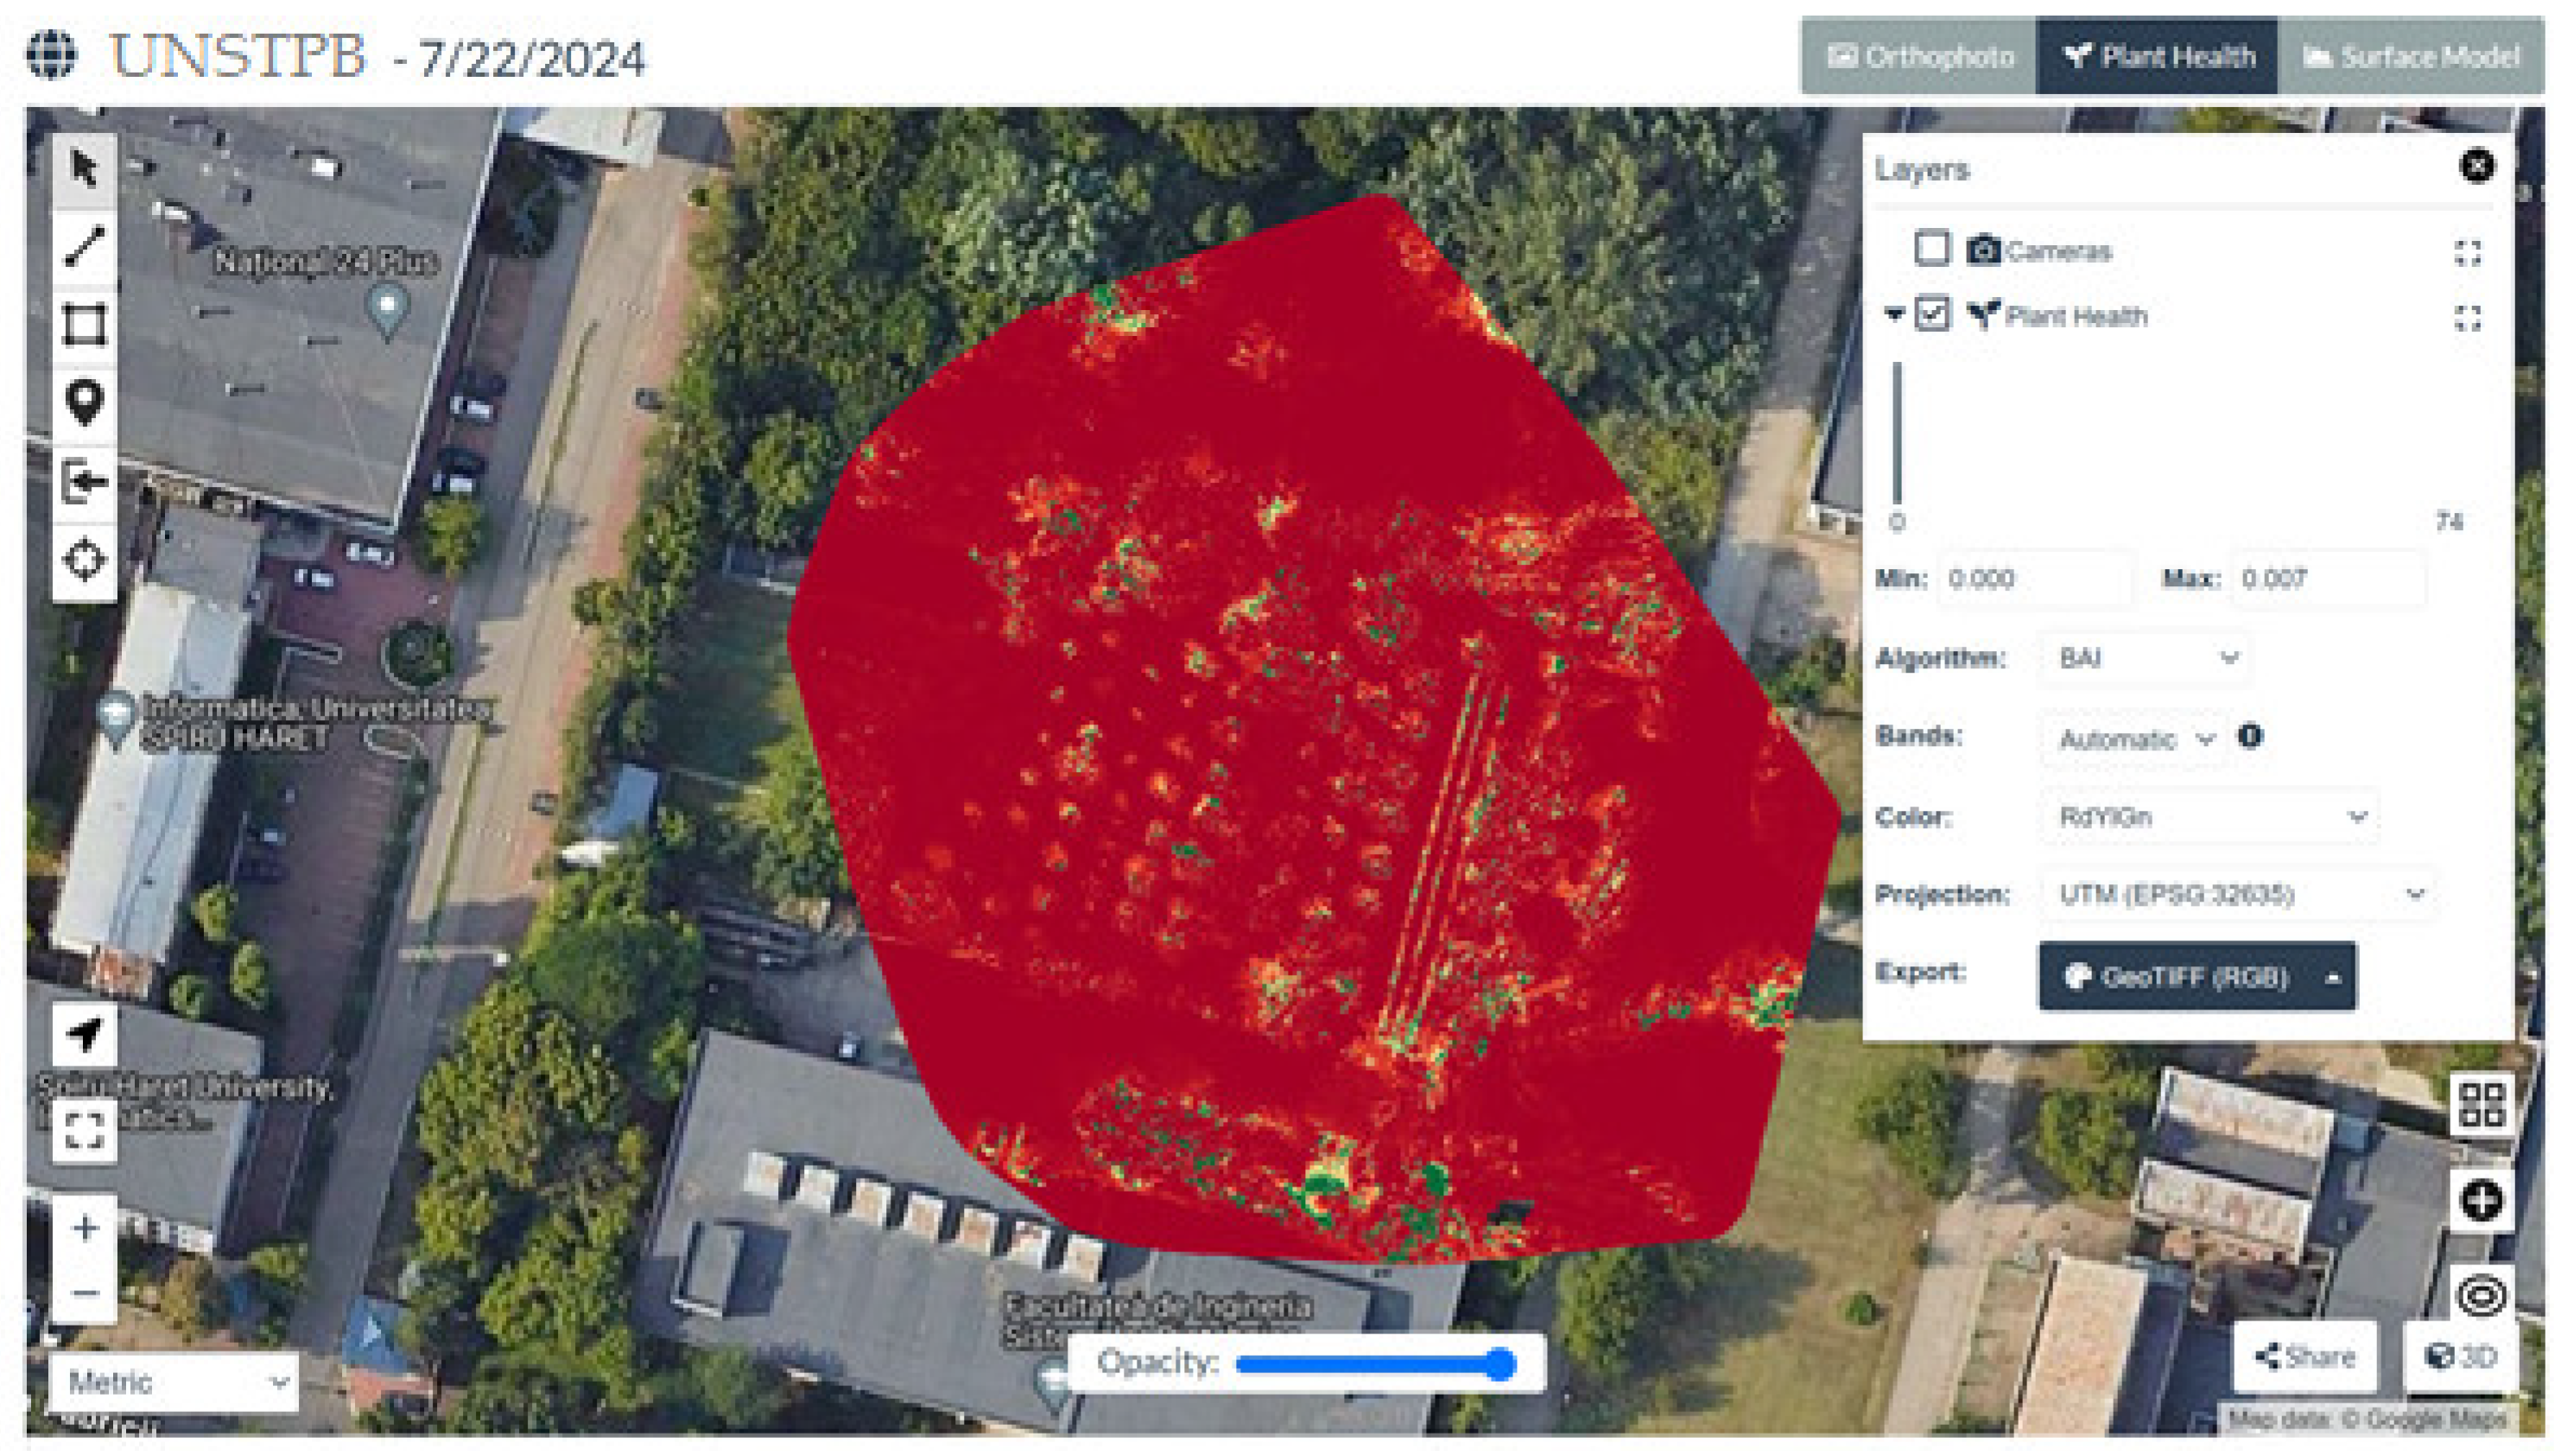
Figure 13.
BAI Burn Area Index.
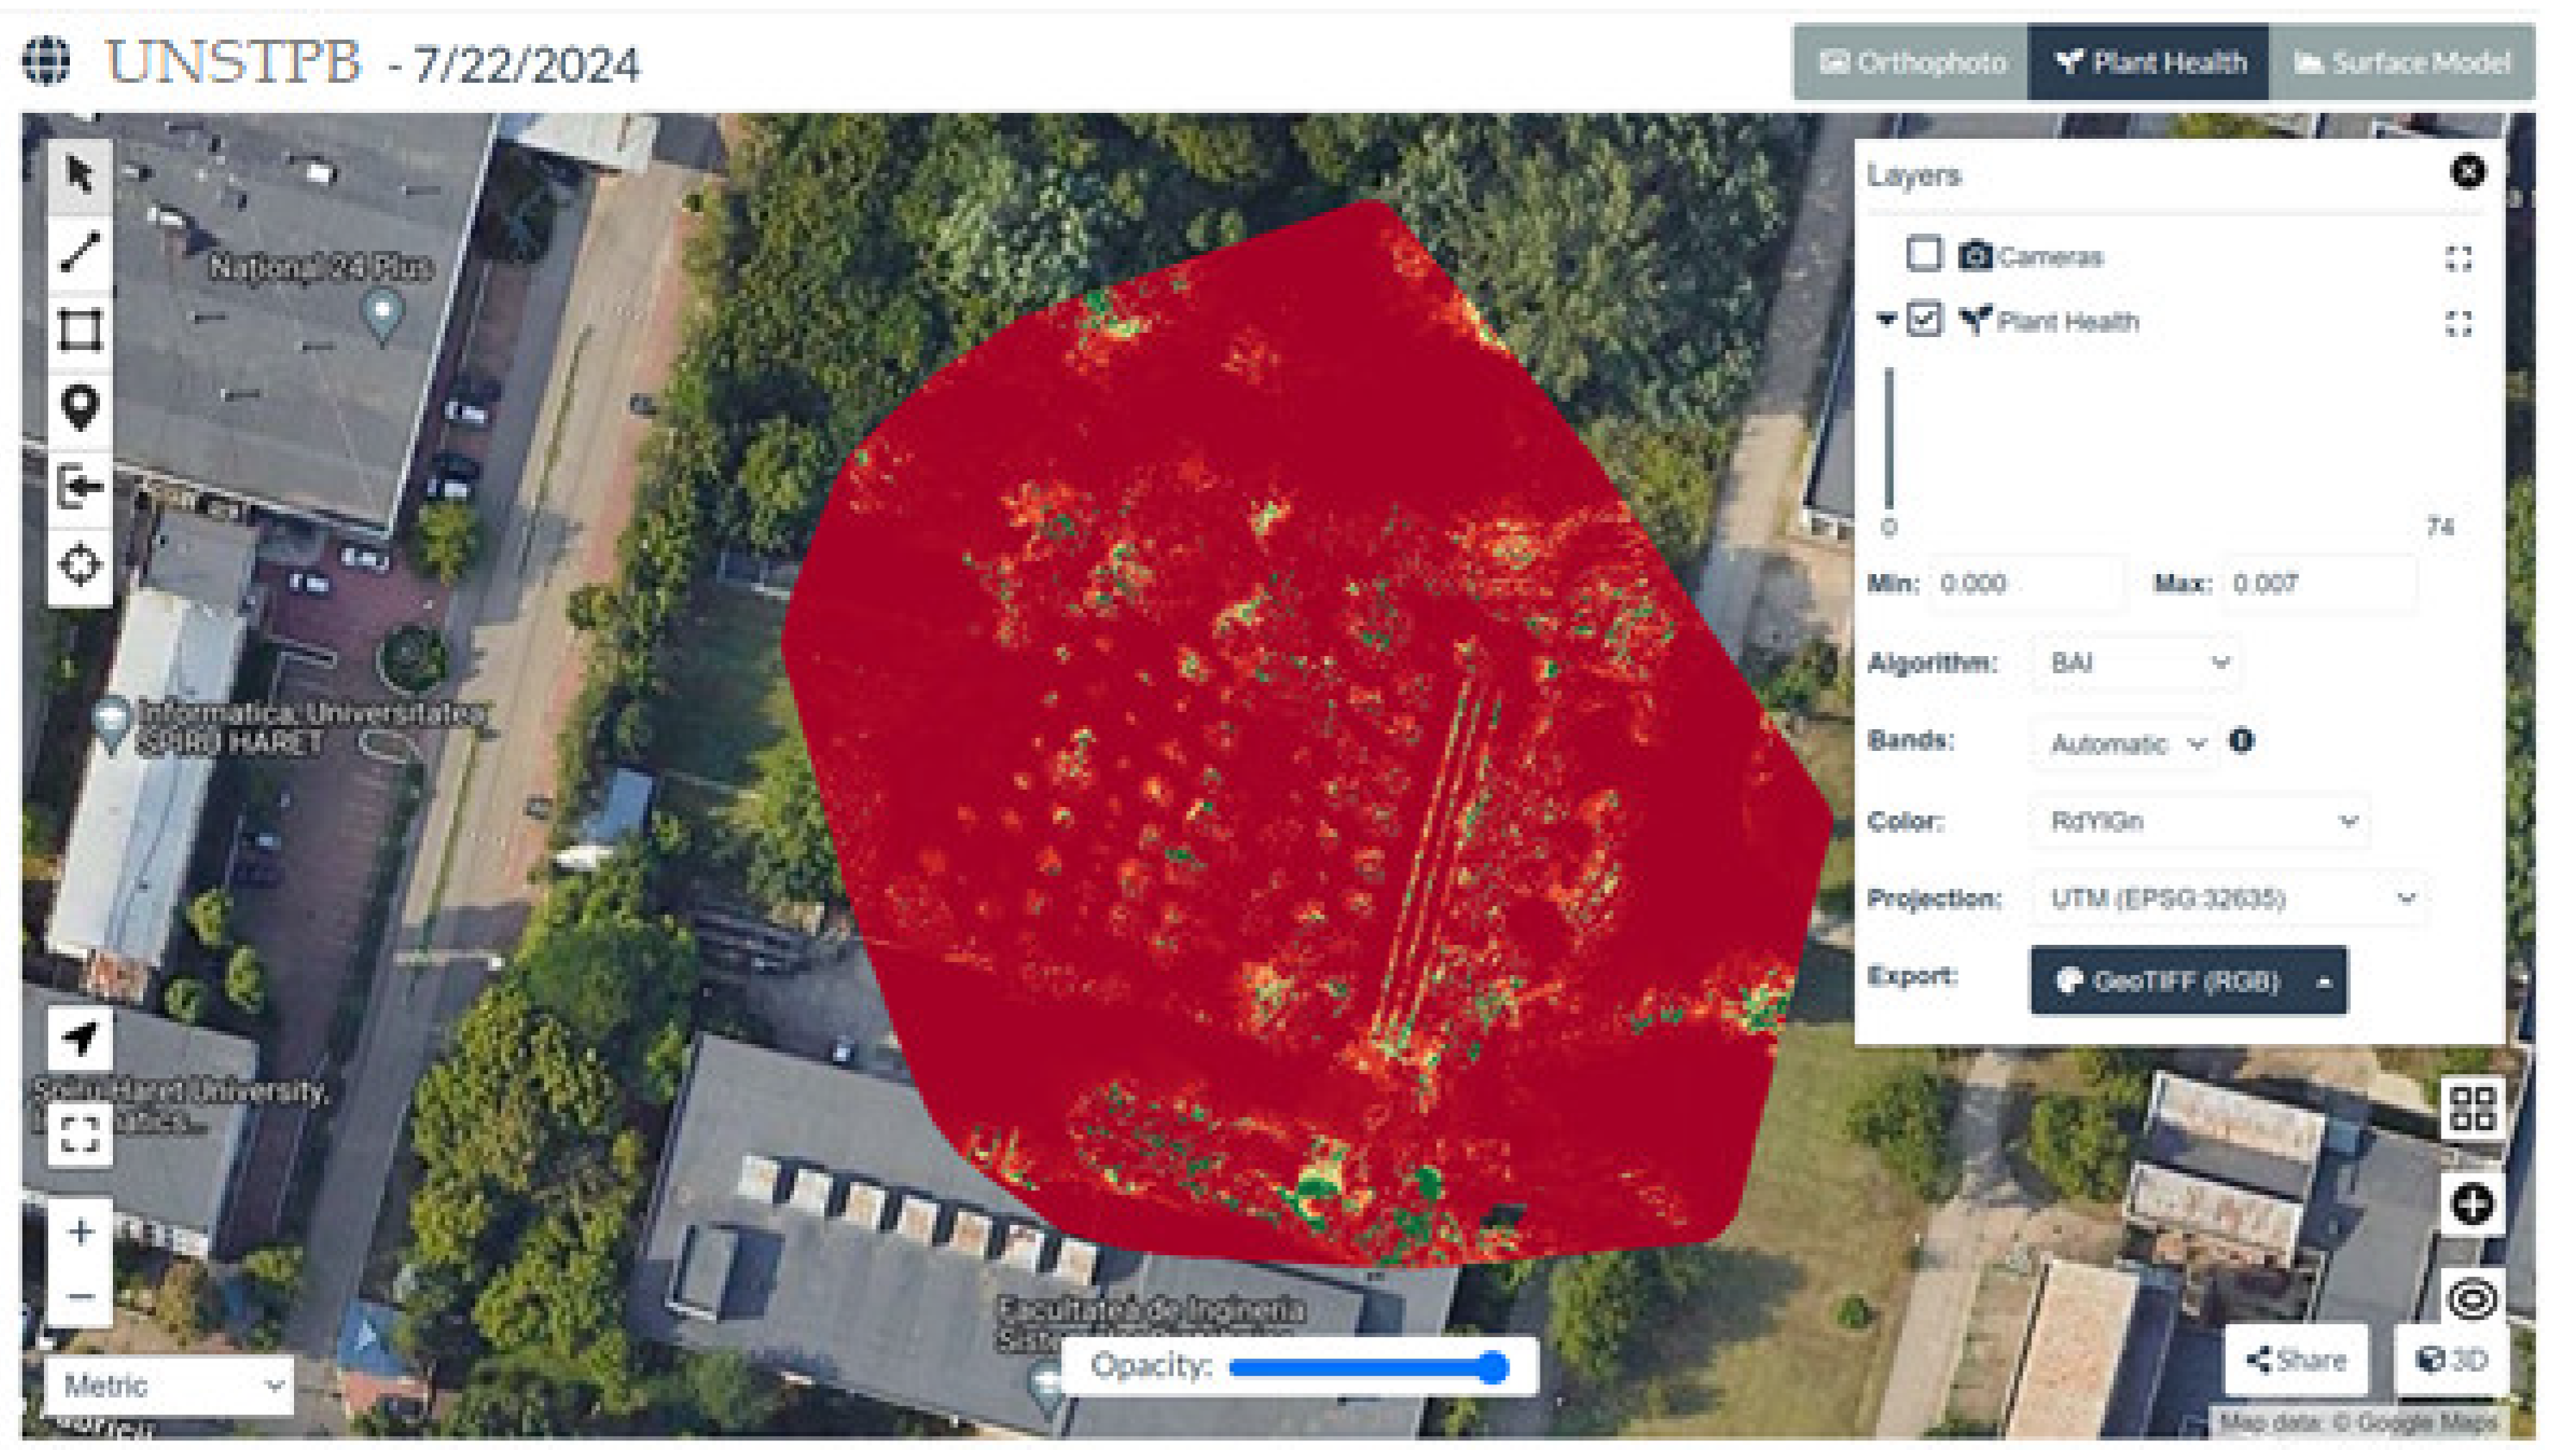
Figure 14.
Stand to test repetability data sensor VEML6075.
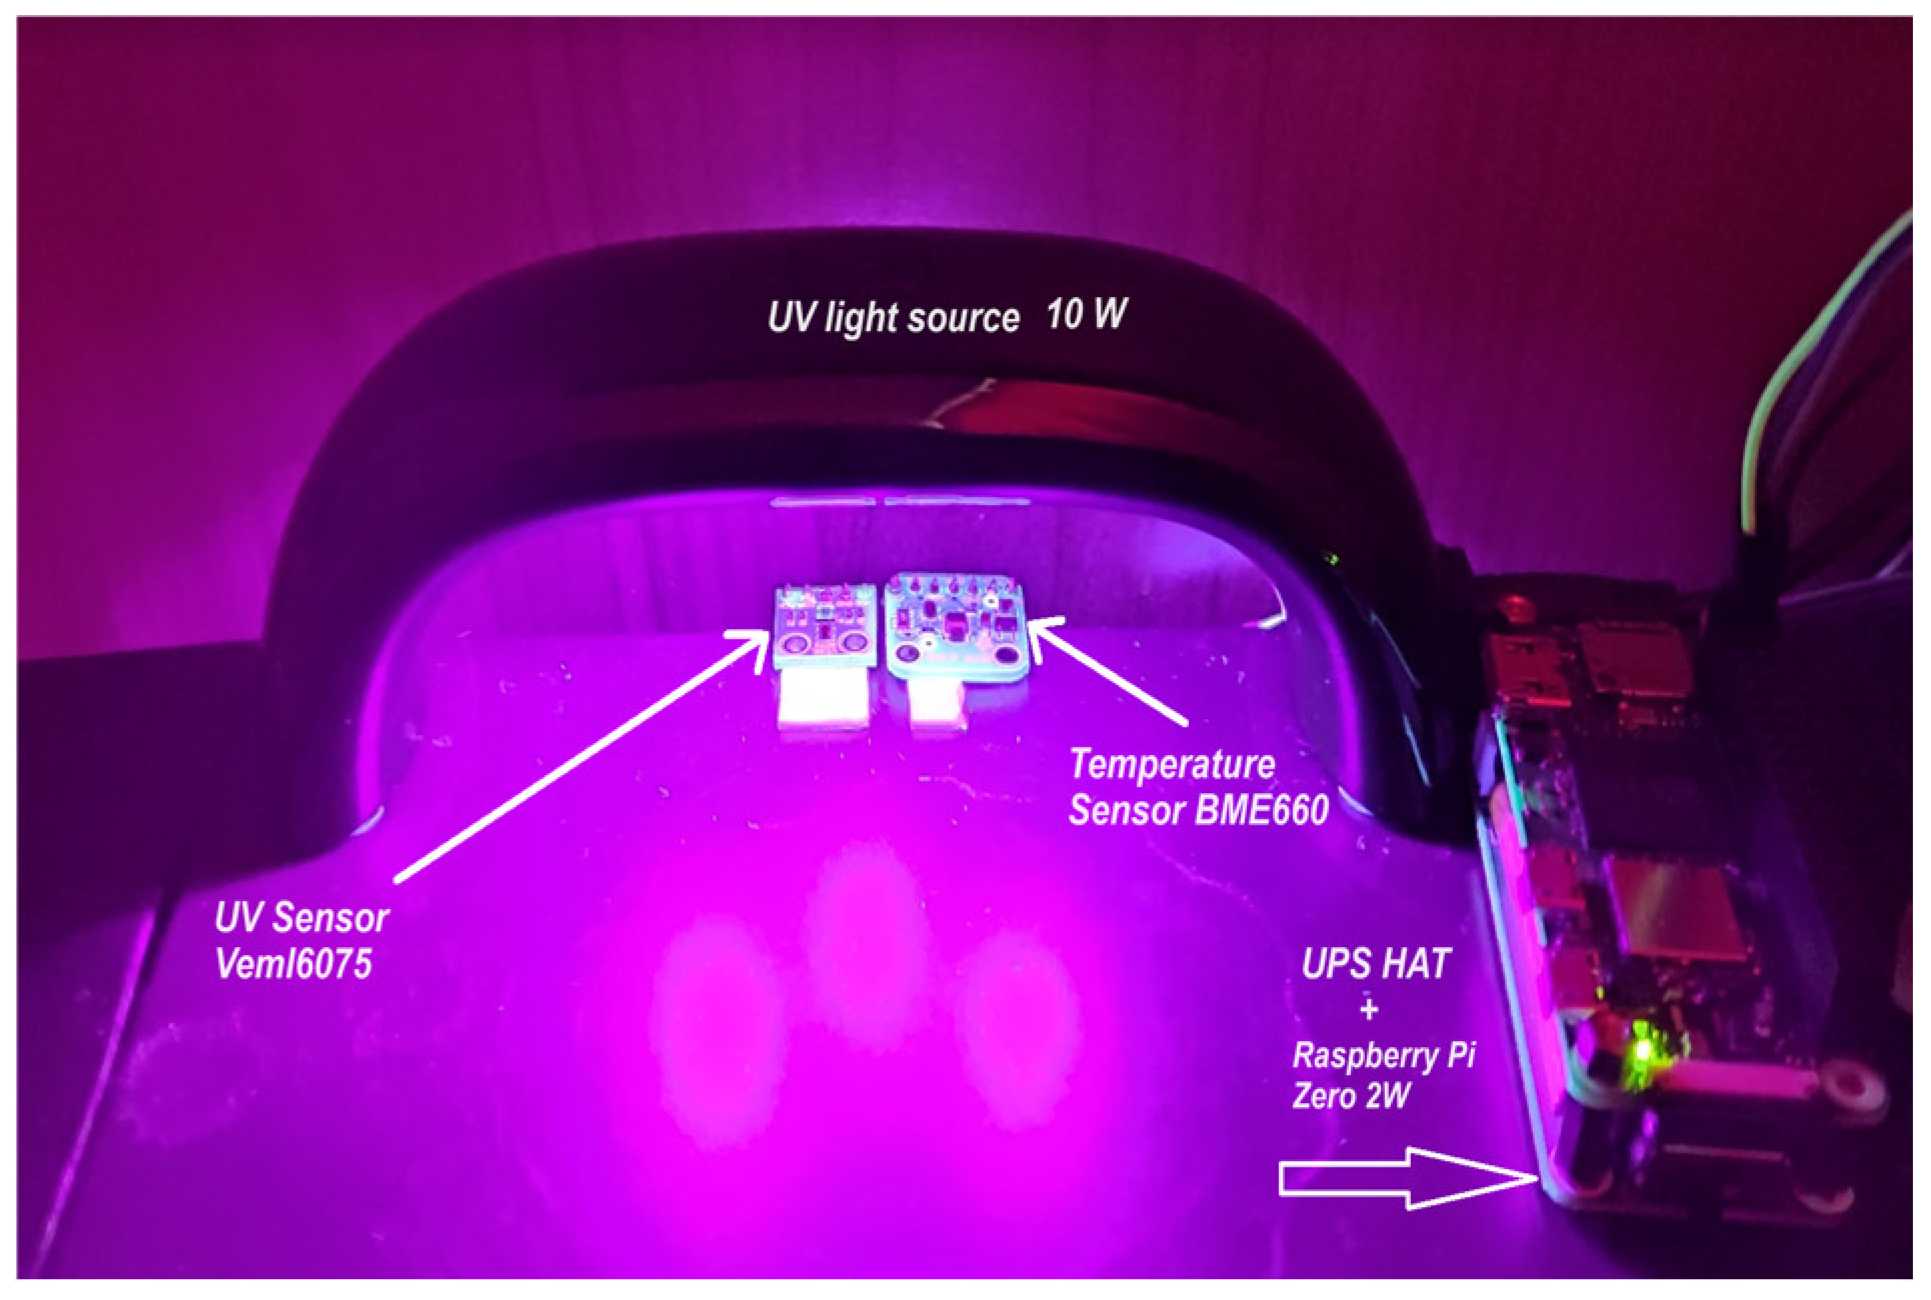
Figure 15.
Drift temperature sensor VEML6075.
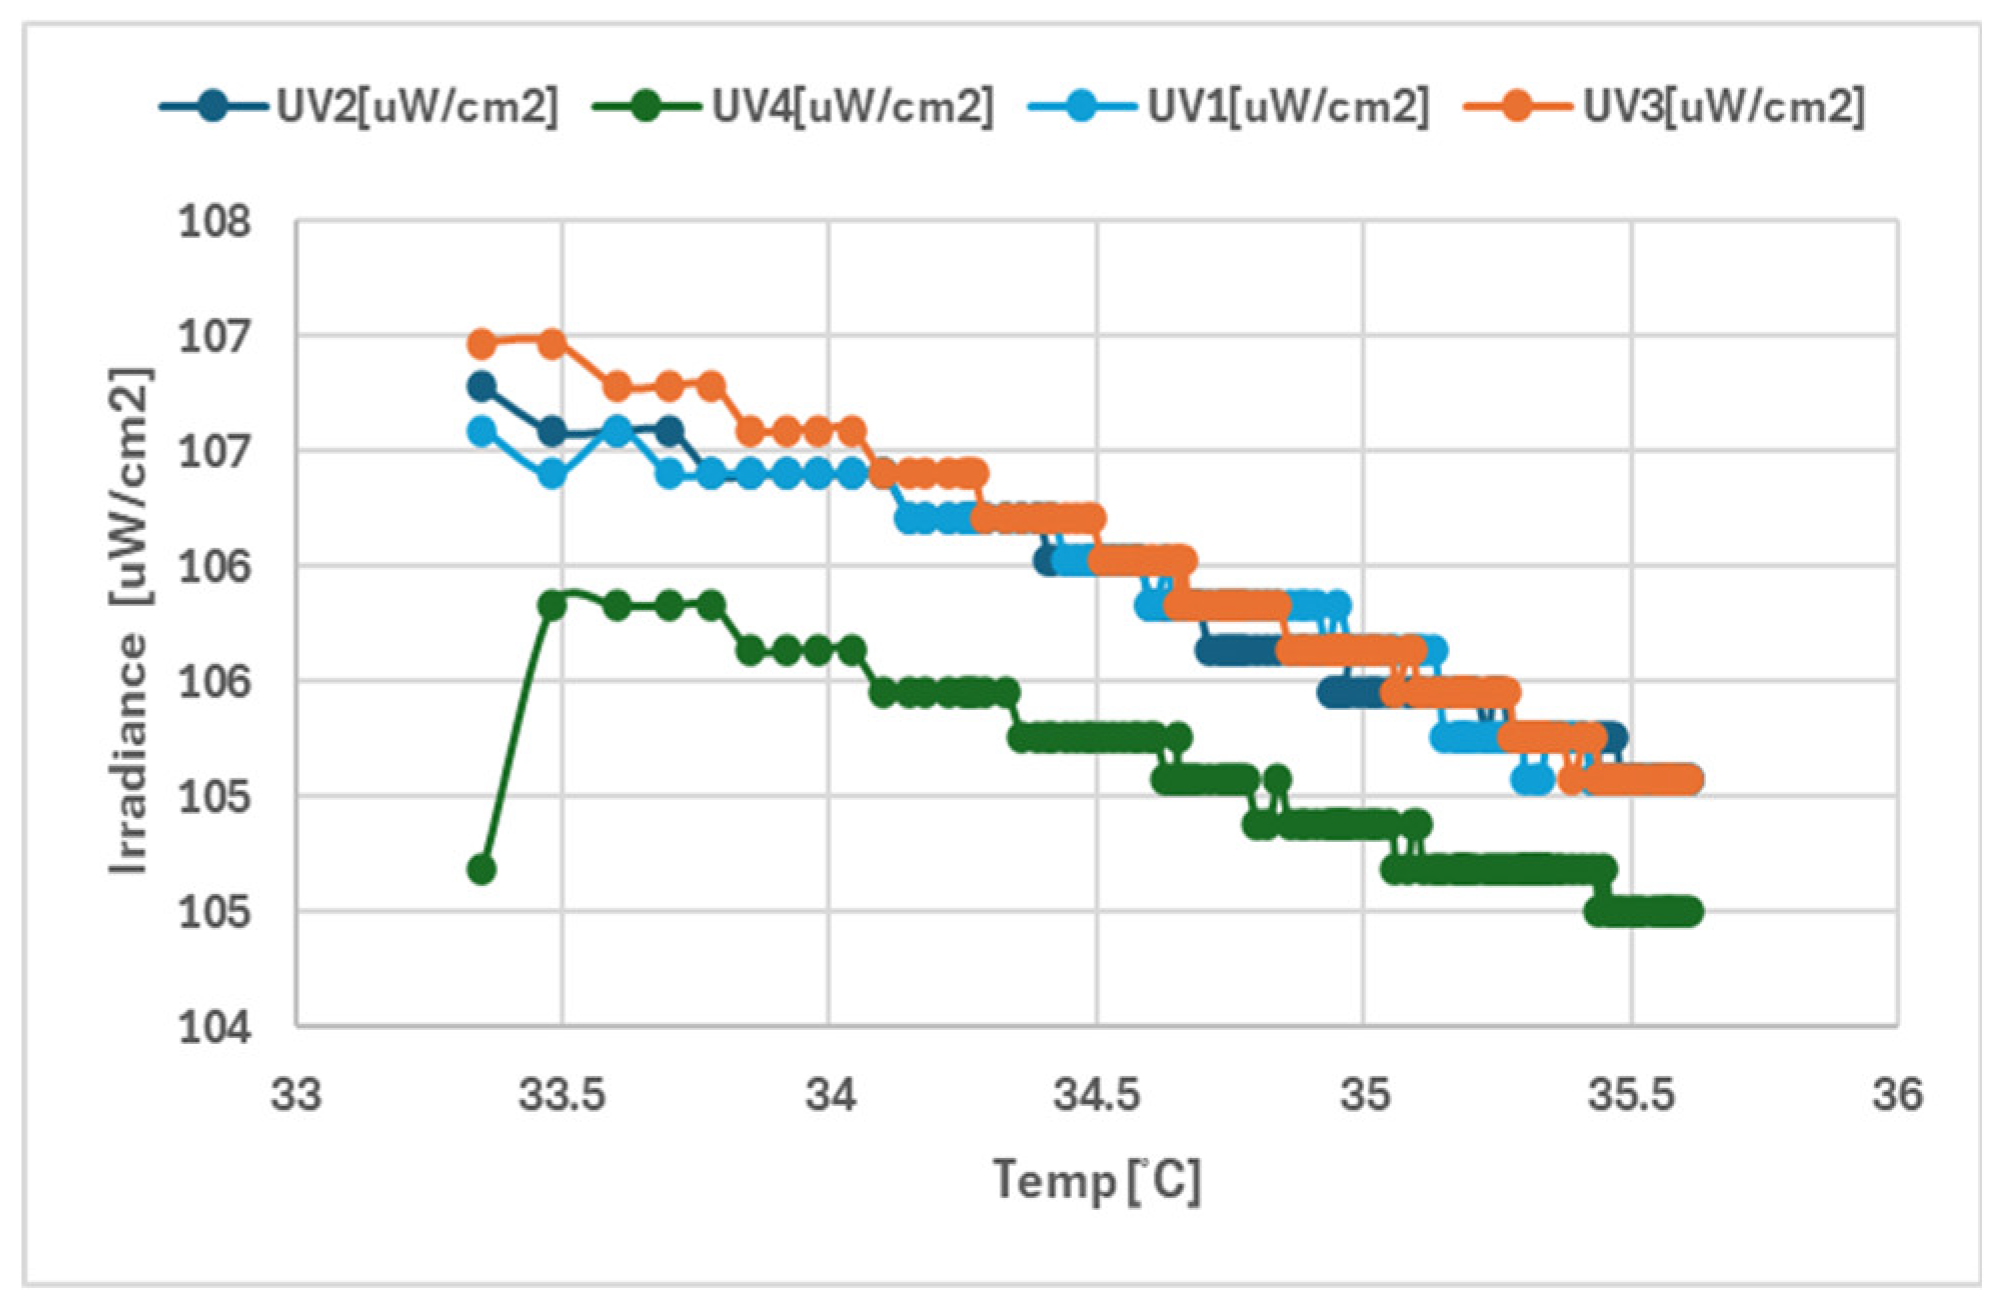
Figure 16.
Evolution of UV-B Radiation in function of flight time.
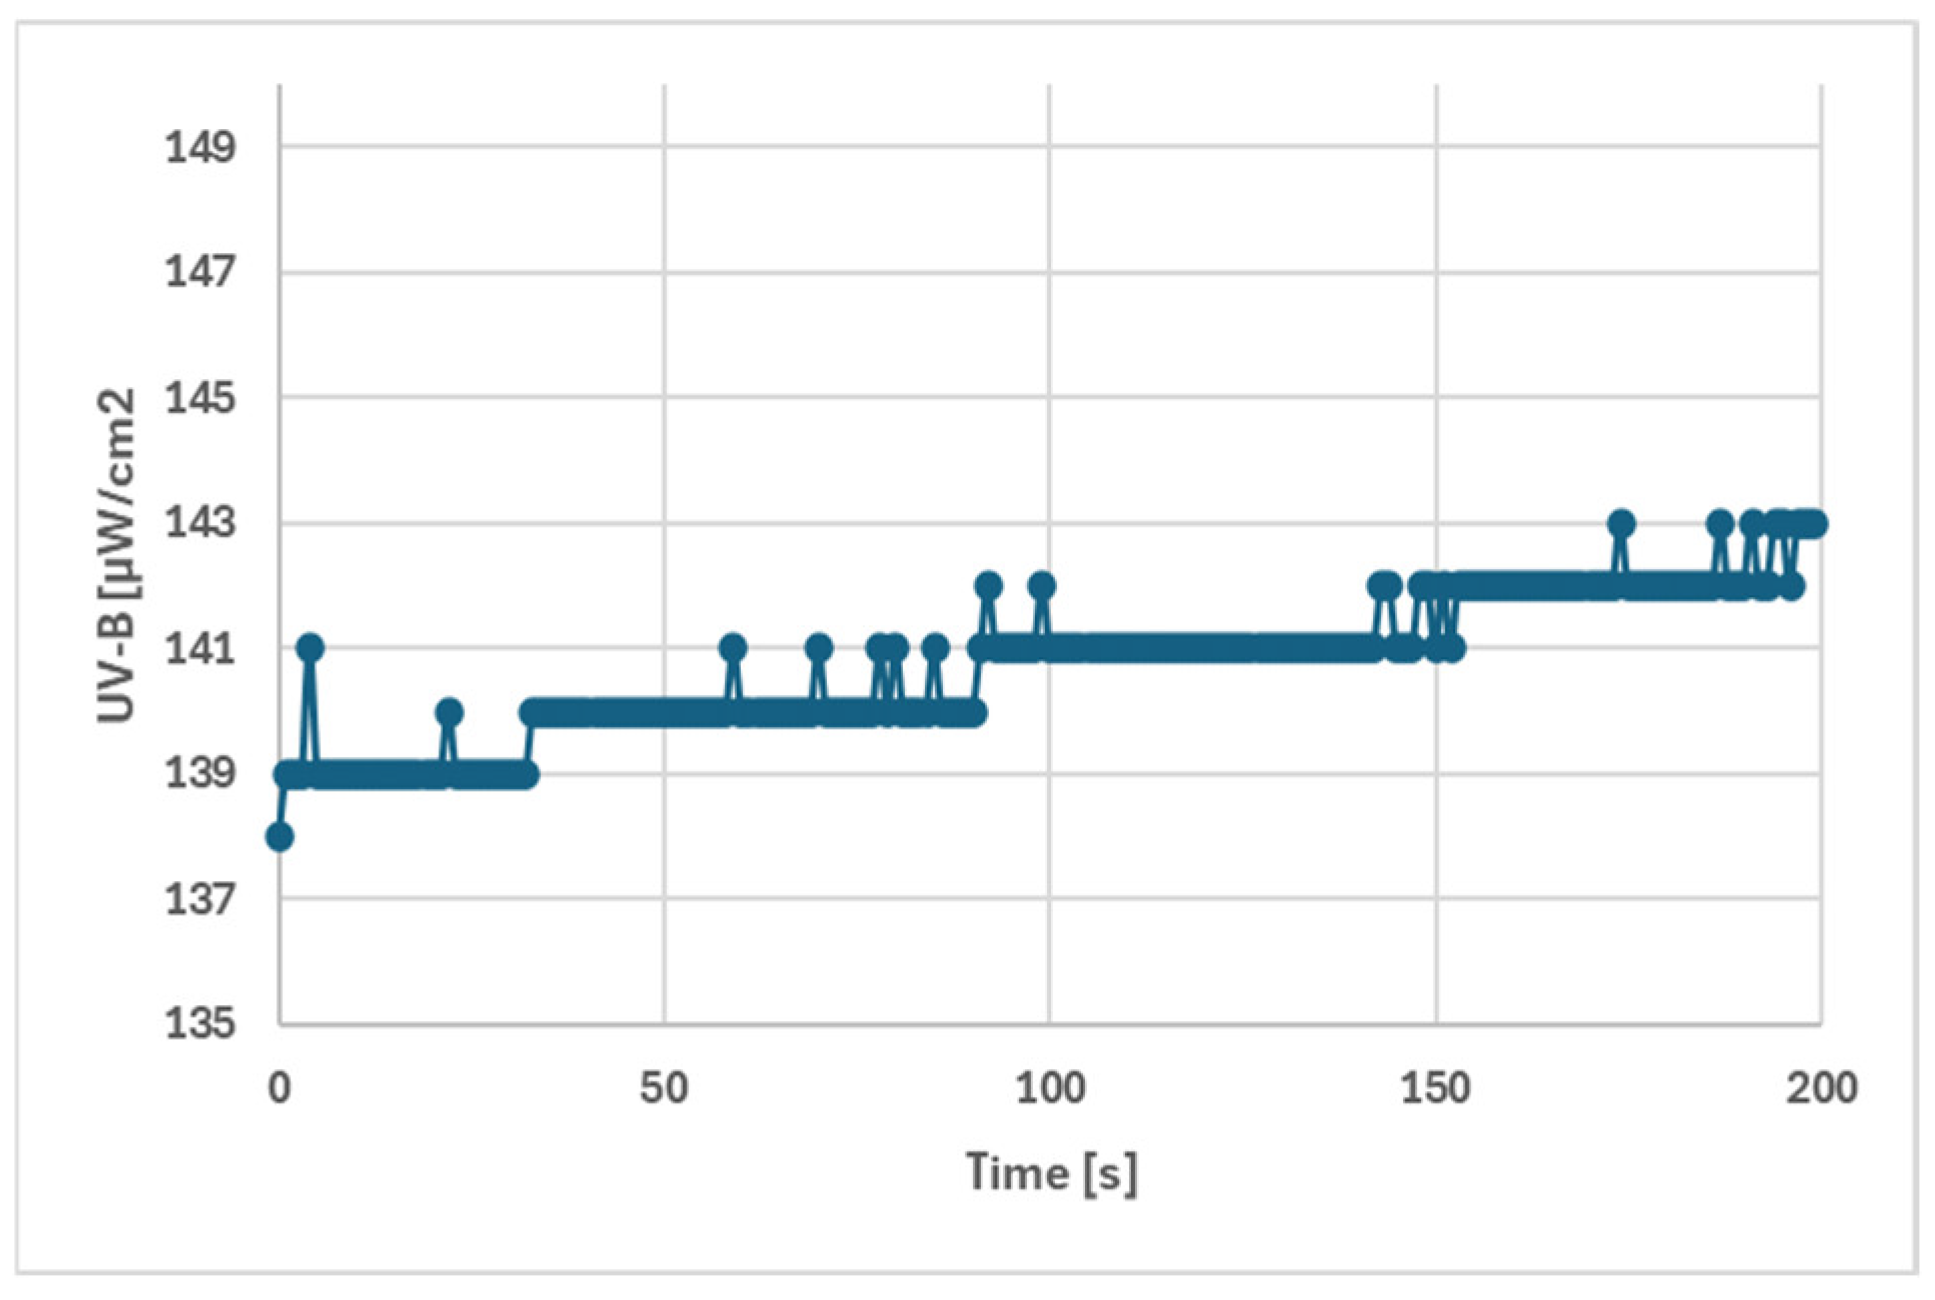
Figure 17.
Testing the distribution data obtained with the VEML6075.
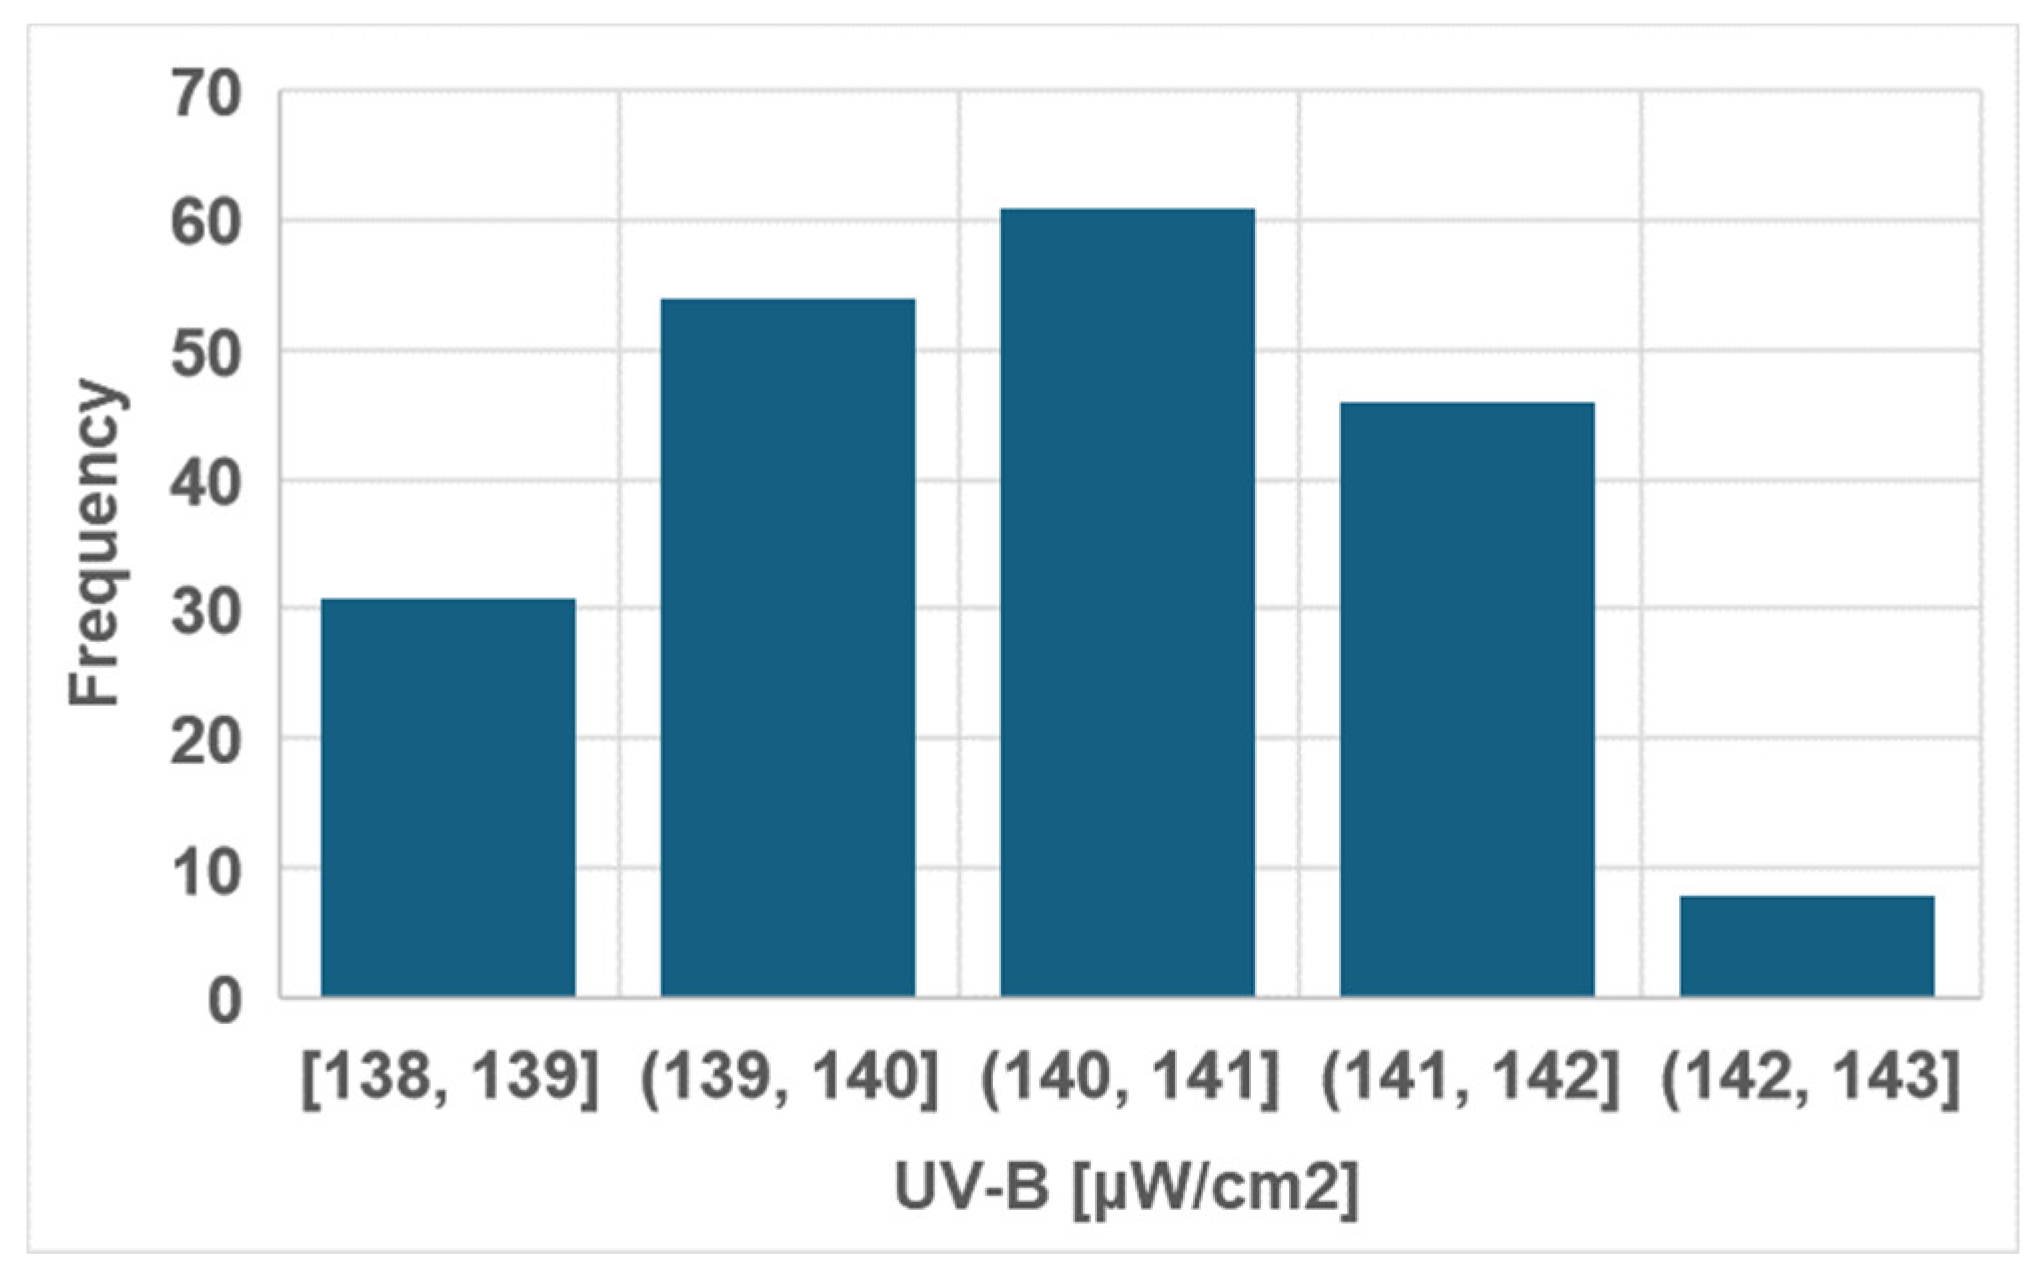
Figure 18.
The energy consumption of the modular UV-B measurement system during monitoring operations.
Figure 18.
The energy consumption of the modular UV-B measurement system during monitoring operations.
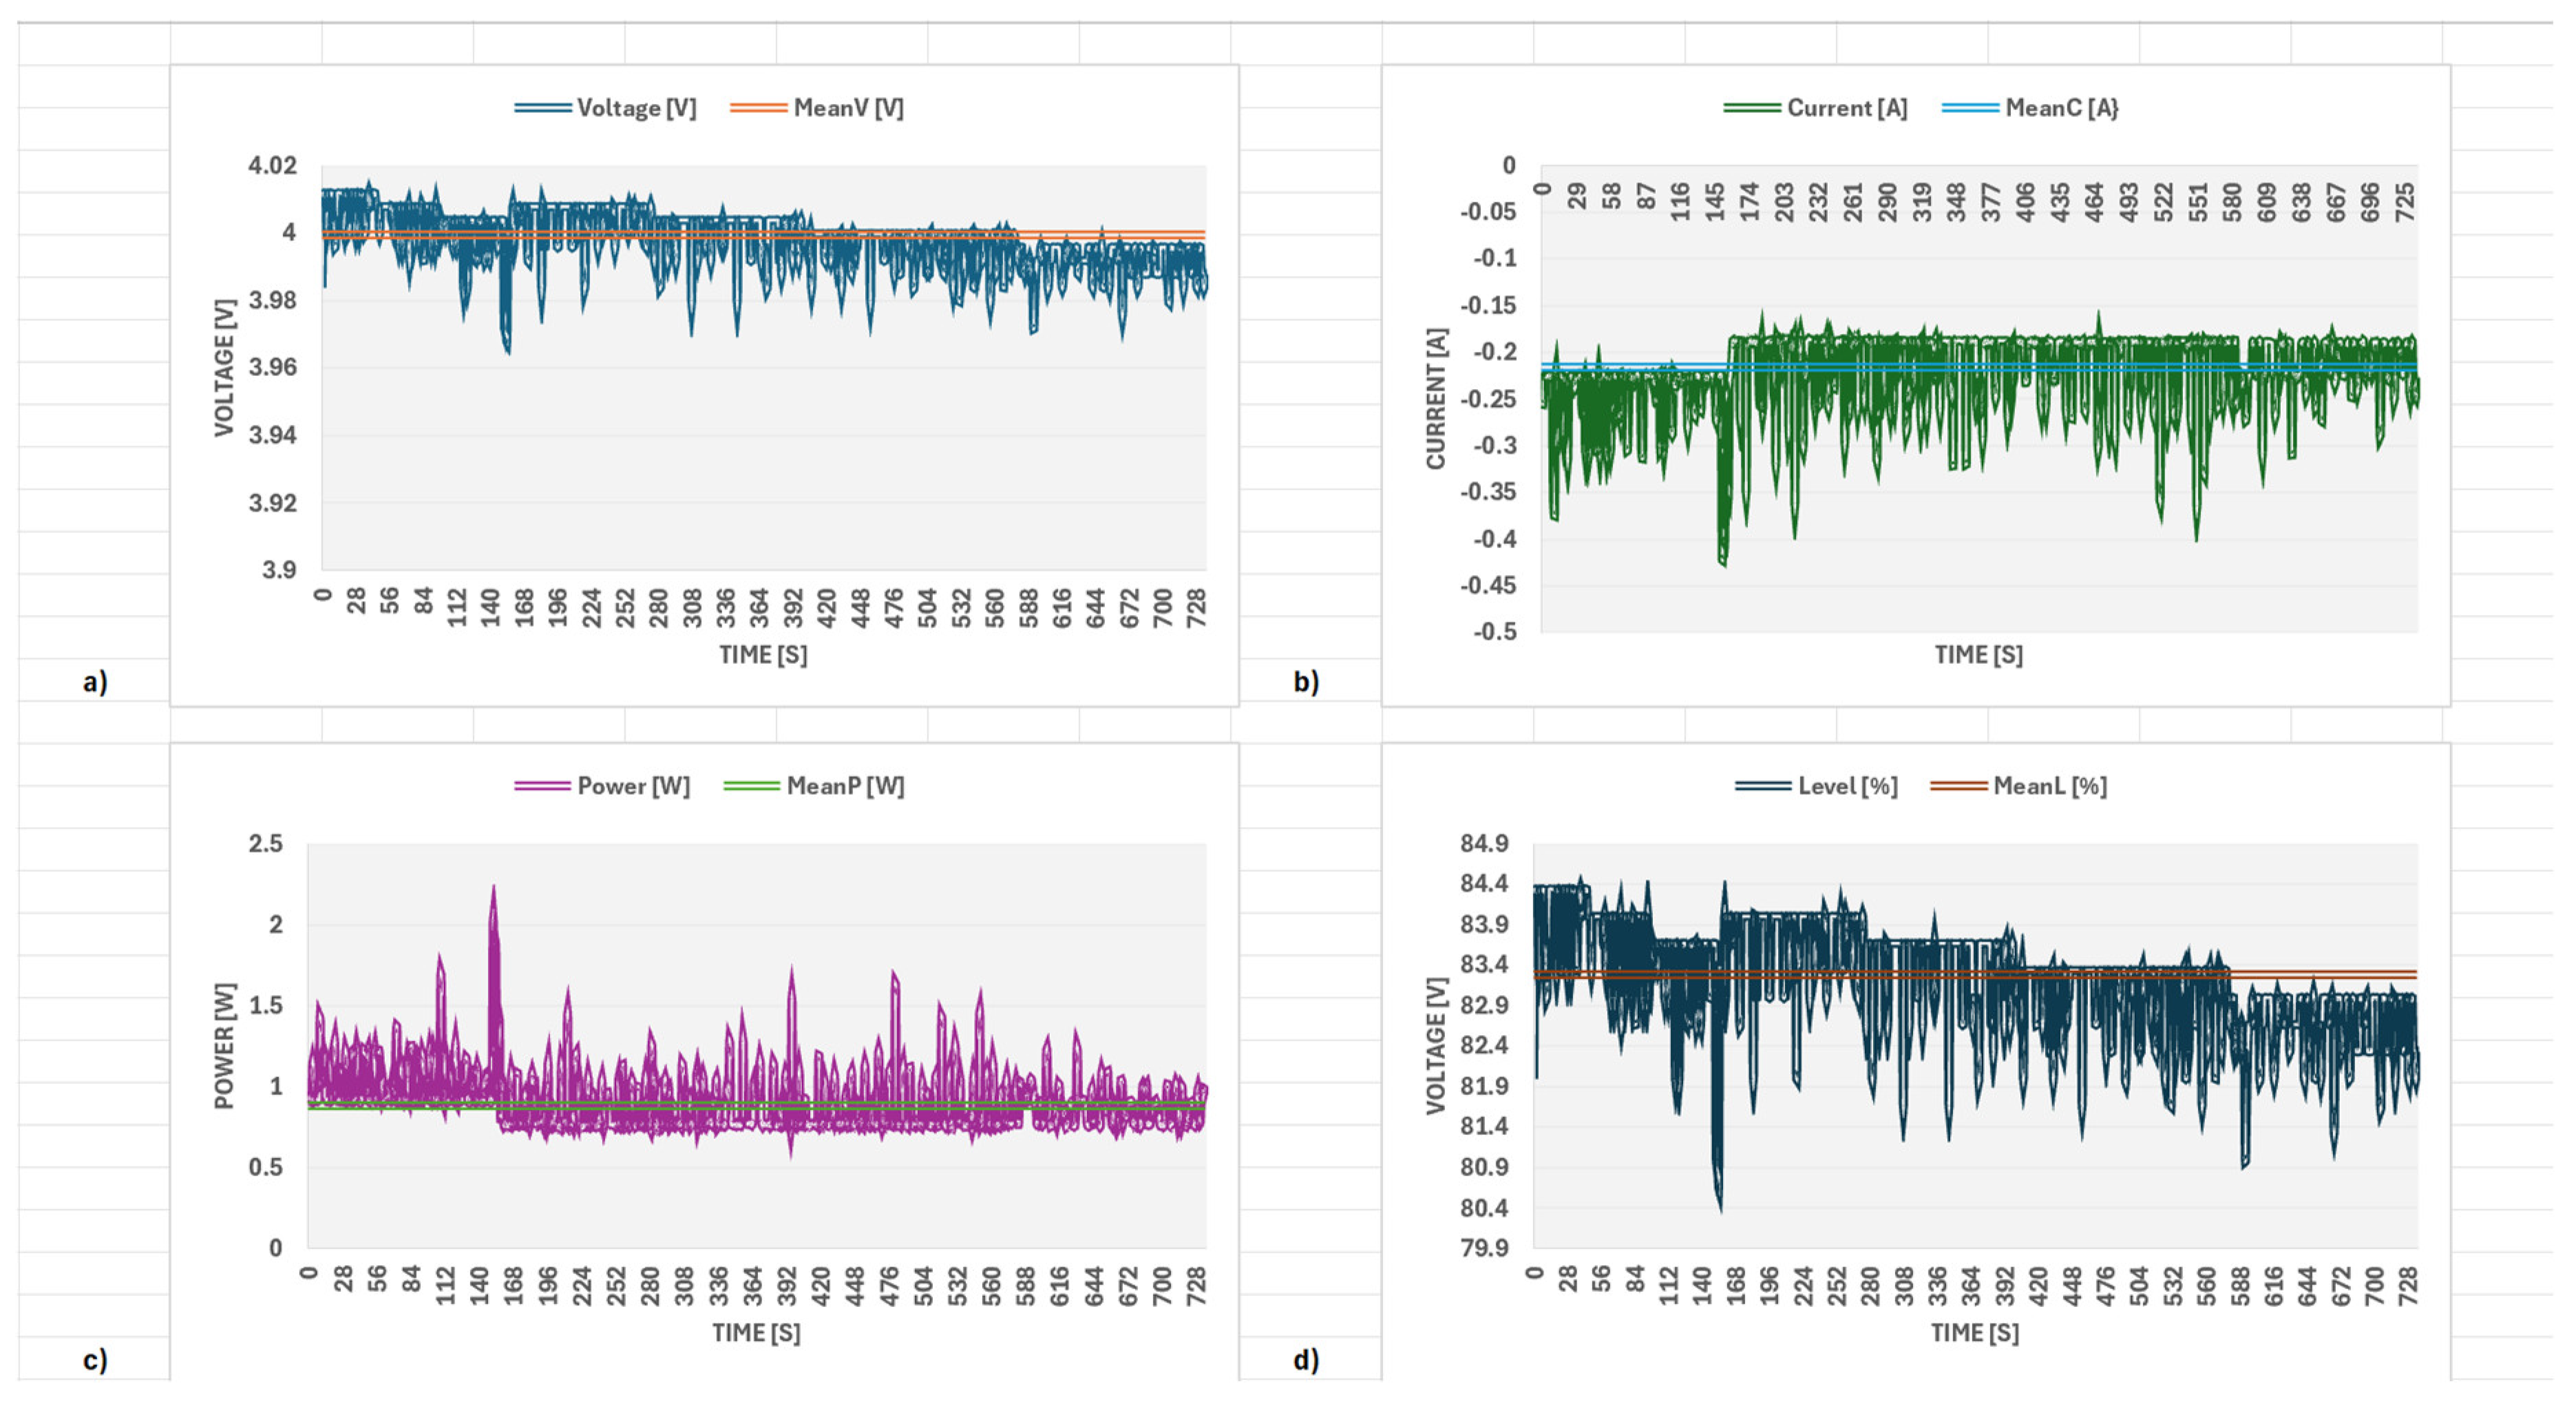
Figure 19.
Analysis of the aircraft’s behavior during the flight mission: (a) The number of GPS satellites connected during the mission; (b) The evolution of the aircraft’s altitude; (c) The variation in wind speed; (d) The variation in pitch and roll angles.
Figure 19.
Analysis of the aircraft’s behavior during the flight mission: (a) The number of GPS satellites connected during the mission; (b) The evolution of the aircraft’s altitude; (c) The variation in wind speed; (d) The variation in pitch and roll angles.
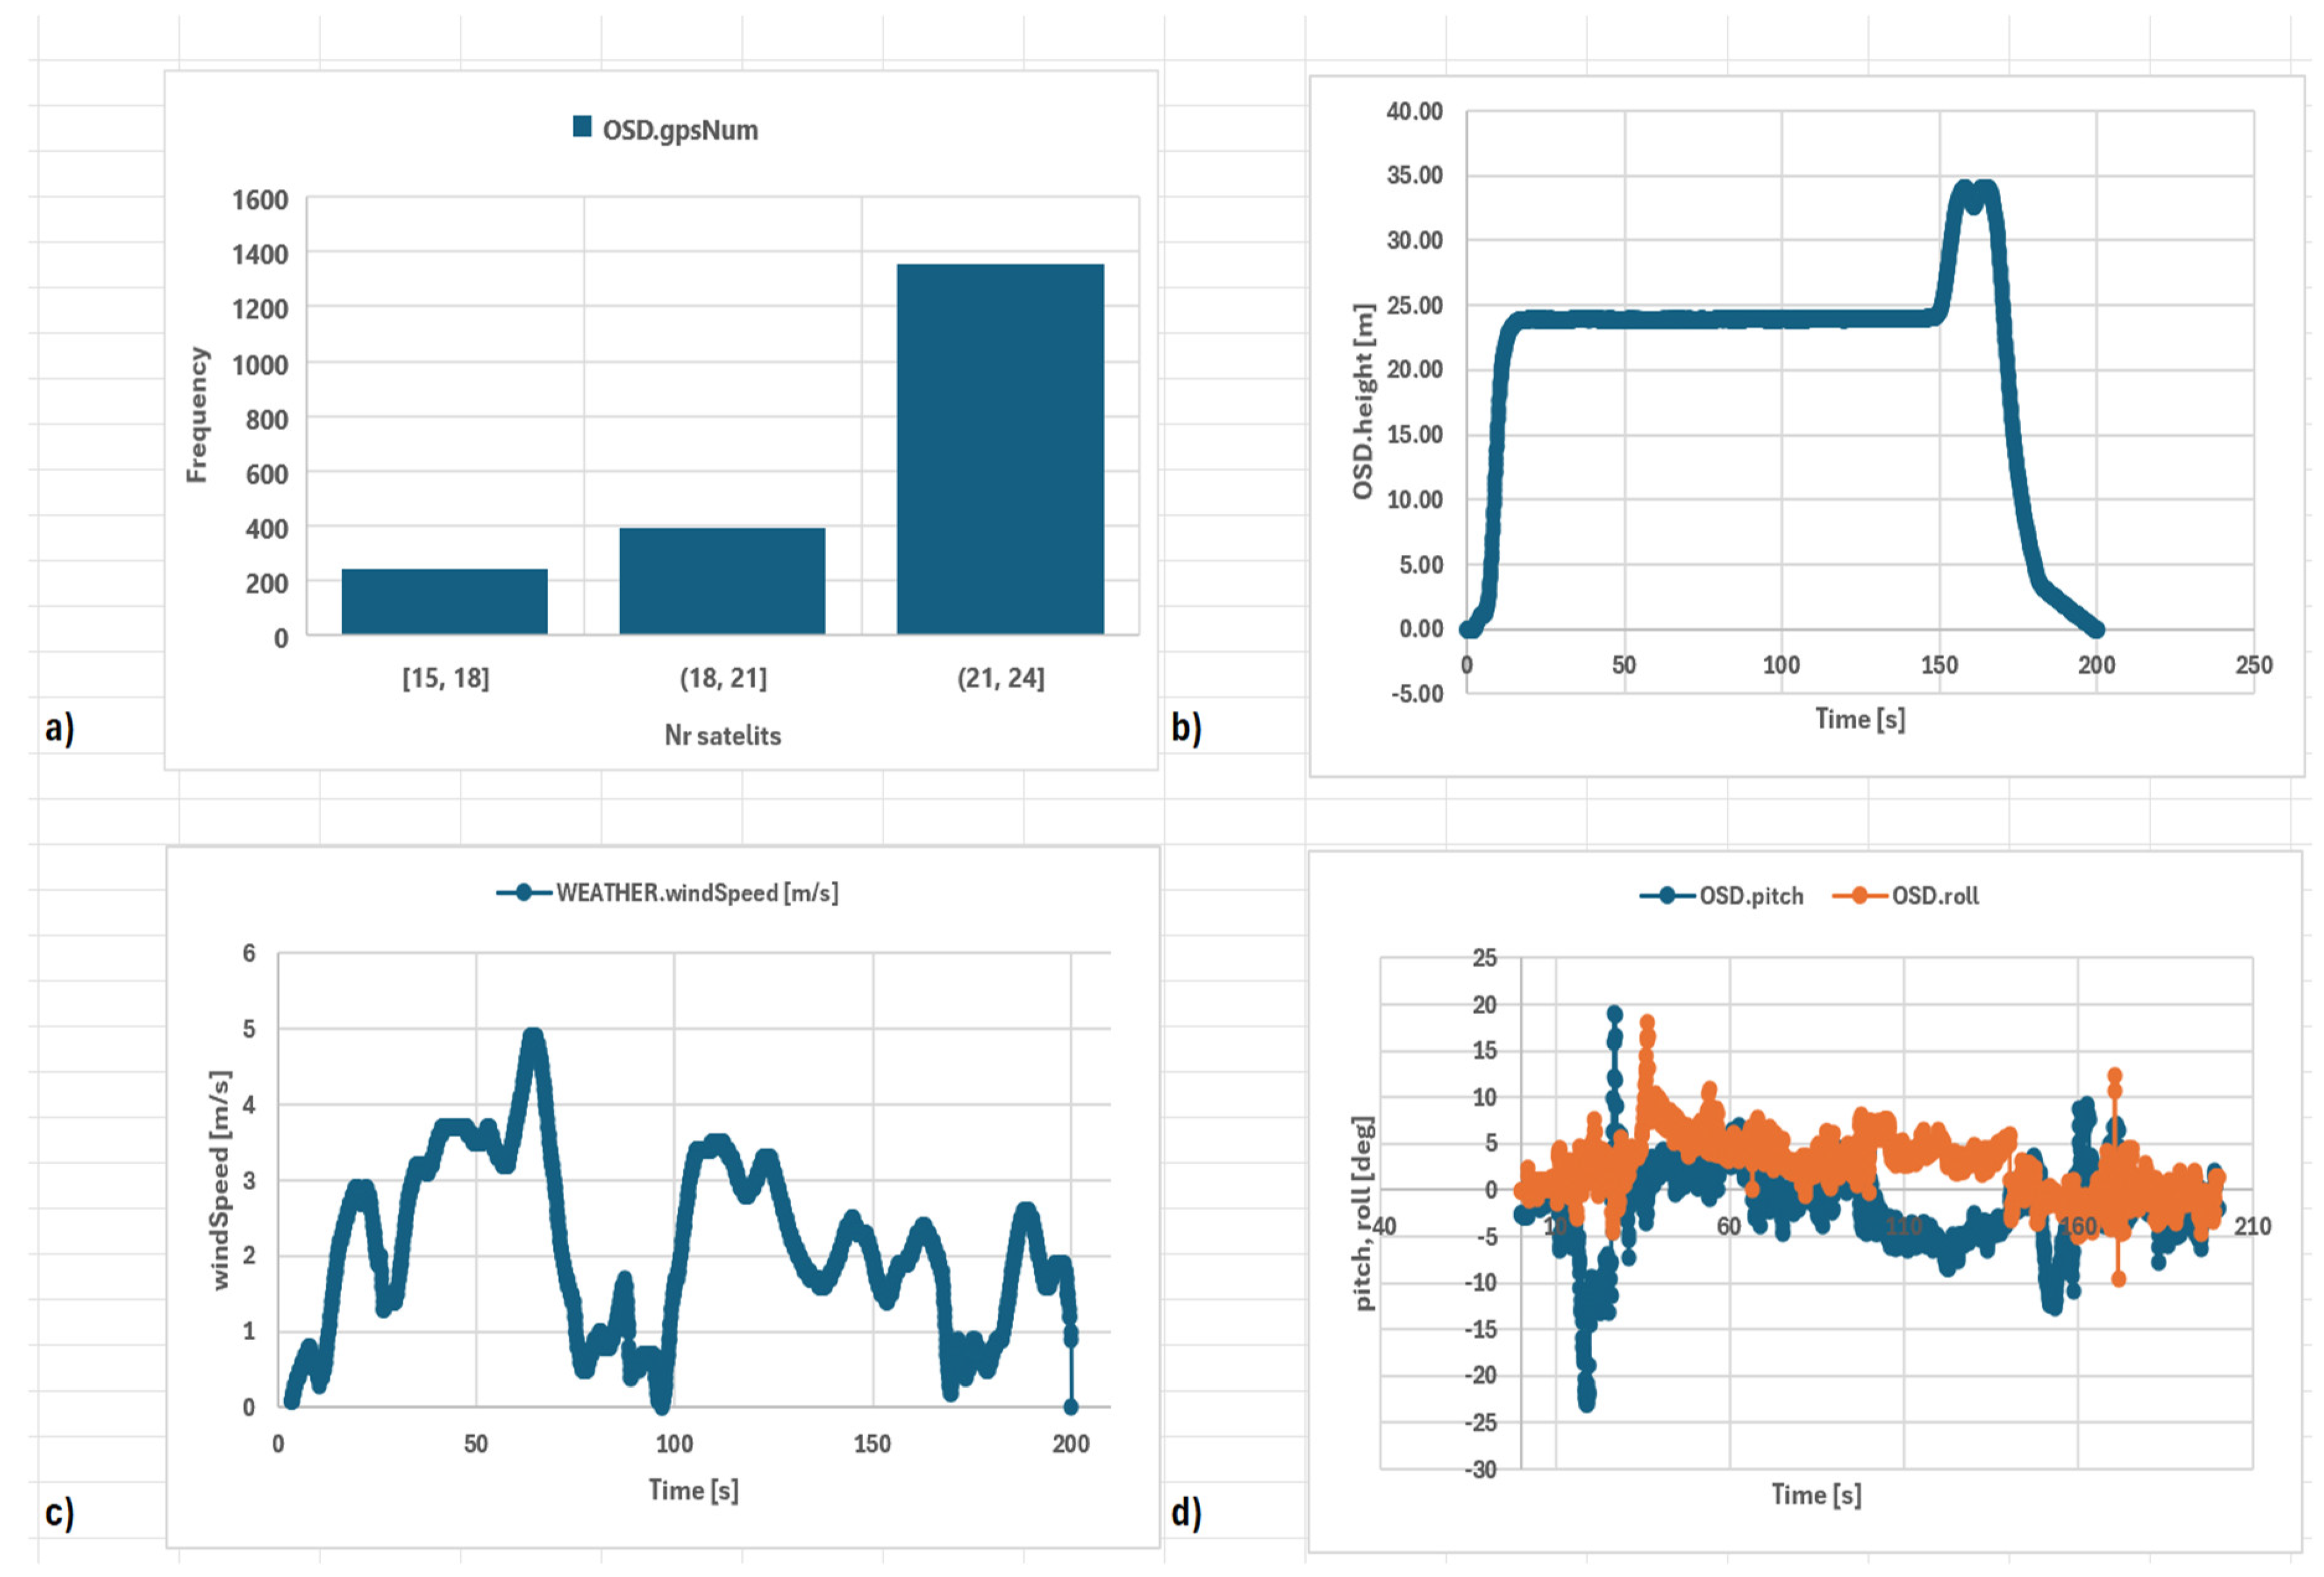
Figure 20.
Analysis of the aircraft’s speed during the flight mission: a) Horizontal speed; b) Speed in the OX direction; c) Speed in the OY direction;d) Speed in the OZ direction.
Figure 20.
Analysis of the aircraft’s speed during the flight mission: a) Horizontal speed; b) Speed in the OX direction; c) Speed in the OY direction;d) Speed in the OZ direction.
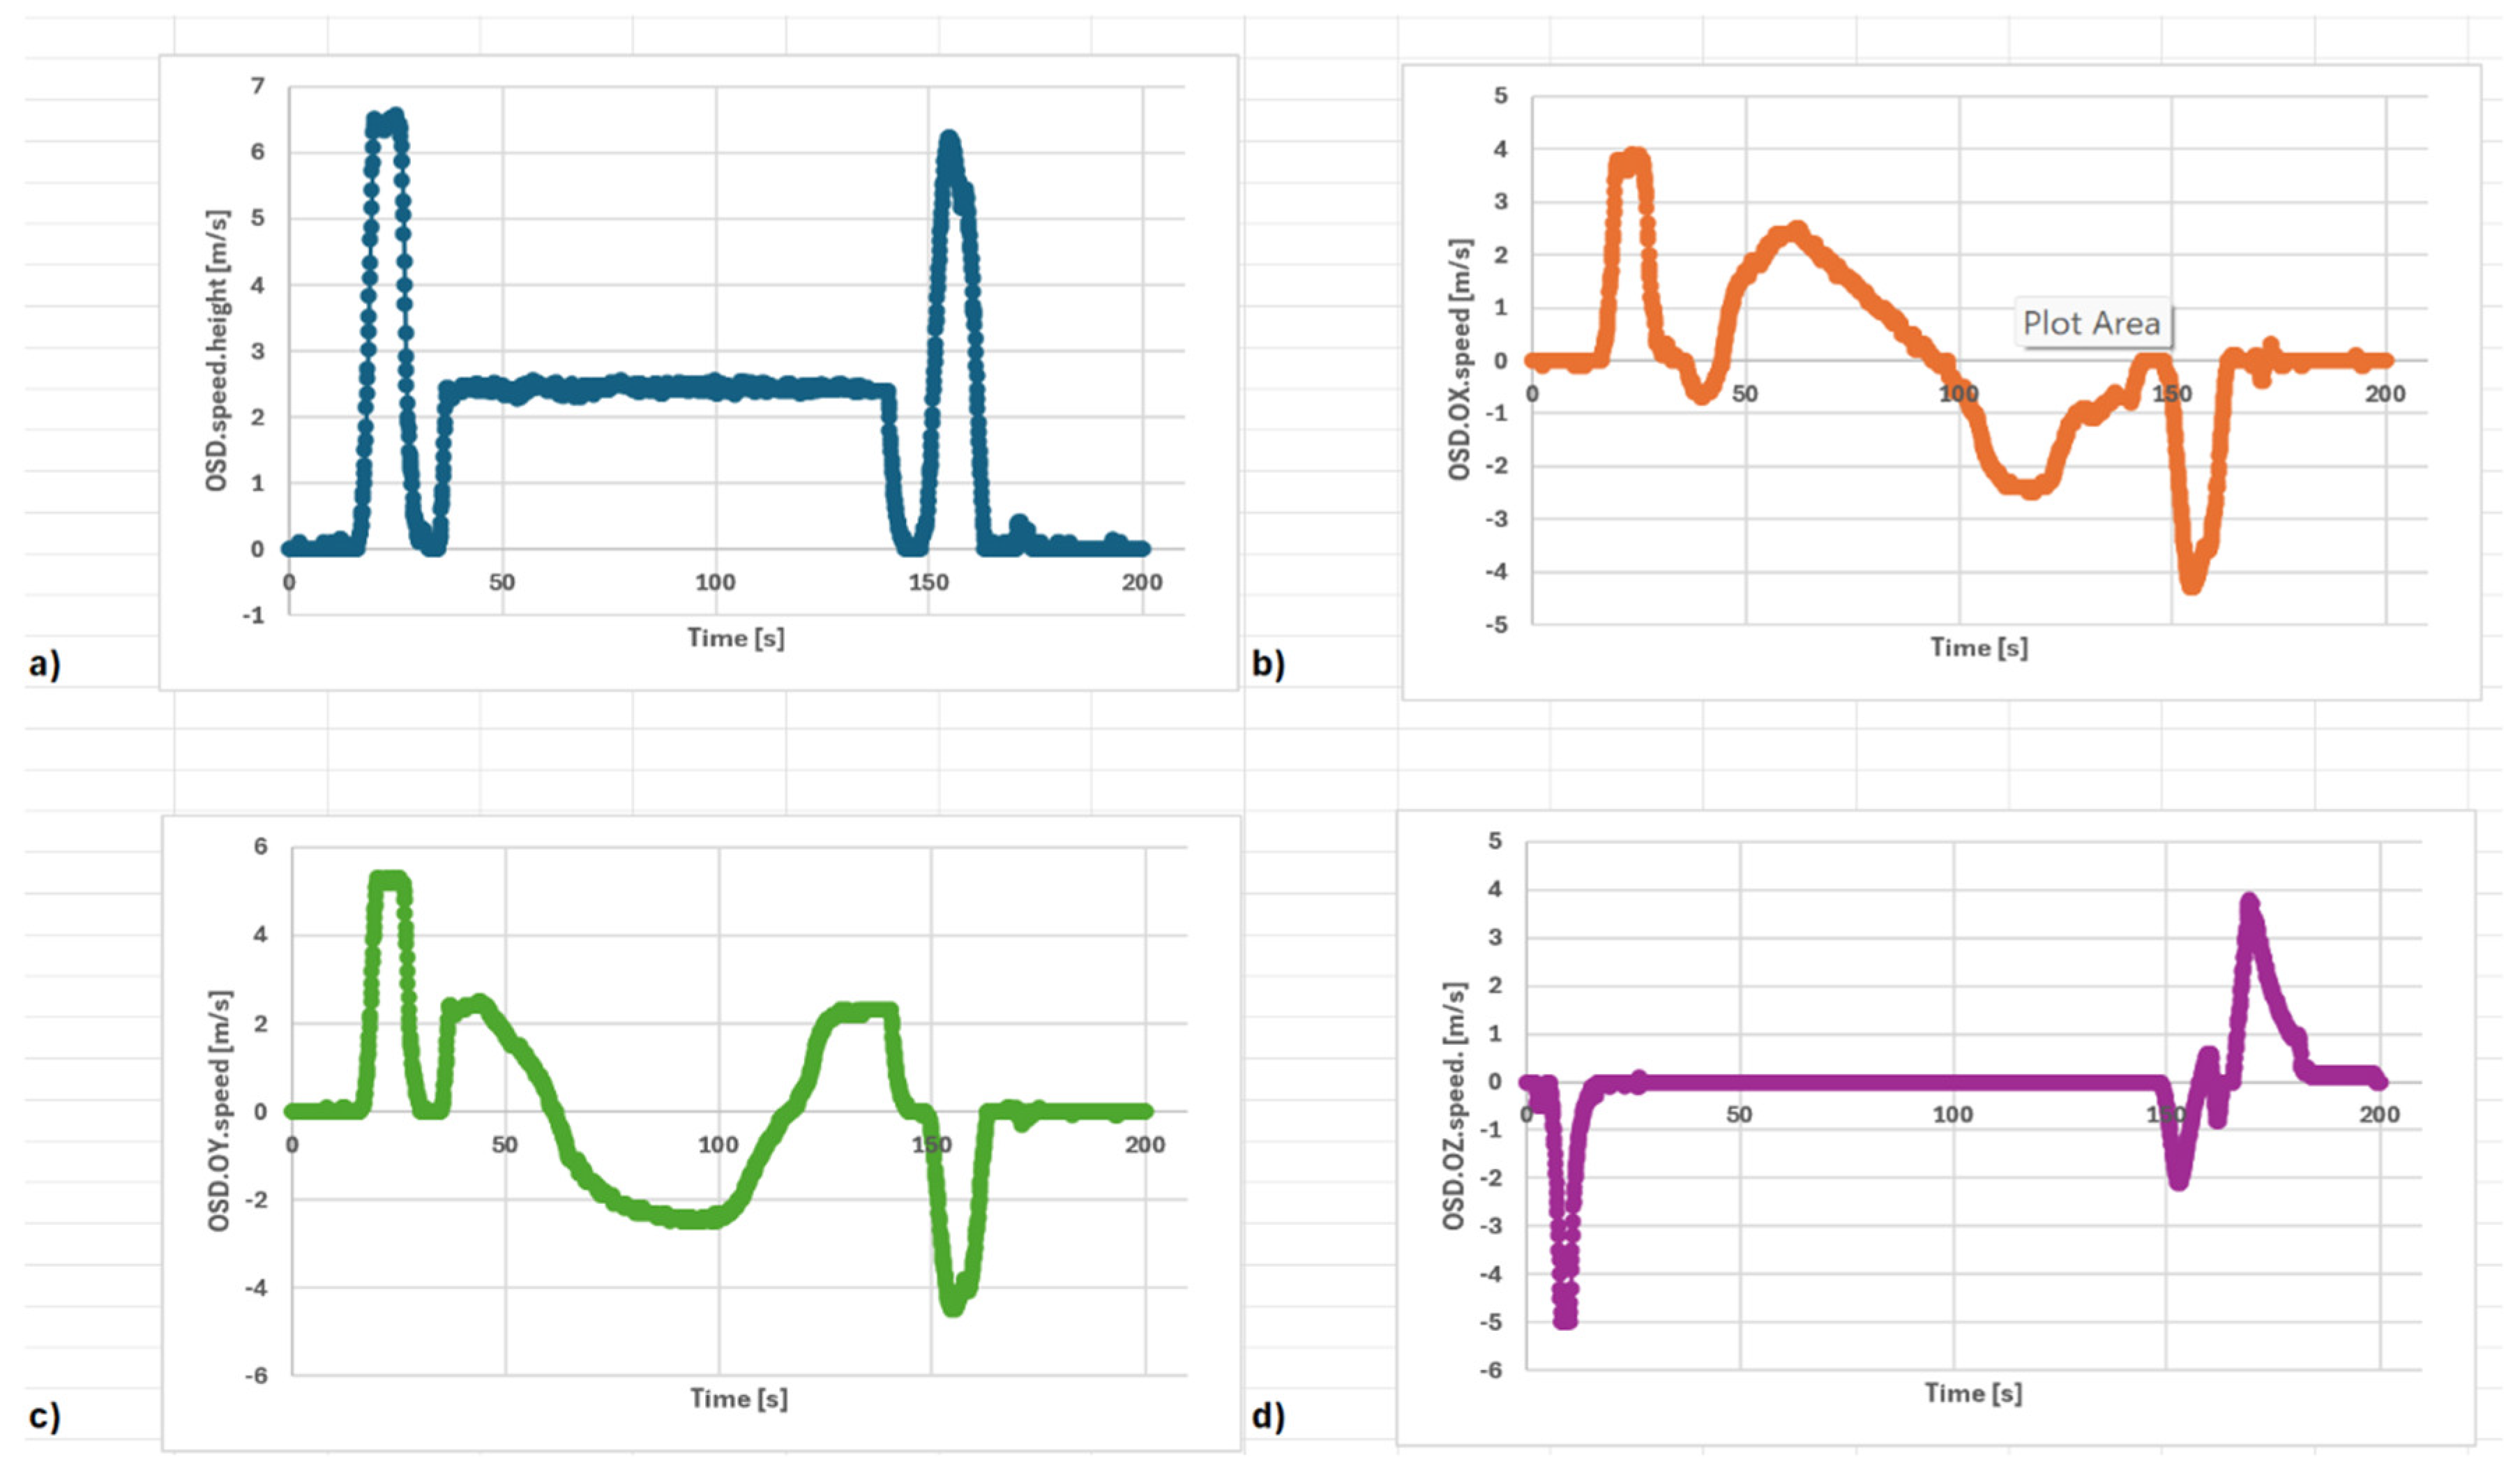

Table 1.
Selected scientific databases and the number of revised articles in different periods.
| Database | Period | |||
| 2010-2015 | 2015-2020 | 2020-2024 | Papers | |
| Google scholar1 | 85 | 362 | 1190 | 1470 |
| IEEE Xplore | 0 | 4 | 9 | 13 |
| Springer Link | 0 | 3 | 6 | 9 |
| ACM Digital Library | 0 | 0 | 6 | 6 |
1 Platform contains and other database.
Table 2.
Functional characteristics of the UPS HAT Waveshare 19739 Device.
| Description | Specifications |
|---|---|
| Output voltage | 5 V |
| Charger | 5 V |
| Control bus | I2C |
| Battery | 803040 Li-po 1000mAh 3.7 V |
| Mounting hole size | 3 mm |
| Dimensions | 65x30 mm |
Disclaimer/Publisher’s Note: The statements, opinions and data contained in all publications are solely those of the individual author(s) and contributor(s) and not of MDPI and/or the editor(s). MDPI and/or the editor(s) disclaim responsibility for any injury to people or property resulting from any ideas, methods, instructions or products referred to in the content. |
© 2024 by the authors. Licensee MDPI, Basel, Switzerland. This article is an open access article distributed under the terms and conditions of the Creative Commons Attribution (CC BY) license (http://creativecommons.org/licenses/by/4.0/).
Copyright: This open access article is published under a Creative Commons CC BY 4.0 license, which permit the free download, distribution, and reuse, provided that the author and preprint are cited in any reuse.


