
Submitted:
02 August 2024
Posted:
05 August 2024
You are already at the latest version
Abstract
Cacalol (C), a sesquiterpene isolated from Psacalium decompositum, has demonstrated anti-inflammatory and antioxidant activities. Its cytotoxic, antiproliferative, and pro-apoptotic effects have been previously shown in an in vitro breast cancer model. A derivative, Cacalol Acetate (CA), shows potential in regulating these processes, which had not been previously reported. This study focused on an in vitro cervical cancer model, assessing CA's anti-proliferative, pro-apoptotic, cytostatic, and anti-migratory activities using the HeLa cell line. The natural anticancer agent I3C was used as a control for comparison. CA demonstrated significant antitumor activities, including inhibiting cell growth, inducing apoptosis, arresting cells in the G2 phase of the cell cycle, and inhibiting cell migration. These effects were notably greater compared to I3C. I3C, while following a similar trend, did not induce Cas-3 expression, suggesting a different apoptotic pathway. Neither CA nor I3C increased p62 and LC3B levels, indicating they do not stimulate autophagy marker expression. Both compounds inhibited HeLa cell migrate on and induced cell cycle arrest. Despite both holding promise as anticancer agents for cervical cancer, CA's lower cytotoxicity and stronger regulation of tumor phenotypes make it a more promising agent compared to I3C.
Keywords:
cacalol
; cacalol acetate
; antiproliferation
; apoptotic effect
; cervical cancer cells
1. Introduction
According to the World Health Organization (WHO), cervical cancer (CC) is the worldwide fifth most frequently occurring cancer [1] and is one of the leading causes of cancer death among women [2]. Although CC is now relatively uncommon in developed countries as United States, it continues to be the first or second leading cause of cancer-related death among women in many low and middle-income countries, with Latin America and the Caribbean region accounting for almost 12% of the world’s CC deaths [3]; actually, 85% of deaths derived from CC occur in underdeveloped or developing countries, and the death rate is 18 times higher in low-income and middle-income countries compared with wealthier countries [4]. Mexico has the second place in CC only below the African continent [5].
Although CC is a preventable disease, many women present with invasive disease requiring radical surgery (early stage disease) and/or combined radiation therapy and chemotherapy (locally advanced disease) [6], but nevertheless these strategies are not successful interventions, and the incomplete removal of the cancer and the negative effect on normal cells could not be excluded [7]. Fortunately, a large amount of information dealing with clinical aspects of cancer chemotherapy are generated, including the finding and application of natural origin drugs.
According to those background, there are two principal requirements on chemotherapeutic antitumor based research, to achieve an efficient antitumoral agent that satisfy a broad population specter: to find a more efficient natural antitumoral agent without adverse effect and a more profitable source of this kind of agent. In this way, we previously reported that indole-3-carbinol (I3C), a non-carcinogenic agonist compounds of the aryl hydrocarbon receptor (AhR), promotes the activation of AhR and decreases cell proliferation, possibly through UBE2L3 (also known as UBCH7, UbcH7, and E2 Ubiquitin-Conjugating Enzyme L3) mRNA induction, which would result in the ubiquitination of HPV (Human Papilloma Virus) E7 protein [8]. However, it is still unknown whether I3C affects other hallmarks of cancer.
On the other hand, another bioactive molecule is cacalol (C), a phytochemical compound with anti-inflammatory and antioxidant properties [9,10]. It has a strong anti-proliferative effect against breast cancer cells, inducing apoptosis by activating a pro-apoptotic pathway [11]. Furthermore, its derivative compound Cacalol Acetate (CA) (see Scheme 1), has shown anti-inflammatory properties [9] but its antitumoral activity is not well known yet.
Although there is no evidence about the antitumoral properties of cacalol acetate in CC, this compound had shown potential utility as a chemopreventive and chemotherapeutic agent against cancer biological models. Particularly, in this study we investigated the anti-proliferative, pro-apoptotic and anti-migratory properties of CA and I3C in a cervical cancer cell line.
2. Materials and Methods
2.1. Cell Cultures
Cervical cancer cell lines, HeLa (positive to HPV-18) was obtained from the American Type Culture Collection (ATCC Rockville, MD, USA). For all assays, HeLa cells were culture in RPMI-1640 media (GIBCO, Carlsbad, CA. USA) and supplemented with 5% newborn calf serum (NCS, GIBCO, USA), L-glutamine, red phenol, and benzylpenicillin. Cultures were maintained in an incubator (Nauire, US) with a humidified atmosphere at 5% CO2 and 37 °C. All cell-based assays were performed using culture cells in the exponential growth phase.
2.2. Tested Compounds
CA were solubilized in 100 µl dimethyl sulfoxide (DMSO; Sigma-Aldrich, St. Louis, MO, USA) and 900 µl of RPMI-1640 medium resulting in a final concentration of 1 µg/ µl. I3C (Sigma-Aldrich, St. Louis, MO, USA; purity ≥ 96%) was solubilized in DMSO and using in at final concentration of 150 µM.
2.3. Cell Proliferation Assays
HeLa cells (6 × 10³ cell/well) were cultivated in a 96-well tissue culture plate (Corning, USA) with a 100 µl of RPMI-1640 medium and growth for 24 h at 37 °C and 5% CO2. Then, CA was added at several concentrations (from 20 µg/ml to 29 µg/ml) and incubated as mentioned above. I3C was added at final concentration of 150 µM. As controls, we added 5 µg/ml of DMSO (vehicle) in cell culture sample and we included one cell culture without treatment (control). In addition, HeLa cells were treated with 1 µM of beta-naphthoflavone (BNF), a agonist synthetic ligand of AhR with anticancer activity against mammary carcinoma cells [13] and cervical cancer cells [14] as a control. After 24 h of incubation with CA, we determine the antiproliferative activity (IC50) by crystal violet staining as previously reported [15,16]. Finally, the cell count was performed spectrophotometrically at 590 nm (Awareness Technology INC, Chromate 4300, USA). Data were analyzed in a dose-response curve to estimate the concentration at which 50% of the cell population decreases (IC50).
2.4. Determination of Apoptosis by Evaluation of Active Caspase-3
HeLa cells (6 × 10³ cell/well) were incubated for 24 h with 102.72 μM of CA and I3C (150 µM). As controls, cells were incubated with 5 µg/ml DMSO (vehicle), and 1 mg/ml colchicine (positive apoptotic cell death control) and beta-naphthoflavone (BNF) (1 µM). For immunodetection of active caspase-3 we followed a reported protocol [16]. Briefly, cells were permeabilized with Triton X-100 (1%) for 20 minutes, after which cells were washed with phosphate buffered saline (PBS) pH 7.3. Then, cells were incubated with rabbit anti-human active caspase-3 polyclonal antibody (Sigma-Aldrich, USA) diluted in PBS (1:1000) for 18 h at 4 °C. Following cells were washed and incubated with goat anti-rabbit IgG secondary antibody coupled to fluorescein-5-isothiocyanate (FITC) diluted 1:1000 in PBS at room temperature for 2 h. Then samples were stained with 4′6-diamidino-2-phenylindole (DAPI) and analyzed under epifluorescence microscopy (Eclipse E600, Nikon, USA) and phase contrast microscopy (Eclipse TS2R-FL, Nikon, Japan). We use a DXMI200F digital camera (Nikon, Melville, NY, USA) for recorded images.
2.5. Determination of Autophagic (p62 and LC3B) Biomarkers by Western Blot Analysis
HeLa cells treated with CA (102.72 μM), I3C (150 µM), DMSO (5 µg/ml, vehicle), BNF (1 µM) and untreated cells (control) were grown for 24 h and were subjected to lysis using RIPA buffer (Santa Cruz Biotechnology, Inc., sc-24948) supplemented with 0.1% protease inhibitors (Complete Protease Inhibitor Cocktail, Roche, catalog number 11697498008). The lysates were then incubated at 4 °C for 30 minutes, followed by centrifugation at 13,000× g at 4 °C for 25 minutes. The soluble protein concentrations in the cell lysates were measured spectrophotometrically at 280 nm using the EPOCH Microplate Spectrophotometer (Bio Tek). Equal amounts of protein from each sample were combined with 5X Laemmli sample buffer (10% SDS, 50% glycerol, 0.02% bromophenol blue, and 0.3125 M Tris HCl, pH 6.8), supplemented with β-mercaptoethanol, and boiled for 10 minutes. Subsequently, 50 µg of protein from each sample were separated on 12% SDS-PAGE gels using a vertical electrophoresis system (Mini Trans-Blot® Cell, Bio-Rad, catalog number 1703810). The separated proteins were then transferred onto 0.45 µm polyvinylidene difluoride (PVDF) membranes (Thermo Scientific, catalog number 88518) using a Trans-Blot Turbo chamber (Bio-Rad) at 25 V and 1 mA for 30 minutes. The membranes were subsequently blocked with 5% non-fat milk in TBS (pH 7.0) containing 1% Tween-20 for 2 hours at room temperature, followed by incubation with primary antibodies against p62 Rabbit pAb (1:3000 dilution, ABclonal), LC3B Rabbit pAb (1:3000 dilution, ABclonal), and β-actin mouse mAb (1:10,000 dilution, ABclonal, catalog number AC004) overnight at 4 °C on a rocking platform. After washing the membranes five times with TBS (pH 7.0) containing 0.1% Tween-20, membranes were incubated for 1 hour at 25 °C with peroxidase-conjugated secondary antibodies anti-rabbit IgG (1:10,000 dilution, Cell Signaling Biotechnology, catalog number 7074s) or anti-mouse IgG (1:10,000 dilution, Cell Signaling Biotechnology, catalog number 7076s) for β-actin detection. Finally, the membranes were washed with TBS (pH 7.0) containing 0.1% Tween-20 and developed using chemiluminescence with Clarity MaxTM Western ECL (Bio-Rad, catalog number 1705062) following the manufacturer's instructions. Image analysis was performed using the C-DiGit Blot (LI-COR). All experiments were conducted in triplicate. β-actin was consistently detected as a loading control and used for normalizing the densitometry of the target proteins with Image J software. Data normalization was carried out by dividing the densitometry data of the target protein by that of the loading control protein (β-actin).
2.6. Determination of Cell Migration
To assess cell migration, a wound healing assay was conducted under sterile conditions. In 96-well plates, adhesive tape (0.5 mm width) was carefully positioned, and a mark with a 2-mm division was applied at the center of each well to demarcate the area for subsequent photographic analysis. Following this, HeLa cells were seeded at a density of 3×10⁴ cells per well in 100 µl of RPMI medium supplemented with 10% neonatal serum and incubated for 24 hours at 37 °C with 5% CO2. After the initial incubation period, 10 µM cytarabine (ara-C) was added and cells were further incubated for 2 hours under the same conditions. The adhesive tape was then carefully removed to create a wound. The samples were gently washed with PBS (pH 7.0), and HeLa cells were treated with CA (102.72 μM), I3C (150 µM), DMSO (5 µg/ml, vehicle), and BNF (1 µM). Negative controls (untreated cells) and cells treated with 105 mM TGF-β were included in each experimental set. Cell migration was observed at various time points (0, 24, 48, and 72 hours) and documented using a Canon camera. Each experiment was conducted in triplicate, with three biological replicates and technical triplicates for each measurement. The thickness of the wound was analyzed using bioinformatics tools (Image J) by assessing images captured at different time points within the designated area and quantifying the migration rate of the cells.
2.7. Determination of Cell Cycle Arrest
Cells (3 × 10⁵) were seeded in a 6-well plate and incubated for 24 hours at 37 °C with 5% CO₂. Subsequently, the cells were divided into untreated and treated groups. Treatment involved the addition of 20 µL of colchicine (1 mg/ml, as a positive control), 102.72 μM of CA, 150 µM of I3C, 5 µg/ml DMSO (vehicle), and 1 µM of BNF. The cells were then incubated for an additional 24 hours at 37 °C with 5% CO₂. Following the incubation period, the cells were trypsinized and collected by centrifugation at 212× g for 3 minutes at room temperature. The collected cells were fixed in ice-cold methanol (500 µL) with PBS (pH 7.0) (500 µL) at 4 °C for 1 hour. After fixation, the cells were washed three times with PBS (pH 7.0) (1 mL each wash) and centrifuged as described above. Next, the cells were treated with 30 µL of RNase A (100 U/ml) and incubated for 30 minutes at 37 °C. After another round of centrifugation, the cells were resuspended in 500 µL of PBS containing 5 µl of propidium iodide (20 µg/ml) and analyzed using the Beckman-Coulter CytoFlex cytometer (Beckman Coulter, USA). The concentration of colchicine chosen for treatment was based on reported values known to arrest the cell cycle at the G2 phase. Each measurement was conducted with three biological replicates and technical duplicates.
2.8. Statistical Analysis
All data were reported in term of mean and standard errors (SE). Statistical analyses were performed by variance differences (ANOVA) using SPSS 10.0.
3. Results
3.1. Cytotoxicity Activity of Phytochemical Compounds on HeLa Cells
First, we determined cellular cytotoxicity by measuring lactate dehydrogenase (LDH), an enzyme that catalyzes the conversion of lactate to pyruvate and is released from cells after membrane dissolution by a toxic stimulus. We did not find cytotoxic activity on HeLa cells from CA or I3C at concentrations of 102.72 μM or 150 μM, respectively, compared to the untreated control or vehicle (Figure 1).
3.2. Anti-proliferative Activity of CA and I3C in HeLa Cells
The antiproliferative effect of CA and I3C was determined for HeLa cells. Antiproliferative activity was measured by a decrease in cell growth 24 h after compound administration. Both compounds had the ability to impair HeLa cell proliferation (Figure 2). A concentration of 150 µM of I3C inhibited cell growth by 70%. In contrast, CA (102.72 μM) inhibited cell growth by 40%. Taken together, these results suggest that CA has greater antiproliferative activity for HeLa cells than I3C.
3.3. Caspase-3-Induced-Apoptosis in HeLa Cells by CA and I3C
The apoptotic pathway, and its initiation may rely on the liberation of cytochrome c and caspase-9 activation, resulting in caspase-3 cleavage [17]. To determine the correlation between Cas-3-induced-apoptosis by CA or I3C, we treated HeLa cells with those compounds (Figure 3). We observed that CA induces the expression of Cas-3, suggesting that CA induces apoptosis via Cas-3. Moreover, after I3C and BNF treatments, the expression of Cas-3 was not increased, suggesting that Cas-3-induced-apoptosis was not triggered by I3C or BNF. The positive control (colchicine) induces Cas-3 expression, thereby activating the Cas-3-induced-apoptosis.
3.4. Determination of Autophagy Induced by CA and I3C Treatments in HeLa Cells
Autophagy biomarkers such as LC3B and p62 were detected by immunoblotting (Figure 4a) and the expression levels of LC3B and p62 were normalized using the expression of β-actin as a loading control (Figure 4b). In all treatments, the expression levels of LC3B or p62 were not statistically significantly different. Neither CA, I3C, nor BFN induced changes in the expression of LC3B or p62, suggesting that these compounds did not induce autophagy.
3.5. Effect of CA and I3C On Cell Cycle Arrest of HeLa cells
To explore the impact of CA and I3C on cell cycle progression, we examined the distribution of HeLa cells treated with both compounds (Figure 5a). Approximately 28% of HeLa cells treated with CA remained in G2 phase. In contrast, the 18% of cells treated with I3C remained in this phase. Therefore, CA has a stronger effect on arresting the cell cycle of HeLa cells in phase 2 than I3C. Additionally, HeLa cells treated with I3C predominantly remained in the S phase (48%), while 58% of cells treated with BNF remained in the G1 phase. Approximately, 95% of cells treated with colchicine (positive control) remained in the G2 phase (Figure 5b).
3.6. Effect of CA and I3C Over Cell Migration of HeLa Cells
Wound assays were conducted to assess whether CA or I3C could influence cell migration in HeLa cells (Figure 6a,b). At 72 hours, cell migration of HeLa cells was significantly enhanced following TGF-β treatment (positive control) compared to untreated cells [negative control, C(-)] and vehicle. Conversely, the presence of CA significantly reduced cell migration by 58% in HeLa cells at 72 h (p>0.05) compared to the positive control. On the other hand, in HeLa cells, relative migration decreased by 40% after 72 hours of treatment with 150 µM I3C compared to the positive control. Additionally, BNF reduced HeLa cell migration by 75%, while the negative control and vehicle reduced cell migration by approximately 30% compared to the positive control These results suggested that CA (102.72 μM) reduced HeLa cell migration 1.45-fold more than I3C did. Therefore, the CA has a greater effect in reducing cell migration of HeLa cells compared to I3C.
4. Discussion
Sesquiterpenes present in several plant species induce apoptosis in cancer cells through different mechanisms [18]. It had been reported that C has shown anti-cancer properties inducing apoptosis in several cancer cells, particularly in breast cancer cells.
Our data showed that CA had no cytotoxic effects on HeLa cells and that this compound exhibited antiproliferative activity in a dose-dependent manner. The IC50 value of cacalol acetate for HeLa cells was 102.72 μM, whereas for I3C it was 150 μM, suggesting the strong potential of CA as anticancer agent through cell growth inhibition. In breast cell cancer (MCF7 and MDA-MD231) and in a xenograft mouse model, cacalol inhibits cell growth without toxic effects and significantly suppress tumor growth when administered intraperitoneally or orally, suggesting its potential as a preventive and therapeutic agent against cancer [11]. Cacalol and its derivative, CA, have antioxidant activity due to their ability to act as potent free radical scavengers, contributing to their anti-cancer properties by reducing oxidative stress in cancer cells [12]. Moreover, this phytochemical compound inhibits the lipid peroxidation induced by free radicals [10].
HeLa cells treated with CA showed increased levels in the expression of caspase-3. In contrast, when cells were treated with I3C, the expression of this apoptotic biomarker was not observed, suggesting that CA induces apoptotic cell death via Cas-3, whereas I3C does not. These results are consistent with our previous report, in which we measured apoptosis by cytometry in I3C-treated HeLa cells and did not observe increased levels of apoptosis [8]. Our evidence suggested that the induction of apoptosis by CA is independent of Ahr. However, the molecular mechanism of CA is still unknown. Previous reports suggest that cacalol has an anti-breast cancer effect by inhibiting Fatty Acid Synthase (FAS) at transcriptional and post-transcriptional levels and modulating the Akt-SREBP (sterol regulatory element-binding protein) pathways. In this way, cacalol blocks P13K/Akt signaling resulting in a inhibition of SREBP1 which is the main transcriptional regulator of FAS [11]. Therefore, cacalol induces apoptosis in breast cancer cells by modulating the Akt-SREBP-FAS signaling pathway, leading to the activation of pro-apoptotic proteins DAPK2 and caspase 3 [11]. Furthermore, cacalol inhibits the FAS gene, essential in fatty acid biosynthesis and energy homeostasis, causing apoptosis through its antioxidant activity [19]. Intrinsic apoptosis is a cell death centered in the mitochondrion [20]. Activation of Bax and Bak (BCL-2 family members) resulted in mitochondrial outer membrane permeabilization (MOMP) and the releasing of proapoptotic proteins and cytochrome c from the inter-membrane mitochondrial space into the cytosol where cytochrome c bind to Apaf-1 forming apoptosome and activating caspase-9 which cleave and activate caspase-3 and -7 [21,22,23,24,25]. Therefore, CA induced apoptotic cell death though promoting that more cervical cancer cells expressed caspase-3. The biomarker of late stage of apoptosis (caspase-3) was not significantly up-regulated in HeLa cells treated with CA treatment. Previous reports indicated that the treatment of tumor cells with cacalol promote the expression of DAPK2 and caspase-3 [11]. Our results agree, showing that CA induces the expression of caspase-3, suggesting that the acetylation of cacalol might enhance the apoptotic induction mechanism of this compound. Although some evidence suggests that cacalol induces apoptosis through the mechanisms described above, the acetylated molecule (CA) might trigger apoptosis through a different pathway, which we are elucidating.
Furthermore, cacalol has synergistic activity that enhances the apoptotic effect of chemotherapeutic drugs such as taxol and cyclophosphamide, helping to overcome chemoresistance [11]. It is still unclear, if CA might have synergistic activity.
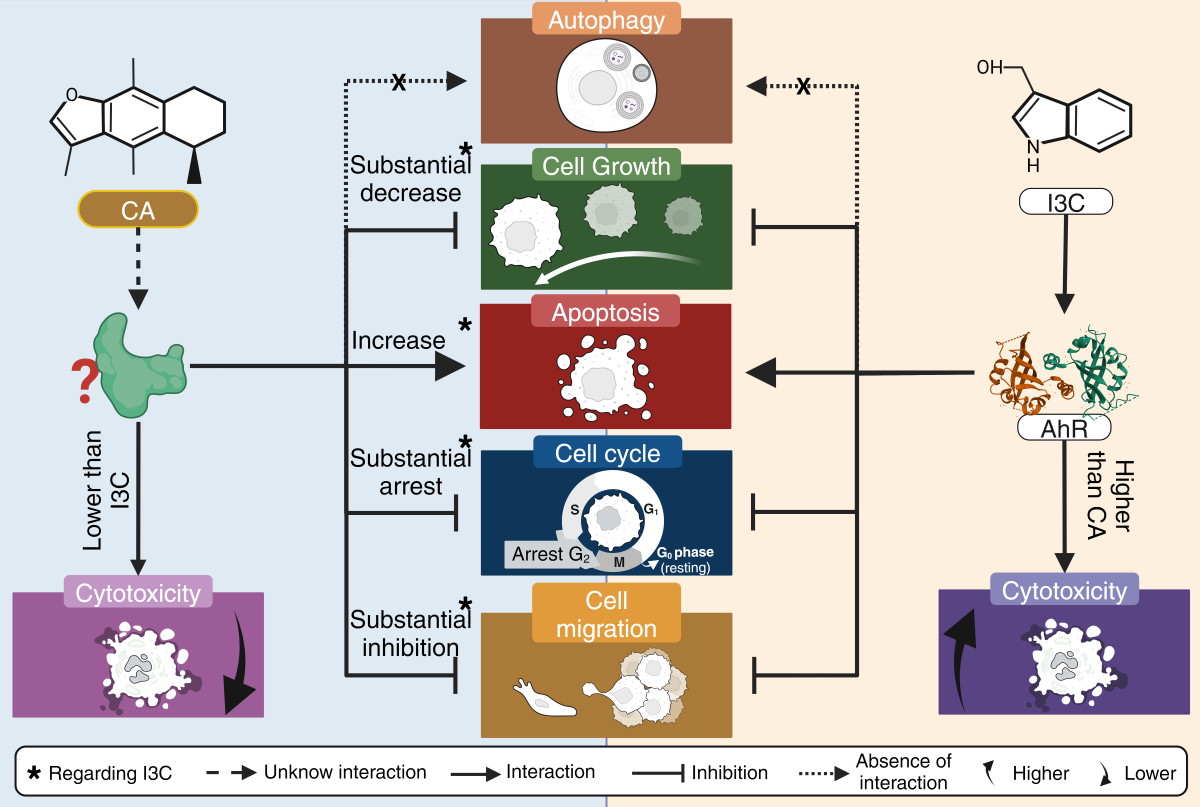
In addition, neither CA nor I3C induces autophagic cell death. CA arrest the cell cycle at G2 phase, while I3C does arrest cell cycle at this phase, albeit to a lesser extent. CA could inhibit cell migration and has a relatively low cytotoxicity, as it does not affect HeLa cell morphology as does BNF (1uM). It is worth mentioning that CA does not cause a morphological cytotoxic effect associated with its ability to inhibit cell migration (Figure 7).
5. Conclusions
CA had lower cytotoxic effect on HeLa cells than I3C. CA and I3C inhibited cell growth, but CA is more effective to inhibit cell proliferation than I3C. I3C did not affect the expression of Cas-3, suggesting that this compound did not induce apoptosis via Cas-3. In contrast, CA upregulated the expression of Cas-3, suggesting that CA induces apoptosis via Cas-3.CA and I3C did not induce the expression of p62 and LC3B levels, suggesting that these phytochemical compounds not induce autophagic cell death. CA arrests cell cycle and inhibits cell migration of HeLa cells at a higher rate than I3C. Although CA and I3C are promising anticancer agents for the treatment of cervical cancer, the low cytotoxicity of CA compared to I3C and the fact that CA induces apoptosis vía Cas-3, cell cycle arrest and inhibits cell proliferation and migration in a higher rate than I3C, make CA a more promising agent than I3C.
Author Contributions
Conceptualization, G.F.-G. and O.D.R.-H.; methodology, G.O.R.-A., A.I.C.-A., J.C.G.-A., E.F.A.-L., R.G.-A., and E.Y.V.-V.; validation, R.G.-A., E.Y.V.-V., H.C., M.G.D.-C. and G.L.-G.; formal analysis, L.I.Q.-G., and O.D.R.-H.; investigation, H.L.-M., L.S.-S., J.J.A.-S., M.J.-E., and O.D.R.-H.; resources, M.J.-E., G.F.-G. and O.D.R.H.; data curation, L.I.Q.-G., and O.D.R.-H.; writing—original draft preparation, L.I.Q.-G. and O.D.R.-H.; writing—review and editing, L.C.-C., M.G.D.-C., L.I.Q.-G., G.F.-G. and O.D.R.-H.; visualization, G.L.-G., H.C., and O.D.R.-H.; supervision G.F.-G. and O.D.R.-H.; project administration, G.F.-G. and O.D.R.-H.; funding acquisition, O.D.R.-H. All authors have read and agreed to the published version of the manuscript.
Funding
This research was funded by PAPIIT (projects IA208422 and IA206724 awarded to G.F.-G. and projects IN222321 and IN221824 awarded to O.D.R.-H.). E.Y.V.-V is a recipient of a postdoctoral fellowship from Dirección General de Asuntos del Personal Académico (DGAPA), from Universidad Nacional Autónoma de Mexico (UNAM).
Institutional Review Board Statement
Not applicable.
Informed Consent Statement
Not applicable.
Data Availability Statement
The original contributions presented in the study are included in the article/supplementary material, further inquiries can be directed to the corresponding author/s.
Conflicts of Interest
The authors declare no conflicts of interest.
References
- Cancer, I.A.f.R.o.; Organization, W.H. Estimated cancer incidence, mortality and prevalence worldwide in 2018. Cervical Cancer Fact Sheet 2018.
- Small Jr, W.; Bacon, M.A.; Bajaj, A.; Chuang, L.T.; Fisher, B.J.; Harkenrider, M.M.; Jhingran, A.; Kitchener, H.C.; Mileshkin, L.R.; Viswanathan, A.N. Cervical cancer: a global health crisis. Cancer 2017, 123, 2404–2412. [Google Scholar] [CrossRef] [PubMed]
- Parkin, D.M.; Almonte, M.; Bruni, L.; Clifford, G.; Curado, M.-P.; Pineros, M. Burden and trends of type-specific human papillomavirus infections and related diseases in the Latin America and Caribbean region. Vaccine 2008, 26, L1–L15. [Google Scholar] [CrossRef] [PubMed]
- Organization, W.H. Human papillomavirus (HPV) and cervical cancer. Available online: http://www.who.int/mediacentre/factsheets/fs380/en/ (accessed on 10 June 2023).
- Bosch, F.X.; De Sanjosé, S. Human papilloma virus and cervical cancer-burden and assessment of causality. J Natl Cancer Inst Monogr 2003, 31, 3–13. [Google Scholar] [CrossRef] [PubMed]
- Lopez, M.S.; Baker, E.S.; Maza, M.; Fontes-Cintra, G.; Lopez, A.; Carvajal, J.M.; Nozar, F.; Fiol, V.; Schmeler, K.M. Cervical cancer prevention and treatment in Latin America. Journal of surgical oncology 2017, 115, 615–618. [Google Scholar] [CrossRef] [PubMed]
- Enger, E.; Ross, F.C.; Bailey, D.B. Concepts in Biology, 12th ed.; McGraw-Hill: New York, NY, USA, 2007. [Google Scholar]
- Arellano-Gutiérrez, C.V.; Quintas-Granados, L.I.; Cortés, H.; González del Carmen, M.; Leyva-Gómez, G.; Bustamante-Montes, L.P.; Rodríguez-Morales, M.; López-Reyes, I.; Padilla-Mendoza, J.R.; Rodríguez-Páez, L. Indole-3-Carbinol, a phytochemical aryl hydrocarbon receptor-ligand, induces the mRNA overexpression of UBE2L3 and cell proliferation arrest. Current Issues in Molecular Biology 2022, 44, 2054–2068. [Google Scholar] [CrossRef] [PubMed]
- Jimenez-Estrada, M.; Chilpa, R.R.; Apan, T.R.; Lledias, F.; Hansberg, W.; Arrieta, D.; Aguilar, F.A. Anti-inflammatory activity of cacalol and cacalone sesquiterpenes isolated from Psacalium decompositum. Journal of ethnopharmacology 2006, 105, 34–38. [Google Scholar] [CrossRef] [PubMed]
- Shindo, K.; Kimura, M.; Iga, M. Potent antioxidative activity of cacalol, a sesquiterpene contained in Cacalia delphiniifolia Sleb et Zucc. Bioscience, biotechnology, and biochemistry 2004, 68, 1393–1394. [Google Scholar] [CrossRef] [PubMed]
- Liu, W.; Furuta, E.; Shindo, K.; Watabe, M.; Xing, F.; Pandey, P.R.; Okuda, H.; Pai, S.K.; Murphy, L.L.; Cao, D. Cacalol, a natural sesquiterpene, induces apoptosis in breast cancer cells by modulating Akt-SREBP-FAS signaling pathway. Breast cancer research and treatment 2011, 128, 57–68. [Google Scholar] [CrossRef] [PubMed]
- Gómez-Vidales, V.; Granados-Oliveros, G.; Nieto-Camacho, A.; Reyes-Solís, M.; Jiménez-Estrada, M. Cacalol and cacalol acetate as photoproducers of singlet oxygen and as free radical scavengers, evaluated by EPR spectroscopy and TBARS. RSC advances 2014, 4, 1371–1377. [Google Scholar] [CrossRef]
- Wang, C.; Xu, C.-X.; Bu, Y.; Bottum, K.M.; Tischkau, S.A. Beta-naphthoflavone (DB06732) mediates estrogen receptor-positive breast cancer cell cycle arrest through AhR-dependent regulation of PI3K/AKT and MAPK/ERK signaling. Carcinogenesis 2014, 35, 703–713. [Google Scholar] [CrossRef] [PubMed]
- Zidi, I.; Balaguer, P. Potential anti-cervical carcinoma drugs with agonist and antagonist AhR/PXR activities. Medical Research Archives 2016, 4. [Google Scholar]
- Kueng, W.; Silber, E.; Eppenberger, U. Quantification of cells cultured on 96-well plates. Analytical biochemistry 1989, 182, 16–19. [Google Scholar] [CrossRef] [PubMed]
- Hernández-Vázquez, J.M.V.; López-Muñoz, H.; Escobar-Sánchez, M.L.; Flores-Guzmán, F.; Weiss-Steider, B.; Hilario-Martínez, J.C.; Sandoval-Ramírez, J.; Fernández-Herrera, M.A.; Sánchez, L.S. Apoptotic, necrotic, and antiproliferative activity of diosgenin and diosgenin glycosides on cervical cancer cells. European Journal of Pharmacology 2020, 871, 172942. [Google Scholar] [CrossRef] [PubMed]
- Eldeeb, M.A.; Fahlman, R.P.; Esmaili, M.; Ragheb, M.A. Regulating apoptosis by degradation: the N-end rule-mediated regulation of apoptotic proteolytic fragments in mammalian cells. International journal of molecular sciences 2018, 19, 3414. [Google Scholar] [CrossRef] [PubMed]
- Ebrahimi, S.M.; Jafari, S.M. A Review of Potential Anti-Cancer Effect of Sesquiterpene Lactones in Breast Cancer. Jorjani Biomedicine Journal 2022, 10, 47–59. [Google Scholar]
- Liu, W.; Furuta, E.; Watabe, M.; Shindo, K.; Iiizumi, M.; Pai, S.; Watabe, K. Inhibition of Fatty acid synthase and induction of apoptosis in human breast cancer cells by Cacalia deliphiniifolia. Cancer Research 2008, 68, 629. [Google Scholar]
- Brentnall, M.; Rodriguez-Menocal, L.; De Guevara, R.L.; Cepero, E.; Boise, L.H. Caspase-9, caspase-3 and caspase-7 have distinct roles during intrinsic apoptosis. BMC cell biology 2013, 14, 1–9. [Google Scholar] [CrossRef] [PubMed]
- Wei, M.C.; Lindsten, T.; Mootha, V.K.; Weiler, S.; Gross, A.; Ashiya, M.; Thompson, C.B.; Korsmeyer, S.J. tBID, a membrane-targeted death ligand, oligomerizes BAK to release cytochrome c. Genes & development 2000, 14, 2060–2071. [Google Scholar]
- Eskes, R.; Desagher, S.; Antonsson, B.; Martinou, J.-C. Bid induces the oligomerization and insertion of Bax into the outer mitochondrial membrane. Molecular and cellular biology 2000, 20, 929–935. [Google Scholar] [CrossRef] [PubMed]
- Wei, M.C.; Zong, W.-X.; Cheng, E.H.-Y.; Lindsten, T.; Panoutsakopoulou, V.; Ross, A.J.; Roth, K.A.; MacGregor, G.R.; Thompson, C.B.; Korsmeyer, S.J. Proapoptotic BAX and BAK: a requisite gateway to mitochondrial dysfunction and death. Science 2001, 292, 727–730. [Google Scholar] [CrossRef] [PubMed]
- Li, P.; Nijhawan, D.; Budihardjo, I.; Srinivasula, S.M.; Ahmad, M.; Alnemri, E.S.; Wang, X. Cytochrome c and dATP-dependent formation of Apaf-1/caspase-9 complex initiates an apoptotic protease cascade. cell 1997, 91, 479–489. [Google Scholar] [CrossRef] [PubMed]
- Srinivasula, S.M.; Ahmad, M.; Fernandes-Alnemri, T.; Alnemri, E.S. Autoactivation of procaspase-9 by Apaf-1-mediated oligomerization. Molecular cell 1998, 1, 949–957. [Google Scholar] [CrossRef] [PubMed]
Scheme 1.
Structure of C and CA. Adapted from Gómez-Vidales, and colleges [12].
Scheme 1.
Structure of C and CA. Adapted from Gómez-Vidales, and colleges [12].
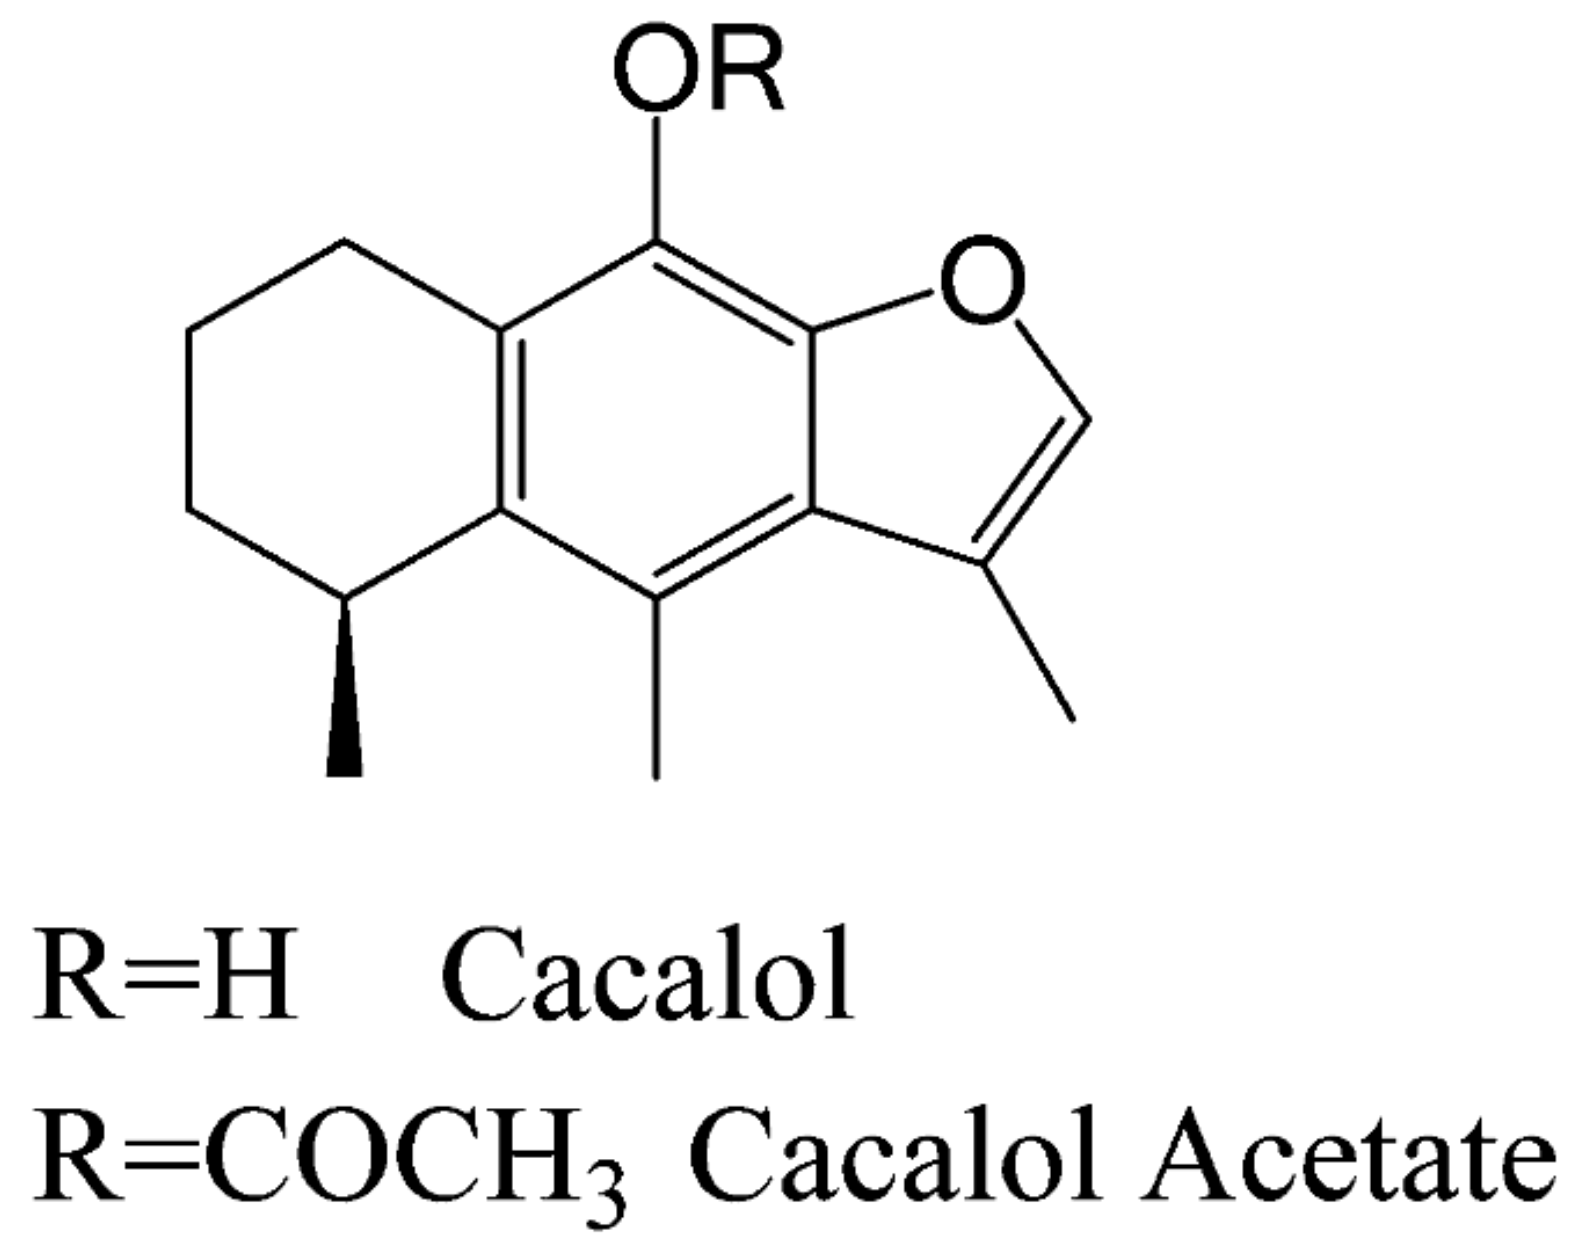
Figure 1.
Cytotoxicity effect of CA and I3C on HeLa cells. HeLa cells were treated with CA (102.72 μM), I3C (150 µM), DMSO (5 µg/ml, vehicle), BNF (1 µM), Triton X-100 (positive control) or untreated cells (control) were analyzed by LDH assay. Bars indicate the percentage of LDH activity in the presence of tested compounds. Experimental data shown the means ± standard error (SE) of three independent assays performed in triplicate. Statistically significant differences were calculated according to ANOVA test followed by Turkey test (p < 0.05).
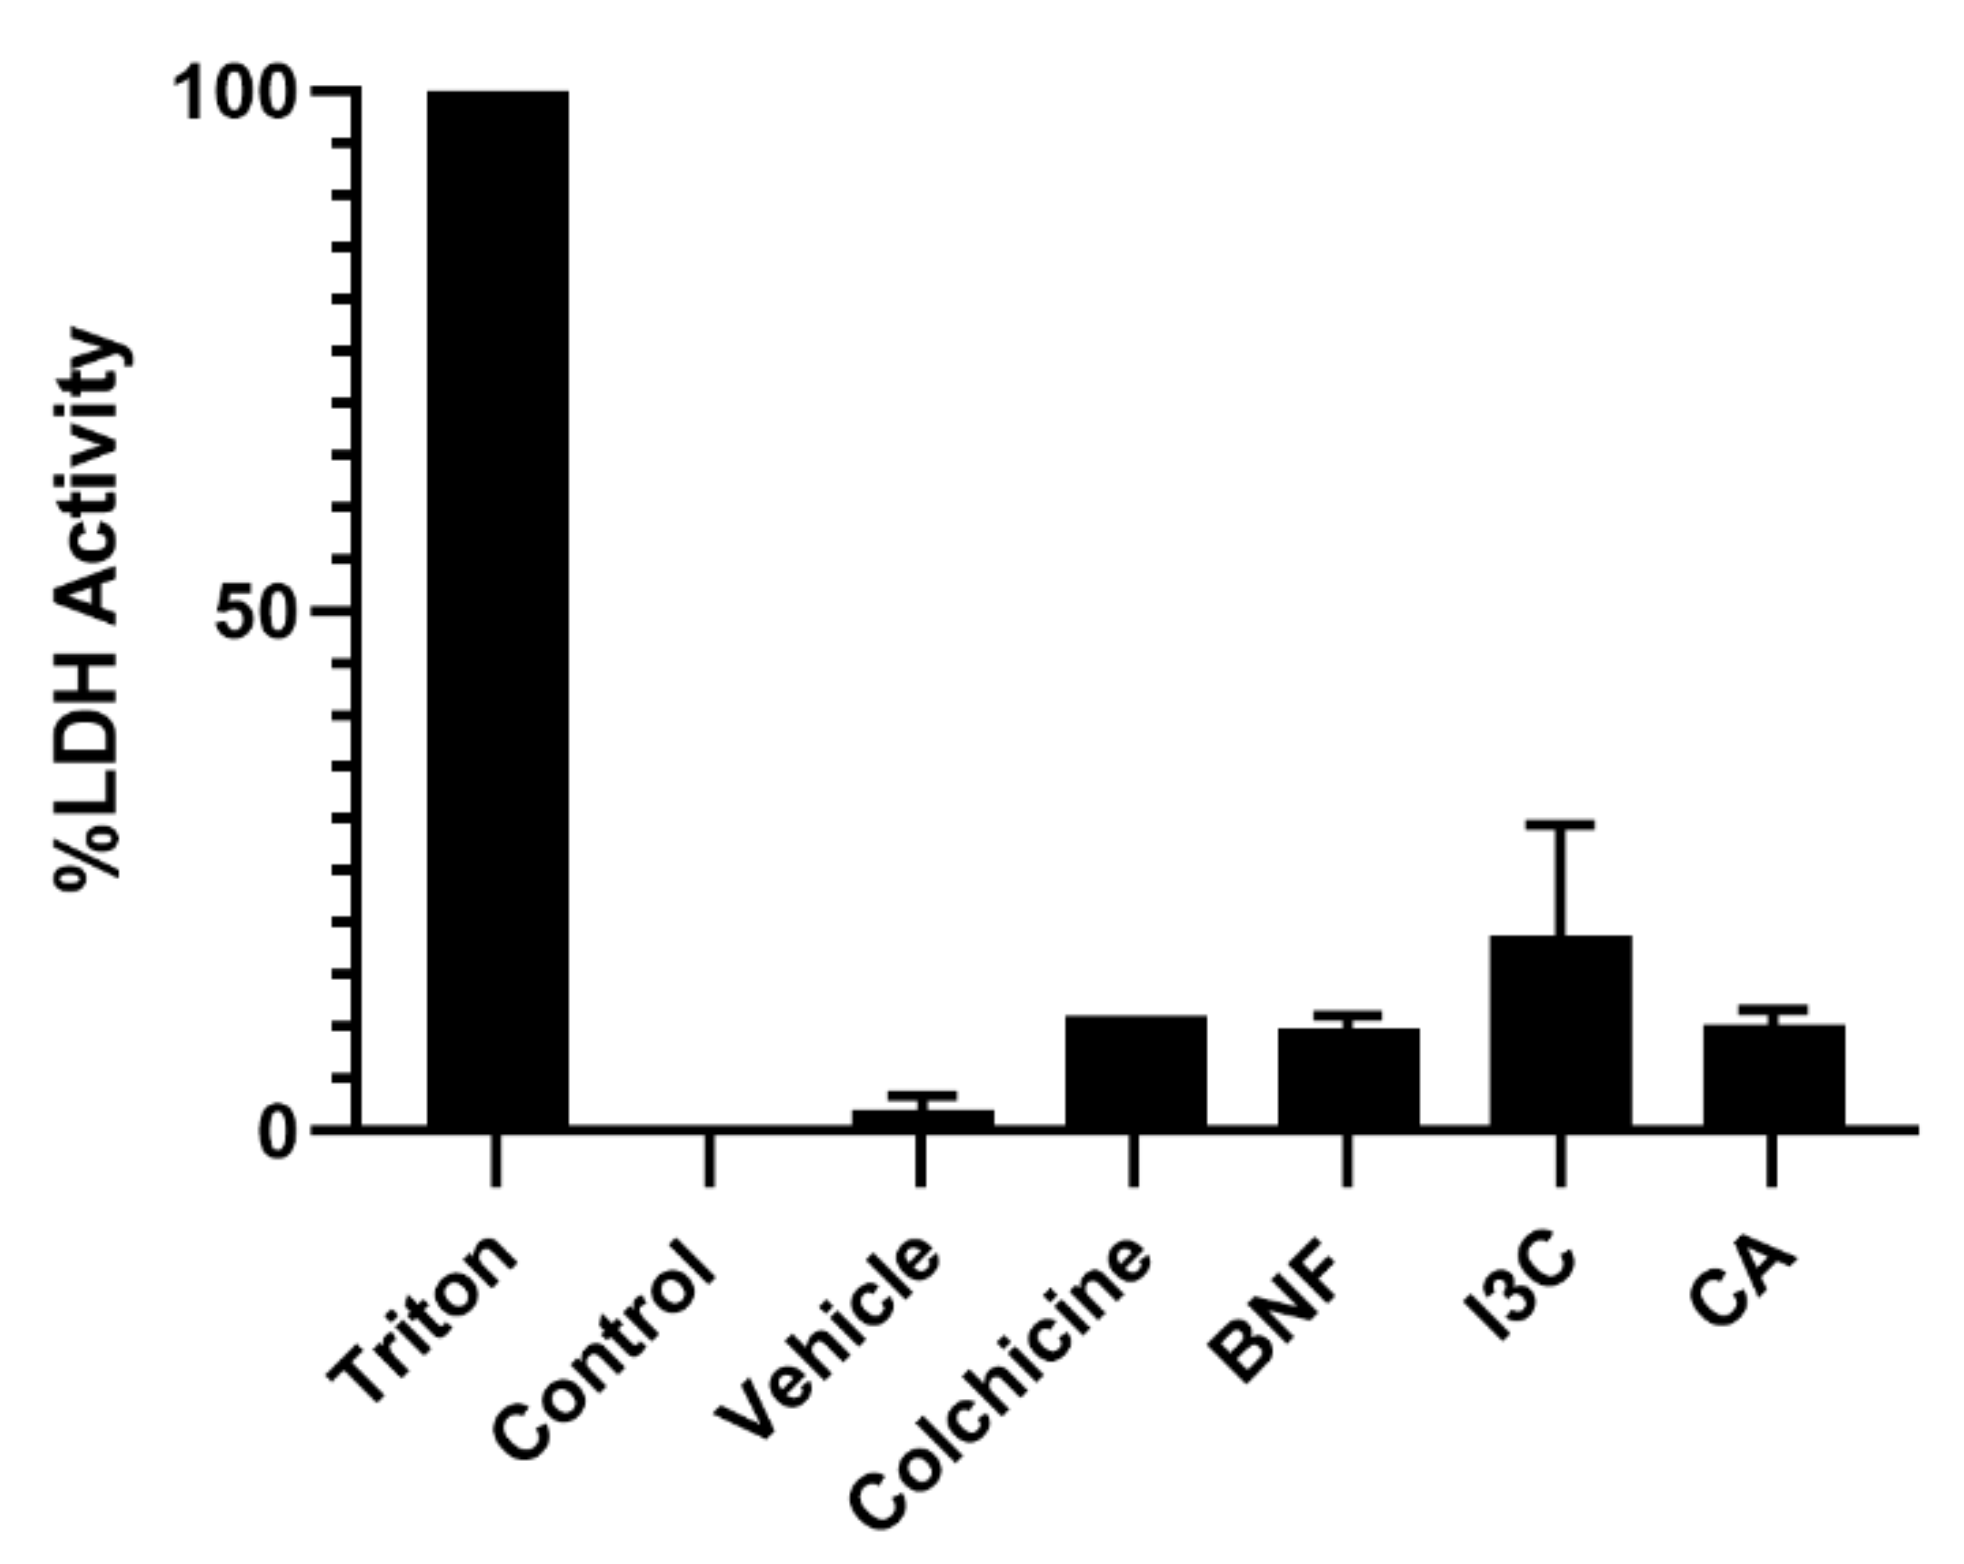
Figure 2.
Effect of CA and I3C over cell growth. HeLa cells were treated with CA (102.72 μM), I3C (150 µM), DMSO (5 µg/ml, vehicle), BNF (1 µM), colchicine (25.03 µM) or untreated cells (control) were analyzed by crystal violet staining. Bars indicate the cell growth percentage in the presence of tested compounds. Experimental data shown the means ± standard error (SE) of three independent antiproliferative assays performed in triplicate. Statistically significant differences were calculated according to ANOVA test followed by Turkey test (p < 0.05).
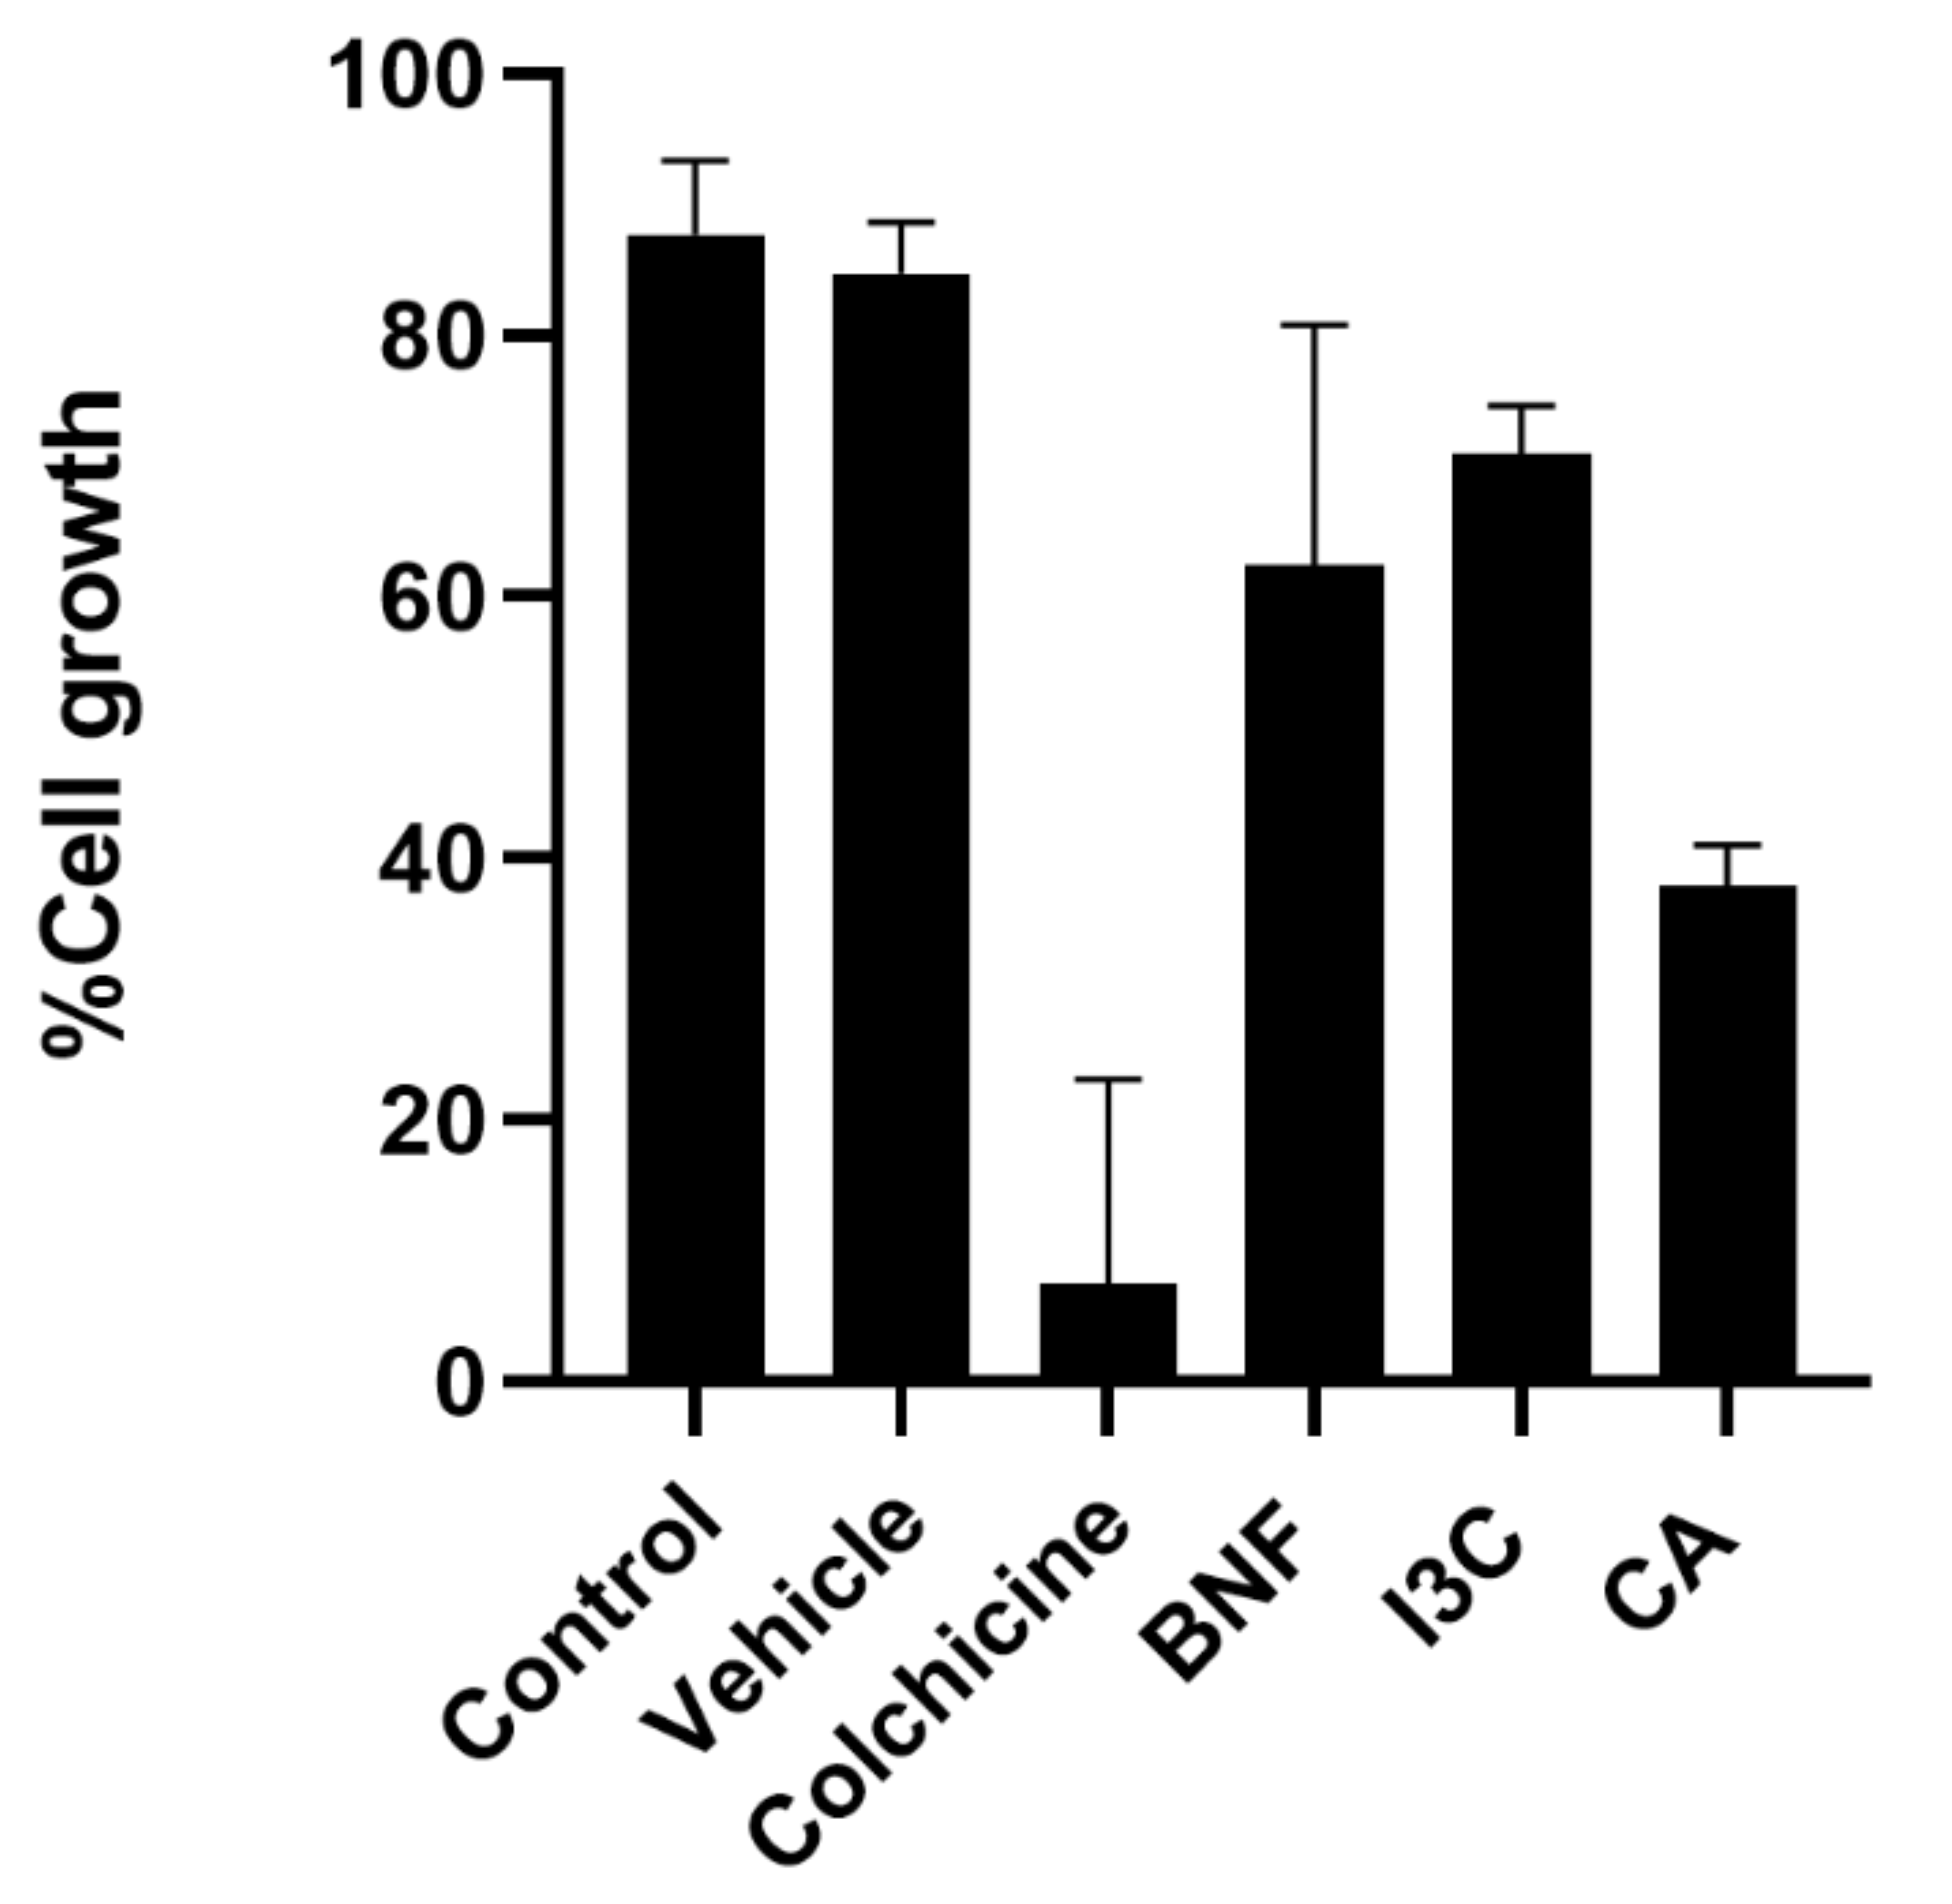
Figure 3.
Confocal microscopy of proapoptotic Cas-3 protein in HeLa cells. HeLa cells treated with CA (102.72 μM), I3C (150 µM), DMSO (5 µg/ml, vehicle), BNF (1 µM), and colchicine (25.03 µM) or untreated cells (control) were used to immunodetection of caspase-3 (green fluorescence) with DAPI-counterstained nuclei (blue fluorescence).
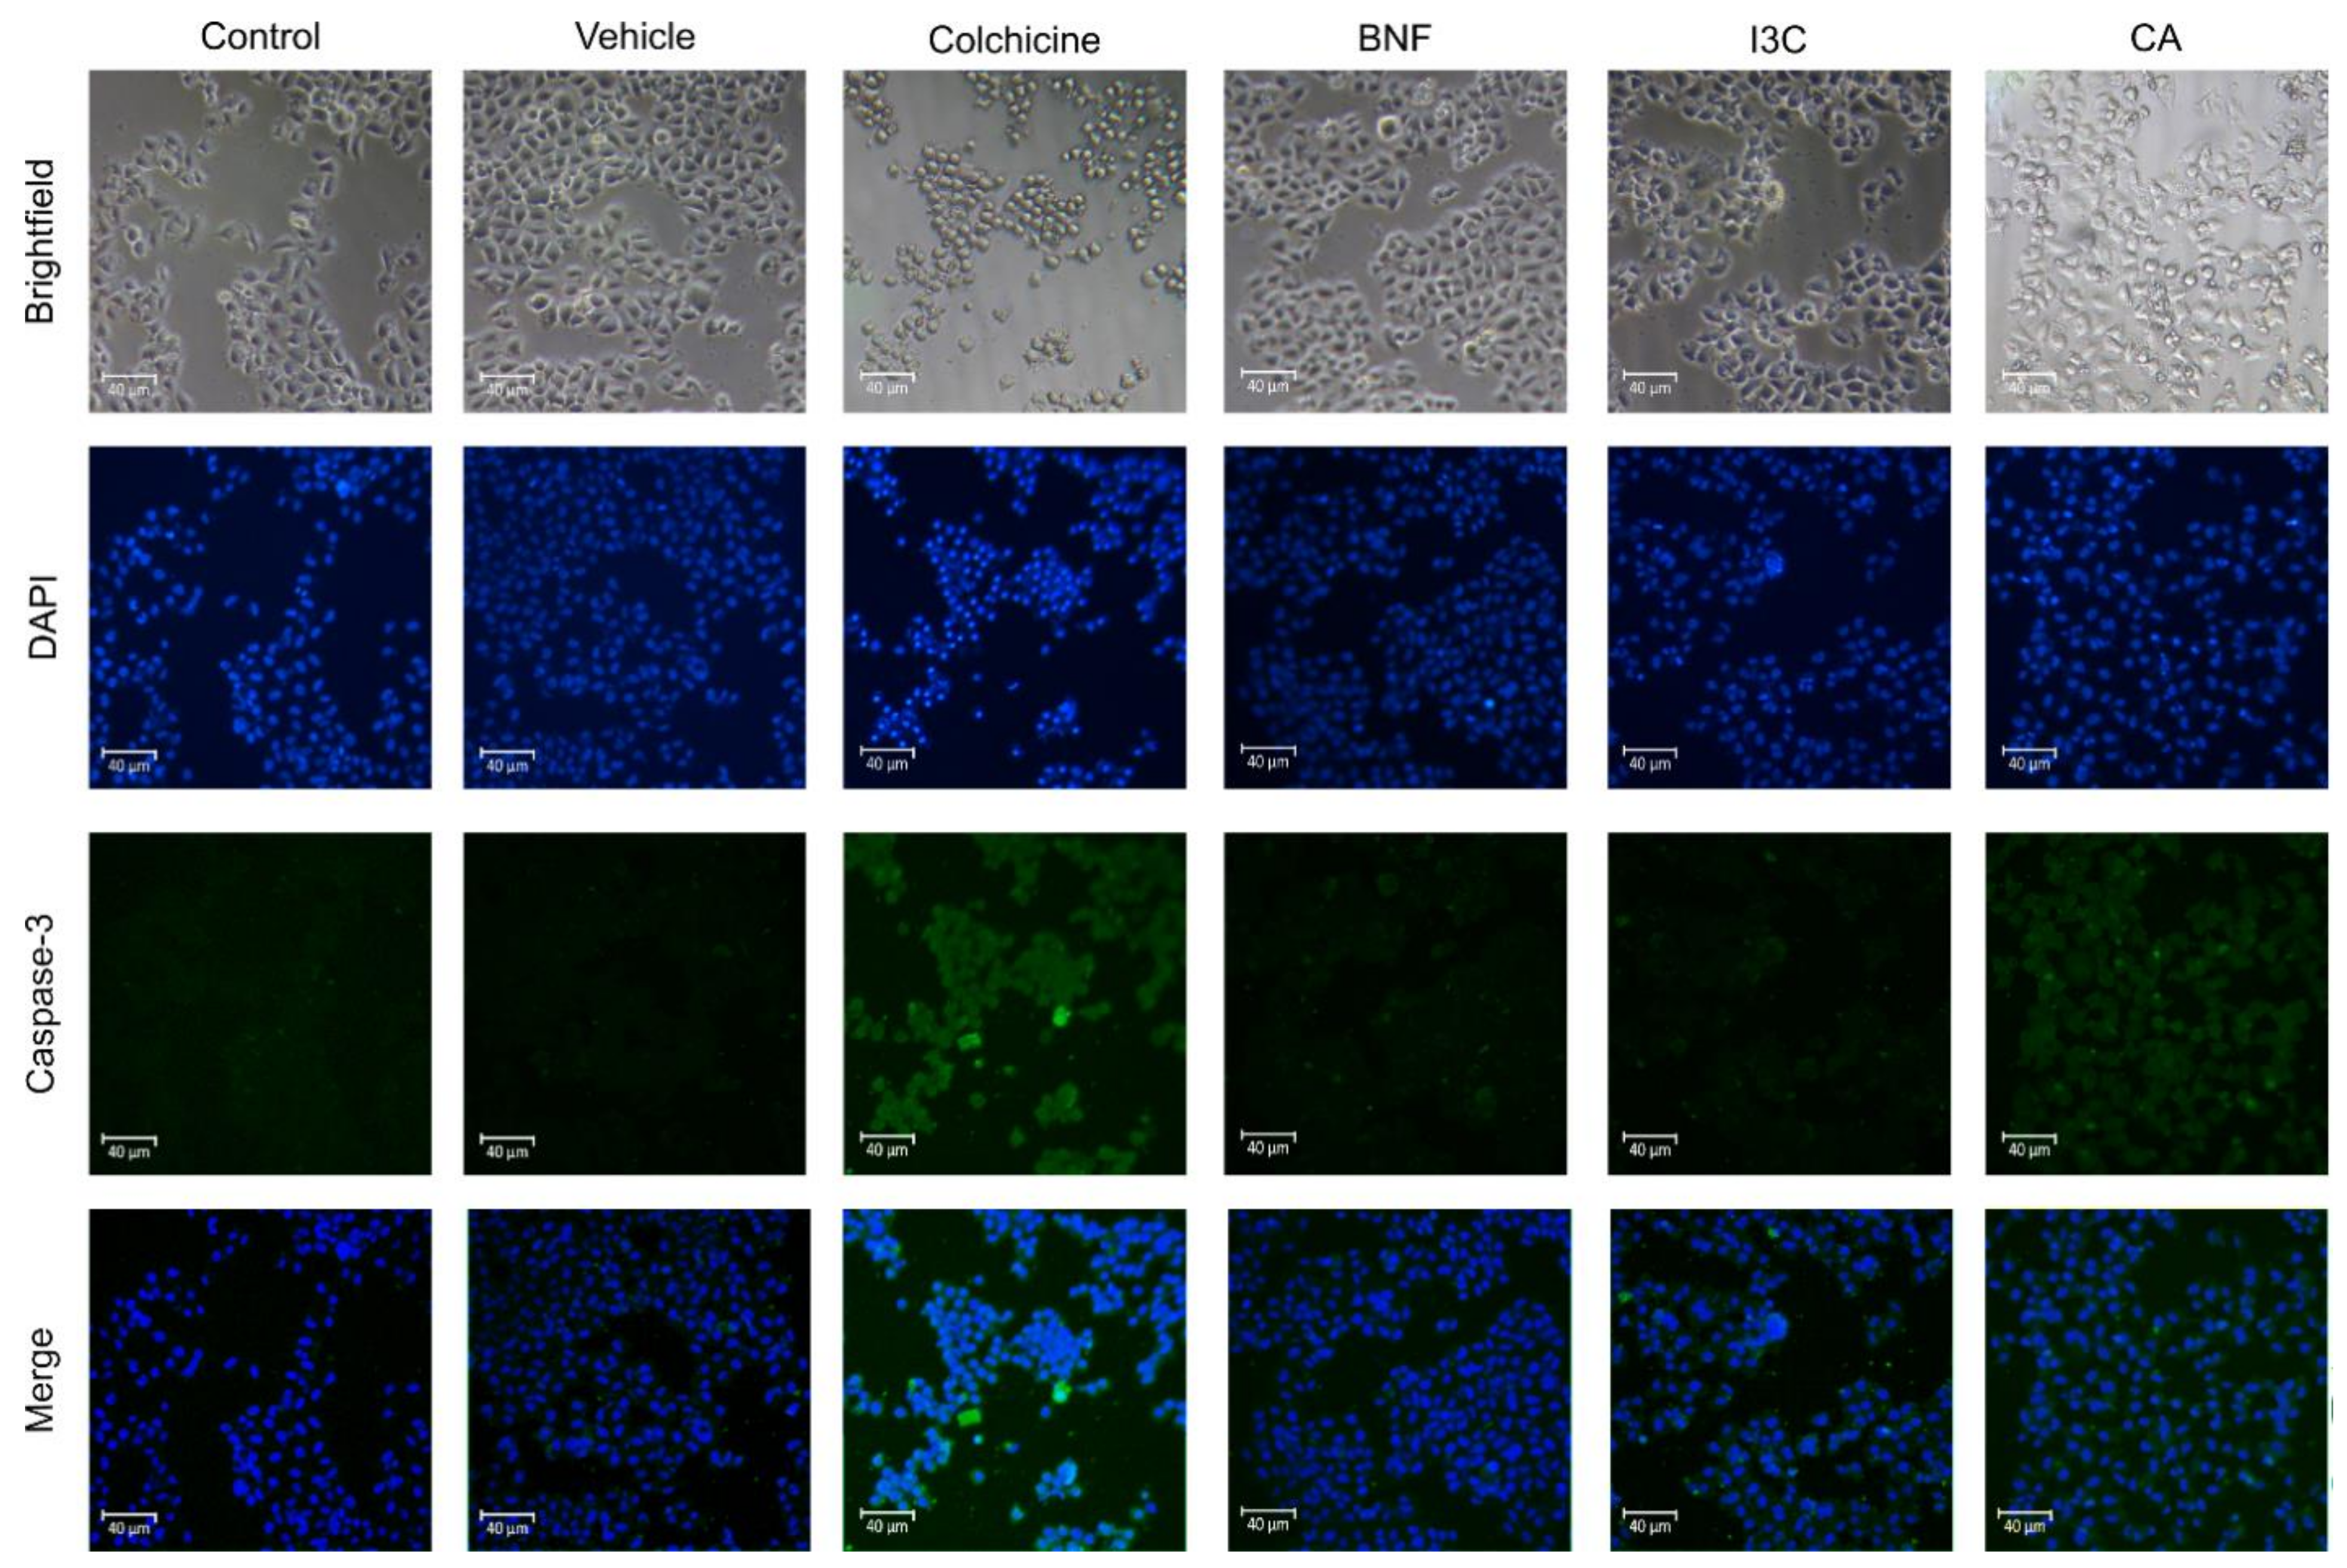
Figure 4.
Western blot analysis to determine LC3B and p62 proteins in HeLa cells. (a) HeLa cells treated with CA (102.72 μM), I3C (150 µM), DMSO (5 µg/ml, vehicle), BNF (1 µM), colchicine (25.03 µM) and untreated cells (control) were used to detect p62 (62 kDa), LC3B (15 kDa) and β-actin (42 kDa). (b) Protein expression levels of p62 and LC3B were normalized using β-actin expression (loading control). Bars indicate the mean levels of protein expression ± standard error (SE) of three independent antiproliferative assays performed in triplicate.
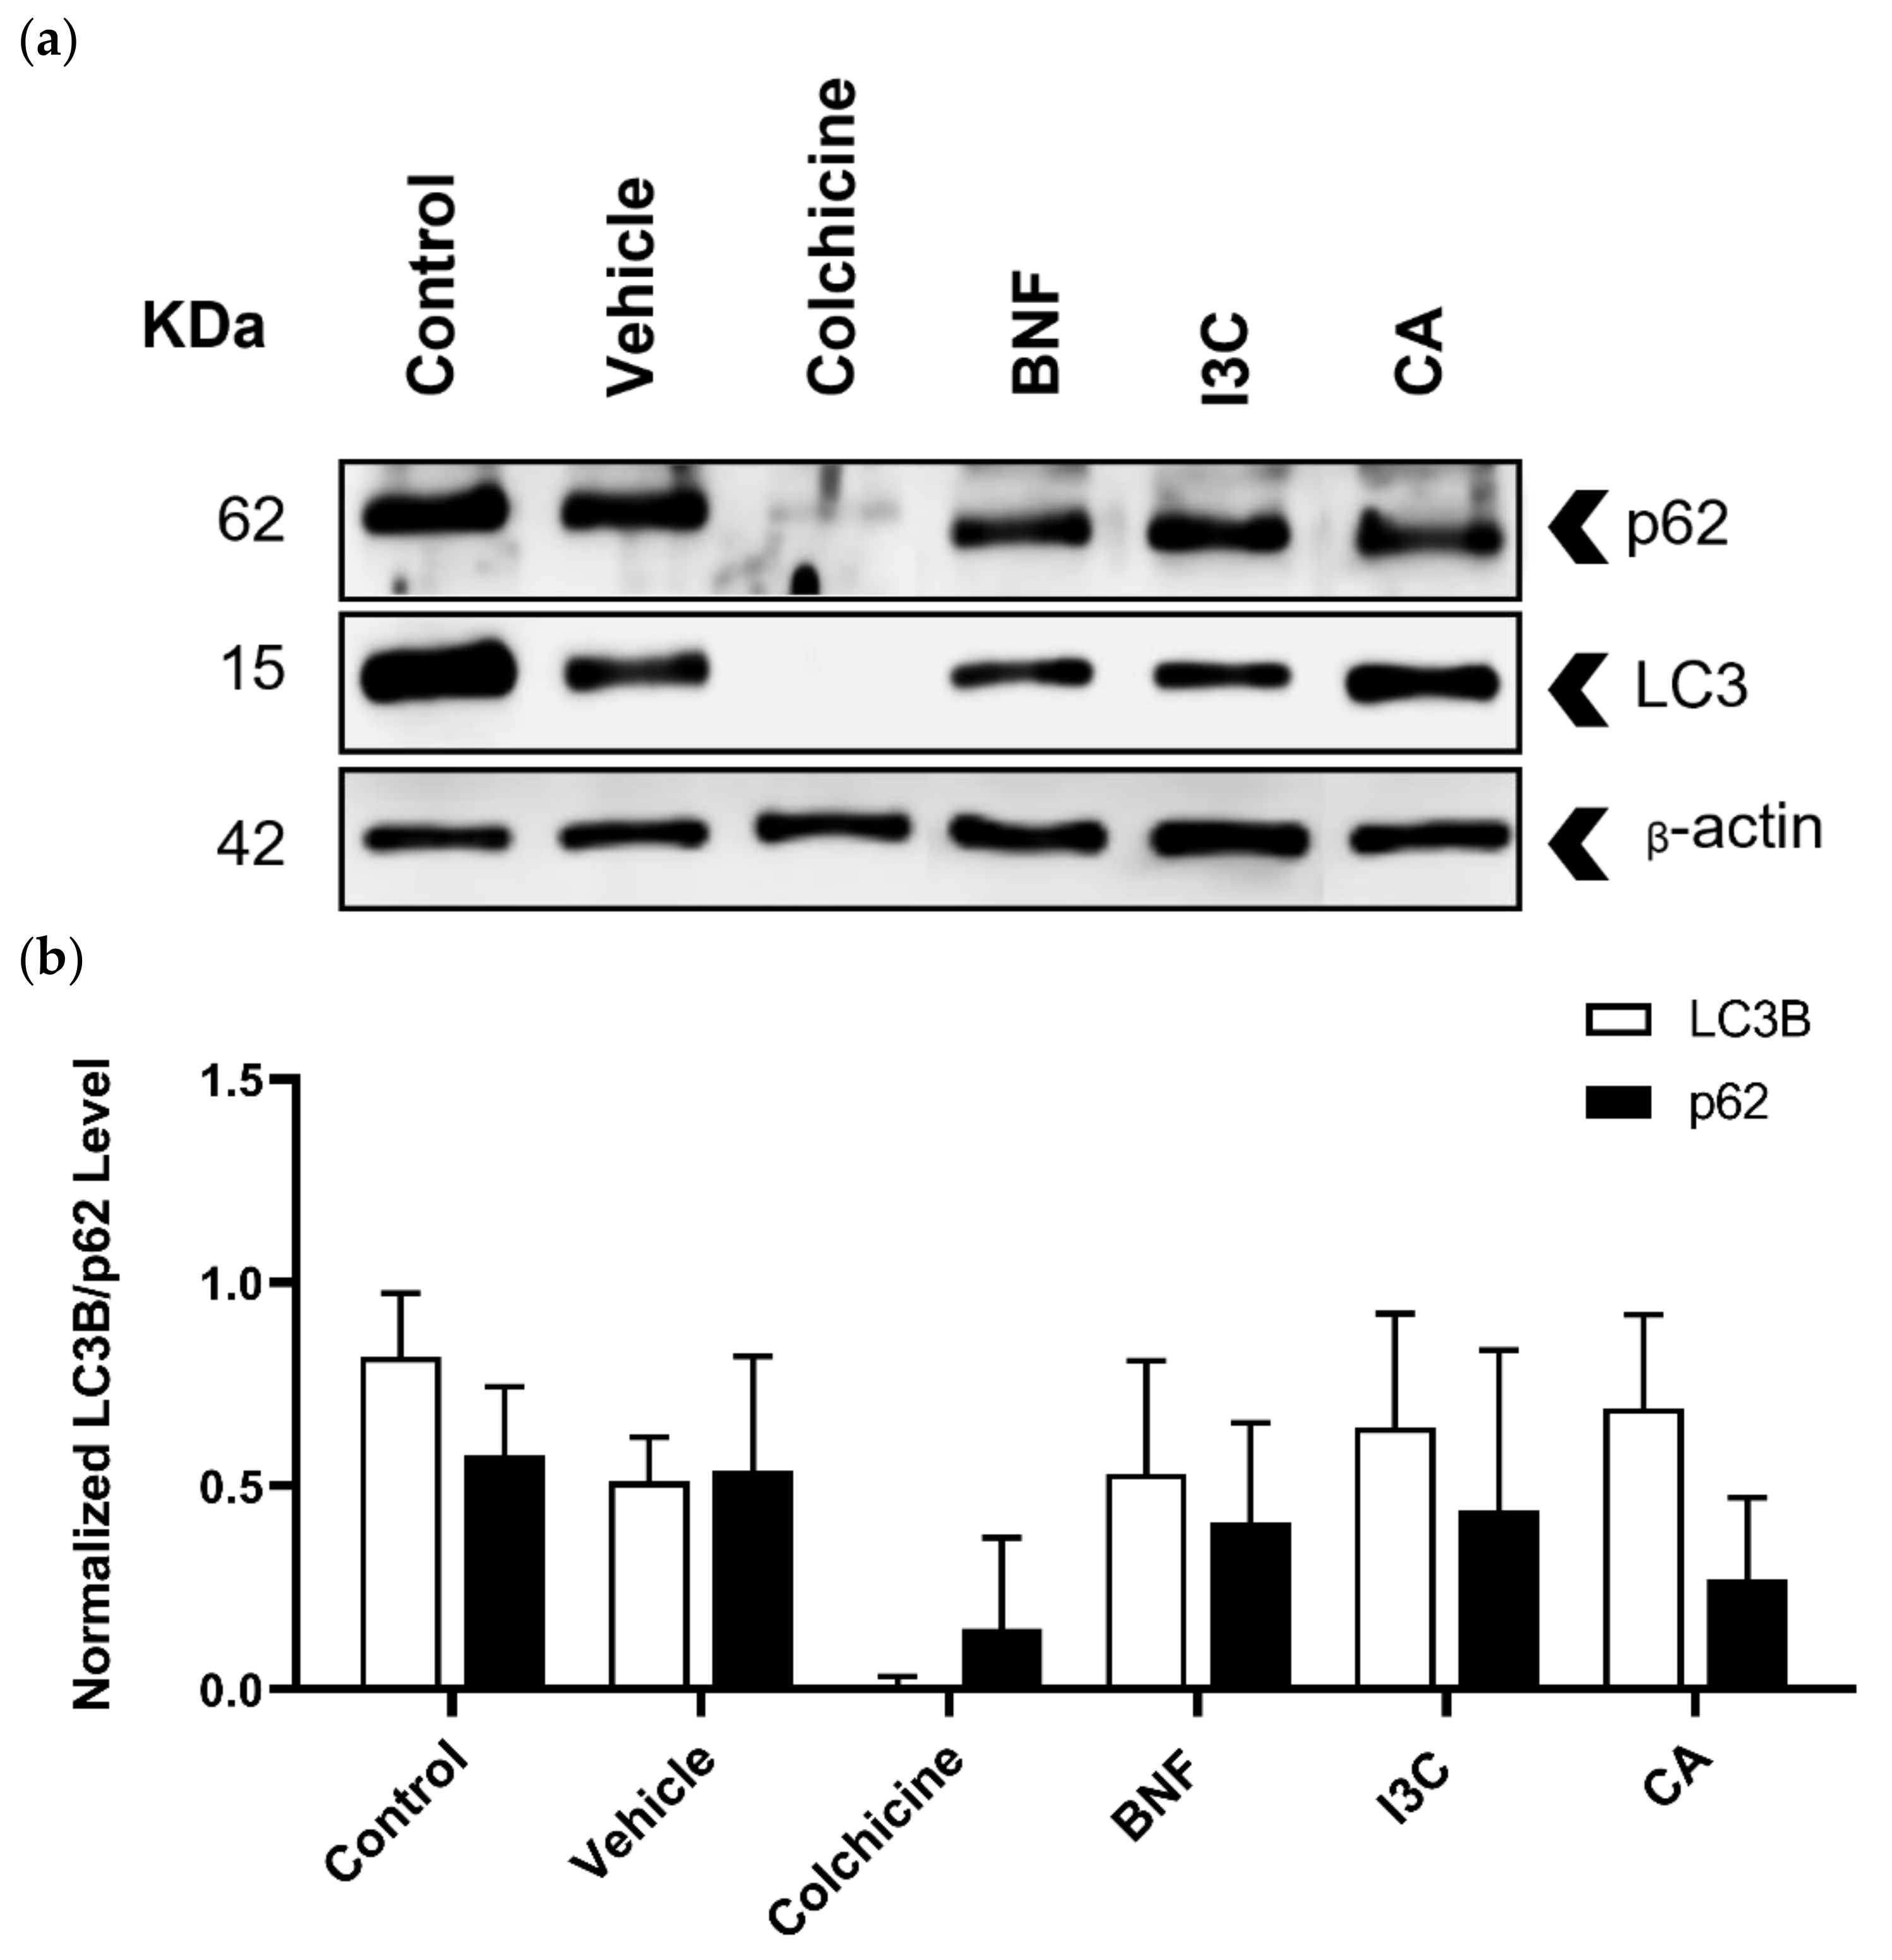
Figure 5.
Effect of CA and I3C over cell cycle arrest of HeLa cells. (a) Flow cytometry graphs depicting the cell cycle distribution of HeLa cells treated with CA (102.72 μM), I3C (150 µM), BNF (1 µM), and colchicine (25.03 µM). (b) The percentages of cells in the G1, S, and G2 phases of the cell cycle for treated HeLa cells.
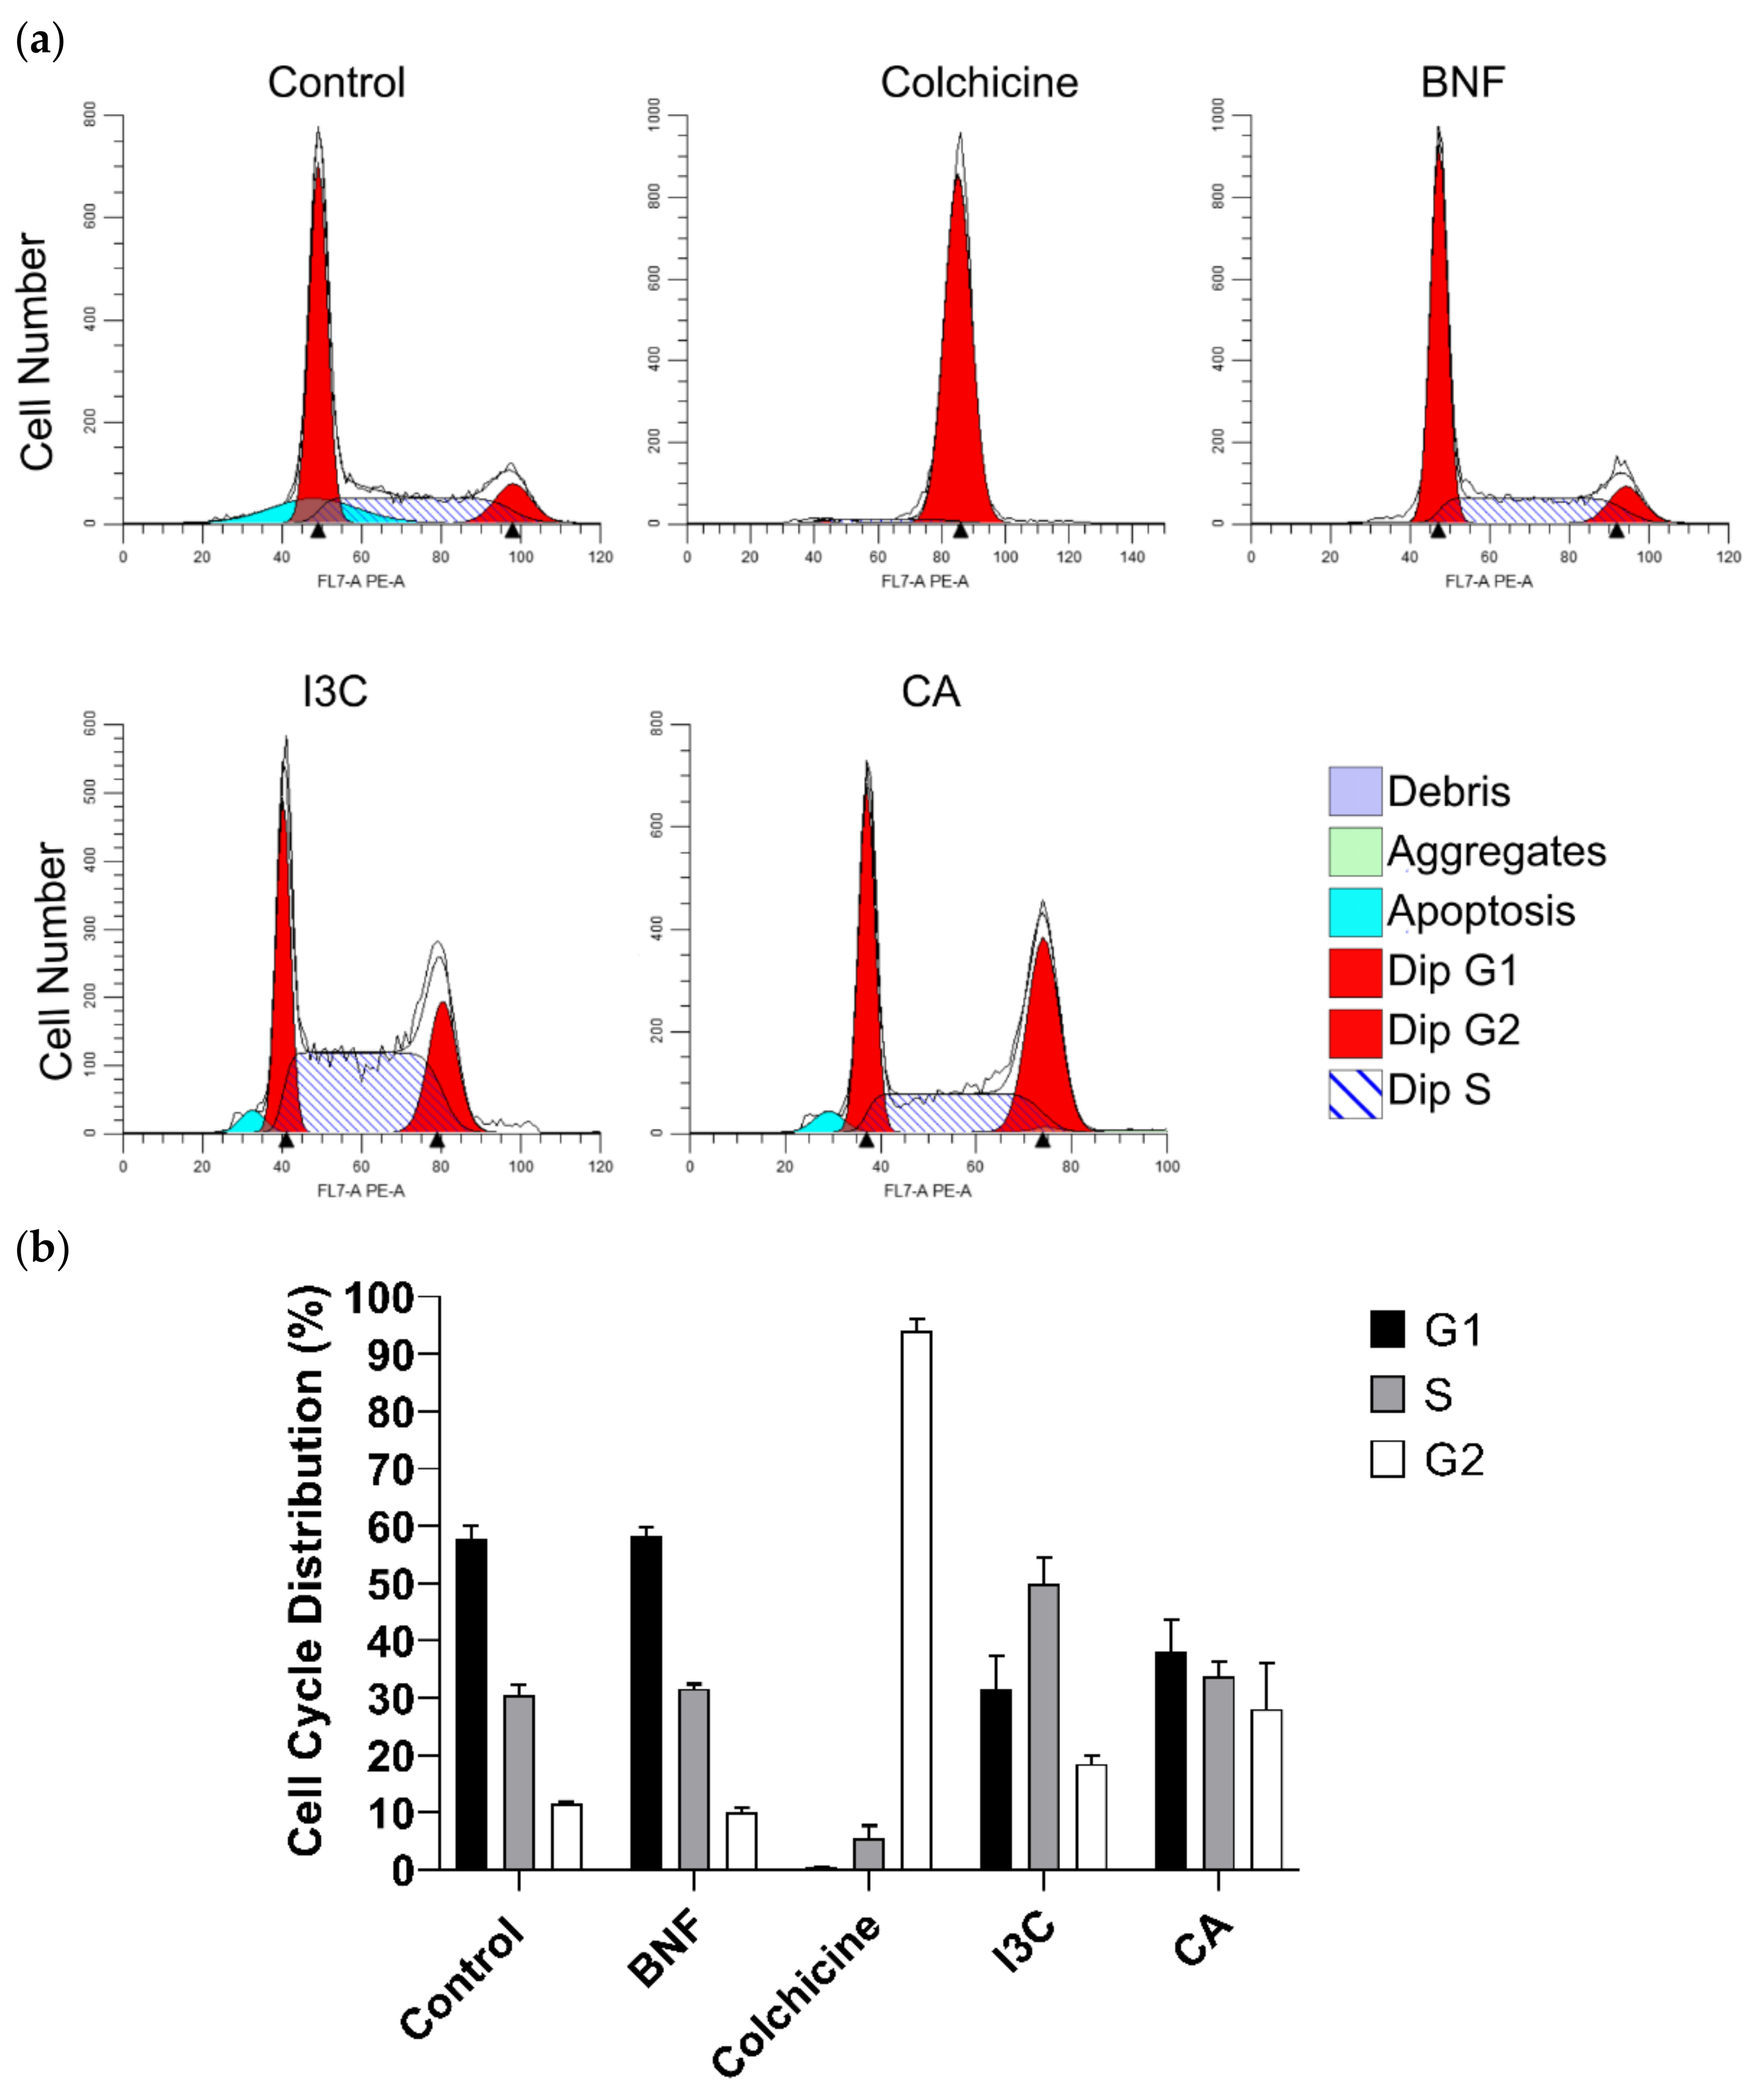
Figure 6.
Effect of CA and I3C over cell migration of HeLa cells. (a) HeLa cells were subjected to treatment with CA (102.72 μM), I3C (150 µM), DMSO (5 µg/ml, vehicle), BNF (1 µM), TGF-β (105 mM), colchicine (25.03 µM) and untreated cells (control). Microscopic images were captured at various time intervals, including 0 h, 24 h, 48 h, and 72 h, to visualize the wound closure. The migrating cell edges were delineated by lines. (b) Relative wound closure percentage was calculated for all experimental conditions. The lines represent the mean of three independent measurements, with the standard deviation indicated on each bar. Statistical analysis was conducted to compare the experimental conditions with the negative control (P < 0.05).
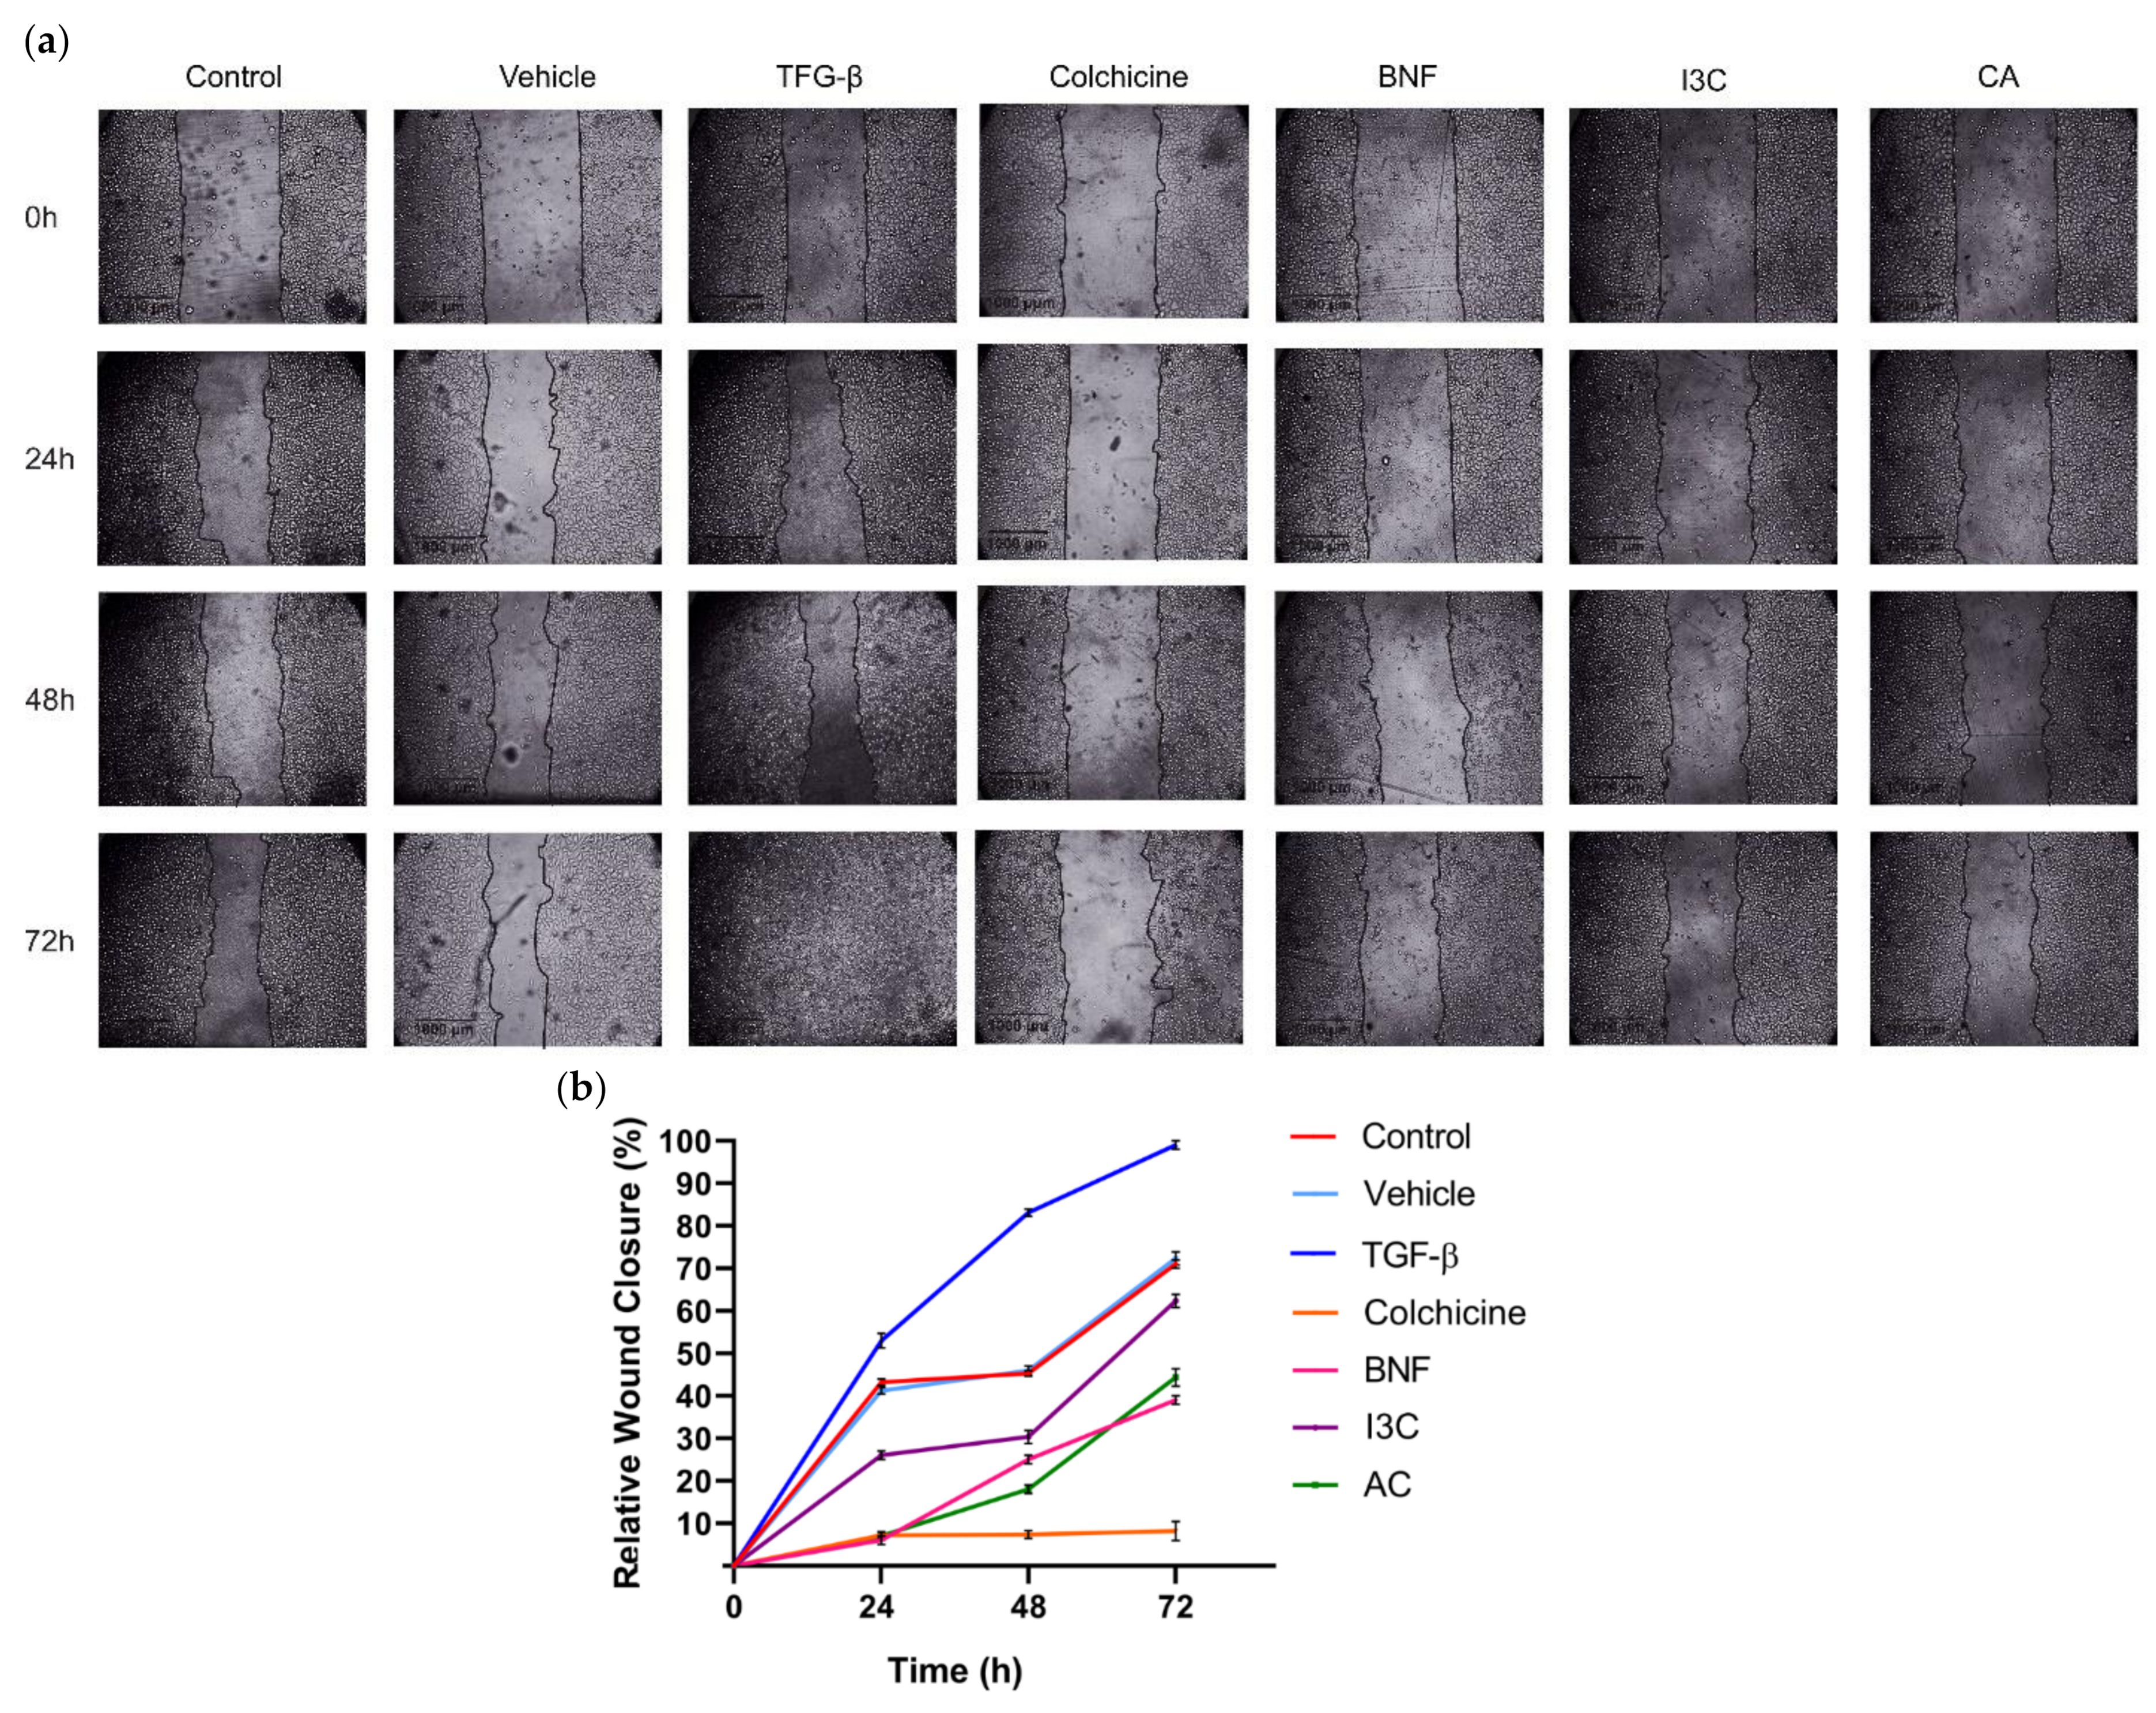
Figure 7.
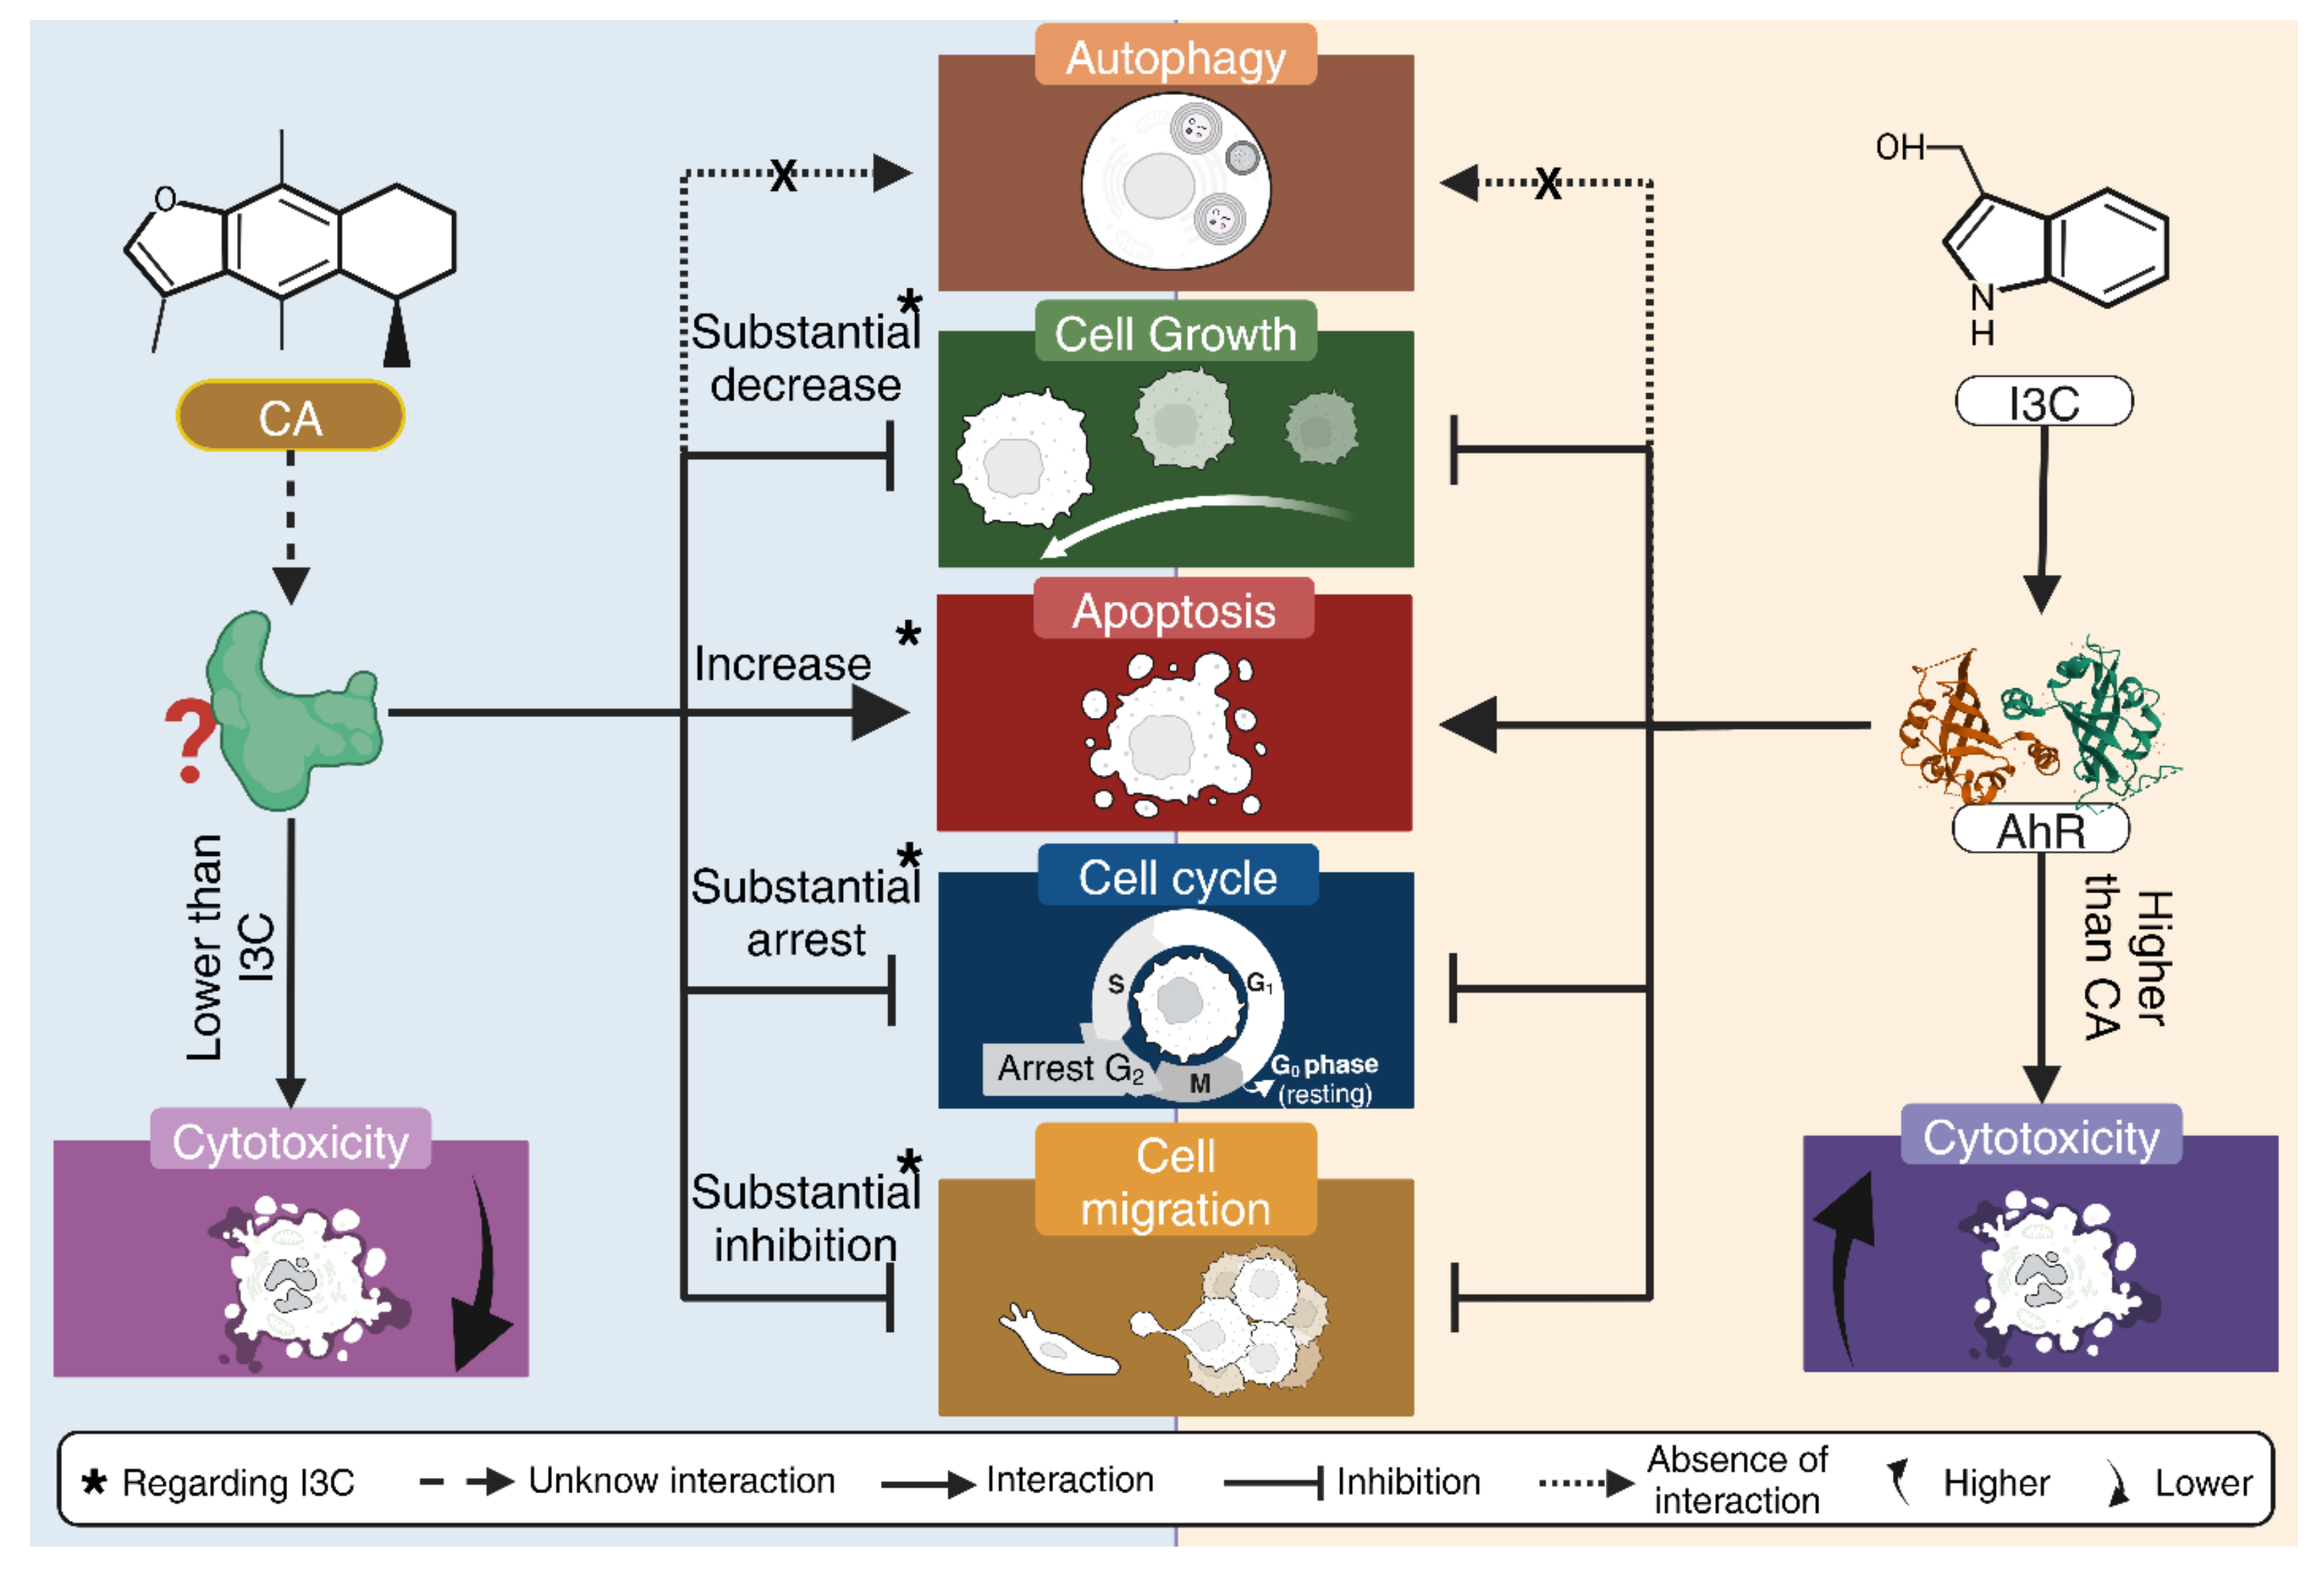
Summary of the anticancer activity of CA and I3C on HeLa cells. CA induces a substantial decrease in cell growth in comparison to I3C and CA substantially inhibits cell migration in comparison to I3C. CA induces apoptosis and arrest cell cycle in a higher rate than I3C. CA and I3C did not induce autophagy.
Figure 7.
Summary of the anticancer activity of CA and I3C on HeLa cells. CA induces a substantial decrease in cell growth in comparison to I3C and CA substantially inhibits cell migration in comparison to I3C. CA induces apoptosis and arrest cell cycle in a higher rate than I3C. CA and I3C did not induce autophagy.
Disclaimer/Publisher’s Note: The statements, opinions and data contained in all publications are solely those of the individual author(s) and contributor(s) and not of MDPI and/or the editor(s). MDPI and/or the editor(s) disclaim responsibility for any injury to people or property resulting from any ideas, methods, instructions or products referred to in the content. |
© 2024 by the authors. Licensee MDPI, Basel, Switzerland. This article is an open access article distributed under the terms and conditions of the Creative Commons Attribution (CC BY) license (http://creativecommons.org/licenses/by/4.0/).
Copyright: This open access article is published under a Creative Commons CC BY 4.0 license, which permit the free download, distribution, and reuse, provided that the author and preprint are cited in any reuse.


