Submitted:
30 July 2024
Posted:
01 August 2024
You are already at the latest version
Abstract
Berberine (BER) is a natural alkaloid found in various Berberis species, used traditionally in herbal medicine and dietary supplements. BER exhibited various biological activities, including anti-inflammatory, antioxidant, antidiabetic, and anti-tumour properties by modulating cellular pathways and influencing gene expression. While BER shows promise in various health applications, its possible toxicity raises concerns. In 2023, EFSA issued a call for data on BER- and protoberberine (PROTBER)-containing products, to comprehensively assess its safety and potential health claims. With these premises, new data was collected by assessing: i) the phytochemical profile of BER- and PROTBER-containing preparations by newly developed HPLC-DAD method; ii) in silico and in vitro investigation of pharmacokinetics properties of BER; iii) in vitro cytotoxicity in different human cell lines and, iv) biological and molecular activities of extracts containing BER and PROTBER in in vitro human non-cancer cells. By testing 16 commercial Berberis extracts, the evidence collected showed a good qualitative reliability in terms of phytochemical profile and limited relapses on cytotoxicity even at 200 µg/ml after a 24h of exposure, while evidencing a good cellular bioavailability and cell migration inhibition. The potential for plant-drug interactions affecting CYP450 proved to be minimal. Overall, our work provides a useful overview to better elucidate potential concerns on botanicals containing BER and minor PROTBER commonly used in food supplement.
Keywords:
berberine
; safety
; bioavailability
; cell viability
; gene expression
1. Introduction
Berberine (BER) is an isoquinoline alkaloid belonging to the category of protoberberines, including berberrubine, thalifendine, demethyleneberberine, coptisine, jatrorrhizine, columbamine, palmatine, and epiberberine. These compounds share a common molecular moiety, characterized by an aromatic quaternary ammonium nitrogen, a bright yellow colour, and a good water solubility[1]. BER is a characteristic active ingredient of several plant species with a well-established use in traditional Asian medicine, such as those in Berberis, Coptis, Phellodendron, Corydalis, Xanthorhiza genera or Tinospora sinensis (Lour.) Merr., Coscininium fenestratum (Goetgh.) Colebr., but it also occurs in medicinal species known in American and European Western medicine, such as Hydrastis canadensis L. or Chelidonium majus L., Papaver spp., in Siberia (Thalictrum flavum L.), in Africa (Jateorhiza palmata (Lam.) Miers and Annickia chlorantha (Oliv.) Setten & Maas) [2]. In crude extracts, other compounds may contribute to the biological activity of the BER phytocomplex, in particular the alkaloids chemically related to BER, such as protoberberinoid derivatives (PROTBER) [3].
To date, in the European Union (EU), an official monograph on the medicinal use of these species has not been produced by the European Medicines Agency (EMA), while a Berberis aristata stem monograph was added to the European Pharmacopoeia in 2022, being the most commonly used BER-containing plant used in food supplements [4,5].
BER and BER-containing herbal preparations from B. aristata have displayed a plethora of biological effects, as witnessed by numerous clinical trials. High-quality meta-analysis [3] report that most clinical trials concern cardiovascular system disorders (atherosclerosis and lipid profile) [5,6,7,8], inflammation [9,10], glycemia [11,12,13,14], gastrointestinal health [15,16], and cancer [17,18,19].Evidence indicates that BER shows beneficial properties in conditions of dysregulation or alteration of physiological processes, displaying various activities such as lipid and glycemic regulation, anti-inflammatory, antioxidant, anti-proliferative and gut microbiota modulation [20]. The biological activity of BER has been associated to multiple molecular mechanisms involving different cell signalling pathways; PKA, p38 MAPK, Wnt/β-catenin, AMPK, RANK/RANKL/OPG, PI3K/Akt, NFAT, NF-κB, Hedgehog, low density lipoprotein (LDL) receptors expression, reactive oxygen species (ROS) and nitric oxide (NO) production have been described as molecular targets of BER in different conditions regarding sugars and lipids metabolism, cardiovascular, gastrointestinal, musculoskeletal, and central nervous systems, cancer and inflammation [21,22,23,24,25,26].
Potential adverse events could be linked to the biological activity of BER and PROTBER, therefore the safety of BER, PROTBER and BER-containing herbal preparations has been carefully considered.
In terms of pharmacokinetics, BER and PROTBER show a different bioavailability: BER is a substrate for P-glycoprotein (P-gp) and less than 1% of oral dose was found to be bioavailable [27]; also, jatrorrhizine is a P-gp substrate and it showed a poor bioavailability [28,29]. Other PROTBER have a higher bioavailability, as demonstrated by in vivo studies for epiberberine [30], palmatine [31], berberubbine [32], coptisine and columbamine [33]. Despite the lack of proper knowledge on cellular bioavailability, it is well known that after intestinal absorption, BER and PROTBER are rapidly metabolized by hepatic CYP450 enzymes. Many studies primarily described BER metabolism reporting that CYP450 1A2, 3A4, 2D6, 2C9 isoforms are mainly involved [34], while few on others PROTBER and their interaction with different CYP450 isoforms, with the exception of jatrorrhizine, metabolized by CYP1A2 [35] and palmatine by CYP2D6 [36]. It is plausible that CYP1A2, CYP3A4 and CYP2D6 have a key role in metabolism of many PROTBER, thus drug-herbal products interactions should be considered when BER, PROTBER and BER-containing herbal preparations are used.
Given the complexity of the topic, the well-established and growing consumption of BER-containing herbal preparations, especially in food supplements, and given the need to fill some pivotal gaps in knowledge, in 2023 the European Food Safety Authority (EFSA) opened a “call for data” to get updates relevant to the safety evaluation of BER-containing herbal preparations used in food supplements [37].
Within this context, this study evaluated the chemical and pharmacokinetics aspects of cellular bioavailability and biological safety of berberine with a seven-step approach:
1) analysis of 16 different commercial raw BER-containing ingredients used in food supplements formulation and validation of a HPLC-DAD method to quantify BER and PROTBER;
2) in vitro/in silico evaluation of digestive stability, bioaccessibility and bioavailability of BER and PROTBER;
3) prediction of potential BER-related targets by bioinformatic analysis;
4) assessment of cytotoxicity in in vitro human intestinal, hepatic, gastric, and kidney cell lines and of the impact on human hepatic cell viability in the presence of CYP450 substrates;
5) evaluation of the effects on the cell migration ability of colorectal cancer cells;
6) investigation of potential oxidative stress in non-cancer kidney cells by the dosage of ROS;
7) evaluation of the transcriptional effects on the main target genes involved in regulation of cell cycle, cell growth, neoplastic transformation, and oncogenes.
2. Materials and Methods
2.1. Plant Material
Sixteen different extracts used as raw ingredients in Italy for food supplement preparations were selected from the international business-to-business market. According to their declared standardization, they were divided in two groups: eight B. aristata bark extracts had a declared content of BER 97% w/w dry basis (db) as BER hydrochloride , while the remnant had a declared content of BER 85% w/w db. Samples were kindly supplied by EHPM (Brussels, Belgium), Viatris (Monza-Brianza, Italy), Giellepi (Seregno, Monza-Brianza, Italy), Vivatis (Gallarate, Varese, Italy).
2.2. Phytochemical Analysis
Quantification of BER and PROTBER in examined extracts was determined by analytical technique and measured by calculating values as BER hydrochloride on the dry basis (db) of the extract (% w/w db). All samples were dissolved in ultra-pure water (1 mg/ml) and analyzed by using a HPLC-DAD Shimadzu Prominence LC 2030 3D instrument. A Bondpak® C18 column, 10 µm, 125 Å, 3.9 mm x 300 mm (Waters Corporation, Milford, MA), was used as a stationary phase. The mobile phase was composed of water with 0.1% v/v formic acid (A) and acetonitrile with 0.1% v/v formic acid (B). The following method was used: B from 45% at 0 min. and linear increase to 55% at 9 min., then 45% at 10 min., holding the same percentage until the end, 11 min. Flow rate was set at 0.900 ml//min.; column temperature was 30 °C. The chromatogram was recorded at 346 nm. BER hydrochloride (Merck KGaA, Darmstadt, Germany) (10-0.1 mg in column) was used to build the calibration curve. In herbal preparations, BER was identified and quantified by using the specific external standard, whereas other PROTBER were identified according to the literature and their UV-vis spectra [31]; PROTBER were quantified being expressed as BER hydrochloride.
Given the homogeneous phytochemical profile of the extracts, subsequent bioactivities were performed on two different B. aristata bark extracts with declared content of BER 97% w/w and two with B. aristata bark extracts with BER content 85% w/w, namely, A85, D85, A97, G97 (see table 3).
2.3. In Vitro Bioaccessibility Assessment of Berberine and Protoberberine Derivatives
The test was conducted according to Governa et al., 2022 [38] and to the validated INFOGEST protocol [39] with some modifications. In detail, 20 mg of each extract were added to 20 mL of simulated gastric juice, containing pepsin from porcine gastric mucosa (300 UI/ml, Merck KGaA, Darmstadt, Germany) and NaCl (10 mg/ml); the pH of the solution was adjusted to 1.7 using HCl. Samples were incubated for 2 h at 37 °C with shaking. Then, pancreatin from porcine pancreas (activity equivalent to 4x U.S.P., 10 mg/ml, Merck) and bile salts mixture (20 mg/ml, Merck KGaA, Darmstadt, Germany) were added, and the pH was increased to 7.0 by adding NaHCO3 (15 mg/ml, Merck KGaA, Darmstadt, Germany) to simulate the intestinal environment. Intestinal digestion was carried out for 2 h at 37 °C with shaking. Samples were then filtered and immediately used for further analysis, performed according to the HPLC-DAD method above described. The bioaccessibility rate of each compound was calculated as the % of its recovery after digestion, compared to the initial amount. Two independent experiments were performed.
2.4. In Silico Pharmacokinetic Analysis and Targets Prediction of Berberine and Protoberberine Derivatives
Computational analysis of pharmacokinetic characteristics of BER and PROTBER present in the most common food supplements marketed in EU was performed by SwissADME© web tool, a free platform created and developed by the Molecular Modeling Group of the SIB Swiss Institute of Bioinformatics. According to their chemical-physical characteristics, compound similarities and provided data, the trained algorithm estimates compounds for ADME (absorption, distribution, metabolism and excretion) properties, physic-chemistry, drug-likeness, pharmacokinetics and medicinal chemistry properties [40]. Targets prediction was performed by using GeneCards® suite, a web tool developed to obtain results with functionality and relevance scoring allowing to combine query terms and provides relevant literature which the match is based on [41]. In this work SwissTargetPrediction, another web tool of the SIB was used as well as SEA (Similarity Ensemble Approach). SEA predicts biological targets of a compound based on its resemblance to ligands annotated in reference databases and relates proteins due to their pharmacology by aggregating chemical similarity among entire sets of ligands; SEA also scores Tanimoto similarity calculations based on compound annotations derived from ChEMBL [42].
2.5. In Vitro Cell Culture and Treatment
Human colorectal (Caco-2), hepatic (HepG2), gastric (AGS), and kidney (HEK293) cell lines were cultured in DMEM supplemented with 10% fetal bovine serum (FBS), 1% glutamine and 1% penicillin/streptomycin antibiotics. Cells were maintained under a humidified atmosphere of 5% CO2, at 37 °C. Cells were treated with two representative samples based on the results obtained from chemical analysis: one B. aristata bark extract with BER (as berberine hydrochloride) 97% w/w (B97%) and one B. aristata bark extracts with BER content 85% w/w (B85%). The control group received phosphate-buffered saline (PBS). The treatments were carried out at various time points as indicated in each section for further analysis.
2.6. Cytotoxicity Assay of Extracts Containing Berberine and Protoberberine Derivatives
Caco-2, HepG2, HEK293 and AGS cells were seeded in 96-well plate and cultured for 24 h. Cells were treated with B97% and B85% extracts at 10, 20, 50, 100 and 200 mg/ml for 4 and 24 h. After the treatment, the medium was removed, and cells incubated with fresh medium in the presence of 10% v/v of CCK-8 (Cell Counting Kit, Merck KGaA, Darmstadt, Germany)[43]. The assay is based on the reduction of a water-soluble tetrazolium salt WST-8 operated by cell dehydrogenases that lead to formazan production, soluble and orange-colored; the absorbance of the formazan dye is measured at 450 nm with a microplate reader VICTOR® Nivo™3s (Perkin-Elmer, Waltham, Massachusetts, USA). Cell viability in treated groups was compared to untreated cells (control). Two independent tests were performed (n=8).
2.7. Cytotoxicity Assay of Extracts Containing Berberine and Protoberberine Derivatives in Presence of CYP450 Substrates
Hepatic HepG2 cells were seeded in 96-well plate and cultured for 24 h. Firstly, cell viability was tested for the CYP450 substrates, specifically phenacetin (CYP1A2), dextromethorphan (CYP2D6) and triazolam (CYP3A4) at the concentration of 0.1, 1, 10, 50 mg/ml for 24 h (all drugs were purchased from Merck KGaA, Darmstadt, Germany). After evaluating non-cytotoxic concentration, HepG2 cells were seeded in 96-well plate and cultured, then treated with B97% and B85% at 50 or 100 mg/ml in presence of phenacetin, dextromethorphan or triazolam at 20 mg/ml for 24 h. Cell viability was assessed by means of CCK-8 kit as described above.
2.87. Dosage of Intracellular Reactive Oxygen Species (ROS) Level
ROS production was quantified using 2’,7’-dichlorodihydrofluorescein diacetate (H2-DCF-DA, Thermo Fischer Scientific, Waltham, Massachusetts, USA)[44]. HEK293 cells were seeded in 96-well plate and cultured for 24 h. Cells were treated with B97% and B85% extracts at 10, 20, 50 mg/ml for 24 h. H2O2 0.5 mM was used as positive control of ROS production. After the treatment, the medium was removed, and cells were washed twice with PBS, then incubated with a 50 μM H2DCF-DA solution for 45 min at 37 °C. In presence of ROS, the reagent H2DCF-DA was converted in a fluorescent adduct, dichlorofluorescein (DCF). DCF fluorescence intensity was measured at excitation 485 nm—emission 535 nm, using a Multilabel Plate Reader VICTOR® Nivo™3s (Perkin-Elmer, Waltham, Massachusetts, USA). Two independent experiments with four replicates (n=8) were performed.
2.9. Migration Assay
Caco-2 cells (5 × 10⁵) were seeded into 6-well cell culture plates and allowed to grow to 70–80% confluence as a monolayer [43,45]. The monolayer was gently scratched across the centre of the well with a sterile one-mL pipette tip. A second scratch was performed in a perpendicular way to the first, creating a cross in each well. After scratching, the medium was removed, and the wells were washed twice in PBS solution. Fresh medium containing 5% v/v of heat-inactivated FBS and B97% or B85% at 10 or 100 mg/ml respectively were added to each well. Images were obtained from the same fields immediately after scratching (t0) and after 6, 24, 30 and 48 h using a Leica DMIL microscope, and analyzed using ImageJ software by manually selecting the wound region and recording the total area. The experiments were conducted in triplicate, and two fields were analyzed for each replicate (n = 4). Untreated scratched cells represented the control. The percentage of scratching gap was calculated using the following formula: [Wound area t)/Wound area t0] × 100
2.10. Total RNA Extraction, Reverse Transcription, and real-Time PCR
HEK293 cells were seeded in 6-well plates at the density of 2x10⁶ cells/well and cultured for 24 h. Cells were stimulated with B97% and B85% at 10 and 20 µg/ml for 24 h. RNA extraction and DNAse treatment were performed as previously described [46] by using Ripospin II mini-Kit (#314–150, GeneAll), according to the manufacturer's protocol. For cDNA synthesis, one microgram of RNA was retrotranscribed with PrimeScript RT Reagent Kit (#RR037A, Takara Bio) and RT-qPCR was performed by CFX Connect Real-Time PCR machine (Bio-Rad Laboratories, CA), using SsoAdvanced Universal SYBR Green Supermix (Bio-Rad Laboratories, CA) and specific forward and reverse primers at a final concentration of 300 nM (Table 1). Cycle threshold (Cq) value was determined by the CFX maestro software (Bio-Rad Laboratories, CA), mRNA expression was calculated by the ΔΔCt method and normalized on the mean of rps18-rpl13a genes as endogenous control. For gene expression analysis, endogenous control mRNA levels were not affected among treatments (p>0.05, one-way analysis of variance: ANOVA).

Table 1.
Transcript and sequence of each primer used in real-time PCR.
| Gene | NCBI GenBank | Sequence |
| Rplp13a | NM_012423.4 | fw: GTGCGTCTGAAGCCTACAAG rv: CGTTCTTCTCGGCCTGTTTC |
| Rps18 | NM_022551.3 | fw: TCTAGTGATCCCTGAAAAGT rv: AACACCACATGAGCATATC |
| Tp53 | NM_000546.6 | fw: AGGGATGTTTGGGAGATGTAAG rv: CCTGGTTAGTACGGTGAAGTG |
| c-Myc | NM_001354870.1 | fw: AAGCTGAGGCACACAAAGA rv: GCTTGGACAGGTTAGGAGTAAA |
| n-Myc | NM_005378.6 | fw: TCCAGCAGATGCCACATAAG rv: ACCTCTCATTACCCAGGATGTA |
| Met | NM_001127500.3 | fw: CCTGGGCACCGAAAGATAAA rv: CTCCTCTGCACCAAGGTAAAC |
| Mdm2 | NM_002392.6 | fw: AGGCTGATCTTGAACTCCTAAAC rv: CAGGTGCCTCACATCTGTAATC |
| Cdkn1a | NM_000389.5 | fw: CGGAACAAGGAGTCAGACATT rv: AGTGCCAGGAAAGACAACTAC |
| Snai1 | NM_005985.4 | fw: CAGATGAGGACAGTGGGAAAG rv: GAGACTGAAGTAGAGGAGAAGGA |
| Snai2 | NM_003068.5 | fw: AACTACAGCGAACTGGACAC rv: GAGGATCTCTGGTTGTGGTATG |
| Hras | NM_005343.4 | fw: AAGCAAGGAAGGAAGGAAGG rv: GTGGCATTTGGGATGTTCAAG |
| Cdk4 | NM_000075.4 | fw: GCTCTGCAGCACTCTTATCTAC rv: CTCAGTGTCCAGAAGGGAAATG |
| Bax | NM_004324 | fw: CTCCCCATCTTCAGATCATCAG rv: GGCAGAAGGCACTAATCAAGTC |
| Bcl2 | NM_000657 | fw: GACTGAGTACCTGAACCGGC rv: CTCAGCCCAGACTCACATCA |
2.11. Statistical Analysis
Data were presented as mean ± standard deviation (SD). Statistical analyses were performed using unpaired Student t-test or one-way analysis of variance (ANOVA) (with p < 0.05 significance level) as appropriate. Analyses were conducted using GraphPad Prism 10.1 (San Diego, CA, USA).
3. Results
3.1. Chemical Analyses of Extracts Containing Berberine and Protoberberine Derivatives
Chemical analysis of sixteen different marketed herbal preparations containing BER and PROTBER were performed, specifically extracts from B. aristata, namely B. aristata bark extracts with declared content of BER 97% w/w db, and B. aristata bark extracts with declared content of BER 85% w/w db. A new method developed on purpose was used, providing robust and reliable performance for the extracts under investigation containing BER and PROTBER (Table 2).
The method allowed us to perfectly identify and quantify BER (as BER hydrochloride) in all samples analyzed at the retention time (RT) of 5.7 min (Table 3).
We also identified jatrorrhizine in all samples (RT= 5.0 min) and palmatine (RT= 5.3 min.) accordingly with previously published works [47] and with the characteristic UV-vis spectra. A partial overlapping of palmatine with another minor PROTBER was noted and, also thanks to the collaboration of external labs and by using a mass spectrometer, we identified this PROTBER as berberrubine. In many samples we found other secondary PROTBER through their maximum of absorbance at 344-347 nm, but the sum of these compounds expressed as BER hydrochloride, was confirmed to be <0.1% (Figure 1).
Summarizing, in all samples we found BER as major compound, followed by jatrorrhizine always present, and palmatine at low concentration, often accompanied by berberrubine (Table 4). Overall quali-quantitative data proved the extracts being true to the label for both 97 and 85% groups (maximum discordance +8.2% for C85 and -5.8% for % for G85).
Contrarily to what emerged for other botanicals, the quality of B. aristata extracts available in the raw ingredients marketplace is reliable [48]. This evidence, however, is seemingly in contrast with recent investigations in which only 56% of 18 berberis food supplements were true-to-the-label [49] It must be specified on this regard that our samples were crude extracts available in the business-to-business ingredients market rather than retail, formulated food supplements.
Given the homogeneous phytochemical profile, for subsequent tests two B. aristata extracts with declared content of 97% of berberine hydrochloride db and two extracts of B. aristata with declared content of 85% of berberine hydrochloride were chosen randomly (A85, D85, A97, G97) and pooled to obtain the samples B 85 and B 97 whose chemical composition is reported in Table 5.
3.2. In Vitro Bioaccessibility Assessment of Berberine and Protoberberine Derivatives
The assessment of simulated digestion on the different B. aristata extracts examined, allowed us to recover BER and jatrorrhizine in all samples (Table 6). The post-digestive presence of bile salts and enzymes partly hid the minority part of berberrubine and palmatine in some replicates, thus we decided to exclude these PROTBER in the assessment of bioavailability. We could verify that isoquinolinic alkaloids underwent a minimal degradation, indeed the post-digestive bioaccessibility rate was >95% for BER and 84-88% for jatrorrhizine with low differences in different samples (Table 6). BER resulted adequately soluble in hydrophilic gastrointestinal digestive fluids, and it was not affected by the activity of digestive enzymes. In Figure 2 (A, B) was shown the stability obtained from the analysis of a representative extract before and after simulated digestion.
3.3 In Silico Pharmacokinetic Analysis and Targets Prediction of Berberine and Protoberberine Derivatives
After testing the bioaccessibility of BER and PROTBER, we intended to study other pharmacokinetic features of BER, jatrorrhizine, berberrubine and palmatine that are stable and present at detectable levels in the most used herbal preparations containing BER and PROTBER.
By means of SwissADME® tools we verified that BER (both in neutral and in hydrochloride forms) has a good potential to be absorbed by intestinal epithelium, but being a P-gp substrate, that explains experimental data referring to poor bioavailability of BER [50,51]. Moreover, computational prediction confirmed that BER is a substrate for the following CYP450 isoforms: 1A2, 3A4, 2D6 (Figure 3).
Jatrorrhizine and berberrubine showed to share almost all pharmacokinetic characteristics with BER (Suppl. Figure 1A, B). As observed for BER, jatrorrhizine, berberrubine, and palmatine resulted a P-gp, CYP2D6 and CYP3A4 substrate, but not of CYP1A2; moreover, palmatine was the worst soluble PROTBER among those examined (Suppl. Figure 1C).
We used the GeneCards tool to collect known targets for BER and the other PROTBER here investigated, and we found a total of 371 targets for BER, 6 for jatrorrhizine, 11 for berberrubine and 16 for palmatine. Interestingly, the overlapping of targets found for the 4 compounds produced 373 results, demonstrating therefore that almost all targets known for BER are shared with other major PROTBER of Berberis spp. (Figure 4).
We observed that the main targets identified by GeneCards were related to Low-Density Lipoprotein Receptor (LDLR) and antiproliferative activity, for which the BER activity is known [52,53,54,55]. Other targets were related to CYP450 interaction (CYP2D6) and anti-neuroinflammatory activity (BDNF, NFE2), already reported also in pre-clinical studies [56] (Figure 4).
The interaction between BER and jatrorrhizine mainly underlined the activity on neuroprotective-related targets (BDNF and acetylcholinesterase, ACHE) and on cell cycle regulatory factors (Suppl. Figure 2A).
Differently, the analysis of the interaction between BER and berberrubine highlighted the anti-inflammatory activity of berberrubine [57] (Suppl. Figure 2B).
As regards the combination BER and palmatine, we found that some targets newly emerged, such as those related to cell cycle regulation and anti-proliferative activity, corroborated data emerged by an in vitro study on cancer cells [58,59,60,61]; moreover, BDNF and cholin-esterase (BCHE) emerged as neuro-targets, and some important antioxidant targets such as catalase (CAT) and superoxide dismutase (SOD) were shared by BER and palmatine, as well as the xenobiotic toxicity modulator aryl hydrocarbon receptor (ARH) [62]. CYP1A(1-2) resulted to be modulated by BER and palmatine (Suppl. Figure 2C).
Swiss and SEA target prediction, set as free search, without organ or signaling restrictions, confirmed that BER has a strong probability to interact with CYP2D6 as already described, but also with CYP1B1 and CYP1A2 (respectively predicted by STP and SEA) (Suppl. Figure 3A). Both prediction tools also indicated acetylcholine- and cholin-esterases (ACHE, BCHE) as targets, and the interaction with Ras-related C3 botulinum toxin substrate 1 (RAC1), a member of Rho GTPase (Suppl. Figure 3A). These predictions, only in part already known, may explain why BER is currently considered in the field of neurodegenerative disorders [63], vascular system [64] and metabolism regulation [24].
As regards jatrorrhizine, tools predicted affinity with medium or low scores, but ACHE resulted the most plausible targets for this PROTBER. STP and SEA shared the prediction towards RAC1, involved in metabolism, and cell division control protein 42 homolog (CDC42), a regulator of cell cycle (Suppl. Figure 3B).
Prediction scores for berberrubine were the worst, being weak only for human; STP predicted with a medium or low score some targets already considered for BER such as RAC1 and CDC42 (Suppl. Figure 3C).
As observed for BER, palmatine resulted to interact with ACHE, data experimentally confirmed [65]. Other targets such as 5-HTRB2, BCHE, ADRA2, CHRM1, SIGMAR1 and CYP2D6 were predicted with medium score by SwissTarget, and RAC1 by SEA with a low score (Suppl. Figure 3D).
3.4. In Vitro Cytotoxicity Evaluation of Berberis Aristata Bark Extracts
To assess the biological safety of BER and PROTBER alkaloids, we investigated the biological impact of both berberine extracts (B97% and B85%) examined so far. Specifically, we evaluated the possible cytotoxic effects of BER- and PROTBER-containing preparations by performing cell viability assay on in vitro model of different human cell lines: intestinal (Caco-2), hepatic (HepG2), gastric (AGS), renal (HEK293). Cells were treated with B97% and B85% at different concentrations (10, 20, 50, 100, 200 µg/ml) for two time points, a short- (4h) and a long-term (24h), to simulate the exposure time of different organism systems (stomach, intestine, liver, kidney) and cell types to BER. Results obtained by cell viability assay allowed to determine the IC50 (half-maximal inhibitory concentration) value for each cell line at both time points of treatment. After 4h of treatment, in all cell lines, the IC50 values were over 100 µg/ml: specifically, for the hepatic (HepG2) and gastric (AGS) cells, the IC50 values exceeded 200 µg/ml (Table 4). Similarly, after 24h of treatment the IC50 values were still higher than 100 µg/ml, although the increasing time of treatment. Of note, differences in extracts tested were very low demonstrating a similar cell impact of different B. aristata extracts here studied. Differences in cell viability were observed in the various cell lines models, but it could be considered a non-significant effect given the high IC50 value obtained (Table 4). These data suggested a negligible cytotoxic impact of BER-containing herbal preparations, providing important outcomes on the safety of use of BER and PROTBER contained in the most common marketed food supplements.
Table 4.
IC50 values calculated for the extracts of B. aristata bark containing berberine hydrochloride 97% (B 97) and 85% (B 85) by means cell viability assay performed on intestinal (Caco-2), gastric (AGS), hepatic (HepG2), and kidney (HEK293) cells after 4h and 24h of treatment.
Table 4.
IC50 values calculated for the extracts of B. aristata bark containing berberine hydrochloride 97% (B 97) and 85% (B 85) by means cell viability assay performed on intestinal (Caco-2), gastric (AGS), hepatic (HepG2), and kidney (HEK293) cells after 4h and 24h of treatment.
| IC50 (mg/ml) | |||||
| Sample | Treatment (h) | AGS | Caco-2 | HepG2 | HEK293 |
| B 97% | 4 | >200 | 166.93±8.44 | >200 | 142.65±12.01 |
| B 85% | 4 | >200 | 169.14±9.25 | >200 | 181.93±24.50 |
| B 97% | 24 | >200 | 105.59±11.21 | 198.85±8.50 | 127.16±25.18 |
| B 85% | 24 | >200 | 107.34±9.68 | 186.41±8.42 | 143.43±29.80 |
3.5. In Vitro Cytotoxicity Evaluation of Berberis Aristata Bark Extracts in Presence of CYP450 Substrates
Considering the hepatic metabolism of BER and PROTBER mediated by CYP450, our investigation included the possible toxicological interactions with other drugs known to be substrates of CYP450 isoforms.
To address this aspect, we performed a cell viability assay on HepG2 cells treated with both B 97% and B 85% extracts at the highest concentrations of 50 and 100 µg/ml in the presence of three main CYP450 substrates, like phenacetin (P), dextromethorphan (D) and triazolam (T).
The selection of concentrations derived from the cytotoxicity tests described in 3.4 and were intended to create a stress condition that can better assess the possible effects of an interaction with other drugs at the cytotoxic level. Firstly, to identify the non-toxic concentration of P, D and T to use in the co-treatment, we tested HepG2 cell viability treated with different concentrations of P, D, and T (0.1, 1, 10, 50 µg/ml) for 24h. Statistical analysis revealed that all three drugs showed no impact on cell viability up to 10 µg/ml compared to the control group (Figure 5A-C). At the dose of 50 µg/ml, P, D, and T differently affected the viability of hepatic cells: P and D reduced cell viability of about 10% and 20% respectively (one-way ANOVA: P=p<0.05; D=p<0.001 vs CTRL), while T showed the most significant impact by reducing cell viability of about 90% with respect to controls (p<0.0001 vs CTRL) (Figure 5C). Based on these data, we carried out following analysis by treating hepatic cells with 20 µg/ml of P, D or T in association with B 97% or B 85% at 50 or 100 µg/ml respectively. The results showed a non-significant effect of B 97% at 50 µg/ml on HepG2 cell viability; the association with P and T at 20 µg/ml did not cause changes in cell viability if compared to control group, while the effect of BER was slightly worsened by the presence of D, resulting in a reduction in cell viability up to 30% (one way ANOVA: p<0.0001 vs CTRL) (Figure 5D). The treatment with B 97% at 100 µg/ml significantly affected cell viability compared to controls (p<0.001 vs CTRL), but it was not significantly altered by the co-presence of the three drugs (Figure 5D). Regarding B 85%, the exposure of HepG2 cells to the sample alone slightly reduced the cell viability (17%) that did not undergo alterations in the presence of P, D or T if compared to control cells (Figure 5E). The 24h-treatment of hepatic cells with B 85% at 100 µg/ml significantly reduced the cell viability of about 30% with respect to controls (p<0.0001 vs CTRL). Also in this case, the association with all drugs did not change the effect of BER (Figure 5E), indeed, the co-presence of P seems to improve the impact of B 85% on cell viability (p<0.05 vs B 85% at 100 µg/ml).
These results showed that, in association with P, D, or T, the low cytotoxicity of the most common BER-containing extracts remains unchanged. Overall, these findings provide preliminary data on toxicological aspects related to the interaction of B 97% and B 85% extracts with drugs known to be CYP450 substrates.
3.6. Effect of Berberis Aristata Bark Extracts on Cell Migration
In addition to assessing the effects on cell viability, the investigation of the safety of herbal preparations containing BER and PROTBER proceeded by analyzing cell migration, an important ability of cells to move in the surrounding environment and to interact with other cells, particularly of cancer cells.
With this purpose, we explored the migratory activity by means of wound healing assay in human colorectal cancer cells (Caco-2) following a treatment with B 97% and B 85% at both low concentration (10 µg/ml) and high concentration (100 µg/ml) for 48h. The relative scratch gap was monitored over time and measured. Data showed a statistically significant effect of both B 97% and B 85% at the dose of 100 µg/ml in decreasing the migration ability of Caco-2 cells (about 40% B 97% and 33% B 85%) at the end of the treatment compared to control cells (one-way ANOVA: **p<0.01 vs CTRL) (Figure 6). These results suggested a functional activity of tested extracts at 100 µg/ml in decreasing cell migration of intestinal tumor cells.
3.7. In Vitro Evaluation of ROS Production in Normal Kidney Cells Treated with Berberis Aristata Bark Extracts
The assessment of safety of herbal preparations containing BER and PROTBER took into consideration also possible effects of oxidative stress of both B 97% and B 85% extracts in non-tumoral human cells. For this reason, ROS production was evaluated in normal renal cells (HEK293) treated for 24h with B 97% and B 85% extracts at different concentrations (10, 20 and 50 µg/ml); H2O2 was used as a positive control.
The results showed no statistical effects of neither B 97% nor B 85% at all the concentrations tested compared to control cells; differently, treatment with H2O2 was able to induce ROS production by 1.45-fold with respect to untreated cells (one-way ANOVA: p<0.0001 vs CTRL) (Figure 7).
These data suggested no effects of BER and PROTBER in inducing oxidative stress by ROS production.
3.8. Transcriptional Effect of Berberis Aristata Bark Extracts on Target Genes Involved In Cell Cycle Control and Neoplastic Transformation
With the purpose to deepening the study on the safety and biological activity of BER, we investigated the molecular effects of BER- and PROTBER-containing herbal preparations in an in vitro model of human normal kidney cells, HEK293.
We focused on the transcriptional effects on the main target genes involved in cell cycle control, cell growth, neoplastic transformation, and oncogenes by exposing HEK293 cells for 24h to the two examined extracts, B 97% and B 85%, at the concentrations of 10 and 20 µg/ml. First, we analyzed through RT-qPCR the gene expression of the tumor protein p53 (TP53), the oncogene MDM2, and the proto-oncogenes c-MYC, n-MYC, HRAS and MET.
Our results showed that TP53, MDM2 and n-MYC mRNA levels were markedly downregulated in cells treated with B 97% and B 85% at both 10 and 20 µg/ml compared to control counterpart [one-way ANOVA: TP53: F (4, 18) = 12,04, p<0.001; MDM2: F (4, 18) = 7,773, p=0.0008; n-MYC: F (4, 18) = 8,198, p=0.0006] (Figure 8 A-C). On the contrary, no differences were observed in c-MYC gene expression with respect to untreated cells with the exception of cells exposed to B 97% at 20 µg/ml where a significant increase (2-fold) in c-MYC mRNA levels, compared to control ones, was observed [F (4, 18) = 7,375; p=0.0011] (Figure 8D). Regarding the mRNA levels of HRAS and MET, we found no significant effects of both BER extracts, at both concentrations, in kidney cells following 24h of treatment (Figure 8 E, F). These results revealed the impact of both B. aristata extracts in downregulating the gene transcription of TP53, MDM2, MYC at both the concentrations tested in normal cells.
Then, our molecular analysis focused on p21 (CDKN1A) and CDK4 targets, two essential factors in regulating cell cycle. Results revealed no statistically significant effects of B 97% extract in modulating CDKN1A gene transcription that was downregulated instead by B 85% at both concentrations [F (4, 18) = 4,273, p= 0.0132]. Regarding CDK4, treatment with both BER extracts induced a decrease of gene expression unrelated to the dose [F (4, 18) = 3,036, p=0.0446] (Figure 9A, B).
In evaluating the effects of BER in regulating cell death process, as apoptosis, we also analyzed the transcriptional levels of the Bcl-2 family members, key factors in the early stages of apoptotic process: the pro-apoptotic gene BAX and the anti-apoptotic gene BCL-2 [66,67,68] .
Statistical analysis showed a significant and similar effect of both B. aristata extracts in downregulating the expression of the pro-apoptotic gene BAX in HEK293 cells compared to controls [one-way ANOVA: F(4, 9)= 8,688, p=0.0037], whereas no changes in BCL-2 mRNA levels were observed (Figure 10 A,B).
Accumulating evidence has revealed that BER exerts potential pro-apoptotic effects by modulating BAX/BCL2 (pro-/anti-apoptotic) expression in multiple cancers, including breast, lung, liver, gastric, colorectal, pancreatic, and ovarian cancers [69,70,71,72,73,74,75,76]. Our results in normal cells counteracted this evidence and highlighted a BAX transcriptional inhibition.
Overall, our data showed that B. aristata extracts examined did not affect or downregulated the transcription of several gene targets involved in the regulation of cell cycle or oncogenic functions suggesting an inhibitory activity of BER of cell cycle, proliferation and division processes in normal cells.
4. Discussion
Herbal preparations containing berberine (BER) and other minor protoberberinoids (PROTBER) have been extensively used both in traditional Asian medicine, in modern conventional phytotherapy and in food supplements supporting physiological activities. BER has garnered attention for its purported effects on glucose and lipid metabolism, gastrointestinal health, and even for potential anti-cancer properties and its use in concentrated, rich extracts leads to limited complications in terms of synergistic effects [77,78,79,80,81,82]. However, as its popularity increases, concerns about its safety are emerging, especially regarding safe exposure for general consumers and special populations, as highlighted by some national authorities and EFSA in the EU [37]. The authorities have clearly claimed the need of analytical, pharmacokinetic and biological insights into herbal preparations containing BER and PROTBER used as food supplements. This study aimed to investigate these important concerns. Chemical characterization of B. aristata extracts available in the market allowed to confirm the declared content of BER and to identify jatrorrhizine as the main secondary PROTBER, while palmatine and berberrubine as other minority PROTBER in the extracts.
These findings showed that herbal preparations containing BER and PROTBER used as food supplements are more homogeneous than expected within the EU, being basically referred to B. aristata dry extracts; moreover, BER represents more than 90% of total alkaloids in the most common extracts available in the market.
Pivotal evidence about pharmacokinetics properties of BER emerged from the in vitro assays and in silico predictions: BER and PROTBER were only minimally degraded before intestinal absorption, but being a P-gp substrate limits bioavailability as well as cytochrome P450 (CYP450) involvement for both alkaloids, with particular regard to CYP2D6, CYP1A2 and CYP3A4 isoforms. Computational prediction were confirmed experimentally for BER and, in part, for palmatine, whereas mainly structural homology-based prediction could be obtained for jatrorrhizine and berberrubine. Beside LDLR, well known to be peculiar target of BER [83], all computational tools confirmed the activity of BER and PROTBER on neuroprotective [84,85,86,87,88] and anti-proliferative targets [59,60,61,89,90].
These data allowed us to move towards a rational, deeper in vitro safety assessment on the plausible concentrations of BER and PROTBER able to reach different orgnism districts after oral administration. Noticeably, target prediction, cell and molecular analysis addressed in this study were focused on human context, recognizing the limitations and misleading interpretations in extrapolating findings from animal studies to human safety [91]. Therefore, given the homogenous phytochemical profile available, we evaluated the effects of two representative B. aristata bark dry extracts on gastric, intestinal, hepatic and renal cells, following a short- or a long-term exposure (4 and 24h). Results showed for both exposures a very limited impact of BER-enriched extracts on cell viablity with a IC50 always exceeding 100 µg/ml in all cell lines examined. We considered cell viability only as a preliminary but fundamental test to assess safe concentrations of samples under investigation, allowing to quickly move towards the investigation of the interaction effects between BER and PROTBER and CYP1A2 -2D6 and -3A4 substrates on hepatic cell viability. Interestingly, even at 50 and 100 µg/ml, B. aristata bark dry extracts did not affect cell viability in presence of phenacetin (CYP1A2), dextromethorphan (CYP2D6) and triazolam (CYP3A4) respectively, demonstrating that herbal preparations containing BER and PROTBER may not have negative interactions with CYP450 substrates.
Many in vitro studies demonstrated the ability of BER to inhibit the proliferation, invasion and regulate cell cycle in tumoral cells [59,61,89,90,92,93]. In light of this, our study proceeded with the analysis of cell response by evalutaing cell migration ability following the treatment with both the tested extracts. The migration ability is an importnat feature of cells to move and invade other tissues, interact with other cells or to repair any damage; this property is typical of cancer cells and identifies their invasive and aggressive potential. In this context, the effects of BER-containing extracts on cell migration were evaluated in colorectal adenocarcinoma cells (Caco-2). Our data demonstrated a delay in cell migration when treated with B. aristata bark dry extracts even after long exposure times, both at 10 and 100 µg/ml, corroborating numerous evidence on the BER-inhibiting activity of cell migration [89,90,94,95,96]. Our experimental evidence supported the potential anti-tumoral activity of B. aristata extracts.
Subsequently, the study focused on non-tumor cell model in order to gather preliminary data on the possible cell function alterations induced by B. aristata extracts, responsible for transformation from normal to tumor cell. Among the mechanisms involved in the neoplastic transformation there is irreversible damage to DNA or a dysregulation of the cell cycle. In addition, excessive generation of ROS in the cell, in response to oxidative stress, may lead to DNA damage and mutagenesis through the suppression and mutations of tumor suppressor genes. This phenomenon potentially promotes tumorigenesis [97,98]. The B. aristata extracts studied did not induce ROS production in human normal HEK293 cells thus excluding the hypothesis of a potential effect of DNA damage mediated by free radical excess. These data support evidence reporting BER antioxidant activity by suppressing ROS production [99,100,101,102] Results confirming a non-carcinogenic potential of BER emerged also from the molecular analysis in normal HEK293 cells that allowed us to evaluate the BER-modulatory effects on the expression of key genes in the inhibition, promotion, or checkpoints control during the cell cycle phases (TP53, CDKN1A,CDK4), oncogenes (MDM2, MYC family, HRAS, MET), and apoptosis process (BAX, BCL2). Overall, a downregulation of cell cycle genes was observed confirming the inhibitory effect of B. aristata extracts in promoting cell cycle, thus cell proliferation in normal cells [59,93], and no effects on the transcription of proto-oncogenes emerged supporting data showing the absence of a pro-tumoral potential of BER [80,103,104,105]. In addition, both the B. aristata extracts examined showed to downregulate the expression of the pro-apoptotic gene BAX, suggesting the effect of BER in regulating transcriptionally the apoptosis process and to having no impact in apoptosis-mediated cell death in normal cells differently to what demonstrated in tumor cells [106,107,108,109,110]. These preliminary findings highlight important insights about BER and PROTBER safety considering the crucial role of these target genes in controlling cell functions and cell homeostasis.
Overall, evidence collected provide a useful overview to better elucidate potential risks related to herbal preparations containing BER and minor PROTBER commonly used in food supplement.
Supplementary Materials
The following supporting information can be downloaded at the website of this paper posted on Preprints.org.
Author Contributions
Conceptualization, M.B; methodology, M.B and G.R.; formal analysis and investigation, G.R, G.C., F.V., G.B.; resources, E.M., F.T.; writing—original draft preparation, G.R and M.B.; review and editing, L.P., F.T., R.B. All authors have read and agreed to the published version of the manuscript.
Funding
This research received no external funding.
Data Availability Statement
Data are available upon request to the Corresponding author.
Acknowledgments
This work has been carried out in the frame of the ALIFAR project of the University of Parma, funded by the Italian Ministry of University through the program “Dipartimenti di Eccellenza 2023-2027”. The publication has been realized with the co-financing of the European Union – FSE-REACT-EU, PON research and Innovation 2014-2020 DM1062/2021.
Conflicts of Interest
The authors declare no conflicts of interest.
References
- Berberine | C20H18NO4+ | CID 2353 - PubChem Available online:. Available online: https://pubchem.ncbi.nlm.nih.gov/compound/2353 (accessed on 2 January 2024).
- Neag, M.A.; Mocan, A.; Echeverría, J.; Pop, R.M.; Bocsan, C.I.; Crisan, G.; Buzoianu, A.D. Berberine: Botanical Occurrence, Traditional Uses, Extraction Methods, and Relevance in Cardiovascular, Metabolic, Hepatic, and Renal Disorders. Front Pharmacol 2018, 9, 343970. [Google Scholar] [CrossRef] [PubMed]
- Imenshahidi, M.; Hosseinzadeh, H. Berberine and Barberry (Berberis Vulgaris): A Clinical Review. Phytotherapy Research 2019, 33, 504–523. [Google Scholar] [CrossRef] [PubMed]
- European Pharmacopoeia Commission Berberis Aristata Stem (2851) Monograph in Ph. Eur. Post 2022. 2022.
- Xing, L.; Zhou, X.; Li, A.H.; Li, H.J.; He, C.X.; Qin, W.; Zhao, D.; Li, P.Q.; Zhu, L.; Cao, H.L. Atheroprotective Effects and Molecular Mechanism of Berberine. Front Mol Biosci 2021, 8, 762673. [Google Scholar] [CrossRef] [PubMed]
- Yang, L.; Zhu, W.; Zhang, X.; Zhou, X.; Wu, W.; Shen, T. Efficacy and Safety of Berberine for Several Cardiovascular Diseases: A Systematic Review and Meta-Analysis of Randomized Controlled Trials. Phytomedicine 2023, 112, 154716. [Google Scholar] [CrossRef] [PubMed]
- Cho, B.J.; Im, E.K.; Kwon, J.H.; Lee, K.H.; Shin, H.J.; Oh, J.; Kang, S.M.; Chung, J.H.; Jang, Y. Berberine Inhibits the Production of Lysophosphatidylcholine-Induced Reactive Oxygen Species and the ERK1/2 Pathway in Vascular Smooth Muscle Cells. Mol Cells 2005, 20, 429–434. [Google Scholar] [CrossRef] [PubMed]
- Ju, J.; Li, J.; Lin, Q.; Xu, H. Efficacy and Safety of Berberine for Dyslipidaemias: A Systematic Review and Meta-Analysis of Randomized Clinical Trials. Phytomedicine 2018, 50, 25–34. [Google Scholar] [CrossRef] [PubMed]
- Li, Z.; Geng, Y.-N.; Jiang, J.-D.; Kong, W.-J. Antioxidant and Anti-Inflammatory Activities of Berberine in the Treatment of Diabetes Mellitus. 2014. [CrossRef]
- Chueh, W.H.; Lin, J.Y. Berberine, an Isoquinoline Alkaloid, Inhibits Streptozotocin-Induced Apoptosis in Mouse Pancreatic Islets through down-Regulating Bax/Bcl-2 Gene Expression Ratio. Food Chem 2012, 132, 252–260. [Google Scholar] [CrossRef]
- Liang, Y.; Xu, X.; Yin, M.; Zhang, Y.; Huang, L.; Chen, R.; Ni, J. Effects of Berberine on Blood Glucose in Patients with Type 2 Diabetes Mellitus: A Systematic Literature Review and a Meta-Analysis. Endocr J 2019, 66, 51–63. [Google Scholar] [CrossRef]
- Cao, C.; Su, M. Effects of Berberine on Glucose-Lipid Metabolism, Inflammatory Factors and Insulin Resistance in Patients with Metabolic Syndrome. Exp Ther Med 2019, 17, 3009. [Google Scholar] [CrossRef]
- Nazari, A.; Ghotbabadi, Z.R.; Kazemi, K.S.; Metghalchi, Y.; Tavakoli, R.; Rahimabadi, R.Z.; Ghaheri, M. The Effect of Berberine Supplementation on Glycemic Control and Inflammatory Biomarkers in Metabolic Disorders: An Umbrella Meta-Analysis of Randomized Controlled Trials. Clin Ther 2023. [Google Scholar] [CrossRef] [PubMed]
- Panigrahi, A.; Mohanty, S. Efficacy and Safety of HIMABERB® Berberine on Glycemic Control in Patients with Prediabetes: Double-Blind, Placebo-Controlled, and Randomized Pilot Trial. BMC Endocr Disord 2023, 23, 1–8. [Google Scholar] [CrossRef] [PubMed]
- Chen, C.; Yu, Z.; Li, Y.; Fichna, J.; Storr, M. Effects of Berberine in the Gastrointestinal Tract - a Review of Actions and Therapeutic Implications. Am J Chin Med (Gard City N Y) 2014, 42, 1053–1070. [Google Scholar] [CrossRef] [PubMed]
- Zhang, L.; Wu, X.; Yang, R.; Chen, F.; Liao, Y.; Zhu, Z.; Wu, Z.; Sun, X.; Wang, L. Effects of Berberine on the Gastrointestinal Microbiota. Front Cell Infect Microbiol 2020, 10. [Google Scholar] [CrossRef] [PubMed]
- Wang, Y.; Liu, Y.; Du, X.; Ma, H.; Yao, J. The Anti-Cancer Mechanisms of Berberine: A Review. Cancer Manag Res 2020, 12, 695. [Google Scholar] [CrossRef] [PubMed]
- Huang, C.; Tao, L.; Wang, X. lian; Pang, Z. Berberine Reversed the Epithelial-Mesenchymal Transition of Normal Colonic Epithelial Cells Induced by SW480 Cells through Regulating the Important Components in the TGF-β Pathway. J Cell Physiol 2019, 234, 11679–11691. [Google Scholar] [CrossRef] [PubMed]
- Gong, C.; Hu, X.; Xu, Y.; Yang, J.; Zong, L.; Wang, C.; Zhu, J.; Li, Z.; Lu, D. Berberine Inhibits Proliferation and Migration of Colorectal Cancer Cells by Downregulation of GRP78. Anticancer Drugs 2020, 31, 141–149. [Google Scholar] [CrossRef] [PubMed]
- Bertuccioli, A.; Cardinali, M.; Biagi, M.; Moricoli, S.; Morganti, I.; Zonzini, G.B.; Rigillo, G. Nutraceuticals and Herbal Food Supplements for Weight Loss: Is There a Prebiotic Role in the Mechanism of Action? Microorganisms 2021, 9. [Google Scholar] [CrossRef] [PubMed]
- Guo, P.; Cai, C.; Wu, X.; Fan, X.; Huang, W.; Zhou, J.; Wu, Q.; Huang, Y.; Zhao, W.; Zhang, F.; et al. An Insight into the Molecular Mechanism of Berberine towards Multiple Cancer Types through Systems Pharmacology. Front Pharmacol 2019, 10, 857. [Google Scholar] [CrossRef]
- Radzka, J.; Łapińska, Z.; Szwedowicz, U.; Gajewska-Naryniecka, A.; Gizak, A.; Kulbacka, J. Alternations of NF-ΚB Signaling by Natural Compounds in Muscle-Derived Cancers. Int J Mol Sci 2023, 24. [Google Scholar] [CrossRef]
- Zhang, Y.; Ma, J.; Zhang, W. Berberine for Bone Regeneration: Therapeutic Potential and Molecular Mechanisms. J Ethnopharmacol 2021, 277, 114249. [Google Scholar] [CrossRef] [PubMed]
- Noh, J.W.; Jun, M.S.; Yang, H.K.; Lee, B.C. Cellular and Molecular Mechanisms and Effects of Berberine on Obesity-Induced Inflammation. Biomedicines 2022, 10. [Google Scholar] [CrossRef] [PubMed]
- Chen, S.; Chen, S.T.; Sun, Y.; Xu, Z.; Wang, Y.; Yao, S.Y.; Yao, W.B.; Gao, X.D. Fibroblast Growth Factor 21 Ameliorates Neurodegeneration in Rat and Cellular Models of Alzheimer’s Disease. Redox Biol 2019, 22. [Google Scholar] [CrossRef]
- Wong, S.K.; Chin, K.Y.; Ima-Nirwana, S. Berberine and Musculoskeletal Disorders: The Therapeutic Potential and Underlying Molecular Mechanisms. Phytomedicine 2020, 73, 152892. [Google Scholar] [CrossRef] [PubMed]
- Chen, W.; Miao, Y.Q.; Fan, D.J.; Yang, S.S.; Lin, X.; Meng, L.K.; Tang, X. Bioavailability Study of Berberine and the Enhancing Effects of TPGS on Intestinal Absorption in Rats. AAPS PharmSciTech 2011, 12, 705–711. [Google Scholar] [CrossRef]
- He, C.Y.; Fu, J.; Shou, J.W.; Zhao, Z.X.; Ren, L.; Wang, Y.; Jiang, J.D. In Vitro Study of the Metabolic Characteristics of Eight Isoquinoline Alkaloids from Natural Plants in Rat Gut Microbiota. Molecules 2017, Vol. 22, Page 932 2017, 22, 932. [Google Scholar] [CrossRef]
- Zhong, F.; Chen, Y.; Chen, J.; Liao, H.; Li, Y.; Ma, Y. Jatrorrhizine: A Review of Sources, Pharmacology, Pharmacokinetics and Toxicity. Front Pharmacol 2022, 12, 783127. [Google Scholar] [CrossRef]
- Chen, N.; Yang, X.Y.; Guo, C.E.; Bi, X.N.; Chen, J.H.; Chen, H.Y.; Li, H.P.; Lin, H.Y.; Zhang, Y.J. The Oral Bioavailability, Excretion and Cytochrome P450 Inhibition Properties of Epiberberine: An in Vivo and in Vitro Evaluation. Drug Des Devel Ther 2018, 12, 57. [Google Scholar] [CrossRef]
- Basera, I.A.; Girmeorcid, A.; Bhatt, V.P.; Sasteorcid, G.; Pawarorcid, S.; Hingoraniorcid, L.; Shah, M.B. Development of Validated UHPLC–PDA with ESI–MS-MS Method for Concurrent Estimation of Magnoflorine, Berbamine, Columbamine, Jatrorrhizine, Palmatine and Berberine in Berberis Aristata. Acta Chromatogr 2021, 34, 412–421. [Google Scholar] [CrossRef]
- Yang, N.; Sun, R. Bin; Chen, X.L.; Zhen, L.; Ge, C.; Zhao, Y.Q.; He, J.; Geng, J.L.; Guo, J.H.; Yu, X.Y.; et al. In Vitro Assessment of the Glucose-Lowering Effects of Berberrubine-9-O-β-D-Glucuronide, an Active Metabolite of Berberrubine. Acta Pharmacol Sin 2017, 38, 351. [Google Scholar] [CrossRef]
- Du, W.; Jin, L.; Li, L.; Wang, W.; Zeng, S.; Jiang, H.; Zhou, H. Development and Validation of a HPLC-ESI-MS/MS Method for Simultaneous Quantification of Fourteen Alkaloids in Mouse Plasma after Oral Administration of the Extract of Corydalis Yanhusuo Tuber: Application to Pharmacokinetic Study. Molecules : A Journal of Synthetic Chemistry and Natural Product Chemistry 2018, 23. [Google Scholar] [CrossRef]
- Guo, Y.; Pope, C.; Cheng, X.; Zhou, H.; Klaassen, C.D. Dose-Response of Berberine on Hepatic Cytochromes P450 MRNA Expression and Activities in Mice. J Ethnopharmacol 2011, 138, 111. [Google Scholar] [CrossRef] [PubMed]
- Zhou, H.; Shi, R.; Ma, B.; Ma, Y.; Wang, C.; Wu, D.; Wang, X.; Cheng, N. CYP450 1A2 and Multiple UGT1A Isoforms Are Responsible for Jatrorrhizine Metabolism in Human Liver Microsomes. Biopharm Drug Dispos 2013, 34, 176–185. [Google Scholar] [CrossRef] [PubMed]
- Vrba, J.; Papouskova, B.; Pyszkova, M.; Zatloukalova, M.; Lemr, K.; Ulrichova, J.; Vacek, J. Metabolism of Palmatine by Human Hepatocytes and Recombinant Cytochromes P450. J Pharm Biomed Anal 2015, 102, 193–198. [Google Scholar] [CrossRef]
- Call for Data for the Scientific Opinion on the Evaluation of the Safety in Use of Plant Preparations Containing Berberine | EFSA Available online:. Available online: https://www.efsa.europa.eu/en/call/call-data-scientific-opinion-evaluation-safety-use-plant-preparations-containing-berberine (accessed on 2 January 2024).
- Governa, P.; Manetti, F.; Miraldi, E.; Biagi, M. Effects of in Vitro Simulated Digestion on the Antioxidant Activity of Different Camellia Sinensis (L.) Kuntze Leaves Extracts. European Food Research and Technology 2022, 248, 119–128. [Google Scholar] [CrossRef]
- Brodkorb, A.; Egger, L.; Alminger, M.; Alvito, P.; Assunção, R.; Ballance, S.; Bohn, T.; Bourlieu-Lacanal, C.; Boutrou, R.; Carrière, F.; et al. INFOGEST Static in Vitro Simulation of Gastrointestinal Food Digestion. Nature Protocols 2019 14:4 2019, 14, 991–1014. [Google Scholar] [CrossRef]
- Daina, A.; Michielin, O.; Zoete, V. SwissADME: A Free Web Tool to Evaluate Pharmacokinetics, Drug-Likeness and Medicinal Chemistry Friendliness of Small Molecules OPEN. 2017. [CrossRef]
- Safran, M.; Rosen, N.; Twik, M.; BarShir, R.; Stein, T.I.; Dahary, D.; Fishilevich, S.; Lancet, D. The GeneCards Suite. Practical Guide to Life Science Databases 2022, 27–56. [Google Scholar] [CrossRef]
- Yu, L.; Zhou, D.; Gao, L.; Zha, Y. Prediction of Drug Response in Multilayer Networks Based on Fusion of Multiomics Data. Methods 2021, 192, 85–92. [Google Scholar] [CrossRef]
- Pressi, G.; Rigillo, G.; Governa, P.; Borgonetti, V.; Baini, G.; Rizzi, R.; Guarnerio, C.; Bertaiola, O.; Frigo, M.; Merlin, M.; et al. A Novel Perilla Frutescens (L.) Britton Cell-Derived Phytocomplex Regulates Keratinocytes Inflammatory Cascade and Barrier Function and Preserves Vaginal Mucosal Integrity In Vivo. Pharmaceutics 2023, 15. [Google Scholar] [CrossRef]
- Borgonetti, V.; Benatti, C.; Governa, P.; Isoldi, G.; Pellati, F.; Alboni, S.; Tascedda, F.; Montopoli, M.; Galeotti, N.; Manetti, F.; et al. Non-Psychotropic Cannabis Sativa L. Phytocomplex Modulates Microglial Inflammatory Response through CB2 Receptors-, Endocannabinoids-, and NF-ΚB-Mediated Signaling. Phytotherapy Research 2022, 36, 2246–2263. [Google Scholar] [CrossRef]
- Pressi, G.; Bertaiola, O.; Guarnerio, C.; Barbieri, E.; Rigillo, G.; Governa, P.; Biagi, M.; Guzzo, F.; Semenzato, A. In Vitro Cell Culture of Rhus Coriaria L.: A Standardized Phytocomplex Rich of Gallic Acid Derivatives with Antioxidant and Skin Repair Activity. Cosmetics 2022, Vol. 9, Page 12 2022, 9, 12. [Google Scholar] [CrossRef]
- G. Rigillo, V. Basile, S.; Belluti, M. Ronzio, E. Sauta, A.; Ciarrocchi, L. Latella, S. Molinari, A.Vallarola, G. Messina, R.; Mantovani, D.D. and C.I. The Transcription Factor NF-Y Participates to Stem Cell Fate Decision and Regeneration in Adult Skeletal Muscle. Nat Commun, 2020.
- Basera, I.A.; Girmeorcid, A.; Bhatt, V.P.; Sasteorcid, G.; Pawarorcid, S.; Hingoraniorcid, L.; Shah, M.B. Development of Validated UHPLC–PDA with ESI–MS-MS Method for Concurrent Estimation of Magnoflorine, Berbamine, Columbamine, Jatrorrhizine, Palmatine and Berberine in Berberis Aristata. Acta Chromatogr 2021, 34, 412–421. [Google Scholar] [CrossRef]
- Ichim, M.C.; Booker, A. Chemical Authentication of Botanical Ingredients: A Review of Commercial Herbal Products. Front Pharmacol 2021, 12, 666850. [Google Scholar] [CrossRef] [PubMed]
- Danoun, S.; Balayssac, S.; Gilard, V.; Martino, R.; Malet-Martino, M. Quality Evaluation of Berberine Food Supplements with High-Field and Compact 1H NMR Spectrometers. J Pharm Biomed Anal 2023, 223. [Google Scholar] [CrossRef] [PubMed]
- Chen, W.; Miao, Y.Q.; Fan, D.J.; Yang, S.S.; Lin, X.; Meng, L.K.; Tang, X. Bioavailability Study of Berberine and the Enhancing Effects of TPGS on Intestinal Absorption in Rats. AAPS PharmSciTech 2011, 12, 705–711. [Google Scholar] [CrossRef] [PubMed]
- Chen, N.; Yang, X.Y.; Guo, C.E.; Bi, X.N.; Chen, J.H.; Chen, H.Y.; Li, H.P.; Lin, H.Y.; Zhang, Y.J. The Oral Bioavailability, Excretion and Cytochrome P450 Inhibition Properties of Epiberberine: An in Vivo and in Vitro Evaluation. Drug Des Devel Ther 2018, 12, 57–65. [Google Scholar] [CrossRef]
- Maharjan, B.; Payne, D.T.; Ferrarese, I.; Giovanna Lupo, M.; Kumar Shrestha, L.; Hill, J.P.; Ariga, K.; Rossi, I.; Sharan Shrestha, S.; Panighel, G.; et al. Evaluation of the Effects of Natural Isoquinoline Alkaloids on Low Density Lipoprotein Receptor (LDLR) and Proprotein Convertase Subtilisin/Kexin Type 9 (PCSK9) in Hepatocytes, as New Potential Hypocholesterolemic Agents. Bioorg Chem 2022, 121. [Google Scholar] [CrossRef]
- Lee, S.; Lim, H.J.; Park, J.H.; Lee, K.S.; Jang, Y.; Park, H.Y. Berberine-Induced LDLR up-Regulation Involves JNK Pathway. Biochem Biophys Res Commun 2007, 362, 853–857. [Google Scholar] [CrossRef]
- Katiyar, S.K.; Meeran, S.M.; Katiyar, N.; Akhtar, S. P53 Cooperates Berberine-Induced Growth Inhibition and Apoptosis of Non-Small Cell Human Lung Cancer Cells in Vitro and Tumor Xenograft Growth in Vivo. Mol Carcinog 2009, 48, 24–37. [Google Scholar] [CrossRef]
- Hsu, W.H.; Hsieh, Y.S.; Kuo, H.C.; Teng, C.Y.; Huang, H.I.; Wang, C.J.; Yang, S.F.; Liou, Y.S.; Kuo, W.H. Berberine Induces Apoptosis in SW620 Human Colonic Carcinoma Cells through Generation of Reactive Oxygen Species and Activation of JNK/P38 MAPK and FasL. Arch Toxicol 2007, 81, 719–728. [Google Scholar] [CrossRef]
- Cheng, Z.; Kang, C.; Che, S.; Su, J.; Sun, Q.; Ge, T.; Guo, Y.; Lv, J.; Sun, Z.; Yang, W.; et al. Berberine: A Promising Treatment for Neurodegenerative Diseases. Front Pharmacol 2022, 13. [Google Scholar] [CrossRef] [PubMed]
- Chen, F.L.; Yang, Z.H.; Liu, Y.; Li, L.X.; Liang, W.C.; Wang, X.C.; Zhou, W.B.; Yang, Y.H.; Hu, R.M. Berberine Inhibits the Expression of TNFalpha, MCP-1, and IL-6 in AcLDL-Stimulated Macrophages through PPARgamma Pathway. Endocrine 2008, 33, 331–337. [Google Scholar] [CrossRef] [PubMed]
- Li, J.; Cao, B.; Liu, X.; Fu, X.; Xiong, Z.; Chen, L.; Sartor, O.; Dong, Y.; Zhang, H. Berberine Suppresses Androgen Receptor Signaling in Prostate Cancer. Mol Cancer Ther 2011, 10, 1346. [Google Scholar] [CrossRef] [PubMed]
- Jantová, S.; čipák, L.; čerňáková, M.; Košt‘álová, D. Effect of Berberine on Proliferation, Cell Cycle and Apoptosis in HeLa and L1210 Cells. Journal of Pharmacy and Pharmacology 2010, 55, 1143–1149. [Google Scholar] [CrossRef]
- Li, Z.; Chen, M.; Wang, Z.; Fan, Q.; Lin, Z.; Tao, X.; Wu, J.; Liu, Z.; Lin, R.; Zhao, C. Berberine Inhibits RA-FLS Cell Proliferation and Adhesion by Regulating RAS/MAPK/FOXO/HIF-1 Signal Pathway in the Treatment of Rheumatoid Arthritis. Bone Joint Res 2023, 12, 91–102. [Google Scholar] [CrossRef] [PubMed]
- Li, J.; Liu, F.; Jiang, S.; Liu, J.; Chen, X.; Zhang, S.; Zhao, H. Berberine Hydrochloride Inhibits Cell Proliferation and Promotes Apoptosis of Non-Small Cell Lung Cancer via the Suppression of the MMP2 and Bcl-2/Bax Signaling Pathways. Oncol Lett 2018, 15, 7409. [Google Scholar] [CrossRef] [PubMed]
- Lo, S.N.; Wang, C.W.; Chen, Y.S.; Huang, C.C.; Wu, T.S.; Li, L.A.; Lee, I.J.; Ueng, Y.F. Berberine Activates Aryl Hydrocarbon Receptor but Suppresses CYP1A1 Induction through MiR-21-3p Stimulation in MCF-7 Breast Cancer Cells. Molecules : A Journal of Synthetic Chemistry and Natural Product Chemistry 2017, 22. [Google Scholar] [CrossRef] [PubMed]
- Wei, W.; Yao, J.X.; Zhang, T.T.; Wen, J.Y.; Zhang, Z.; Luo, Y.M.; Cao, Y.; Li, H. Network Pharmacology Reveals That Berberine May Function against Alzheimer’s Disease via the AKT Signaling Pathway. Front Neurosci 2023, 17, 1059496. [Google Scholar] [CrossRef] [PubMed]
- Zhao, L.; Liu, S.; Wang, M.; Zhi, M.; Geng, X.; Hou, C.; Wang, W.; Zhao, D. Berberine Restored Nitrergic and Adrenergic Function in Mesenteric and Iliac Arteries from Streptozotocin-Induced Diabetic Rats. J Ethnopharmacol 2019, 244. [Google Scholar] [CrossRef]
- Mak, S.; Luk, W.W.K.; Cui, W.; Hu, S.; Tsim, K.W.K.; Han, Y. Synergistic Inhibition on Acetylcholinesterase by the Combination of Berberine and Palmatine Originally Isolated from Chinese Medicinal Herbs. J Mol Neurosci 2014, 53, 511–516. [Google Scholar] [CrossRef]
- Campbell, K.J.; Tait, S.W.G. Targeting BCL-2 Regulated Apoptosis in Cancer. Open Biol 2018, 8. [Google Scholar] [CrossRef]
- Qian, S.; Wei, Z.; Yang, W.; Huang, J.; Yang, Y.; Wang, J. The Role of BCL-2 Family Proteins in Regulating Apoptosis and Cancer Therapy. Front Oncol 2022, 12. [Google Scholar] [CrossRef]
- Singh, R.; Letai, A.; Sarosiek, K. Regulation of Apoptosis in Health and Disease: The Balancing Act of BCL-2 Family Proteins. Nat Rev Mol Cell Biol 2019, 20, 175–193. [Google Scholar] [CrossRef]
- Li, J.; Li, O.; Kan, M.; Zhang, M.; Shao, D.; Pan, Y.; Zheng, H.; Zhang, X.; Chen, L.; Liu, S. Berberine Induces Apoptosis by Suppressing the Arachidonic Acid Metabolic Pathway in Hepatocellular Carcinoma. Mol Med Rep 2015, 12, 4572–4577. [Google Scholar] [CrossRef]
- Palma, T.V.; Lenz, L.S.; Bottari, N.B.; Pereira, A.; Schetinger, M.R.C.; Morsch, V.M.; Ulrich, H.; Pillat, M.M.; de Andrade, C.M. Berberine Induces Apoptosis in Glioblastoma Multiforme U87MG Cells via Oxidative Stress and Independent of AMPK Activity. Mol Biol Rep 2020, 47, 4393–4400. [Google Scholar] [CrossRef]
- Kuo, C.L.; Chou, C.C.; Yung, B.Y.M. Berberine Complexes with DNA in the Berberine-Induced Apoptosis in Human Leukemic HL-60 Cells. Cancer Lett 1995, 93, 193–200. [Google Scholar] [CrossRef]
- Berberine Hydrochloride Inhibits Cell Proliferation and Promotes Apoptosis of Non-Small Cell Lung Cancer via the Suppression of the MMP2 and Bcl-2/Bax Signaling Pathways Available online:. Available online: https://www.spandidos-publications.com/10.3892/ol.2018.8249 (accessed on 14 December 2023).
- Liu, Z.; Liu, Q.; Xu, B.; Wu, J.; Guo, C.; Zhu, F.; Yang, Q.; Gao, G.; Gong, Y.; Shao, C. Berberine Induces P53-Dependent Cell Cycle Arrest and Apoptosis of Human Osteosarcoma Cells by Inflicting DNA Damage. Mutation Research - Fundamental and Molecular Mechanisms of Mutagenesis 2009, 662, 75–83. [Google Scholar] [CrossRef]
- Xie, J.; Xu, Y.; Huang, X.; Chen, Y.; Fu, J.; Xi, M.; Wang, L. Berberine-Induced Apoptosis in Human Breast Cancer Cells Is Mediated by Reactive Oxygen Species Generation and Mitochondrial-Related Apoptotic Pathway. Tumor Biology 2015, 36, 1279–1288. [Google Scholar] [CrossRef]
- Liu, L.; Fan, J.; Ai, G.; Liu, J.; Luo, N.; Li, C.; Cheng, Z. Berberine in Combination with Cisplatin Induces Necroptosis and Apoptosis in Ovarian Cancer Cells. Biol Res 2019, 52, 37. [Google Scholar] [CrossRef]
- Yao, Z.; Wan, Y.; Li, B.; Zhai, C.; Yao, F.; Kang, Y.; Liu, Q.; Lin, D. Berberine Induces Mitochondrial-Mediated Apoptosis and Protective Autophagy in Human Malignant Pleural Mesothelioma NCI-H2452 Cells. Oncol Rep 2018, 40, 3603–3610. [Google Scholar] [CrossRef]
- Cao, C.; Su, M. Effects of Berberine on Glucose-Lipid Metabolism, Inflammatory Factors and Insulin Resistance in Patients with Metabolic Syndrome. Exp Ther Med 2019, 17, 3009. [Google Scholar] [CrossRef] [PubMed]
- Li, W.; Li, D.; Kuang, H.; Feng, X.; Ai, W.; Wang, Y.; Shi, S.; Chen, J.; Fan, R. Berberine Increases Glucose Uptake and Intracellular ROS Levels by Promoting Sirtuin 3 Ubiquitination. Biomedicine and Pharmacotherapy 2020, 121. [Google Scholar] [CrossRef] [PubMed]
- Liang, Y.; Xu, X.; Yin, M.; Zhang, Y.; Huang, L.; Chen, R.; Ni, J. Effects of Berberine on Blood Glucose in Patients with Type 2 Diabetes Mellitus: A Systematic Literature Review and a Meta-Analysis. Endocr J 2019, 66, 51–63. [Google Scholar] [CrossRef] [PubMed]
- Wang, Y.; Liu, Y.; Du, X.; Ma, H.; Yao, J. The Anti-Cancer Mechanisms of Berberine: A Review. Cancer Manag Res 2020, 12, 695–702. [Google Scholar] [CrossRef] [PubMed]
- Zhang, L.; Wu, X.; Yang, R.; Chen, F.; Liao, Y.; Zhu, Z.; Wu, Z.; Sun, X.; Wang, L. Effects of Berberine on the Gastrointestinal Microbiota. Front Cell Infect Microbiol 2020, 10. [Google Scholar] [CrossRef] [PubMed]
- Chen, C.; Yu, Z.; Li, Y.; Fichna, J.; Storr, M. Effects of Berberine in the Gastrointestinal Tract - a Review of Actions and Therapeutic Implications. Am J Chin Med (Gard City N Y) 2014, 42, 1053–1070. [Google Scholar] [CrossRef] [PubMed]
- Lee, S.; Lim, H.J.; Park, J.H.; Lee, K.S.; Jang, Y.; Park, H.Y. Berberine-Induced LDLR up-Regulation Involves JNK Pathway. Biochem Biophys Res Commun 2007, 362, 853–857. [Google Scholar] [CrossRef] [PubMed]
- Tian, E.; Sharma, G.; Dai, C. Neuroprotective Properties of Berberine: Molecular Mechanisms and Clinical Implications. Antioxidants 2023, 12, 1883. [Google Scholar] [CrossRef] [PubMed]
- Cheng, Z.; Kang, C.; Che, S.; Su, J.; Sun, Q.; Ge, T.; Guo, Y.; Lv, J.; Sun, Z.; Yang, W.; et al. Berberine: A Promising Treatment for Neurodegenerative Diseases. Front Pharmacol 2022, 13. [Google Scholar] [CrossRef]
- Huang, Q.; Ji, D.; Tian, X.; Ma, L.; Sun, X. Berberine Inhibits Erastin-Induced Ferroptosis of Mouse Hippocampal Neuronal Cells Possibly by Activating the Nrf2-HO-1/GPX4 Pathway. Journal of Southern Medical University 2022, 42, 937–943. [Google Scholar] [CrossRef]
- Wei, W.; Yao, J.X.; Zhang, T.T.; Wen, J.Y.; Zhang, Z.; Luo, Y.M.; Cao, Y.; Li, H. Network Pharmacology Reveals That Berberine May Function against Alzheimer’s Disease via the AKT Signaling Pathway. Front Neurosci 2023, 17, 1059496. [Google Scholar] [CrossRef] [PubMed]
- Mak, S.; Luk, W.W.K.; Cui, W.; Hu, S.; Tsim, K.W.K.; Han, Y. Synergistic Inhibition on Acetylcholinesterase by the Combination of Berberine and Palmatine Originally Isolated from Chinese Medicinal Herbs. J Mol Neurosci 2014, 53, 511–516. [Google Scholar] [CrossRef]
- GU, Y.; ZHOU, Z. Berberine Inhibits the Proliferation, Invasion and Migration of Endometrial Stromal Cells by Downregulating MiR-429. Mol Med Rep 2021, 23. [Google Scholar] [CrossRef] [PubMed]
- Li, Q.; Qing, L.; Xu, W.; Yang, Y.; You, C.; Lao, Y.; Dong, Z. Berberine Affects the Proliferation, Migration, Invasion, Cell Cycle, and Apoptosis of Bladder Cancer Cells T24 and 5637 by Down-Regulating the HER2/PI3K/AKT Signaling Pathway. Arch Esp Urol 2023, 76, 152–160. [Google Scholar] [CrossRef]
- Burkina, V.; Rasmussen, M.K.; Pilipenko, N.; Zamaratskaia, G. Comparison of Xenobiotic-Metabolising Human, Porcine, Rodent, and Piscine Cytochrome P450. Toxicology 2017, 375, 10–27. [Google Scholar] [CrossRef] [PubMed]
- Liu, Z.; Liu, Q.; Xu, B.; Wu, J.; Guo, C.; Zhu, F.; Yang, Q.; Gao, G.; Gong, Y.; Shao, C. Berberine Induces P53-Dependent Cell Cycle Arrest and Apoptosis of Human Osteosarcoma Cells by Inflicting DNA Damage. Mutation Research - Fundamental and Molecular Mechanisms of Mutagenesis 2009, 662, 75–83. [Google Scholar] [CrossRef]
- Khan, M.; Giessrigl, B.; Vonach, C.; Madlener, S.; Prinz, S.; Herbaceck, I.; Hölzl, C.; Bauer, S.; Viola, K.; Mikulits, W.; et al. Berberine and a Berberis Lycium Extract Inactivate Cdc25A and Induce α-Tubulin Acetylation That Correlate with HL-60 Cell Cycle Inhibition and Apoptosis. Mutation Research/Fundamental and Molecular Mechanisms of Mutagenesis 2010, 683, 123–130. [Google Scholar] [CrossRef]
- Liu, J.F.; Lai, K.C.; Peng, S.F.; Maraming, P.; Huang, Y.P.; Huang, A.C.; Chueh, F.S.; Huang, W.W.; Chung, J.G. Berberine Inhibits Human Melanoma A375.S2 Cell Migration and Invasion via Affecting the FAK, UPA, and NF-ΚB Signaling Pathways and Inhibits PLX4032 Resistant A375.S2 Cell Migration in Vitro. Molecules 2018, 23. [Google Scholar] [CrossRef]
- Yang, L.J.; He, J.B.; Jiang, Y.; Li, J.; Zhou, Z.W.; Zhang, C.; Tao, X.; Chen, A.F.; Peng, C.; Xie, H.H. Berberine Hydrochloride Inhibits Migration Ability via Increasing Inducible NO Synthase and Peroxynitrite in HTR-8/SVneo Cells. J Ethnopharmacol 2023, 305. [Google Scholar] [CrossRef]
- Tarawneh, N.; Hamadneh, L.; Abu-Irmaileh, B.; Shraideh, Z.; Bustanji, Y.; Abdalla, S. Berberine Inhibited Growth and Migration of Human Colon Cancer Cell Lines by Increasing Phosphatase and Tensin and Inhibiting Aquaporins 1, 3 and 5 Expressions. Molecules 2023, 28, 3823. [Google Scholar] [CrossRef]
- Srinivas, U.S.; Tan, B.W.Q.; Vellayappan, B.A.; Jeyasekharan, A.D. ROS and the DNA Damage Response in Cancer. Redox Biol 2019, 25. [Google Scholar] [CrossRef] [PubMed]
- Sarmiento-Salinas, F.L.; Perez-Gonzalez, A.; Acosta-Casique, A.; Ix-Ballote, A.; Diaz, A.; Treviño, S.; Rosas-Murrieta, N.H.; Millán-Perez-Peña, L.; Maycotte, P. Reactive Oxygen Species: Role in Carcinogenesis, Cancer Cell Signaling and Tumor Progression. Life Sci 2021, 284, 119942. [Google Scholar] [CrossRef] [PubMed]
- Kassab, R.B.; Vasicek, O.; Ciz, M.; Lojek, A.; Perecko, T. The Effects of Berberine on Reactive Oxygen Species Production in Human Neutrophils and in Cell-Free Assays. Interdiscip Toxicol 2017, 10, 61. [Google Scholar] [CrossRef] [PubMed]
- Lv, X.X.; Yu, X.H.; Wang, H.D.; Yan, Y.X.; Wang, Y.P.; Lu, D.X.; Qi, R. Bin; Hu, C.F.; Li, H.M. Berberine Inhibits Norepinephrine-Induced Apoptosis in Neonatal Rat Cardiomyocytes via Inhibiting ROS-TNF-α-Caspase Signaling Pathway. Chin J Integr Med 2013, 19, 424–431. [Google Scholar] [CrossRef] [PubMed]
- Sun, Y.; Yuan, X.; Zhang, F.; Han, Y.; Chang, X.; Xu, X.; Li, Y.; Gao, X. Berberine Ameliorates Fatty Acid-Induced Oxidative Stress in Human Hepatoma Cells. Scientific Reports 2017 7:1 2017, 7, 1–11. [Google Scholar] [CrossRef] [PubMed]
- Dong, S.F.; Yasui, N.; Negishi, H.; Kishimoto, A.; Sun, J.N.; Ikeda, K. Increased Oxidative Stress in Cultured 3T3-L1 Cells Was Attenuated by Berberine Treatment. Nat Prod Commun 2015, 10. [Google Scholar] [CrossRef]
- Wen, L.; Han, Z.; Li, J.; Du, Y. C-MYC and HIF1α Promoter G-Quadruplexes Dependent Metabolic Regulation Mechanism of Berberine in Colon Cancer. J Gastrointest Oncol 2022, 13, 1152–1168. [Google Scholar] [CrossRef]
- Rauf, A.; Abu-Izneid, T.; Khalil, A.A.; Imran, M.; Shah, Z.A.; Bin Emran, T.; Mitra, S.; Khan, Z.; Alhumaydhi, F.A.; Aljohani, A.S.M.; et al. Berberine as a Potential Anticancer Agent: A Comprehensive Review. Molecules 2021, Vol. 26, Page 7368 2021, 26, 7368. [Google Scholar] [CrossRef]
- Almatroodi, S.A.; Alsahli, M.A.; Rahmani, A.H. Berberine: An Important Emphasis on Its Anticancer Effects through Modulation of Various Cell Signaling Pathways. Molecules 2022, 27. [Google Scholar] [CrossRef]
- Ho, Y.; Lu, C.-C.; Yang, J.-S.; Chiang, J.-H.; Li, T.-C.; Ip, S.; Hsia, T.; Liao, C.; Lin, J.-G.; Wood, W.; et al. Berberine Induced Apoptosis via Promoting the Expression of Caspase-8, -9 and -3, Apoptosis-Inducing Factor and Endonuclease G in SCC-4 Human Tongue Squamous Carcinoma Cancer Cells. Anticancer Res 2009. [Google Scholar]
- Li, J.; Li, O.; Kan, M.; Zhang, M.; Shao, D.; Pan, Y.; Zheng, H.; Zhang, X.; Chen, L.; Liu, S. Berberine Induces Apoptosis by Suppressing the Arachidonic Acid Metabolic Pathway in Hepatocellular Carcinoma. Mol Med Rep 2015, 12, 4572–4577. [Google Scholar] [CrossRef] [PubMed]
- Liu, L.; Fan, J.; Ai, G.; Liu, J.; Luo, N.; Li, C.; Cheng, Z. Berberine in Combination with Cisplatin Induces Necroptosis and Apoptosis in Ovarian Cancer Cells. Biol Res 2019, 52, 37. [Google Scholar] [CrossRef] [PubMed]
- Kim, D.-Y.; Kim, S.-H.; Cheong, H.-T.; Ra, C.-S.; Rhee, K.-J.; Jung, B.D. Berberine Induces P53-Dependent Apoptosis through Inhibition of DNA Methyltransferase3b in Hep3B Cells. Korean Journal of Clinical Laboratory Science 2020, 52, 69–77. [Google Scholar] [CrossRef]
- Palma, T.V.; Lenz, L.S.; Bottari, N.B.; Pereira, A.; Schetinger, M.R.C.; Morsch, V.M.; Ulrich, H.; Pillat, M.M.; de Andrade, C.M. Berberine Induces Apoptosis in Glioblastoma Multiforme U87MG Cells via Oxidative Stress and Independent of AMPK Activity. Mol Biol Rep 2020, 47, 4393–4400. [Google Scholar] [CrossRef]
Figure 1.
HPLC chromatogram of a representative Berberis aristata DC. bark extract recorded at 346 nm. The main peak (retention time 5.7 min) is related to berberine (BER); at 5.0 min there is jatrorrhizine (JTR). Among these two molecules, at 5.3 min, two partially overlapped peaks are present, attributed to berberrubine (BBR) and palmatine (PLM).
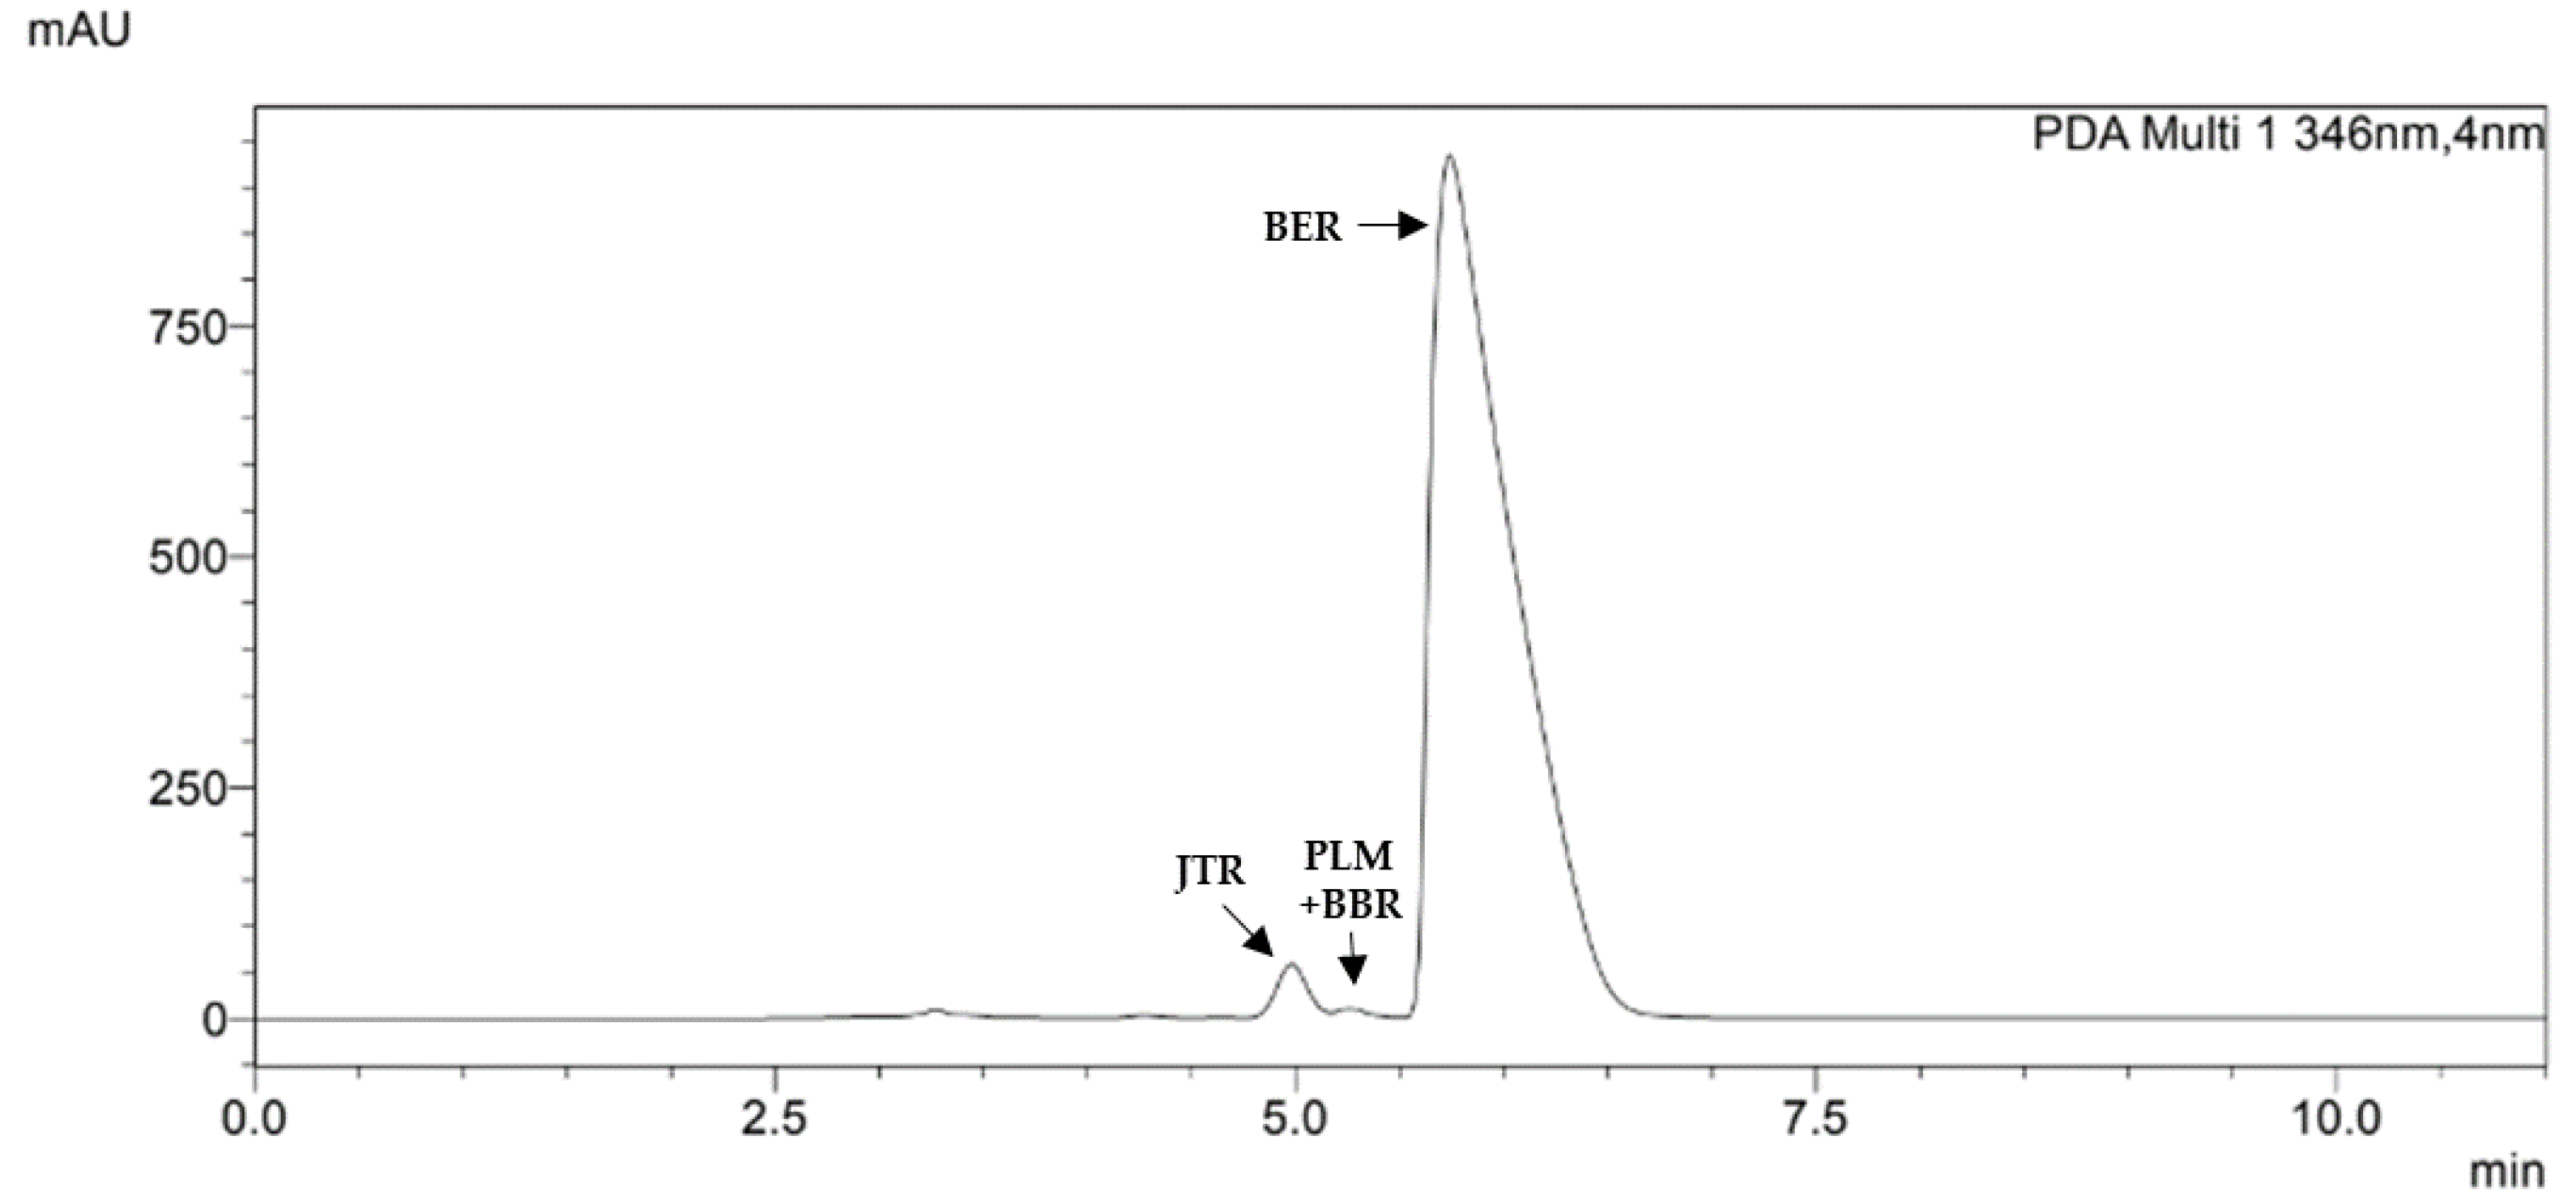
Figure 2.
Representative HPLC chromatogram of Berberis aristata DC. bark extract containing 85% of berberine hydrochloride dry basis before (A) and after (B) simulated digestion, recorded at 346 nm.
Figure 2.
Representative HPLC chromatogram of Berberis aristata DC. bark extract containing 85% of berberine hydrochloride dry basis before (A) and after (B) simulated digestion, recorded at 346 nm.
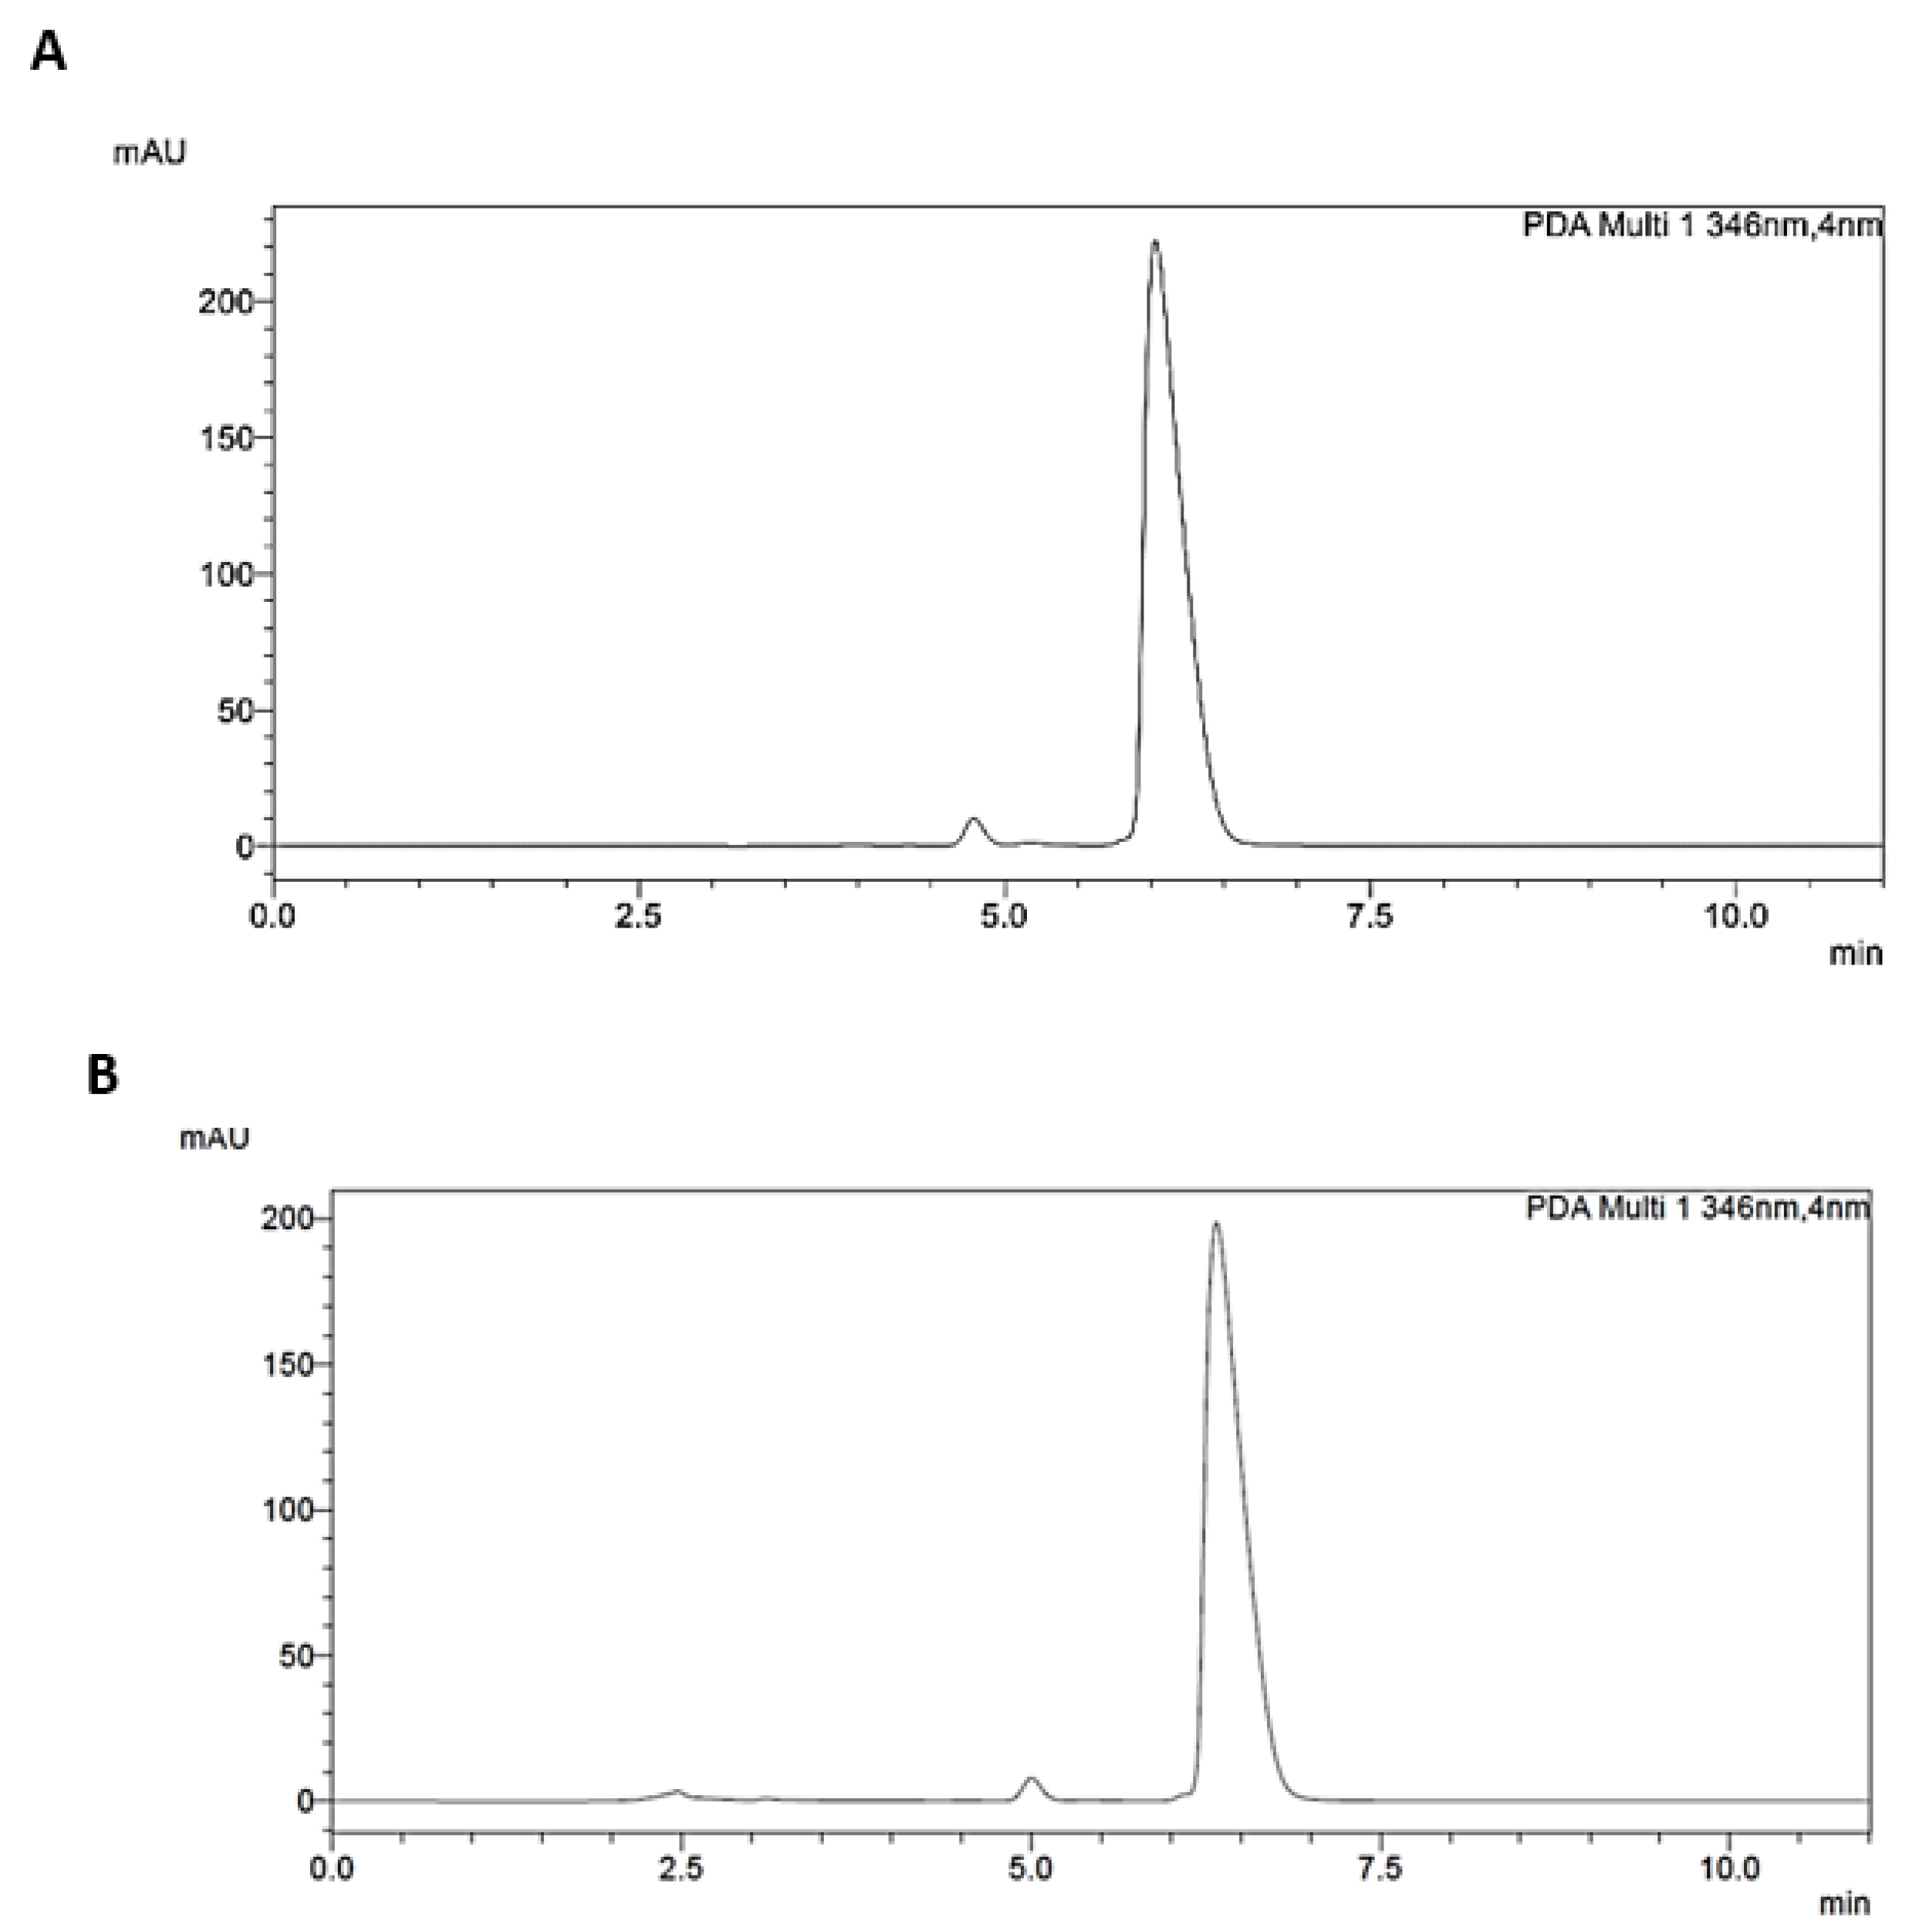
Figure 3.
computational analysis of berberine pharmacokinetic properties by means of SwissADME tool (http://www.swissadme.ch/).
Figure 3.
computational analysis of berberine pharmacokinetic properties by means of SwissADME tool (http://www.swissadme.ch/).
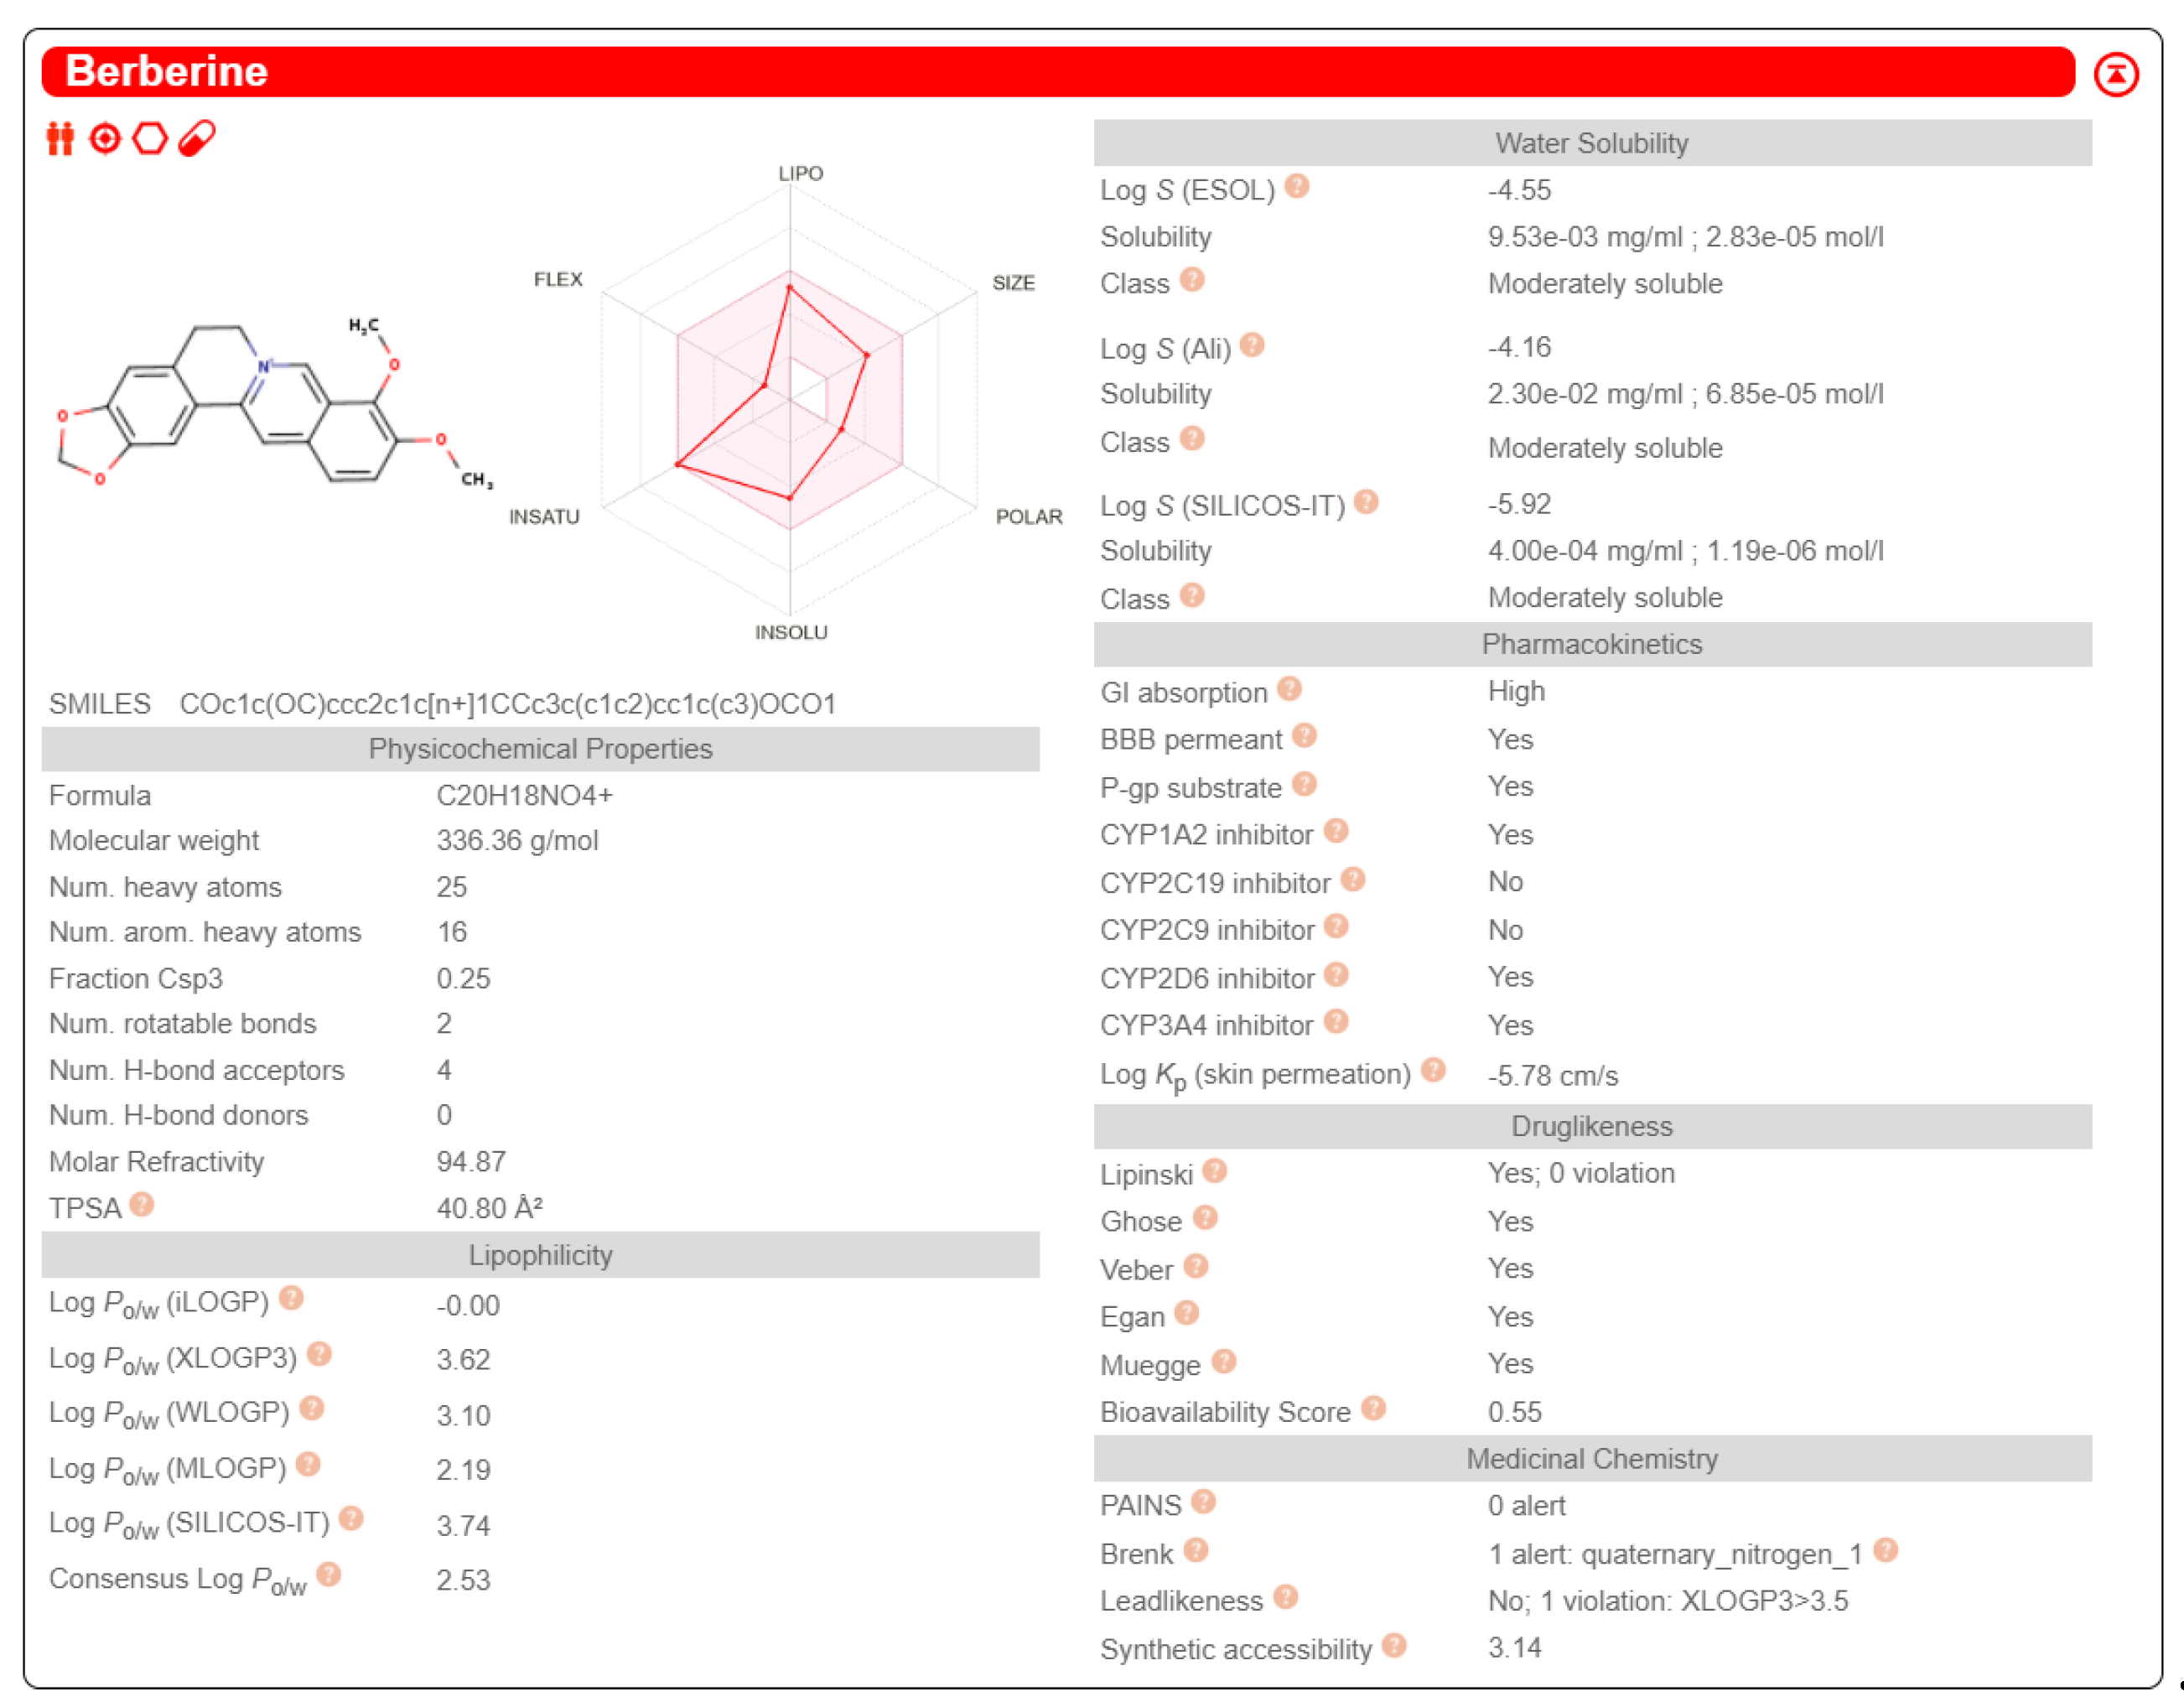
Figure 4.
The best score for analysis of target prediction for berberine as predicted by Genecards tool (https://www.genecards.org/). Predicted targets are very heterogeneous but mainly refer to the most studied biological activities of berberine.
Figure 4.
The best score for analysis of target prediction for berberine as predicted by Genecards tool (https://www.genecards.org/). Predicted targets are very heterogeneous but mainly refer to the most studied biological activities of berberine.
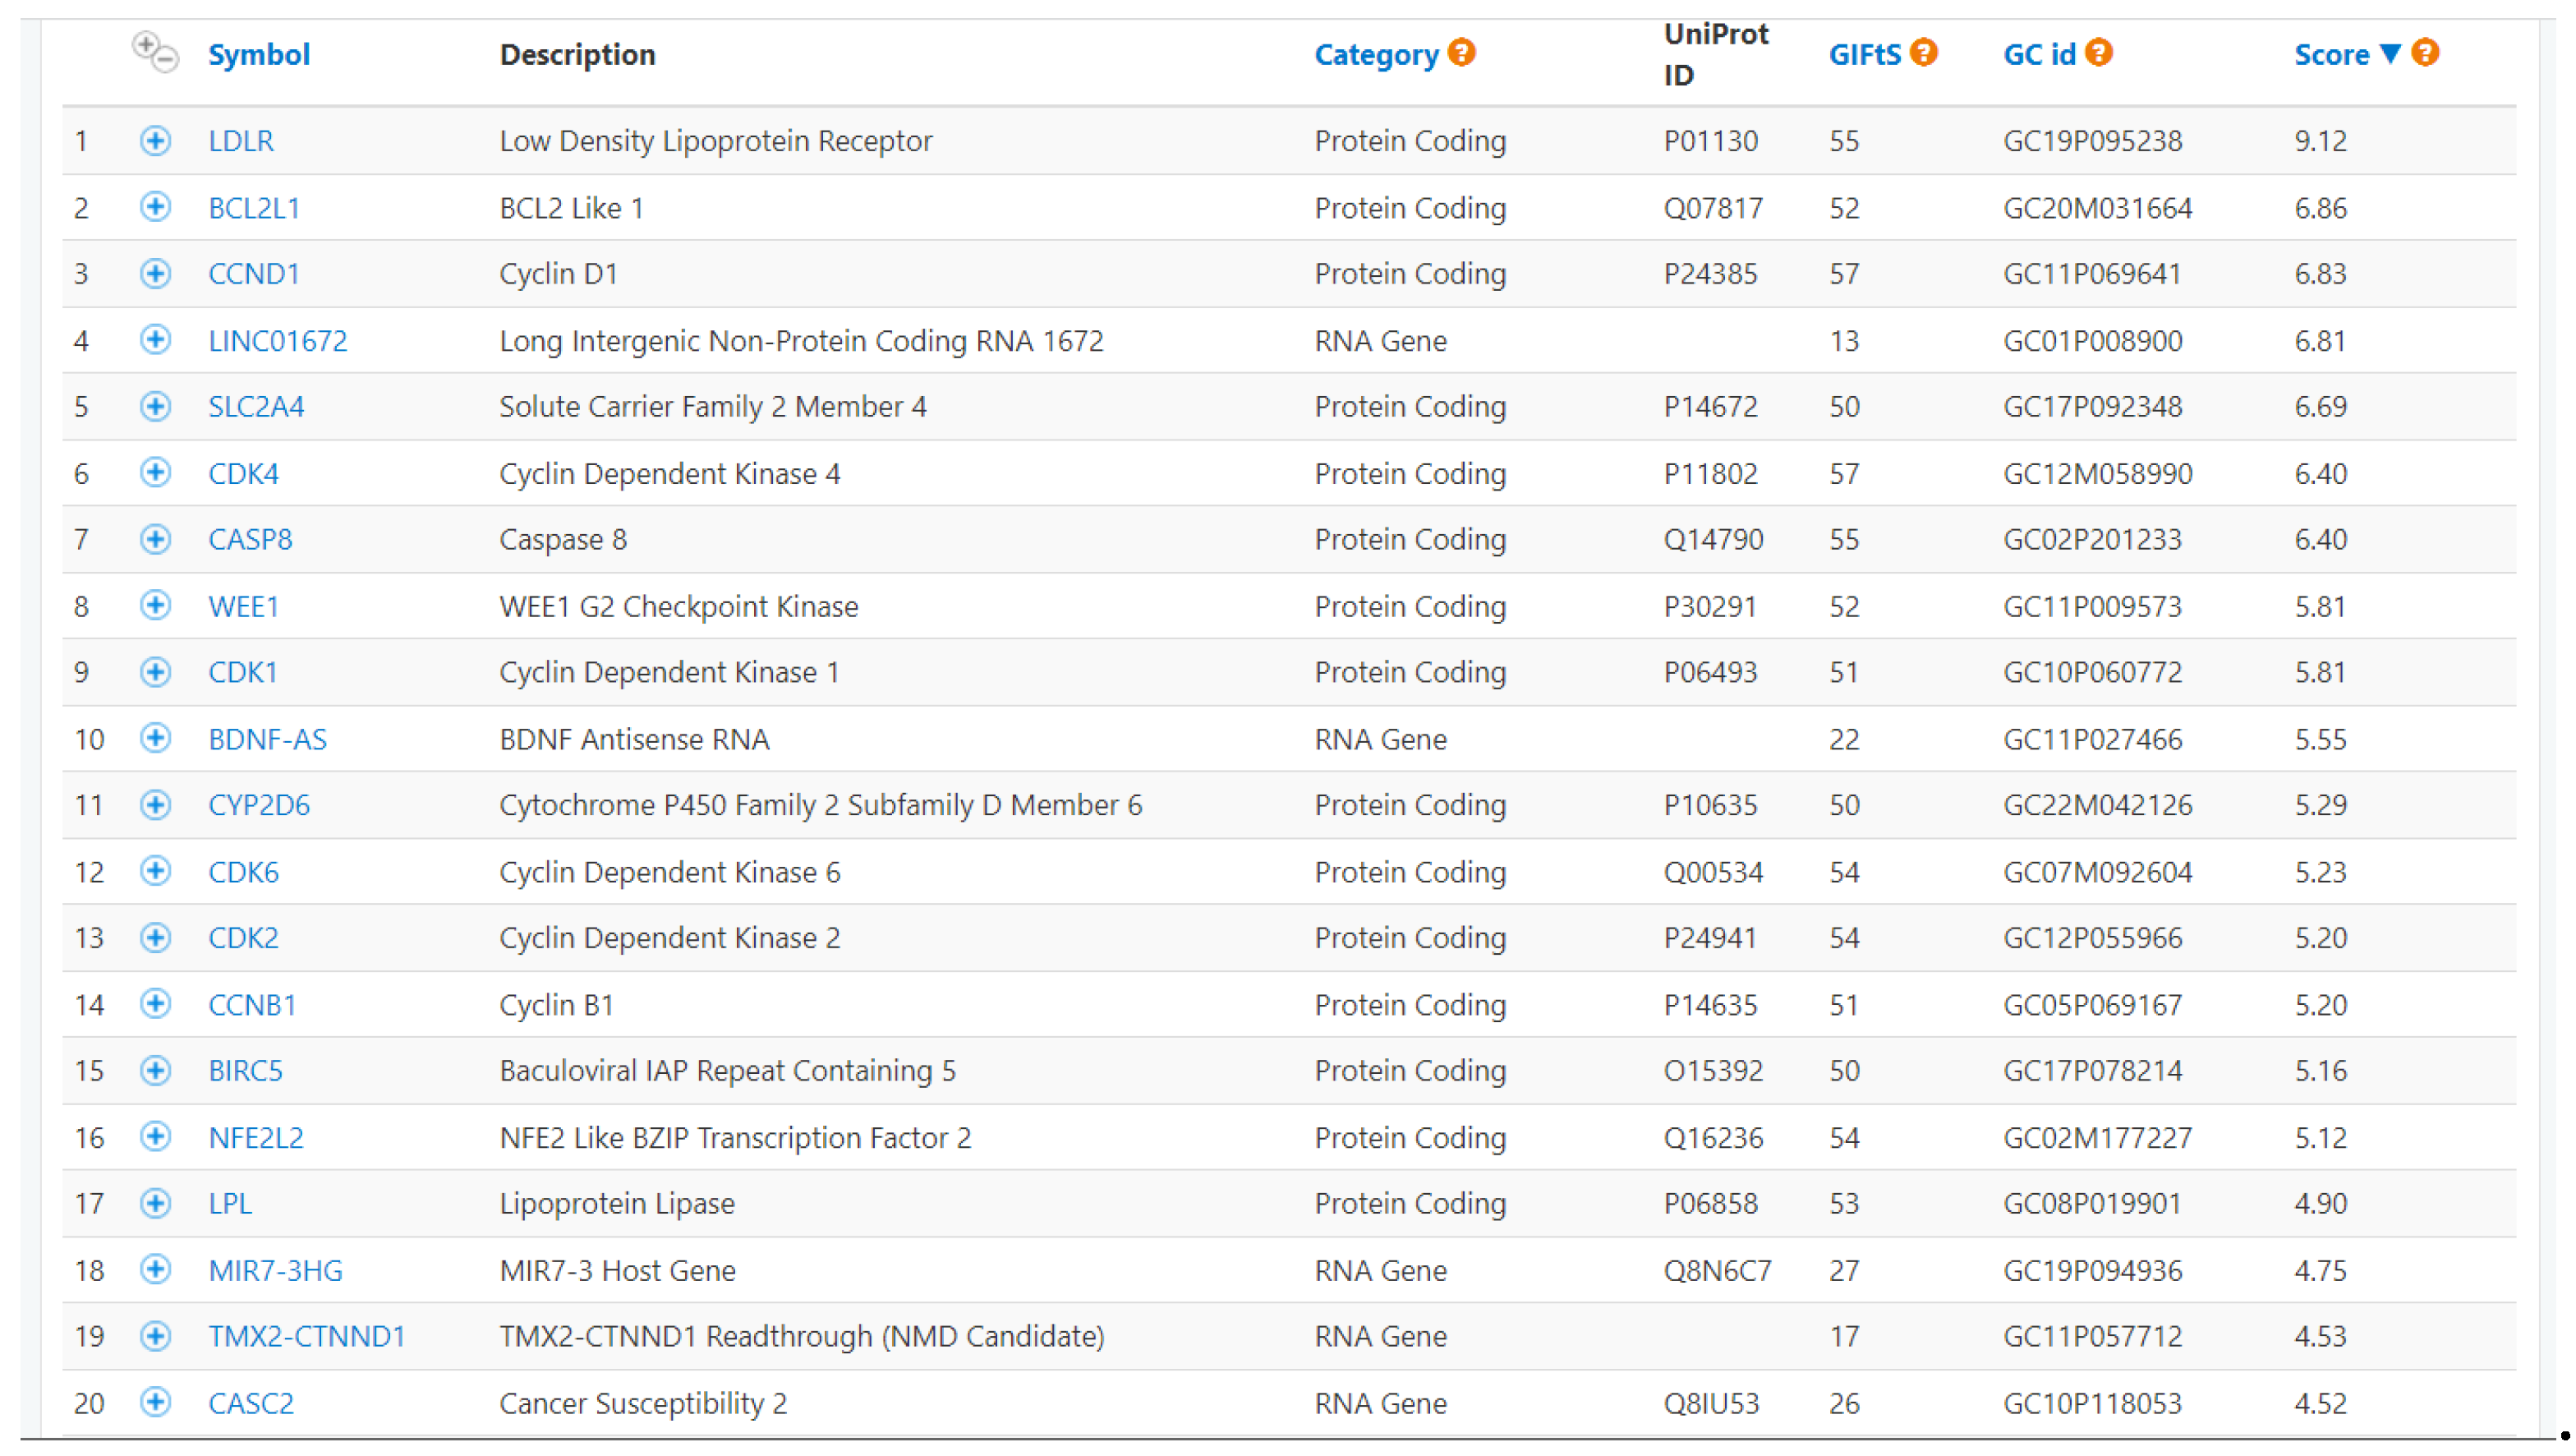
Figure 5.
Cell viability assay on HepG2 cells after 24h of treatment with different concentrations of (A) phenacetin, (B) dextromethorphan, (C) triazolam. Then, HepG2 cells were co-treated for 24h with phenacetin, dextromethorphan or triazolam at 20 µg/ml and B 97% at 50, 100 µg/ml (D) or B 85% at 50, 100 µg/ml (E) respectively. Each column represents mean ± SEM. Data were analyzed by one-way analysis of variance followed by post-hoc Dunnet: ***p<0.001****, p<0.0001 vs CTRL; **** p<0.0001 vs B 85% 50 mg/ml; *p< 0.05 vs B85% 100 mg/ml; n=4.
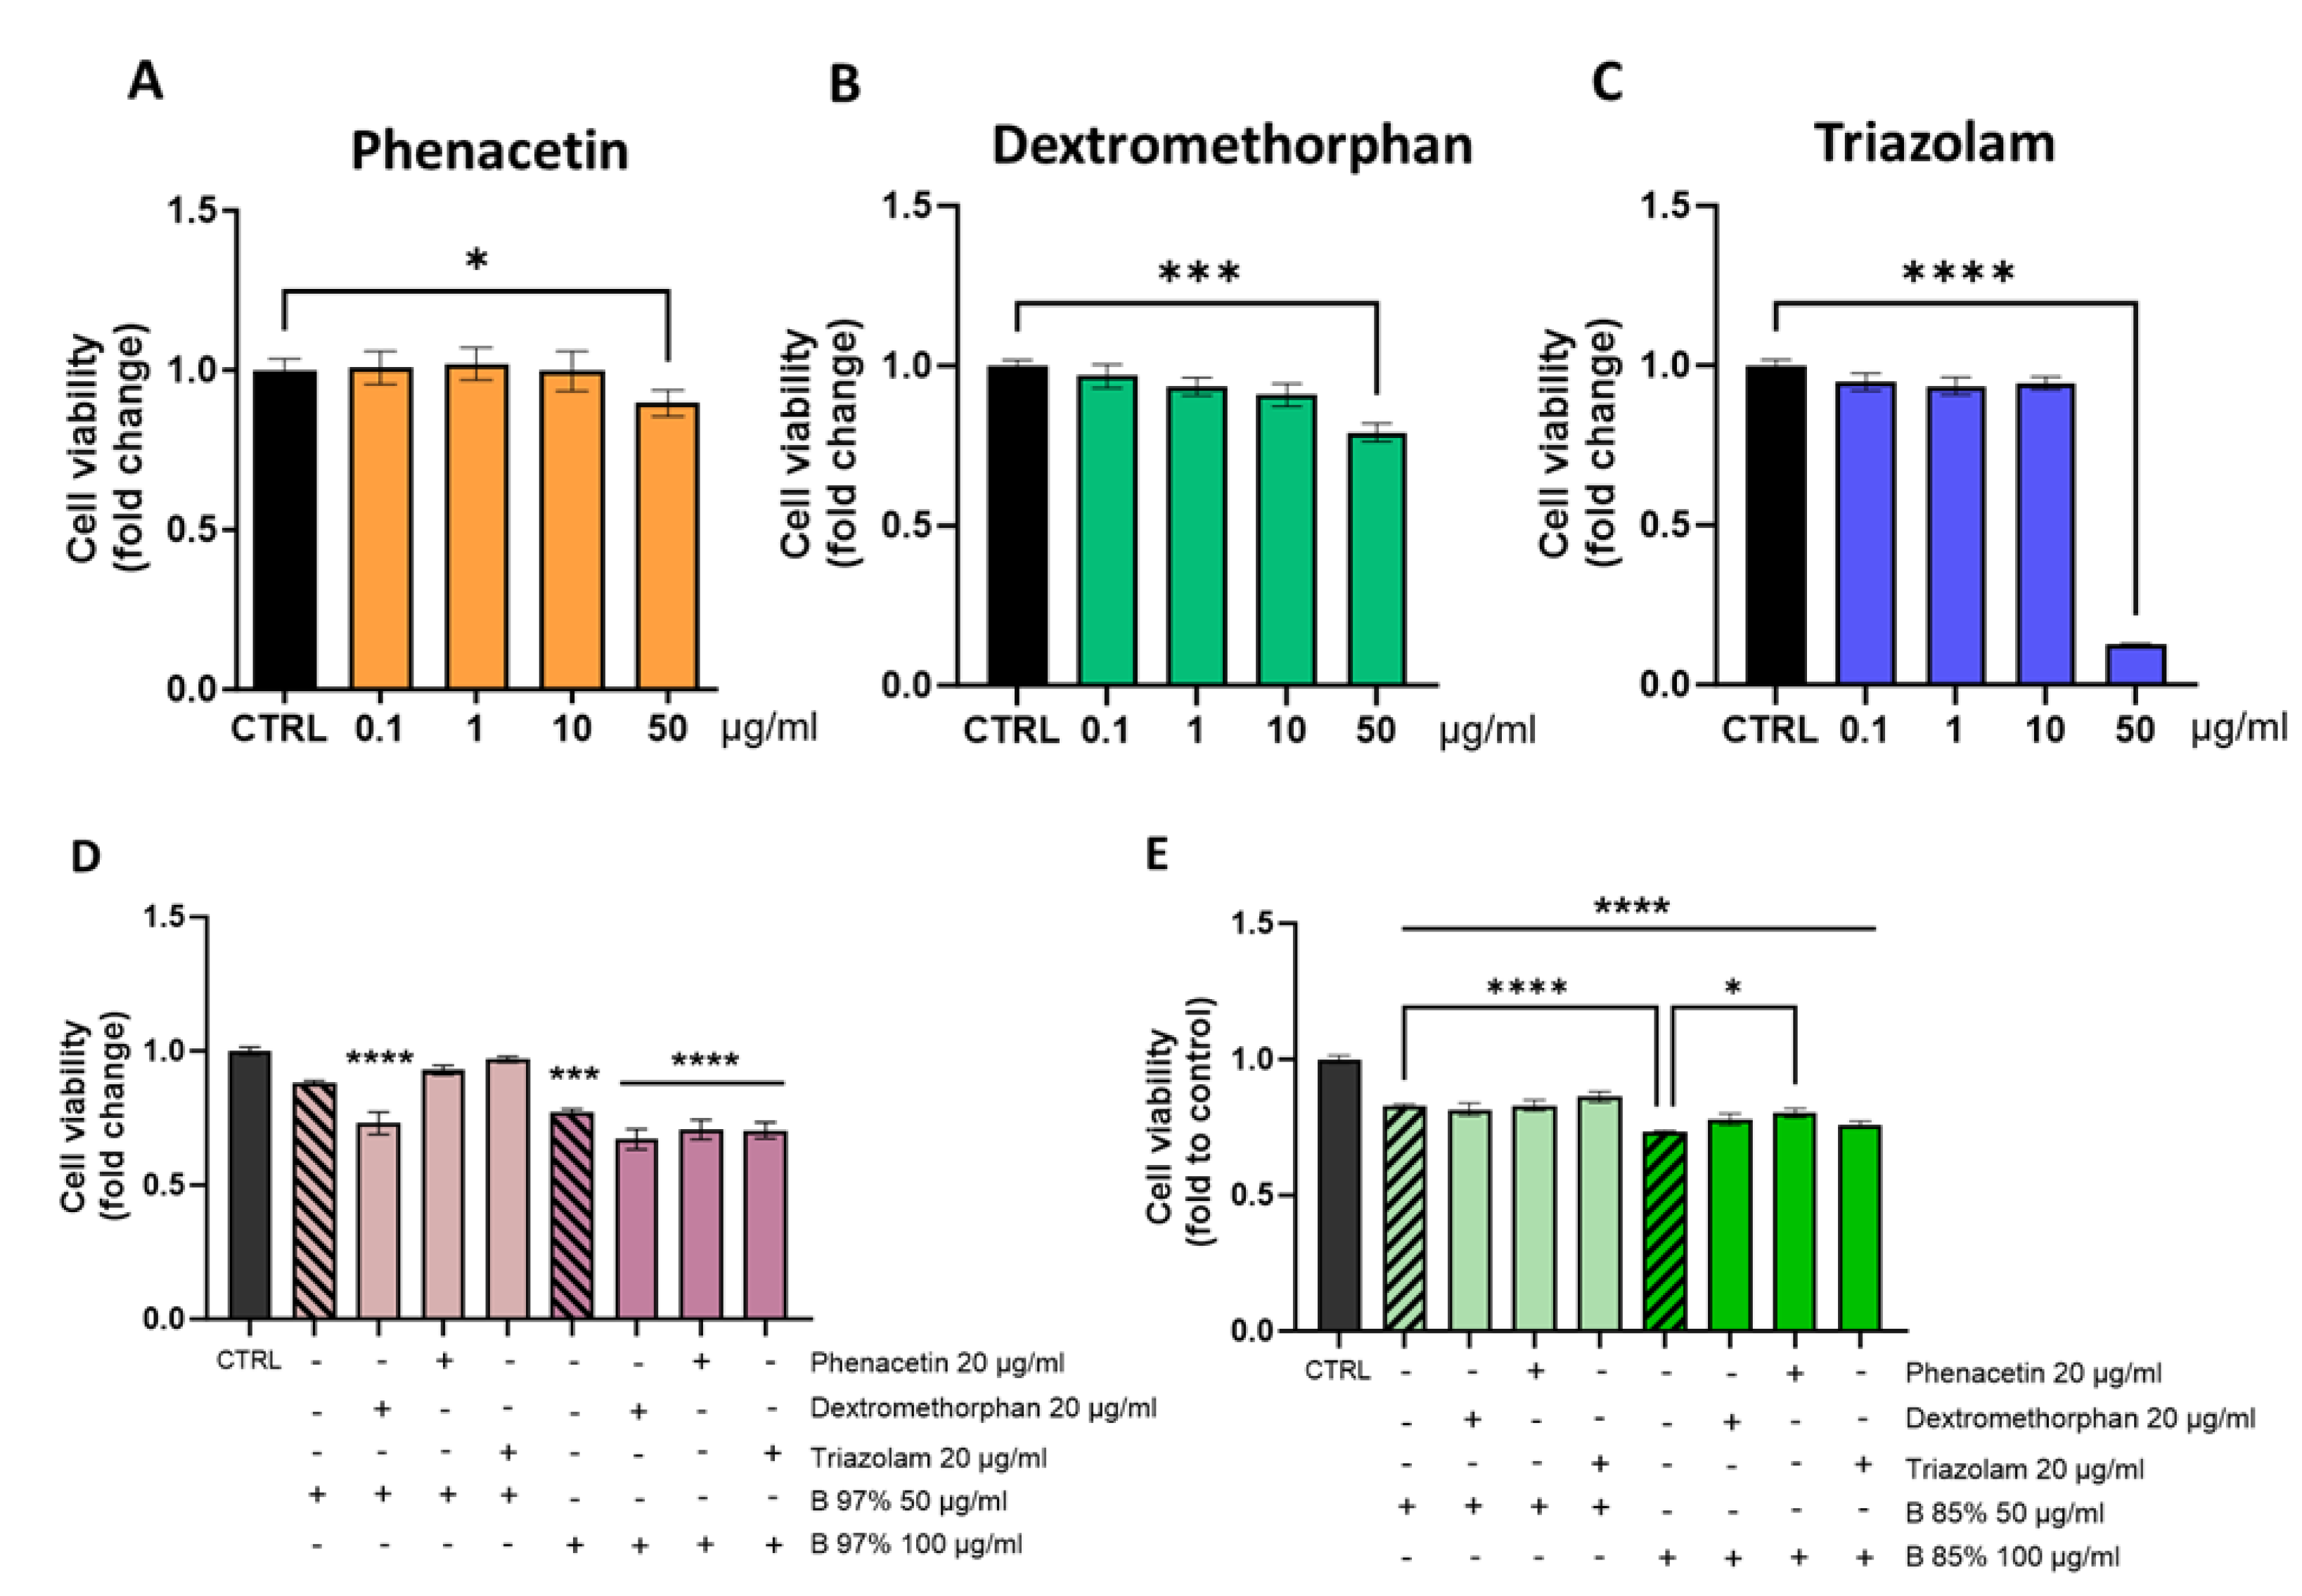
Figure 6.
Wound Healing assay on Caco-2 cells treated with B 97% and B 85% (10 and 100 µg/ml) for 48h or untreated (CTRL). Each column represents mean ± SEM. Data were analyzed by one-way analysis of variance: **p<0.01 vs CTRL; n=4.
Figure 6.
Wound Healing assay on Caco-2 cells treated with B 97% and B 85% (10 and 100 µg/ml) for 48h or untreated (CTRL). Each column represents mean ± SEM. Data were analyzed by one-way analysis of variance: **p<0.01 vs CTRL; n=4.
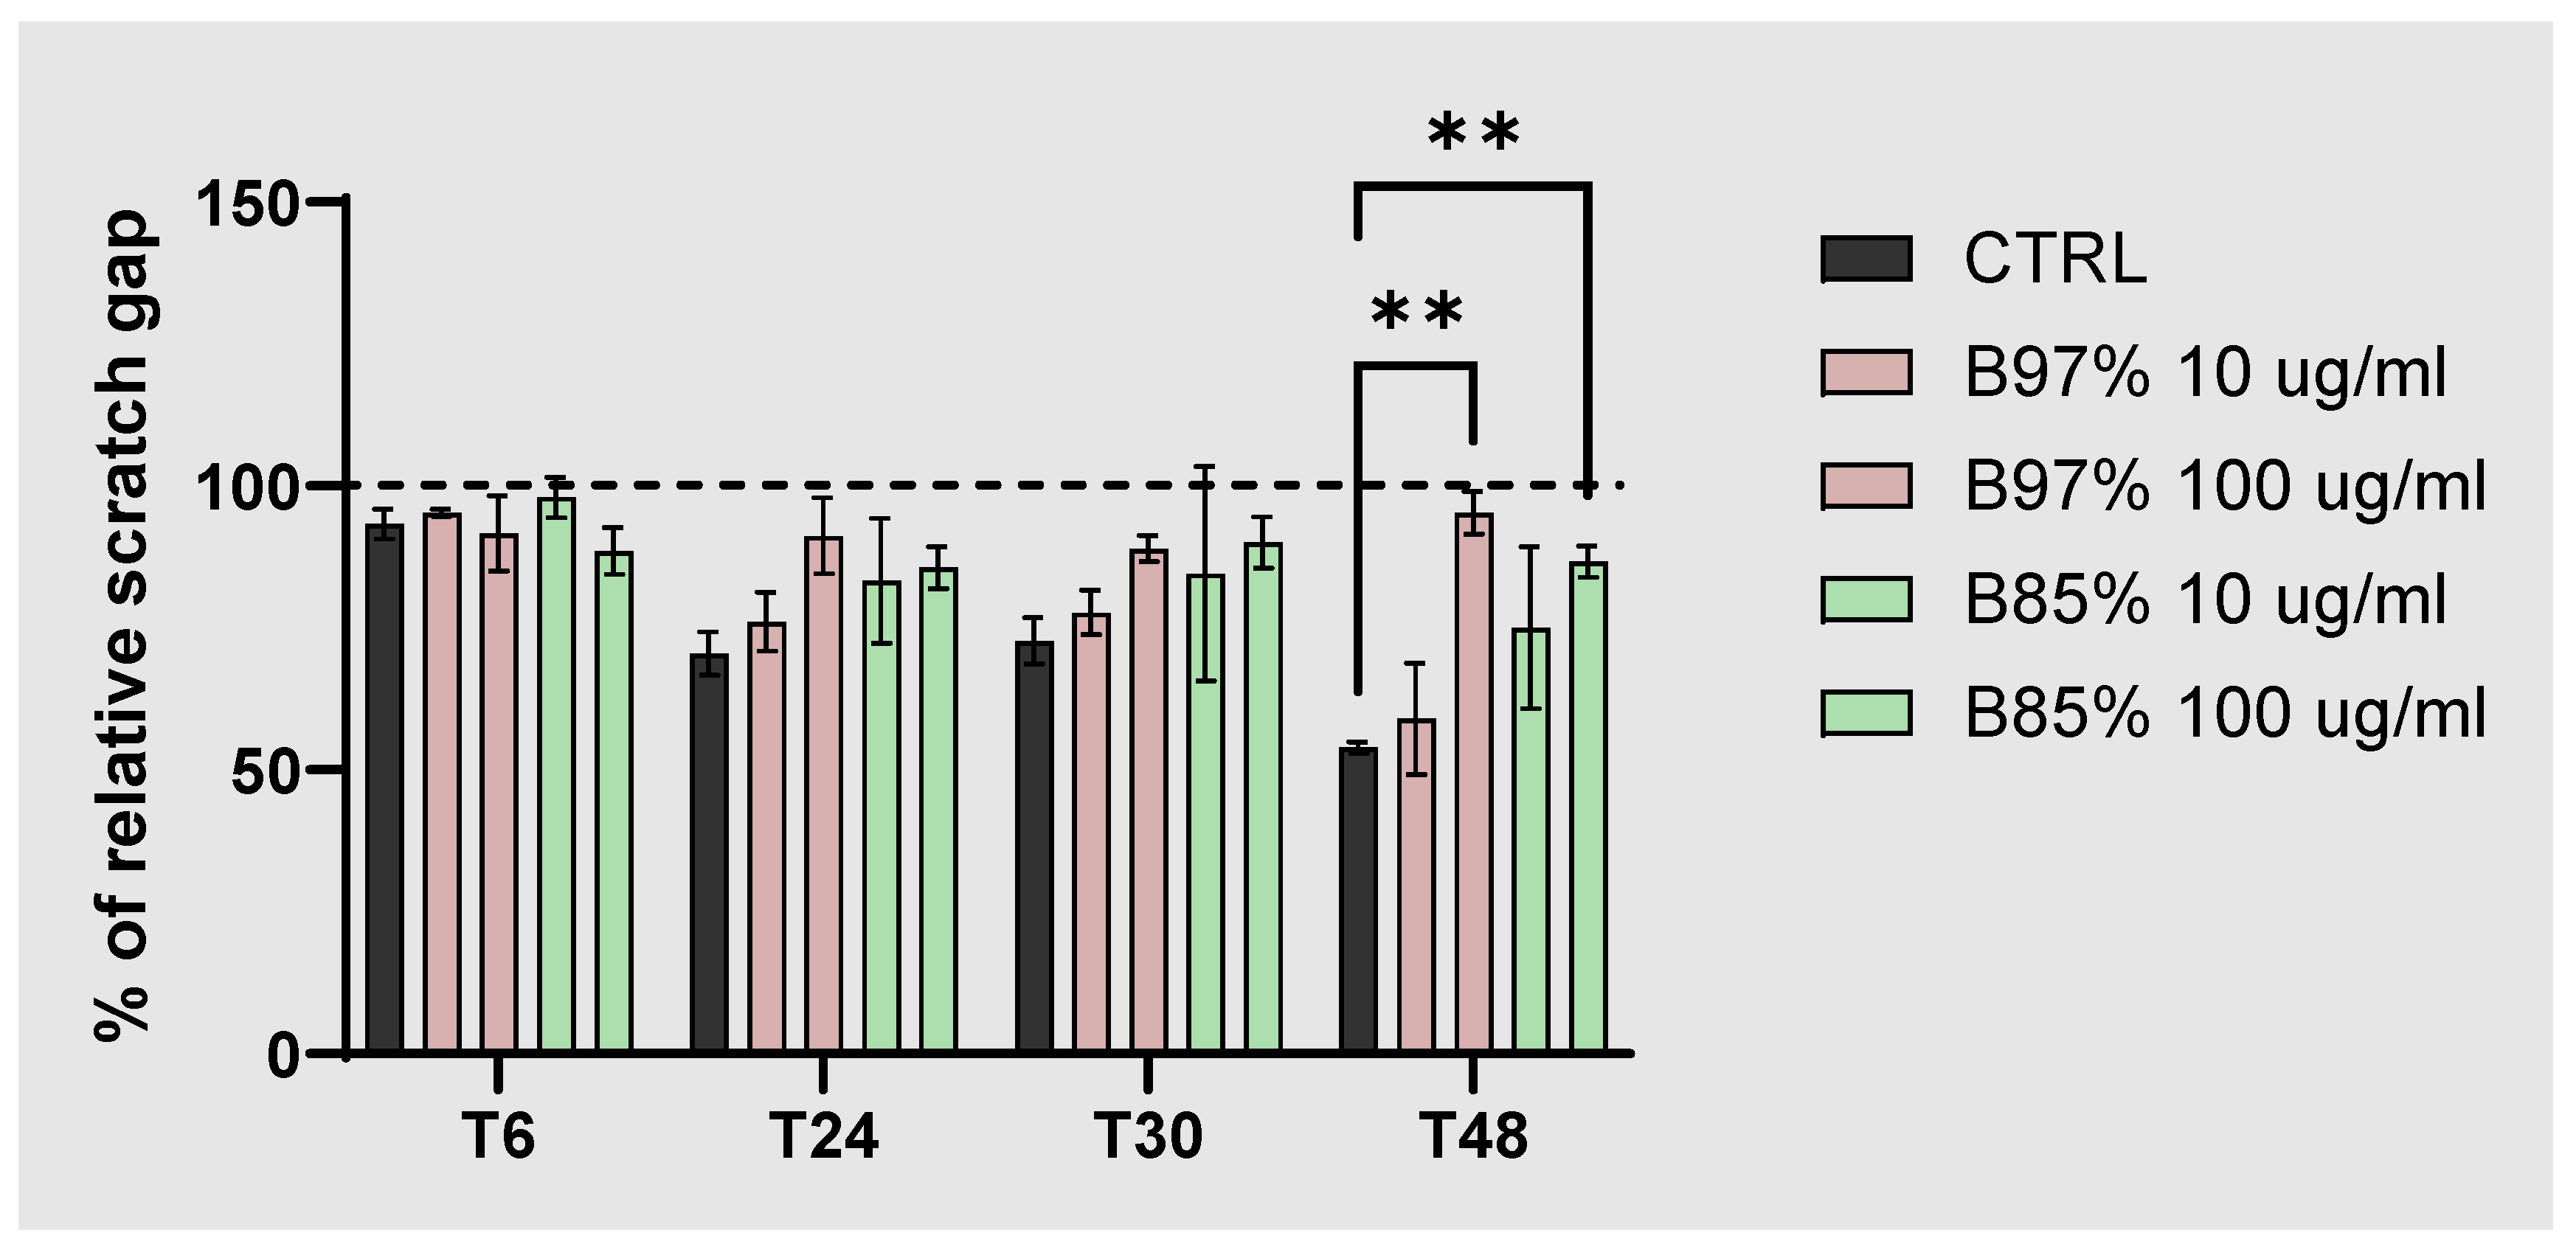
Figure 7.
Dosage of intracellular ROS in HEK293 cells treated with B 97% and B 85% at the concentrations of 10, 20, or 50 µg/ml for 24h. H2O2 (500 mM) was used as positive control (CTRL+). Each column represents mean ± SEM. Data were analyzed by one-way analysis of variance: *p<0.05, ****, p<0.0001 vs CTRL; n=8.
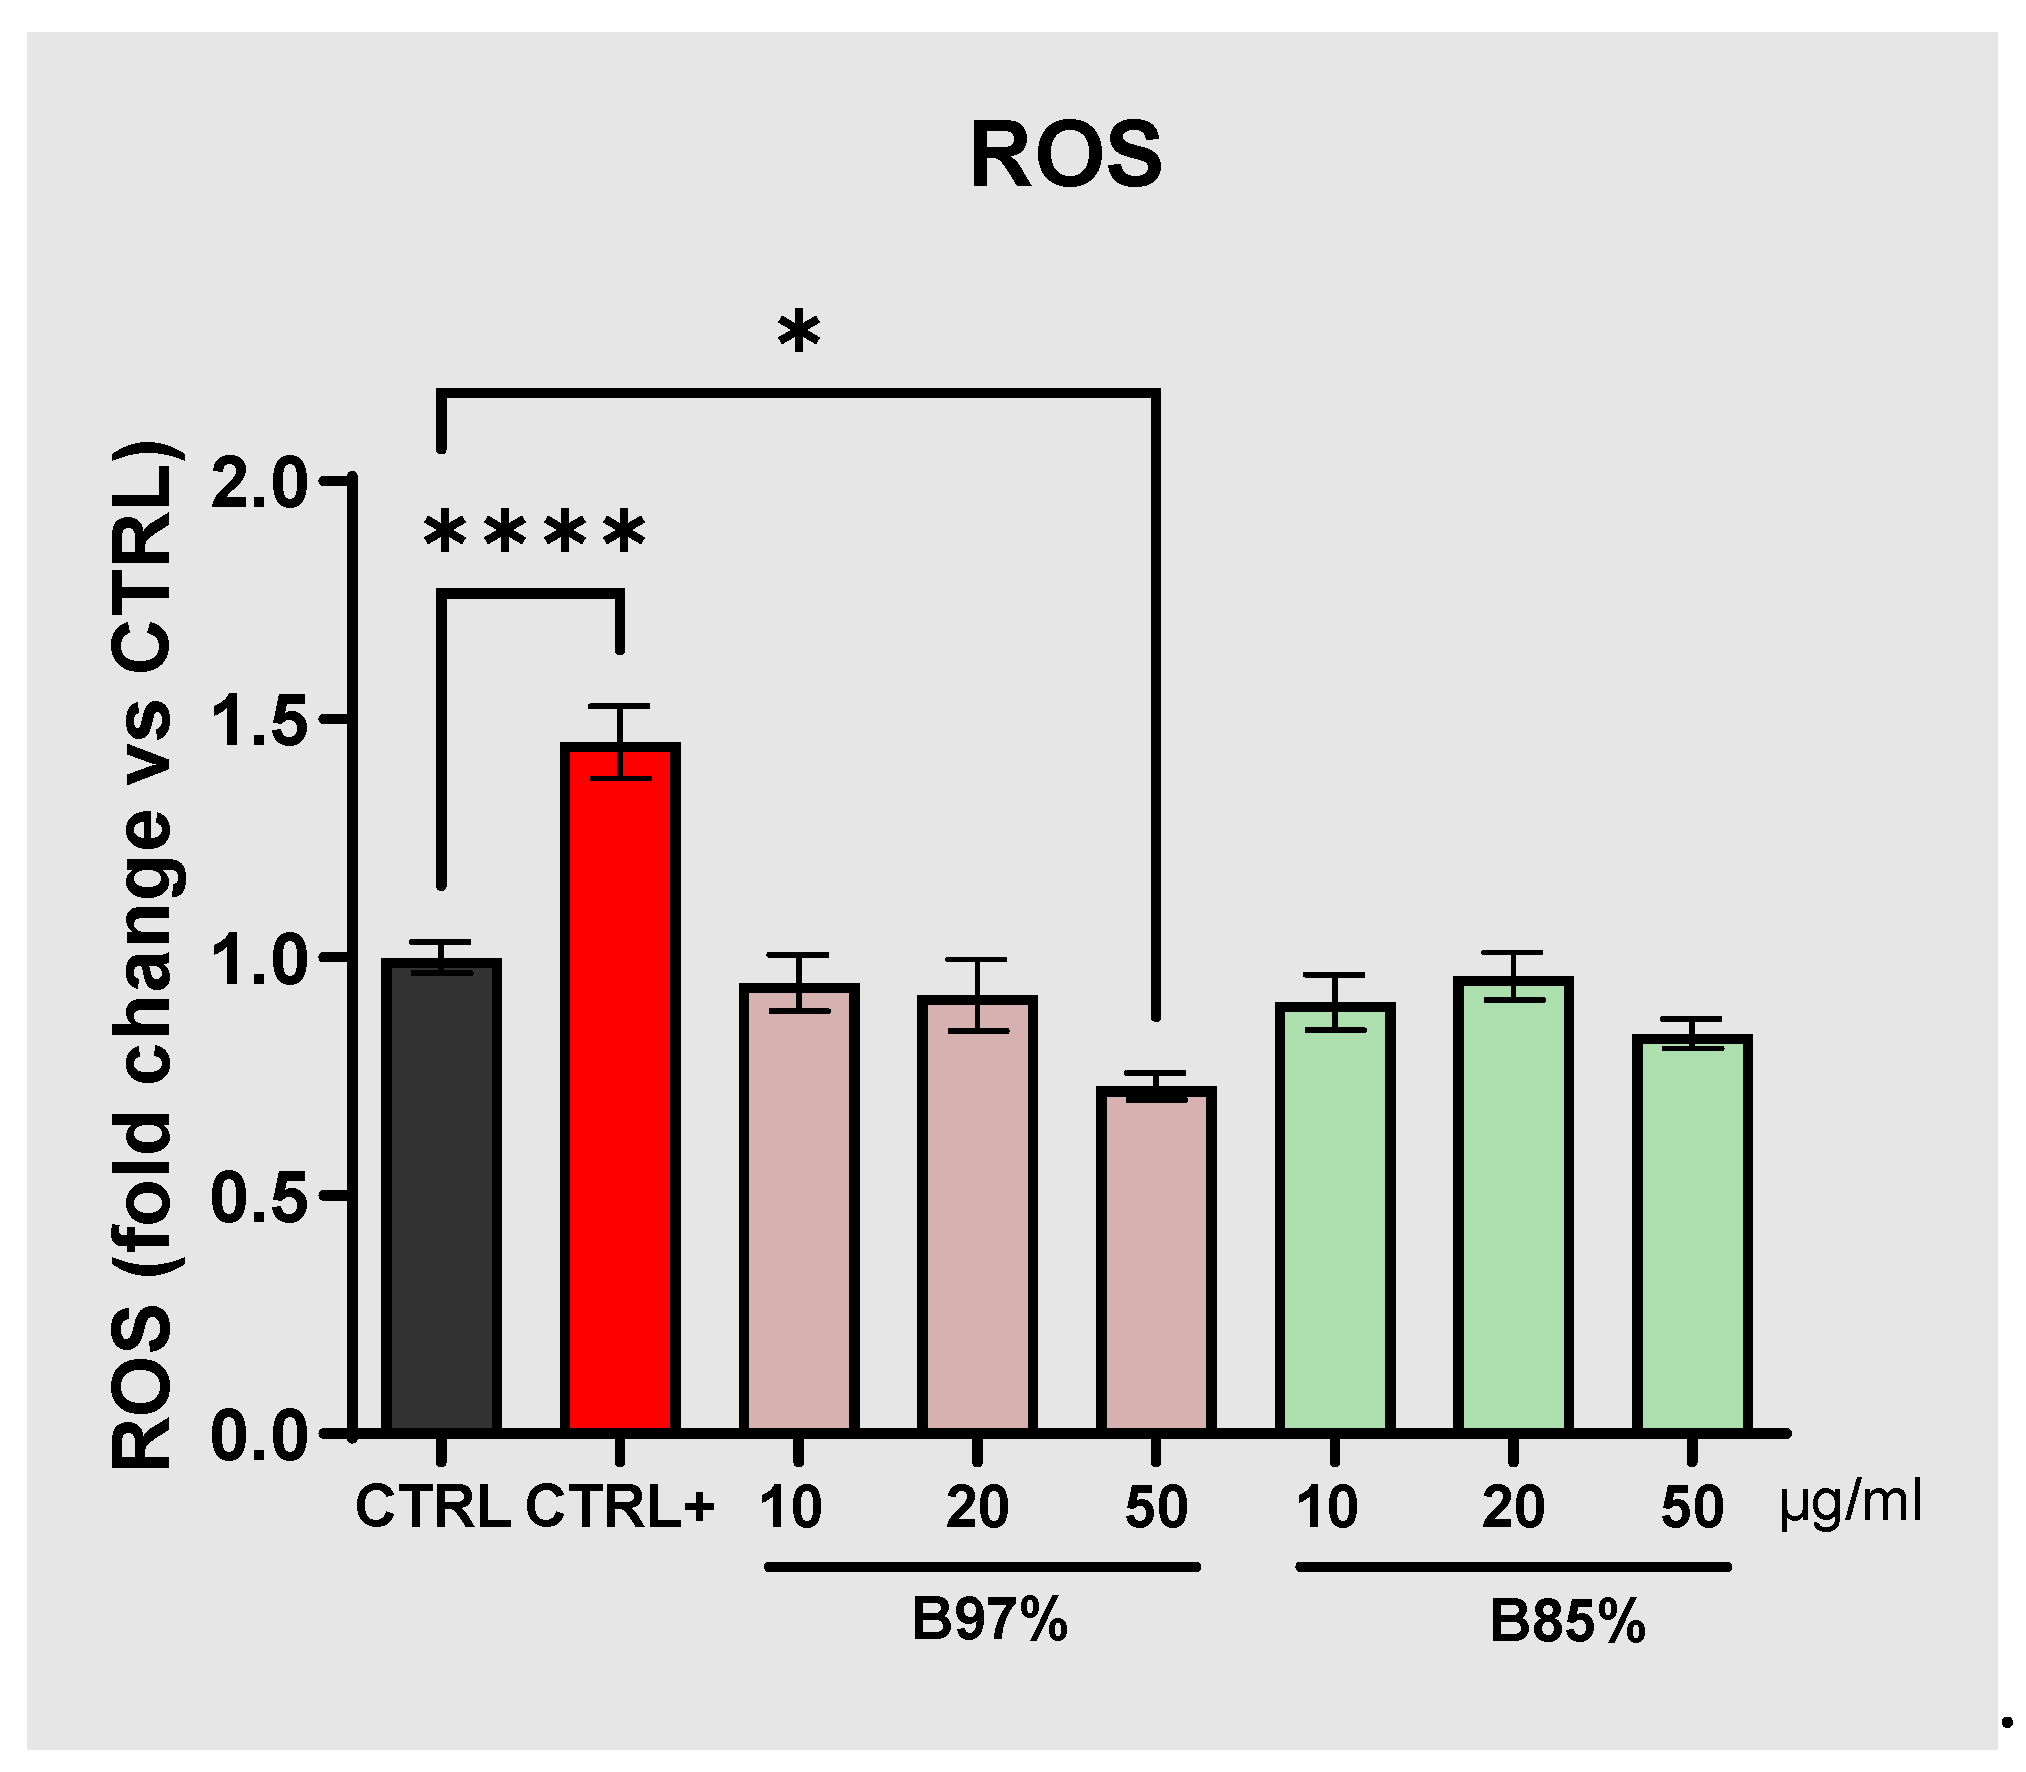
Figure 8.
RT-qPCR analysis of TP53 (A), MDM2 (B), n-MYC (C), c-MYC (D), HRAS (E) and MET (F) transcripts in HEK293 cells following treatment with B97% and B85% at 10 or 20 μg/ml. Each column represents mean ± SEM. Data were analyzed by one-way analysis of variance followed by Dunnet: *p <0 .05, **p < 0.01, ***p < 0.001, ****p < 0.0001 vs CTRL (n = 4).
Figure 9.
RT-qPCR analysis of CDKN1A (A) and CDK4 (B) transcripts in HEK293 cells following treatment with B97% and B85% at 10 or 20 μg/ml. Each column represents mean ± SEM. Data were analyzed by one-way analysis of variance followed by Dunnet: *p < 0.05, **p <0 .01 vs CTRL (n = 4).
Figure 9.
RT-qPCR analysis of CDKN1A (A) and CDK4 (B) transcripts in HEK293 cells following treatment with B97% and B85% at 10 or 20 μg/ml. Each column represents mean ± SEM. Data were analyzed by one-way analysis of variance followed by Dunnet: *p < 0.05, **p <0 .01 vs CTRL (n = 4).
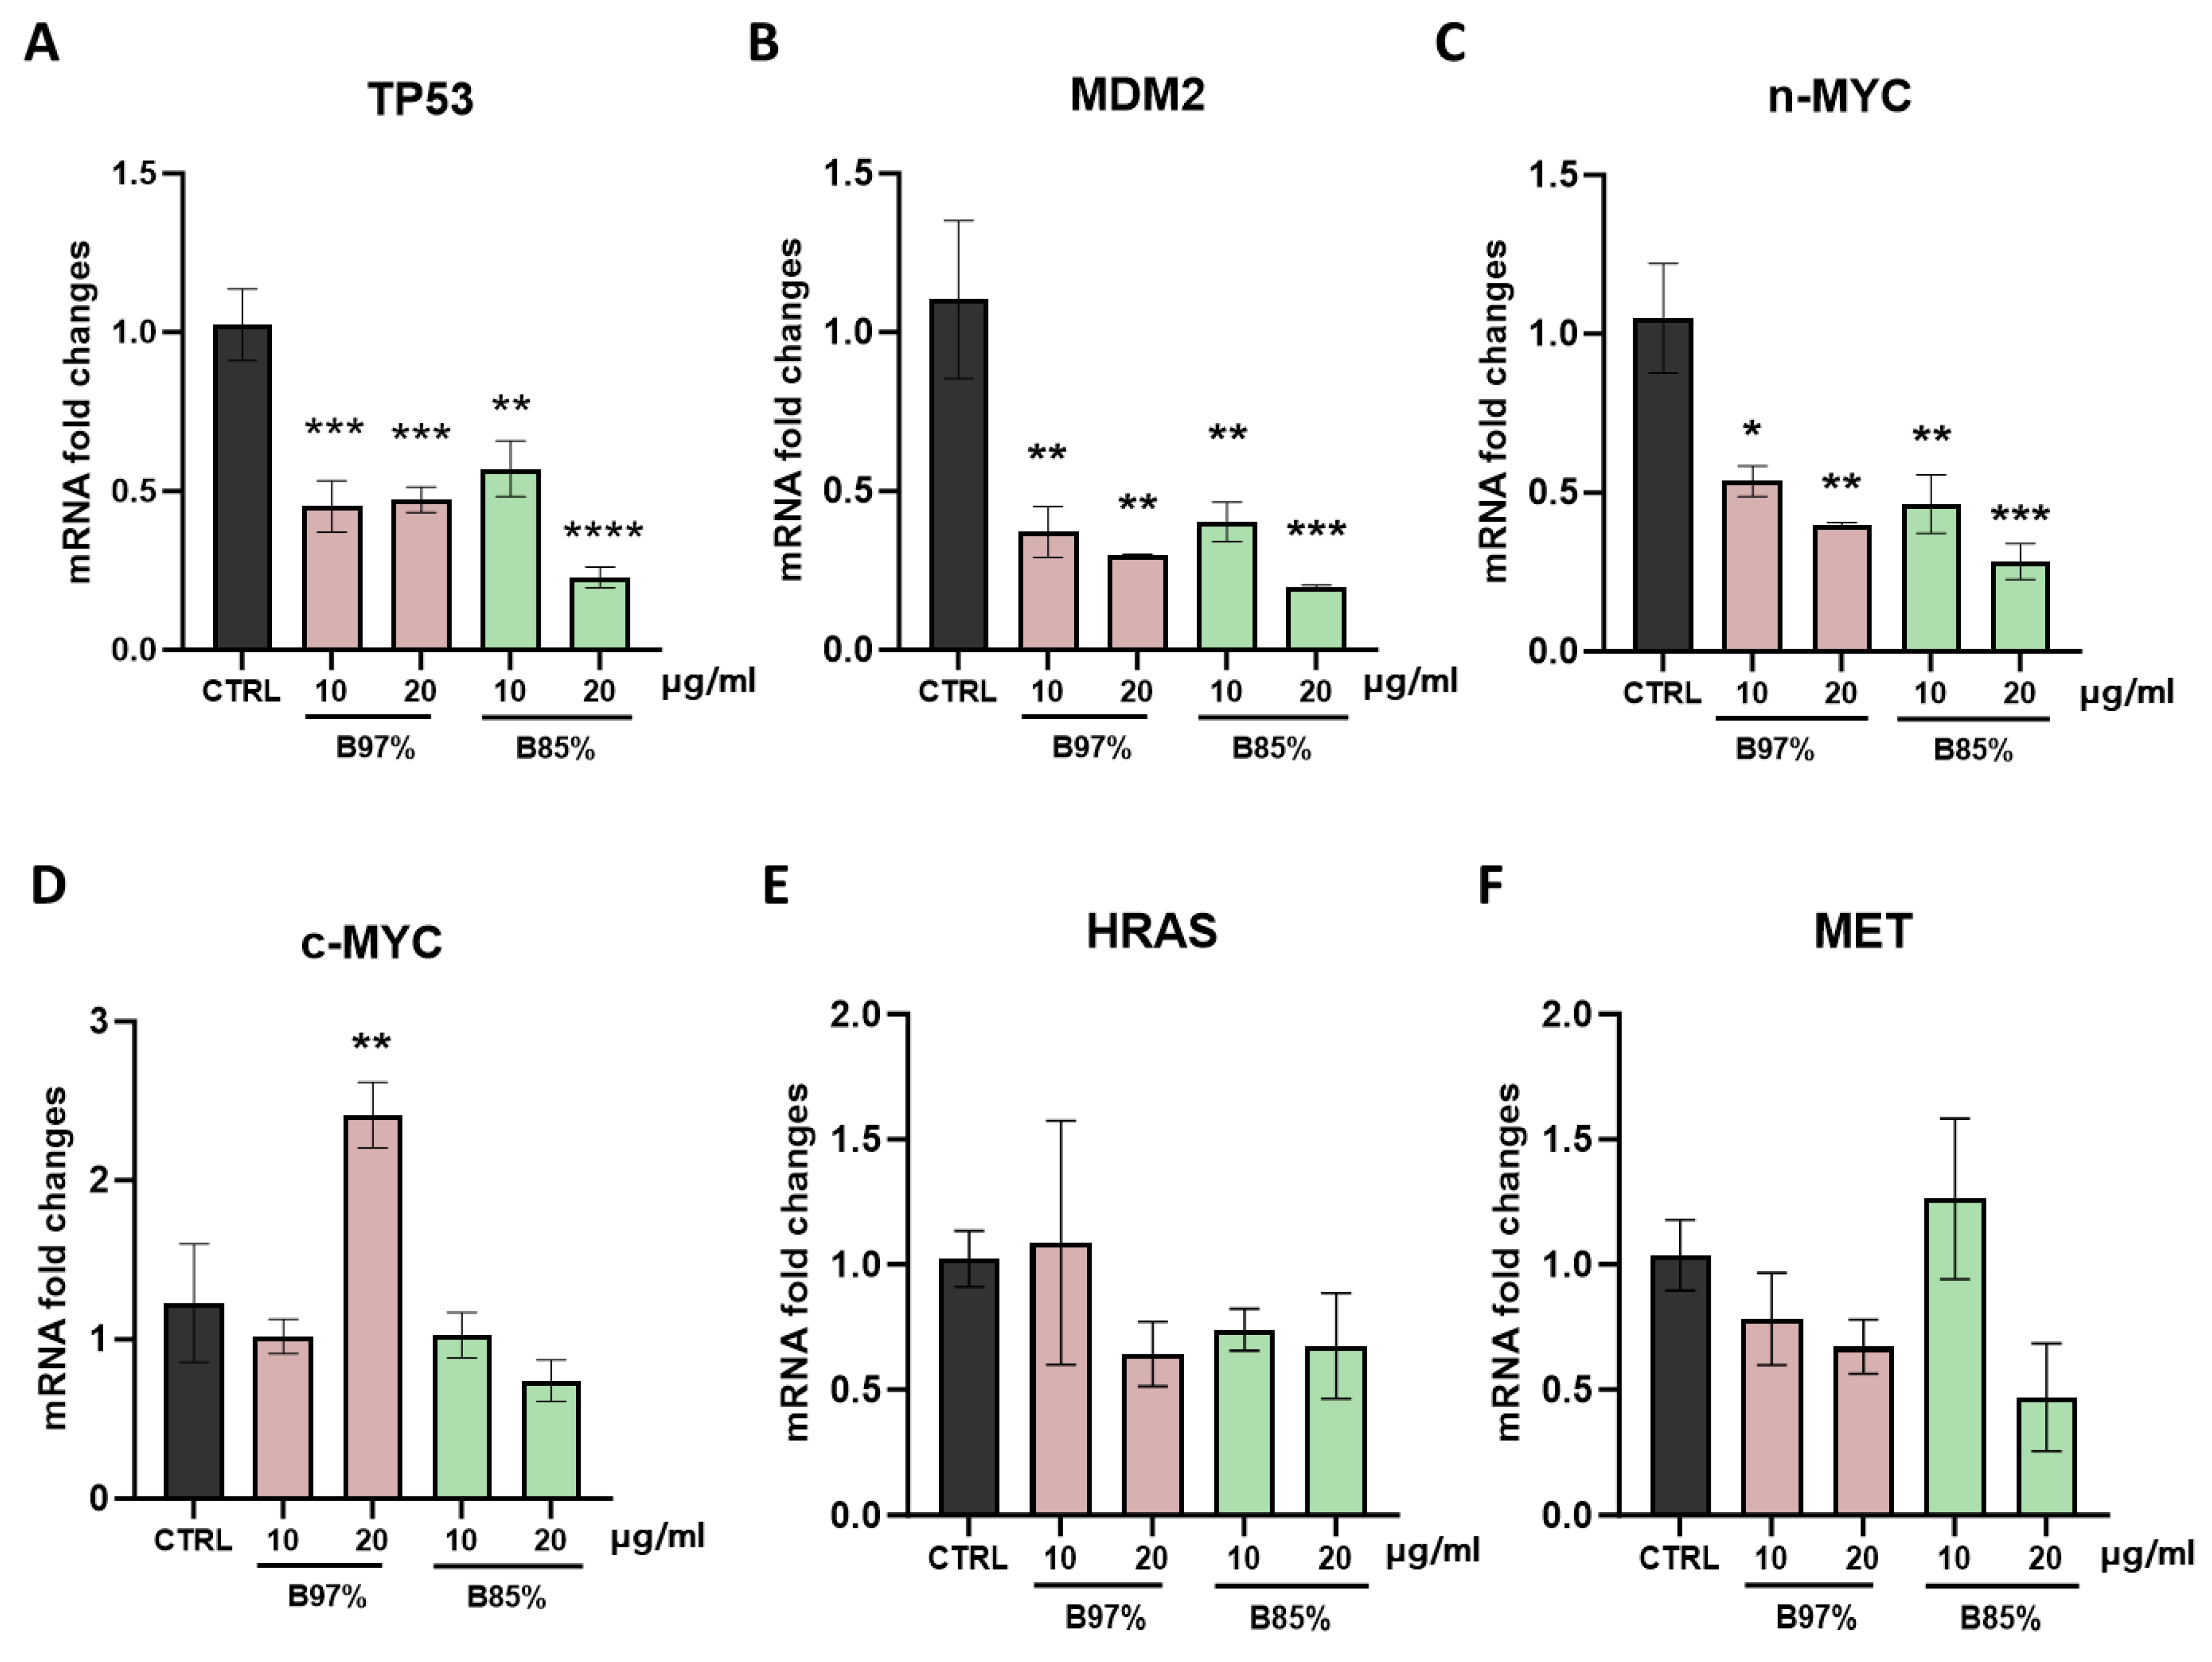
Figure 10.
RT-qPCR analysis of BAX (A) and BCL-2 (B) transcripts in HEK293 cells following treatment with B97% and B85% at 10 or 20 μg/ml. Each column represents mean ± SEM. Data were analyzed by one-way analysis of variance followed by Dunnet: *p <0 .05, **p <0 .01 vs CTRL (n = 4).
Figure 10.
RT-qPCR analysis of BAX (A) and BCL-2 (B) transcripts in HEK293 cells following treatment with B97% and B85% at 10 or 20 μg/ml. Each column represents mean ± SEM. Data were analyzed by one-way analysis of variance followed by Dunnet: *p <0 .05, **p <0 .01 vs CTRL (n = 4).
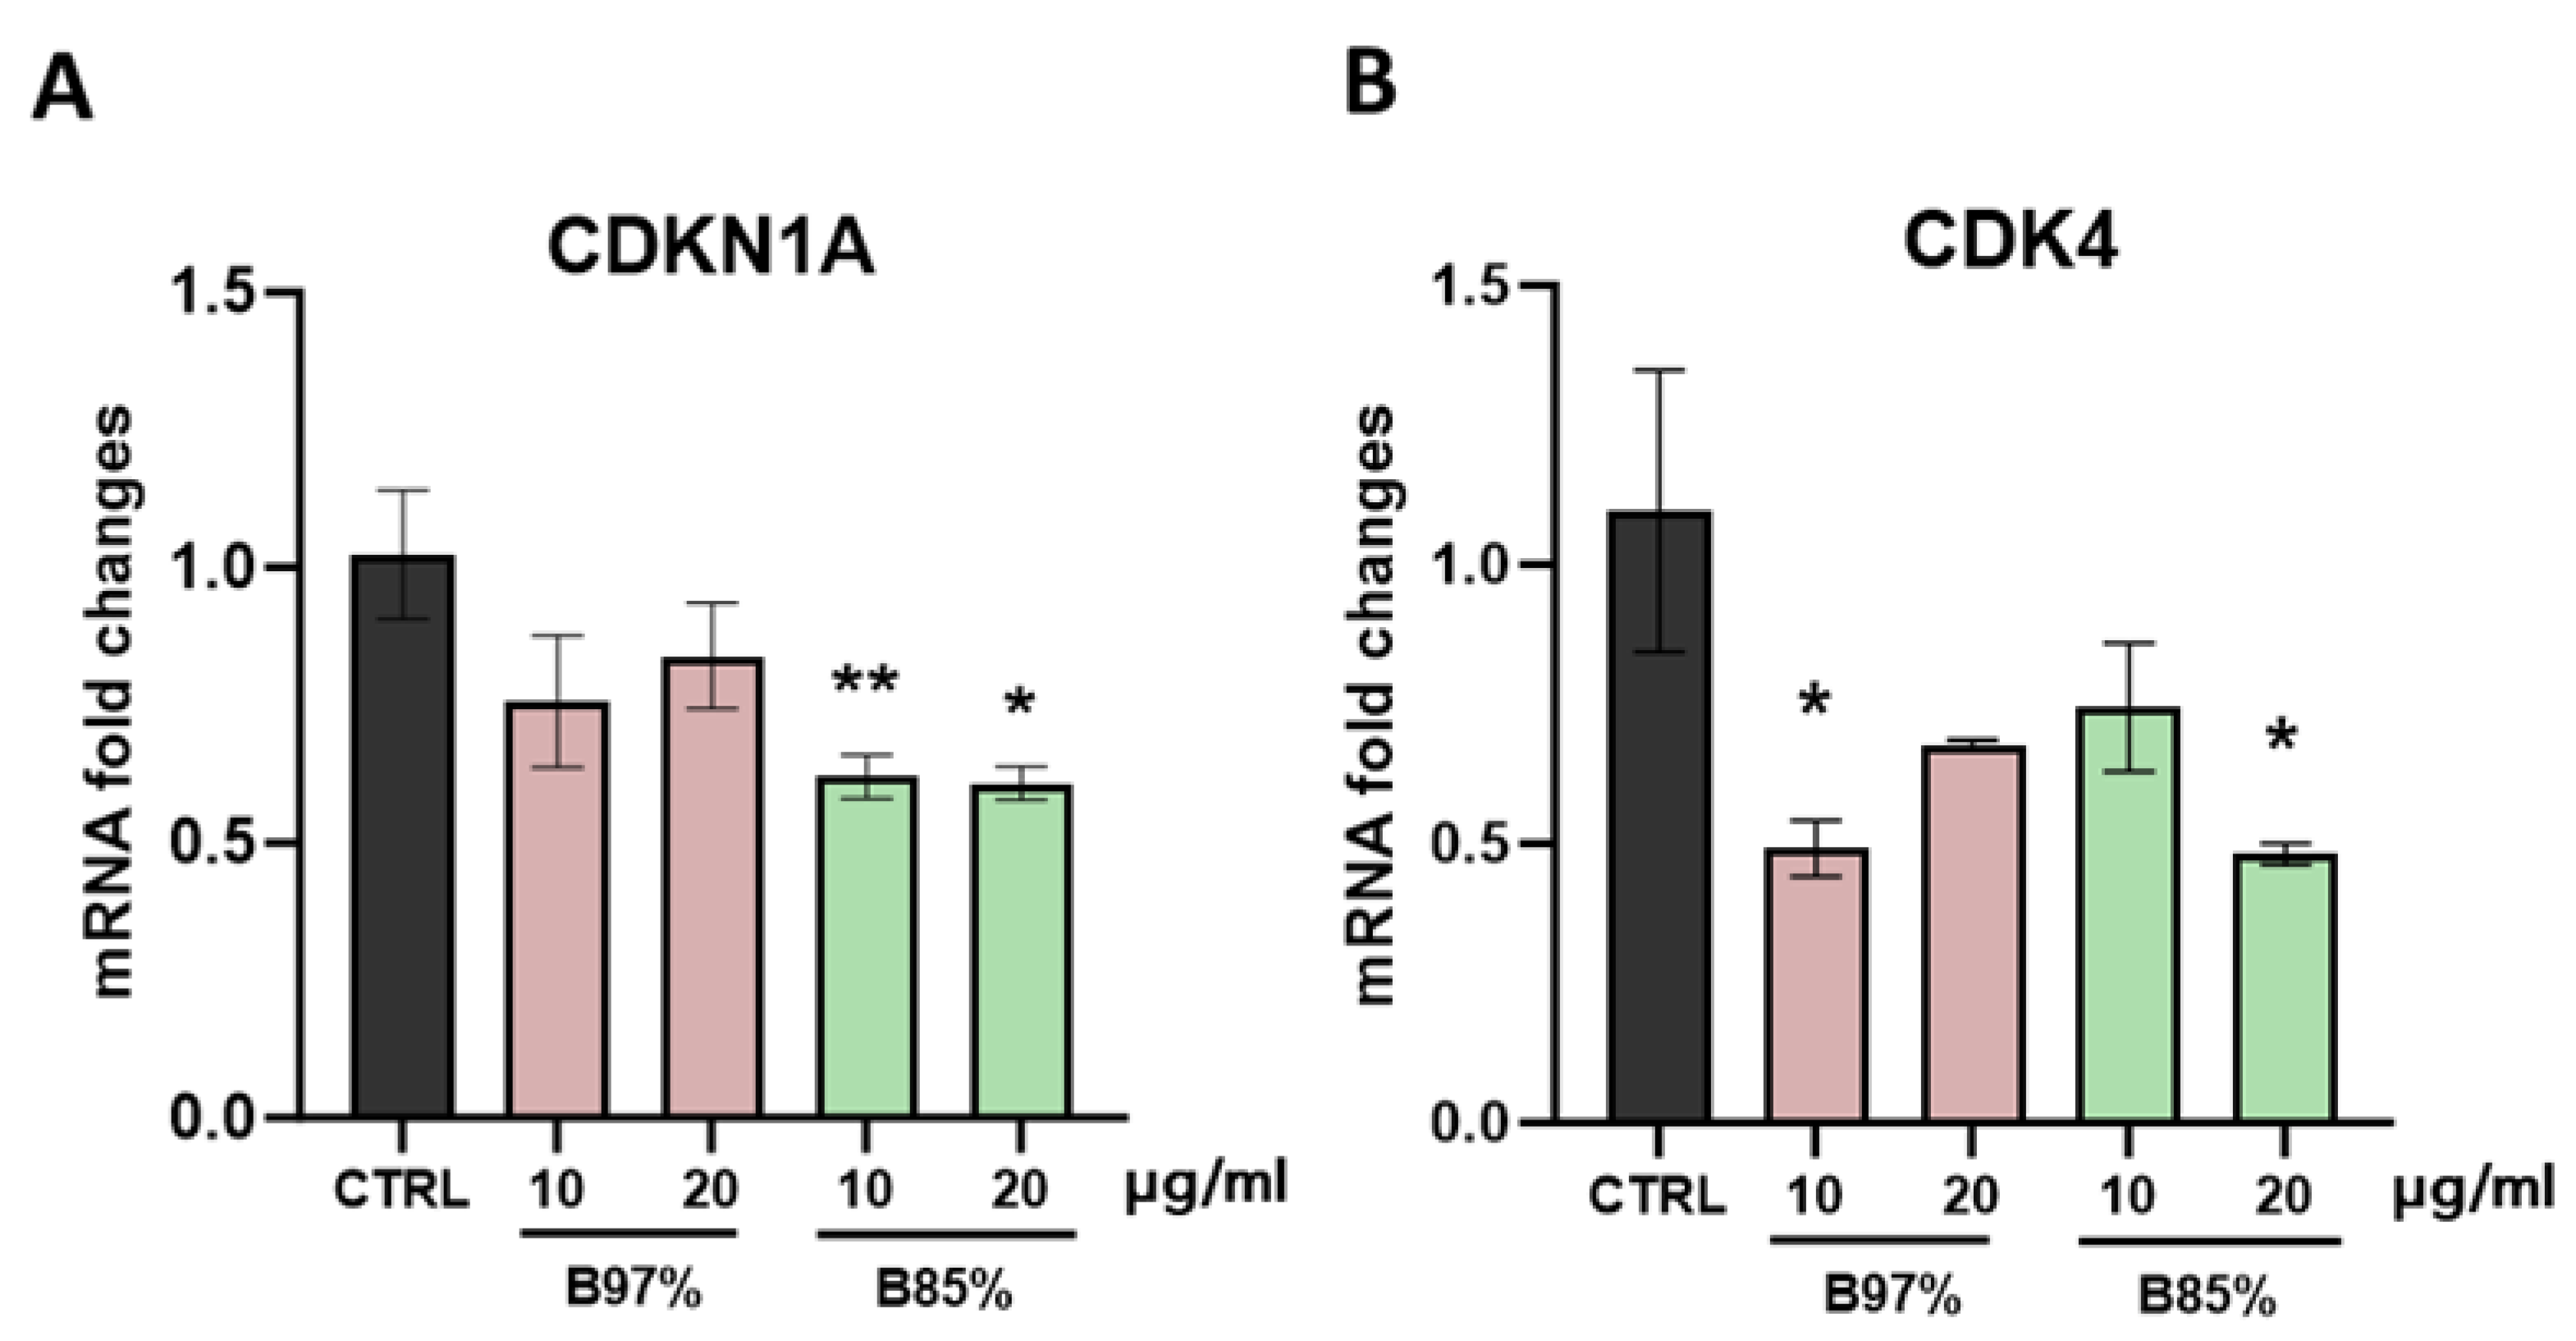
Table 2.
Parameters of the used HPLC-DAD method.
| Parameter | Value |
| R2 | 0.99 |
| Linearity range | 0.15-7.5 mg in column |
| Equation | y=4317.80-98.57 |
| Intra- and inter-day variation | <3% |
Table 3.
Quantification of berberine in 16 different marketed herbal preparations containing berberine and protoberberinoids by means of HPLC-DAD. Quantification was made on dry basis (db) of the extracts and values are expressed as berberine hydrochloride. Values are expressed as % w/w of a triplicate analysis performed on eight B. aristata extracts with declared content of 97% of berberine hydrochloride db and eight extracts of B. aristata with declared content of 85% of berberine hydrochloride.
| Sample |
Berberine % w/w db |
Sample |
Berberine % w/w db |
| A85 | 86.26 | A97 | 97.41 |
| B85 | 86.74 | B97 | 91.94 |
| C85 | 91.93 | C97 | 96.50 |
| D85 | 88.87 | D97 | 97.16 |
| E85 | 89.63 | E97 | 97.49 |
| F85 | 90.66 | F97 | 97.21 |
| G85 | 80.07 | G97 | 97.29 |
| J85 | 87.88 | J97 | 97.80 |
| mean± SD | 87.76 ± 3.64 | mean± SD | 96.60 ± 1.91 |
Table 4.
Quantification of protoberberinoids in B. aristata bark extracts. Samples are labelled according to the declared content of berberine expressed as berberine hydrochloride. Quantification was made on dry basis (db) of the extracts and all compounds are expressed as berberine hydrochloride. Values are expressed as % w/w of a triplicate analysis performed on eight B. aristata extracts with declared content of 97% of berberine hydrochloride db and eight extracts of B. aristata with declared content of 85% of berberine hydrochloride.
| Samples |
Jatrorrhizine % w/w db |
Berberrubine + palmatine % w/w db |
| A85 | 2.39 | 0.25 |
| B85 | 1.88 | 0.24 |
| C85 | 2.10 | 0.23 |
| D85 | 3.07 | 0.26 |
| E85 | 2.54 | 0.28 |
| F85 | 2.85 | 0.24 |
| GH | 2.59 | 0.20 |
| J85 | 3.12 | 0.25 |
| mean± SD | 2.57± 0.44 | 0.24± 0.02 |
| A97 | 2.25 | 0.24 |
| B97 | 1.49 | 0.08 |
| C97 | 2.98 | 0.11 |
| D97 | 2.57 | 0.23 |
| E97 | 2.04 | 0.13 |
| F97 | 2.04 | 0.14 |
| G97 | 2.05 | 0.28 |
| J97 | 1.71 | 0.13 |
| mean± SD | 2.14 ± 0.46 | 0.17 ± 0.07 |
Table 5.
Chemical composition of pooled A85 and D85 (mixed 1:1, B 85) and pooled A97 and G97 (1:1, B 97), expressed as mean of composition of single extracts.
Table 5.
Chemical composition of pooled A85 and D85 (mixed 1:1, B 85) and pooled A97 and G97 (1:1, B 97), expressed as mean of composition of single extracts.
| Samples |
Berberine % w/w db |
Jatrorrhizine % w/w db |
Berberrubine + palmatine % w/w db |
| B. aristata85% (B 85) | 87.57 ± 1.85 | 2.83 ± 0.48 | 0.26 ± 0.01 |
| B. aristata97% (B 97) | 97.35 ± 0.08 | 2.15 ± 0.14 | 0.26 ± 0.02 |
Table 6.
Bioaccessibility rate of berberine and jatrorrhizine investigated in two extracts of Berberis aristata DC. bark containing 97% or 85% of berberine hydrochloride dry basis. Berberine is highly stable to pH change and digestive enzymes; jatrorrhizine also is recovered in high percentage. Due to matrix interferences, the bioaccessibility rate of berberrubine and palmatine is not reported. Values are expressed as % rate of the mean ± standard deviation of a triplicate analysis performed on two different B. aristata bark extracts containing berberine hydrochloride 97% or 85% dry basis.
| Bioaccessibility rate % | ||
| Samples | Berberine | Jatrorrhizine |
| B. aristata 97% | > 95 | 83.57 ± 3.33 |
| B. aristata 85% | > 95 | 87.81 ± 3.69 |
Disclaimer/Publisher’s Note: The statements, opinions and data contained in all publications are solely those of the individual author(s) and contributor(s) and not of MDPI and/or the editor(s). MDPI and/or the editor(s) disclaim responsibility for any injury to people or property resulting from any ideas, methods, instructions or products referred to in the content. |
© 2024 by the authors. Licensee MDPI, Basel, Switzerland. This article is an open access article distributed under the terms and conditions of the Creative Commons Attribution (CC BY) license (http://creativecommons.org/licenses/by/4.0/).
Copyright: This open access article is published under a Creative Commons CC BY 4.0 license, which permit the free download, distribution, and reuse, provided that the author and preprint are cited in any reuse.


