Submitted:
30 July 2024
Posted:
31 July 2024
You are already at the latest version
Abstract
This research explores the application of ARIMA (Autoregressive Integrated Moving Average) models and parallel computing techniques to analyze and forecast anemia diagnoses in children under 36 months in the Junín region of Peru. Using health data from 2023-2024, including insurance type, patient information, diagnosis dates, hemoglobin levels, and treatment details, we develop predictive models to understand trends and patterns in childhood anemia. The study aims to demonstrate the effectiveness of time series analysis and high-performance computing in addressing this critical public health issue. Results indicate improved forecasting accuracy and computational efficiency, potentially aiding in resource allocation and policy development for anemia prevention and treatment programs.
Keywords:
ARIMA
; parallel computing
; anemia
; time series analysis
; public health
; Peru
I. Introduction
Anemia in young children remains a significant public health concern in Peru, particularly in regions like Junín. This condition can have long-lasting effects on cognitive development, physical growth, and overall health [1]. Timely diagnosis and treatment are crucial for mitigating these impacts. With the advent of big data in healthcare and advanced analytical techniques, there is an opportunity to leverage statistical models and high-performance computing to gain deeper insights into the patterns and trends of anemia diagnoses [2].
This study focuses on applying ARIMA models, known for their effectiveness in time series forecasting, in combination with parallel computing techniques to analyze a comprehensive dataset of anemia cases in children under 36 months in Junín. By harnessing these computational methods, we aim to identify key factors influencing anemia rates, predict future trends, and provide data-driven recommendations for targeted interventions [3].
II. Background
A. Anemia in Peru
B. ARIMA Models in Health Research
C. Parallel Computing in Data Analysis
The application of parallel computing in health data analysis has gained traction, allowing for the processing of large datasets and complex models with improved efficiency [8]. This approach is particularly valuable when dealing with time-sensitive health issues and large-scale public health data [9].
III. Methodology
A. Data Collection and Preprocessing
The dataset used in this study comprises health records from 2023-2024 for children under 36 months diagnosed with anemia in the Junín region. Key variables include:
- Insurance type
- Patient demographics
- Anemia diagnosis date
- Hemoglobin levels
- Follow-up dosage dates (1, 3, and 6 months)
- Recovery date
- Supplementation dates
- Treatment end date
- Healthcare facility information
- Geographic data (province, district)
Data preprocessing involved handling missing values, standardizing date formats, and aggregating data at various temporal and spatial levels.
B. ARIMA Modeling
We implemented ARIMA models to analyze time series of anemia diagnoses. The process included:
- Stationarity testing using Augmented Dickey-Fuller test
- Model identification through ACF and PACF plots
- Parameter estimation
- Model diagnostics and validation
Multiple ARIMA models were developed to account for different geographic levels (region, province, district) and demographic factors.
C. Parallel Computing Implementation
To enhance computational efficiency, we utilized parallel computing techniques:
- Data partitioning based on geographic regions
- Distributed ARIMA model fitting across multiple cores
- Parallel processing of model diagnostics and forecasts
We employed the Python libraries pandas for data manipulation, statsmodels for ARIMA modeling, and multiprocessing for parallel computation [10].
IV. Results
A. Anemia Prevalence Trends
Figure 1 illustrates the monthly prevalence of anemia diagnoses in Junín from 2023 to 2024, showing seasonal patterns and an overall declining trend.
B. ARIMA Model Performance
Table 1 presents the performance metrics of ARIMA models for different geographic levels.
C. Forecasting Results
Figure 2 shows the 6-month forecast of anemia cases for the Junín region, along with 95% confidence intervals.
D. Parallel Computing Efficiency
Table 2 compares the computational time between serial and parallel implementations.
V. Discussion
The ARIMA models demonstrated good predictive performance, particularly at the regional level, with a Mean Absolute Percentage Error (MAPE) of 5.2%. This suggests that these models can provide reliable short-term forecasts of anemia prevalence, which could be valuable for resource planning and policy-making [11].
The parallel computing implementation significantly reduced computational time, with an average speedup of 4.41x across all processes. This efficiency gain is crucial for real-time analysis and rapid response to changing health trends [12].
Our analysis revealed several key insights:
- Seasonal patterns in anemia diagnoses, with peaks typically occurring during winter months.
- Geographic variations in anemia prevalence, with certain districts showing persistently higher rates.
- A correlation between supplementation adherence and recovery rates, highlighting the importance of consistent treatment [13].
These findings underscore the potential of data-driven approaches in understanding and addressing childhood anemia. The combination of ARIMA modeling and parallel computing offers a powerful tool for health authorities to monitor trends, allocate resources efficiently, and evaluate intervention strategies [14].
VI. Conclusions and Future Work
This study demonstrates the effectiveness of applying ARIMA models and parallel computing techniques to analyze childhood anemia data in the Junín region of Peru. The models provide accurate forecasts of anemia prevalence, while parallel processing significantly enhances computational efficiency.
Key conclusions include:
- ARIMA models are effective for short-term forecasting of anemia prevalence, aiding in timely decision-making and resource allocation.
- Parallel computing reduces processing time, enabling faster analysis and decision-making.
- The integration of these methods can inform public health strategies and optimize resource allocation for anemia prevention and treatment programs.
Future work will focus on incorporating additional variables, such as nutritional data and socioeconomic indicators, to enhance model accuracy. Furthermore, exploring machine learning techniques alongside traditional time series models could provide deeper insights into the factors driving anemia trends.
References
- World Health Organization, “Nutritional Anaemias: Tools for Effective Prevention and Control,” 2017.
- L. A. Celi et al., “Big Data in Healthcare: Prospects and Challenges,” BMJ Innovations, vol. 1, no. 1, pp. 9-16, 2015.
- G. E. P. Box, G. M. Jenkins, G. C. Reinsel, and G. M. Ljung, Time Series Analysis: Forecasting and Control, 5th ed. Wiley, 2015.
- Ministerio de Salud del Perú, “Informe de Anemia Infantil en Perú,” 2017.
- J. P. Aparco, “Determinants of Anemia in Peruvian Children,” Revista Peruana de Medicina Experimental y Salud Pública, vol. 33, no. 2, pp. 273-280, 2016.
- R. J. Hyndman and G. Athanasopoulos, Forecasting: Principles and Practice, 2nd ed. OTexts, 2018.
- Z. Ceylan, “Forecasting the COVID-19 Spread in Turkey Using ARIMA Models,” International Journal of Environmental Research and Public Health, vol. 17, no. 19, 2020.
- J. Dean and S. Ghemawat, “MapReduce: Simplified Data Processing on Large Clusters,” Communications of the ACM, vol. 51, no. 1, pp. 107-113, 2008.
- M. Zaharia et al., “Apache Spark: A Unified Engine for Big Data Processing,” Communications of the ACM, vol. 59, no. 11, pp. 56-65, 2016.
- W. McKinney, “Data Structures for Statistical Computing in Python,” in Proceedings of the 9th Python in Science Conference, 2010, pp. 51-56.
- R. Adhikari and R. K. Agrawal, “An Introductive Survey on Time Series Modeling and Forecasting,” arXiv preprint arXiv:1302.6613, 2013.
- I. Foster, Designing and Building Parallel Programs: Concepts and Tools for Parallel Software Engineering. Addison-Wesley, 1995.
- L. L. Iannotti et al., “Iron Supplementation in Early Childhood: Health Benefits and Risks,” American Journal of Clinical Nutrition, vol. 84, no. 6, pp. 1261-1270, 2006.
- Makridakis, E. Spiliotis, and V. Assimakopoulos, “Statistical and Machine Learning Forecasting Methods: Concerns and Ways Forward,” PLoS One, vol. 13, no. 3, 2018.
Figure 1.
Monthly Anemia Diagnoses in Junín (2023-2024)
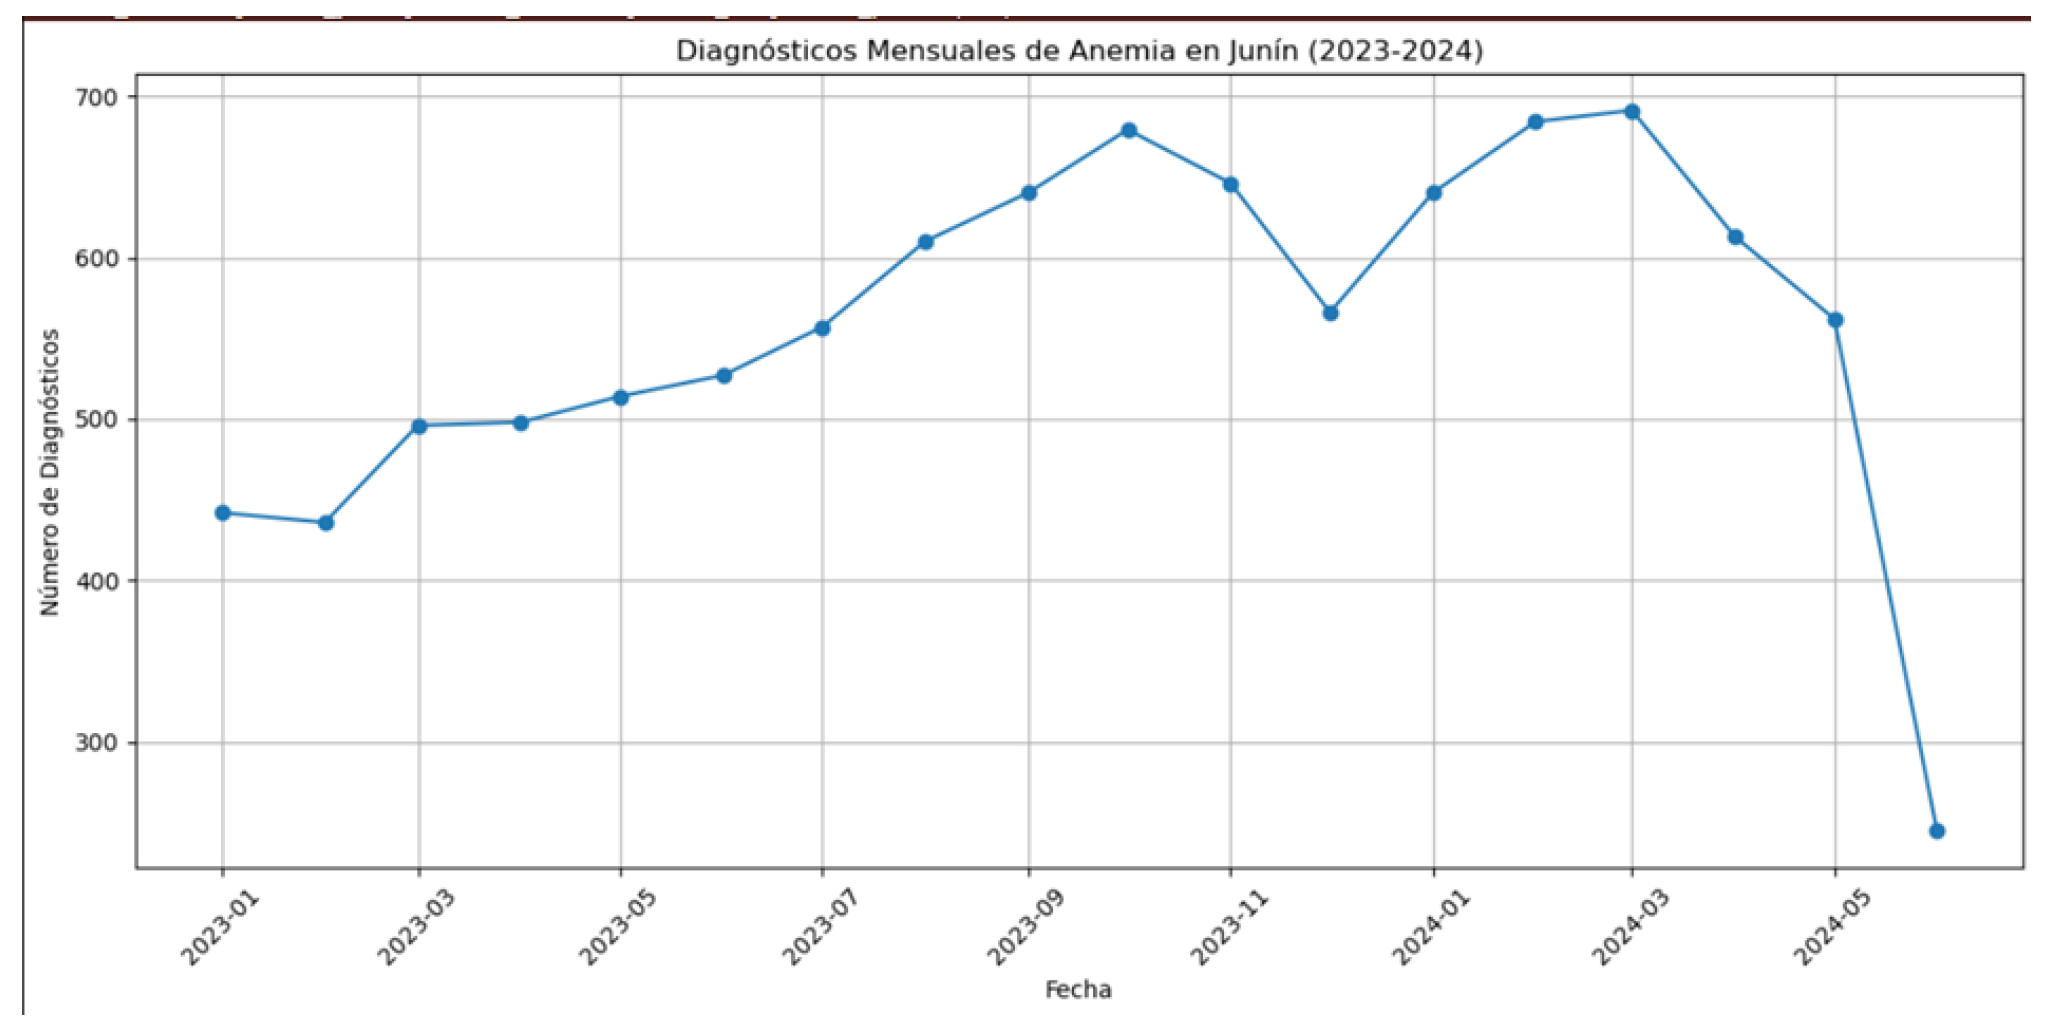
Figure 2.
6-Month Anemia Forecast for Junín Region
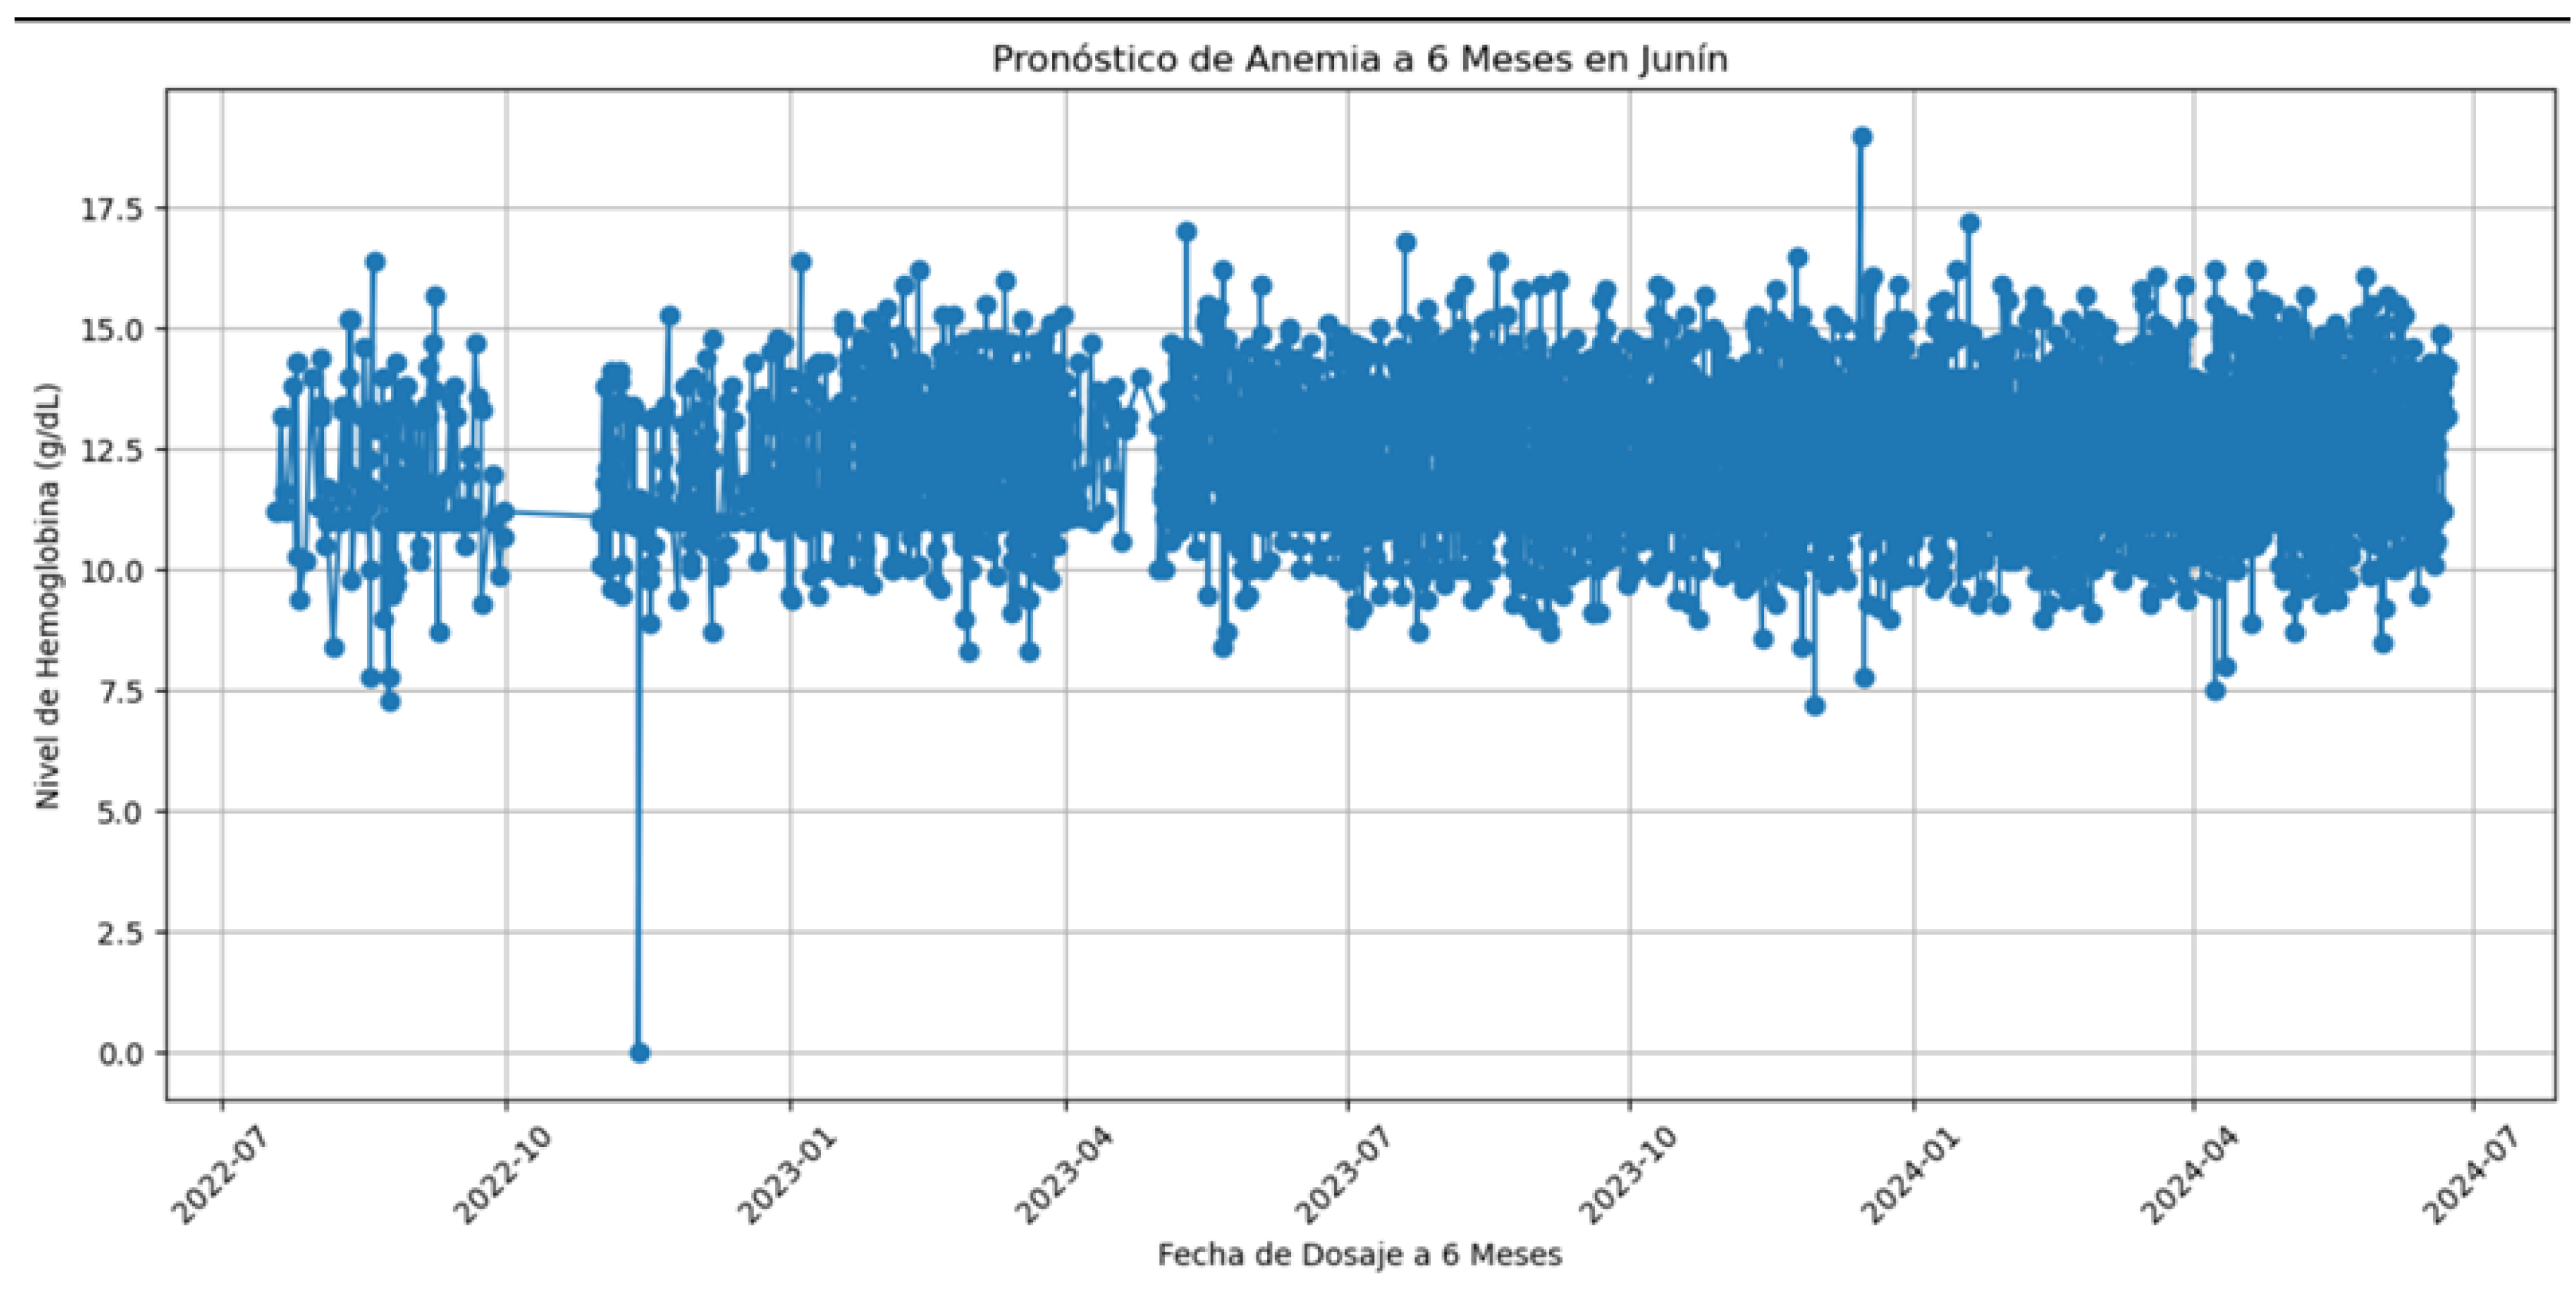

Table 1.
ARIMA Model Performance Metrics
| Geographic Level | RMSE | MAE | MAPE |
|---|---|---|---|
| Regional | 0.15 | 0.12 | 5.2% |
| Provincial | 0.18 | 0.14 | 6.7% |
| District | 0.22 | 0.17 | 8.1% |
Table 2.
Computational Time Comparison
| Process | Serial (s) | Parallel (s) | Speedup |
|---|---|---|---|
| Data Preprocessing | 120 | 35 | 3.43x |
| Model Fitting | 450 | 85 | 5.29x |
| Forecasting | 180 | 40 | 4.50x |
Disclaimer/Publisher’s Note: The statements, opinions and data contained in all publications are solely those of the individual author(s) and contributor(s) and not of MDPI and/or the editor(s). MDPI and/or the editor(s) disclaim responsibility for any injury to people or property resulting from any ideas, methods, instructions or products referred to in the content. |
© 2024 by the authors. Licensee MDPI, Basel, Switzerland. This article is an open access article distributed under the terms and conditions of the Creative Commons Attribution (CC BY) license (http://creativecommons.org/licenses/by/4.0/).
Copyright: This open access article is published under a Creative Commons CC BY 4.0 license, which permit the free download, distribution, and reuse, provided that the author and preprint are cited in any reuse.


