
Submitted:
29 July 2024
Posted:
30 July 2024
You are already at the latest version
Abstract
This paper addresses the study of synoptic-scale meteorological conditions that favor long-range pollen transport in southern South America combining airborne pollen counts, modeled three-dimensional backward trajectories, and synoptic and surface meteorological data. Alnus pollen transport trajectories indicate origins predominantly in Montane forests of the Yungas between 1500 and 2800 m altitude. The South American Low-Level Jet is the main meteorological feature that explains 64\% of the detected pollen arrival at the target site. Podocarpus and Nothofagus pollen instead are linked primarily to the widespread Subantartic forests in southern Patagonia. Their transport patterns are consistent with previous studies which show an association with synoptic patterns related to cold front passages carrying pollen in the free atmosphere (27% for Nothofagus and 25% for Podocarpus). These results show the significance of understanding long-distance pollen transport for disciplines such as climate change reconstruction and agriculture, emphasizing the need for further research to refine atmospheric circulation models and refine interpretations of past vegetation and climate dynamics.
Keywords:
Airborne pollen tracers
; Atmospheric circulation
; SAMS
; South America
; Alnus acuminata
; Nothofagus
1. Introduction
Atmospheric pollen transport is of great interest in many aspects, from purely academic, as in the case of the theory of pollen analysis that supports palaeoenvironmental reconstructions [1,2,3,4,5,6,7]), to the social ones like the treatment of respiratory allergies [8,9,10,11,12,13]). The studies eventually lead to modeling the relationships between meteorological variables such as precipitation, temperature, and pollen emission. Researchers must accomplish this by considering local pollen emissions and more complex processes involving wind-driven material from distant sources. Generally, the long-range pollen contribution is scarce and can be neglected without major consequences, but there are exceptional events of remarkable impact, as reported by some authors [14,15,16]).
Investigating long-distance pollen transport is much more difficult in low latitudes because the flora from tropical or subtropical regions is diverse, and species are not commonly wind-pollinated. Conversely, at mid or high latitudes, this pollination syndrome is very extended, the vegetation includes fewer species, occupies wide regions, and long-range transport is easily observed. As a component of atmospheric aerosols, airborne pollen is considered the largest biological particle of the size spectrum [17] that could be used as a proxy of atmospheric circulation [18]. Usually, the preferred study technique comprises meteorological models employed in air pollution or environmental issues within which Gaussian, Eulerian, or Lagrangian approaches are the most widely used. A comprehensive list of model categories can be found in Fraile et al. (2006) [18] and the feasibility of simulating pollen transport was also thoroughly evaluated by Sofiev et al. (2006) [19].
Many case studies document long-range pollen transport in the Northern Hemisphere. For example, those reporting pollen arrivals to the high Arctic, Greenland, or the North Pole [20,21,22] or into the Mediterranean [23,24,25,26] among many others. On the contrary, there are few studies on this topic in South America. It can be mentioned those who analyze the source-receptor relationship of pollen from the extra-regional origin [27], the atmospheric mechanisms involved in trans-Andean pollen transport [28], and the role of transient weather systems defining the pollen source area in northern Patagonia [29]. Only one study accounts for bioaerosol dispersal concerning subtropical atmospheric circulation. Meza Torres et al. (2015) [30] first analyzed the combined effect of trade winds and the South American Monsoon as a possible dispersal pathway ofOphioglossum reticulatum L. fern spores coming from Northwestern Africa.
This paper addresses studying the main circulation patterns and synoptic-scale meteorological conditions that favor long-range pollen transport in southern South America. To complete this task, we appeal to an interdisciplinary study with aerobiological sampling techniques using airborne pollen as atmospheric circulation tracers and numerical modeling of trajectories commonly used in meteorology.
2. Main Features of Atmospheric Circulation in Southern South America
Regional variations in South America’s weather are the direct consequence of the land-ocean distribution, the mean climatic conditions, and the regular cycles at different timescales in the Southern Hemisphere. Diverse patterns from tropical to midlatitude arise from the latitudinal span of the continent (12°N - 56°S). The Andes constitute a barrier to the zonal tropospheric flow producing dry conditions on the western slope and moist on the eastern slope in the subtropics [31]. A reversed pattern appears south of 35°S. Andean ranges also lead to intense tropical-extratropical interactions to the east, which characterizes the weather and climate of the Pampa plain and Patagonia plateau. Midlatitude synoptic variability shows different pressure patterns from which the main one represents the characteristic westerly flow south of 40°S [32]. The second variability mode represents equatorward cold-air outbreaks occurring all year round at 1 or 2-week intervals [32]. Its seasonal structure has modest changes although the interaction with warm and humid subtropical air masses in summertime leads to stronger convective processes [33,34]. Cold fronts also deeply impact the surface temperature mainly in wintertime when extremely persistent episodes produce intense freezing conditions in central-southern South America [35,36].
North of 35°S and east of the Andes, the most significant feature of the atmospheric circulation is the seasonal moisture, heat, and pressure, horizontal and vertical changes involved in the South American Monsoon System (SAMS) [37]. The South American Low-Level Jet (SALLJ) is a component of the SAMS that has been extensively studied due to its role in the hydrological cycle of Southeastern South America (SESA) [38]. Specifically, the SALLJ is the strengthening and south-eastward deflection of the flow, at the westward side of the South Atlantic subtropical high due to the Andes mountains. The atmospheric dynamics drive moisture from tropical to extratropical latitudes and contribute to developing convective systems in the austral warm season [39,40].
Paegle (1998) [41] raised the role of SALLJ in the dispersion of biogeochemical species. SALLJ acts as a conveyor belt in the regional transport of biomass-burning products that impact distant downwind receptors in SESA and the Atlantic Ocean [42,43]. This occurs during the tropical dry season (from June to October) and corresponds to midlatitudes in late Austral winter and spring. Owing to this dynamic situation, different SALLJ types are found according to the region where the jet core is located [44,45]. Particularly, the events that stretch from tropical – about 15° S – to middle latitudes – at least 35° S – with northwest-southeast orientation are known as Chaco Jet (CJ). The other two types are the No Chaco Jet (NCJ) and the Argentine low-level jet (ALLJ). The configuration of these events meets the SALJ criteria, but the region where it occurs varies. During an NCJ event, the wind is more zonal than meridional, while with CJs the meridional component is the most important. Convection tends to develop between northern Paraguay and southern Brazil. The ALLJ events, develop along the western periphery of a postfrontal anticyclone. In these cases, in contrast to the CJs and NCJs, the main source of moisture is the Atlantic Ocean. Precipitation develops along the eastern slopes of the Andes, in central, and northwestern Argentina. The additional requirement of no rain occurring in their span -thus avoiding the wet removal mechanisms- was expected to favor pollen transport from the source region to SESA. Castañeda and Ulke (2015) [46] particularly studied CJs that match this requirement (known as CJ1 events) which represent almost 36% of the total summer variance.
3. Material and Methods
3.1. Airborne Pollen Sampling
Atmospheric pollen monitoring was carried out in two periods (August 1st, 2012 - November 27th, 2012; August 9th, 2013 - December 5th, 2013) including the greatest palynological richness in the air of most of the localities studied in Argentina [47]. The survey was performed with a Hirst (1952) [48] seven-day volumetric suction sampler located approximately 3 km SW of Sunchales City, at the National Weather Service station (30° 57’ 24.5” S, 61° 31’ 59.2” W, 93 m a.s.l.). The site was selected considering the possibility of capturing subtropical and mid-latitude circulation. The device collects the aerosols by inertial impact on an adhesive tape mounted on a drum that spins at a speed of 2 mm h. The trap was operated at a constant suction volume of 0.6 m h. Pollen collection started at 13 UTC, therefore the "pollen day" lasted from 13 UTC (-3 GMT) day 0 to 12 UTC day+1. The date assigned to each sample corresponds to day 0. The sticky tape and the slides were prepared by standard techniques [49]. Pollen counting was performed with an optical microscope with a final magnification of 1000x, analyzing the complete slide for each day and seeking the specific pollen types selected in the survey. Pollen types were recognized with specialized literature [50,51,52,53]) and expressed as daily concentrations (grains m of air).
Ninety-three pollen types were recognized in 2012 and 91 in 2013 [47]. The complete dataset is available at http://hdl.handle.net/11336/240591. We selected pollen from Alnus, Podocarpus, and Nothofagus to follow subtropical and mid-latitude circulations of southern South America. As daily concentrations of these pollen types far from the source are extremely diluted, the data are expressed as the number of pollen grains per 100 cubic meters of air (gr x 100 m). Being anemophilous, these pollen types were adapted to air transport and produced in large quantities making them ideal airborne pollen tracers. Besides, pollen from these natives has been previously recorded in the air from different locations far from their sources, where their presence has been linked to medium and long-range transport [27,54,55]. The genus Nothofagus comprises several species (N. dombeyi, N. oblicua, N. pumilio, N. alessandri, N. alpina, N. antarctica, N. betuloides, N. glauca, N. macrocarpa, N. nitida) that grow in South American Subantarctic forests, within a narrow latitudinal strip on the Andes (35.7 - 55°S), between 500 - 1800 m a.s.l. at their northern distribution and from sea level up to 500 m a.s.l. on its southernmost location [56,57]. Conversely, Alnus (Alnus acuminata) grows within the Yungas forest in the eastern slopes of the Andes and Bolivian southern Altiplano in the Montane forest vegetation belt between 1600 - 2700 m a.s.l. [57,58]. Its southernmost geographical distribution reaches 29°S (Catamarca Province, Argentina). Podocarpus represents two species, P. nubigena from the Subantarctic forests and P. parlatorei from the Yungas forest, therefore it is potentially a tracer for both, mid-latitude and subtropical circulation. Morphological limitations, the nature of the aerobiological samples, and mineral dust on slides precluded taxonomic determination to the species level using standard light microscopy techniques.
3.2. Meteorological Data and Calculation of Backward Trajectories
Once pollen tracer concentrations were obtained, we sought a connection with their potential sources. Therefore, the online version of the HYSPLIT 4.9 model (Hybrid Single-Particle Lagrangian Integrated Trajectory) of the Air Resources Laboratory (ARL), National Oceanic and Atmospheric Administration (NOAA) [59,60] was used to calculate three-dimensional backward trajectories arriving at Sunchales. Stein et al. (2015) [61] made a complete revision of the historical evolution and multiple applications over the three decades of this model. ARL - Global Data Assimilation System (GDAS) data with 1° x 1° horizontal resolution, were used to perform 72-hour backward trajectories covering each pollen day. We considered three arrival heights (250, 750, and 1500 m above ground level) at the synoptic times 00, 06, 12, and 18 UTC but only 750 and 1500 m arrival height trajectories are shown for the mid-latitude and subtropical pollen tracers. Among the options to compute the vertical pollen transport, we choose the vertical velocity provided by the model. For each trajectory, we checked that no precipitation occurred along the path. In addition, surface meteorological data (daily precipitation, maximum and minimum temperatures, hourly temperature, pressure, present weather, wind speed, and direction) measured at Sunchales Airfield station (National Weather Service), were checked at the time of arrival of the pollen tracers.
Vertical circulation associated with high and low-pressure systems, ridges, and troughs plays a crucial role in pollen grains’ suspension, long-distance transport, and deposition. High-pressure systems are characterized by descending air (subsidence), resulting in fair weather conditions. In contrast, low-pressure systems involve rising air, leading to cloud formation and potential precipitation. Ridges and troughs are wave-shaped pressure systems where horizontal winds circulate anticyclonically and cyclonically. Along the frontal boundaries of ridges, high-pressure regions feature sinking air that promotes fair weather. Instead, upward air motion induces cloudiness and precipitation along trough fronts, conducting atmospheric washout. Aiming to identify the synoptic systems driving the airborne pollen transport and their evolution, we analyzed the geopotential height (925 and 700 hPa) and vertical pressure velocity (omega 700 hPa) fields for each pollen day. These levels were chosen as representatives of near-surface and mid-tropospheric flow that have been identified as relevant for airborne pollen transport [28]. Study cases representing the most frequent synoptic patterns associated with long-range pollen transport were selected for a detailed description.
For the subtropical circulation, we sought to identify low-level jet situations. Bonner (1968) [62] designed an objective procedure to document the occurrence of a low-level jet based on observed wind speed profiles. This method was adapted to use different meteorological fields (analysis, forecasts, and reanalysis) allowing its application to the extended territories of South America where there are scarce upper air measurements [63,64]. The modified Bonner’s criteria were applied to 850 and 700 hPa GDAS wind fields of the National Center for Environmental Prediction (NCEP). Six hourly fields with one-degree horizontal resolution were considered because of the variations of the synoptic weather conditions and the influence of the daily cycle. Aiming to focus on the airflow structure in the near-source region, the 750/800 hPa layer mean horizontal flow, wind vector, and streamline patterns were studied. In addition, wind vector and omega vertical cross-sections were analyzed at the source (19°S) and receptor (30.97°S) latitudes for the start and end times of the transport event, respectively.
The South American mid-latitude circulation is dominated by transient synoptic systems moving from SW to NE. We used ERA5 (fifth generation ECMWF reanalysis) gridded data with a regular 0.25° lat-long resolution to obtain the time evolution of 700 hPa geopotential and omega along two different SW-NE transects connecting the Nothofagus and Podocarpus source region with Sunchales. The information summarized in Hovmöller diagrams, allowed us to identify weather systems and their associated horizontal and vertical displacements.
4. Results
4.1. Pollen Tracers of Subtropical Circulation
No trajectory linked the presence of Podocarpus with the source located in the Yungas forest. Therefore, Alnus was the only tracer analyzed for the subtropical circulation transporting pollen species toward Sunchales.
Backward trajectories show that 35 out of 61 Alnus occurrences at Sunchales (57%) are linked with the source location. Nevertheless, considering the flowering period, which extends from August to September, the percentage rises to 64%. Few occurrences (4 cases) lay outside these months, but no one was related to source emission.
The arrival of Alnus pollen occurs with a weak cyclonic system (trough or low) located northeast of Sunchales, and the South Atlantic High advanced over the continent (77% of the registered cases, Table 1). The post-frontal high produces the required air descent for pollen capture.
The median pollen concentration for the study period was 10 gr x 100 m. The highest values (21 and 42 gr x 100 m) occurred on August 31st and September 1st, 2013 within an episode of continuous arrival that began on August 28th and lasted until September 7th. Therefore, they were selected for a detailed analysis.
4.1.1. Alnus Case Study
Most of the trajectories ending between 14 UTC on August 31st and 12 UTC on September 1st, 2013 (Figure 1), start moving towards the NW and then turn to the SE when they reach the northern limit of the Yungas forest in southern Bolivia. From this position onwards, the trajectories continue in a southerly direction at altitudes between 1000 and 2000 m.a.s.l. Travel times endure from 28 to 72 hours.
Examples of Figure 1 started from August 29th to 31st and ended from August 31st to September 1st. The trajectories illustrate the typical pathway of low-level flow in a SALLJ event. Most of them indicate that air masses travel over the Yungas region thus advecting pollen southwards. Light-colored ones show how the northerly flow is progressively constrained to the eastern flank of the Andes while the dark ones (17 UTC August 31st, and 02 - 18 UTC September 1st) surpass the geographical distribution of the Tucumano - Bolivian Yungas (Figure 1). Near the destination, the trajectories rotate counterclockwise due to the advance of a cold front and arrive at their target location from the S.
The meteorological conditions recorded at Sunchales Aero station show that on August 31st clear skies and low relative humidity (on average 52%) prevailed. The maximum and minimum temperatures reached 32.8°C and 6.6°C at 19 UTC and 10 UTC respectively. On September 1st, surface conditions were similar, with maximum and minimum temperatures of 31.2 and 10.5°C. Consistently with the calculated trajectories, on August 31st the wind blew from the N until it changed to a slight S wind that increased from 1.2 to 3.1 m s on September 1st.
The synoptic situation remained similar between August 31st and September 1st. The average geopotential height field at 1000 hPa (Figure 2) shows a thermal-induced low-pressure system identified as the Chaco low [65] centered at 25°S, 63°W.
There is an intensified pressure gradient on its eastern flank due to the presence of the South Atlantic Anticyclone over the continent. This feature favors an intense northern meridional component of the wind between the Argentina - Paraguay border. In turn, the mid-latitude baroclinic zone is positioned south of 35°S. The 500/1000 hPa thickness field shows a warm air mass (thickness higher than 5700 gpm) over the Amazon basin and northern Argentina. Cold air masses extend up to approximately 40°S (thickness lower than 5400 gpm).
This pattern agrees with the structure described by some authors during a SALLJ event [66,67]. Sixty percent of the analyzed cases were consistent with no precipitation pattern of CJ1 described by Castañeda and Ulke (2015) [46] while 30% with NCJ and 10% with ALLJ. Moreover, the area that includes central Bolivia, northern Argentina, and Paraguay, satisfies the modified Bonner’s criteria and presents winds with an intense southward meridional component. Two examples are shown in Figure 3.
The example in Figure 3a shows NNW winds blowing from the source area towards Sunchales, reaching approximately 35°S. The situation on August 31st shows that the jet core moved slightly towards the NE pushed by the advance of a cold front (Figure 3b).
The streamlines in Figure 4 show a more detailed view of the flow pattern and progression features. The jet core is located over southern Bolivia and northern Paraguay. At the same time, the exit region appears on NE Argentina and SE Brazil on August 31st (Figure 4a) with a clear dominance of northern winds over Sunchales. Interestingly, the flow, oriented W to E, overpasses the Yungas region to end up into the jet thus ensuring the fast advection southwards. The advance of the cold front that extends in the SSE - NNW direction on September 1st (Figure 4b) allows the entry of wind from sector S towards the central region of Argentina.
The vertical cross-sections by the time the studied trajectories arrive at Sunchales show that until 06 UTC on August 31st, and eastward of the Andes, the wind is predominantly from the N sector except at upper levels where a progressive coupling with the westerlies is observed (Figure 5).
At 12 UTC, below 900 hPa, the wind begins to rotate NE and E (00 UTC August 1st) to later settle in the S quadrant below the 750 hPa level due to the cold front passage. The atmospheric conditions over Sunchales show moderate subsidence (omega > 0) throughout the period. The progressive displacement of the SALLJ towards the east is also observed.
Figure 6 shows the vertical cross-section at the beginning of the event at the latitude of the Yungas. The event starts on August 29th, with no jet structure in the pollen source area. The next day the wind intensify on the eastern flank of the Andes and omega changes to increasingly negative values (ascents) which is maximum at the time of greater warming (18 UTC, 2:00 p.m. local time).
From 12 UTC onwards, a wind maximum from the NNW direction and SALLJ characteristics were established below 700 hPa at approximately 62°W. At the same time, a positive omega cell is located where the higher wind occurs. The subsidence occurred by the horizontal divergence at the northward inlet of the jet. August 31st is the day of greatest development when the SALLJ core registered NNW winds with more than 20 m s. The pattern and values are consistent with those documented by Salio et al. (2007) [68], and Nicolini and García Skabar (2011) [69].
4.2. Pollen Tracers of Mid-Latitude Circulation
Backward trajectories confirmed that 15 out of 20 Nothofagus occurrences at Sunchales (75% of the total cases) linked the source and destination and occurred within the flowering season (October - November). These cases show that the arrival of airborne pollen mainly occurred with anticyclonic conditions and air subsidence (80% of the cases). Post-frontal features are the most frequent synoptic situations (46.6%, Table 2).
Similarly, 12 out of 15 total occurrences of Podocarpus pollen linked to the southern source by backward trajectories. Their arrival is mainly related to anticyclonic conditions and air subsidence (75% of total cases) and like the previous case, post-frontal situations are the most frequent (66.7%, Table 3).
Both Nothofagus and Podocarpus airborne pollen concentrations were low. They reached medians of 7 gr x 100 m of air and maximum concentrations of 42 and 14 gr x 100 m, on November 24th, 2012, and October 29th, 2013, respectively. Two case examples were selected for further study: November 24th, 2012, for Nothofagus, and October 24th, 2013, for Podocarpus.
4.2.1. Backward Trajectories
Nothofagus trajectories show SW - NE orientation crossing the northern region of the Subantarctic forest on November 22nd - 23rd 2012 at an altitude between 2500 and 3500 m.a.s.l. (Figure 7a).
Podocarpus trajectories crossed the continent at the same latitudinal strip, between 39 and 47°S but with a meridional alignment, then turned counterclockwise near Sunchales (Figure 7b). The Subantarctic forests were surpassed on October 22nd - 23rd 2013 at altitudes ranging from 2000 to 3000 m.a.s.l. Some trajectories passing over the southernmost Subantarctic forest are not linked to the Podocarpus pollen source area, as its geographical range only extends between 39.83° and 50.38°S [70]. Also, the curved trajectory (arriving at 12 UTC on October 25th) does not come from the pollen source area. As a rule, the travel time from the source area to the destination point lasts from 48 to 72 hours, although in some exceptional cases, they last up to 96 hours.
4.2.2. Nothofagus Case Study
The Hovmöller diagram of Figure 8, resumes the synoptic situation from November 15th to December 1st, 2012, over a transect with SW - NE orientation (41.54°S, 74.71°W - 29.69°S, 60.02°W).
On November 16th, the 700 hPa geopotential field shows a low-pressure system that weakens leeward. Subsequently, between November 21st and 22nd, a new trough crosses the Andes range, generating a windward descent over the Nothofagus pollen source area. The system moves to the NE with omega values < 0, which keeps the pollen airborne until the time of arrival (November 24th) when the associated subsidence (omega > 0) takes airborne pollen to surface level. On November 24th, clear skies and light winds (2.3 m s) predominantly from the SSE direction prevailed at Sunchales. A minimum temperature of 15.1°C was recorded at 10 UTC while a maximum of 28.4°C was observed at 21 UTC. The mean relative humidity was 62.6%.
4.2.3. Podocarpus Case Study
The geopotential height field on October 22nd, 2013, shows a trough passage over the pollen-source area in the Andes of Northern Patagonia (Figure 9). The trough front produces the pollen uplift that enters the free atmosphere to be transported over long distances.
On October 23rd, the trough reached Sunchales leading to post-frontal subsidence and the entry of Podocarpus pollen to the city on October 24th, when daily pollen concentration reached 14 gr x 100 m. The surface pressure showed a sharp decrease up to 995 hPa without any significant meteorological phenomena, except for dust due to wind gusts recorded between 20 UTC on October 23rd and 01 UTC on October 24th. October 24th showed clear skies and strong southerly winds (6.3 m s). The minimum temperature reached 14.1°C at 10 UTC while the maximum temperature (24.7°C) occurred at 19 UTC. Also, this day registered the lowest relative humidity of the week (51.6%). Figure 9 also shows a situation similar to the previously described, which occurred between October 20th and 22nd, bringing a Podocarpus pollen concentration of 7 gr x 100 m to the city.
5. Discussion and Concluding Remarks
Alnus geographical distribution represents a pattern of several regions of more or less isolated populations along the eastern flank of the Andes. Today it reaches approximately 29°S resulting from the complex migration dynamics of repeated glacial-interglacial events during the last million years through Central America from the Northern to the Southern Hemisphere [71,72,73]. Most of the events of Alnus pollen arrival (64% within its flowering period) were linked with any source location which extended from Jujuy province (Argentina) to the eastern flank of the Bolivian altiplano. Only four cases were not connected with any source location. The absence of other Alnus tree species growing in the vicinity of the city of Sunchales, presupposes that the source of this tracer is located in the Montane forest between 1500 and 2800 m. a.s.l. The analyzed cases show trajectories passing over the southeast of Bolivia and turning to a southerly direction. Afterwards, a cold frontal passage rotates trajectories counterclockwise until arrival at Sunchales. Travel times range from 28 to 72 hours according to wind intensities. The synoptic situation corresponds to a trough (37%) or weak low (40%) over the source region combined with a high in southeast Brazil. This is consistent with the structure of CJ1 with no precipitation (60%) described by Castañeda and Ulke (2015) [46]. Composite wind fields at 850 hPa indicate that the region meets modified Bonner’s criteria, confirming the presence of a Low-Level Jet east of the Andes. Other SALLJ types were minimally represented in this study. It is important to note that these percentages are significantly influenced by the sampling design. The selection of airborne pollen sampling sites depends on the specific objectives of the research. The Sunchales location is justified by the SALLJ’s role in supplying moisture to the region’s agricultural productive core of SESA, thereby enhancing the representation of CJ1 events south of 30°S. Future studies should consider additional sampling locations to thoroughly assess pollen transport across different types of SALLJ, including NCJ and ALLJ.
Our results show that during its approach to the eastern flank of the Andes, the core of the SALLJ is located at similar altitudes to those at which pollen sources grow although some kilometers to the east (see Figure 6). The scale of the meteorological analyses of this work does not allow us to explain how the pollen emitted by the source enters the SALLJ. However, streamlines results (Figure 4) show an eastward zonal transport up to 6 m s that could account for the entry of pollen into the SALLJ. Previous studies on pollen transport in the Yungas of Jujuy showed mountain-valley breeze systems that produce Alnus acuminata upslope transport, up to 3800 m a.s.l. [74]. Presumably, the presence of these mesoscale systems that occur in conditions that favor pollen release may be responsible for this connection.
Concerning pollen source location for Podocarpus, no trajectory linked the presence of this pollen type with a northern source, but with the southern one instead. According to Hooghiemstra et al. (2006)[75], the pollen grains from different Podocarpus species are morphologically identical therefore, the detection of this genus does not allow an unambiguous source identification. nubigena is a gymnosperm that grows in Subantarctic forests, while Podocarpus parlatorei does in the Yungas. According to Bianchi and Olabuenaga (2006)[76], the flowering period of P. nubigena extends from October to December while it is detected in the air of Patagonian localities until February [77]. P. parlatorei blooms in October at the end of the dry season [78]. However, no trajectory is linked with the Yungas but with its southern source (Figure 1b). P. parlatorei is a low pollen producer rendering low airborne pollen concentrations even near its source [79,80]. Moreover, it is also a shade-tolerant species that makes a sparse low-density understory [81,82]). Therefore, P. parlatorei is a weak pollen source which could explain the lack of northern trajectories and we conclude that Subantarctic forests are their main source. However, the study period may not be sufficient to evaluate the possibility that the Northern source has a greater contribution than detected. In this sense, more extensive studies will be necessary.
The biogeography of Nothofagus places it not only in southern South America but also in New Guinea, New Zealand, and eastern Australia. According to some authors, this disjoint distribution comes from the detachment of Gondwana [83] while for others, it would represent a post-Gondwanan irradiation that would have begun between 55 and 40 million years ago [84]. The many species of this genus are also difficult to discern with optical microscopy. Excluding those who grow in New Zealand, New Guinea, and eastern Australia the nearest probable source is the Subantarctic forests. Calculated trajectories confirm this hypothesis following previous studies in southeastern Buenos Aires Province [27].
In the case of the southern circulation, the sequence in the source area associated with a long-distance transport event is always the same regardless of the tracer, whether it is Nothofagus or Podocarpus. Postfrontal subsidence at 700 hPa ensures good weather conditions and, surface diurnal heating triggers the pollen uplift above the ABL to be transported in the free atmosphere. Previous studies in northern Patagonia indicate that airborne pollen transport (Podocarpus) initiates with a trough located over the South Pacific Ocean (41% of the studied cases over 5 years) or with its axis over Patagonia (21%) [54]. At the destination, pollen descent from the upper atmosphere occurs by postfrontal subsidence (46.6 for Nothofagus and 66.7% for Podocarpus total cases), situations of a leading-edge trough (25% for Podocarpus) or a high (26.6% for Nothofagus). This mechanism agrees with that described by Gassmann and Pérez (2006)[27] for the transport of Nothofagus reaching southeastern Buenos Aires Province, so it should be a valid transport mechanism for any pollen type whose source is found in the Subantarctic forests.
The study of long-distance transport is of fundamental interest to many disciplines. Knowing the dispersion pathways of bioaerosols such as insects or fungal spores has direct applications in agriculture, for example, to prevent biological invasions and the dispersal of crop diseases. On the other hand, pollen grains preserved in the fossil record are used to study climate changes that affect past vegetation. Many of them investigate the role of the SAMS in the hydrological, dust deposition, and vegetation changes detected mainly in the last 2000 years [85,86,87,88,89,90,91,92]. These interpretations require understanding the current pollen-climate relationships with which these reconstructions are produced. Knowledge of the atmospheric patterns that disperse pollen over long distances constitutes the first advance to build a tool to provide information on changes in atmospheric circulation in the past and an independent technique to cross-validate the reconstructions obtained particularly for the region of Southeastern South America.
Author Contributions
Conceptualization, C.F.P., A.G.U., and M.I.G.; funding acquisition, C.F.P., and A.G.U.; methodology and pollen counting, C.F.P.; formal analysis, A.G.U., and M.I.G.; data curation, C.F.P.; writing, C.F.P. and A.G.U.; writing, review and editing, C.F.P. All authors have read and agreed to the published version of the manuscript.
Funding
This research was funded by ANPCyT-Argentina (PICT 2008-1739 given to Dr. A.G. Ulke and PICT 2020-SERIE A-00366 given to Dr. C.F. Pérez).
Institutional Review Board Statement
Not applicable.
Informed Consent Statement
Not applicable.
Data Availability Statement
The original data presented in the study are openly available in the Repositorio Institucional CONICET Digital at http://hdl.handle.net/11336/240591.
Acknowledgments
We appreciate the support of SanCor Cooperativa de Seguros Ltda. which installed the Burkard trap at Sunchales and provided transport logistics for the pollen samples. We especially thank the Sunchales weather station personnel who operate the Burkard trap. Without their collaboration, this work would not have been possible. We gratefully thank the National Weather Service which provided the meteorological data for this study. Figure 1 and 7 were drawn with GPS Visualizer, a free online software http://www.gpsvisualizer.com/
Conflicts of Interest
The authors declare no conflicts of interest.
Abbreviations
The following abbreviations are used in this manuscript:
| SESA | Southeastern South America |
| SAMS | South American Monsoon System |
| SALLJ | South American Low-Level Jet |
| CJ | Chaco Jet |
| CJ1 | Chaco Jet with no precipitation |
| ALLJ | Argentine low-level jet |
| NCJ | No Chaco Jet |
| UTC | Coordinated Universal Time |
| m a.s.l. | meters above sea level |
| HYSPLIT | Hybrid Single-Particle Lagrangian Integrated Trajectory model |
| ARL | Air Resources Laboratory |
| NOAA | National Oceanic and Atmospheric Administration |
| GDAS | Global Data Assimilation System |
| NCEP | National Center for Environmental Prediction |
Appendix A
Figure A1.
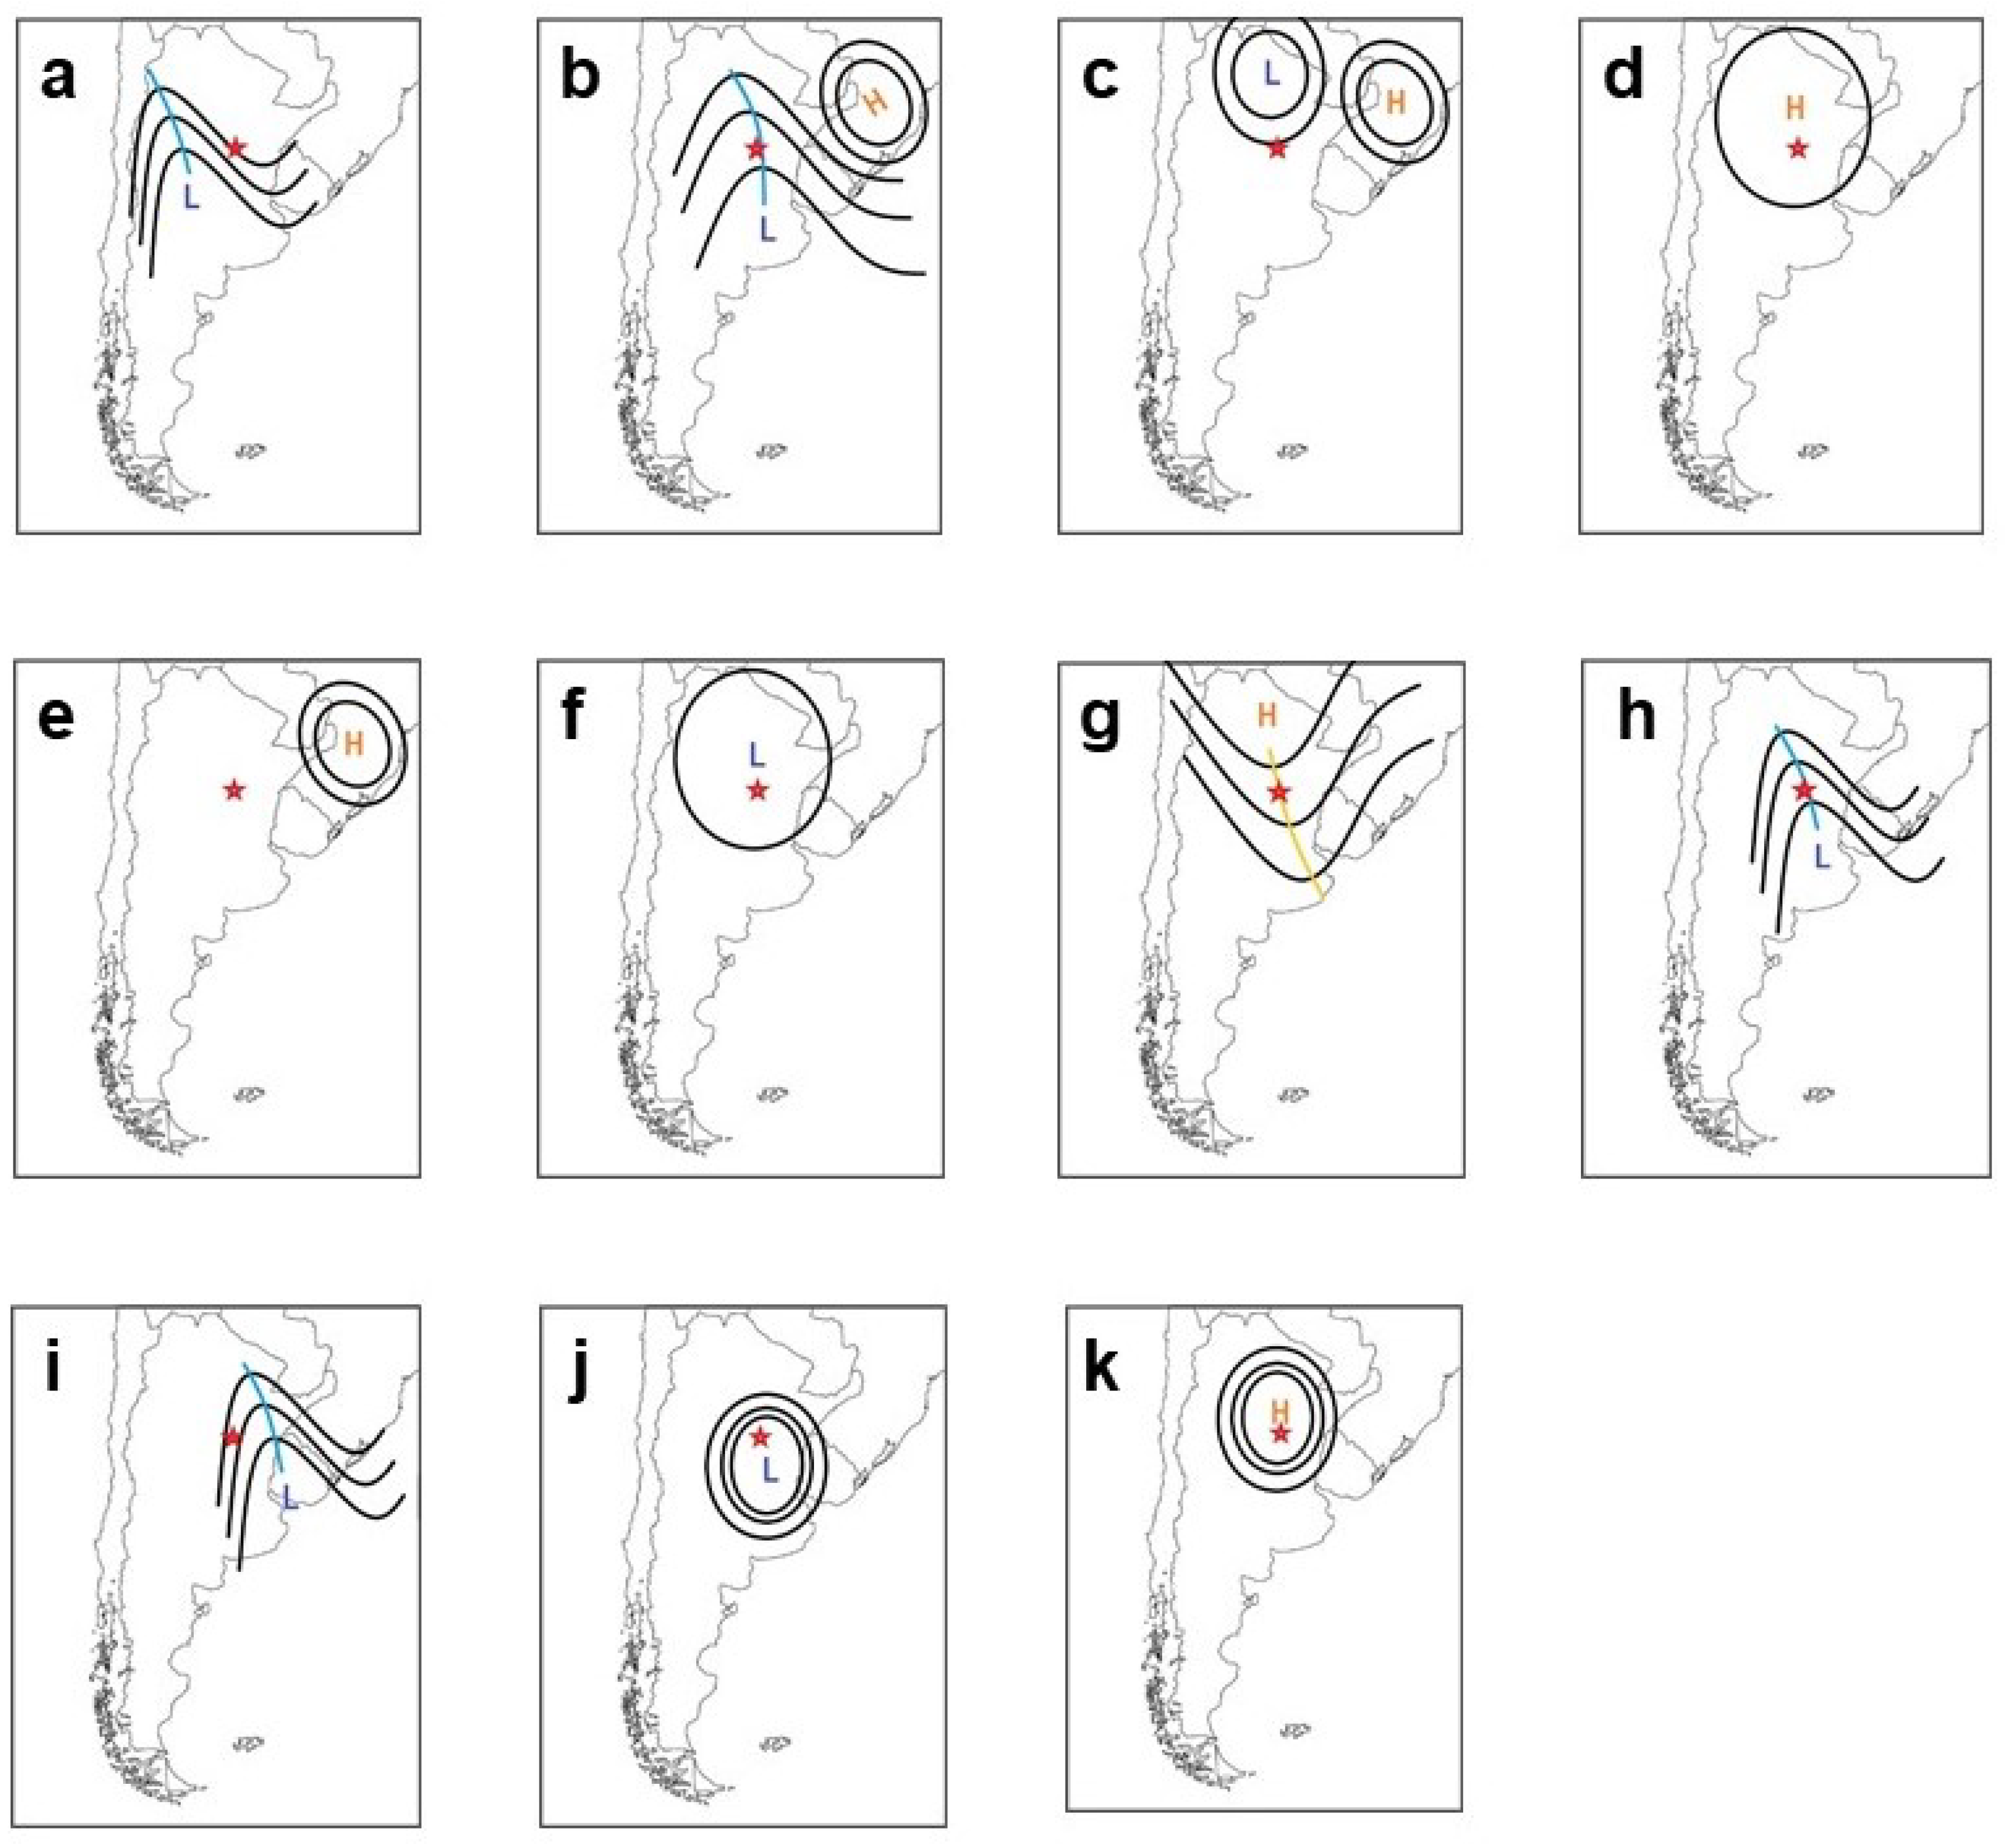
Cartoons describing the transient synoptic patterns (see Tables 1–3) recognized for Alnus, Nothofagus, and Podocarpus pollen arrival at Sunchales. The red star shows the city’s location. (a) leading-edge trough, (b) trough - eastern high, (c) low - eastern high, (d) weak high, (e) eastern high, (f) weak low, (g) ridge, (h) trough, (i) post-frontal, (j) low, (k) high.
Figure A1.
Cartoons describing the transient synoptic patterns (see Tables 1–3) recognized for Alnus, Nothofagus, and Podocarpus pollen arrival at Sunchales. The red star shows the city’s location. (a) leading-edge trough, (b) trough - eastern high, (c) low - eastern high, (d) weak high, (e) eastern high, (f) weak low, (g) ridge, (h) trough, (i) post-frontal, (j) low, (k) high.
References
- Prentice, C.I. Pollen Representation, Source Area, and Basin Size: Toward a Unified Theory of Pollen Analysis. Quaternary Res. 1985, 23, 76–86. [Google Scholar] [CrossRef]
- Prentice, C.I. Records of vegetation in time and space: the principles of pollen analysis. In Vegetation history. Handbook of vegetation science, vol 7; Huntley, B., Webb, T., Eds.; Springer: Dordrecht, Netherlands, 1988; pp. 17–42. [Google Scholar]
- Sugita, S. A Model of Pollen Source Area for an Entire Lake Surface Quaternary Res. 1993, 39, 239–244.
- Sugita, S. Pollen Representation of Vegetation in Quaternary Sediments: Theory and Method in Patchy Vegetation. J. Ecol. 1994, 82, 881–897. [Google Scholar] [CrossRef]
- Sugita, S. Theory of quantitative reconstruction of vegetation I: pollen from large sites REVEALS regional vegetation composition. The Holocene 2007, 17, 229–241. [Google Scholar] [CrossRef]
- Sugita, S. Theory of quantitative reconstruction of vegetation II: all you need is LOVE. The Holocene 2007, 17, 243–257. [Google Scholar] [CrossRef]
- Gaillard, M.J.; Sugita, S.; Bunting, M.J.; et al. The use of modeling and simulation approach in reconstructing past landscapes from fossil pollen data: a review and results from the POLLANDCAL network. Veget. Hist. Archaeobot. 2008, 17, 419–443. [Google Scholar] [CrossRef]
- Hjelmroos, M. Long-distance transport of Betula pollen grains and allergic symptoms. Aerobiologia 1992, 8, 231–236. [Google Scholar] [CrossRef]
- Emberlin, J. The effects of patterns in climate and pollen abundance on allergy. Allergy 1994, 49, 15–20. [Google Scholar] [CrossRef] [PubMed]
- Cecchi, L.; Morabito, M.; Domeneghetti, M.P.; Crisci, A.; Onorari, M.; Orlandini, S. Long distance transport of ragweed pollen as a potential cause of allergy in central Italy, Ann. Allerg. Asthma Imm. 2006, 96, 86–91. [Google Scholar]
- D’Amato, G.; Cecchi, L.; Bonini, S.; Nunes, C.; Annesi-Maesano, I.; Behrendt, H.; Liccardi, G.; Popov, T.; Van Cauwenberge, P. Allergenic pollen and pollen allergy in Europe. Allergy 2007, 62, 976–990. [Google Scholar] [CrossRef] [PubMed]
- Sofiev, M.; Belmonte, J.; Gehrig, R.; Izquierdo, R.; Smith, M.; Dahl, A.; Siljamo, P. Airborne Pollen Transport, In Allergenic Pollen; Sofiev, M., Bergmann, K.C., Eds.; Springer: Dordrecht, Netherlands, 2013; pp. 127–159. [Google Scholar]
- Zhang, R.; Duhl, T.; Salam, M.T.; House, J.M.; Flagan, R.C.; Avol, E.L.; Gilliland, F.D.; Guenther, A.; Chung, S.H.; Lamb, B.K.; Van Reken, T.M. Development of a regional-scale pollen emission and transport modeling framework for investigating the impact of climate change on allergic airway disease. Biogeosciencies 2013, 10, 3977–4023. [Google Scholar] [CrossRef]
- Skjøth, C.A.; Sommer, J.; Stach, A.; Smith, M.; Brandt. , J.; 2007. The long-range transport of birch (Betula) pollen from Poland and Germany causes significant pre-season concentrations in Denmark. Allergy 2007, 37, 1204–1212. [Google Scholar]
- Siljamo, P.; Sofiev, M.; Severova, E.; Ranta, H.; Kukkonen, J.; Polevova, S.; Kubin, E.; Minin, A. Sources, impact, and exchange of early-spring birch pollen in the Moscow region and Finland. Aerobiologia 2008, 24, 211–230. [Google Scholar] [CrossRef]
- Izquierdo, R.; Belmonte, J.; Avila, A.; Alarcón, M.; Cuevas, E.; Alonso-Pérez, S. Source areas and long-range transport of pollen from continental land to Tenerife (Canary Islands). Int. J. Biometeorol. 2011, 55, 67–85. [Google Scholar] [CrossRef] [PubMed]
- Després, V.R.; Huffman, J.A.; Burrows, S.M.; Hoose, C.; Safatov, A.S.; Buryak, G.; Fröhlich-Nowoisky, J.; Elbert, W.; Andreae, M.O.; Pöschl, U.; Jaenicke, R. Primary biological aerosol particles in the atmosphere: a review. Tellus B 2012, 64, 1–40. [Google Scholar] [CrossRef]
- Fraile, R.; Calvo, A.I.; Castro, A.; Fernández-González, D.; García-Ortega, E. The behavior of the atmosphere in long-range transport. Aerobiologia 2006, 22, 35–45. [Google Scholar] [CrossRef]
- Sofiev, M.; Siljamo, P.; Ranta, H.; Rantio-Lehtimäki, A. Towards numerical forecasting of long-range air transport of birch pollen: theoretical considerations and a feasibility study. Int. J. Biometeorol. 2006, 50, 392–402. [Google Scholar] [CrossRef] [PubMed]
- Bourgeois, J.C.; Koerner, R.M.; Alt, B.T. Airborne pollen: a unique air mass tracer, its influx to the Canadian high Arctic. Ann. Glaciol. 1985, 7, 109–116. [Google Scholar] [CrossRef]
- Rousseau, D-D. ; Duzer, D.; Cambon, G., Jolly, D.; Poulsen, U.; Ferrier, J.; Schevin, P.; Gros, R. Long-distance transport of pollen to Greenland. Geophys. Res. Lett. 2003, 30, 1–4. [Google Scholar]
- Rousseau, D-D. ; Duzer, D.; Etienne, J-L.; Cambon, G.; Jolly, D.; Ferrier, J.; Schevin, P. Pollen record of rapidly changing air trajectories to the North Pole. J. Geophys. Res. 2004, 109, 1–7. [Google Scholar]
- Waisel, Y.; Ganor, E.; Epshtein, V.; Stupp, A.; Eshel, A. Airborne pollen, spores, and dust across the east Mediterranean Sea. Aerobiologia 2008, 24, 125–131. [Google Scholar] [CrossRef]
- Hernández-Ceballos, M.A.; García-Mozo, H.; Adame, J.A.; Domínguez-Vilches, E.; Bolívar, J.P.; De la Morena, B.A.; Pérez-Badía, R.; Galán, C. Determination of potential sources of Quercus airborne pollen in Córdoba city (southern Spain) using back-trajectory analysis. Aerobiologia 2011, 27, 261–276. [Google Scholar] [CrossRef]
- Celenk, C. Detection of reactive allergens in long-distance transported pollen grains: Evidence of Ambrosia. Atmos. Environ. 2019, 209, 212–219. [Google Scholar] [CrossRef]
- Negral, L.; Moreno-Grau, S.; Galera, M.D.; Elvira-Rendueles, B.; Costa-Gómez, I.; Aznar, F.; Pérez-Badía, R.; Moreno, J.M. The effects of continentality, marine nature and the recirculation of air masses on pollen concentration: Olea in the Mediterranean coastal enclave. Total Environ. 2021, 790, 1–13. [Google Scholar] [CrossRef] [PubMed]
- Gassmann, M.I.; Pérez, C.F. Trajectories associated with regional and extra-regional pollen transport in the southeast of Buenos Aires province, Mar del Plata (Argentina). Int. J. Biometeorol. 2006, 50, 280–291. [Google Scholar] [CrossRef] [PubMed]
- Pérez, C.F.; Castañeda, M.E.; Gassmann, M.I.; Bianchi, M.M. A statistical study of Weinmannia pollen trajectories across the Andes. Adv. Geosci. 2009, 22, 79–84. [Google Scholar] [CrossRef]
- Pérez, C.F.; Bianchi, M.M.; Gassmann, M.I.; Tonti, N.; Pisso, I. A case study of anisotropic airborne pollen transport in Northern Patagonia using a Lagrangian particle dispersion model. Rev. Palaeobot.P alyno. 2018, 258, 215–222. [Google Scholar] [CrossRef]
- Meza Torres, E.I.; Cerne, B.; Ulke, A.G.; Morbelli, M.A. Distribution of Ophioglossum reticulatum L. in South America. A case of long-distance jump dispersal? Int. J. Biometeorol. 2015, 59, 137–150. [Google Scholar] [CrossRef]
- Garreaud, R.D. The Andes climate and weather. Adv. Geosci. 2009, 22, 3–11. [Google Scholar] [CrossRef]
- Compagnucci, R.H.; Salles, M.A. Surface pressure patterns during the year over southern South America. Int. J. Climatol. 1997, 17, 635–653. [Google Scholar] [CrossRef]
- Garreaud, R.D.; Wallace, J.M. Summertime incursions of midlatitude air into tropical and subtropical South America. Mon. Wea. Rev. 1998, 126, 2713–2733. [Google Scholar] [CrossRef]
- Garreaud, R.D. Cold air incursions over Subtropical South America: mean structure and dynamics. Mon. Wea. Rev. 2000, 128, 2544–2559. [Google Scholar] [CrossRef]
- Müller, G.V.; Berri, G.J. Atmospheric circulation associated with persistent generalized frosts in Central-Southern South America. Mon. Wea. Rev. 2007, 135, 1268–1289. [Google Scholar] [CrossRef]
- Müller, G.V.; Berri, G.J. Atmospheric circulation associated with extreme generalized frost persistence in central-southern South America. Clim. Dyn. 2012, 38, 837–857. [Google Scholar] [CrossRef]
- de Carvalho, L.M.V.; Cavalcanti, I.F.A. The South American Monsoon System (SAMS). In The Monsoons and Climate Change; de Carvalho L., Jones C., Eds.; Springer Climate. Springer, Cham., 2016.
- Marengo, J.A.; Liebmann, B.; Grimm, A.M.; Misra, V.; Silva Dias, P.L.; Cavalcanti, I.F.A.; Carvalho, L.M.V.; Berbery, E.H.; Ambrizzi, T.; Vera, C.S.; Saulo, A.C.; Nogues-Paegle, J.; Zipser, E.; Seth, A.; Alves, L.M. Recent developments on the South American monsoon system. Int. J. Climatol. 2012, 32, 1–21. [Google Scholar] [CrossRef]
- Nicolini, M.; Saulo, A.C. Modeled Chaco low-level jets and related precipitation patterns during the 1997–1998 warm season. Meteorol. Atmos. Phys. 2006, 94, 129–143. [Google Scholar] [CrossRef]
- Vera, C.; Baez, J.; Douglas, M.; Emmanuel, C.B.; Marengo, J.; Meitin, J.; Nicolini, M.; Nogues-Paegle, J.; Paegle, J.; Penalba, O.; Salio, P.; Saulo, C.; Silva Dias, M.A.; Zipser, E. The South American low-level jet experiment. Bull. Am. Meteorol. Soc. 2006, 87, 63–78. [Google Scholar] [CrossRef]
- Paegle, J. A comparative review of South American low-level jets. Meteorologica 1998, 23, 73–81. [Google Scholar]
- Freitas, S.R.; Longo, K.M.; Silva Dias, M.A.F.; Silva Dias, P.L.; Chatfield, R.; Prinsd, E.; Artaxo, P.; Grell, G.A.; Recuero, F.S. Monitoring the Transport of Biomass Burning Emissions in South America Environ. Fluid Mech. 2005, 5, 135–167. [Google Scholar] [CrossRef]
- Ulke, A.G. Influence of regional transport mechanisms on the fingerprints of biomass-burning aerosols in Buenos Aires. Adv. Meteorol. 2019, 2019, 1–13. [Google Scholar] [CrossRef]
- Nicolini, M. ; Salio, P; Borque, P. Thermodynamic and kinematic characterization of the low-level troposphere during SALLJEX in different large-scale environments. In 8th Inter. Conference on Southern Hemisphere Meteorology and Oceanography, Foz do Iguaçu, Brazil 2006.
- Salio, P.; Nicolini, M. Seasonal characterization on the diurnal cycle of convection frequency over Southeastern South America under different low-jet conditions. In 8th Inter. Conference on Southern Hemisphere Meteorology and Oceanography, Foz do Iguaçu, Brazil 2006.
- Castañeda, M.E.; Ulke, A.G. Analysis of atmospheric conditions associated to CHACO events of the Low Level Jet East of the Andes and their implications for regional transport. Int. J. Climatol. 2015, 35, 4126–4138. [Google Scholar] [CrossRef]
- Pérez, C.F.; Gassmann, M.I.; Ulke, A.G.; Merino, R. Diversidad polínica atmosférica en la ciudad de Sunchales (Santa Fe, Argentina): agosto – noviembre 2012, agosto – diciembre 2013. Bol. Soc. Argent. Bot. 2020, 55, 573–585. [Google Scholar] [CrossRef]
- Hirst, J.M. An automatic volumetric spore trap. Ann. Appl. Biol. 1952, 39, 257–265. [Google Scholar] [CrossRef]
- Käpylä, M.; Penttinen, A. An evaluation of the microscopical counting methods of the tape in Hirst-Burkard pollen and spore trap. Grana 1981, 20, 131–141. [Google Scholar] [CrossRef]
- Heusser, C.J. Pollen and spores of Chile: modern types of the Pteridophyta, Gymnospermae, and Angiospermae, 3rd ed.; Publisher: Univ. Arizona Press, Tucson, EEUU, 1971; pp. 154–196. [Google Scholar]
- Markgraf, V.; D’Antoni, H.L. Pollen flora of Argentina. Modern spore and pollen types of Pteridophyta, Gymnospermae and Angiospermae, 3rd ed.; Publisher: Univ. Arizona Press, Tucson, EEUU, 1978; pp. 154–196. [Google Scholar]
- Pire, S.M.; Anzótegui, L.M.; Cuadrado, G.A. Eds. Flora polínica del Nordeste Argentino. Volumen I, 3rd ed.; Publisher: EUDENE-UNNE, Corrientes, Argentina, 1998; pp. 154–196. [Google Scholar]
- Pire, S.M.; Anzótegui, L.M.; Cuadrado, G.A. Eds. Flora polínica del Nordeste Argentino. Volumen II, 3rd ed.; Publisher: EUDENE-UNNE, Corrientes, Argentina, 2001; pp. 154–196. [Google Scholar]
- Pérez, C.F.; Gassmann, M.I.; Bianchi, M.M.; Tonti, N. Airborne pollen transport of Podocarpus sp.: The study of backward trajectories and associated synoptic situations. 9th International Congress on Aerobiology, Buenos Aires, Argentina, 2010.
- Pérez, C.F.; Latorre, F.; Ulke, G.; Alonso, C.A. Retro-trayectorias de masas de aire asociadas a la llegada de polen del Bosque Montano de Yungas a la ciudad de Diamante (Entre Ríos). Congremet XI, Buenos Aires, Argentina, 2012.
- Luebert, F.; Pliscoff, P. Sinopsis bioclimática y vegetacional de Chile, 3rd ed.; Publisher: Editorial Universitaria, Santiago, Chile, 2017; pp. 154–196. [Google Scholar]
- Oyarzabal, M.; Clavijo, J.; Oakley, L.; Biganzoli, F.; Tognetti, P.; Barberis, I.; Maturo, H.M.; Aragón, R.; Campanello, P.I.; Prado, D.; Oesterheld, M.; León, R.J.C. Unidades de vegetación de la Argentina. Ecol. Aust. 2018, 20, 40–63. [Google Scholar] [CrossRef]
- Arturi, M.F.; Grau, H.R.; Aceñolaza, P.G.; Brown, A.D. Estructura y sucesión en bosques montanos del noroeste de Argentina. Rev. Biol. Trop. 1998, 46, 525. [Google Scholar] [CrossRef]
- Draxler, R.R.; Hess, G.D. Description of the HYSPLIT 4 modeling system; NOAA Technical Memorandum ERL ARL224, 25pp.
- Draxler, R.R.; Hess, G.D. An overview of the HYSPLIT 4 modeling system for trajectories, dispersion and deposition. Aust. Meteorol. Mag. 1998, 47, 295–308. [Google Scholar]
- Stein, A.F.; Draxler, R.R.; Rolph, G.D.; Stunder, B.J.B.; Cohen, M.D.; Ngan, F. NOAA’s HYSPLIT atmospheric transport and dispersion modeling system. Bull. Am. Meteorol. Soc. 1998, 96, 2059–2077. [Google Scholar] [CrossRef]
- Bonner, W.D. Climatology of the Low Level Jet. Mon. Wea. Rev. 1968, 96, 833–850. [Google Scholar] [CrossRef]
- Oliveira, M.I.; Nascimento, E.L.; Kannenberg, C. A new look at the identification of low-level jets in South America. Mon. Wea. Rev. 2018, 146, 2315–2334. [Google Scholar] [CrossRef]
- Oliveira, M.I.; Nascimento, E.L.; Kannenberg, C. A new look at the identification of low-level jets in South America. J. Geophys. Res. Atmos. 2019, 124, 1200–1218. [Google Scholar] [CrossRef]
- Seluchi, M.E.; Saulo, A.C.; Nicolini, M.; Satyamurty, P. The northwestern Argentinean low: A study of two typical events. Mon. Wea. Rev. 2003, 131, 2361–2378. [Google Scholar] [CrossRef]
- Nicolini, M.; Saulo, C.; Torres, C.J.; Salio, P. Strong South American low-level jet events characterization during warm season and implications for enhanced precipitation. Meteorologica. Special Issue on South American Monsoon System 2002, 27, 59–69. [Google Scholar]
- Salio, P.V. Caracterización de eventos de corriente en chorro en capas bajas de la atmósfera en base a reanálisis y la precipitación asociada en el Sudeste de Sudamérica. Tesis Doctoral, Universidad de Buenos Aires, Buenos Aires, Argentina, 2002.
- Salio, P.; Nicolini, M.; Zipser, E.J. Mesoscale Convective Systems over Southeastern South America and Their Relationship with the South American Low-Level Jet. Mon. Wea. Rev. 2007, 135, 1290–1309. [Google Scholar] [CrossRef]
- Nicolini, M.; Garcia Skabar, Y. Diurnal Cycle in convergence pattern in the boundary layer east of the Andes and convection. Atmos. Res. 2011, 100, 377–390. [Google Scholar] [CrossRef]
- Marticorena, C.; Rodríguez, R. Flora de Chile I, Universidad de Concepción: Santiago, Chile, 1995; 157 pp.
- Furlow, J.J. The systematics of the American species of Alnus (Betulaceae). Part I. Rhodora 1979, 81, 1–121. [Google Scholar]
- Gómez, L.D. Vegetación de Costa Rica, EUNED: San José, Costa Rica, 1986; 327 pp.
- Rich, P.V. ; Rich. T.H. The Central American dispersal route: biotic history and paleogeography. In Costa Rican Natural History; Janzen, D.H., Ed.; The University of Chicago: Chicago, Illinois, EEUU, 1983; pp. 12–34. [Google Scholar]
- Torres, G.R.; Pérez, C.F.; Lupo, L.C. Altitudinal patterns of wind transport and deposition of Yungas tree pollen in northwestern Argentina: Implications for interpreting the Quaternary fossil record. Palaeogeography, Palaeoclimatology, Palaeoecology 2019, 520, 66–77. [Google Scholar] [CrossRef]
- Hooghiemstra, H.; Wijninga, V.M.; Cleef, A.M. The paleobotanical record of Colombia: implications for biogeography and biodiversity. Ann. Mo. Bot. Gard. 2006, 93, 377–390. [Google Scholar] [CrossRef]
- Bianchi, M.M.; Olabuenaga, S.E. A 3-year airborne pollen and fungal spores record in San Carlos de Bariloche, Patagonia, Argentina. Aerobiologia 2006, 22, 247–257. [Google Scholar] [CrossRef]
- Bianchi, M.M.; Olabuenaga, S.E.; Dzendoletas, M.; CrIvelli, E.S. El registro polínico atmosférico de San Carlos De Bariloche: septiembre 2001- septiembre 2002. Rev. Mus. Argentino Cienc. Nat. 2004, 6, 1–7. [Google Scholar]
- Ayma-Romay, A.I.; Sanzetenea, E.S. Variaciones fenológicas de especies de Podocarpaceae en estación seca de los Yungas (Cochabamba, Bolivia). Ecología en Bolivia 2008, 43, 16–28. [Google Scholar]
- García de Albano, M.E. Lluvia polínica en selvas montanas de la provincia de Tucumán, Argentina. Rev. Mus. Argentino Cienc. Nat. 2006, 8, 159–164. [Google Scholar] [CrossRef]
- García, M.E.; Reyes, N.J.; Espeche, M.L.; Ordano, M.; Lamelas, C.; Forciniti, J.; Gómez, L.S. Strong seasonal effects and long-term weather-related factors drive the temporal variability of airborne pollen in the atmosphere of San Miguel de Tucumán, Argentina. Grana 2021, 60, 372–384. [Google Scholar] [CrossRef]
- Pinazo, M.A.; Gasparri, N.I.; Goya, J.F.; Arturi, M.F. Caracterización estructural de un bosque de Podocarpus parlatorei y Juglans australis en Salta, Argentina. Rev. Biol. Trop. 2003, 51, 361–368. [Google Scholar] [PubMed]
- Quiroga, M.P.; Premoli, A.C. El rol de las poblaciones marginales en la conservación del acervo genético de la única conífera del sur de Yungas en Argentina y Bolivia, Podocarpus parlatorei (Podocarpaceae). Ecología en Bolivia 2013, 48, 4–16. [Google Scholar]
- Swenson, U.; Hill, R.S.; McLoughlin, S. , 2001. Biogeography of Nothofagus supports the sequence of Gondwana break-up. Taxon 2001, 50, 1025–1041. [Google Scholar] [CrossRef]
- Lyn, G.C.; Michael, D.C. 2005. Not so ancient: the extant crown group of Nothofagus represents a post-Gondwanan radiation. In Proceedings of the Royal Society of Biology, Biological Sciences, 2005, 272, 2535–2544. [Google Scholar]
- Piovano, E.L.; Ariztegui, D.; Córdoba, F.; Cioccale, M.; Sylvestre, F. Hydrological Variability in South America below the Tropic of Capricorn (Pampas and Patagonia, Argentina) during the last 13.0 Ka. In Past Climate Variability in South America and Surrounding Regions. Developments in Paleoenvironmental Research, 14; Vimeux, F., Sylvestre, F., Khodri, M., Eds.; Springer: Dordrecht, The Netherlands, 2009. [Google Scholar]
- Troin, M.; Vallet-Coulomb, C.; Sylvestre, F.; Piovano, E. Hydrological modelling of a closed lake (Laguna Mar Chiquita, Argentina) in the context of 20th century climatic changes. Journal of Hydrology 2010, 393, 233–244. [Google Scholar] [CrossRef]
- Hooper, J.; Marx, S.K.; May, J.H.; Lupo, L.C.; Kulemeyer, J.J.; Pereira, E.D.L.Á.; et al. Dust deposition tracks late-Holocene shifts in monsoon activity and the increasing role of human disturbance in the Puna-Altiplano, northwest Argentina. The Holocene 2020, 30, 519–536. [Google Scholar] [CrossRef]
- Jara, I.A.; Maldonado, A.; de Porras, M.E. Late Holocene dynamics of the South American summer monsoon: New insights from the Andes of northern Chile (21°S). Quat. Sci. Rev. 2020, 246, 106533. [Google Scholar] [CrossRef]
- Jara, I.A.; Maldonado, A.; de Porras, M.E. Did modern precipitation drivers influence centennial trends in the highlands of the Atacama Desert during the most recent millennium? Geo. Res. Lett. 2022, 49, e2021GL095927. [Google Scholar] [CrossRef]
- Kock, S.T.; Schittek, K.; Mächtle, B.; Maldonado, A.; Vos, H.; Lupo, L.C.; et al. (2020). Multi-centennial-scale variations of South American summer monsoon intensity in the southern central Andes (24–27°S) during the late Holocene. Geo. Res. Lett. 2020, 47, e2019GL084157. [Google Scholar] [CrossRef]
- Lücke, A.; Kock, S.; Wissel, H.; Kulemeyer, J.J.; Lupo, L.C.; Schabitz, F.; et al. (2022) Hydroclimatic record from an Altiplano cushion peatland 24°S indicates large-scale reorganization of atmospheric circulation for the late Holocene. PLoS ONE 2020, 17, e0277027. [Google Scholar]
- Torres, G.; Lupo, L.; Pérez, C. Reconstruction of the environmental conditions for the past 2,000 years in the Perico River basin (NW Argentina) based on fossil pollen records. Veg. Hist. Archaeobot. 2023, 32, 235–251. [Google Scholar] [CrossRef]
Figure 1.
(a) Even-hour Alnus trajectories arriving at 1500 m a.s.l. from 14 UTC of August 31st - 12 UTC of September 1st, 2013 and (b) 14 UTC of September 1st - 12 UTC of September 2nd, 2013.
Figure 1.
(a) Even-hour Alnus trajectories arriving at 1500 m a.s.l. from 14 UTC of August 31st - 12 UTC of September 1st, 2013 and (b) 14 UTC of September 1st - 12 UTC of September 2nd, 2013.
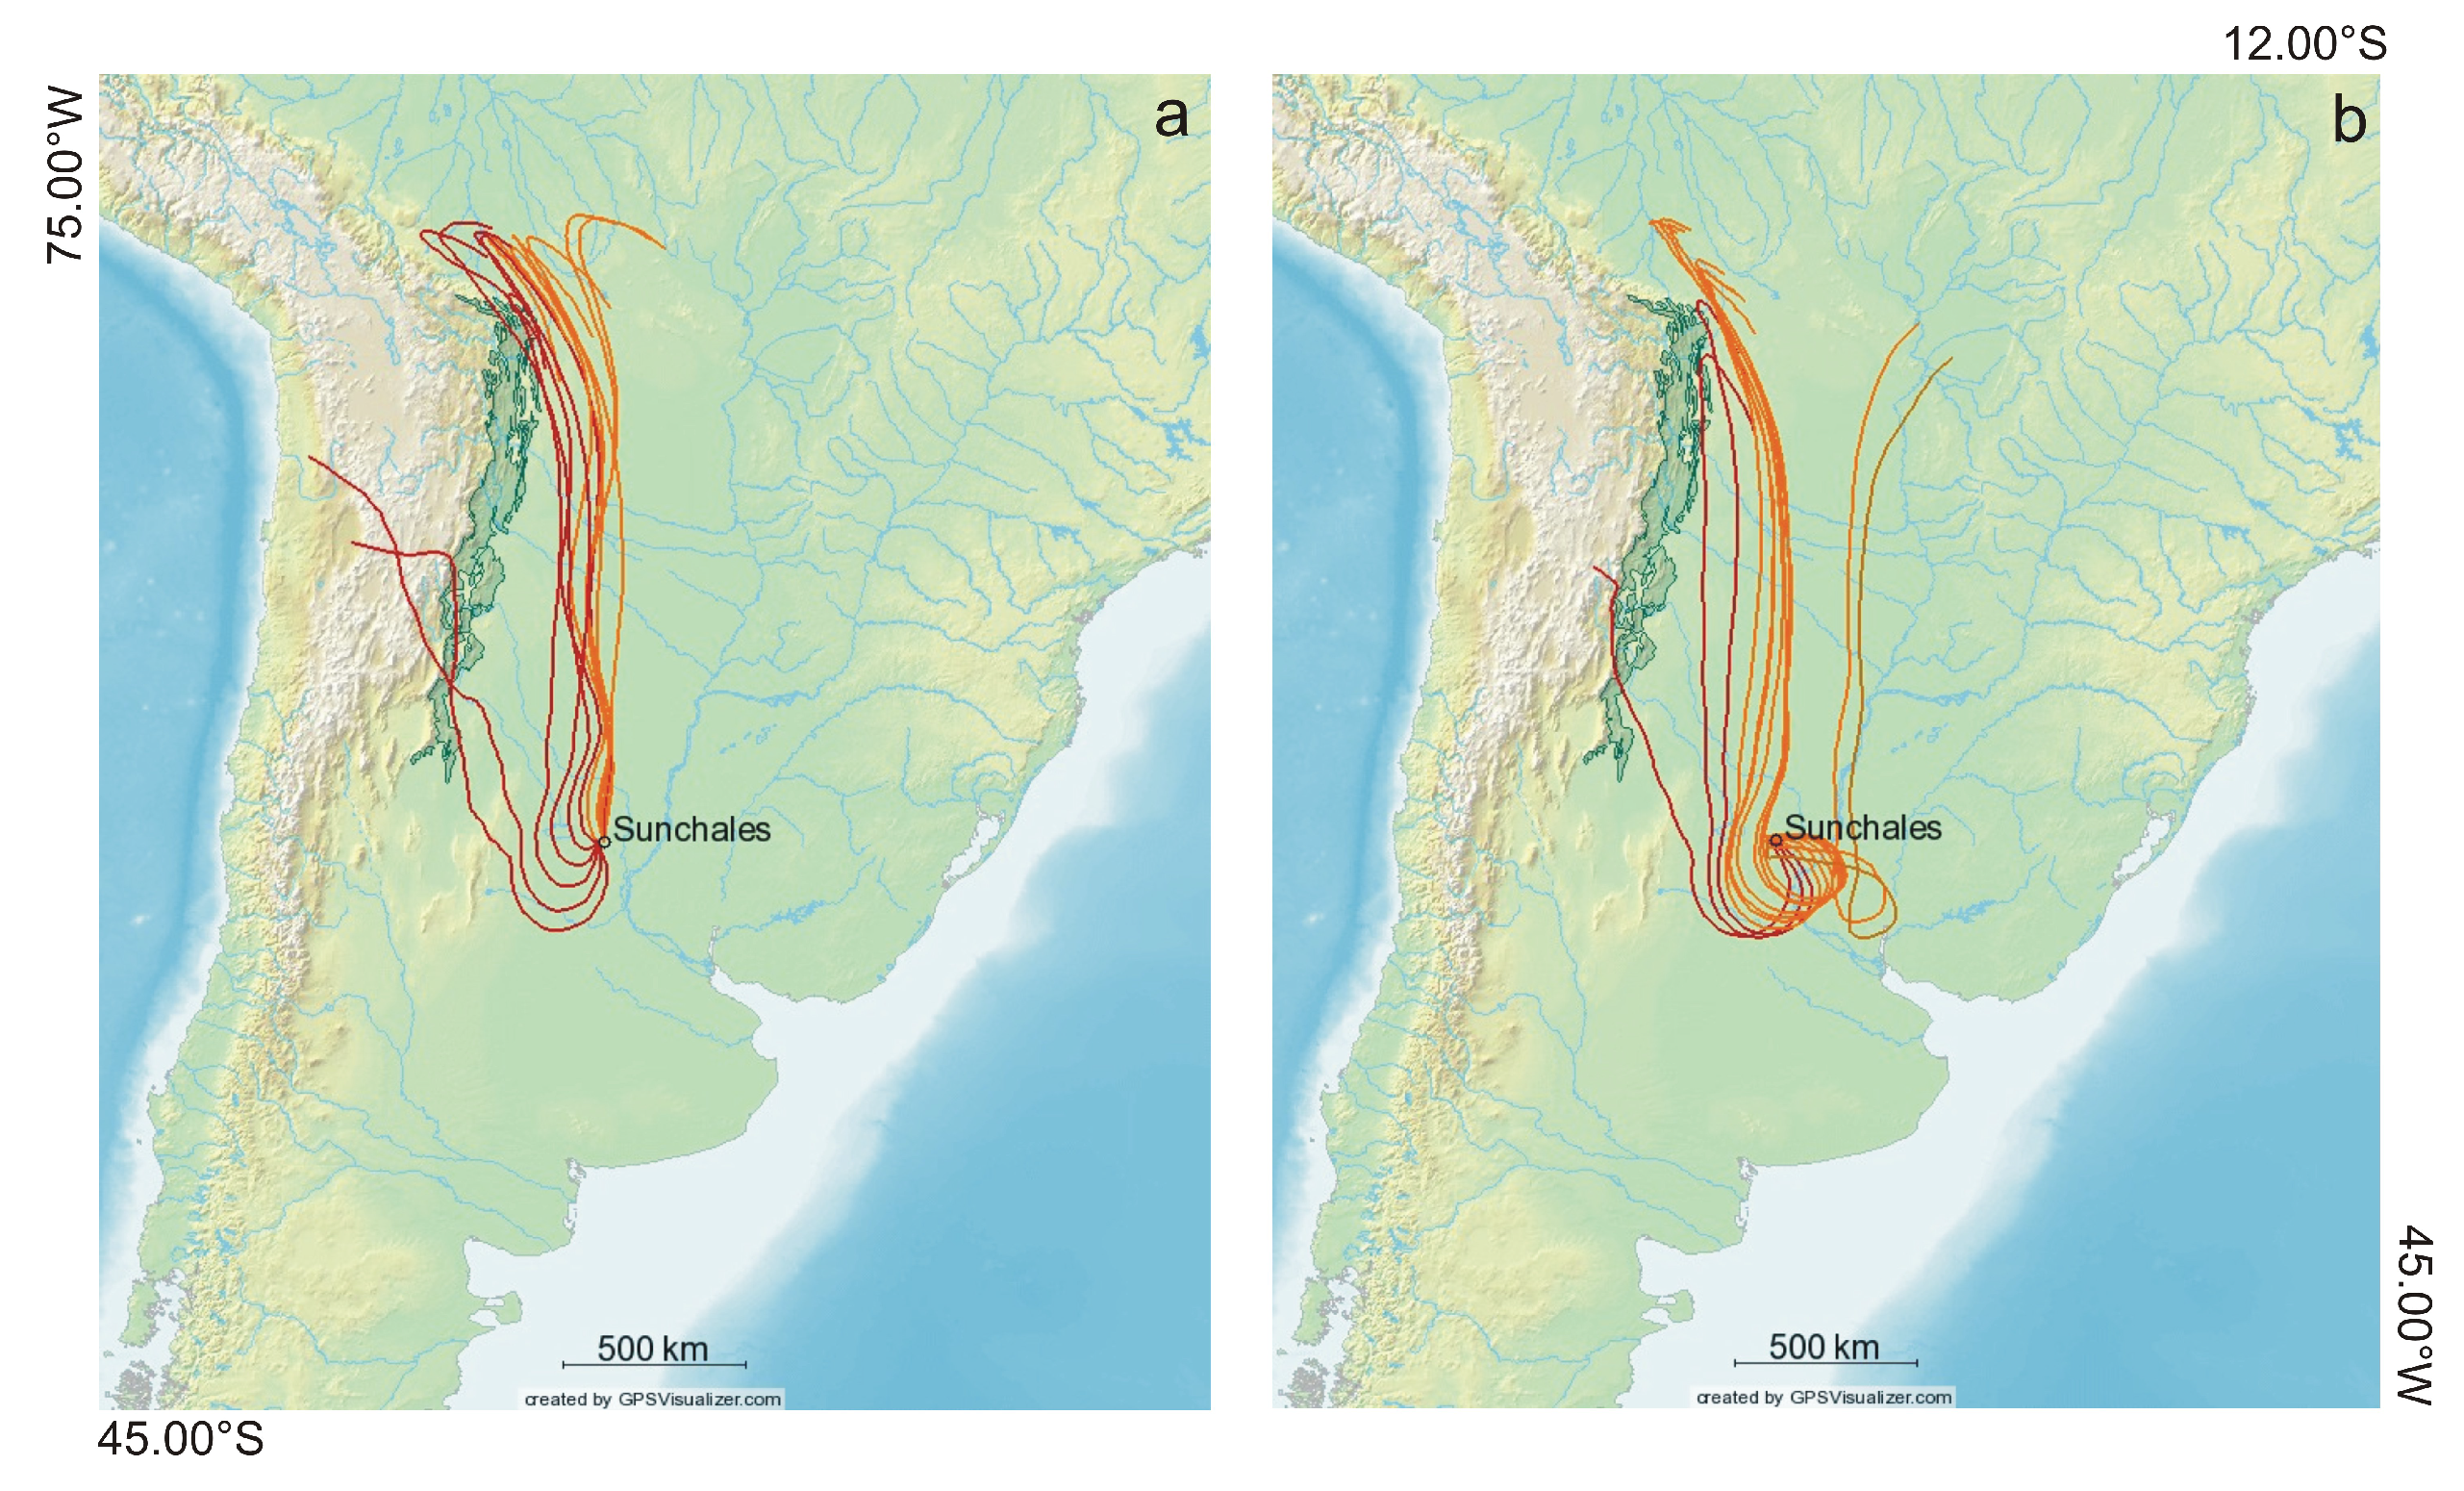
Figure 2.
Mean geopotential height at 1000 hPa (black solid lines) and 500/1000 hPa thickness fields (gray dashed lines) for the Alnus case study (August 31st - September 1st, 2013). The shaded area shows the highest heights of the Andes (above 1500 m).
Figure 2.
Mean geopotential height at 1000 hPa (black solid lines) and 500/1000 hPa thickness fields (gray dashed lines) for the Alnus case study (August 31st - September 1st, 2013). The shaded area shows the highest heights of the Andes (above 1500 m).
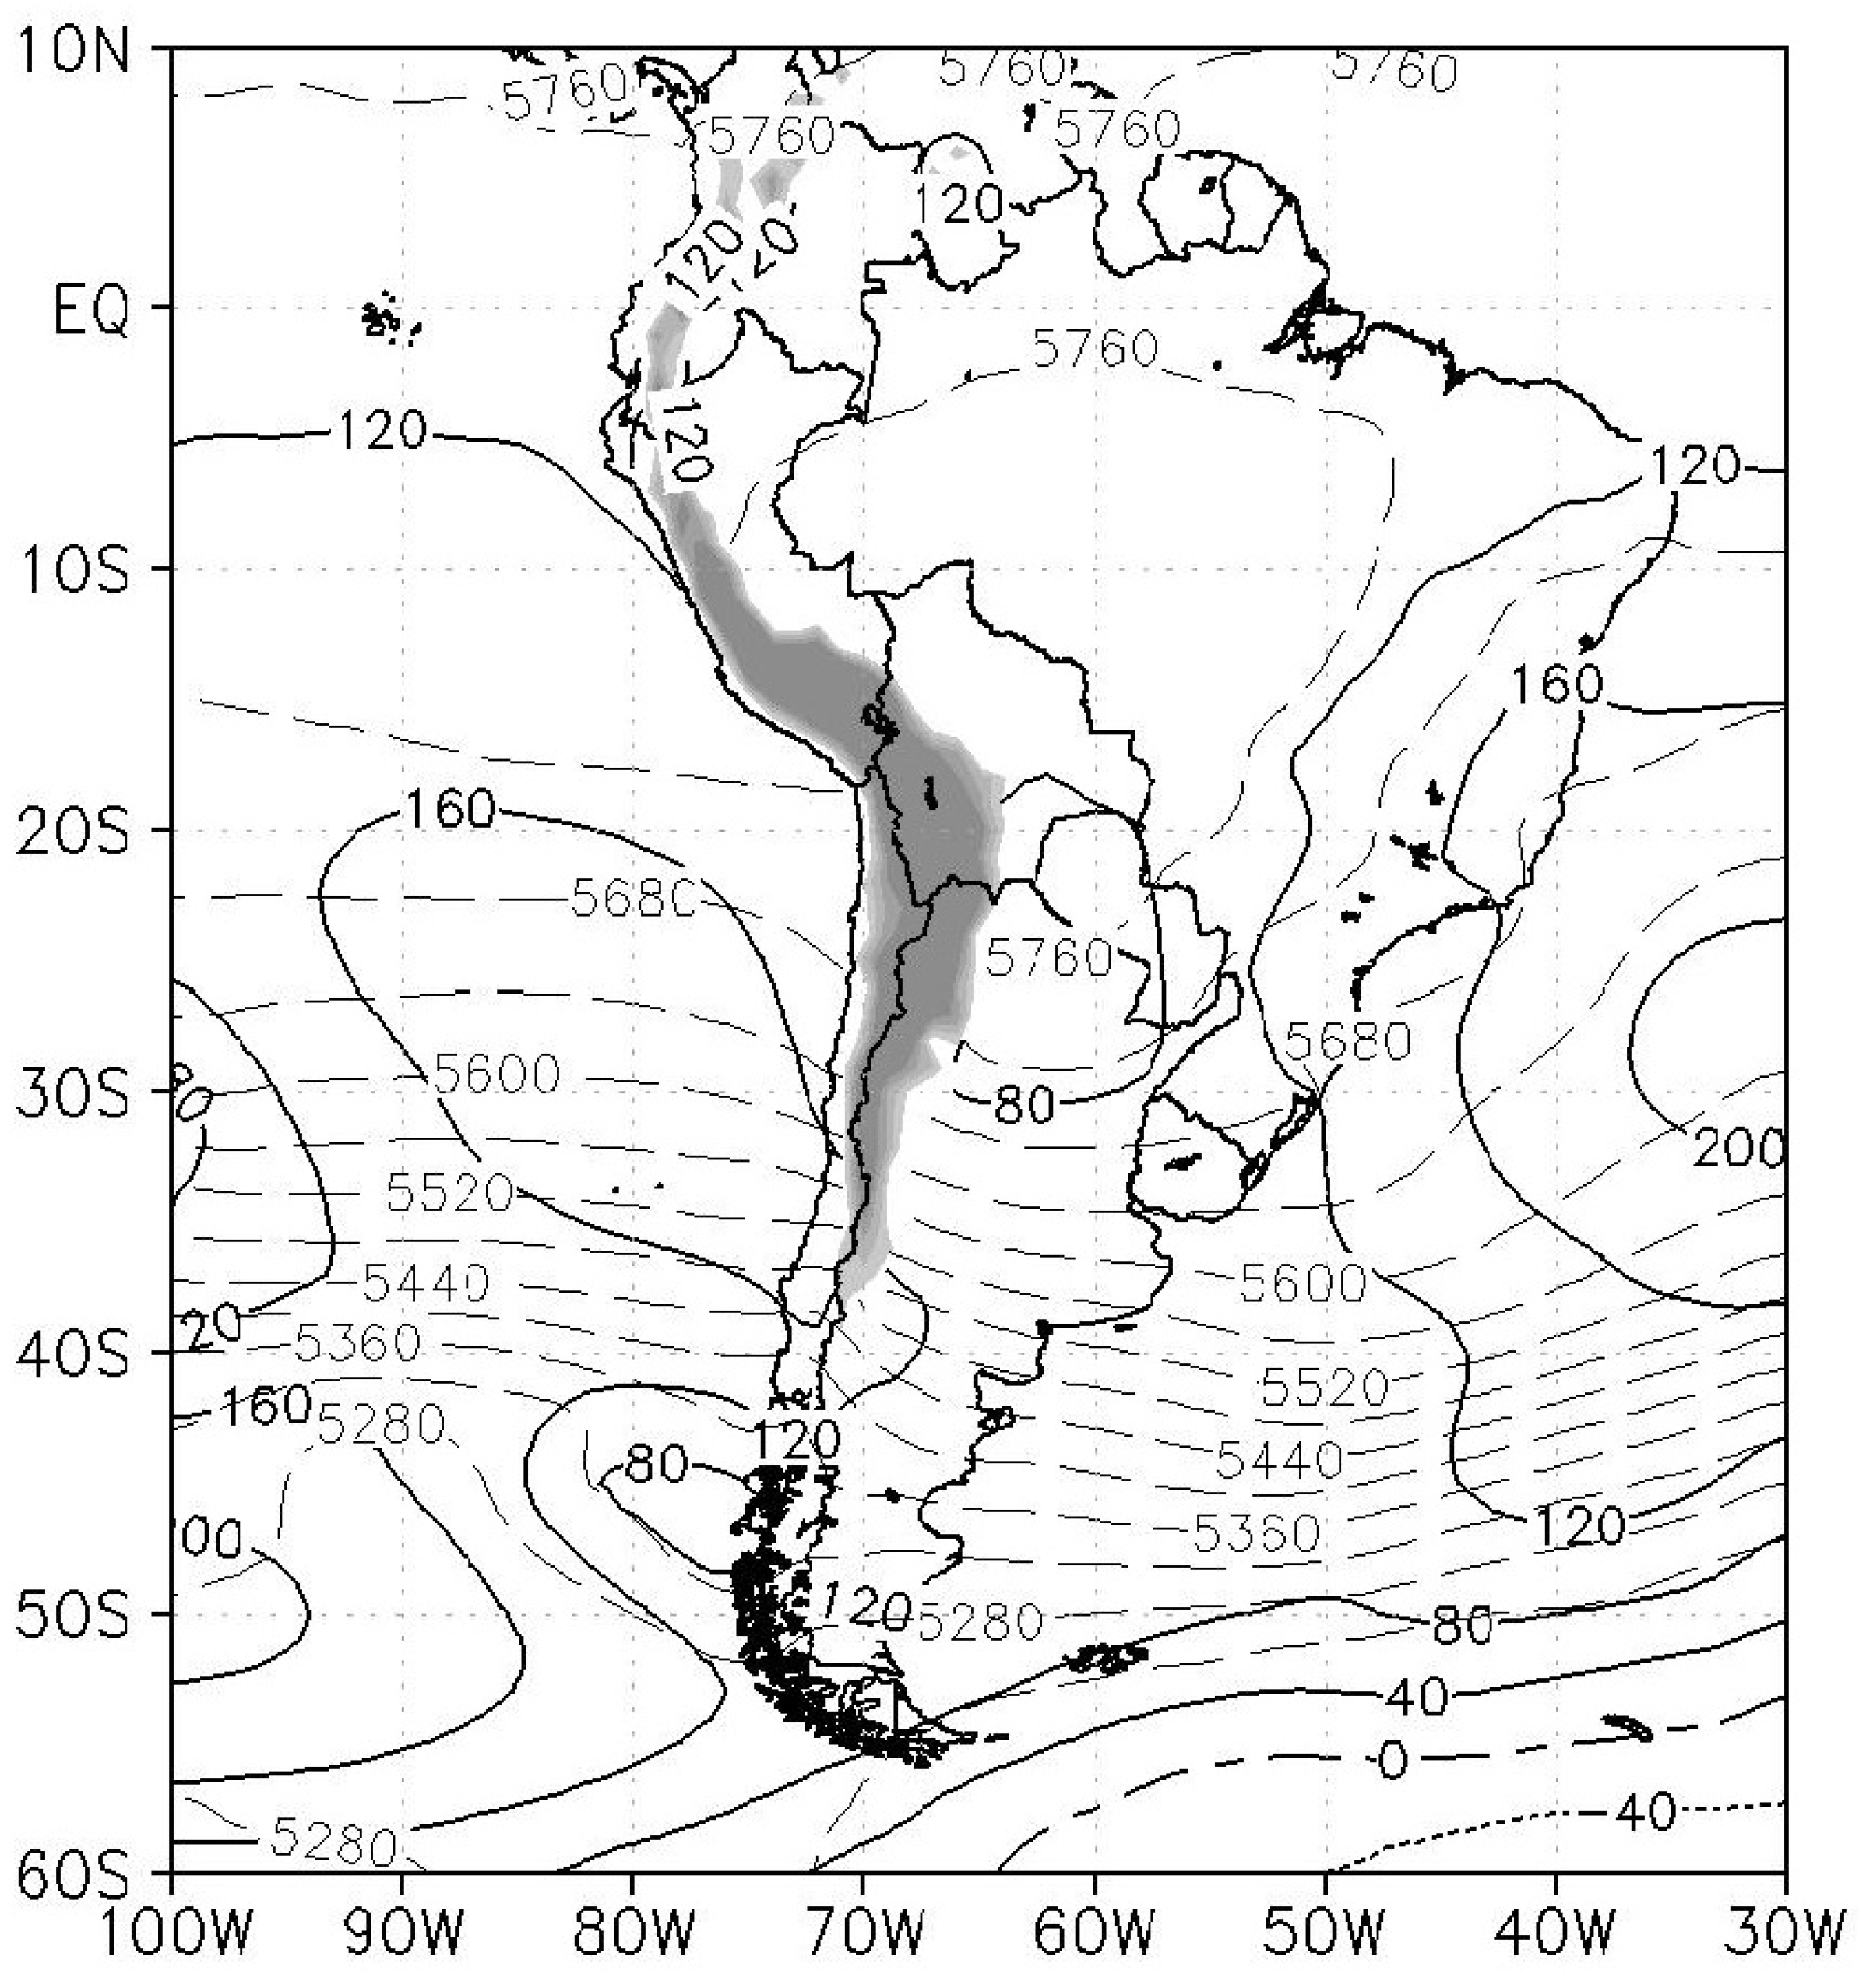
Figure 3.
850 hPa winds (vectors, m s) and areas satisfying the modified Bonner’s criteria for (a) 06 UTC August 31st and (b) 06 UTC September 1st showing the position of the cold front. Shading indicates wind speeds at 850 hPa greater than 12, 16, and 20 m s. White contours indicate 700/850 hPa wind difference greater than 6, 8,10 m s. Dashed line masks altitudes above 1500 m.
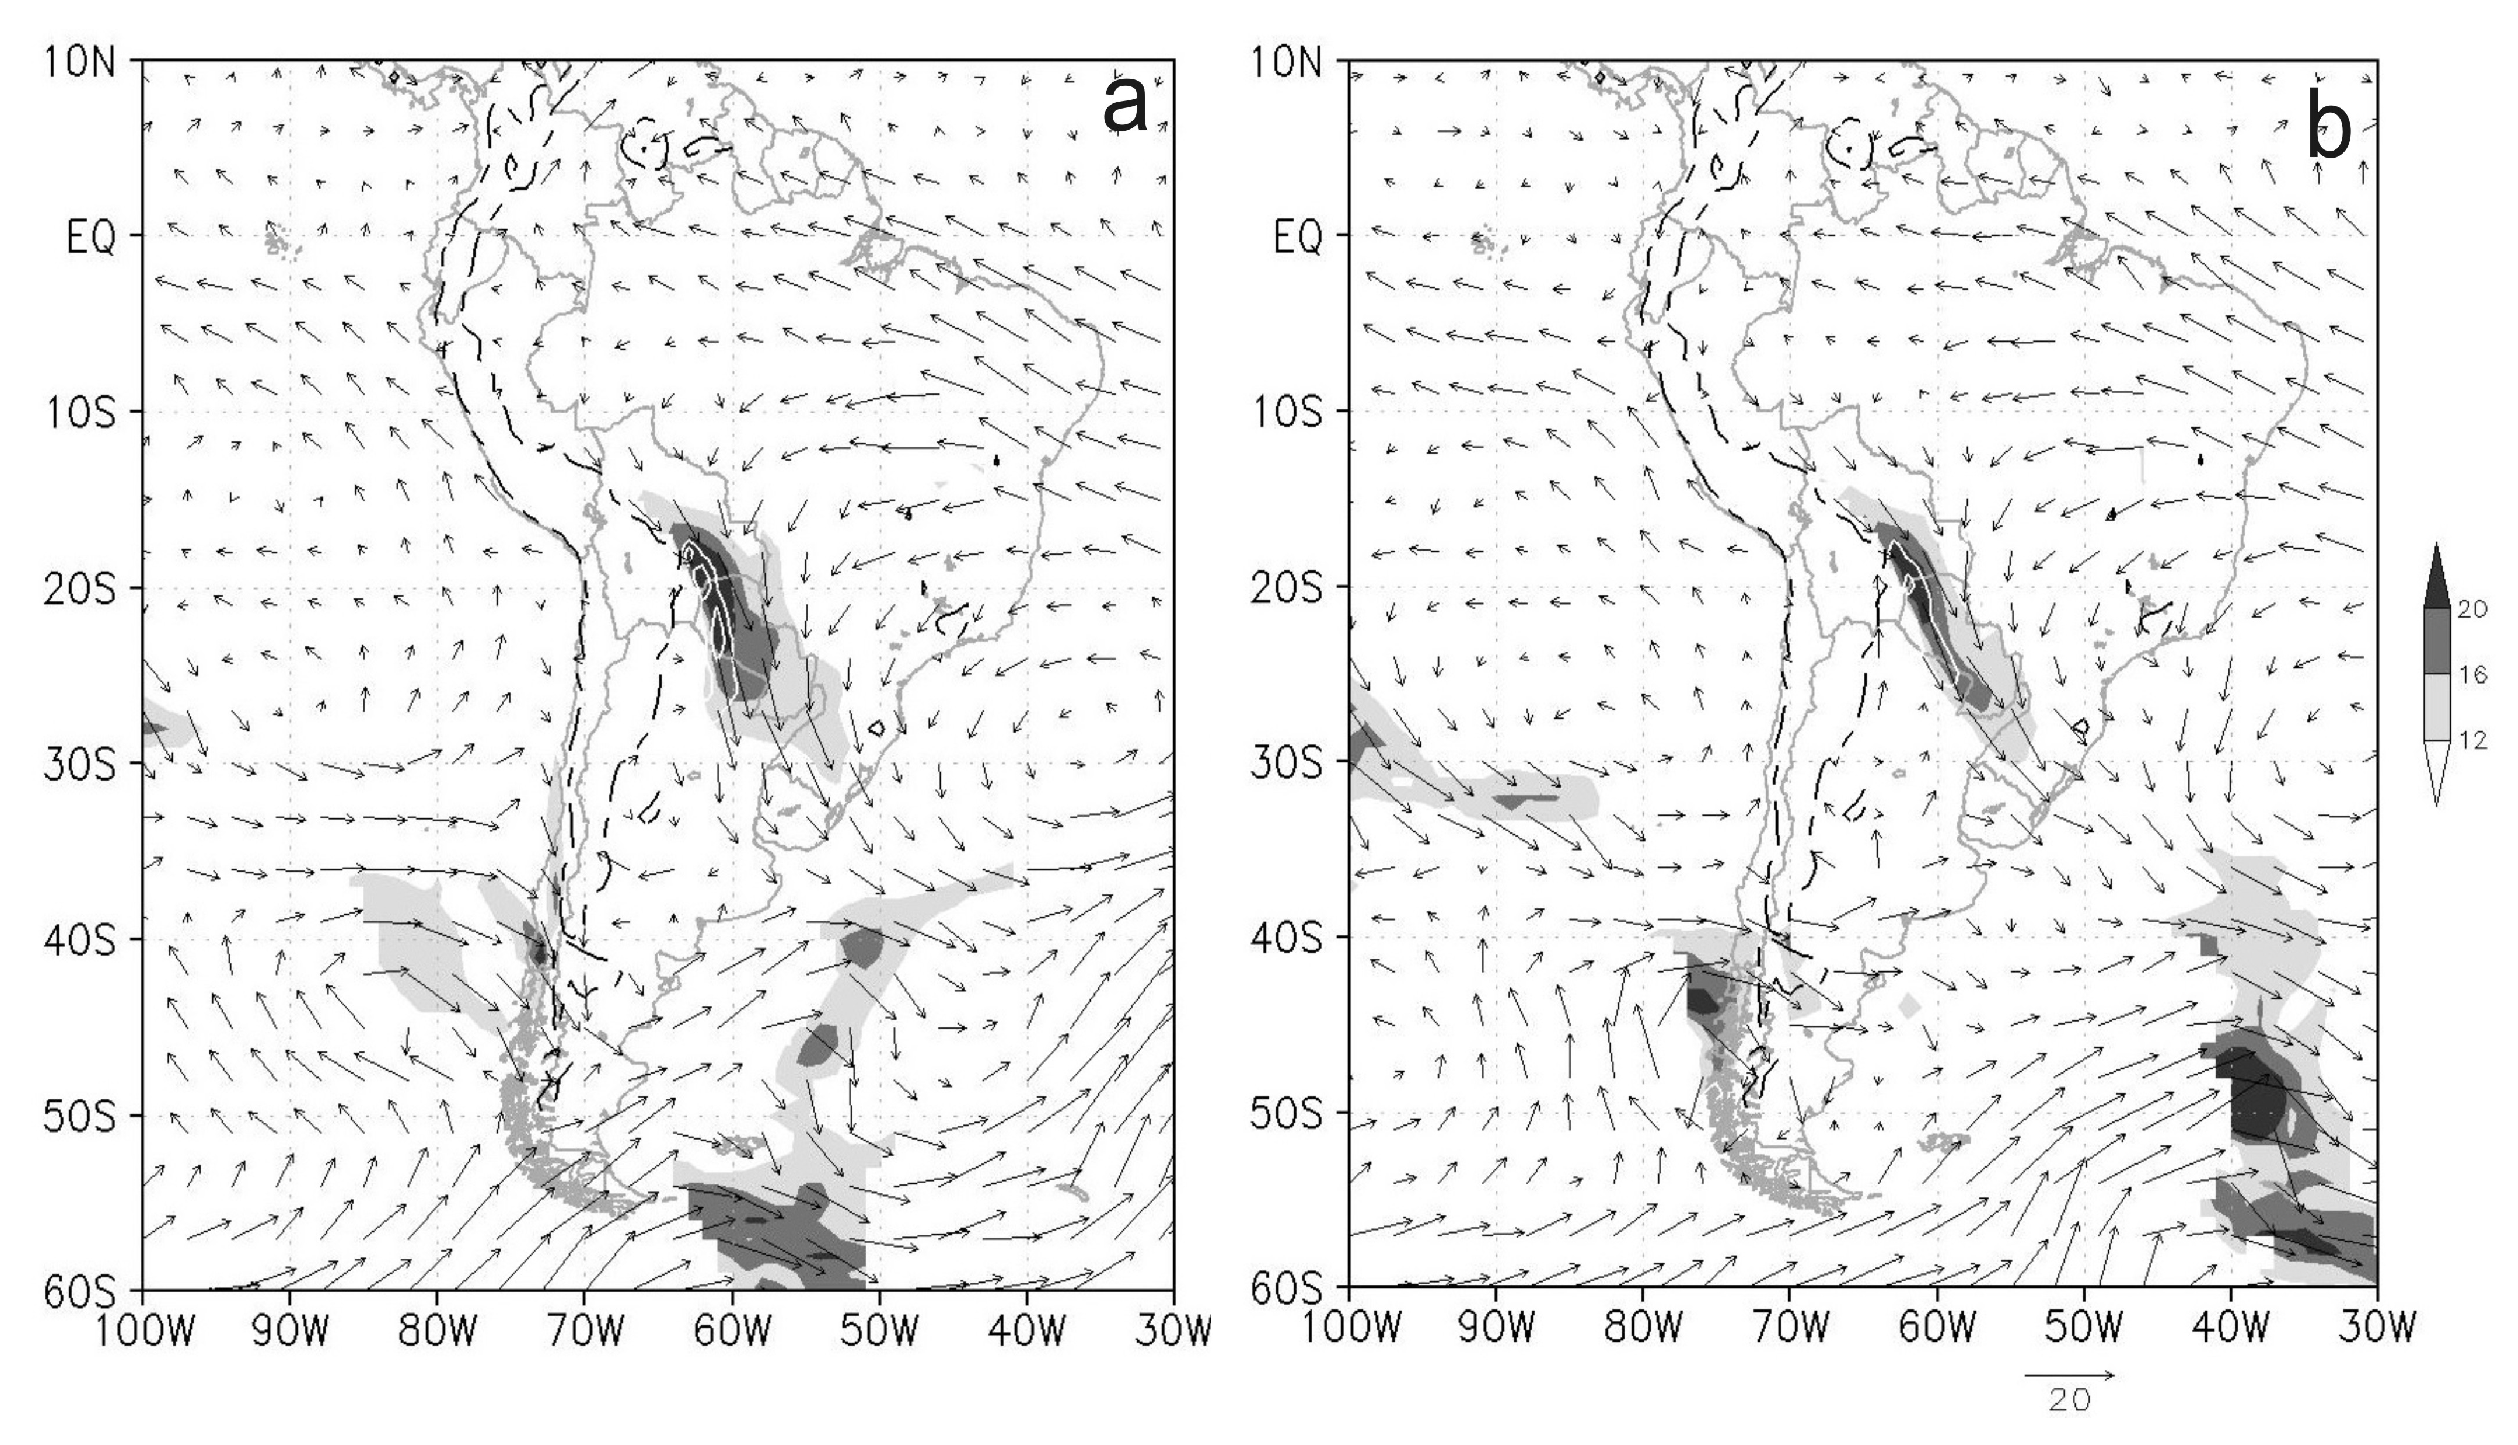
Figure 4.
800-750 hPa layer mean flow for 06 UTC August 31st (a) and 06 UTC September 1st showing the position of the cold front (b). The dashed line marks the 1500 m altitude while the shaded area masks altitudes higher than 3250 m. The color scale shows the horizontal wind intensity (m s).
Figure 4.
800-750 hPa layer mean flow for 06 UTC August 31st (a) and 06 UTC September 1st showing the position of the cold front (b). The dashed line marks the 1500 m altitude while the shaded area masks altitudes higher than 3250 m. The color scale shows the horizontal wind intensity (m s).
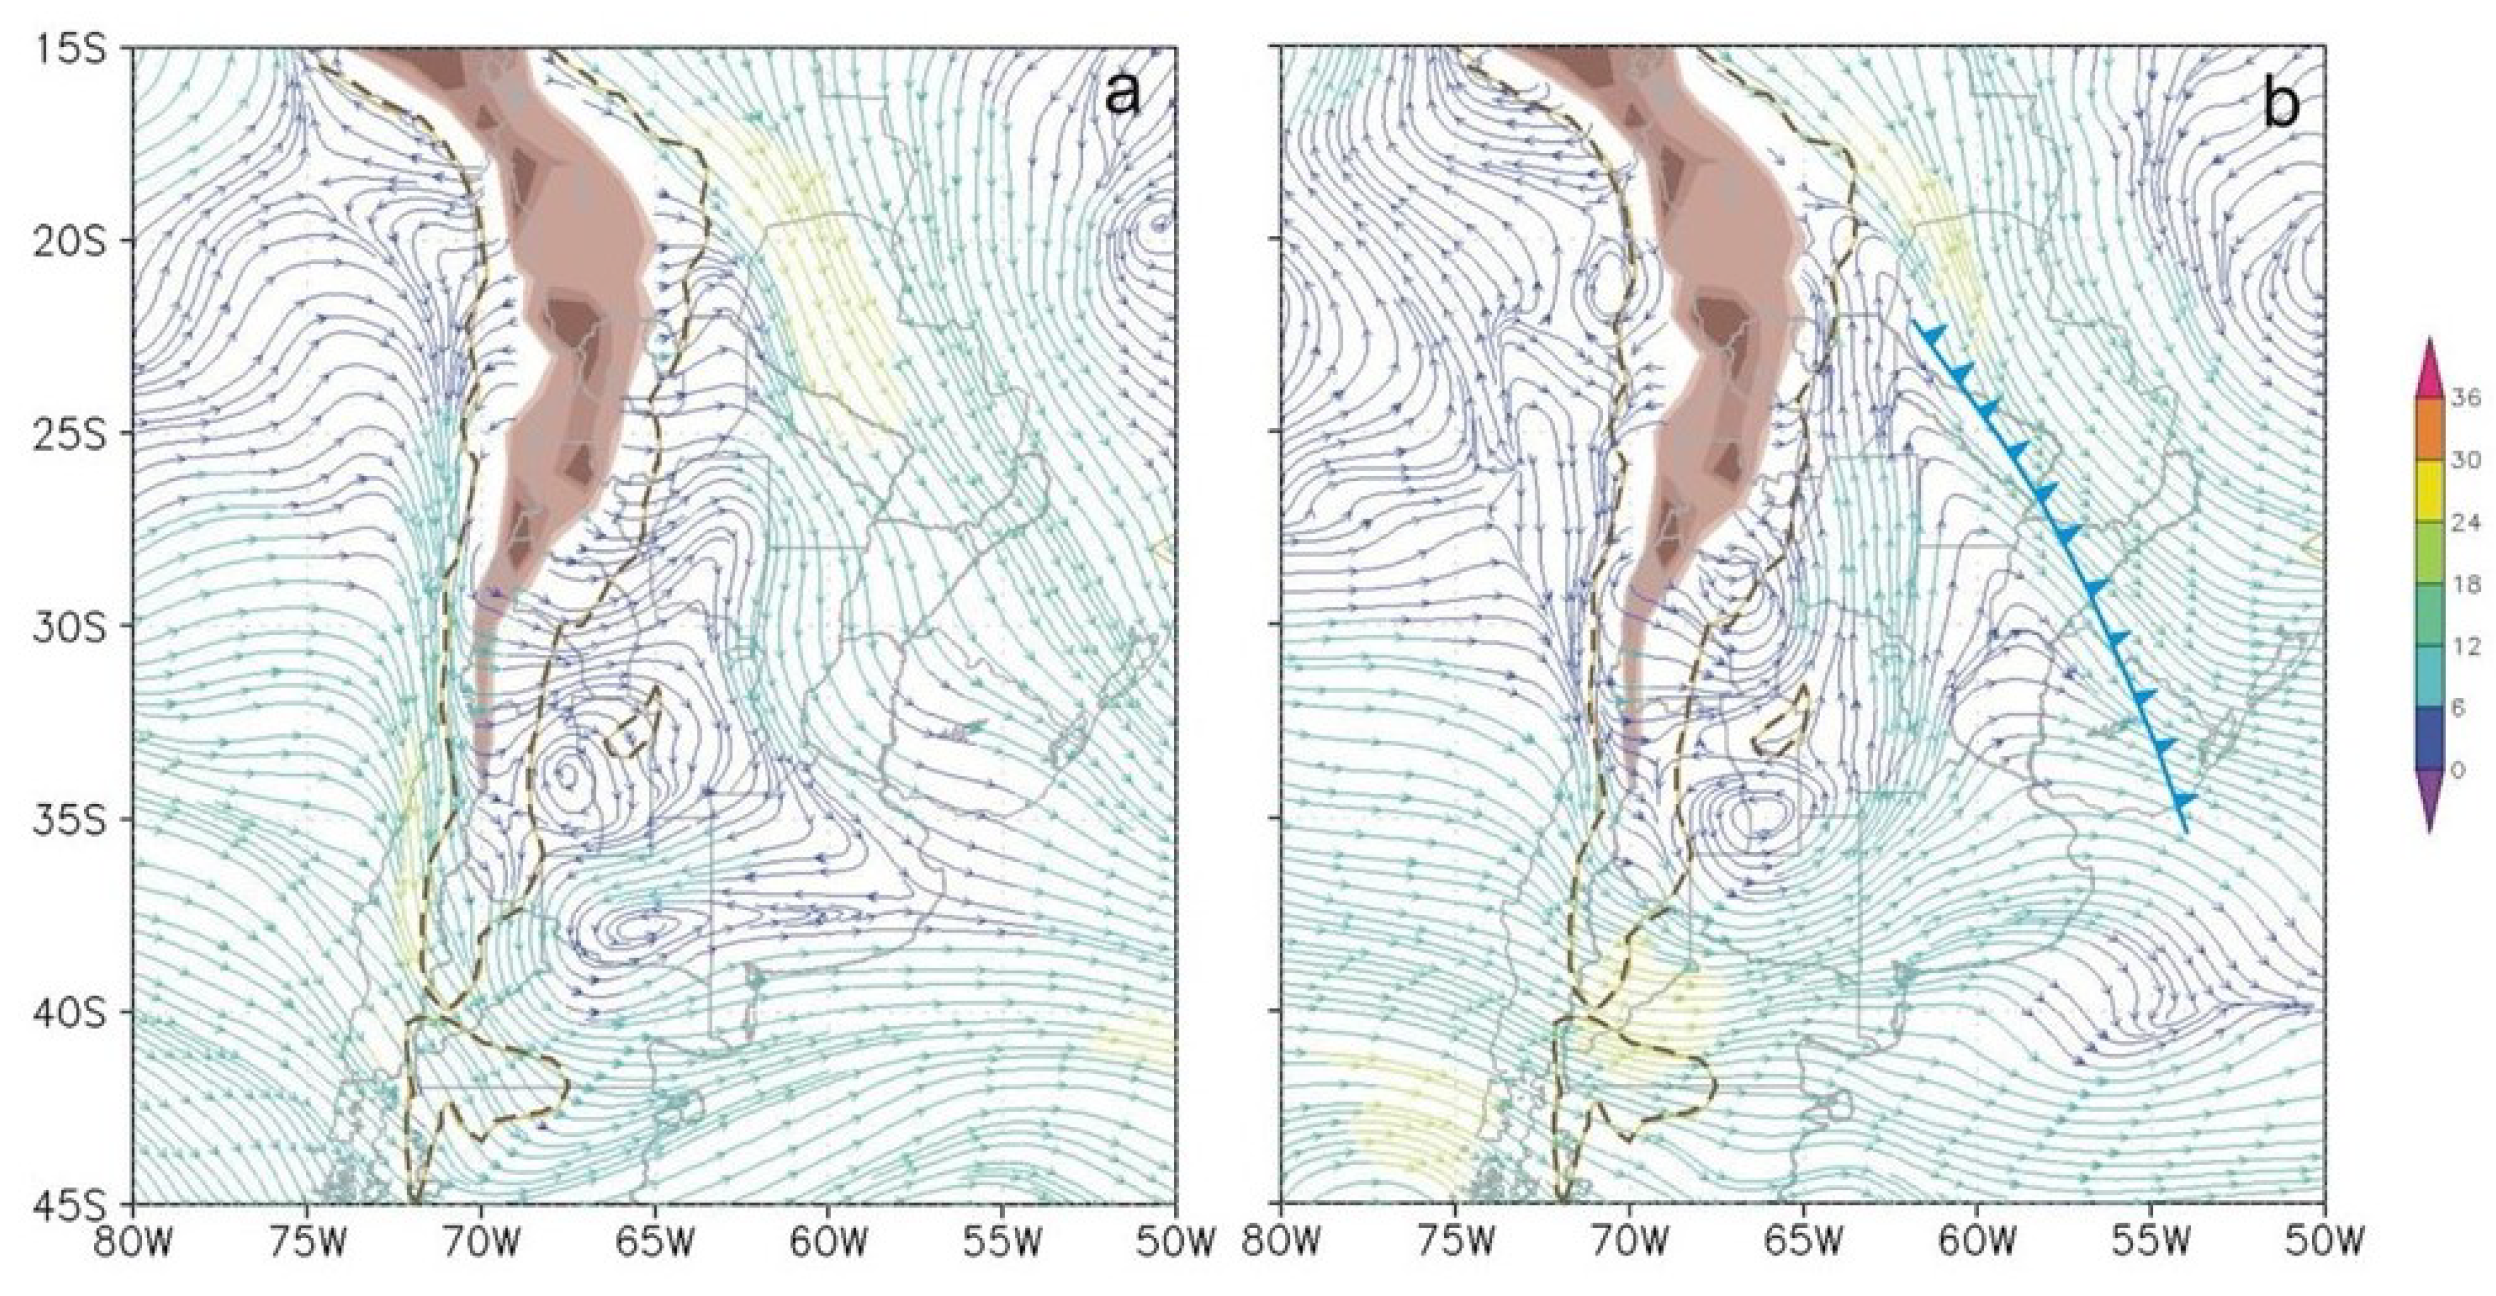
Figure 5.
Vertical cross-sections (30.97°S) showing the horizontal wind (vectors, m s) and omega (lines, Pa s) by the end of the SALLJ event. The star shows the position of Sunchales. Panels show the situation every 6 hours from August 30th to September 1st, 2013. The shaded area shows the Andes and Córdoba ranges. The star indicates the position of Sunchales.
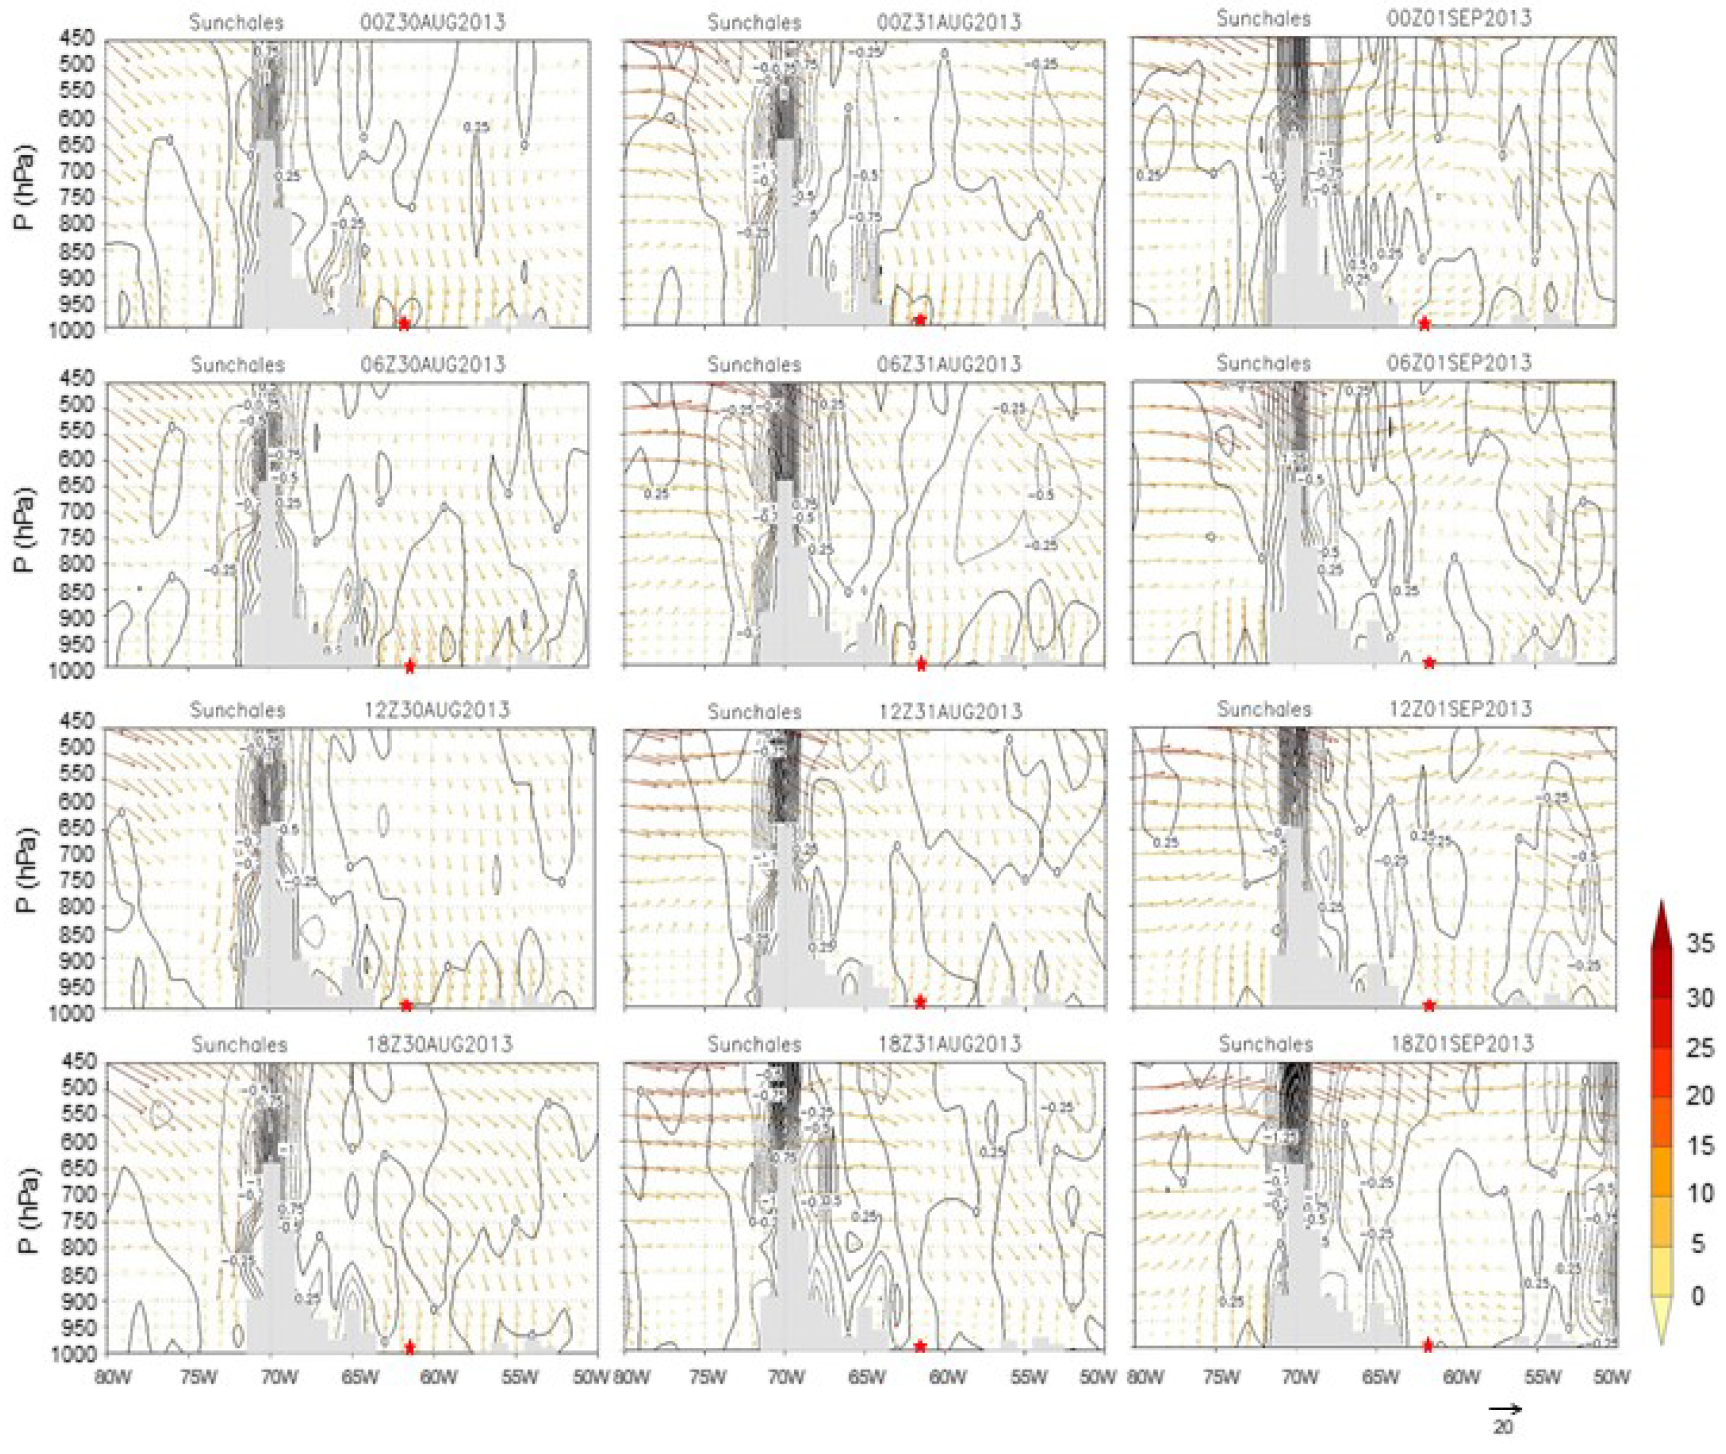
Figure 6.
Vertical cross-sections (19°S) showing the horizontal wind (vectors, m s) and omega (lines, Pa s) at the latitude where the SALLJ passes over the Yungas. Panels show the situation every 6 hours from August 29th to August 31st, 2013 when the event started. The shaded area shows the Andes and Brazilian ranges.
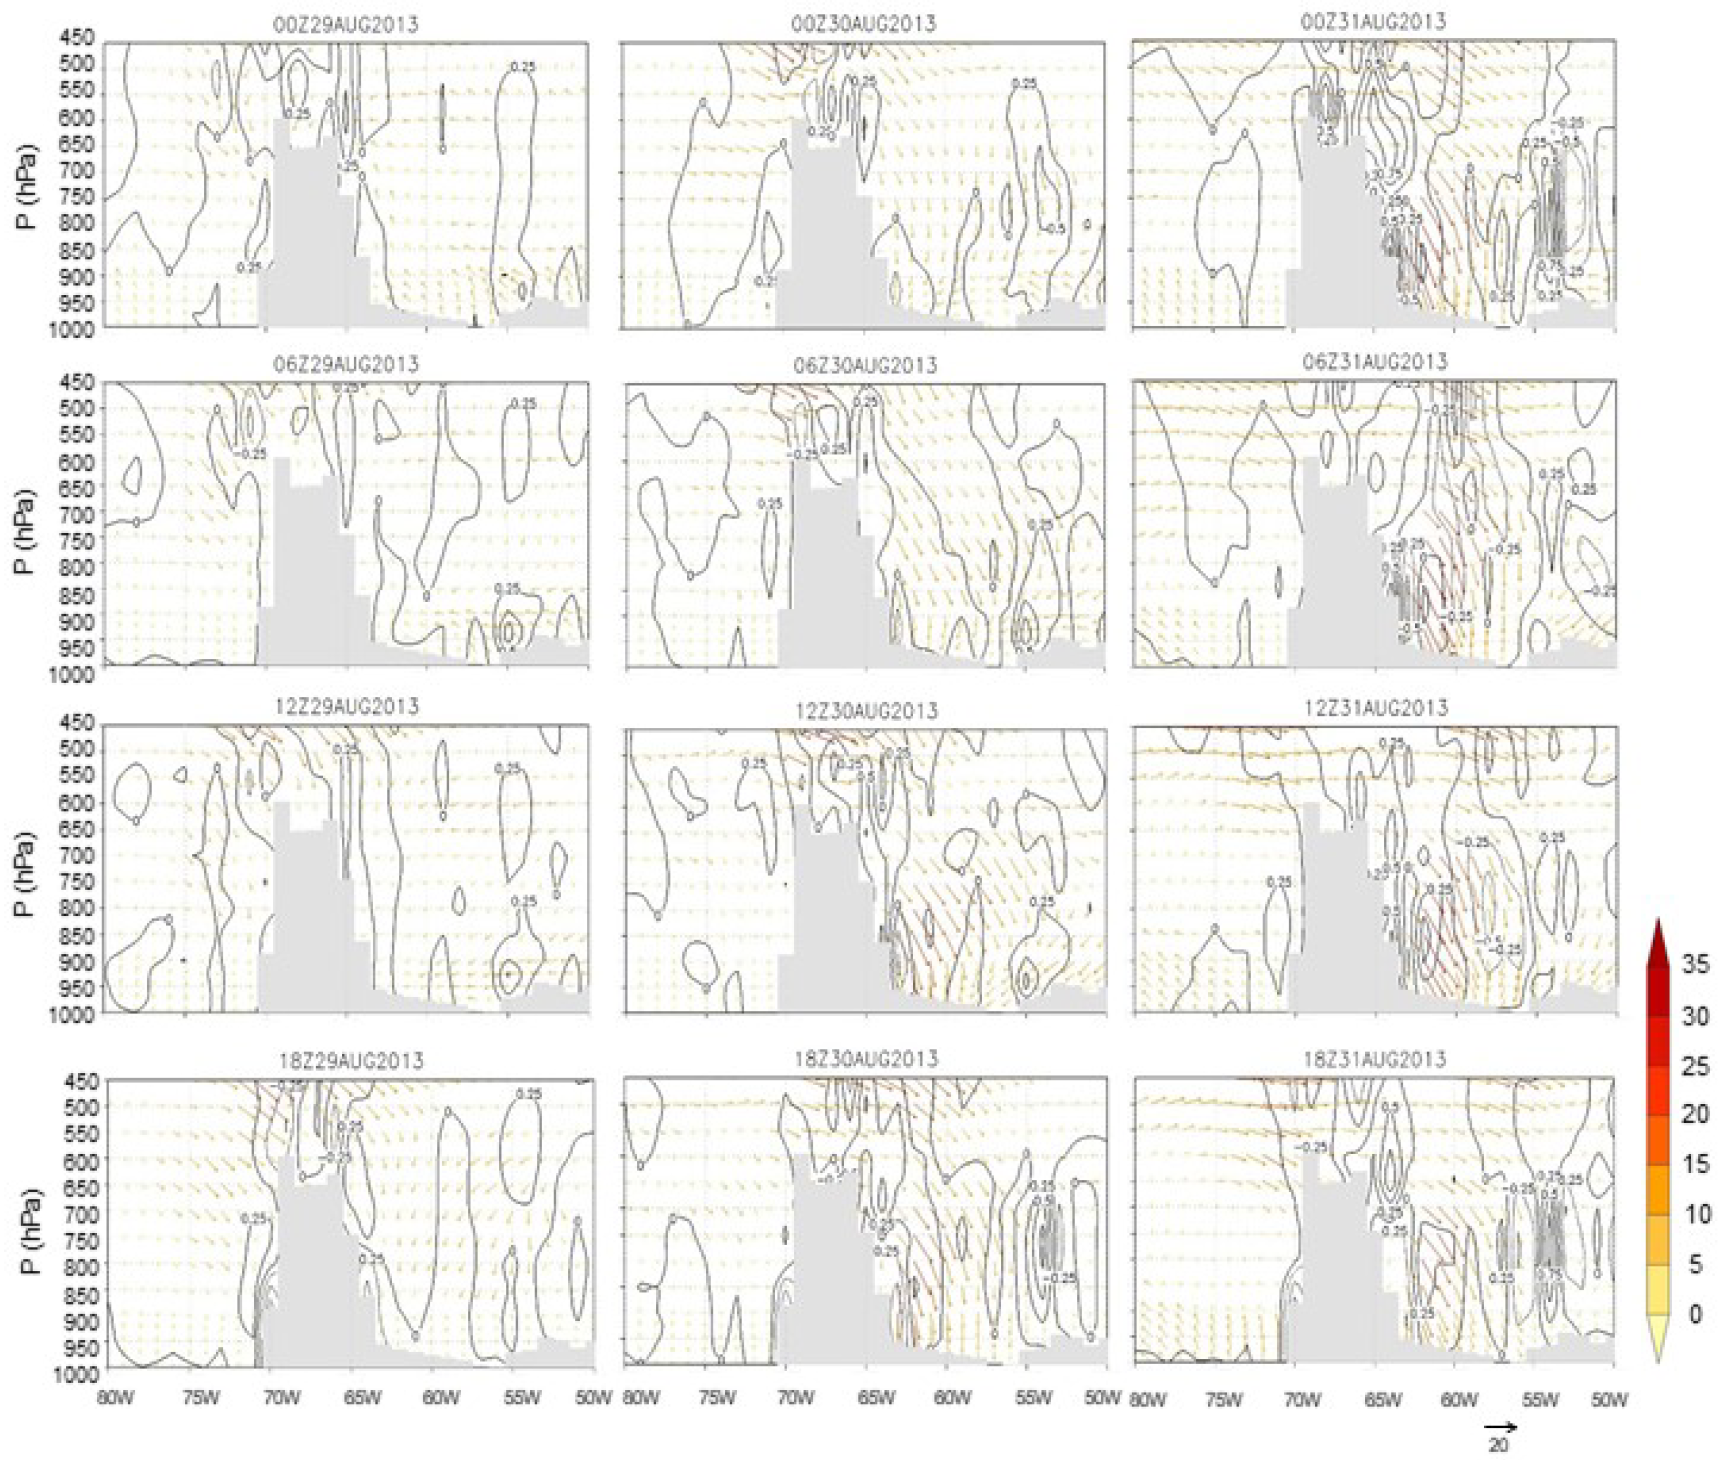
Figure 7.
Even-hour Nothofagus (a) and Podocarpus (b) trajectories arriving at 750 m a.s.l. on 14 UTC of November 24th - 12 UTC of November 25th, 2012, and 14 UTC October 24th - 12 UTC October 25th, 2013, respectively. Light-colored lines show trajectories not passing over the pollen source area (see text). Straight lines represent the construction cuts of the Hovmöller diagrams in Figure 8 and Figure 9. The shaded area shows the geographic distribution of the Subantarctic forests.

Figure 8.
Hovmöller diagram for Nothofagus case study from November 15th to December 1st, 2012. The space cut corresponds to the straight line of Figure 7a. Lines show the 700 hPa geopotential height (gpm) and shaded areas, 700 hPa omega (Pa s). The lower panel shows the associated topography and the vertical line represents the geographical location of Sunchales.
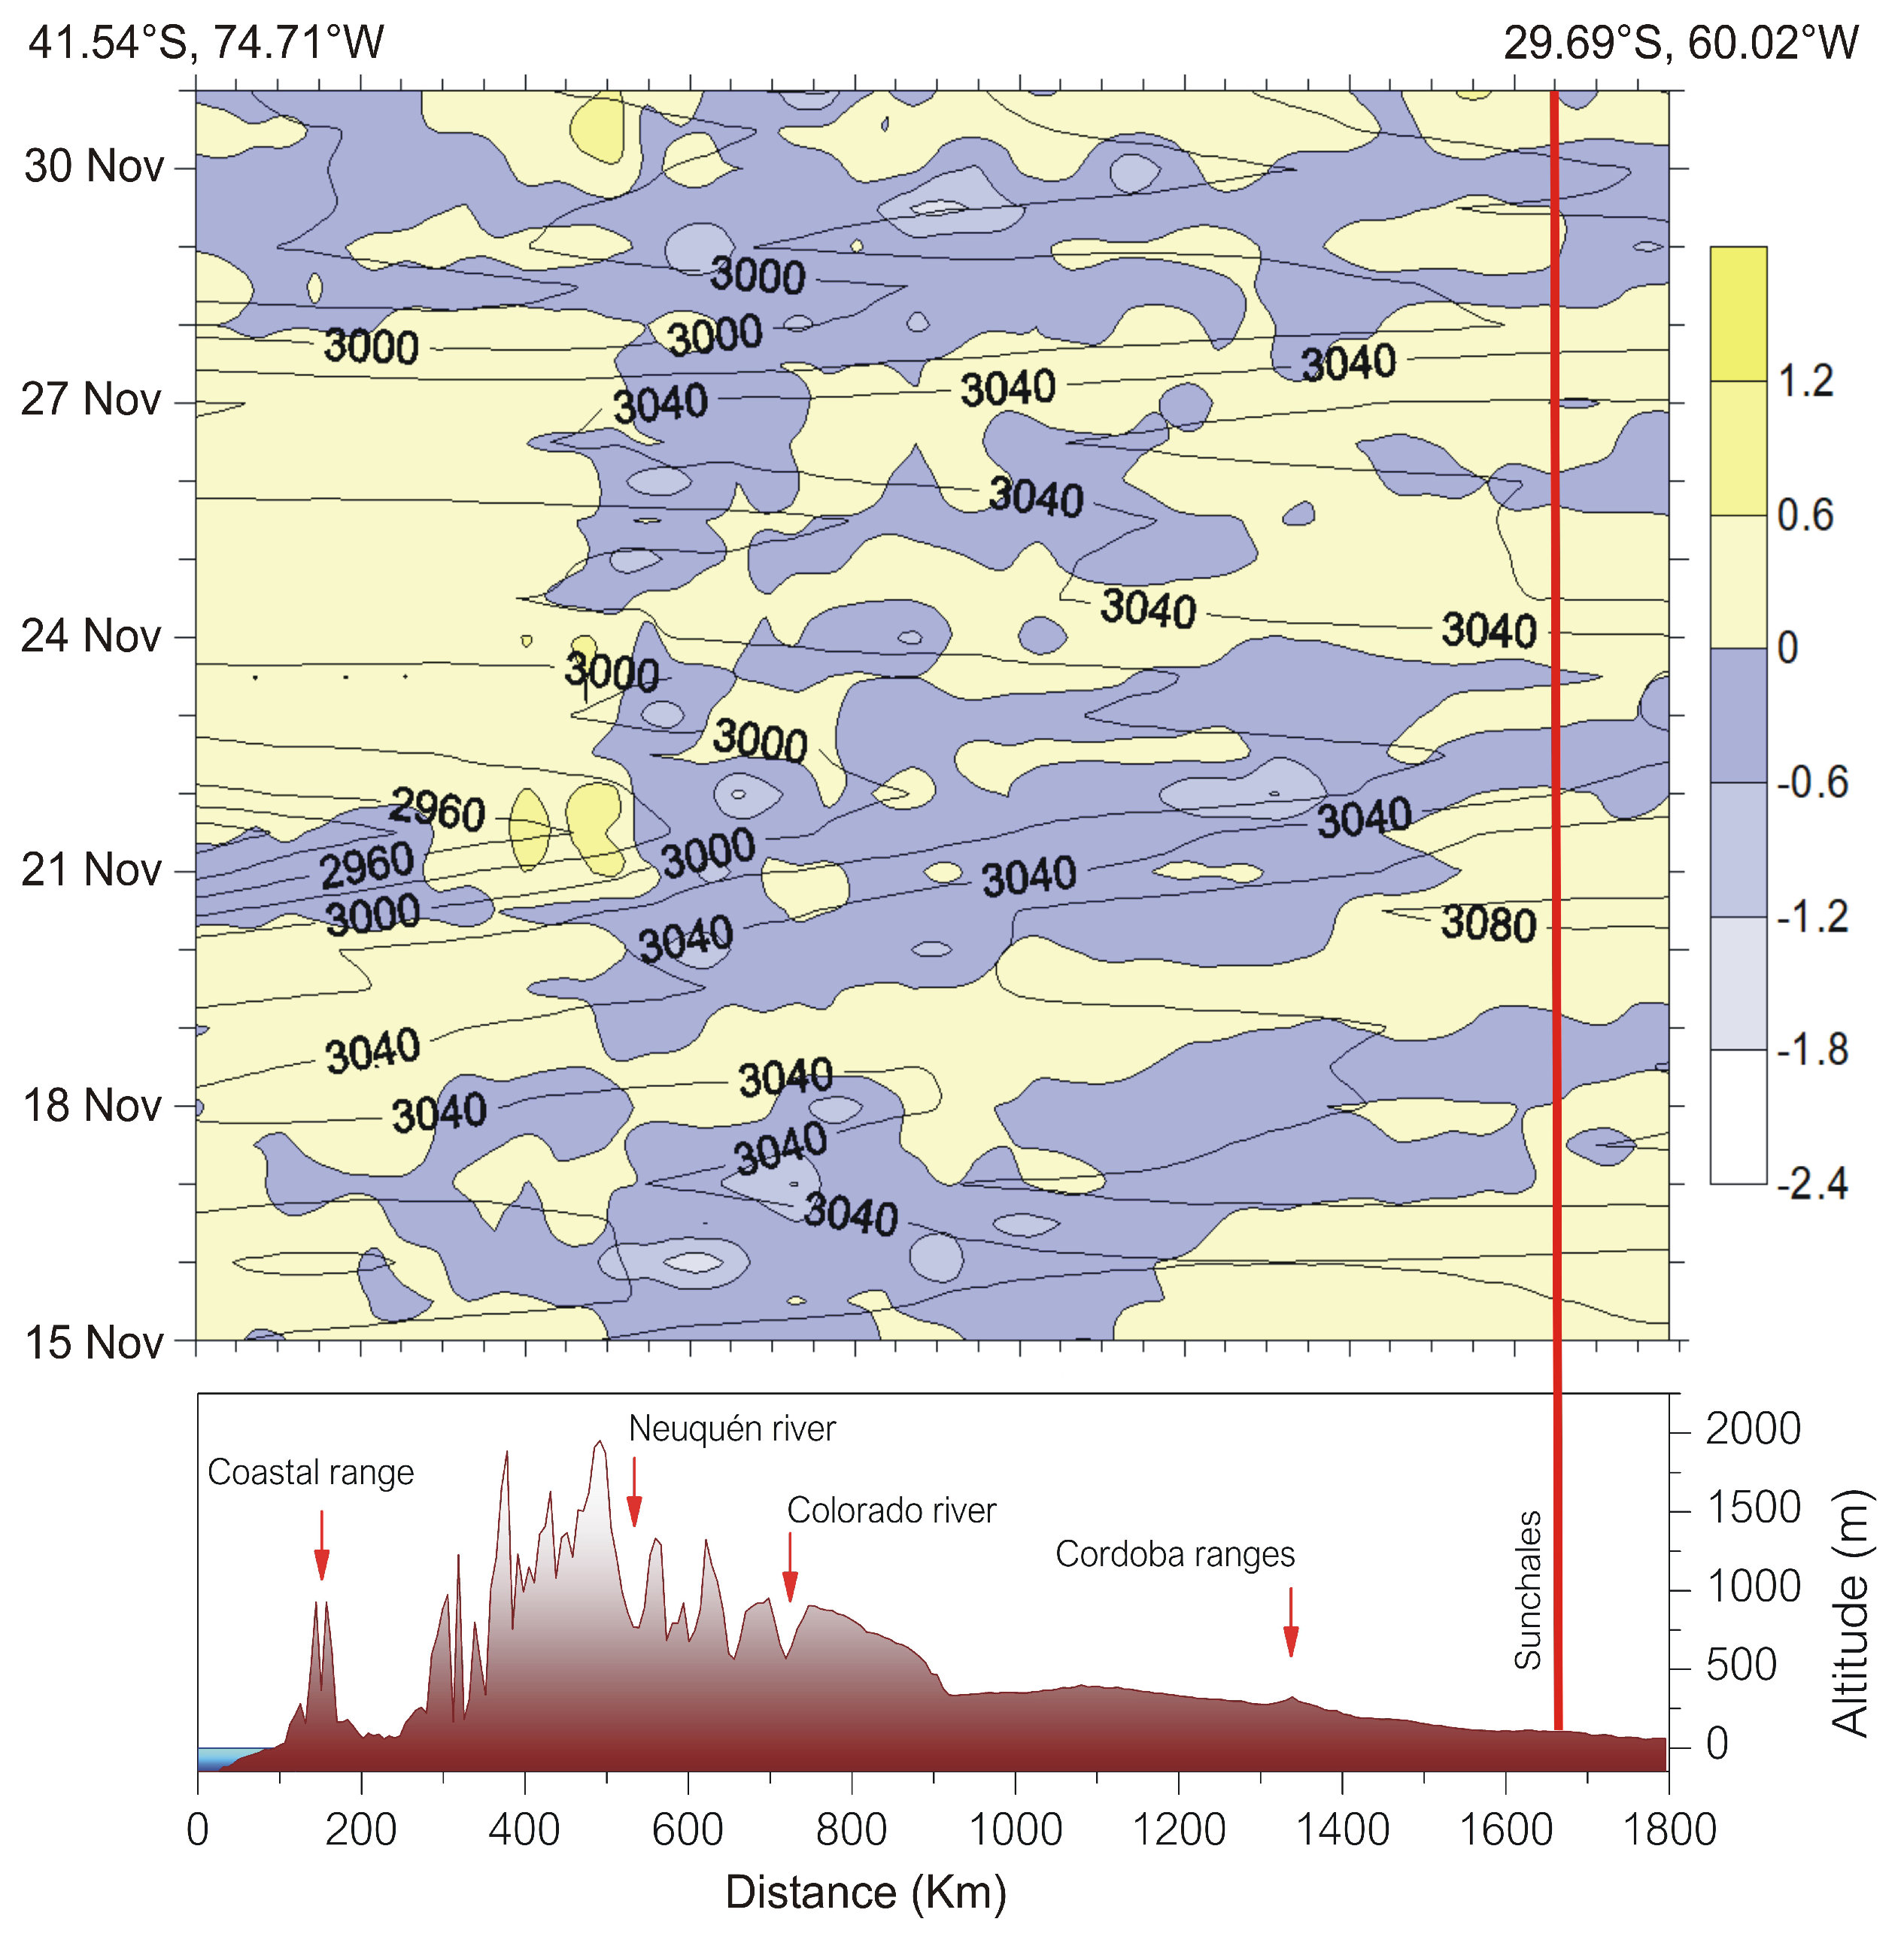
Figure 9.
Hovmöller diagram for Podocarpus case study from October 15th to November 1st, 2013. The space cut corresponds to the straight line of Figure 7b. Lines show the 700 hPa geopotential height (gpm) and shaded areas, 700 hPa omega (Pa s). The lower panel shows the associated topography and the vertical line represents the geographical location of Sunchales.
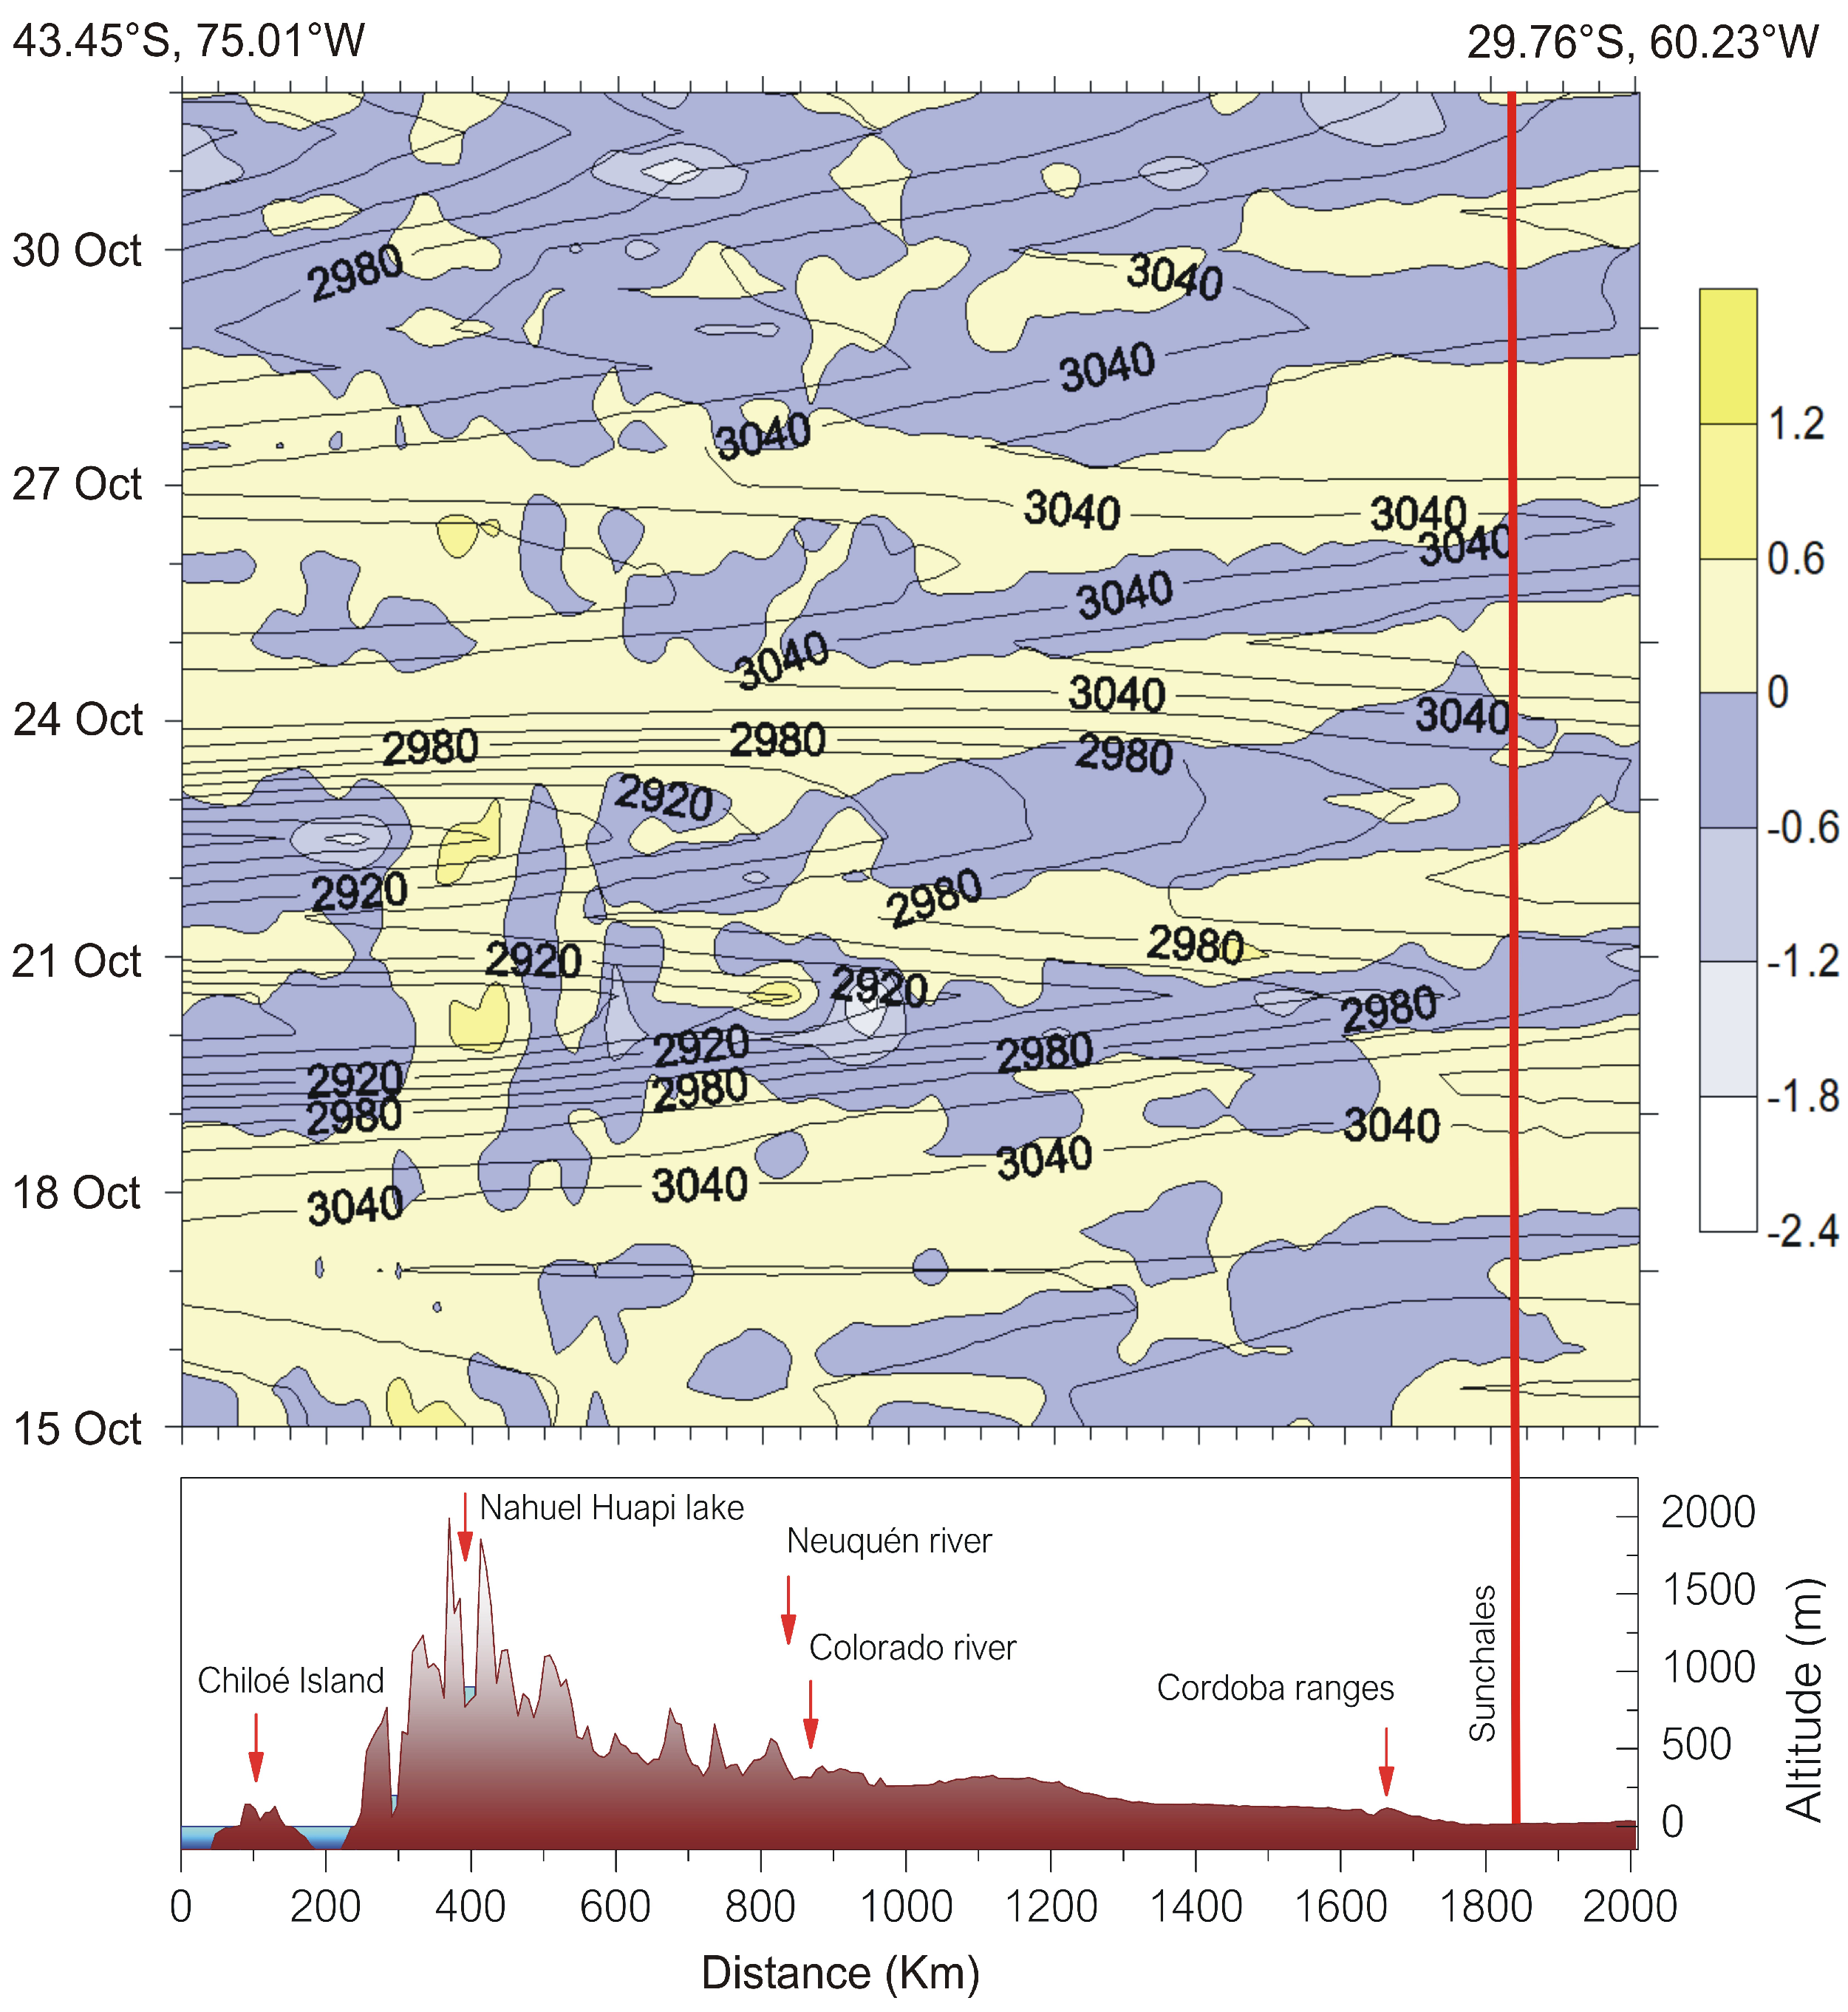

Table 1.
Frequencies of transient synoptic systems (925 hPa geopotential height field) and omega (700 hPa), on the Alnus pollen capture dates at Sunchales.
Table 1.
Frequencies of transient synoptic systems (925 hPa geopotential height field) and omega (700 hPa), on the Alnus pollen capture dates at Sunchales.
| Synoptic pattern1 | 2012 | 2013 | Percentage |
|---|---|---|---|
| leading-edge trough | 0 | 2 | 5.6 |
| trough-eastern high | 7 | 6 | 37.0 |
| low-eastern high | 7 | 7 | 40.0 |
| weak high | 0 | 3 | 9.0 |
| eastern high | 0 | 1 | 2.8 |
| weak low | 1 | 0 | 2.8 |
| ridge | 0 | 1 | 2.8 |
| Total | 15 | 20 | 100 |
| Omega | 2012 | 2013 | Percentage |
| > 0 (descent) | 13 | 13 | 74.2 |
| < 0 (ascent) | 2 | 7 | 25.7 |
| Total | 15 | 20 | 100 |
14.1cm 1 We provide a cartoon for each pattern in Appendix A, (Figure A1).
Table 2.
Frequencies of transient synoptic systems (700 hPa geopotential height field) and omega (700 hPa), observed at Sunchales on the capture dates of airborne Nothofagus pollen.
Table 2.
Frequencies of transient synoptic systems (700 hPa geopotential height field) and omega (700 hPa), observed at Sunchales on the capture dates of airborne Nothofagus pollen.
| Synoptic pattern1 | 2012 | 2013 | Percentage |
|---|---|---|---|
| leading-edge trough | 0 | 1 | 6.7 |
| trough | 0 | 1 | 6.7 |
| post-frontal | 6 | 1 | 46.6 |
| low | 0 | 1 | 6.7 |
| ridge | 0 | 1 | 6.7 |
| high | 1 | 3 | 26.6 |
| Total | 7 | 8 | 100 |
| Omega | 2012 | 2013 | Percentage |
| > 0 (descent) | 0 | 3 | 20 |
| < 0 (ascent) | 7 | 5 | 80 |
| Total | 7 | 8 | 100 |
14.1cm 1 A cartoon for each pattern in Appendix A, (Figure A1).
Table 3.
Frequencies of transient synoptic systems (700 hPa geopotential height field) and omega (700 hPa), observed at Sunchales on the capture dates of airborne Podocarpus pollen.
Table 3.
Frequencies of transient synoptic systems (700 hPa geopotential height field) and omega (700 hPa), observed at Sunchales on the capture dates of airborne Podocarpus pollen.
| Synoptic pattern1 | 2012 | 2013 | Percentage |
|---|---|---|---|
| leading-edge trough | 0 | 3 | 25.0 |
| post-frontal | 4 | 4 | 66.7 |
| high | 1 | 0 | 8.3 |
| Total | 5 | 7 | 100 |
| Omega | 2012 | 2013 | Percentage |
| > 0 (descent) | 0 | 3 | 25 |
| < 0 (ascent) | 5 | 4 | 75 |
| Total | 5 | 7 | 100 |
14.1cm 1 Cartoons for each pattern in Appendix A, (Figure A1).
Disclaimer/Publisher’s Note: The statements, opinions and data contained in all publications are solely those of the individual author(s) and contributor(s) and not of MDPI and/or the editor(s). MDPI and/or the editor(s) disclaim responsibility for any injury to people or property resulting from any ideas, methods, instructions or products referred to in the content. |
© 2024 by the authors. Licensee MDPI, Basel, Switzerland. This article is an open access article distributed under the terms and conditions of the Creative Commons Attribution (CC BY) license (http://creativecommons.org/licenses/by/4.0/).
Copyright: This open access article is published under a Creative Commons CC BY 4.0 license, which permit the free download, distribution, and reuse, provided that the author and preprint are cited in any reuse.


