Submitted:
25 July 2024
Posted:
26 July 2024
You are already at the latest version
Abstract
In order to reduce the environmental impact of energy enterprises, it is important to promptly identify cases of possible changes in the quality of wastewater generated at power plants, that is cases of exceeding the maximum permissible concentrations of pollutants in wastewater. The goal of the method for detecting complex anomalies in multidimensional time series obtained from smart energy station’s sensor channels is to increase the accuracy of detecting pollution levels in industrial wastewater. To achieve this goal, the following tasks were solved: methods for detecting time series anomalies were analyzed, the method for detecting complex anomalies was developed, software implementation of the algorithm was carried out and experiments were conducted. The developed method is proposed to be used in an smart energy monitoring system.
Keywords:
smart energy
; time series
; anomaly detection
; complex anomalies
; outlier
; Isolation Forest
; predicates’ conjunction
1. Introduction
At electric power enterprises, depending on technological processes, a large amount of wastewater is generated containing substances hazardous to natural water bodies, such as oil and petroleum products, as well as heavy metals. In this regard, there are strict requirements for wastewater discharge. For the transition to Smart energy solutions in the concept of Industry 5.0 [1,2] we need to implement new approaches for the environmental impact evaluation.
Smart energy plays an active role in providing preservation of environment. This can be achieved by adopting digital technologies including machine learning algorithms in the area of wastewater emission control as part of smart energy (see Figure 1). Analyzing existing methods and providing new more accurate methods is good for our planet as it favors circular production models and supports energy technologies that make the use of natural resources more efficient way. Indirect measurements is one of many ways to control wastewater quality and quickly detect anomalies in time series data that may indicate facts of exceeding emission standards. When we deal with real-life data we have to work with not only known anomalies but to detect possible ones in case of missed events.
Wastewater is any stream of water that is move out from an electrical power plant’s cycle. The main “types of wastewater are:
- wastewater from both circulating and open hydro-ash and slag-removal (HSR) systems of power plants that operate on solid fuels;
- blowdown water from the circulating water supply system of thermal power plants, which is discharged continuously;
- wastewater from water treatment plants, which can be discharged periodically or continuously, including reverse osmosis concentrates, wash water from mechanical filters, and eluates after the regeneration of ion exchange filters;
- blowdown water from steam boilers, evaporators, and steam converters that is discharged continuously;
- snow and rain runoff that contains suspended particles, such as various types of pollutants and petroleum products, including fuel oil;
- oily, contaminated external condensate, suitable for feeding steam evaporators after cleaning;
- spent washing solutions, acidic and alkaline, and wash waters, after chemical washing and preservation, for steam boilers, condensers, heaters, and other equipment, including periodic runoff, typically formed in the summertime”[3].
Such wastewater should be treated at a local treatment facility until it meets state standards. Discharging wastewater with an excess of harmful substances’ maximum permissible concentrations (MPC) into a body of water is a serious offense, as it can lead to negative impacts on the environment. Indirect measurements of smart energy station’s sensor channels indicate changes in water quality and anomalies in such data may indicate possible cases of exceeding wastewater pollutants maximum permissible concentration (MPC).
Maximum permissible concentration (MPC) is a sanitary and hygienic standard approved by law. MPC is “the maximum concentration of chemical elements and their compounds in the environment exposed every day over a long period of time that does not cause pathological changes or diseases in the human body established by modern research methods at any time in the life of the present and subsequent generations” [4].
The relevance of the work is due to its high practical significance for the comprehensive environmental monitoring system in energy industry, as well as assessing and forecasting condition changes under the influence of natural and anthropogenic factors.
Wastewater analytical indicators must be constantly monitored. It is necessary to promptly identify events of exceeding pollutants MPC facts on energy facilities. In order for the quick response and high accuracy of emission detection, it is necessary to develop technical solutions, such as smart energy monitoring systems with modern measuring devices, and also improve methods for wastewater composition analysis.
Smart energy monitoring systems use indirect measurement sensor channels. Such sensors measure changes over the time in the chemical water composition by the electrochemical method with pH electrodes that generate time series data with an index of timestamp format. The main idea is that anomaly in sensors data triggered by the emissions to wastewater. Thus, the task comes down to detecting anomalies in time-series data.
In the context of this study, anomaly detection is the identification of patterns in data that do not correspond to expected normal behavior and may be a signal of untreated wastewater discharge on energy facilities.
This article discusses a method for assessing the environmental impact of industrial wastewater generated by electric power enterprises. The scientific contribution is the developed method for detecting complex anomalies in multidimensional time series, called IFPC (Isolation Forest – Predicates’ Conjunction) that allows reducing the negative impact on the environment.
The paper is structured as follows: The Literature Review section reviews current research approaches in the field of water quality assessment, anomaly detection methods and anomaly detection metrics. The Material and Methods section presents the statement of the problem, a description of the methodology and tools, and the IFCP algorithm itself. The results of applying anomaly detection methods are presented and discussed in the Results and Discussion section. The Conclusion section concludes the article.
2. Literature Review
Literature review covers sources regarding approaches in the field of water quality assessment.
Rashevskiy et al. study ecology modeling for the sustainable development of the urban environment [5]. Daoping et al. study the application of sensors for a wastewater treatment system [6]. Rehbach et al. propose multi-objective machine learning for a water quality monitoring system and address the problem of data set imbalance [7]. A survey of machine learning methods applied to anomaly detection on drinking water quality data by Dogo et al [8]. It contains a comprehensive overview of the drinking water quality monitoring problems. Provided statistics are: 41% of surveyed water utilities rely on manual water sample collection for analysis, and only 16% rely on automated collection. However, only 40% of them would like to have a real-time water quality monitoring system, and only 17% currently have it. It also provides an overview of traditional monitoring types (physical observation, laboratory analysis, portable detection devices) and the transition to wireless sensor networks. It gives a retrospective of research into machine learning methods to detect anomalies in drinking water quality data. Dogo et al. consider class imbalance and missing data impact on the performance of learning algorithms in water quality anomaly detection problems. Paper [9] presents a research retrospective on this issue. Muharemi et al. prove the weakness of RNN and LSTM algorithms with data that has an imbalance problem [10]. Ribeiro and Reynoso-Meza propose to use ensemble learning (SMOTEBoost and RUSBoost) for problems with extreme imbalance coefficients [11]. Zhang et al. consider solving the problem of noisy data coming from water composition monitoring sensors by wavelet transforms [12]. Wu et al. present a successful experience of ALBP and 2sIRF models in urban water supply systems in Norway [13]. Al-Gunaid et al. describe a system concept for collecting data by hardware-software complex for wastewater composition automated control from pH/ORP sensors. Paper [14] proposes an approach for automatic wastewater discharge detection by binary classification.
In a general sense, an anomaly means a deviation from expected behavior. Anomaly detection is the task of detecting unusual patterns that do not correspond to expected behavior.
The following types of anomalies in time series are determined [15]:
- point anomalies, when a single data instance is considered anomalous in relation to other data;
- contextual anomalies, when a data instance is anomalous in a certain context;
- collective anomalies that occur as a sequence of time points when no normal data exists between the beginning and end of the anomaly.
Anomaly detection metrics are considered in [17,18]. An overview of metrics by anomaly type and anomaly detection tasks is shown in Figure 3.
The main problems in solving this class of tasks are:
- noisy data, missing values, associated with the data transmission specifics from sensors;
- unbalanced distribution of classes (imbalanced data), associated with the peculiarity of the event (rare and missed events);
- unlabeled data related to the specifics of the wastewater excess pollutants MPC monitoring (the use of indirect rather than direct measurement sensors);
- lack of metrics for solving tasks with unlabeled data.
In the context of our study, we hypothesize that the wastewater excess pollutants MPC occurred if there was a pattern of a rare event, namely, an anomaly was detected by all sensor channels at the same time point.
An anomaly detected by all smart energy station’s sensor channels at the same time point will be considered a complex anomaly [19].
To evaluate the IFPC method, we will operate with three dates actually laboratory recorded facts of exceeding pollutants MPC. Algorithmic data marking and the subsequent use of traditional metrics for evaluating supervised machine learning methods in this case cannot be trusted. It is proposed to identify and display dates of detected complex anomalies and compare them with known dates.
3. Materials and Methods
3.1. Problem Statement
Let be a multidimensional time series, where each element is a m-dimensional vector representing readings of m sensor channels at time t.
It is necessary to assign to each moment of time t an anomaly label of reading from i-th channel of the sensor
where ,
where A(x) – a predicate defining the properties of the argument and A(x)∈{0,1},
A prerequisite is that there is no labeled data in the sample. Labeled data is a set of data that has already been marked or classified by the researcher or algorithmically.
We will consider an anomaly as a complex anomaly if the conjunction of predicates (1) is satisfied.
The source of time series data is a smart energy monitoring system of energy facilities wastewater composition, where data is collected from the software and hardware complex (SHC) with pH/ORP sensors [18]. Indirect measurement sensors detect changes in the chemical water composition by the electrochemical method. At the command of the SHC controller, the self-priming pump ensures liquid renewal in the flow chamber, where it is analyzed by a set of signal sensors and measuring analyzers. The values from the sensor channels are processed by the controller and transmitted via the TCP/IP protocol to the application server for further processing.
To prepare the data, it is necessary to preprocess it:
- 5.
- removal of noise in the data (achieved by moving average method);
- 6.
- data normalization for stable algorithms’ operation;
- 7.
- aggregation of data when it is presented in unequal time intervals;
- 8.
- logarithm of data (to acquire the homoscedasticity);
- 9.
- differentiation of data (to remove the trend component and bring the time series to a stationary one).
3.2. The Isolation Forest
The Isolation Forest (iForest) method was chosen as the basic unsupervised machine learning method for anomaly detection. This method requires minimal data preprocessing, it is resistant to missing data, to data dimensionality, invariant to feature scaling, and there are no parameters that require selection. It has complexity linear time complexity and a small memory requirement, which is more efficient than most other algorithms, especially for analyzing streaming data.
The iForest method is based on the construction of a set of several disjoint undirected binary decision trees (or isolation trees, iTree), otherwise an ensemble of decision trees.
A decision tree is a graph where there is only one route between any pair of vertices, and it does not contain a single loop. The decision tree is a connected acyclic graph (Figure 4).
Isolation Forest algorithm [16]:
«1. Algorithm iForest(X, d, ψ)
Inputs: X - dataset, d - number of trees, ψ - number of subsample instances
Output: set of d iTrees trees
1: Initialize Forest
2: set tree height limit
3: for i = 1 to d do
4:
5:
6: end for
7: return Forest
2. Algorithm iTree(X, e, l)
Inputs: X - dataset, e - height of current tree, l - height limit
Output: iTree tree
1: if then
2: return
3: else
4: let Q be a list of attributes in X
5: randomly select an attribute q ∈ Q
6: randomly select a split point p from max and min
values of attribute q in X
7:
8:
9: return
10: end if»
Authors of the Isolation Forest algorithm [16,21,22] propose the following estimation of anomaly (2):
where ψ - number of instances in subsample;
h(x) - length of the path to observation x, is defined by the number of edges starting from the root of the tree;
- mean h(x) from iTree ensemble;
c(ψ) - average path length of unsuccessful search in iTree.
Marginal data in anomaly estimation of instance according to (2):
- if ;
- if ;
- if .
Criteria for recognizing an instance as abnormal:
- 10.
- if , then an instance of the class can be considered anomalous with certainty;
- 11.
- if , then an instance of the class can be considered normal;
- 12.
- if anomaly estimation yields s ≈ 0.5 for all instances, then the sample has no anomalies.
3.3. Method IFPC (Isolation Forest – Predicates’ Conjunction)
An IFPC method has been developed for identifying complex anomalies in multidimensional time series (Figure 5), and can be described in the following steps:
- 1.
- Data preparation:
- 13.
- data download;
- 14.
- data concatenation;
- 15.
- preprocessing (normalization) of data.
- 2.
- For all sensor channels:
- 16.
- identifying anomalous sample instances by the basic method;
- 17.
- output of time series with marked anomalies;
- 18.
- detection of complex anomalies by the logical operation of conjunction.
- 3.
- Extracting and displaying dates where complex anomalies were detected.
To verify the IFPC method source code was written in the integrated development environment Visual Studio Code using Python with the following libraries:
- 19.
- pandas (data processing);
- 20.
- matplotlib (data visualization);
- 21.
- numpy (linear algebra problems);
- 22.
- scipy.stats (statistics);
- 23.
- statsmodels (test for stationarity of the series);
- 24.
- sklearn (machine learning methods);
- 25.
- pmdarima (ARIMA model);
- 26.
- keras (deep learning methods).
The program [24] has several data sources: downloaded .csv and .json files and user-supplied parameters.
The computational experiment’s purpose is to test the hypothesis that the wastewater excess pollutants MPC on energy facilities has occurred if anomalies are detected by all sensor channels at the same time point. Input data:
- 27.
- unlabeled dataset for 2020-2021 consisting of 12 .csv files;
- 28.
- unlabeled dataset for June-July 2022 in .json format;
- 29.
- three dates actually laboratory recorded facts of exceeding pollutants MPC - June 7th, 8th, and 9th in 2022.
Output data: time series plots with anomalies marked and a list of dates where pollutants MPC may have been exceeded.
4. Results and Discussion
4.1.3. σ PC Method
The 3-sigma rule states that for many fairly symmetric unimodal distributions, almost the entire population is within three standard deviations of the mean. Note, that 3-sigma rule states is simple and is widely uses in practice as the benchmark models. Disadvantages of 3-sigma rule is discusses in scientific literature. For instance, the choice of threshold in the approach is not trivial problem. It depends on physical aspects of a domain. Researches uses various heuristics based on their domain knowledge. Figure 6 shows the result of searching for anomalies by the three sigma method on the full dataset of data for each sensor channel. Note, that this approach operates as a filter omitting values around maximum and minimum. Complex Anomalies plot of Figure 6 shows the 3σPC (3 sigma – predicates’ conjunction) method results.
Figure 7 shows another result of the 3σPC method results - a list of dates.
Thus, detecting anomalies by the 3σPC method, we received nine dates, but there are no dates actually laboratory recorded facts of exceeding pollutants MPC - June 7th, 8th, and 9th in 2022.
4.2. k-meansPC Method
K-means is a method for clustering problems in unsupervised learning. The algorithm seeks to minimize the total square deviation of cluster points from the centers of these clusters. Figure 8 shows the result of searching for anomalies by the k-means method on the full dataset for each sensor channel. Complex Anomalies plot of Figure 8 shows the k-meansPC (k-means– predicates’ conjunction) method results.
K-means method has two main disadvantages. First drawback due to initialization of method parameters. The second is, a number of cluster need to set up. This value depends on expert knowledge. Figure 9 shows another result of k-meansPC method results - a list of dates.
Thus, detecting anomalies by the k-meansPC method, we received three dates, but there are no dates actually laboratory recorded facts of exceeding pollutants MPC.
4.3. IFPC Method
Figure 10 shows the result of searching for anomalies by the Isolation Forest method on the full dataset for each sensor channel. Complex Anomalies plot of Figure 10 shows the IFPC (Isolation Forest – predicates’ conjunction) method results.
Figure 11 shows another result of IFPC method results - a list of dates.
Thus, detecting anomalies using the IFPC method, we received 57 dates, including all three dates actually laboratory recorded facts of exceeding pollutants MPC - June 7th, 8th, and 9th in 2022.
Table 1 summarizes the results of the experiments.
We hypothesize that the wastewater excess pollutants MPC has occurred if the time series has a pattern of a rare event (an anomaly is detected by all sensor channels at the same time point). As a result of the experiments, the hypothesis was confirmed. The IFPC method for complex anomalies detection in multidimensional time series determines dates actually laboratory recorded facts of exceeding pollutants MPC in energy facilities wastewater.
At the same time, it seems promising to use the predicates’ conjunction with other anomaly detection methods, but this requires additional experiments.
5. Conclusions
The crucial issue of electric power enterprises is reducing the negative impact to environment. Smart Energy systems allow detecting negative events due to collecting and processing of energy data streams, including data about quality of wastewater.
In the paper a new IFPC method for detecting complex anomalies in multidimensional times series is proposed. The IFPC method determines dates actually laboratory recorded facts of exceeding pollutants MPC in wastewater. The results of experimental setup for complex anomaly detection show that proposed method can detect both labelled and unlabeled events. Therefore, it is possible to use the method on corrupted data sets excluding records about events.
The method is recommended for use in Smart Energy Systems to improve sustainable energy for quickly respond to energy facilities wastewater quality change.
6. Patents
Certificate of state registration of the computer program “Program for verifying the method of detecting anomalies of multidimensional time series with the predicates’ conjunction condition implementation” № 2023669725 dated 20.09.2023.
Author Contributions
Conceptualization, M.S. and E.S.; methodology, M.S.; software, E.S.; visualization, E.S. and A.E., validation, A.E.; data curation, M.A.; writing—original draft preparation, E.S.; writing—review and editing, M.S., Alla.K., A.K.. All authors have read and agreed to the published version of the manuscript.
Funding
The study has been supported by the grant from the Russian Science Foundation (RSF) No. 24-21-00483 https://rscf.ru/en/project/24-21-00483/.
Data Availability Statement
Not applicable.
Conflicts of Interest
The authors declare no conflicts of interest.
References
- Masoomi, B.; Sahebi, I.G.; Ghobakhloo, M.; Mosayebi, A., Do industry 5.0 advantages address the sustainable development challenges of the renewable energy supply chain?, Sustainable Production and Consumption, Volume 43, 2023, Pages 94-112, ISSN 2352-5509. [CrossRef]
- Kumar, U.; Kaswan, M.S.; Kumar, R.; Chaudhary, R.; Garza-Reyes, J.A.; Rathi, R. and Joshi, R. A systematic review of Industry 5.0 from main aspects to the execution status, 2023, The TQM Journal. [CrossRef]
- Wastewater сleaning. Wastewater from thermal power plants. Access mode: http://www.nvbvu.ru/info/category/23012 [Date of reference: 23.02. 2024.
- GN 2.1.5.1315-03 Maximum permissible concentrations (MPC) of chemical substances in water bodies of household, drinking and domestic water use. Access mode: https://files.stroyinf.ru/Data2/1/4294815/4294815336.pdf [Date of reference: 23.02.2024].
- Rashevskiy, N.; Sadovnikova, N.; Ereshchenko, T.; Parygin, D.; Ignatyev, A. Atmospheric Ecology Modeling for the Sustainable Development of the Urban Environment. Energies 2023, 16, 1766. [Google Scholar] [CrossRef]
- Daoping, H.; Yiqi, L.; Yan, L. Soft sensor research and its application in wastewater treatment. CIESC J. 2011, 62, 7–15. [Google Scholar]
- Rehbach, F.; Moritz, S.; Chandrasekaran, S.; Rebolledo, M.; Friese, M. and Bartz-Beielstein, T. GECCO 2018 Industrial Challenge: Monitoring of drinking-water quality. 2018. Access mode: http://www.spotseven.de/wpcontent/uploads/2018/03/ rulesGeccoIc2018.pdf [Date of reference: 23.02.2023].
- Dogo, E. M.; Nwulu, N.I.; Twala, B.; Aigbavboa, C.O. A survey of machine learning methods applied to anomaly detection on drinkingwater quality data, Urban Water Journal. 2019, vol. 16, (3), pp. 235-248. [CrossRef]
- Dogo, E.M., Nwulu, N.I., Twala, B., & Aigbavboa, C.O. Empirical Comparison of Approaches for Mitigating Effects of Class Imbalances in Water Quality Anomaly Detection. IEEE Access. 2020, 8, 218015-218036.
- Muharemi, F.; Logofătu, D. and Leon, F. Machine learning approaches for anomaly detection of water quality on a real-world data set, Journal of Information and Telecommunication. 2019, pp. 1-14. [CrossRef]
- Ribeiro, V. and Reynoso-Meza, G. Monitoring of drinking-water quality by means of a multi-objective ensemble learning approach, in Proc. of the Genetic and Evolutionary Computation Conference. 2018, pp. 1-2.
- Zhang, W.; Zhao, J.; Quan, P.; Wang, J.; Meng, X.; Li, Q. Prediction of influent wastewater quality based on wavelet transform and residual LSTM, Applied Soft Computing, 2023, Volume 148.
- Wu, D.; Wang, H. and Seidu, R. Smart data driven quality prediction for urban water source management, Future Generation Computer Systems, 2020, vol. 107, pp. 418-432. [CrossRef]
- Al-Gunaid, M.A.; Shcherbakov, M.; Artyushin, V.O.; Shkolny, D.V.; Belov, S.V. Detecting Anomalies in Multidimensional Time Series Using Binary Classification. In: Kravets, A.G., Shcherbakov, M.V., Groumpos, P.P. (eds) Creativity in Intelligent Technologies and Data Science. CIT&DS 2023. Communications in Computer and Information Science, vol 1909. Springer, Cham. 2023. [CrossRef]
- Tatbul, N.; Lee, T.J.; Zdonik, S.; Alam, M.; Gottschlich, J. Precision and Recall for Time Series, 32nd Conference on Neural Information Processing Systems (NeurIPS 2018), Montreal, Canada. 2018.
- Liu F., T.; Ting K., M.; Zhou Z., H. Isolation Forest. Data Mining. ICDM’08. Eighth IEEE International Conference on. 2008, pp. 413-422.
- Elmasry, W., Wadi, M. Detection of Faults in Electrical Power Grids Using an Enhanced Anomaly-Based Method. Arab J Sci Eng 47, 14899–14914 (2022). [CrossRef]
- Artemov, A.; Burnaev, E. Ensembles of detectors for online detection of transient changes. Eighth International Conference on Machine Vision (ICMV 2015). 2015, Vol. 9875. International Society for Optics and Photonics.
- Rayushkin, E.S.; Scherbakov, M.V.; Kazakov, I.D.; Kolesnikova, V.O.: Detection of anomalies in multidimensional time series using R language package. Modeling, optimization and information technology. 2021, 9(3).
- Golovina, A.M.; Diakonov, A.G. Detection of anomalies in operation of mechanisms using machine learning methods. Proceedings of XIX International Conference Analytics and Data Management in Data-intensive areas (DAMDID/ RCDL’2017). 2017.
- Tan S. C.; Ting K. M.; Liu T. F. Fast anomaly detection for streaming data. Twenty- Second International Joint Conference on Artificial Intelligence. 2011.
- Liu F., T.; Ting K., M.; Zhou Z., H. Isolation-based anomaly detection. ACM Transactions on Knowledge Discovery from Data (TKDD). 2012, 6(1), 1–39. [Google Scholar] [CrossRef]
- Barsky, M.E.; Shikov, A.N. Research of Isolation Forest anomaly search algorithm. Fundamental and Applied Scientific Research. 2019, 113–117. [Google Scholar]
- Certificate of state registration of the computer program “Program for verifying the method of detecting anomalies of multidimensional time series with the predicates’ conjunction condition implementation” № 2023669725 dated 20.09.2023.
Figure 1.
Smart Energy Impact Assessment.
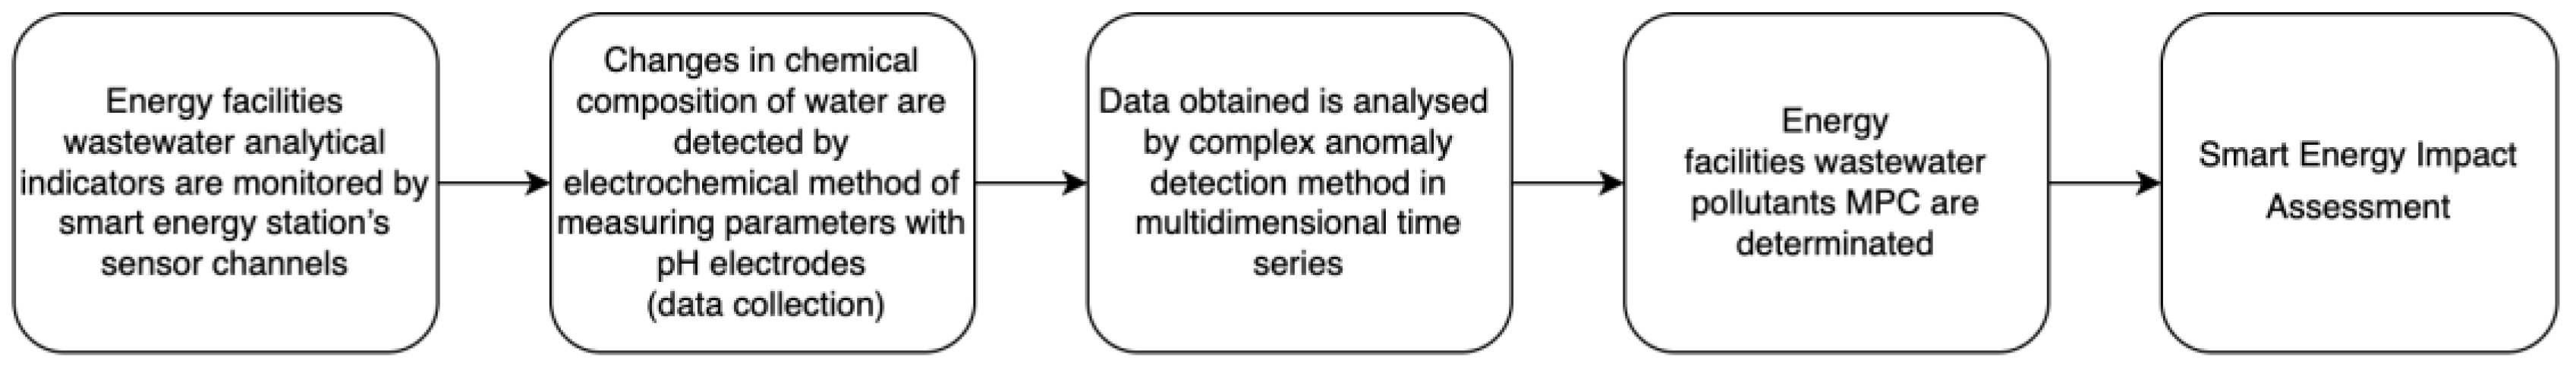
Figure 2.
Anomaly detection methods.
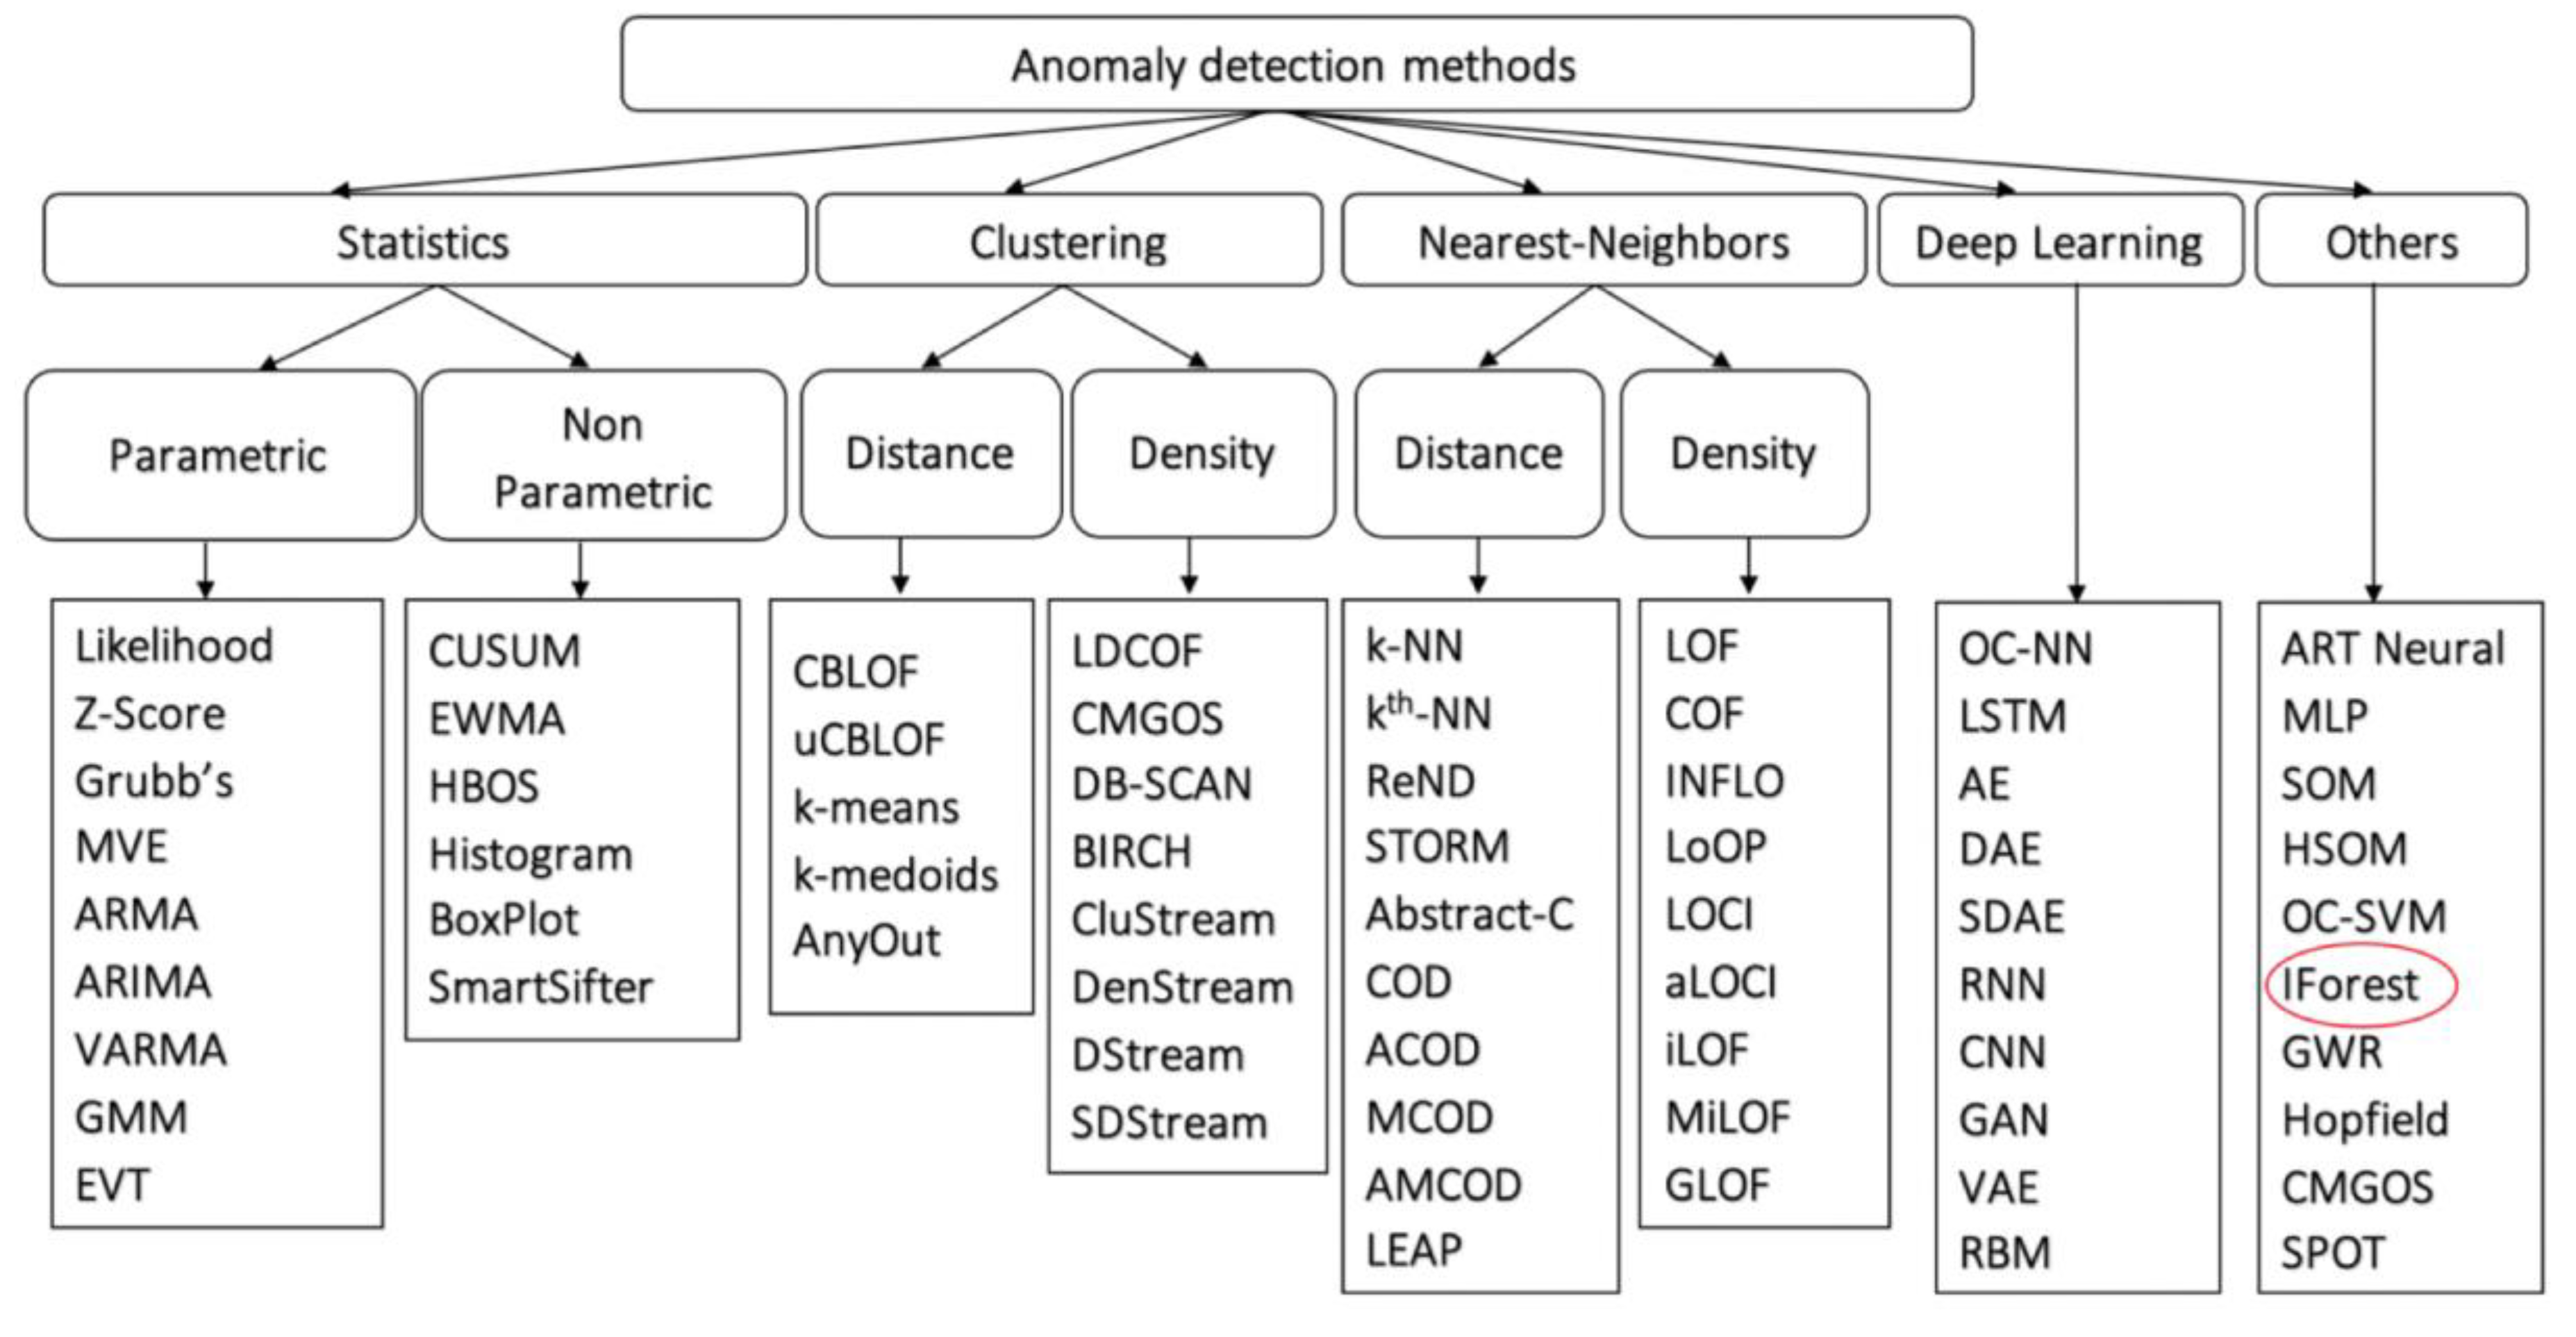
Figure 3.
Anomaly detection metrics.
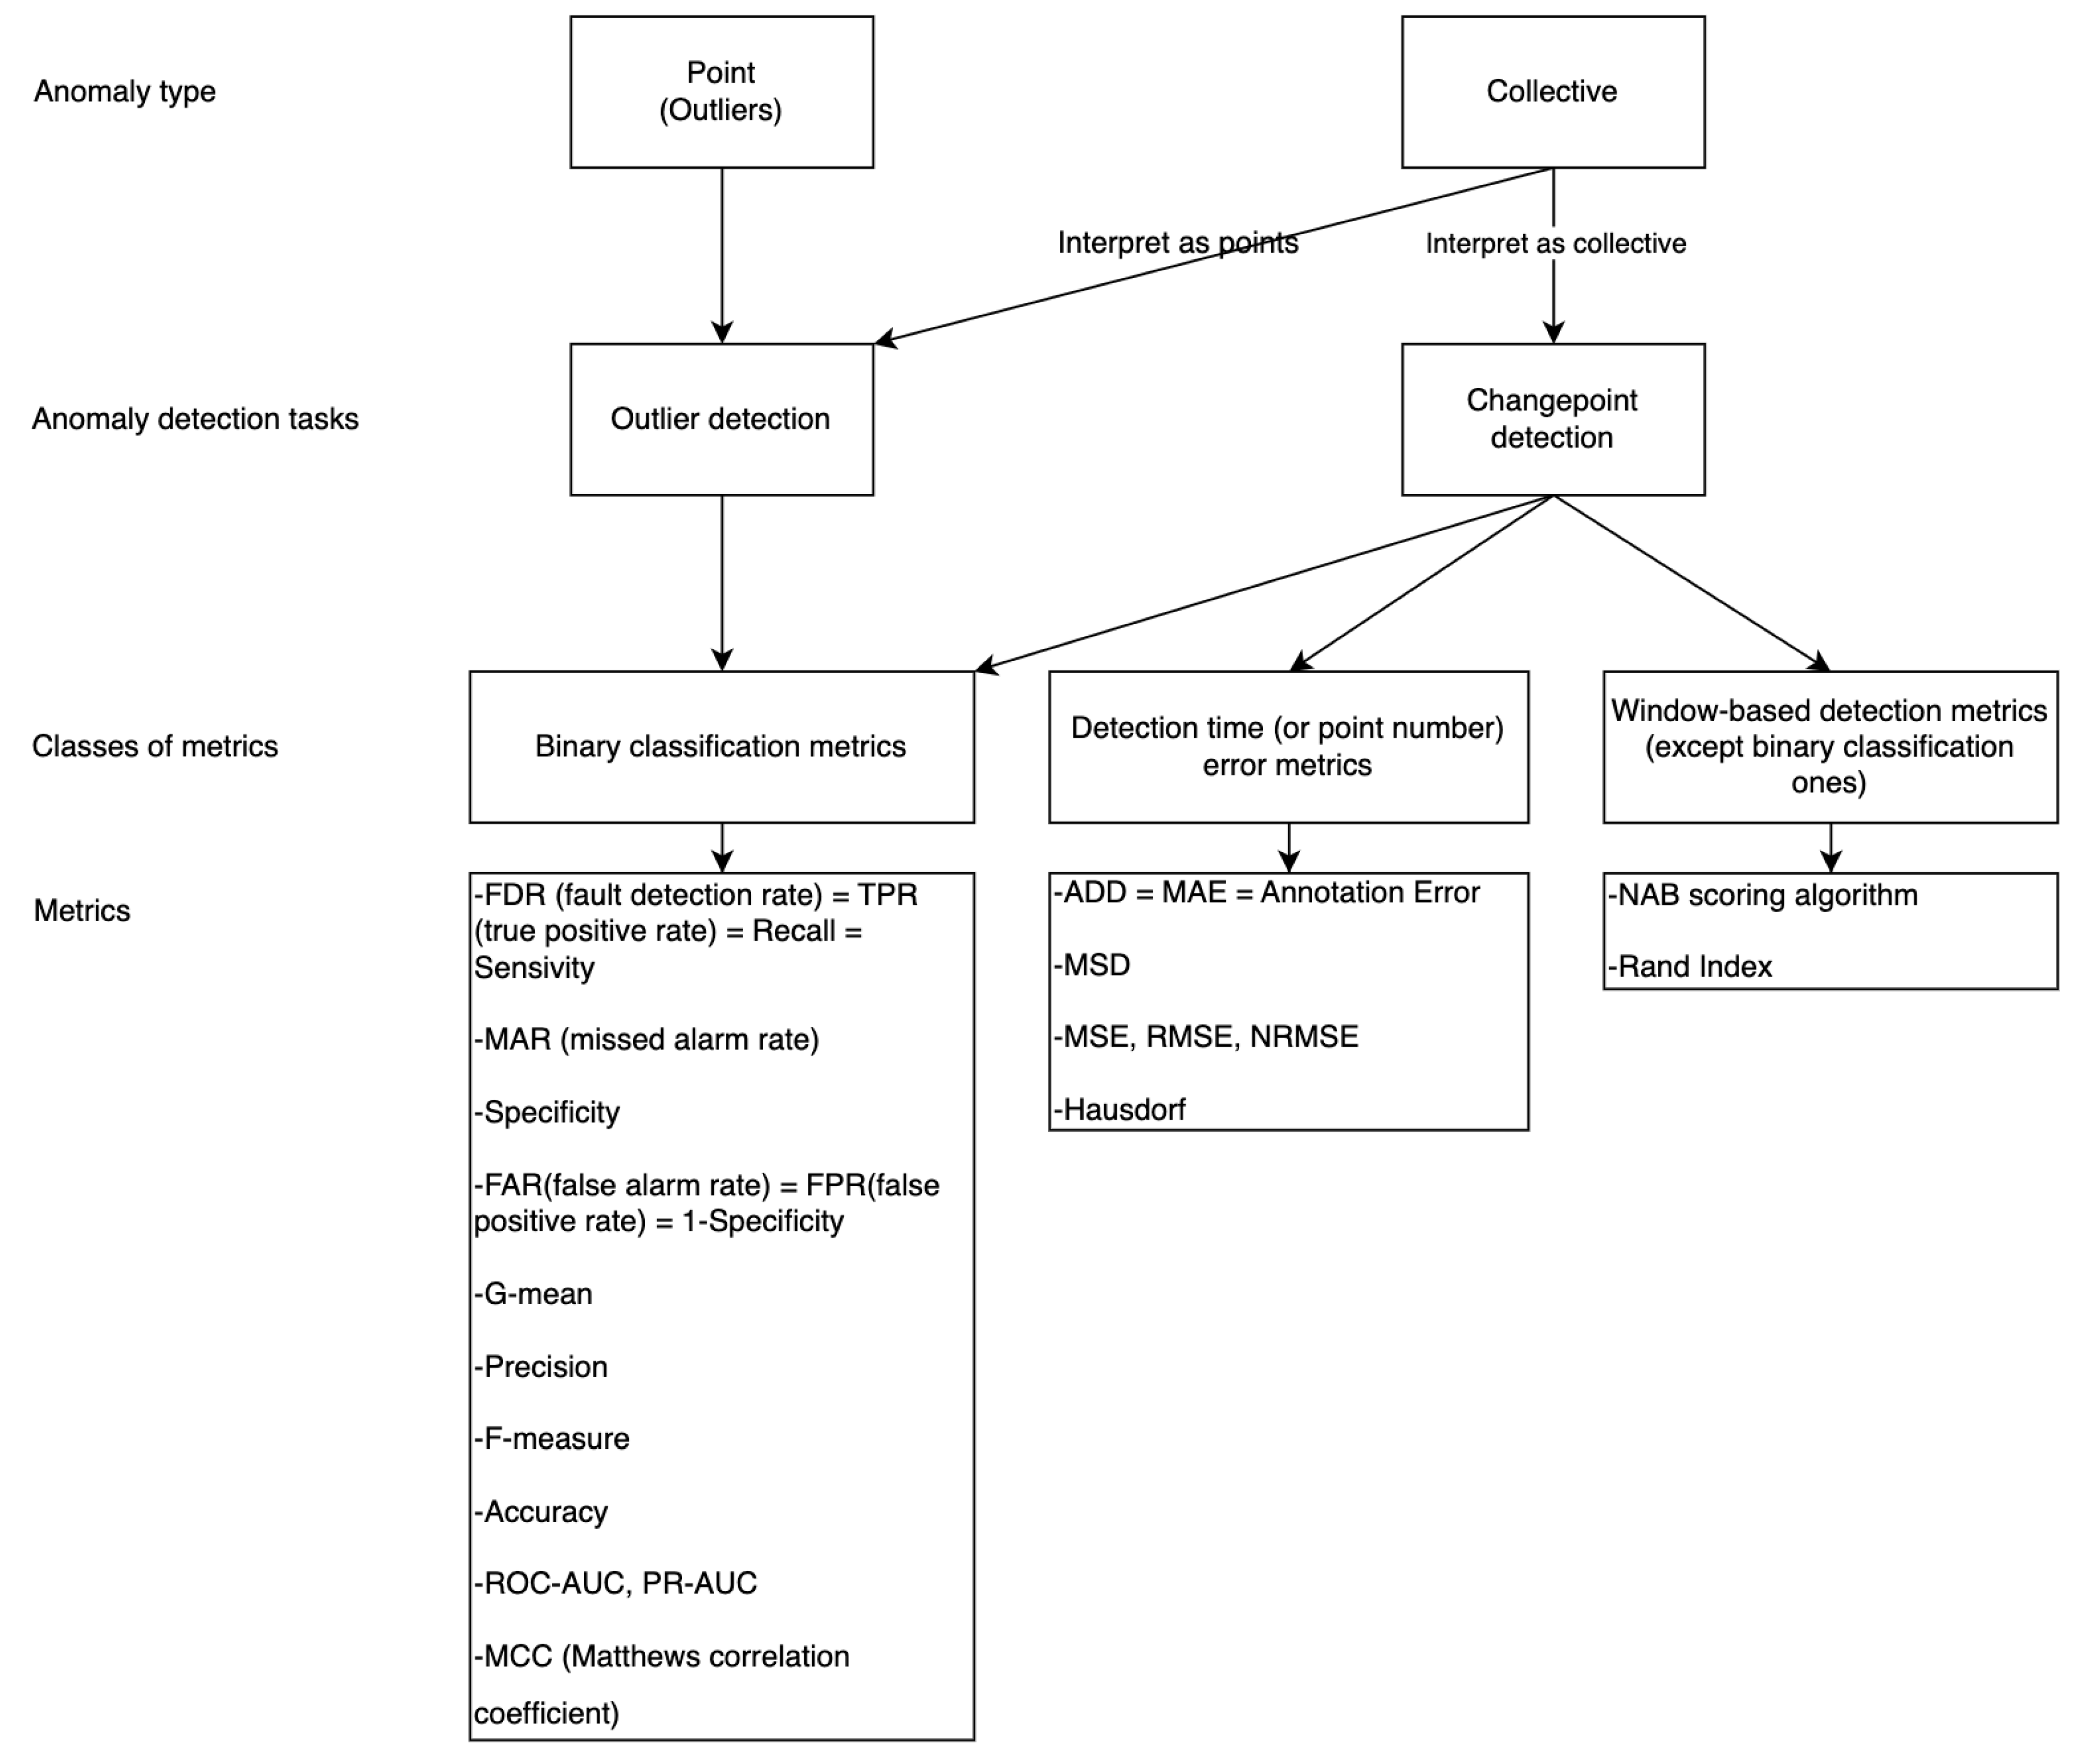
Figure 4.
Schematic representation of the Isolation Forest method [20].
Figure 4.
Schematic representation of the Isolation Forest method [20].
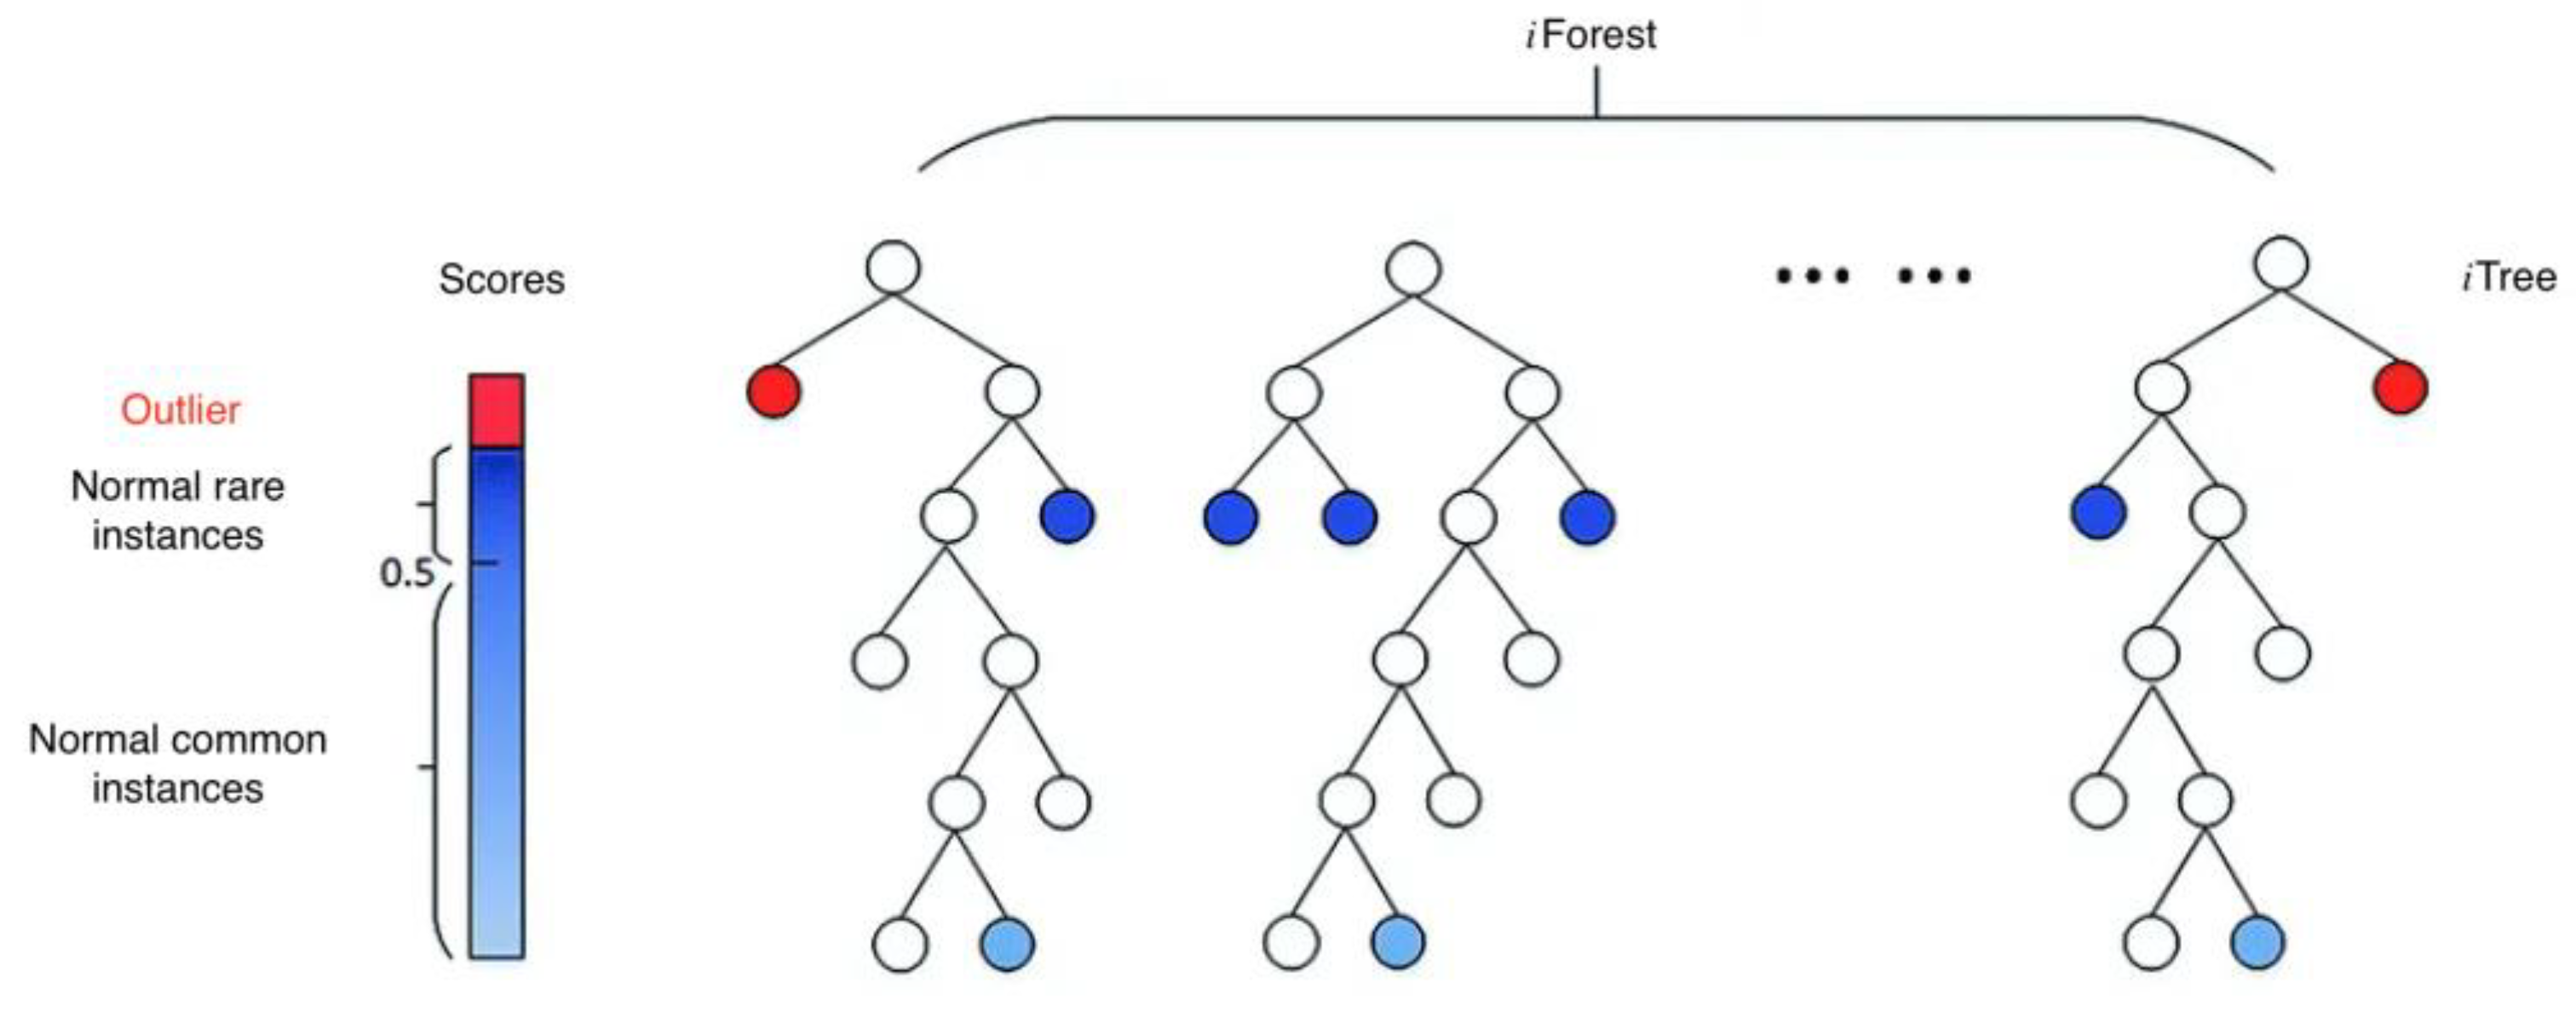
Figure 5.
Flowchart IFPC-method.
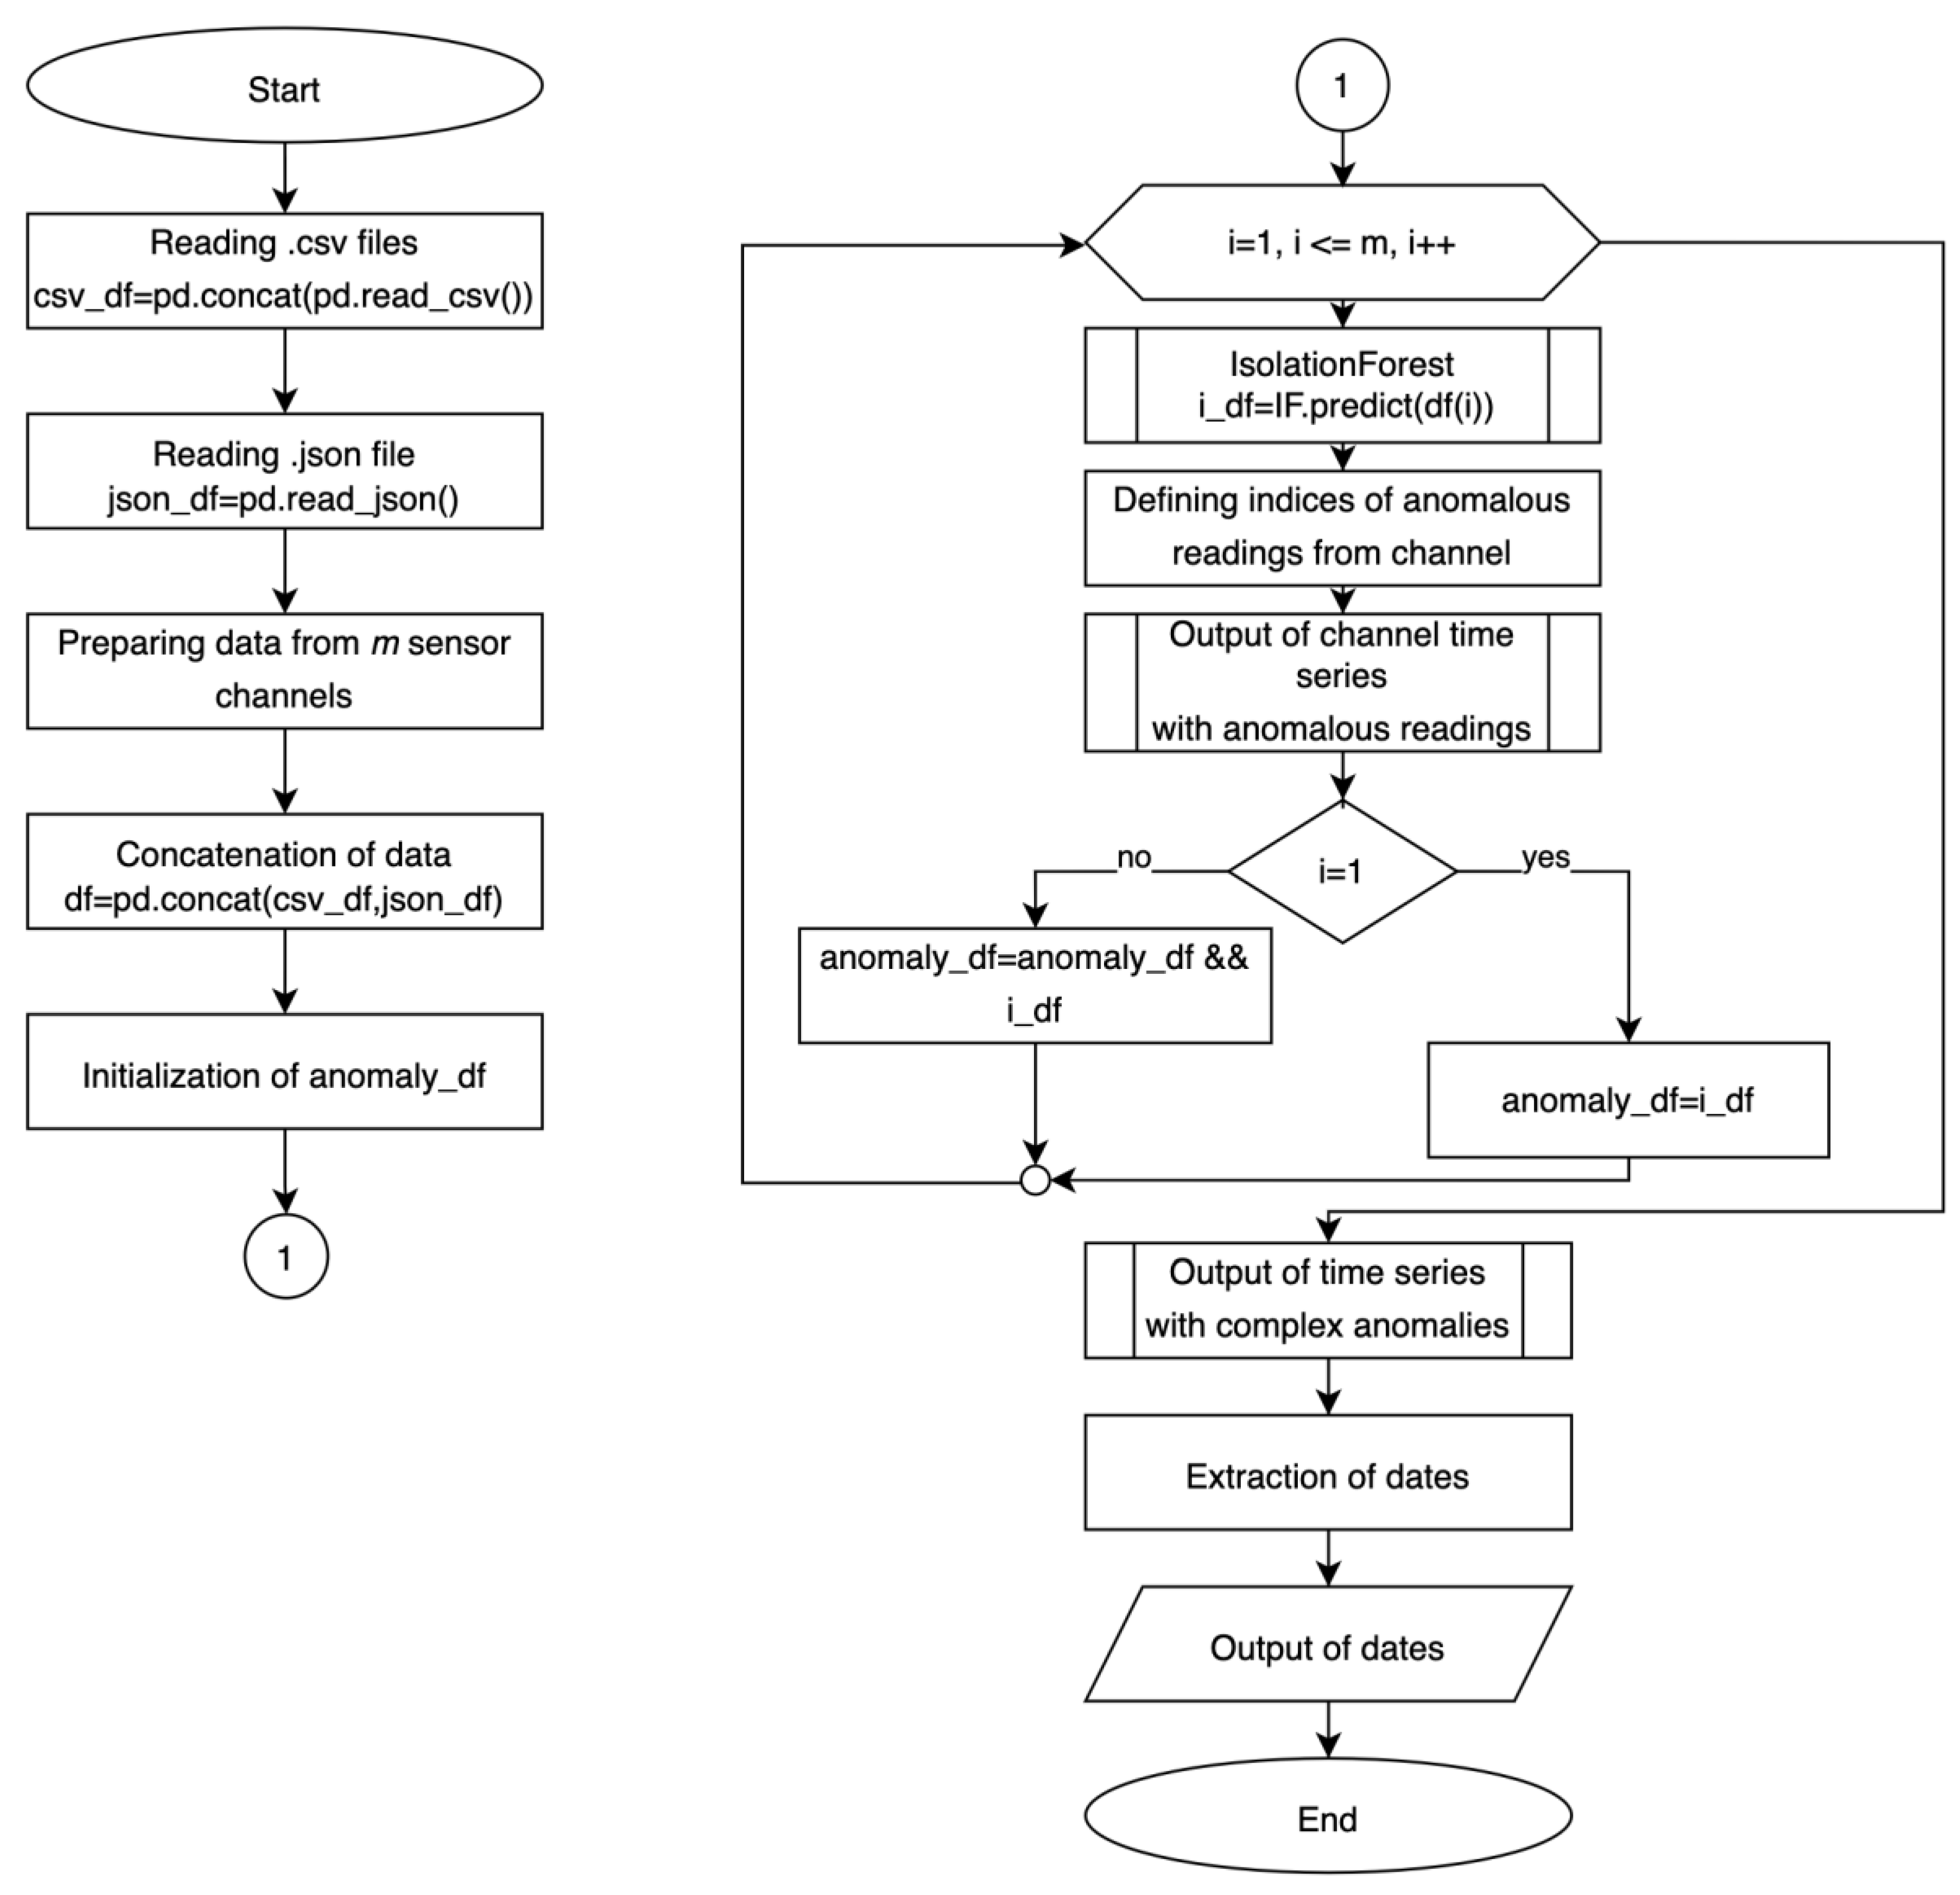
Figure 6.
Results of testing the 3σPC method.
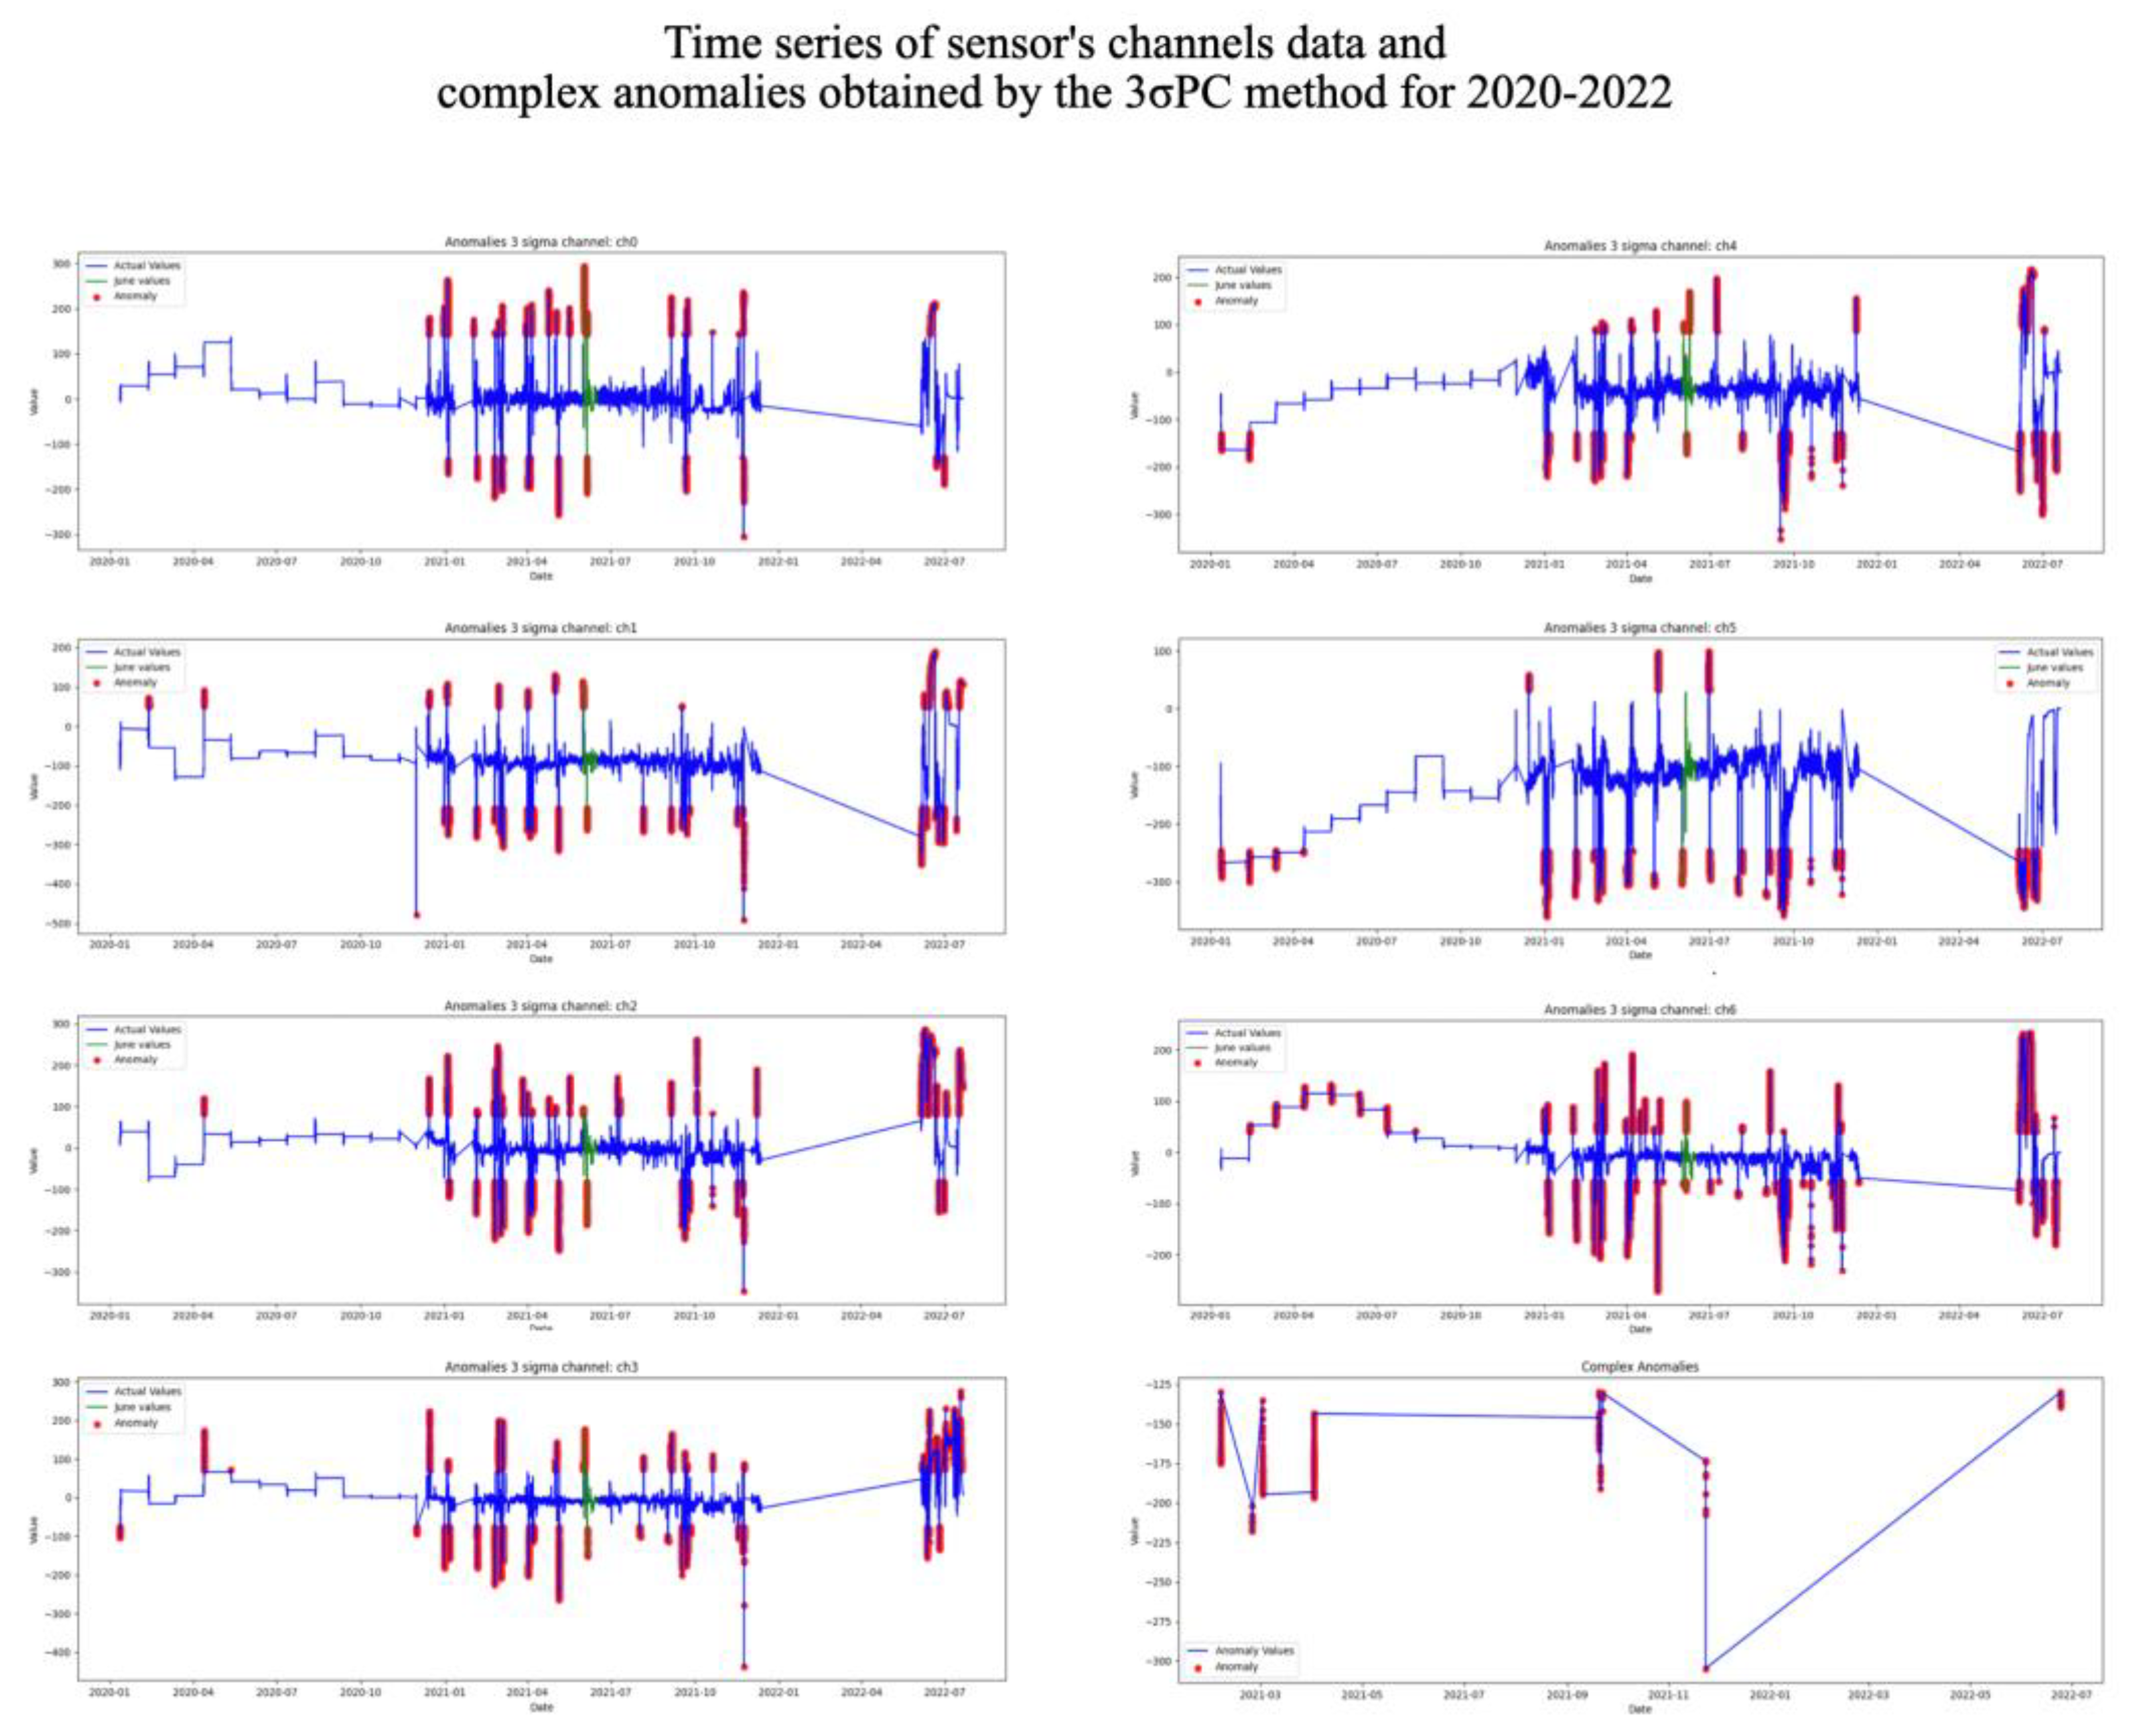
Figure 7.
List of date obtained by the 3σPC method.
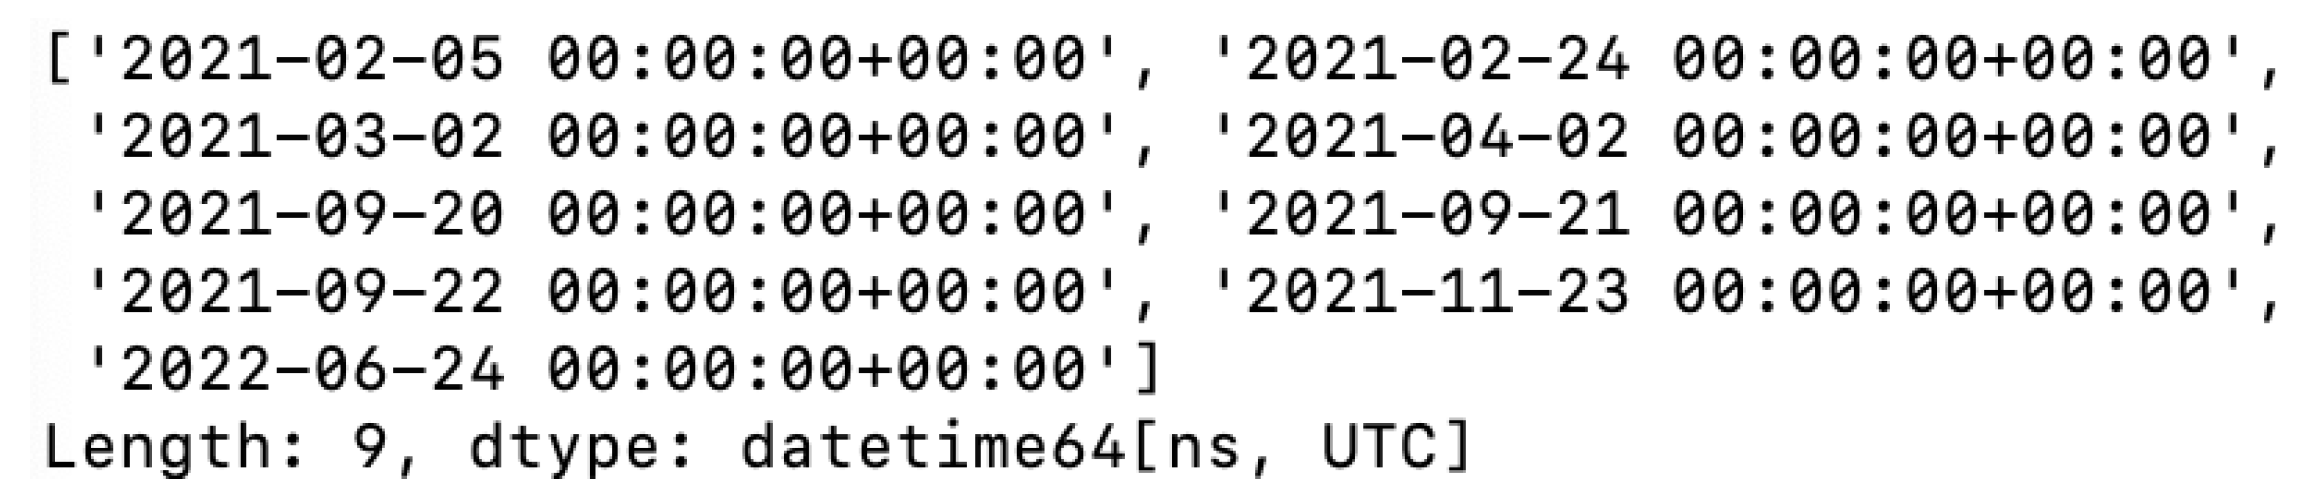
Figure 8.
Results of testing the k-meansPC method.
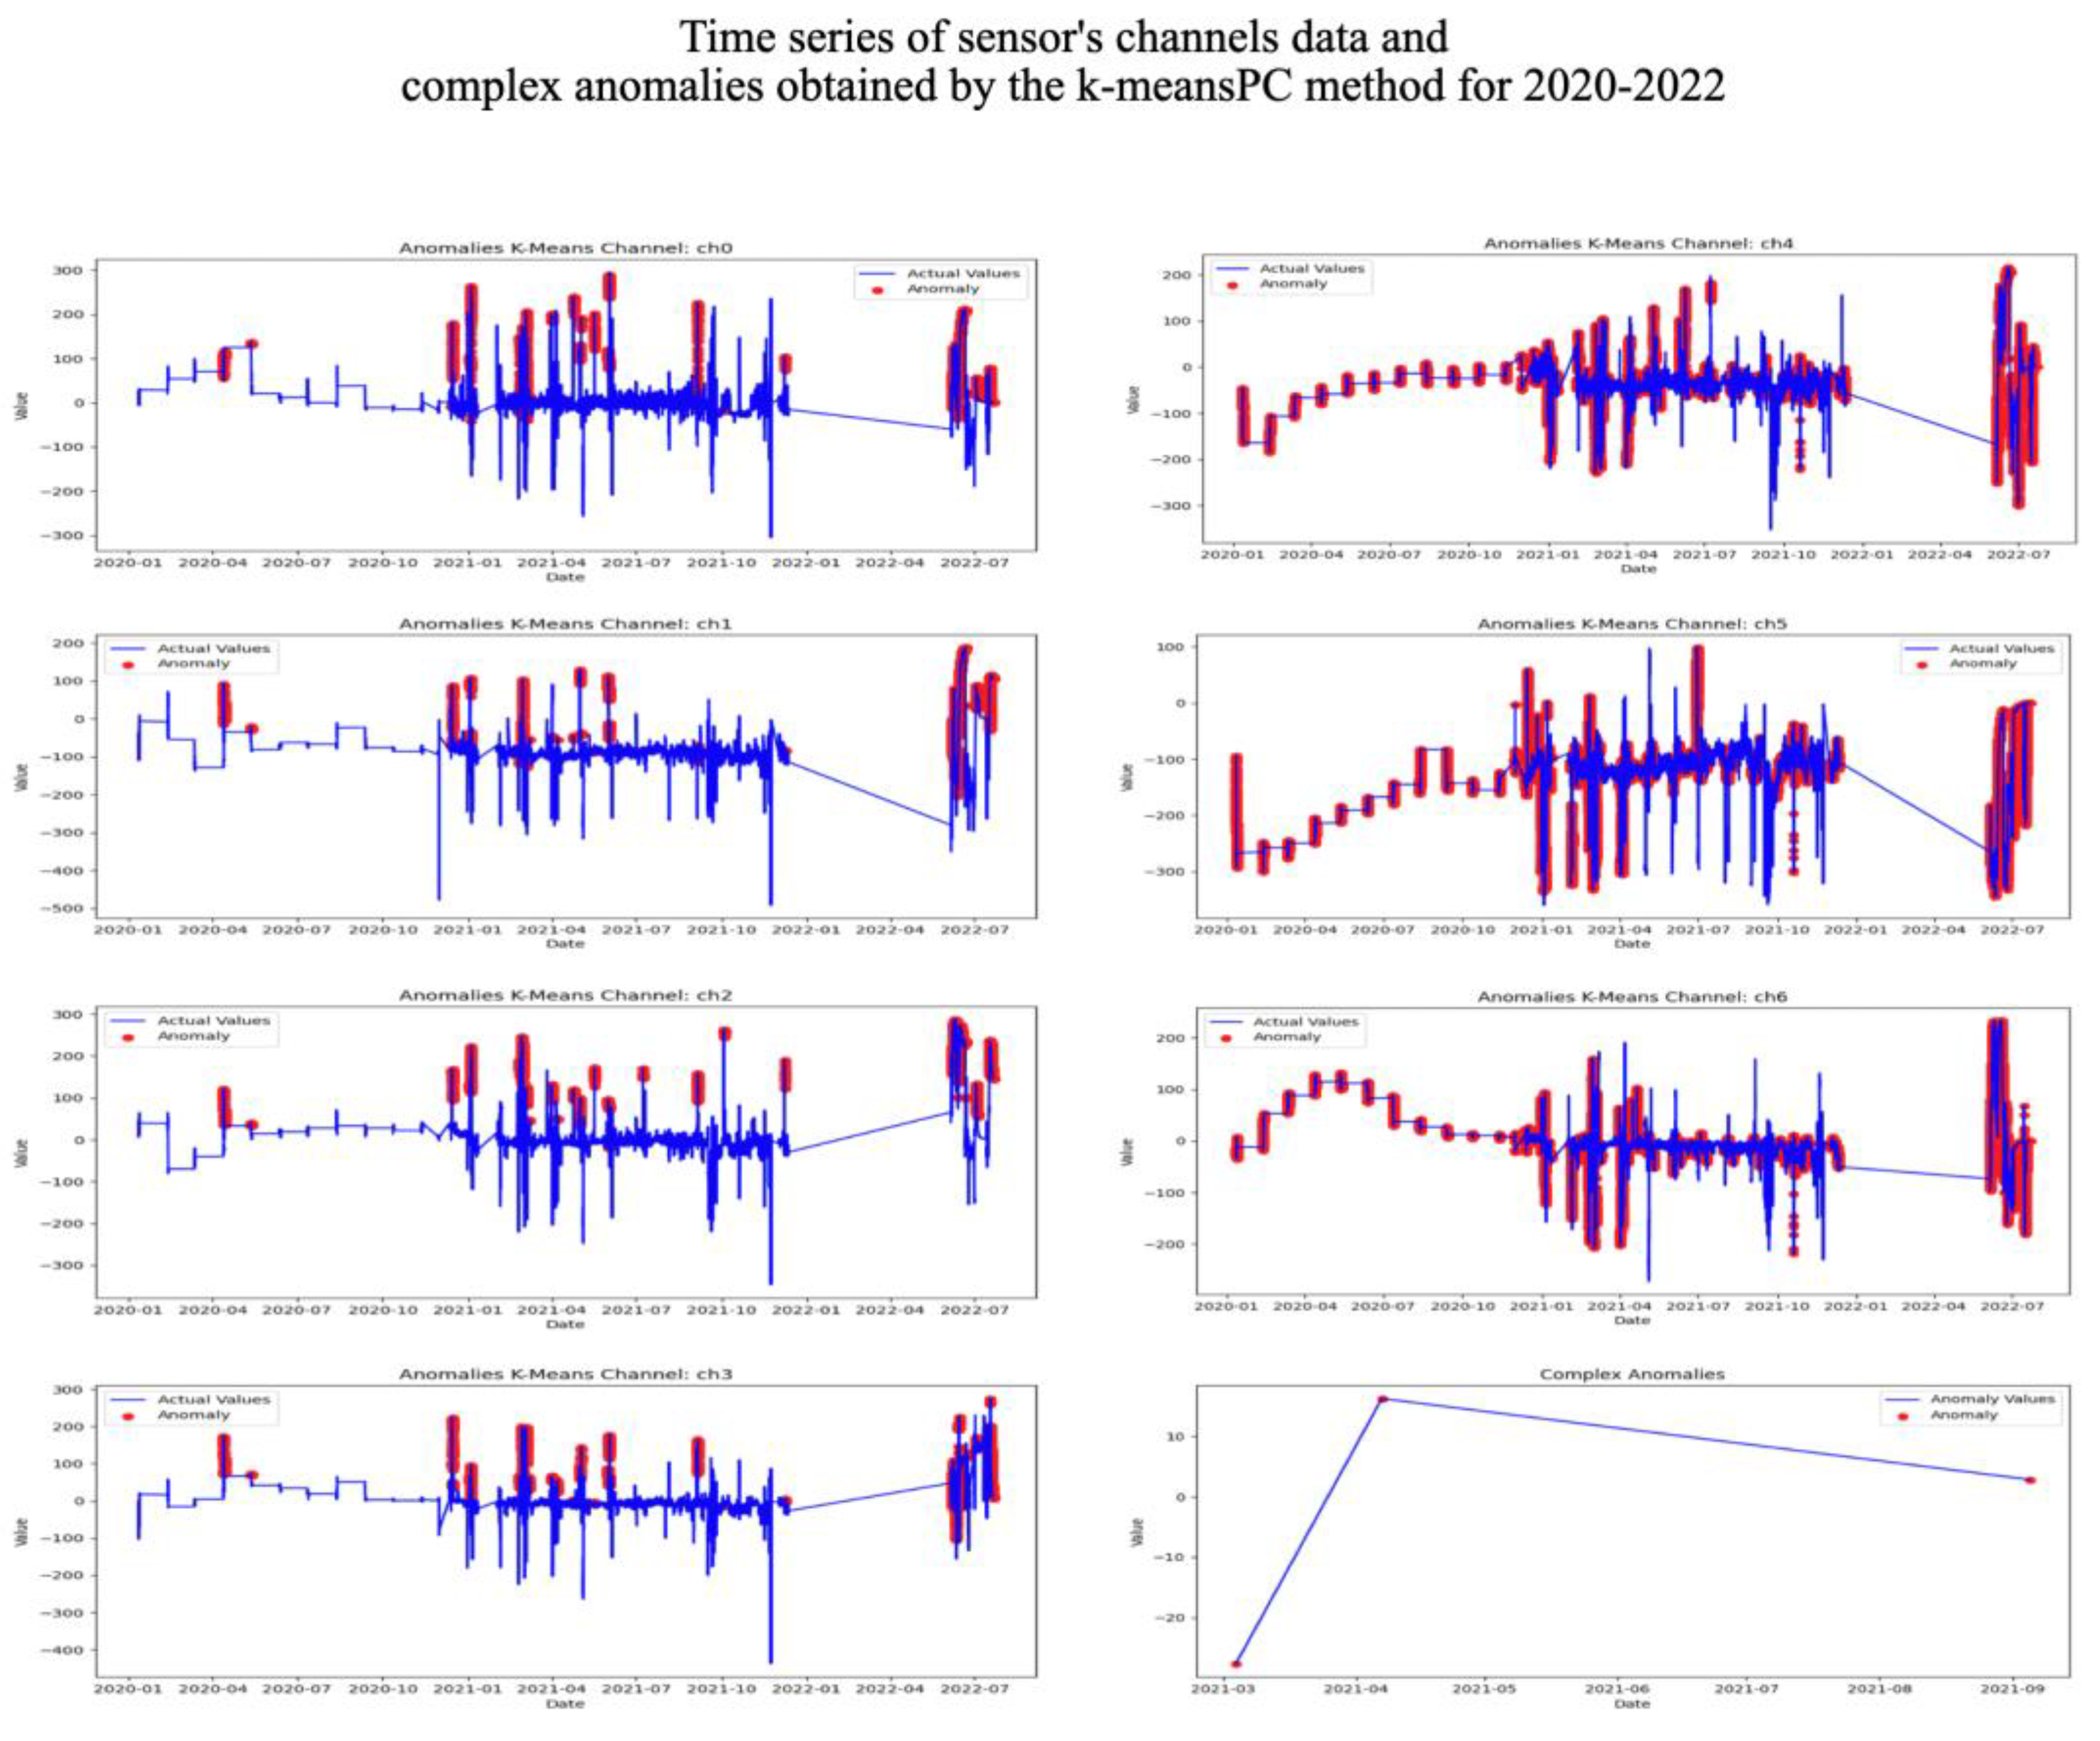
Figure 9.
List of date obtained by the k-meansPC method.
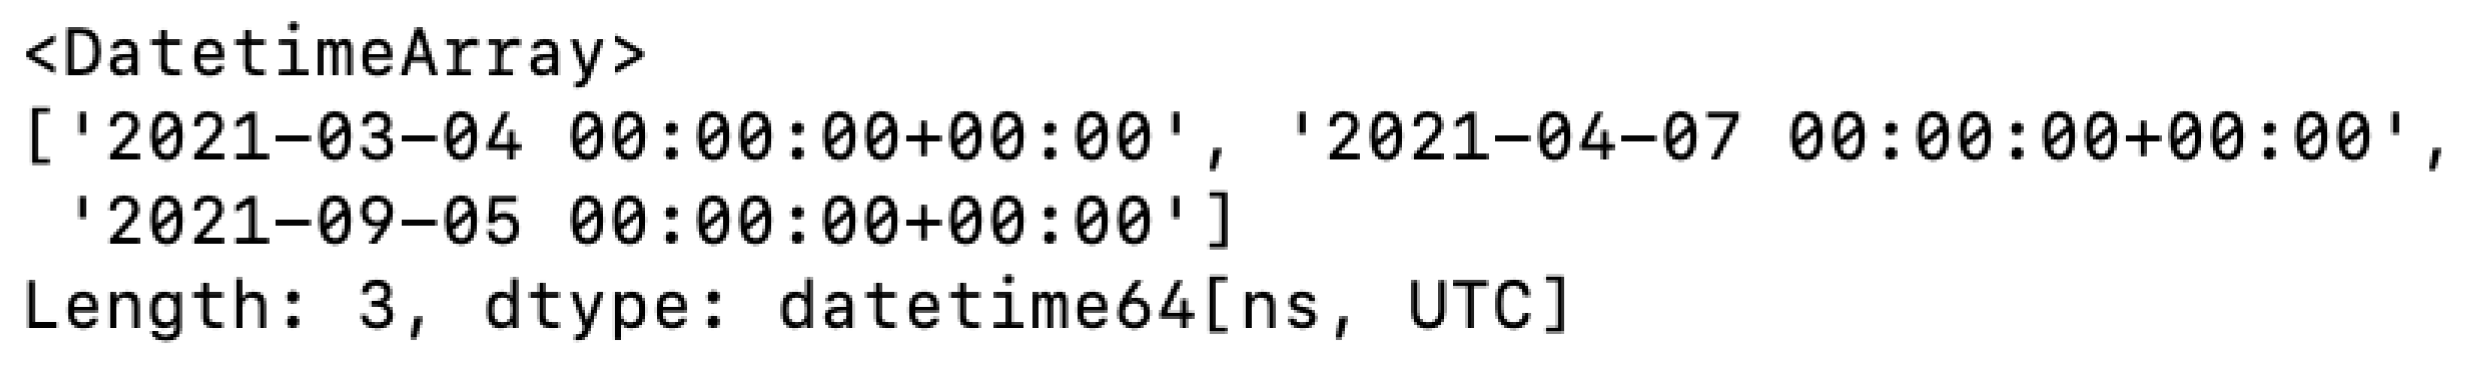
Figure 10.
Results of testing the IFPC method.
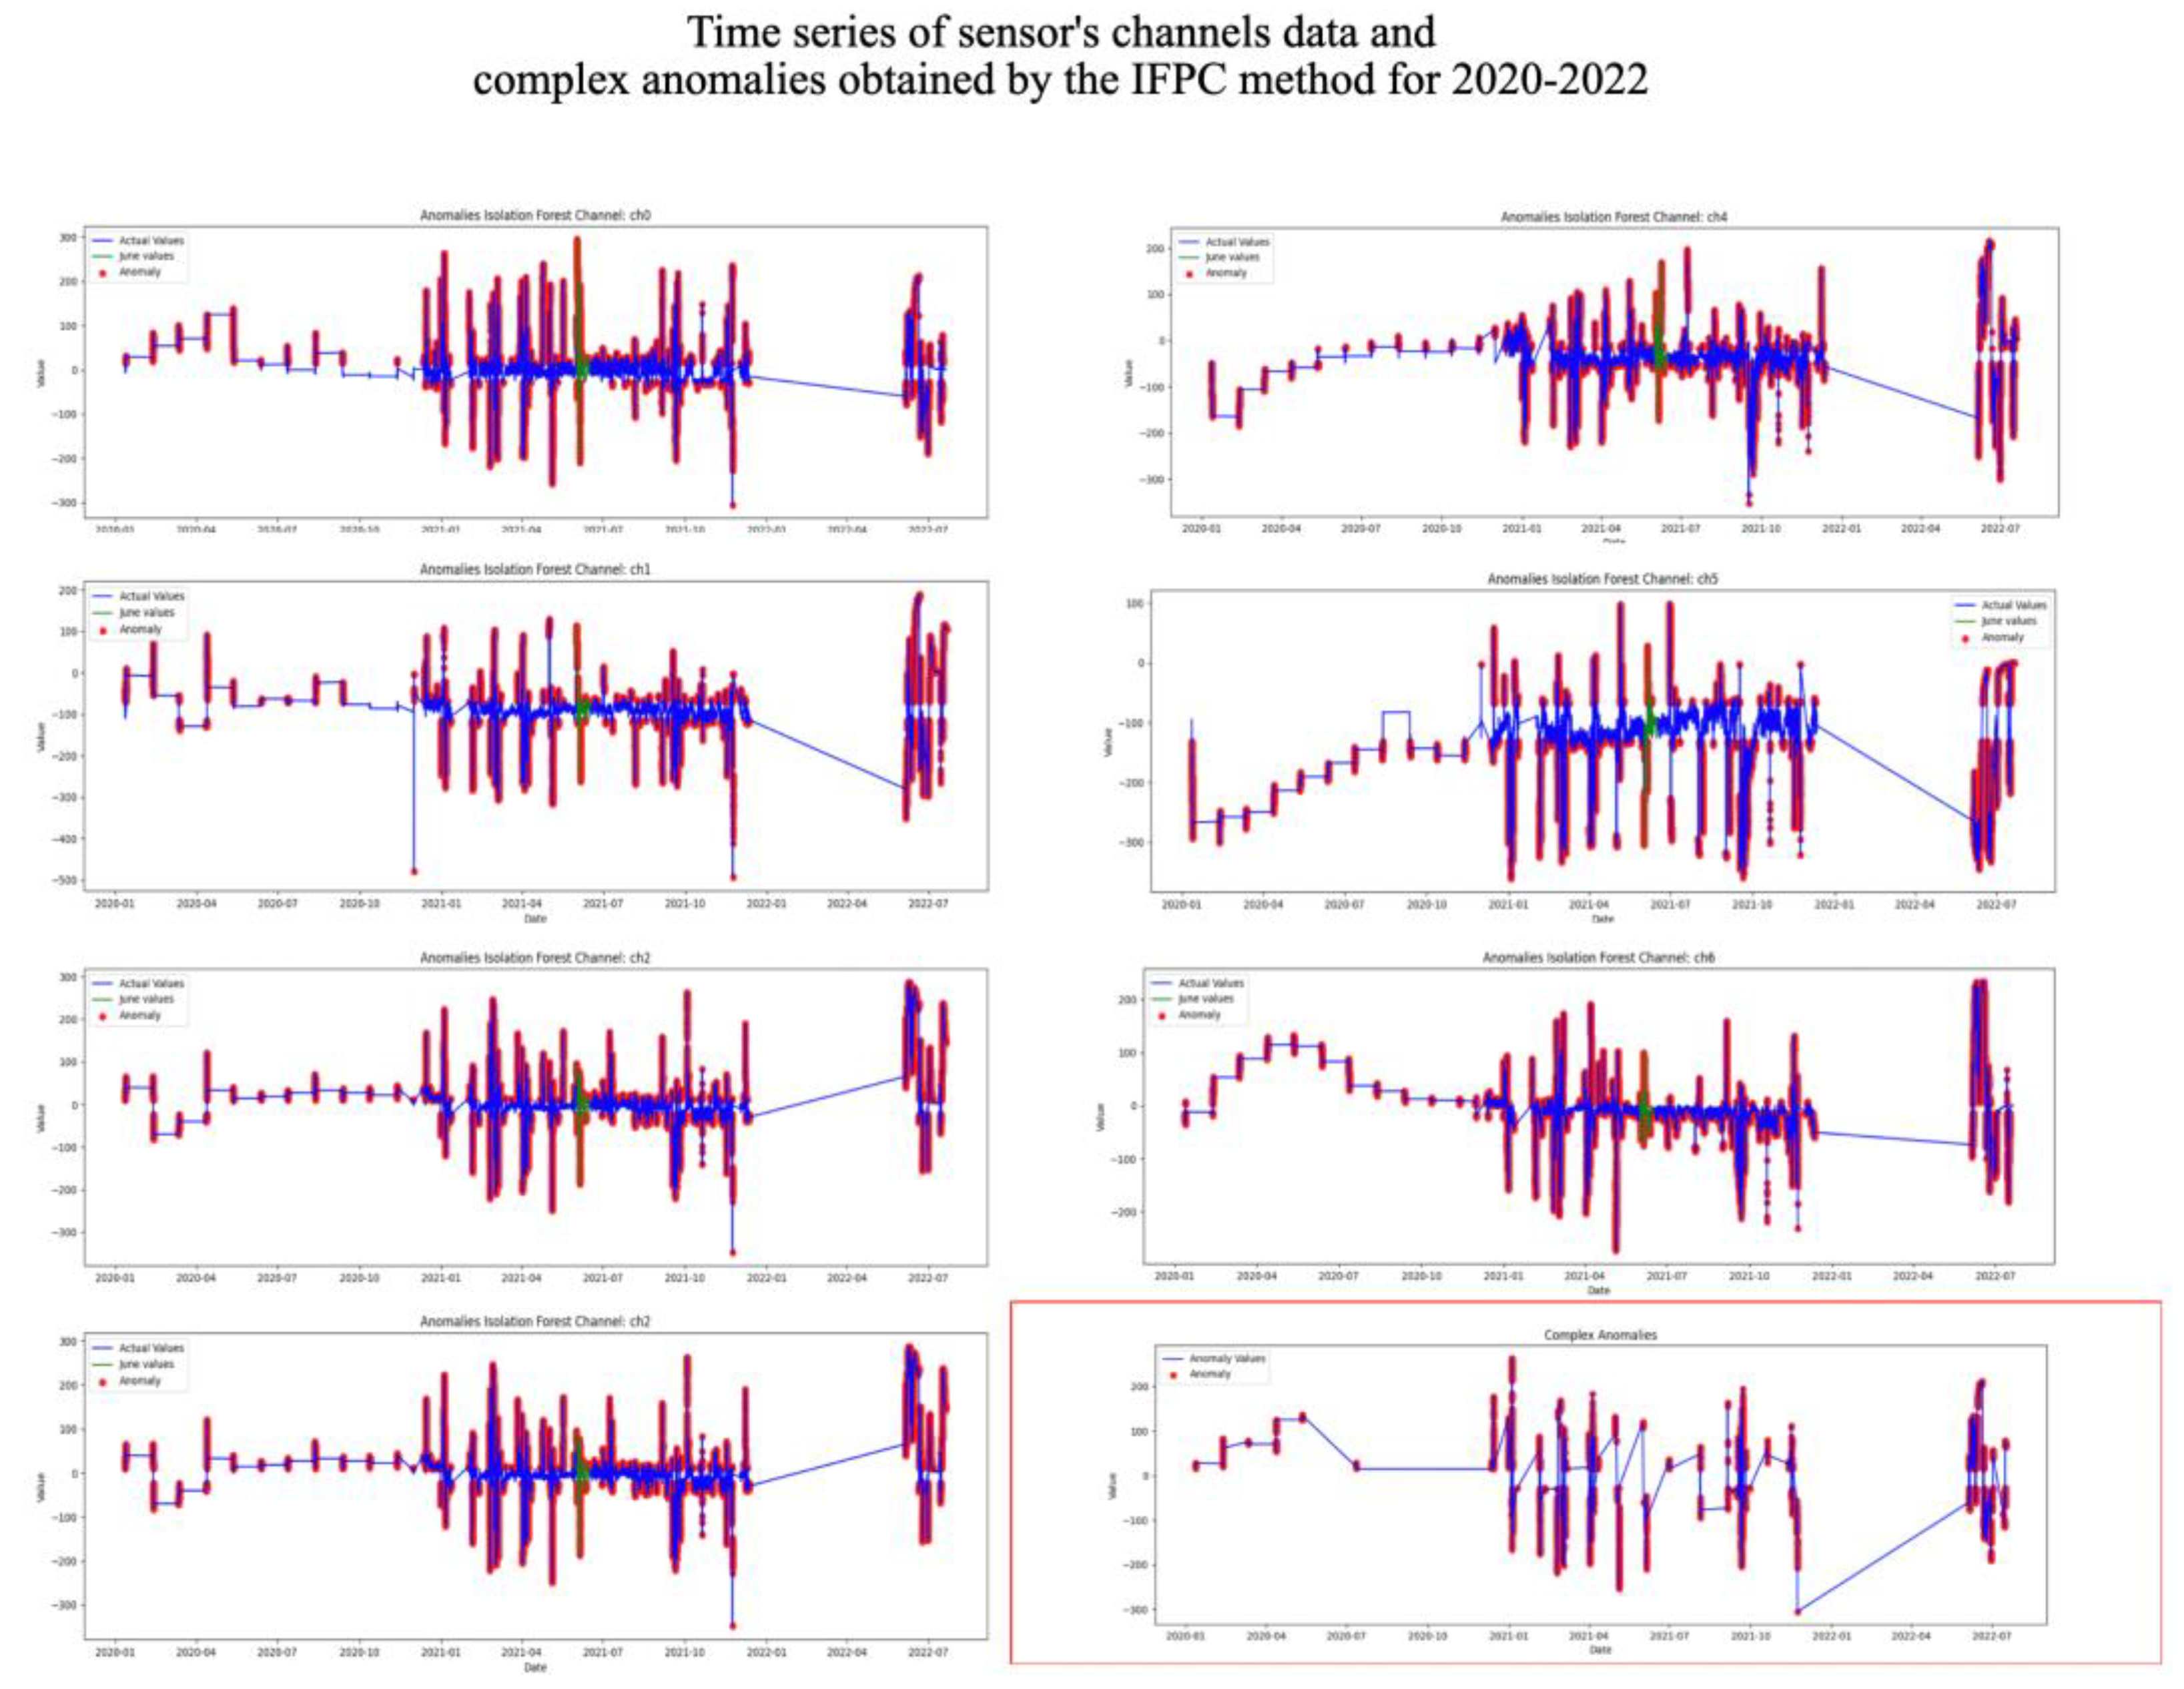
Figure 11.
List of date obtained by the IFPC method.
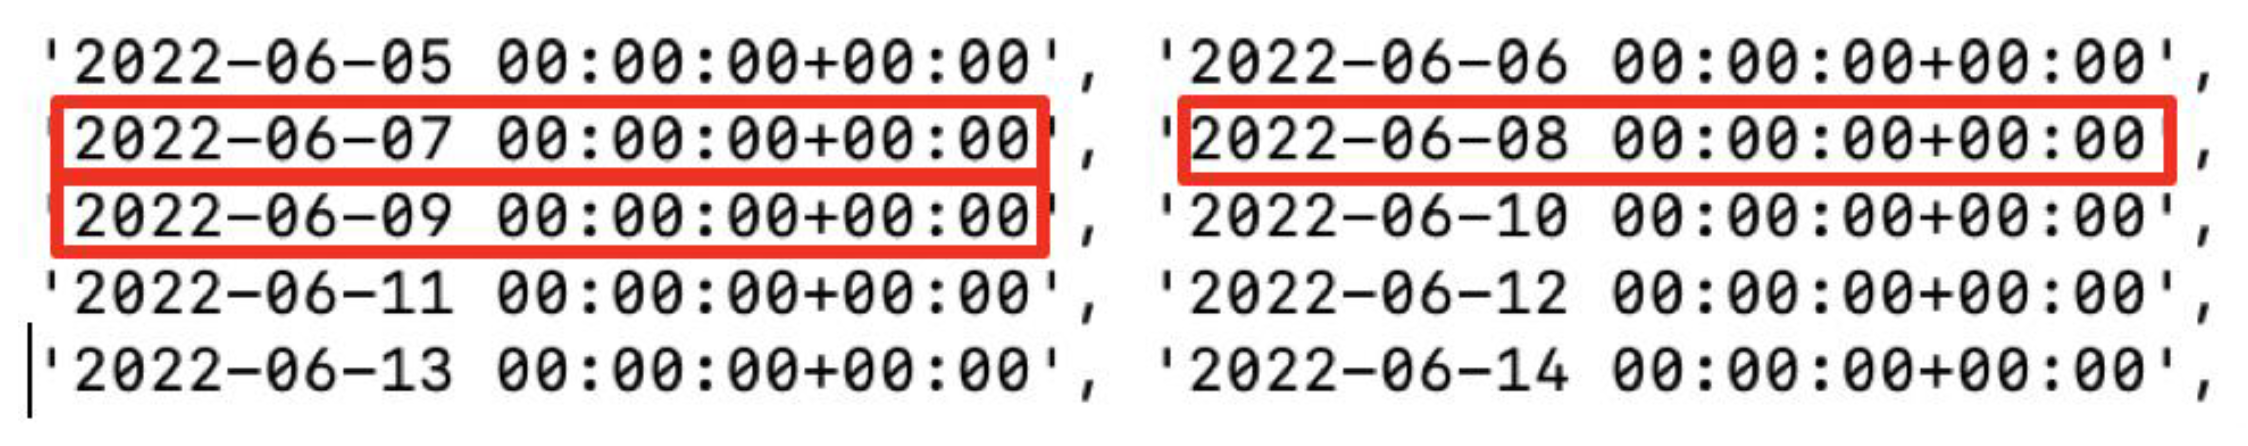

Table 1.
The results of the experiments.
| Method | Dates obtained | Dates of laboratory recorded facts | Number of detection |
|---|---|---|---|
| 3σPC | 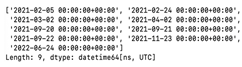 |
2022-06-07, 2022-06-08, 2022-06-09 |
0/3 |
| k-meansPC | 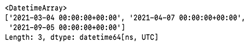 |
0/3 | |
| IFPC | 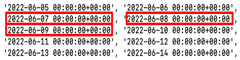 |
3/3 |
Disclaimer/Publisher’s Note: The statements, opinions and data contained in all publications are solely those of the individual author(s) and contributor(s) and not of MDPI and/or the editor(s). MDPI and/or the editor(s) disclaim responsibility for any injury to people or property resulting from any ideas, methods, instructions or products referred to in the content. |
© 2024 by the authors. Licensee MDPI, Basel, Switzerland. This article is an open access article distributed under the terms and conditions of the Creative Commons Attribution (CC BY) license (http://creativecommons.org/licenses/by/4.0/).
Copyright: This open access article is published under a Creative Commons CC BY 4.0 license, which permit the free download, distribution, and reuse, provided that the author and preprint are cited in any reuse.


