
Submitted:
23 July 2024
Posted:
24 July 2024
You are already at the latest version
Abstract
The primary objective of this study is to determine the existence of a significant correlation between inflammation levels, as measured by inflammatory markers IL-6, IL-1β, and TNF-α, and the severity of depressive symptoms assessed using HAM-D assessment scale. This could provide additional evidence supporting the hypothesis that inflammation plays a notable role in the pathogenesis of depression. The data analysis supports the hypothesis that the biological mechanisms of inflammation contributes to the clinical manifestations of depression. Elevated levels of inflammatory markers, especially interleukins (IL6, IL1β), tumor necrosis factor-alpha (TNFα), and C-reactive protein (CRP) have been identified in patients with major depressive disorder compared to the findings in healthy controls. Materials and Methods: Inflammatory markers (IL-6, IL-1β, and TNF-α) were measured in a sample of 31 patients hospitalized at the Socola Institute of Psychiatry in Iasi, Romania, and compared to a control group with no psychiatric or inflammatory conditions. One of the main objectives is to determine if there is a significant correlation between inflammation levels, measured by inflammatory markers (IL-6, IL-1β, and TNF-α), and the severity of depressive symptoms assessed using HAM-D scores. Conclusions: The study results suggest a significant correlation between inflammation levels measured by inflammatory markers IL-1β and IL-6 and the severity of depressive symptoms evaluated by HAM-D scores in the study group. These findings support the hypothesis that inflammation may play an important role in the development or exacerbation of depressive symptoms. The relationship between inflammation and depression is also influenced by risk and protective factors that require further research.
Keywords:
Inflammation
; depression
; inflammatory markers
1. Introduction
There are a multitude of factors that can determine a bidirectional relationship between depression and inflammation, with the underlying mechanisms not being fully understood [1]. Experimental studies have shown that stress is associated with elevated levels of CRP and TNF-α [2], that a stressful social family environment can directly stimulate the production of pro-inflammatory cytokines, and that changes in coagulation factors and genetic factors can increase the risk of depressive symptoms as well as cardiovascular diseases and glucose metabolism alterations. Thus, the theory that the inflammatory process is an etiological factor in depression, associated with elevated levels of inflammatory markers and low levels of serotonin, an important neurotransmitter in the pathogenesis of depression, is considered [3].
At least two interleukins appear to play an important role in the effects on neurotransmitter systems in schizophrenia: IL-1β, which induces mesencephalic progenitor cells in rats to transform into a dopaminergic phenotype, and IL-6, which decreases the survival of serotonergic neurons in the fetal brain. Although increases in pro-inflammatory cytokines are not specific to schizophrenia and are described in other mental disorders, the interaction between cytokines and neurotransmitters in certain brain regions, particularly during brain development, contributes to the pathophysiology of schizophrenia [4].
Animal models have provided evidence for the role of pre- and perinatal infections in the later development of schizophrenia. For example, in animal models, offspring exhibit typical symptoms of schizophrenia, such as cognitive impairment or abnormal reflexes, following prenatal exposure to viral agents [5]. Evidence is also available from human studies after prenatal or childhood exposure to various viruses, respiratory infections, genital or reproductive tract infections, toxoplasma gondii, and other infections.
2. Objectives
In this study, we aimed to more precisely assess the association between inflammation and depression by measuring inflammatory markers (IL-6, IL-1β, and TNF-α) in a group of patients admitted to the Socola Institute of Psychiatry and comparing them with a control group of individuals without psychiatric disorders and without associated inflammatory pathologies. The study group included 31 patients, while the control group included 19. In the study group patients, we monitored leukocyte count, ESR (erythrocyte sedimentation rate), and C-reactive protein to observe if their values increased concurrently with high HAM-D scores.
One of the main objectives is to determine whether there is a significant correlation between inflammation levels, measured by inflammatory markers (IL-6, IL-1β, and TNF-α), and the severity of depressive symptoms, evaluated using HAM-D scores. This could provide evidence for the hypothesis that inflammation may play a role in depression.
Examining the influence of marital status on the inflammation-depression relationship: Another objective of the study is to investigate whether the marital status of patients (married, divorced, cohabiting) influences the correlation between inflammation and depression. This could provide insights into how social, or life factors interact with inflammatory processes in depression.
It is important to compare the results obtained in the study group, which includes patients with psychiatric disorders and inflammatory pathologies, with those in a control group, which has no psychiatric disorders or inflammatory pathologies. This comparison could highlight significant differences between the two groups and provide additional data on the inflammation-depression relationship.
The study could analyse whether there are significant differences between men and women regarding the relationship between inflammation and depression. This could contribute to understanding how the patient's gender may influence this relationship.
The results should confirm or refute the hypotheses presented in the study, such as the hypothesis that IL-6 may be a relevant indicator in assessing the severity of depression or the hypothesis that marital status may influence the relationship between inflammation and depression.
3. Materials and Methods
In this study, we used the Hamilton Anxiety Rating Scale (HAM-A) as the main psychometric tool to assess the severity of anxiety in patients. The HAM-A scale is recognized for its ability to quantify anxiety symptoms, providing scores ranging from 0-4 points (indicating normal limits), 5-10 points (mild anxiety), 11-16 points (moderate anxiety), and ≥ 17 points (severe anxiety). Although this scale is extremely useful for tracking the evolution of patients throughout long-term psychotherapeutic treatment, it cannot substitute for a detailed clinical evaluation performed by a psychiatrist. Using HAM-A in combination with comprehensive clinical evaluations ensures a more accurate diagnosis and adequate monitoring of patients' conditions, thus facilitating appropriate therapeutic interventions.. For the patients in the study group, with a distribution between genders and backgrounds that reflect potential differences in access to care or the prevalence of the health conditions studied, we also monitored the value of C-reactive protein to observe if there was an increase in its levels concomitant with a high HAM-D score.
4. Results
The study found further associations between inflammation and depression. Inflammatory markers (IL-6, IL-1β, and TNF-α) were measured in a group of 31 patients and compared with a control group without psychiatric disorders or associated inflammatory pathologies of 19 individuals. The analysis of the distribution of patients in the study group provides an insight into the diversity of the sample in terms of gender and background. The gender distribution in the study group reflects potential differences in access to care or the prevalence of the health conditions studied.

Table 1.
Distribution of patients according to gender, BMI and level of inflammation.
| BMI | ||||
|---|---|---|---|---|
| GENDER | < 18.5 kg/m2 (Underweight) |
18.5 – 25 kg/m2 (Normal) |
25 – 30 kg/m2 (Overweight) |
BMI ≥ 30 kg/m2 (Obesity) |
| Men | 2 (6.45%) | 4 (12.90%) | 3 (9.67%) | 1 (3.22%) |
| Women | 5 (16.12%) | 10 (32.25%) | 3 (9.67%) | 3 (9.67%) |
| The presence of inflammation | 2 (6.45%) | 4 (12.90%) | 2 (6.45%) | 2 (6.45%) |
These data offer an intriguing perspective on the distribution of patients by gender, Body Mass Index (BMI), and the presence of elevated inflammatory markers. Interpreting these data brings to the forefront complex aspects that can provide a solid basis for further research and a deeper understanding of these relationships. We will explore these elements without resorting to enumerations, using appropriate academic language.
Firstly, we observe significant variations in the body composition of subjects based on BMI and gender. Regarding men, a significant majority fall into the normal BMI category. This observation suggests a relatively uniform distribution of BMIs among men in this sample. In contrast, women exhibit a greater diversity in BMIs, which may reflect not only biological variability but also behavioural influences on body weight.
Table 2.
Distribution of patients according to gender, family medical history and inflammatory markers.
Table 2.
Distribution of patients according to gender, family medical history and inflammatory markers.
| Gender | Family medical history | No. of Patients | Increased inflammatory markers |
|---|---|---|---|
| Men | Present | 3 (9.67%) | 1 (3.22%) |
| Absent | 7 (22.58%) | 4 (12.90%) | |
| Women | Present | 9 (29.03%) | 5 (16.12%) |
| Absent | 12 (38.70%) | 0 (0.00%) |
From a broader perspective, when analysing the presence of elevated inflammatory markers, we can easily observe that these markers are significantly present across all BMI categories. This indicates an important aspect of this analysis: inflammation appears to be a relevant issue among these patients, regardless of BMI. However, it is important to mention that inflammation can have multiple origins, such as underlying medical conditions, genetic factors, or behavioural factors, and its intensity can vary from one individual to another.
The relevant data presented in Table 2 highlight a series of noteworthy aspects. Firstly, it is evident that patients were categorized based on gender and the presence or absence of hereditary antecedents. This may reflect a patient classification approach based on biological factors and family history. In this context, there is significant diversity in the distribution of patients across the four categories.
Furthermore, the presence or absence of elevated inflammatory markers in these groups is notable. This may suggest complex relationships between genetic predisposition, family history, and the inflammatory status of patients. However, we must be aware that inflammation is a multifactorial process and can have multiple causes, including environmental factors and lifestyle. This could be an important direction for future research and, overall, these data represent just a "window" into a much more complex medical reality.
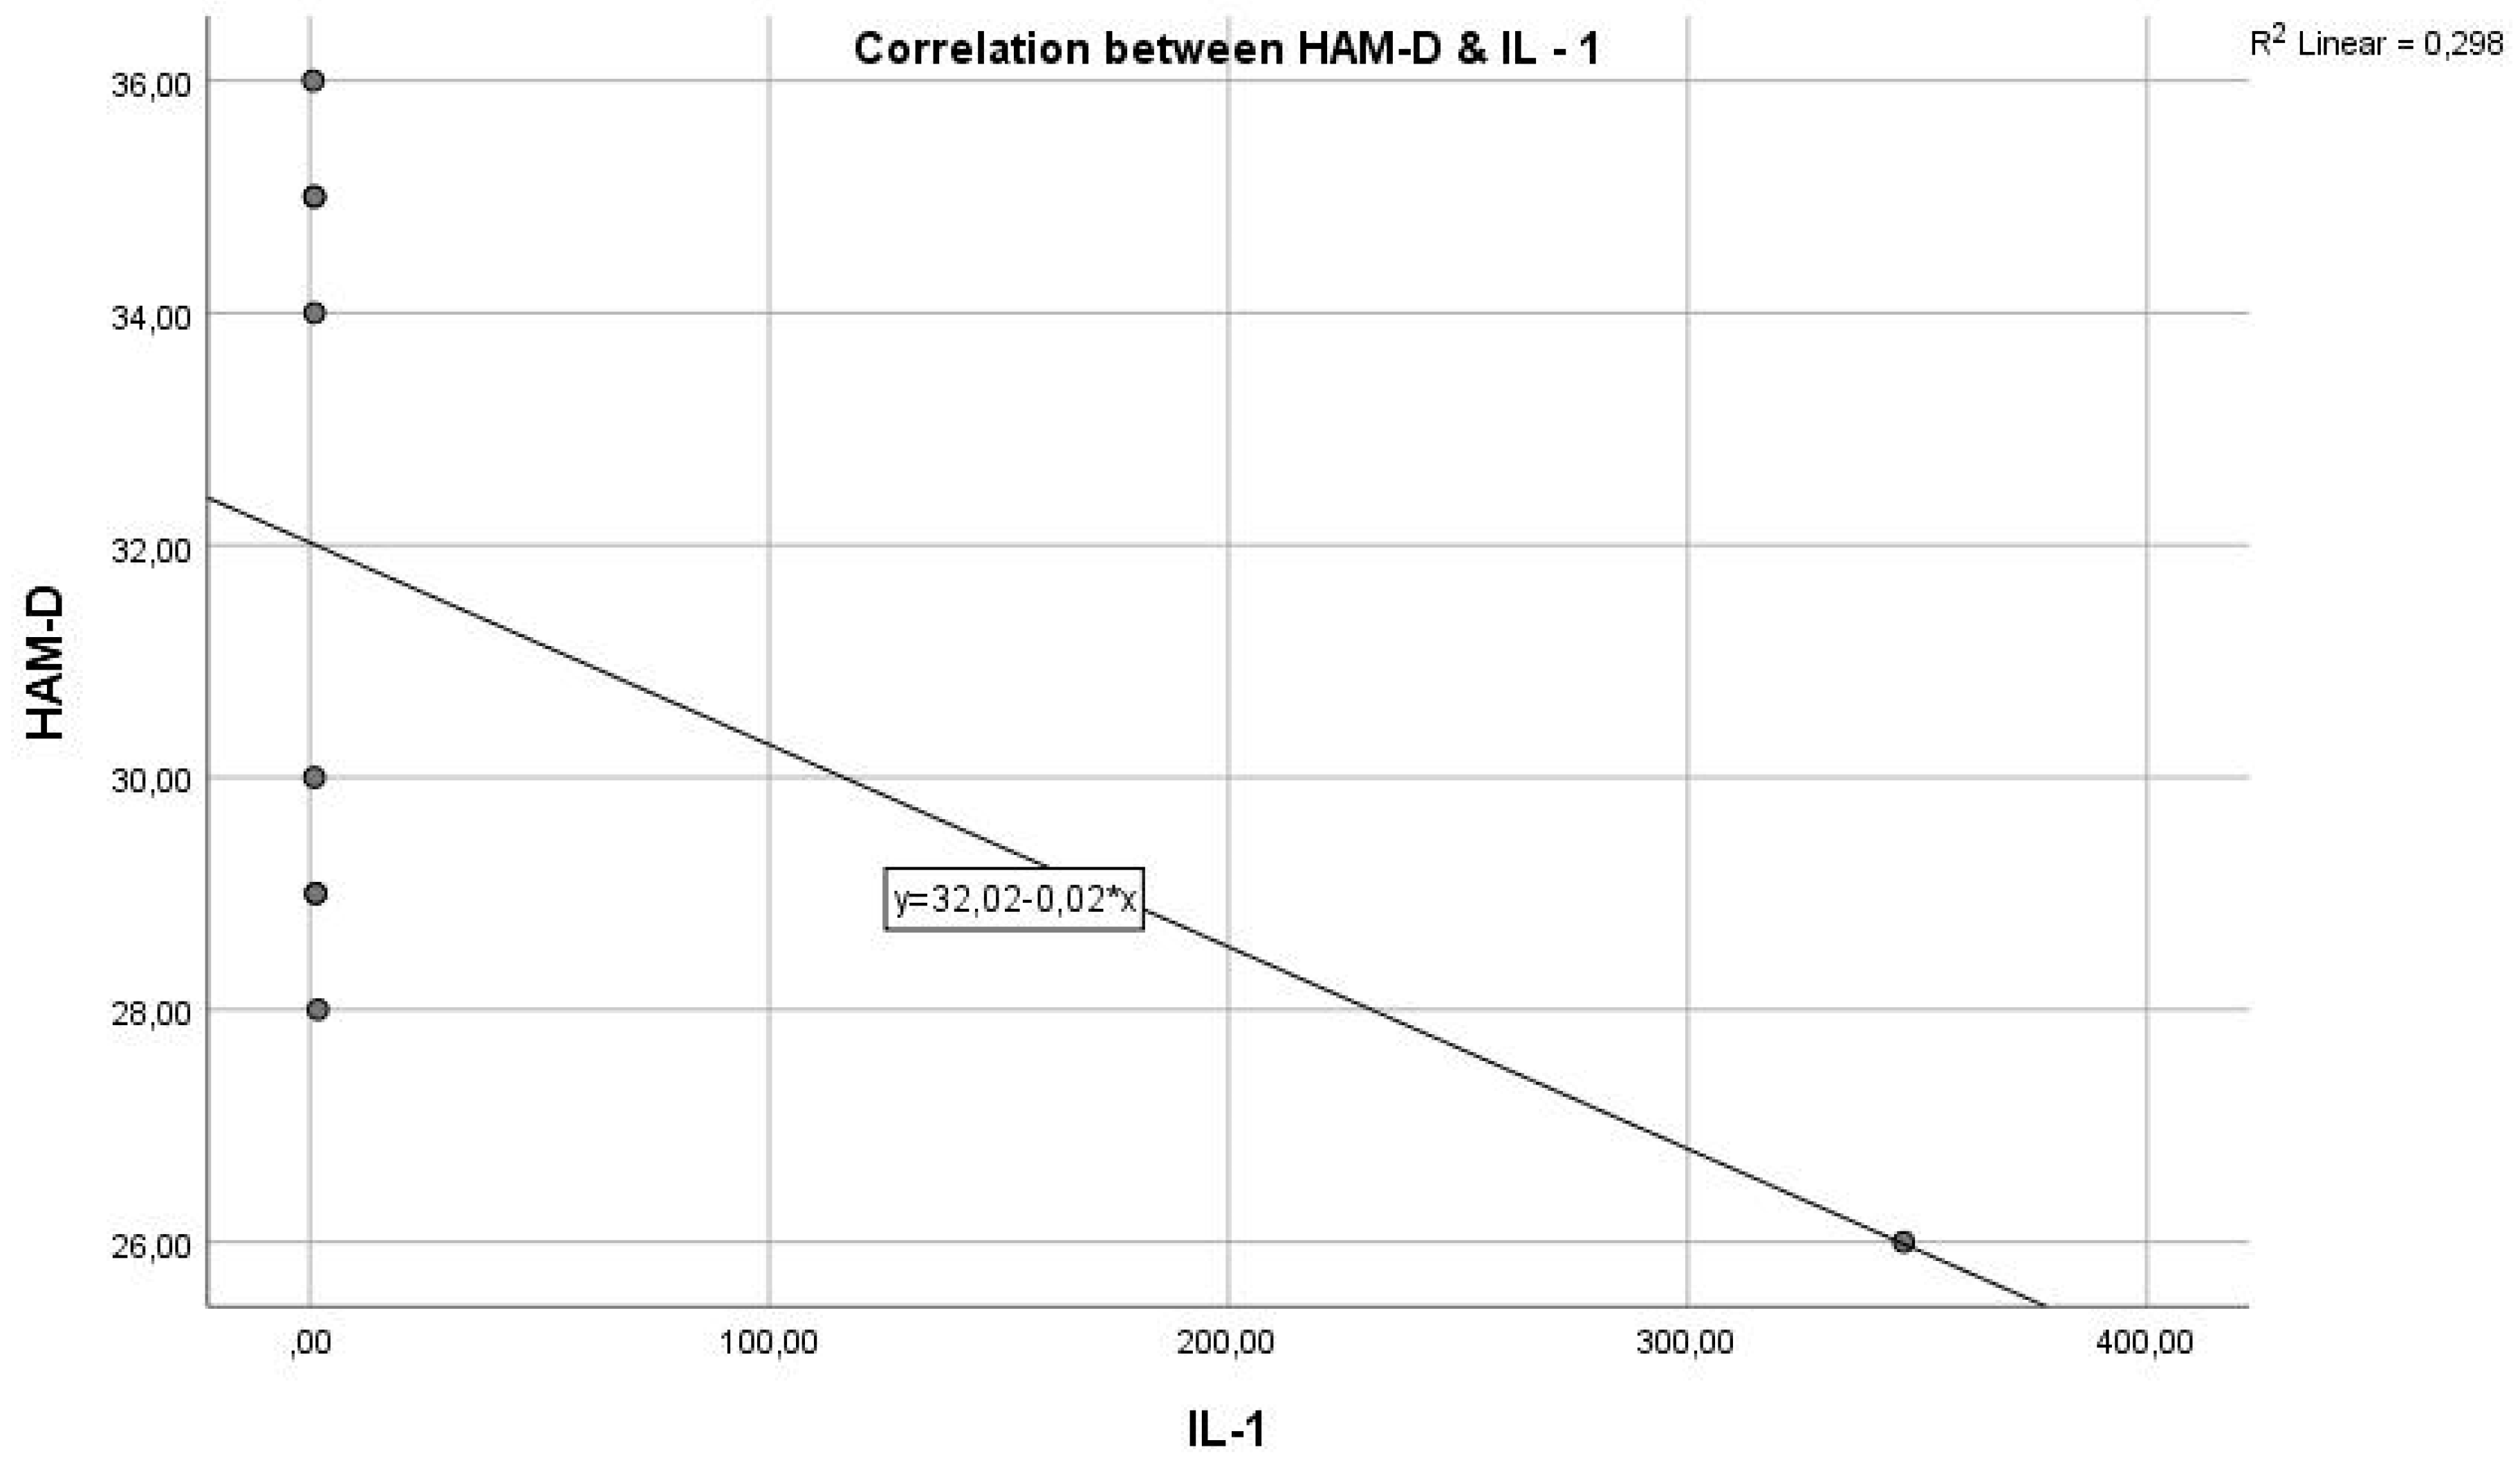
In the graph below, we have the correlation between the inflammatory marker IL-1 and the HAM-D test score (Figure 1). As we can see, we have a Pearson correlation coefficient r = -0.3720, which indicates a negative correlation but with weak statistical significance (p > 0.005), from which we cannot conclude that these variables are correlated and statistically significant.
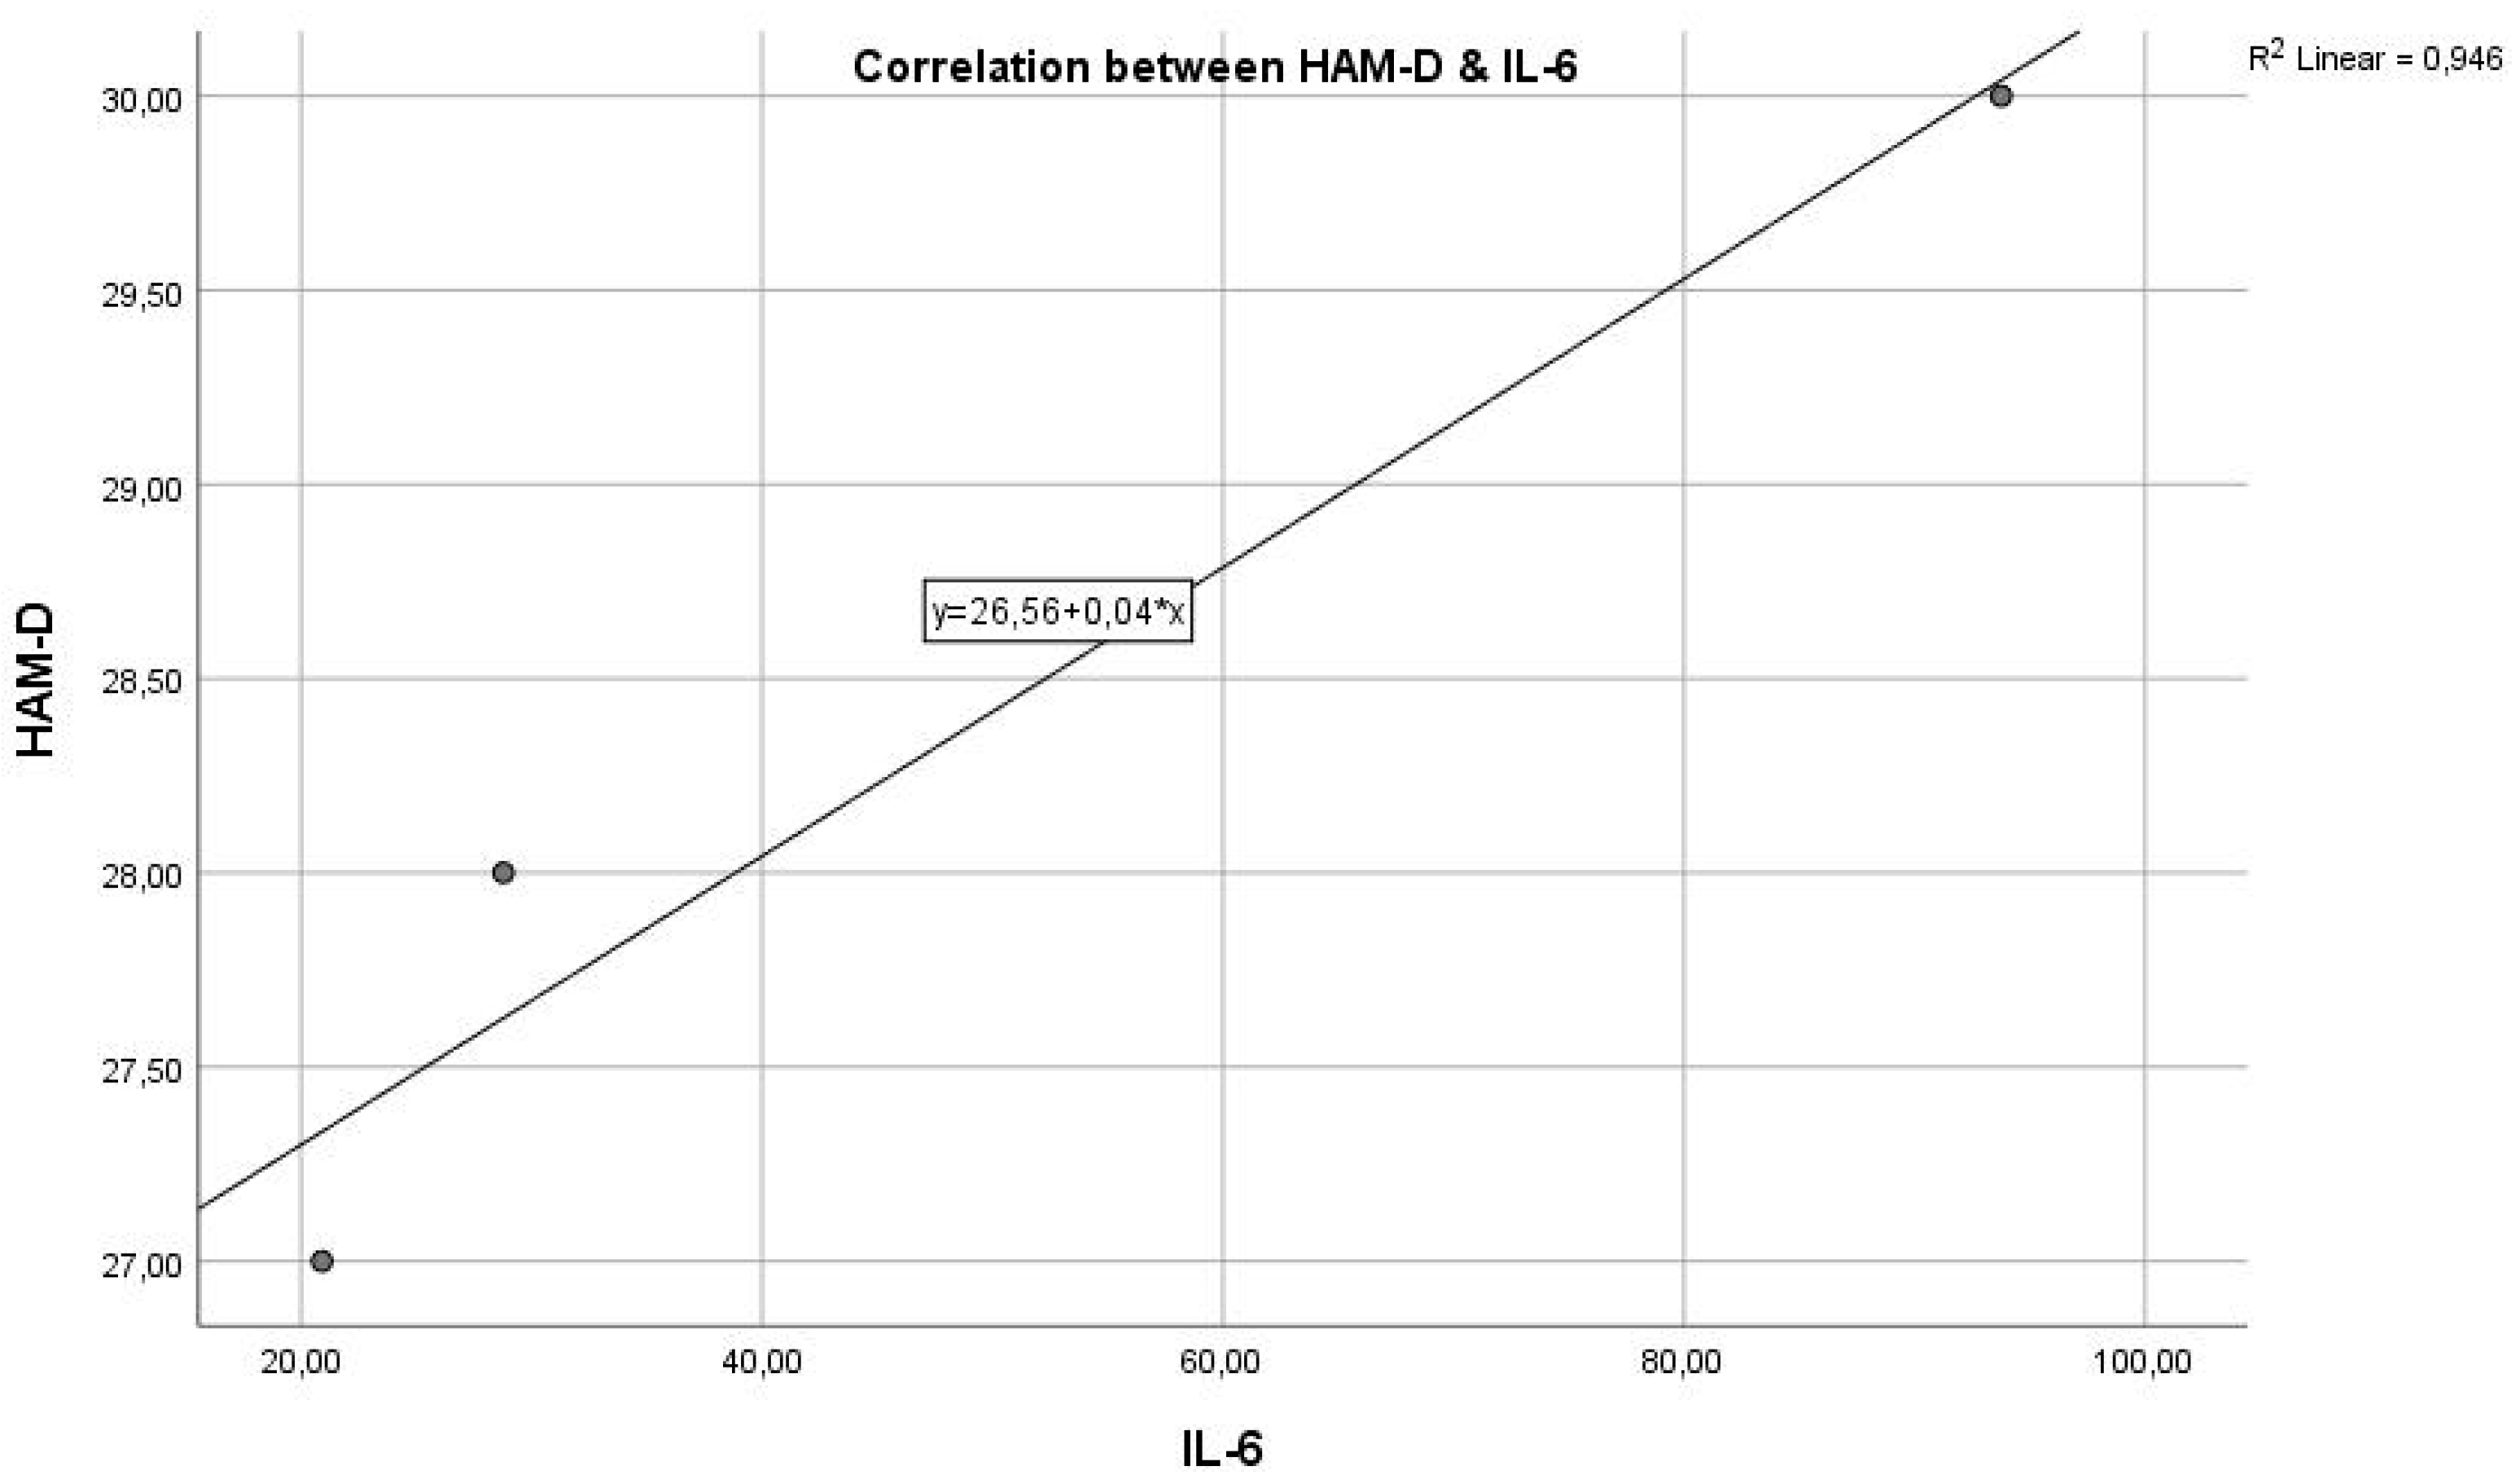
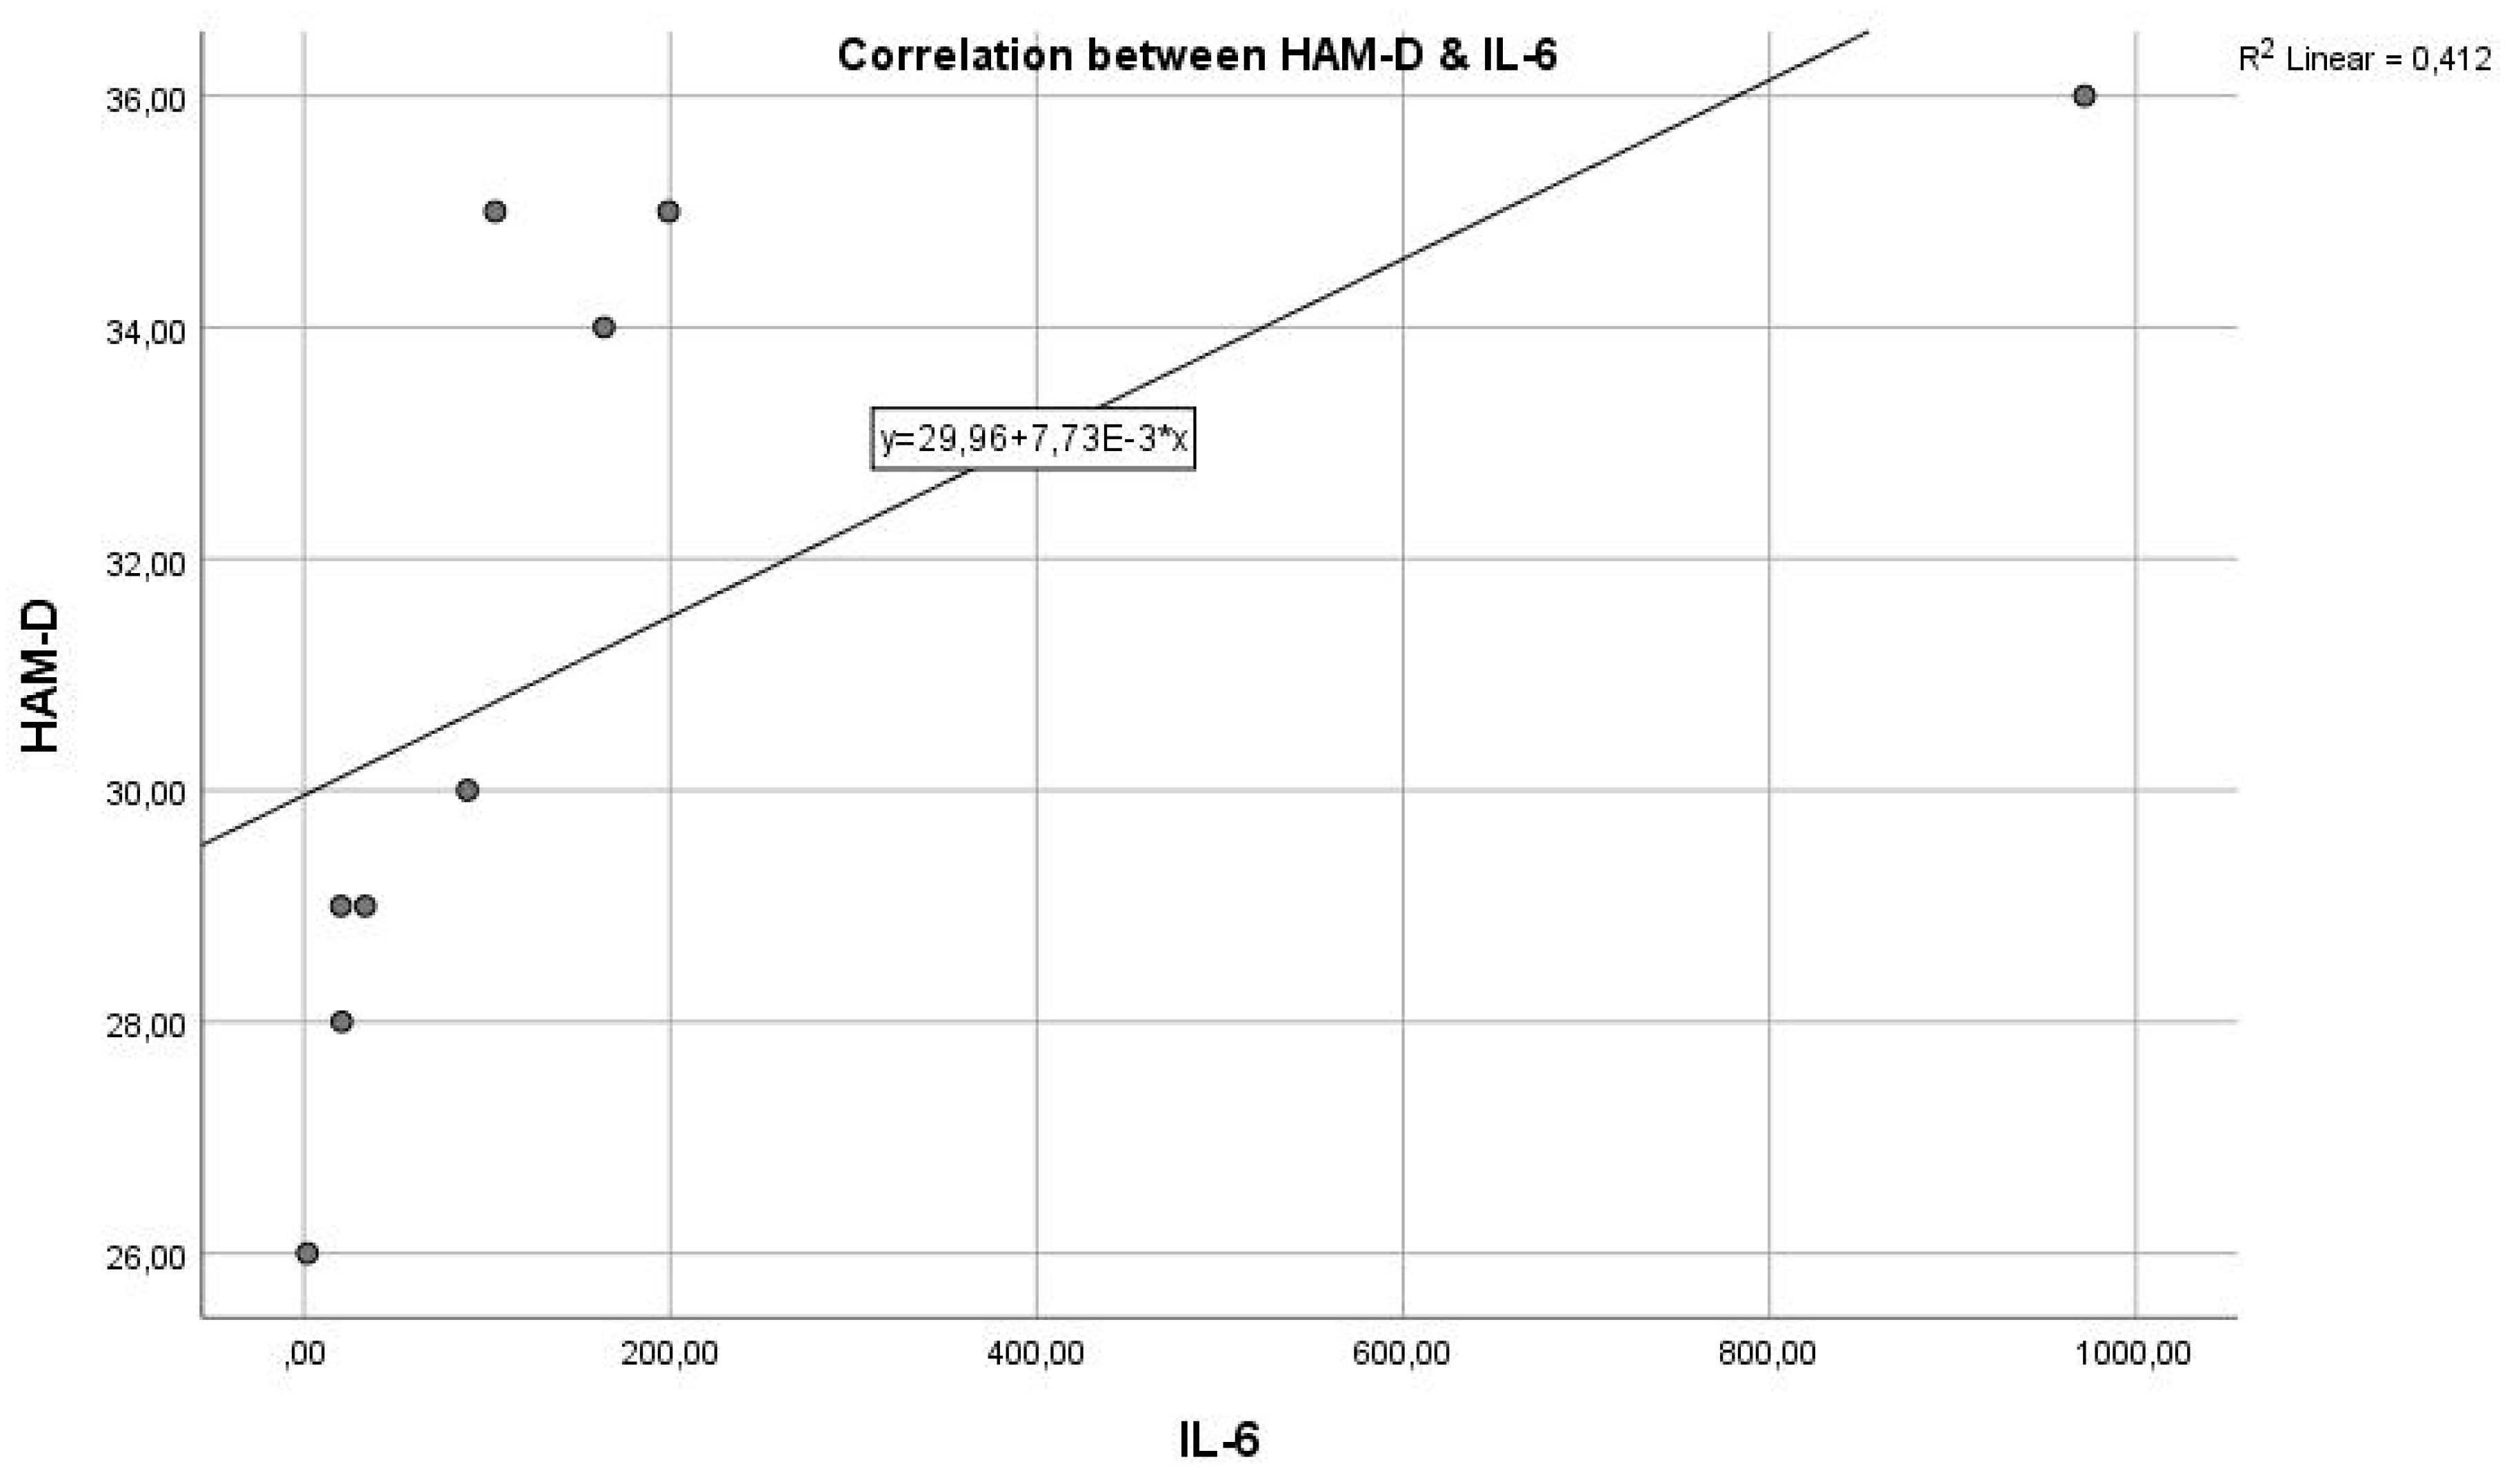
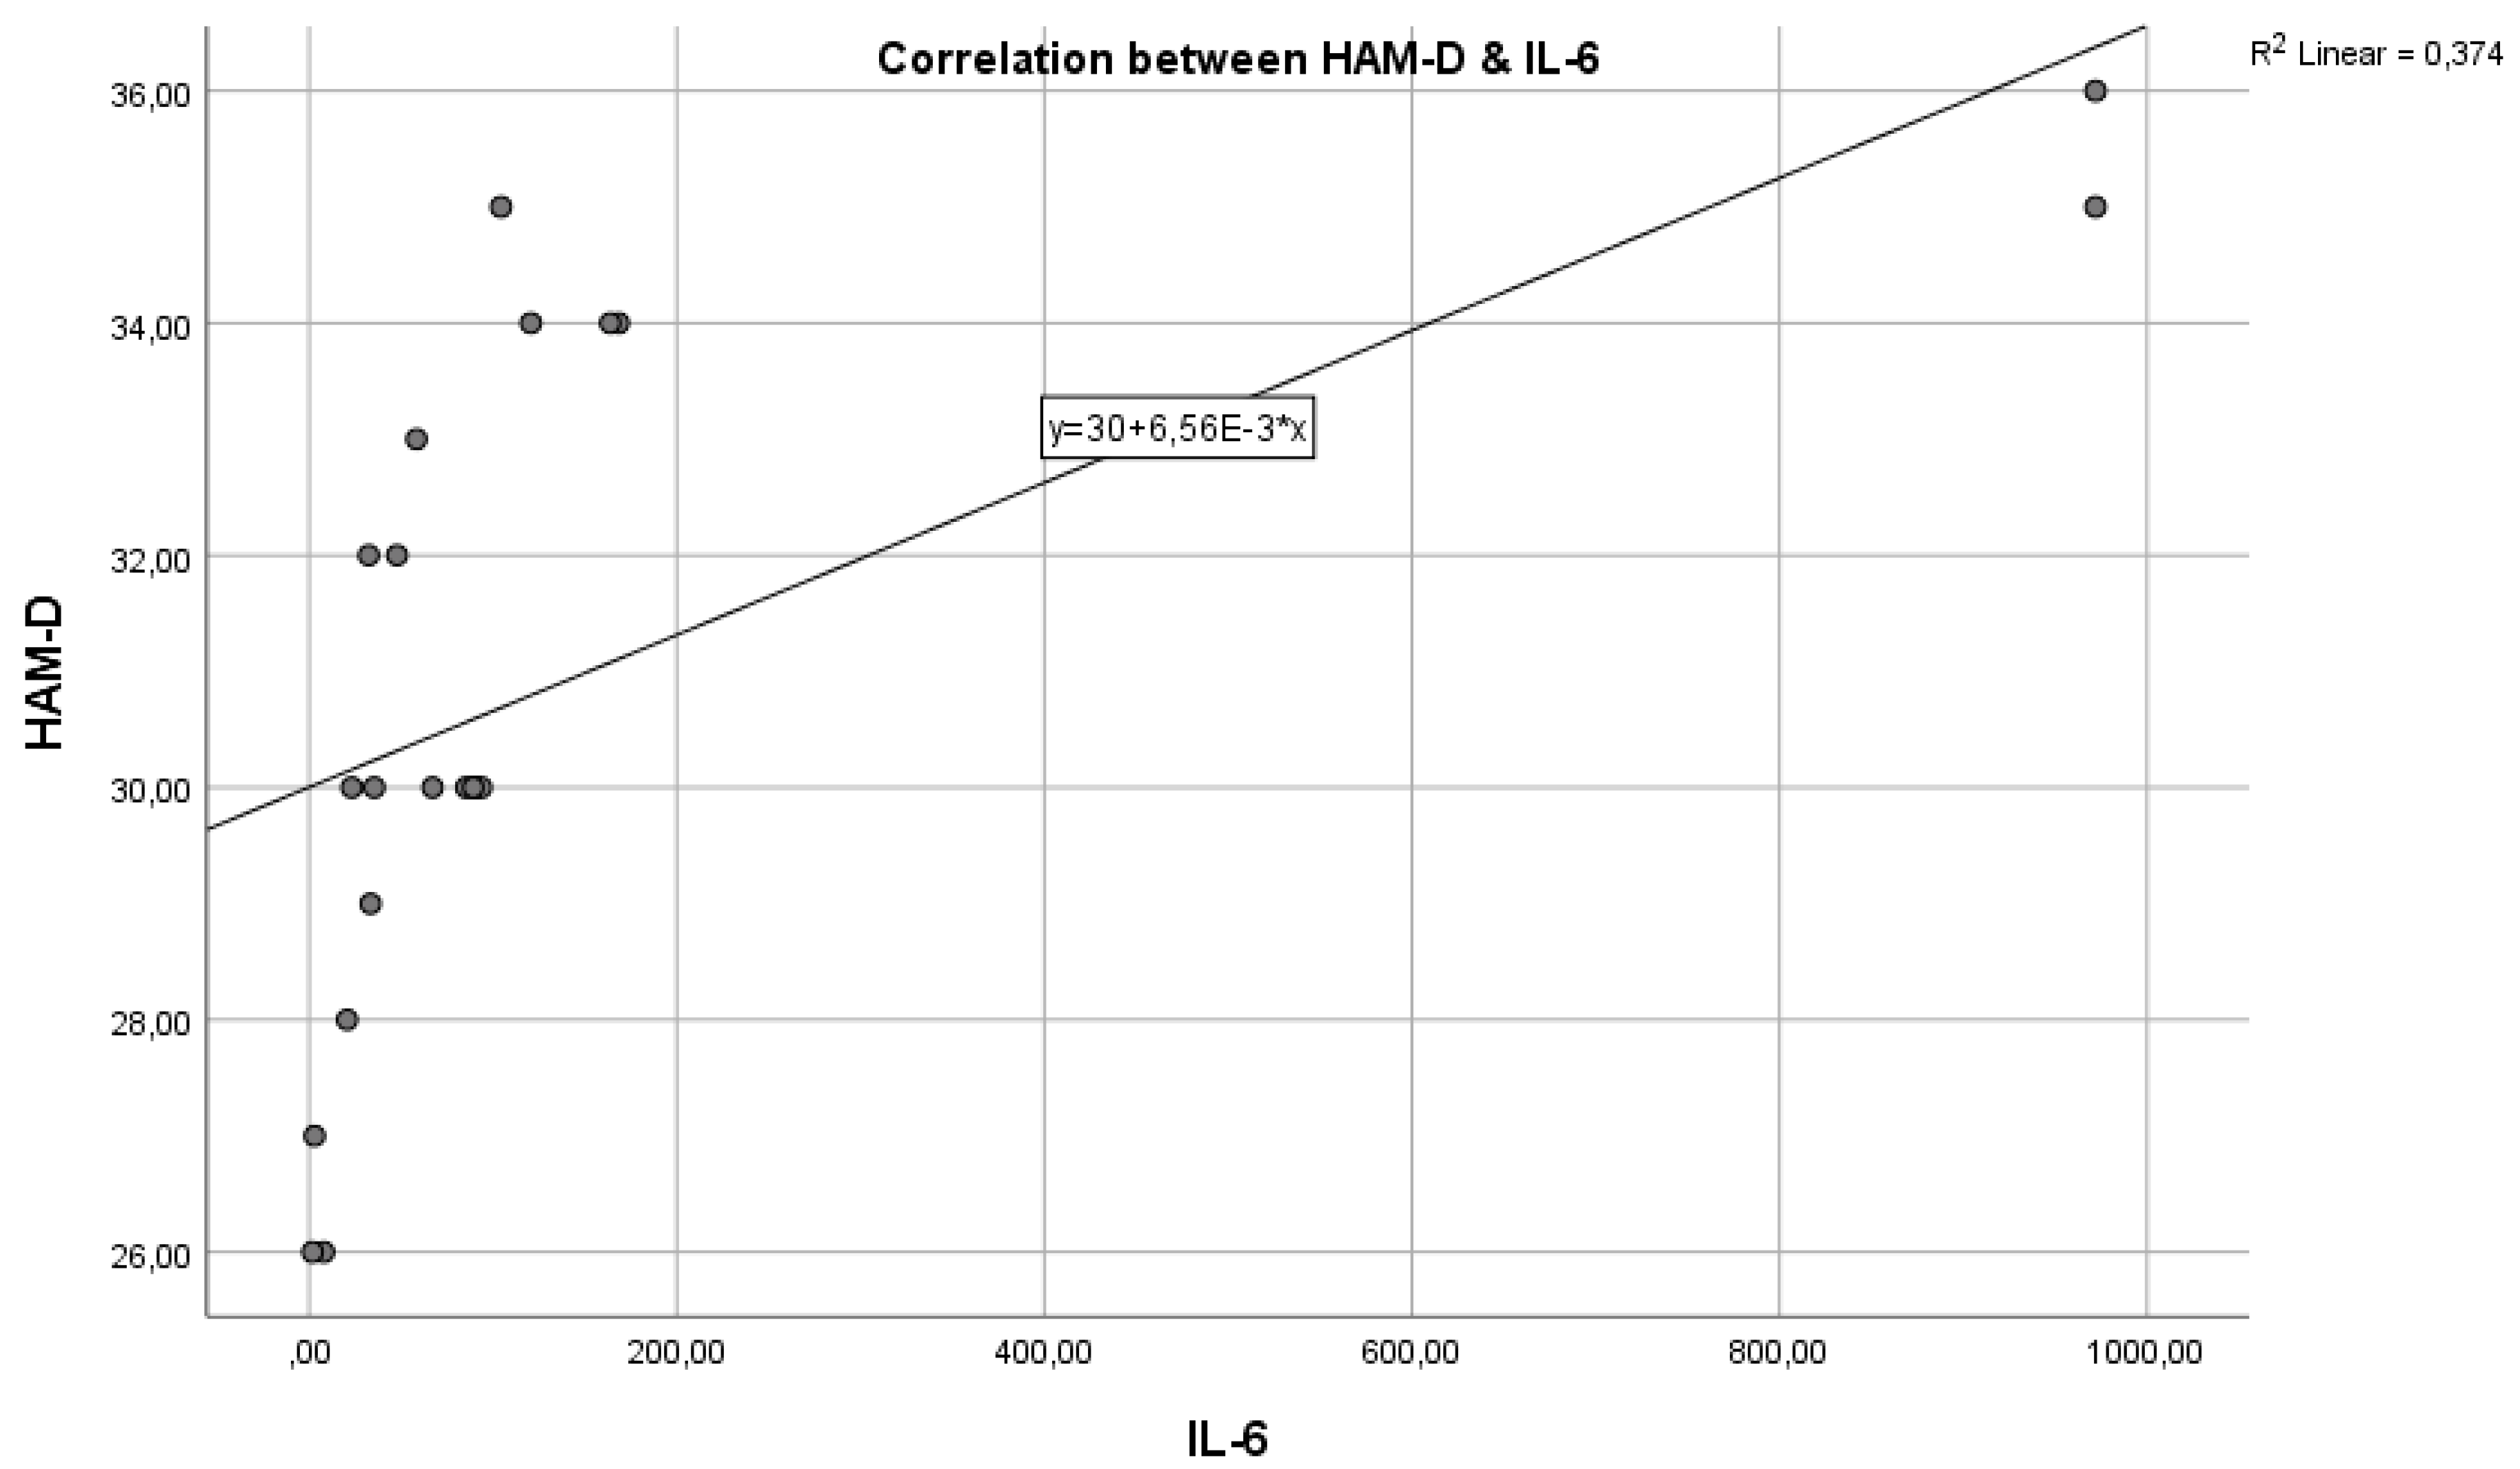
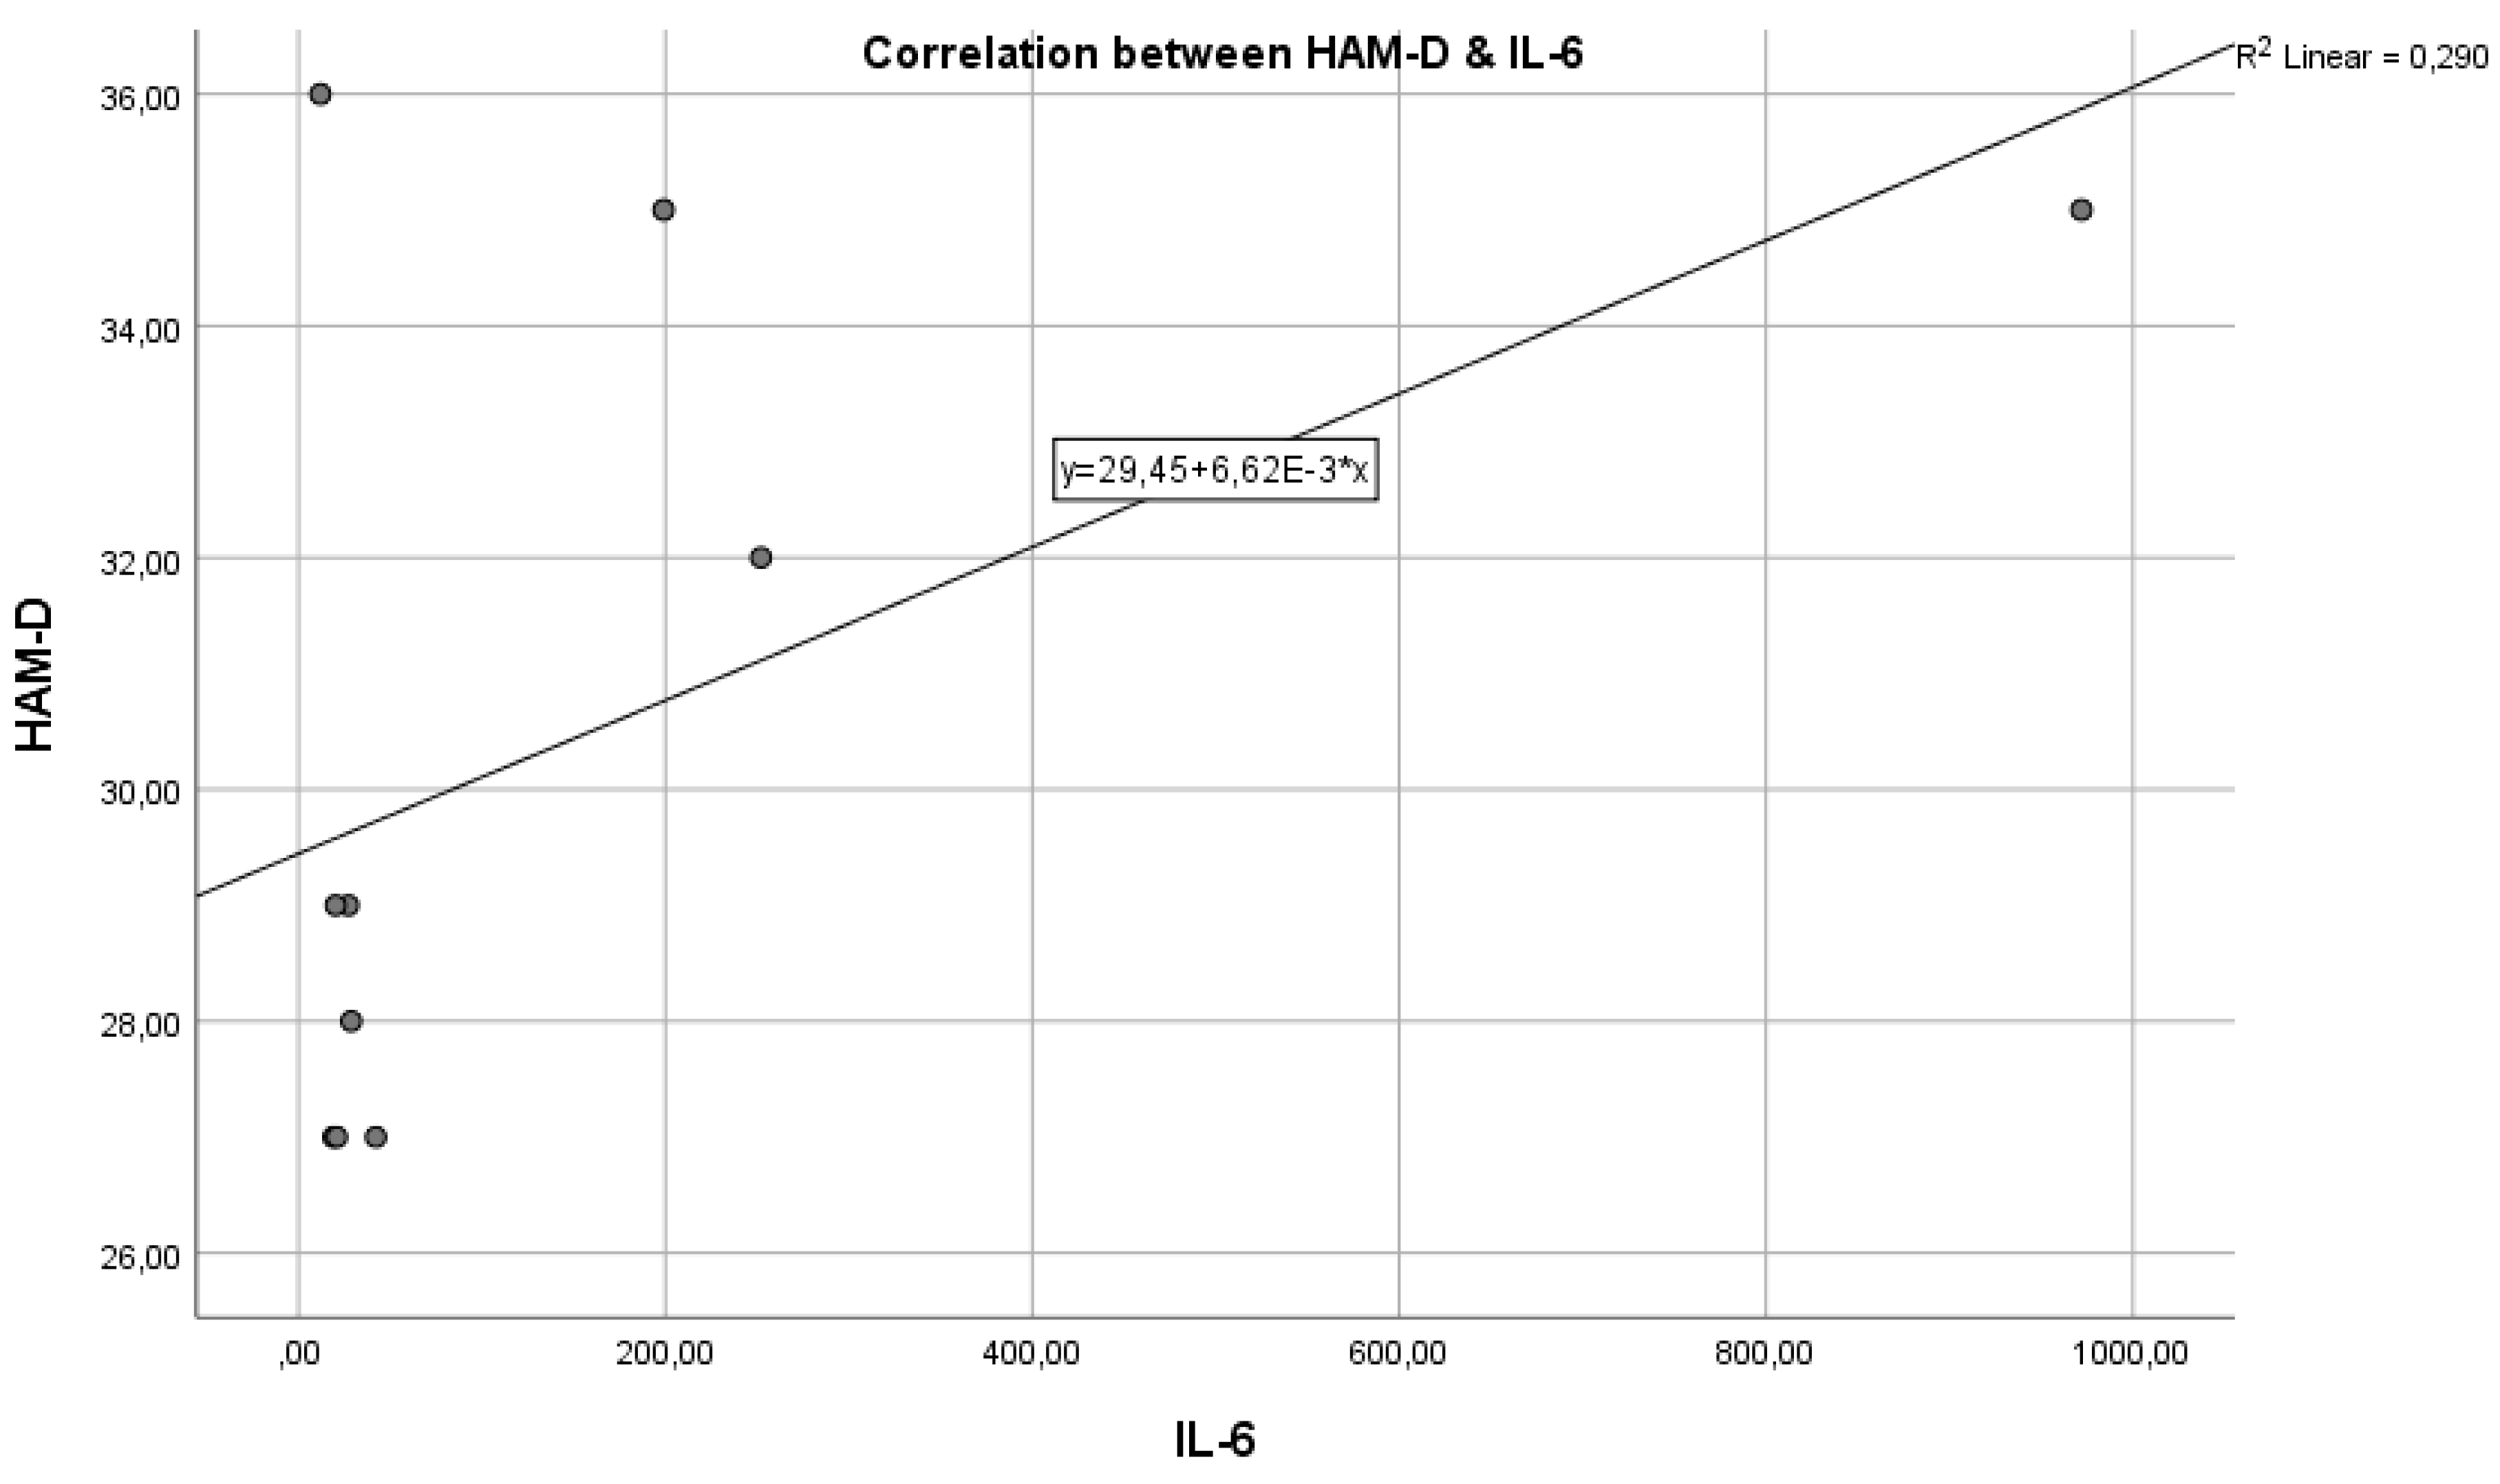
Analysing the next graph (Figure 2), which represents the correlation between the inflammatory marker IL-6 and the HAM-D test score, we have a Pearson correlation coefficient r = 0.580, which represents a reasonable positive correlation and statistical significance where p = 0.0390 < 0.05, indicating that the two variables are correlated. The results indicate a statistically significant relationship between the inflammatory marker IL-6 and the severity of depression, as measured by HAM-D scores. This suggests that inflammation, as indicated by IL-6 levels, could play a role in the pathogenesis or severity of depression.
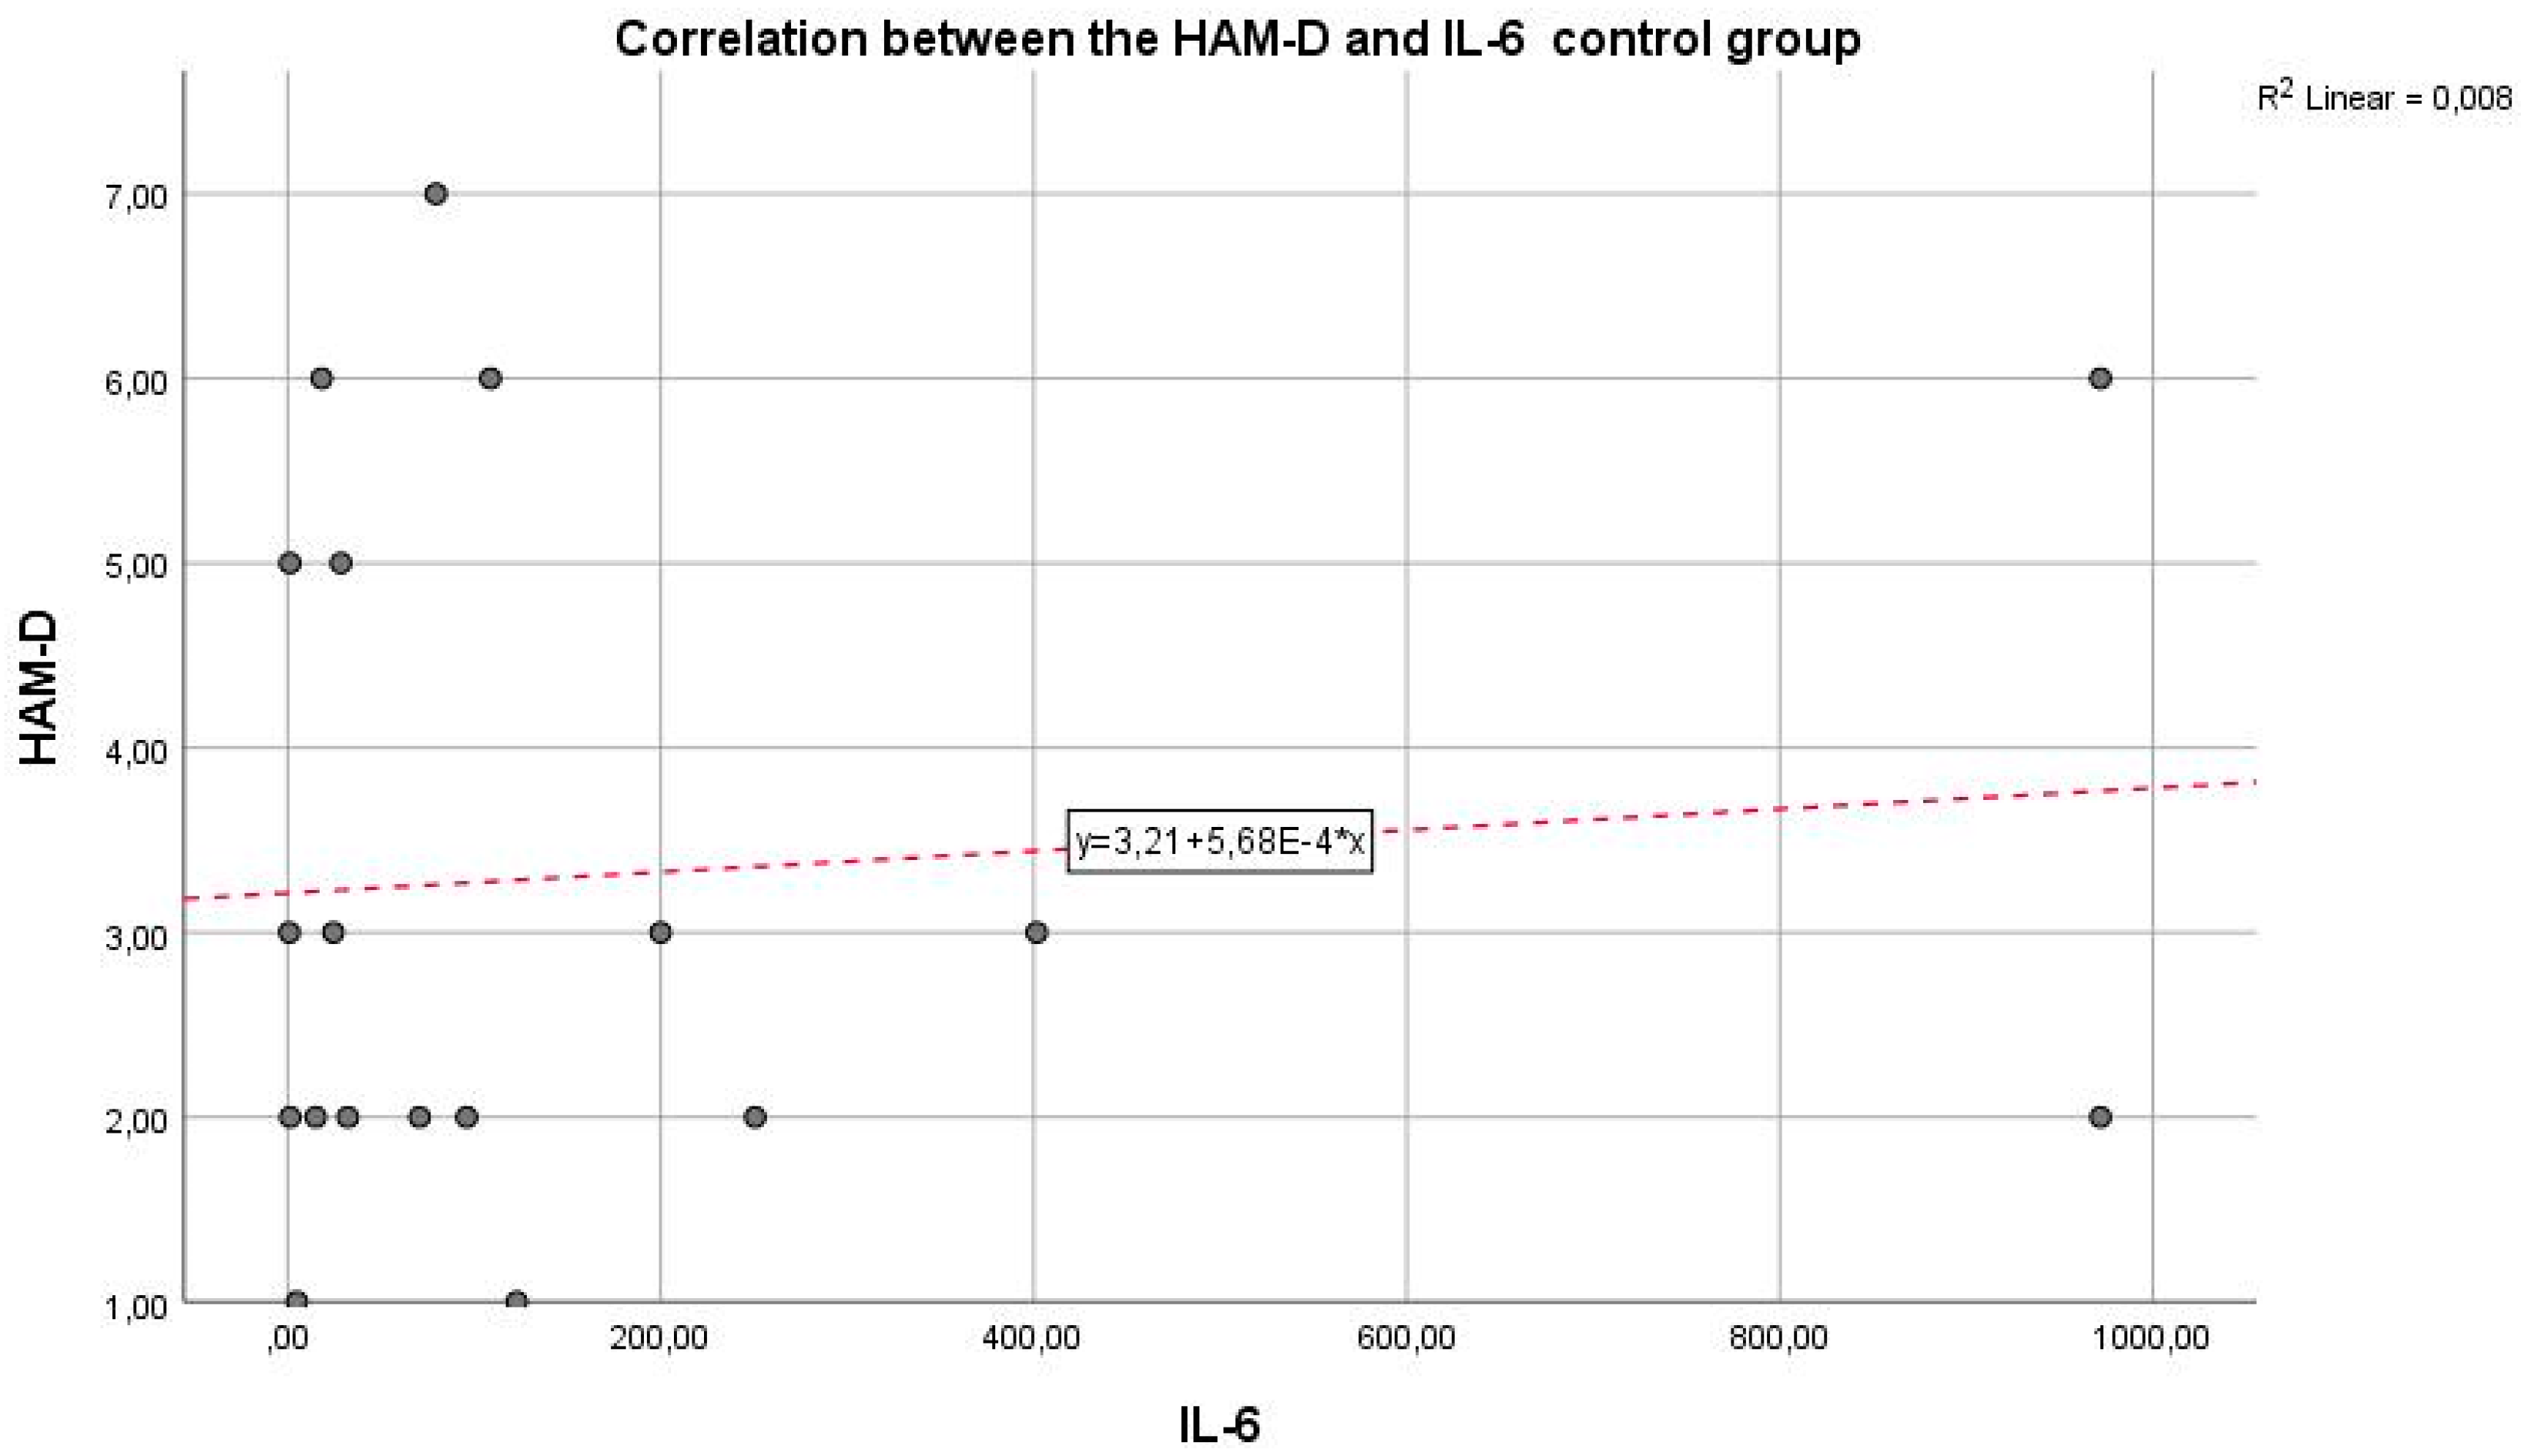
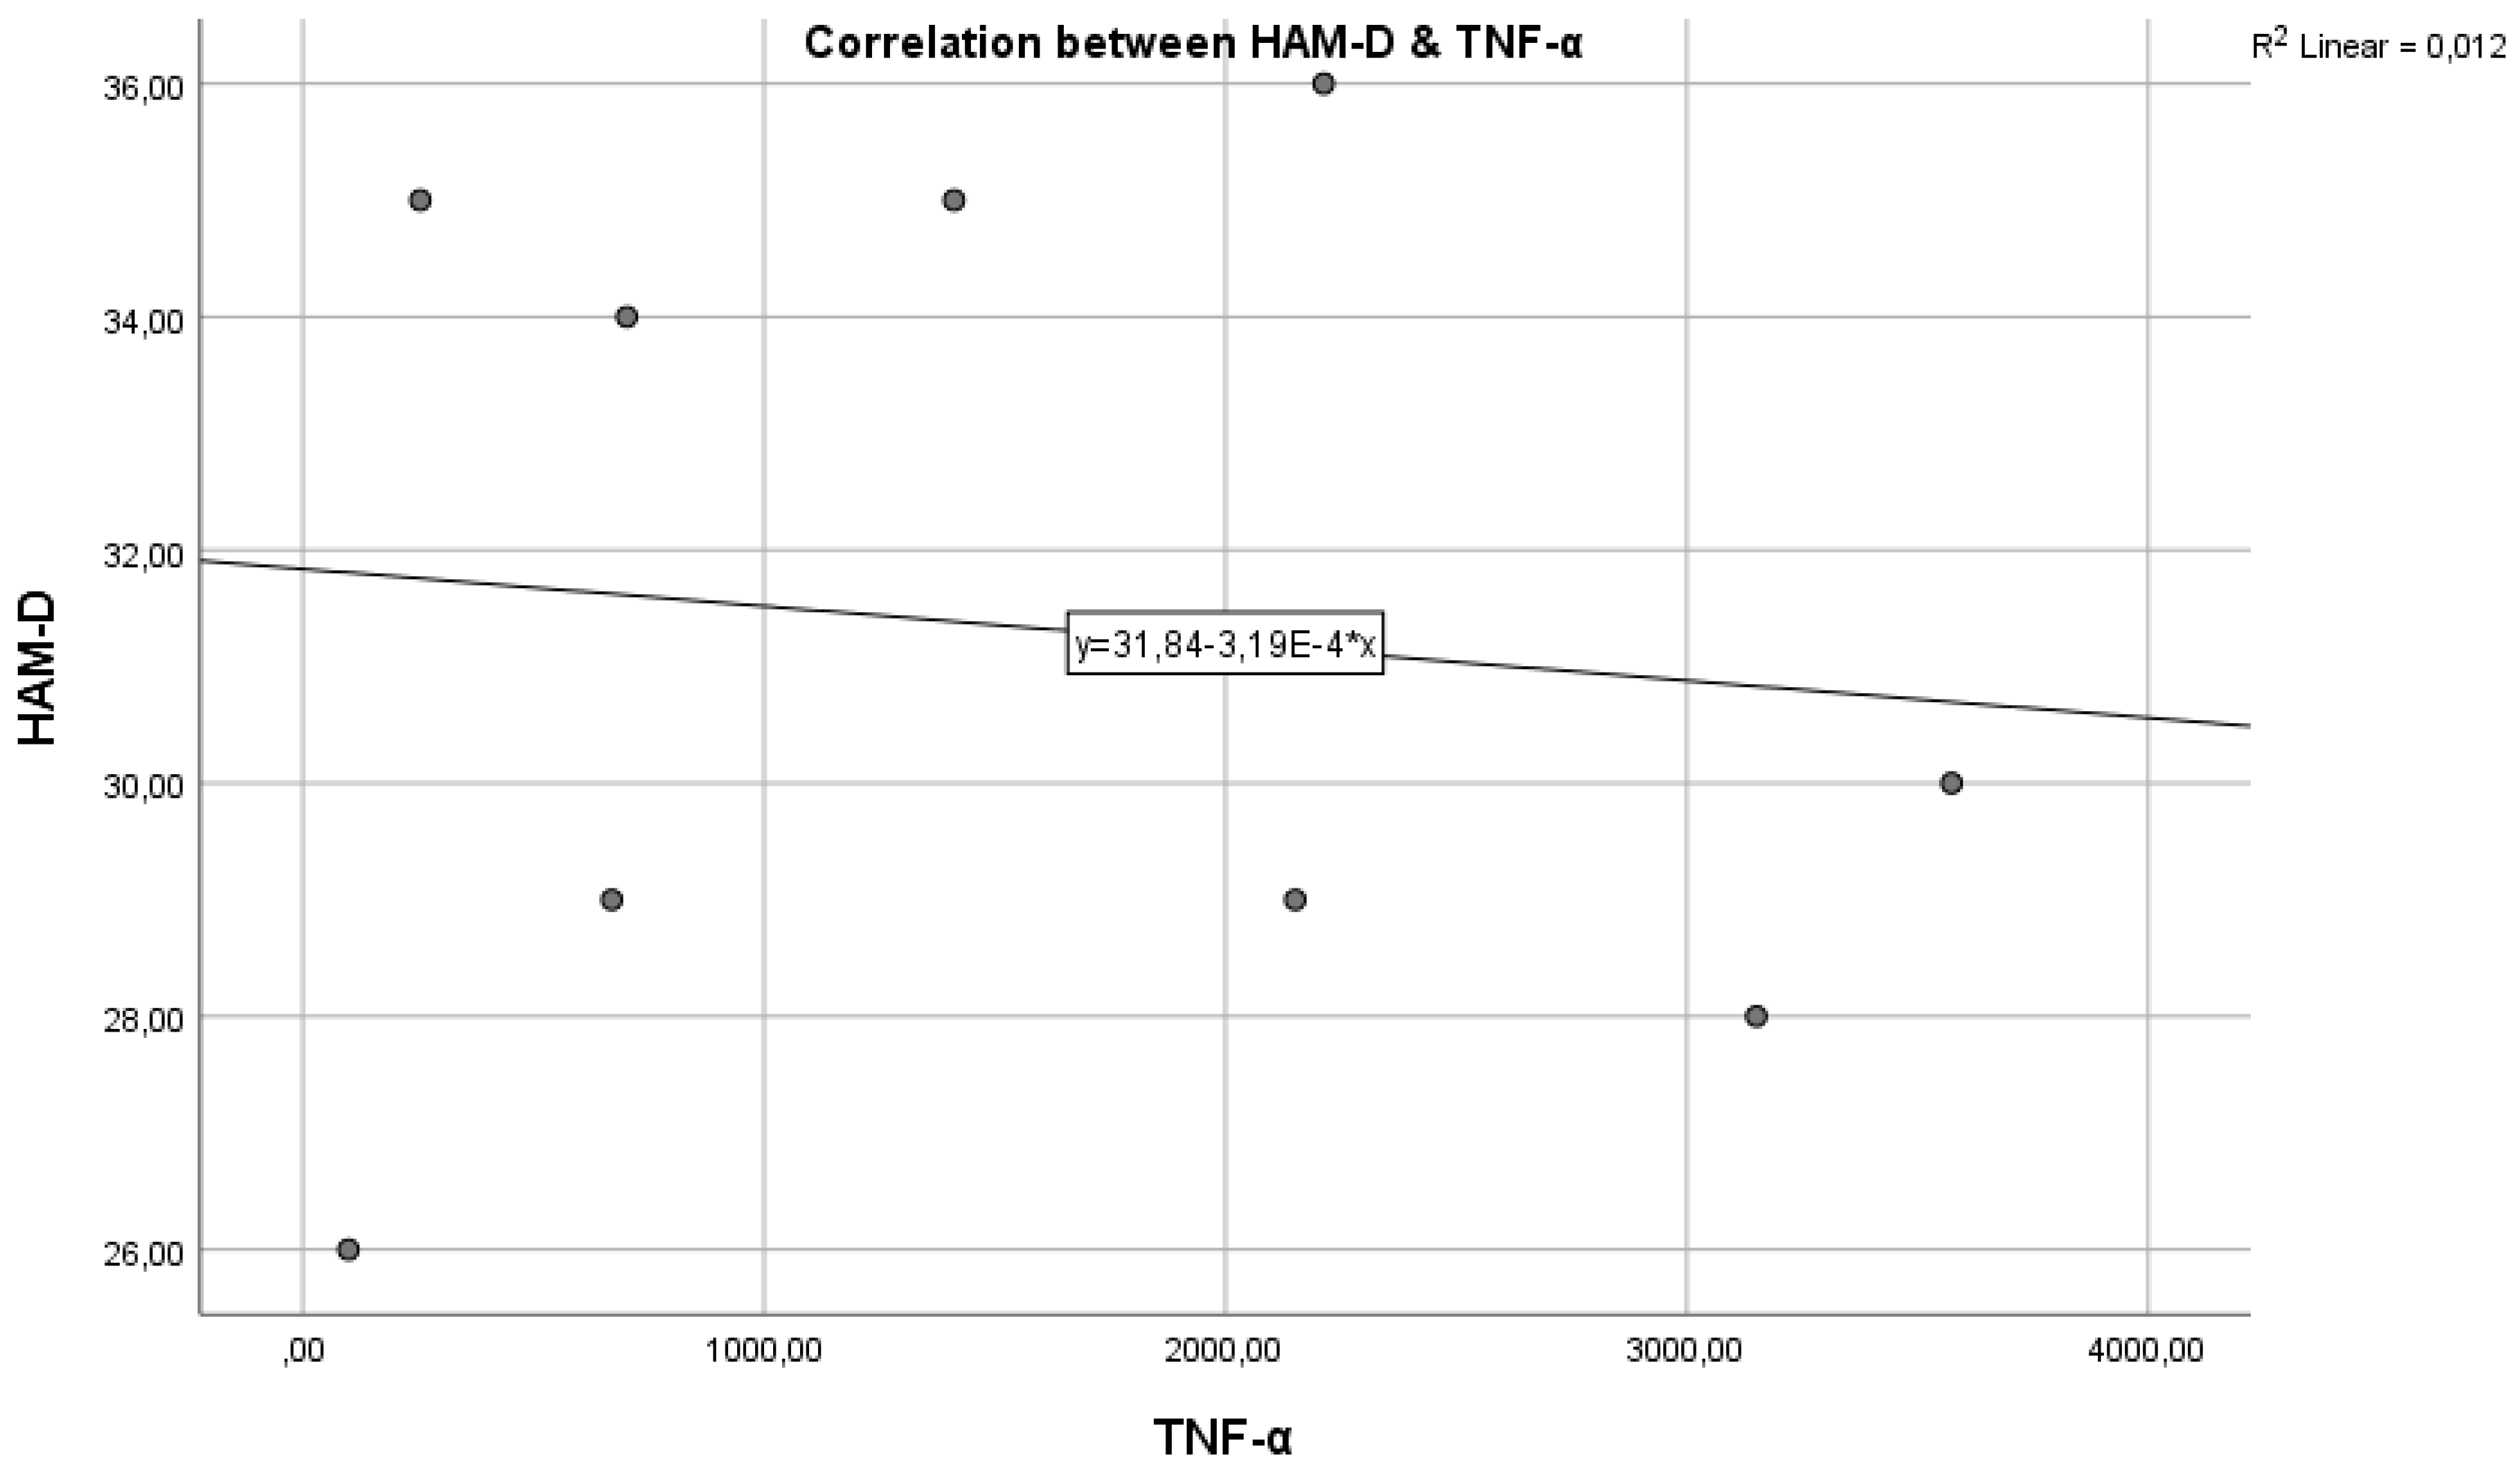
Next, Figure 3 shows the correlation between the inflammatory marker IL-6 and the HAM-D test in the control group. We can observe that the Pearson correlation coefficient is r = 0.008 and p = 0.0021. An r value of 0.008 indicates a very weak correlation between IL-6 and HAM-D scores. Practically, this coefficient close to zero suggests that there is no significant linear relationship between IL-6 levels and the severity of depression as measured by the HAM-D test in the control group. The p-value of 0.0021 is well below the standard threshold for statistical significance. The mentioned p-value shows that, although the correlation coefficient suggests a lack of linear correlation between the two variables, the statistical test results are significant, suggesting that any observed association between IL-6 and HAM-D scores is unlikely to be due to chance.
It is important to understand that a small p-value in the context of a correlation coefficient very close to zero can be somewhat confusing. The statistical significance indicated by the p-value refers to testing the hypothesis that there is no relationship between the two variables. In this case, the small p-value might indicate the detection of a statistical difference, but the near-zero correlation coefficient suggests that the relationship between the variables is practically negligible.
We can state that the inflammatory marker IL-6 can be considered an indicator in assessing depression, supported by the fact that the two are in a reasonable positive correlation, with p = 0.0021, reaching the statistical significance threshold. In this situation, the inflammatory hypothesis in depression is confirmed, with a very statistically significant correlation, so that IL-6 values increase as the intensity of depression increases.
Figure 3.
Correlation between the HAM-D and IL-6 - control lot.
In Figure 3, we have a Pearson correlation coefficient of r = 0.06310, which indicates that there is no correlation between the two variables, and a p-value > 0.005, which does not attest to statistical significance.
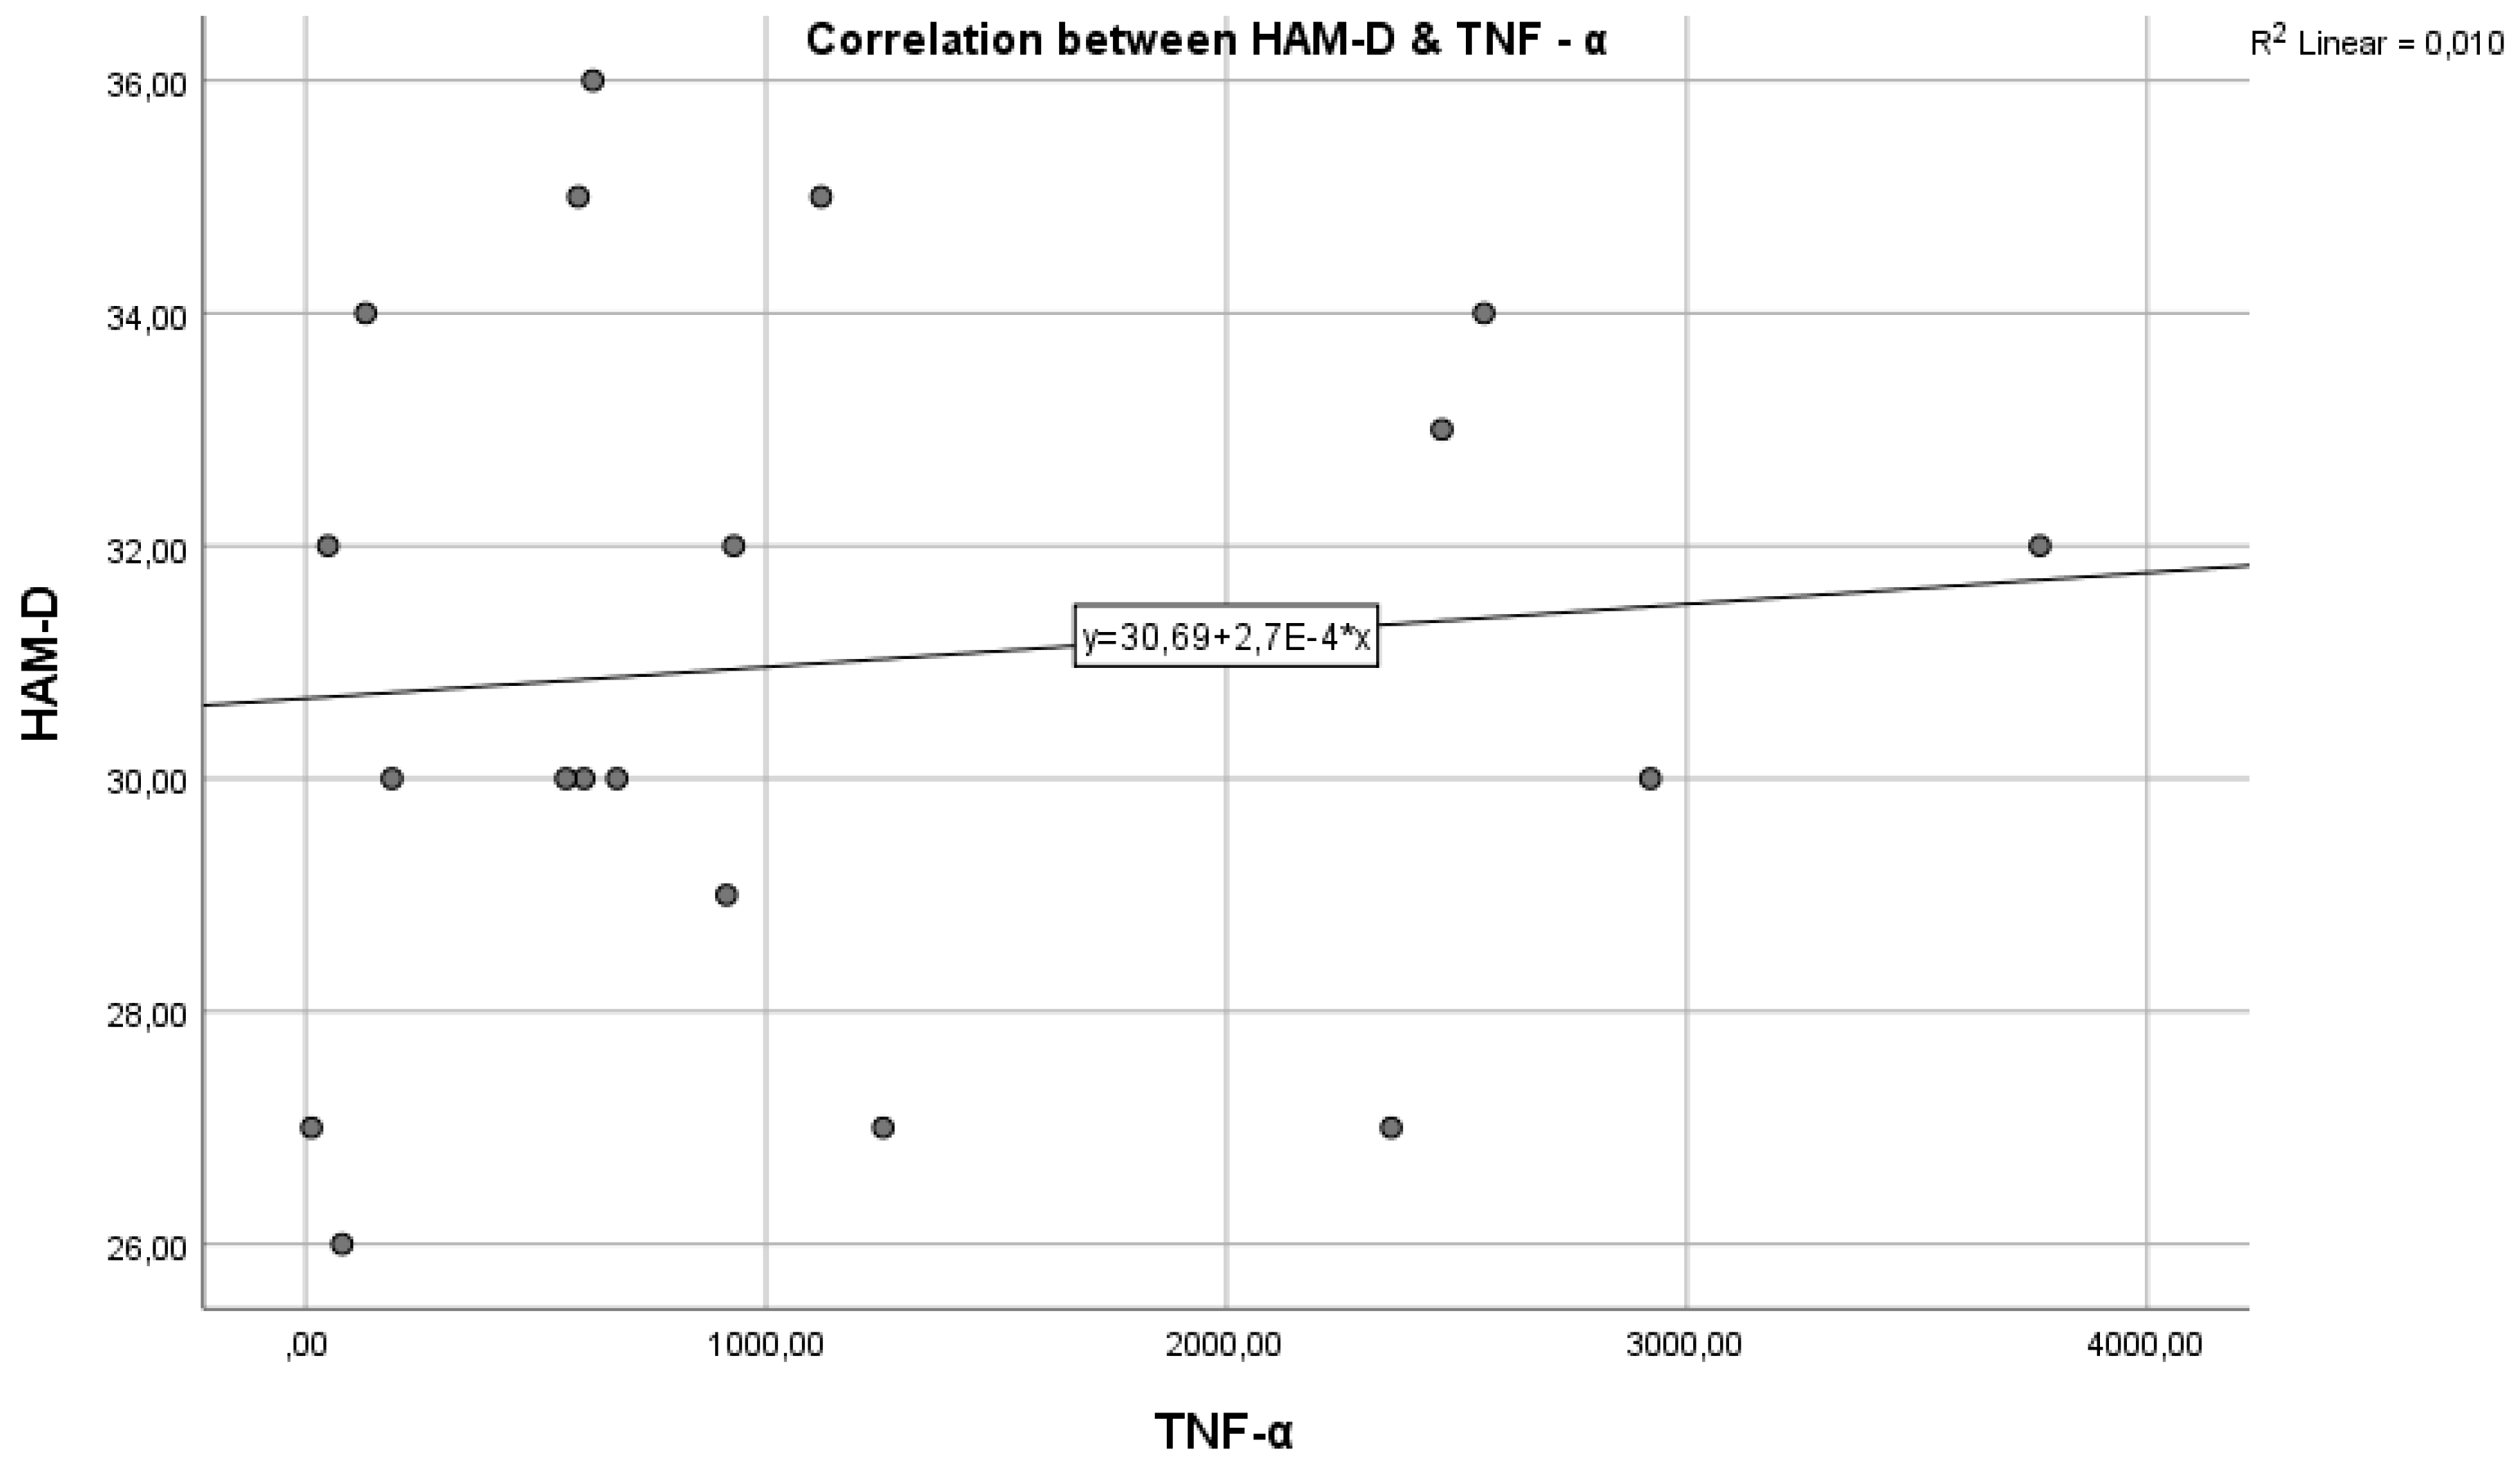
Figure 4 represents the correlation between the inflammatory marker TNF-α and the HAM-D test score.
Regarding study hypothesis 1, we can state that inflammation is associated to some extent with the highest HAM-D test scores. This hypothesis is confirmed only in the case of IL-6, while for IL-1β and TNF-α, the correlations were not statistically significant.
We further examined the extent to which study hypothesis 4 is confirmed, a hypothesis proposing that marital status influences the depression-inflammation correlation.
Figure 5.
Pearson correlations for IL-1 and HAM-D variables in married patients.

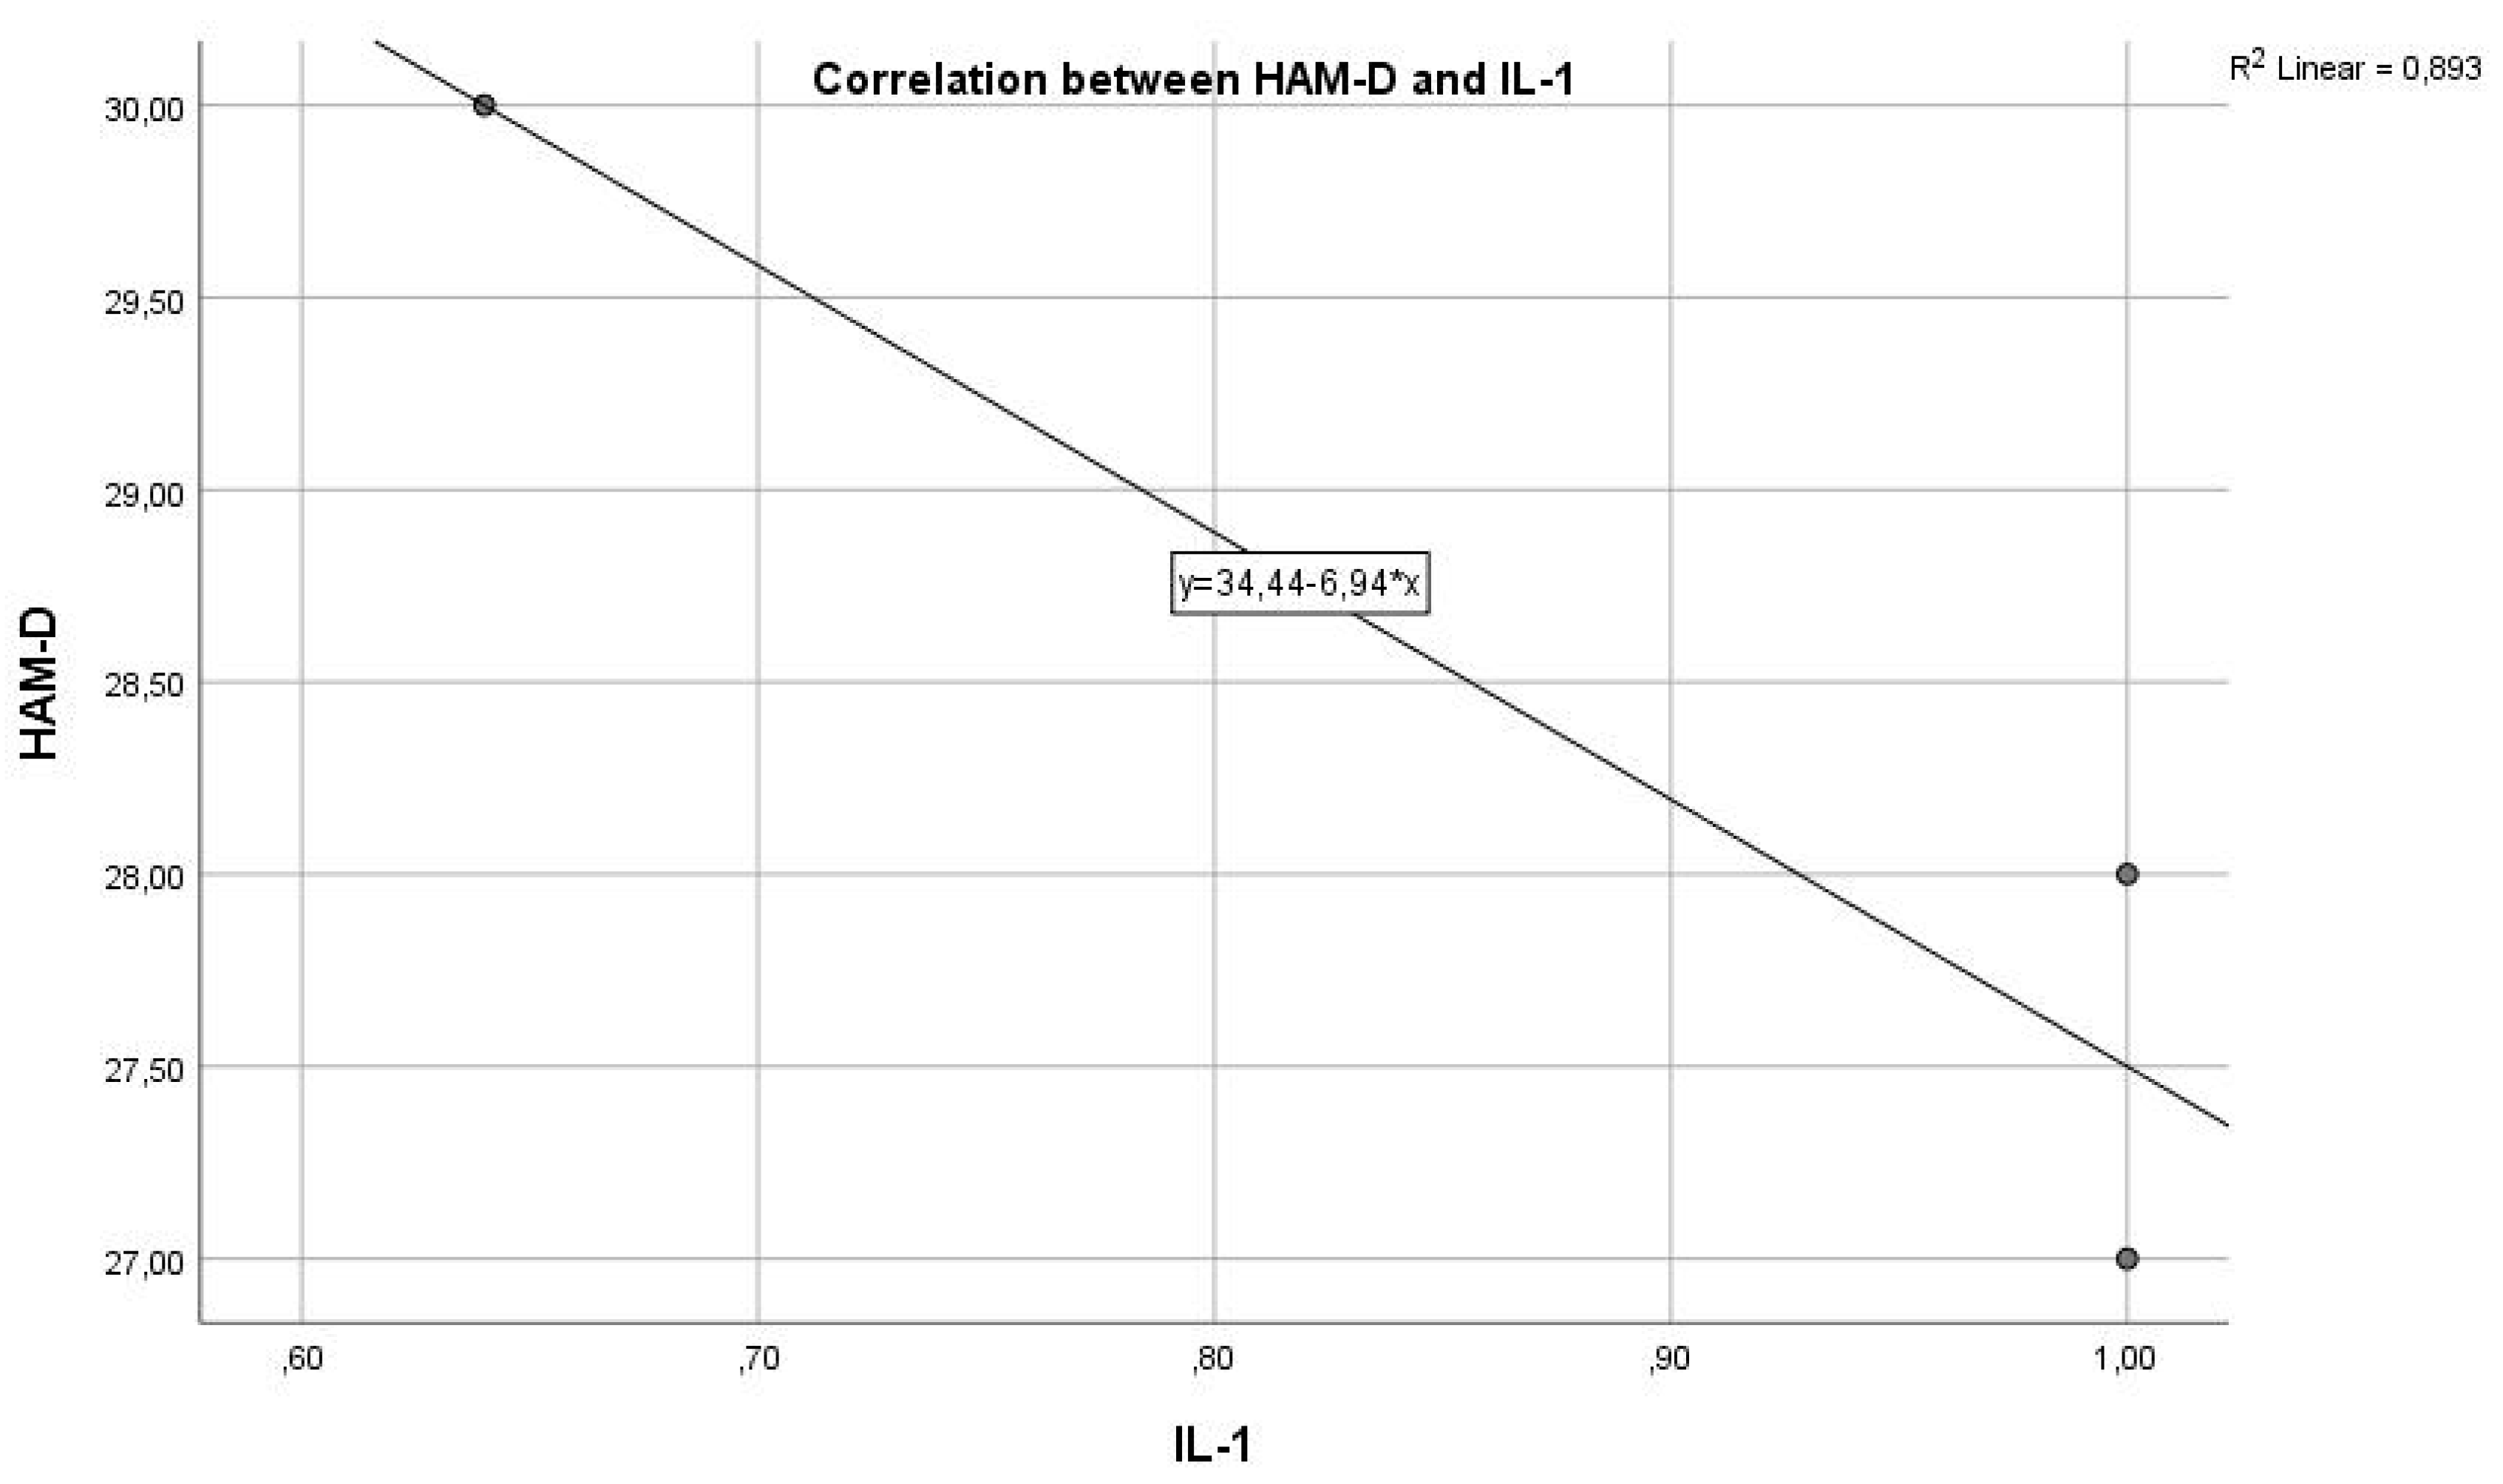
In married patients, where we correlated the HAM-D score with the IL-1 value, we have a Pearson correlation coefficient of r = -0.535, indicating a moderate negative correlation and statistical significance with p = 0.018262 < 0.05, attesting that the two variables are interconnected. The results indicate a statistically significant relationship between IL-1 inflammatory marker levels and the severity of depression as measured by HAM-D scores in married patients. The moderate negative correlation between IL-1 and HAM-D suggests that higher levels of IL-1 might be associated with lower severity of depressive symptoms in this subgroup of patients, or that more severe depression is associated with lower levels of IL-1.
Similarly, we have a strong negative correlation in divorced and cohabiting patients.
Figure 6.
Pearson correlations for IL-1 and HAM-D variables in divorced patients.
We identified a Pearson correlation coefficient of r = -0.944 for divorced patients (Figure 6) and r = -0.809 for those cohabiting with partners, indicating a strong association but without statistical significance, with p = 0.214061 > 0.05 for divorced patients and p = 0.400018 for cohabiting patients where IL-1 was measured in conjunction with the HAM-D score. Analyzing the results presented for the correlations between IL-1 inflammatory marker levels and HAM-D scores by marital status, we have two different sets of Pearson coefficients and p values for two subgroups: divorced patients and those cohabiting with partners.
For divorced patients: the Pearson coefficient r = -0.944 indicates a very strong negative correlation between IL-1 and the HAM-D score. This suggests that in the group of divorced patients, higher IL-1 levels are associated with lower HAM-D scores and vice versa, signifying a strong inverse relationship between inflammation and depression severity. The p-value of 0.214061 is greater than the standard threshold for statistical significance (0.05), indicating that although the correlation is strong, it is not statistically significant. This means we cannot exclude the possibility that the observed relationship is due to chance.
For cohabiting patients: the Pearson coefficient r = -0.809 also shows a strong negative correlation between IL-1 and the HAM-D score, suggestive of an inverse association between inflammation and depression severity in this group as well. The p-value of 0.400018, like the divorced group, indicates a lack of statistical significance for the observed correlation. The p value > 0.05 suggests that the observed strong relationship cannot be considered statistically significant, raising the possibility that it is the result of random variability.
The results indicate strong negative correlations between IL-1 and HAM-D scores for both divorced and cohabiting patients, suggesting an inverse association between inflammation levels and depression severity in these groups. However, the lack of statistical significance in both cases indicates that these strong correlations may not be robust or reflect a causal relationship.
Figure 7.
Pearson correlations for IL-1 and HAM-D variables in cohabiting patients.
Regarding the association of IL-1 with HAM-D scores and marital status, we obtained negative correlations in all three categories. In this case, we can state that the inflammation-depression relationship, although present, is inversely proportional and confirms the hypothesis that marital status influences the inflammation-depression correlation, with inflammation viewed from the perspective of IL-1 values.
While the correlation is negative and reached statistical significance in married patients, it was not statistically significant in divorced and cohabiting patients.
We further analysed the correlation between IL-6 and HAM-D scores in the three categories of patients: married, divorced, and cohabiting. In the case of married patients (Figure 8), we identified a Pearson correlation coefficient of r = -0.534, indicating a moderate negative correlation and statistical significance, with p = 0.018443 < 0.05, showing that the two variables are correlated.
Although in the case of the patients from Figure 8, we identified a good but negative correlation between IL-6 and HAM-D scores, in the case of divorced and cohabiting patients, the correlations are strong and positive, with a good degree of association, with a Pearson correlation coefficient of r = 0.972 for divorced patients and r = 0.642 for cohabiting patients.
The correlation is stronger in divorced patients than in cohabiting patients, being an almost perfectly positive correlation.
Figure 9.
Pearson correlations for IL-6 and HAM-D variables in divorced patients.
In both situations (Figure 8 and Figure 9), the threshold of statistical significance was not reached, in divorced patients, the p-value was 0.149645, and in cohabiting patients p = 0.55621.
Figure 10.
Pearson correlations for IL-1 and HAM-D variables in cohabiting patients.
To identify and study the relationship between TNF-α and HAM-D scores in the three groups, the Pearson correlation coefficient was calculated, which in this case shows extreme values with different correlations. For married patients, the Pearson coefficient is r = 0.009, suggesting that there is no correlation between the two variables, with a p-value of 0.400018 > 0.05, which is not statistically significant.
The results suggest that, in married patients, there is no significant or practically relevant relationship between TNF-α levels and the severity of depression as evaluated by HAM-D scores. The absence of a significant correlation between these two variables indicates that, at least in this subgroup of patients, TNF-α does not appear to be a predictive marker or directly associated with the severity of depression.
Figure 11.
Pearson correlations for TNF-α and HAM-D variables in married patients.
For divorced patients (Figure 12), the Pearson correlation coefficient is r = 0.901, indicating a strong, almost perfect positive correlation and a good degree of association between TNF-α levels and HAM-D scores, with a p-value of 0.004158 < 0.005, confirming that the two variables are correlated.
On the other side, in Figure 12, is the group of divorced patients, where we identified a Pearson correlation coefficient value of r = -0.109, indicating a weak negative correlation, and a p-value of 0.93047, which is greater than the statistical significance threshold of 0.05.
Figure 13.
Pearson correlations for TNF-α and HAM-D variables in cohabiting patients.
In the study hypothesis where we assumed that patients from urban areas would specifically have elevated TNF-α levels, we calculated the mean with the corresponding standard deviation and analysed the minimum and maximum components. Here, the mean in the urban area is lower than in the rural area. The hypothesis is refuted, but still, the maximum value is higher for the urban environment than for the rural one (Table 3).
Similarly, we tested and confirmed the hypothesis that the intensity of depression in women is higher than in men. We calculated the mean HAM-D score for women and men, along with the standard deviation and minimum and maximum components. As shown in the table below (Table 4), the hypothesis is confirmed, with women having an average HAM-D score of 30.83 with a standard deviation of 3.1, compared to an average score of 30.05 for men with a standard deviation of 2.99.
Next, we evaluated the relationship between the intensity of depression measured by the HAM-D scale and the value of inflammatory markers IL-1, IL-1β, and TNF-α, based on the gender of the patients, to see the extent to which study hypotheses 1 and 2, established earlier, are confirmed.
The Pearson correlations applied to the group of women (Figure 14) with major recurrent depressive disorder, in terms of the variables IL-1 and HAM-D, indicate a moderate, satisfactory correlation, with r = 0.372536716, which reaches the threshold of statistical significance p = 0.03902557 < 0.05.
We evaluated the relationship between the intensity of depression in women (Figure 14) and the intensity of inflammation in terms of IL-6 values, applying Pearson correlations, and we obtained a strong positive correlation (r = 0.580456) and a very statistically significant threshold (p = 0.000619 < 0.05). The results indicate a clear and statistically significant relationship between the intensity of inflammation and the severity of depression among the women studied. This finding is consistent with the theory that inflammatory processes may contribute to the development or exacerbation of depressive symptoms.
The strong positive correlation and high statistical significance suggest that measuring IL-6 levels could provide valuable insights into the biological mechanisms underlying depression and could help in identifying women at higher risk of severe depression due to inflammation.
Figure 15.
Pearson correlations in the case of women from the perspective of IL-6 and HAM-D variables.
Figure 15.
Pearson correlations in the case of women from the perspective of IL-6 and HAM-D variables.
In the case of the association between the intensity of depression and the degree of inflammation associated with TNF-α (Figure 16), the correlation is insignificant, minor (r = 0.063099591), without reaching the established threshold of statistical significance p < 0.01 (p = 0.735949118). Regarding the inflammation-depression correlation, at least in the group of women, for the TNF-α component, hypothesis 1 is not confirmed.
From the association between IL-1 and the HAM-D score, a moderate correlation is observed in Figure 17 (r = 0.392211), but it is statistically significant with p = 0.047507. In other words, as the HAM-D score increases in men with recurrent major depressive disorder, higher values of IL-1 are encountered, which supports our hypothesis.
Similar to the case of IL-1, we applied Pearson correlations in evaluating the degree of correlation between IL-6 and the intensity of associated depression (HAM-D score). This time, the threshold for statistical significance is very high (p = 0.00897), and the correlation is also strong and satisfactory (r = 0.546145), indicating a strong link between depression and inflammation, with inflammation being expressed through high IL-6 values.
Figure 18.
Pearson correlations in the case of men from the perspective of IL-6 and HAM-D variables.
Figure 18.
Pearson correlations in the case of men from the perspective of IL-6 and HAM-D variables.
Finally, the relationship between inflammation and depression was evaluated in the male group, considering the HAM-D score and TNF-α value as variables. The result was not significant, with a small correlation (r = 0.072294), lacking statistical significance (p = 0.725618 > 0.05).
As observed in the figure below (Figure 19), regarding TNF-α, study hypothesis 1 is not confirmed for either men or women, as there is no correlation between the intensity of depression and inflammation. The strongest correlations were found between HAM-D and IL-6 in both men and women, and for IL-1, there are satisfactory correlations with the intensity of depression in both men and women.
Analyzing the above graphs (Figure 18 and Figure 19) from the perspective of the statistical analysis performed, we can conclude that study hypothesis 1 is partially confirmed and that depression is specifically associated with an inflammatory status, as evidenced by the statistically significant correlations between high HAM-D scores and high IL-1 and IL-6 values.
Regarding study hypothesis 2, where we assumed that there are stronger correlations between inflammation and depression in women than in men, as observed in the table below (Table 5), this aspect is confirmed only in the case of IL-6, where the value of r in women (r = 0.580456) is higher than in men (r = 0.546145) (Table 5).
Although there are numerous scales for measuring depression and the associated risk of suicide, none of them provide a score that is sufficiently reliable or clinically useful for accurately estimating a patient's real risk of self-harm.
Healthcare professionals should consider the social constructs and norms that influence how suicide is addressed and indirectly minimized using these terms to describe suicidal ideation.
In this study, we paid particular attention to the clinical interview, anamnesis, and psychological evaluation using the Columbia scale or the HAM-A anxiety scale to identify elements that could be indicative of suicide risk. However, in the patients selected to participate in this scientific research, we did not identify such elements.
As the study aims at evaluating the correlation between the inflammatory markers present in the study group with the severity of depressive symptoms assessed, a regresion analysis was performed to determine if there are statistically significant differences between the mean scores of both groups. Also, the analysis of variance ANOVA was used to analyse the impact of multiple independent variables (inflammatory markers) on dependant variable (HAM-D scores). The p-values obtained through ANOVA indicate which markers are statistically significant in predicting depression severity and explains the relationship between the inflammatory markers and depression in multiple groups.
The regression model analysis performed with control group data suggests that IL-1 and TNF significantly predict HAM-D scores, suggesting a corelation between these two inflammatory markers and depression severity, whereas IL-6 does not appear to be a significant predictor in this group.
Table 6.
Control group ANOVA.
| ANOVA a | ||||||
| Model | Sum of Squares | df | Mean Square | F | Sig. | |
| 1 | Regression | 23,538 | 3 | 7,846 | 2,901 | ,069 b |
| Residual | 40,567 | 15 | 2,704 | |||
| Total | 64,105 | 18 | ||||
| a. Dependent Variable: HAMD | ||||||
| b. Predictors: (Constant), TNF, IL6, IL1 | ||||||
The ANOVA analysis for the study group suggests that the regression model the predictors, respectively the inflammatory markers IL-1, IL-6 and TNF, significantly explain the variance in the HAM-D scores.
Table 7.
Study group ANOVA.
| ANOVA a | ||||||
| Model | Sum of Squares | df | Mean Square | F | Sig. | |
| 1 | Regression | 132,352 | 3 | 44,117 | 7,183 | ,001 b |
| Residual | 165,841 | 27 | 6,142 | |||
| Total | 298,194 | 30 | ||||
| a. Dependent Variable: HAMD | ||||||
| b. Predictors: (Constant), TNF, IL6, IL1 | ||||||
To better observe the relationship between the presence of inflammatory markers and demographic data with the severity of depression assessed, we analyse the correlation matrix of all variables for the study group (Table 7). While there are no statistically significant correlations observed in regard to age, gender and area of residence to HAM-D scores, we also do not find a significant correlation of TNF marker to the variables provided. However, we have strong positive correlation between HAM-D scores and IL-6 (0.581, p = 0.001), suggesting that higher IL6 levels are associated with higher HAM-D scores. Also, the analysis provides that negative correlation (-0.409, p = 0.022) between IL-1 and HAM-D scores, suggest that higher IL-1 levels are associated with lower depression scores.
Table 8.
Correlation matrix all variables.
| Correlations | |||||||
| Area | Status | Gender | Age | HAMD | TNF | ||
| Area | Pearson Correlation | 1 | ,555 ** | -,065 | -,708 ** | -,048 | ,027 |
| Sig. (2-tailed) | ,001 | ,728 | ,000 | ,796 | ,887 | ||
| N | 31 | 31 | 31 | 31 | 31 | 31 | |
| Status | Pearson Correlation | ,555 ** | 1 | ,226 | -,495 ** | ,211 | ,096 |
| Sig. (2-tailed) | ,001 | ,222 | ,005 | ,256 | ,608 | ||
| N | 31 | 31 | 31 | 31 | 31 | 31 | |
| Gender | Pearson Correlation | -,065 | ,226 | 1 | -,095 | ,075 | ,232 |
| Sig. (2-tailed) | ,728 | ,222 | ,611 | ,687 | ,208 | ||
| N | 31 | 31 | 31 | 31 | 31 | 31 | |
| Age | Pearson Correlation | -,708 ** | -,495 ** | -,095 | 1 | -,154 | -,262 |
| Sig. (2-tailed) | ,000 | ,005 | ,611 | ,408 | ,154 | ||
| N | 31 | 31 | 31 | 31 | 31 | 31 | |
| HAMD | Pearson Correlation | -,048 | ,211 | ,075 | -,154 | 1 | ,063 |
| Sig. (2-tailed) | ,796 | ,256 | ,687 | ,408 | ,736 | ||
| N | 31 | 31 | 31 | 31 | 31 | 31 | |
| TNF | Pearson Correlation | ,027 | ,096 | ,232 | -,262 | ,063 | 1 |
| Sig. (2-tailed) | ,887 | ,608 | ,208 | ,154 | ,736 | ||
| N | 31 | 31 | 31 | 31 | 31 | 31 | |
| IL6 | Pearson Correlation | -,011 | ,106 | -,013 | -,134 | ,581 ** | ,012 |
| Sig. (2-tailed) | ,954 | ,569 | ,947 | ,472 | ,001 | ,947 | |
| N | 31 | 31 | 31 | 31 | 31 | 31 | |
| IL1 | Pearson Correlation | -,153 | -,047 | ,195 | ,082 | -,409 * | -,094 |
| Sig. (2-tailed) | ,411 | ,803 | ,292 | ,661 | ,022 | ,616 | |
| N | 31 | 31 | 31 | 31 | 31 | 31 | |
For the purpose of our study, we look at the confounding variables to accurately evaluate the correlation of the depression severity and the levels of inflammation present: age could be a confounding variable, as older people tend to have higher levels of inflammatory markers compared to younger patients, which could be impacting the correlation. Also, gender differences are relevant, where women show stronger correlations between inflammatory levels and depression than men, whereas marital status is impactful, since divorced patients show a significant positive correlation between IL-6 and depressive scores, while married people did now emphasize such relationship. Also, the presence or absence of comorbidities or use of medication can influence the levels of inflammatory markers and thus confound the relationship to depression scores. The interpretation of regression coefficients (Table 8) suggests that IL-6 has a strong positive impact on HAM-D scores, the higher IL-6 levels, the higher the depression severity. Another significant coefficient is observed at IL-1, with moderate negative impact on HAM-D scores, the higher IL-1 levels, the lower depression severity. Age, status, living area and TNF do not suggest statistically significant relationship to HAM-D scores.
Table 9.
Regression coefficients all variables.
| Coefficients a | ||||||
| Model | Unstandardized Coefficients | Standardized Coefficients | t | Sig. | ||
| B | Std. Error | Beta | ||||
| 1 | (Constant) | 33,047 | 4,864 | 6,794 | ,000 | |
| Age | -,067 | ,064 | -,233 | -1,040 | ,309 | |
| Gender | ,478 | 1,050 | ,072 | ,455 | ,653 | |
| Status | 1,240 | ,962 | ,236 | 1,289 | ,210 | |
| Area | -2,545 | 1,518 | -,393 | -1,677 | ,107 | |
| TNF | ,000 | ,000 | -,069 | -,441 | ,663 | |
| IL6 | ,005 | ,002 | ,462 | 3,095 | ,005 | |
| IL1 | -,003 | ,001 | -,389 | -2,578 | ,017 | |
5. Discussions
The relationship between inflammation and depression is also affected by risk and protective factors, which require further research. Lifestyle factors, such as diet and physical activity level, can influence inflammation levels and, consequently, the risk of developing or exacerbating depression [6].
The genetic component can also play a significant role in an individual's susceptibility to this complex interaction. As we better understand the connection between inflammation and depression, there is an opportunity to develop personalized therapies. A treatment that works effectively for one patient may not have the same effect for another, depending on their inflammation levels. Identifying these individual differences can lead to more precise and effective approaches to the treatment of depression [7].
Physicians and therapists ought to consider evaluating inflammation levels and integrating this information into the development of personalized treatment plans for patients with depression. This could offer a more efficient and precise approach to managing and treating depression. In light of these complex aspects and the uncertainties surrounding the relationship between inflammation and depression, it is evident that this is a crucial area of research in psychiatry [8]. With a deeper understanding of these biological processes, we can develop more effective interventions for treating and managing depression, thus offering hope and help to those struggling with this debilitating mental disorder.
Increasingly numerous studies have examined this complex link between inflammation and depression, providing important evidence that supports this connection. Some of these studies have shown that patients with depression may have elevated levels of these inflammatory markers compared to healthy individuals. Moreover, positive correlations have been identified between the severity of depressive symptoms and high levels of these markers, suggesting that inflammation may contribute to the severity of depression [9].
Challenges for future studies include balancing potential side effects and considering somatic comorbidities, especially cardiovascular diseases, and treatment risk. Caution was highlighted in a recent study on the potential use of NSAIDs in depression, emphasizing that NSAID effects are inconsistent due to methodological heterogeneity and highlighting the need for methodological improvements in future studies. Additionally, other pathways for personalized treatment schemes, such as nitrosative and oxidative stress pathways and increasing glutathione levels, are important to consider. Clearly, the widespread use of anti-inflammatory agents against depression is not indicated. Rather, the challenge lies in identifying those patients who might effectively respond to anti-inflammatory intervention [10].
Studies have addressed the fundamental pathways through which cytokines can contribute to depression. In general, it has been shown that cytokines access the brain and interact with almost every pathophysiological domain relevant to depression, including neurotransmitter metabolism, neuroendocrine function, and neuronal plasticity. However, it remains unclear whether the activation of inflammatory pathways in the central nervous system during depression originates mainly peripherally and/or whether stress or other processes not yet identified induce inflammatory responses directly in the brain [11].
Such unresolved issues will have a major impact on the fact that relevant therapeutic targeting will require activity at the CNS level to be effective. The source of inflammation is clear when depression occurs in the context of medical conditions with an infectious, autoimmune, or inflammatory component or when there are injuries and/or tissue destruction, all of which are associated with the activation of the peripheral system and, in some cases, central inflammatory responses. In the case of depressive individuals with no apparent medical condition, the source of inflammation is less apparent, although developing inflammatory processes may be present [12].
Relevant data for the potential clinical applications of the association between inflammation and depression indicate that inflammatory biomarkers can identify depressive patients who are less likely to respond to conventional antidepressant treatment and can provide an indicator of treatment response. For example, patients with evidence of increased inflammatory activity before treatment have been reported to be less sensitive to antidepressants, lithium, or sleep deprivation (a strong short-term mood stimulant). Furthermore, it has been found that patients with a history of non-response to antidepressants demonstrate elevated plasma concentrations of IL-6 and acute-phase reactants compared to patients who respond to treatment. Additionally, emerging literature suggests that functional allelic variants of genes for IL-1β and TNF-α, as well as genes critical for T cell function, may increase the risk of depression and be associated with a reduced response to antidepressant therapy. Notably, antidepressant treatment has been associated with a reduction in inflammatory markers in 11 out of 20 studies that examined immune responses as a function of antidepressive therapy [13,14].
Depression, a severe psychiatric condition, represents a significant global challenge for public health. Addressing and understanding depression requires appropriate experimental models. Despite numerous studies, an animal model that faithfully reflects the complexity of the pathological mechanisms of human depression has not yet been developed. This is a major limitation of progress in depression research. However, the combination of behavioural modelling and rational analysis contributes to partially elucidating the mechanisms underlying depression. Human brain imaging and research on animal models indicate functional disturbances in the interconnections between certain brain areas as contributory factors to depression [5]. It has been observed that this condition also involves structural brain changes. Studies suggest that depression affects brain structure and function, altering gene expression and transcription factor activity in the involved areas. The nucleus accumbens plays a crucial role in managing neural networks associated with depression, integrating information from the prefrontal cortex, ventral hippocampus, and amygdala. Other relevant brain regions in the context of depression include the dorsal and medial prefrontal cortex, insular lobe, orbitofrontal cortex, amygdala, hippocampus, and cingulate cortex. A decrease in metabolism in these areas is thought to favor the manifestation of depressive symptoms and accelerate disease progression. Previous studies have shown that this metabolic decline, along with a reduction in cerebral blood flow, corresponds to a decrease in brain volume in these regions, correlated with the presence of depression [15]
Regarding the clinical applicability of these results, they could suggest that measuring inflammation levels might be useful in evaluating and treating depression, especially in patients who do not respond well to traditional therapies. Anti-inflammatory therapies or interventions to reduce inflammation could be considered in the treatment of depression, particularly in cases where inflammation seems to play a significant role.
Another important aspect of this equation is the gender difference. Studies have suggested that the relationship between inflammation and depression may vary by sex, with potential implications for the clinical approach to depression in men and women. For example, some research has indicated that women may exhibit a stronger correlation between inflammation and depression than men, suggesting that anti-inflammatory treatments might have a more beneficial effect among women with depression [16]. However, the relationship between inflammation and depression is far from fully understood. Ultimately, understanding the underlying mechanisms of the interaction between genetic, neurochemical, and inflammatory factors in the context of depression is essential for developing more effective and personalized therapeutic strategies for patients with depressive disorders, including those at increased risk of suicide. This knowledge can contribute to improving the quality of life and prognosis for these patients and can open new directions for research in psychiatry [17].
Many questions remain unanswered, including the exact mechanisms by which inflammation can influence brain function and, consequently, mental well-being. Additionally, questions arise about the causal direction of this relationship: does inflammation cause depression, or vice versa, or is there a vicious cycle where these two processes influence each other?
Thus, the relationship between inflammation and depression is a fascinating and complex research area that has shed light on new directions in understanding and clinically approaching depression. Although there are many unanswered questions and much future research needed, this connection offers hopes for developing new and personalized therapies for patients with depression, thereby opening doors to improving the mental well-being of millions of people.
The results of this study provide a compelling argument for the significant correlation between inflammation levels, specifically the inflammatory markers IL 1β and IL 6, and the severity of depressive symptoms as assessed by HAM D scores. These findings support the hypothesis that inflammation may play a crucial role in the development or exacerbation of depressive symptoms. This opens new avenues for research into anti-inflammatory therapies as potential treatments for patients with depression that is resistant to traditional treatment methods [18].
A key aspect highlighted by the study is the gender-based differences in the correlation between inflammation and depression. Women exhibited stronger correlations between inflammatory markers and depressive symptoms compared to men. This suggests that the underlying mechanisms of depression may differ between sexes, necessitating further research to fully understand these differences and develop personalized treatment approaches tailored to each gender [19].
Another significant finding of the study is the impact of marital status on the relationship between inflammation and depression, particularly concerning the inflammatory marker IL 6. Divorced patients showed a significant positive correlation between IL 6 levels and depressive symptoms, whereas married patients did not exhibit the same significant correlation. This may indicate that stress factors associated with divorce could intensify the link between inflammation and depression [20].
Although age was not a primary factor influencing this study, there was a tendency for older patients to exhibit lower inflammation levels, particularly for the TNF-α marker. This suggests that inflammation may have a stronger role in depression among younger patients or that other aging-related factors may influence inflammation levels [21].
The study also touches upon the role of genetic factors in predisposing individuals to behavioral traits that increase the risk for suicidal behavior. Proximal factors with an underlying immune component can induce a sustained immune response, which modulates various downstream effectors, including monoamine metabolism, tryptophan metabolism, and activation of the hypothalamic-pituitary axis [22].
Overall, the findings suggest a complex interplay between genetic, neurochemical, and inflammatory factors in the development and manifestation of depressive disorders. The correlation between increased activity of pro-inflammatory cytokines and the onset of depressive symptoms, as well as an increased risk of suicide, supports the inflammation-depression hypothesis. This indicates that treatments targeting inflammation reduction may be beneficial for patients with depression, especially those who do not respond to conventional antidepressant therapy [23].
6. Conclusions
The study highlights a significant correlation between inflammation levels, particularly the inflammatory markers IL 1β and IL 6, and the severity of depressive symptoms, supporting the hypothesis that inflammation plays a crucial role in the development or exacerbation of depression. This correlation opens new avenues for anti-inflammatory therapies as potential treatments for patients with depression resistant to traditional treatments.
Gender-based differences were noted, with women showing stronger correlations between inflammatory markers and depressive symptoms compared to men, suggesting possible differences in the underlying mechanisms of depression between sexes. Marital status also influenced the relationship between inflammation and depression, with divorced patients showing a significant positive correlation between IL 6 and depressive symptoms, possibly due to stress factors related to divorce.
Age showed a tendency for older patients to have lower inflammation levels, particularly for the TNF-α marker, indicating a potentially stronger role of inflammation in depression among younger patients. Genetic factors combined with neurochemical and inflammatory components contribute to the complex pathogenesis of depression, emphasizing the importance of targeting inflammation in treatment strategies.
The study underscores the potential of cytokines as diagnostic markers, measures of treatment efficacy, or predictors of disease progression, highlighting the need for further research to develop personalized treatment approaches and identify biomarkers for estimating the response to anti-inflammatory therapies.
Author Contributions
Conceptualization, R.G., C.S. and P.R.D.; methodology, R.G. and V.T.I.; software, M.M, A.C.P. and I.S.; validation, A.C.P. and P.R.D.; formal analysis, R.G., V.T.I. and R.G.; investigation, R.G., A.C.P., M.M. and I.S.; resources, C.S., P.R.D. and R.G.; data curation, A.C.B. and R.G.; writing—original draft preparation, A.C.P. and R.G.; writing—review and editing, A.C.B. and I.S.; visualization, R.G., A.C.P., A.C.B., M.M., I.S. and V.T.I.; supervision, P.R.D. and C.S.; project administration, R.G., A.C.P. and P.R.D. All authors have read and agreed to the published version of the manuscript.
Funding
This research received no external funding.
Institutional Review Board Statement
The study was conducted following the Declaration of Helsinki and approved by the Institutional Ethics Committee of “Grigore T. Popa” University of Medicine and Pharmacy.
Informed Consent Statement
Informed consent was obtained from all subjects involved in the study.
Data Availability Statement
The data presented in this study are available on request from the corresponding author.
References
- Sandler, J.; Joffe, W.G. Notes on childhood depression. Int J Psychoanal 1965, 46, 88–96. [Google Scholar]
- Haapakoski, R.; Mathieu, J.; Ebmeier, K.P.; Alenius, H.; Kivimäki, M. Cumulative Meta-Analysis of Interleukins 6 and 1β, Tumour Necrosis Factor α and C-Reactive Protein in Patients with Major Depressive Disorder. Brain Behav Immun 2015, 49, 206–215. [Google Scholar] [CrossRef]
- Stewart, J.C.; Rand, K.L.; Muldoon, M.F.; Kamarck, T.W. A Prospective Evaluation of the Directionality of the Depression-Inflammation Relationship. Brain Behav Immun 2009, 23, 936–944. [Google Scholar] [CrossRef] [PubMed]
- Torres-Platas, S.G.; Hercher, C.; Davoli, M.A.; Maussion, G.; Labonté, B.; Turecki, G.; Mechawar, N. Astrocytic Hypertrophy in Anterior Cingulate White Matter of Depressed Suicides. Neuropsychopharmacology 2011, 36, 2650–2658. [Google Scholar] [CrossRef] [PubMed]
- Song, J.; Kim, Y.-K. Animal Models for the Study of Depressive Disorder. CNS Neurosci Ther 2021, 27, 633–642. [Google Scholar] [CrossRef]
- Suneson, K.; Lindahl, J.; Chamli Hårsmar, S.; Söderberg, G.; Lindqvist, D. Inflammatory Depression—Mechanisms and Non-Pharmacological Interventions. IJMS 2021, 22, 1640. [Google Scholar] [CrossRef] [PubMed]
- Kouba, B.R.; De Araujo Borba, L.; Borges De Souza, P.; Gil-Mohapel, J.; Rodrigues, A.L.S. Role of Inflammatory Mechanisms in Major Depressive Disorder: From Etiology to Potential Pharmacological Targets. Cells 2024, 13, 423. [Google Scholar] [CrossRef]
- Wachowska, K.; Gałecki, P.; Szemraj, J.; Śmigielski, J.; Orzechowska, A. Personality Traits and Inflammation in Depressive Disorders. JCM 2022, 11, 1974. [Google Scholar] [CrossRef] [PubMed]
- Wachowska, K.; Gałecki, P. Inflammation and Cognition in Depression: A Narrative Review. JCM 2021, 10, 5859. [Google Scholar] [CrossRef]
- Dogaru, I.-A.; Puiu, M.G.; Manea, M.; Dionisie, V. Current Perspectives on Pharmacological and Non-Pharmacological Interventions for the Inflammatory Mechanism of Unipolar Depression. Brain Sciences 2022, 12, 1403. [Google Scholar] [CrossRef]
- Wachowska, K.; Szemraj, J.; Śmigielski, J.; Gałecki, P. Inflammatory Markers and Episodic Memory Functioning in Depressive Disorders. JCM 2022, 11, 693. [Google Scholar] [CrossRef]
- Carr, A.C.; Bradley, H.A.; Vlasiuk, E.; Pierard, H.; Beddow, J.; Rucklidge, J.J. Inflammation and Vitamin C in Women with Prenatal Depression and Anxiety: Effect of Multinutrient Supplementation. Antioxidants 2023, 12, 941. [Google Scholar] [CrossRef] [PubMed]
- Johnston, J.N.; Campbell, D.; Caruncho, H.J.; Henter, I.D.; Ballard, E.D.; Zarate, C.A. Suicide Biomarkers to Predict Risk, Classify Diagnostic Subtypes, and Identify Novel Therapeutic Targets: 5 Years of Promising Research. Int J Neuropsychopharmacol 2022, 25, 197–214. [Google Scholar] [CrossRef] [PubMed]
- Harsanyi, S.; Kupcova, I.; Danisovic, L.; Klein, M. Selected Biomarkers of Depression: What Are the Effects of Cytokines and Inflammation? Int J Mol Sci 2022, 24, 578. [Google Scholar] [CrossRef] [PubMed]
- von Mücke-Heim, I.-A.; Urbina-Treviño, L.; Bordes, J.; Ries, C.; Schmidt, M.V.; Deussing, J.M. Introducing a Depression-like Syndrome for Translational Neuropsychiatry: A Plea for Taxonomical Validity and Improved Comparability between Humans and Mice. Mol Psychiatry 2023, 28, 329–340. [Google Scholar] [CrossRef] [PubMed]
- Dresp-Langley, B. From Reward to Anhedonia-Dopamine Function in the Global Mental Health Context. Biomedicines 2023, 11, 2469. [Google Scholar] [CrossRef]
- Pagonabarraga, J.; Álamo, C.; Castellanos, M.; Díaz, S.; Manzano, S. Depression in Major Neurodegenerative Diseases and Strokes: A Critical Review of Similarities and Differences among Neurological Disorders. Brain Sciences 2023, 13, 318. [Google Scholar] [CrossRef]
- Maeng, S.H.; Hong, H. Inflammation as the Potential Basis in Depression. Int Neurourol J 2019, 23 (Suppl 2), S63–S71. [Google Scholar] [CrossRef]
- Nishuty, N.L.; Khandoker, M.M.H.; Karmoker, J.R.; Ferdous, S.; Shahriar, M.; Qusar, M.M.A.S.; Islam, M.S.; Kadir, M.F.; Islam, M.R. Evaluation of Serum Interleukin-6 and C-Reactive Protein Levels in Drug-Naïve Major Depressive Disorder Patients. Cureus 2019, 11, e3868. [Google Scholar] [CrossRef] [PubMed]
- Kofod, J.; Elfving, B.; Nielsen, E.H.; Mors, O.; Köhler-Forsberg, O. Depression and Inflammation: Correlation between Changes in Inflammatory Markers with Antidepressant Response and Long-Term Prognosis. European Neuropsychopharmacology 2022, 54, 116–125. [Google Scholar] [CrossRef] [PubMed]
- Osimo, E.F.; Pillinger, T.; Rodriguez, I.M.; Khandaker, G.M.; Pariante, C.M.; Howes, O.D. Inflammatory Markers in Depression: A Meta-Analysis of Mean Differences and Variability in 5,166 Patients and 5,083 Controls. Brain, Behavior, and Immunity 2020, 87, 901–909. [Google Scholar] [CrossRef] [PubMed]
- Chu, A.L.; Stochl, J.; Lewis, G.; Zammit, S.; Jones, P.B.; Khandaker, G.M. Longitudinal Association between Inflammatory Markers and Specific Symptoms of Depression in a Prospective Birth Cohort. Brain, Behavior, and Immunity 2019, 76, 74–81. [Google Scholar] [CrossRef] [PubMed]
- Roohi, E.; Jaafari, N.; Hashemian, F. On Inflammatory Hypothesis of Depression: What Is the Role of IL-6 in the Middle of the Chaos? J Neuroinflammation 2021, 18, 45. [Google Scholar] [CrossRef] [PubMed]
Figure 1.
Correlation between HAM-D and the inflammatory marker IL-1β.
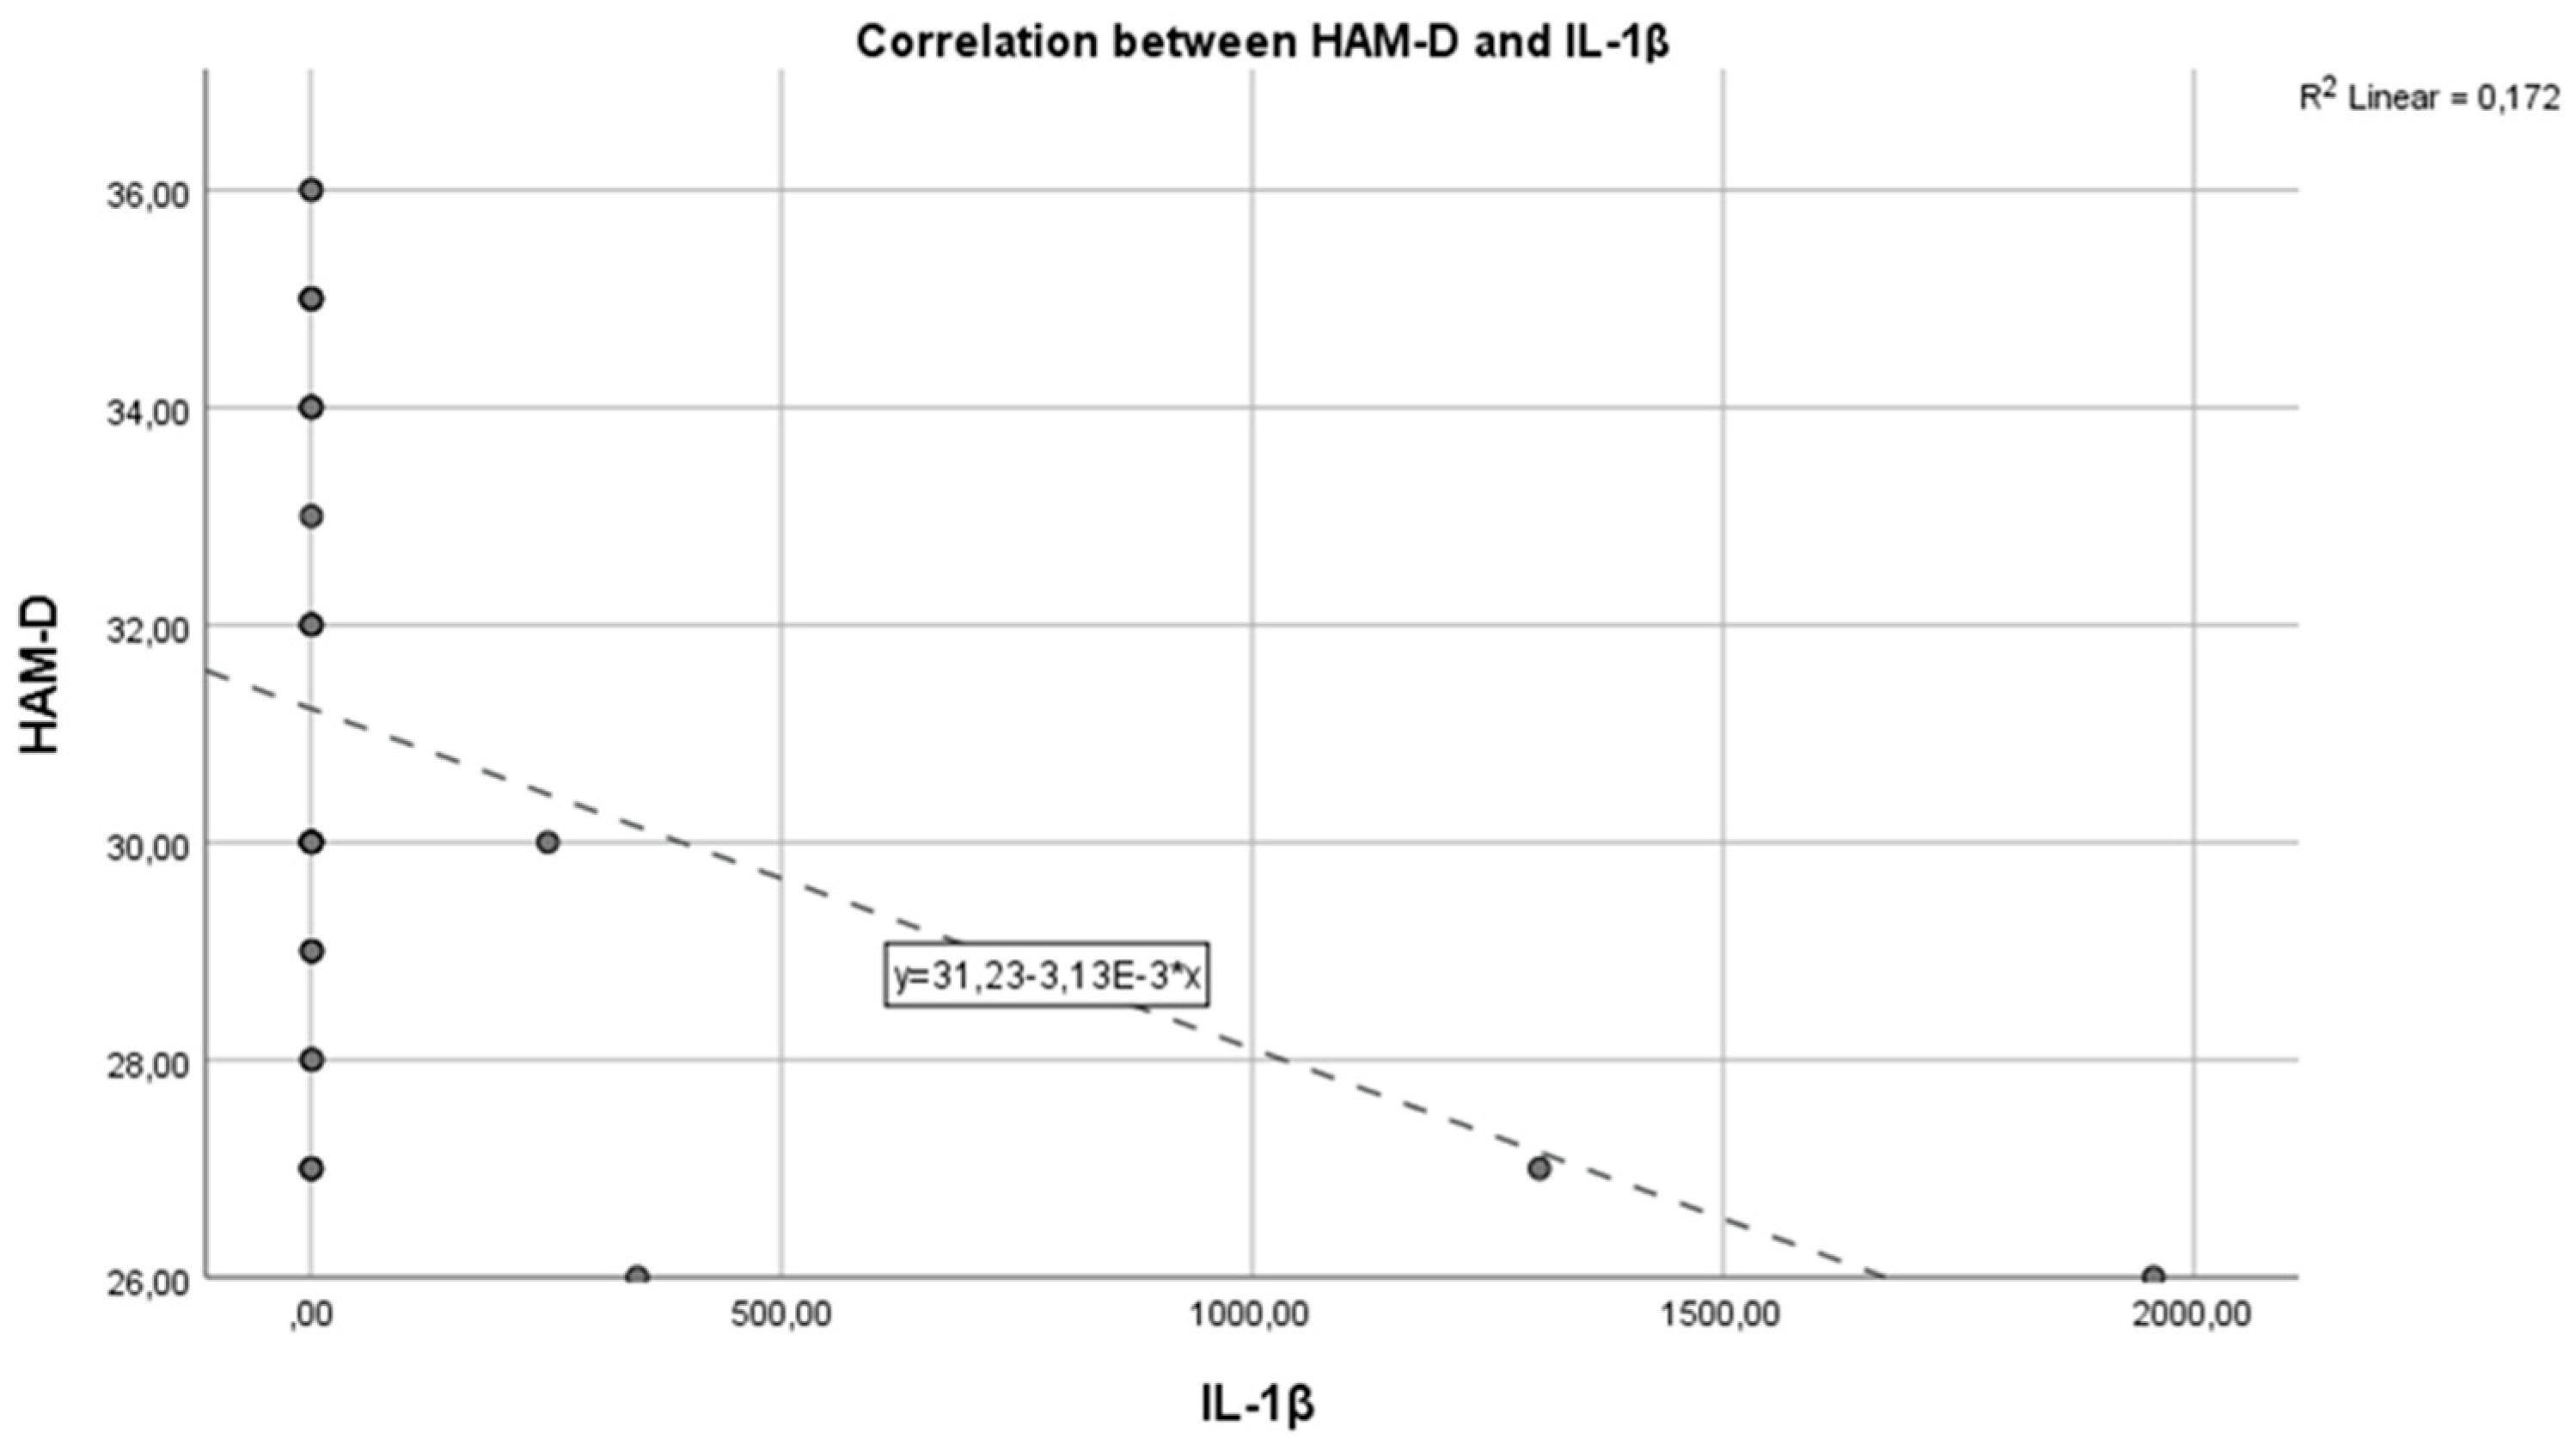
Figure 2.
Correlation between HAM-D and IL-6.
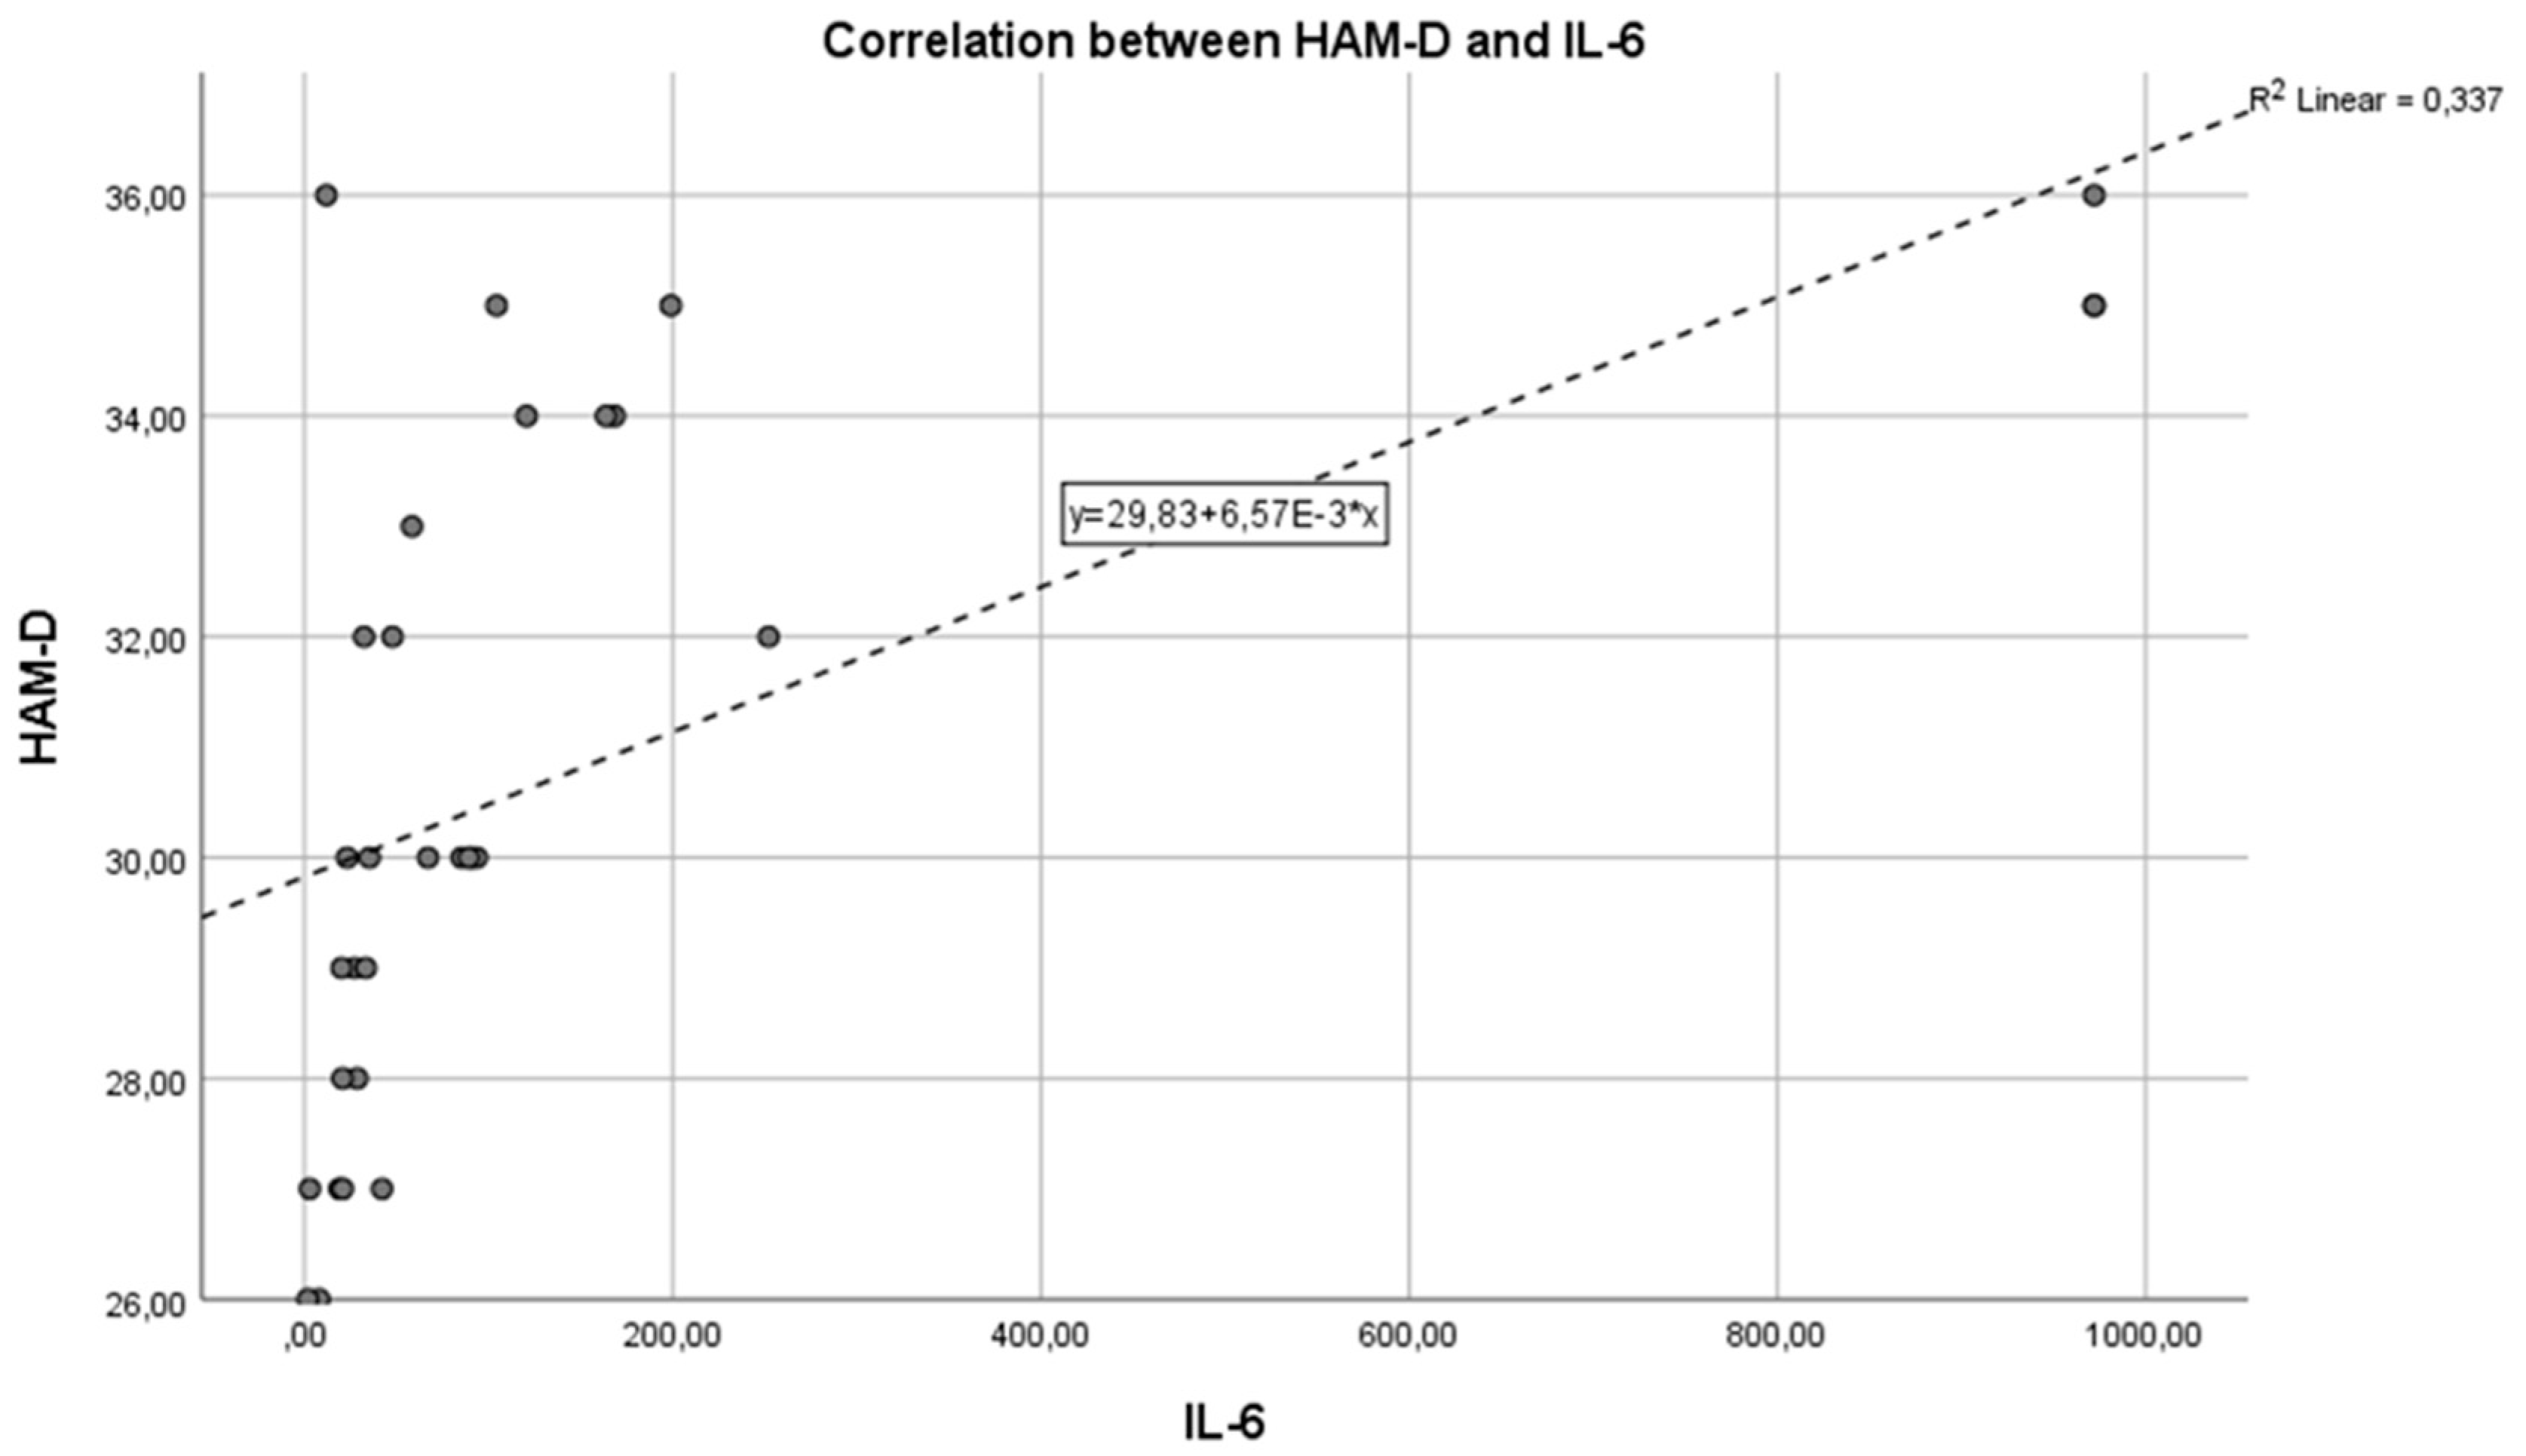
Figure 4.
Correlation between HAM-D and TNF-α.
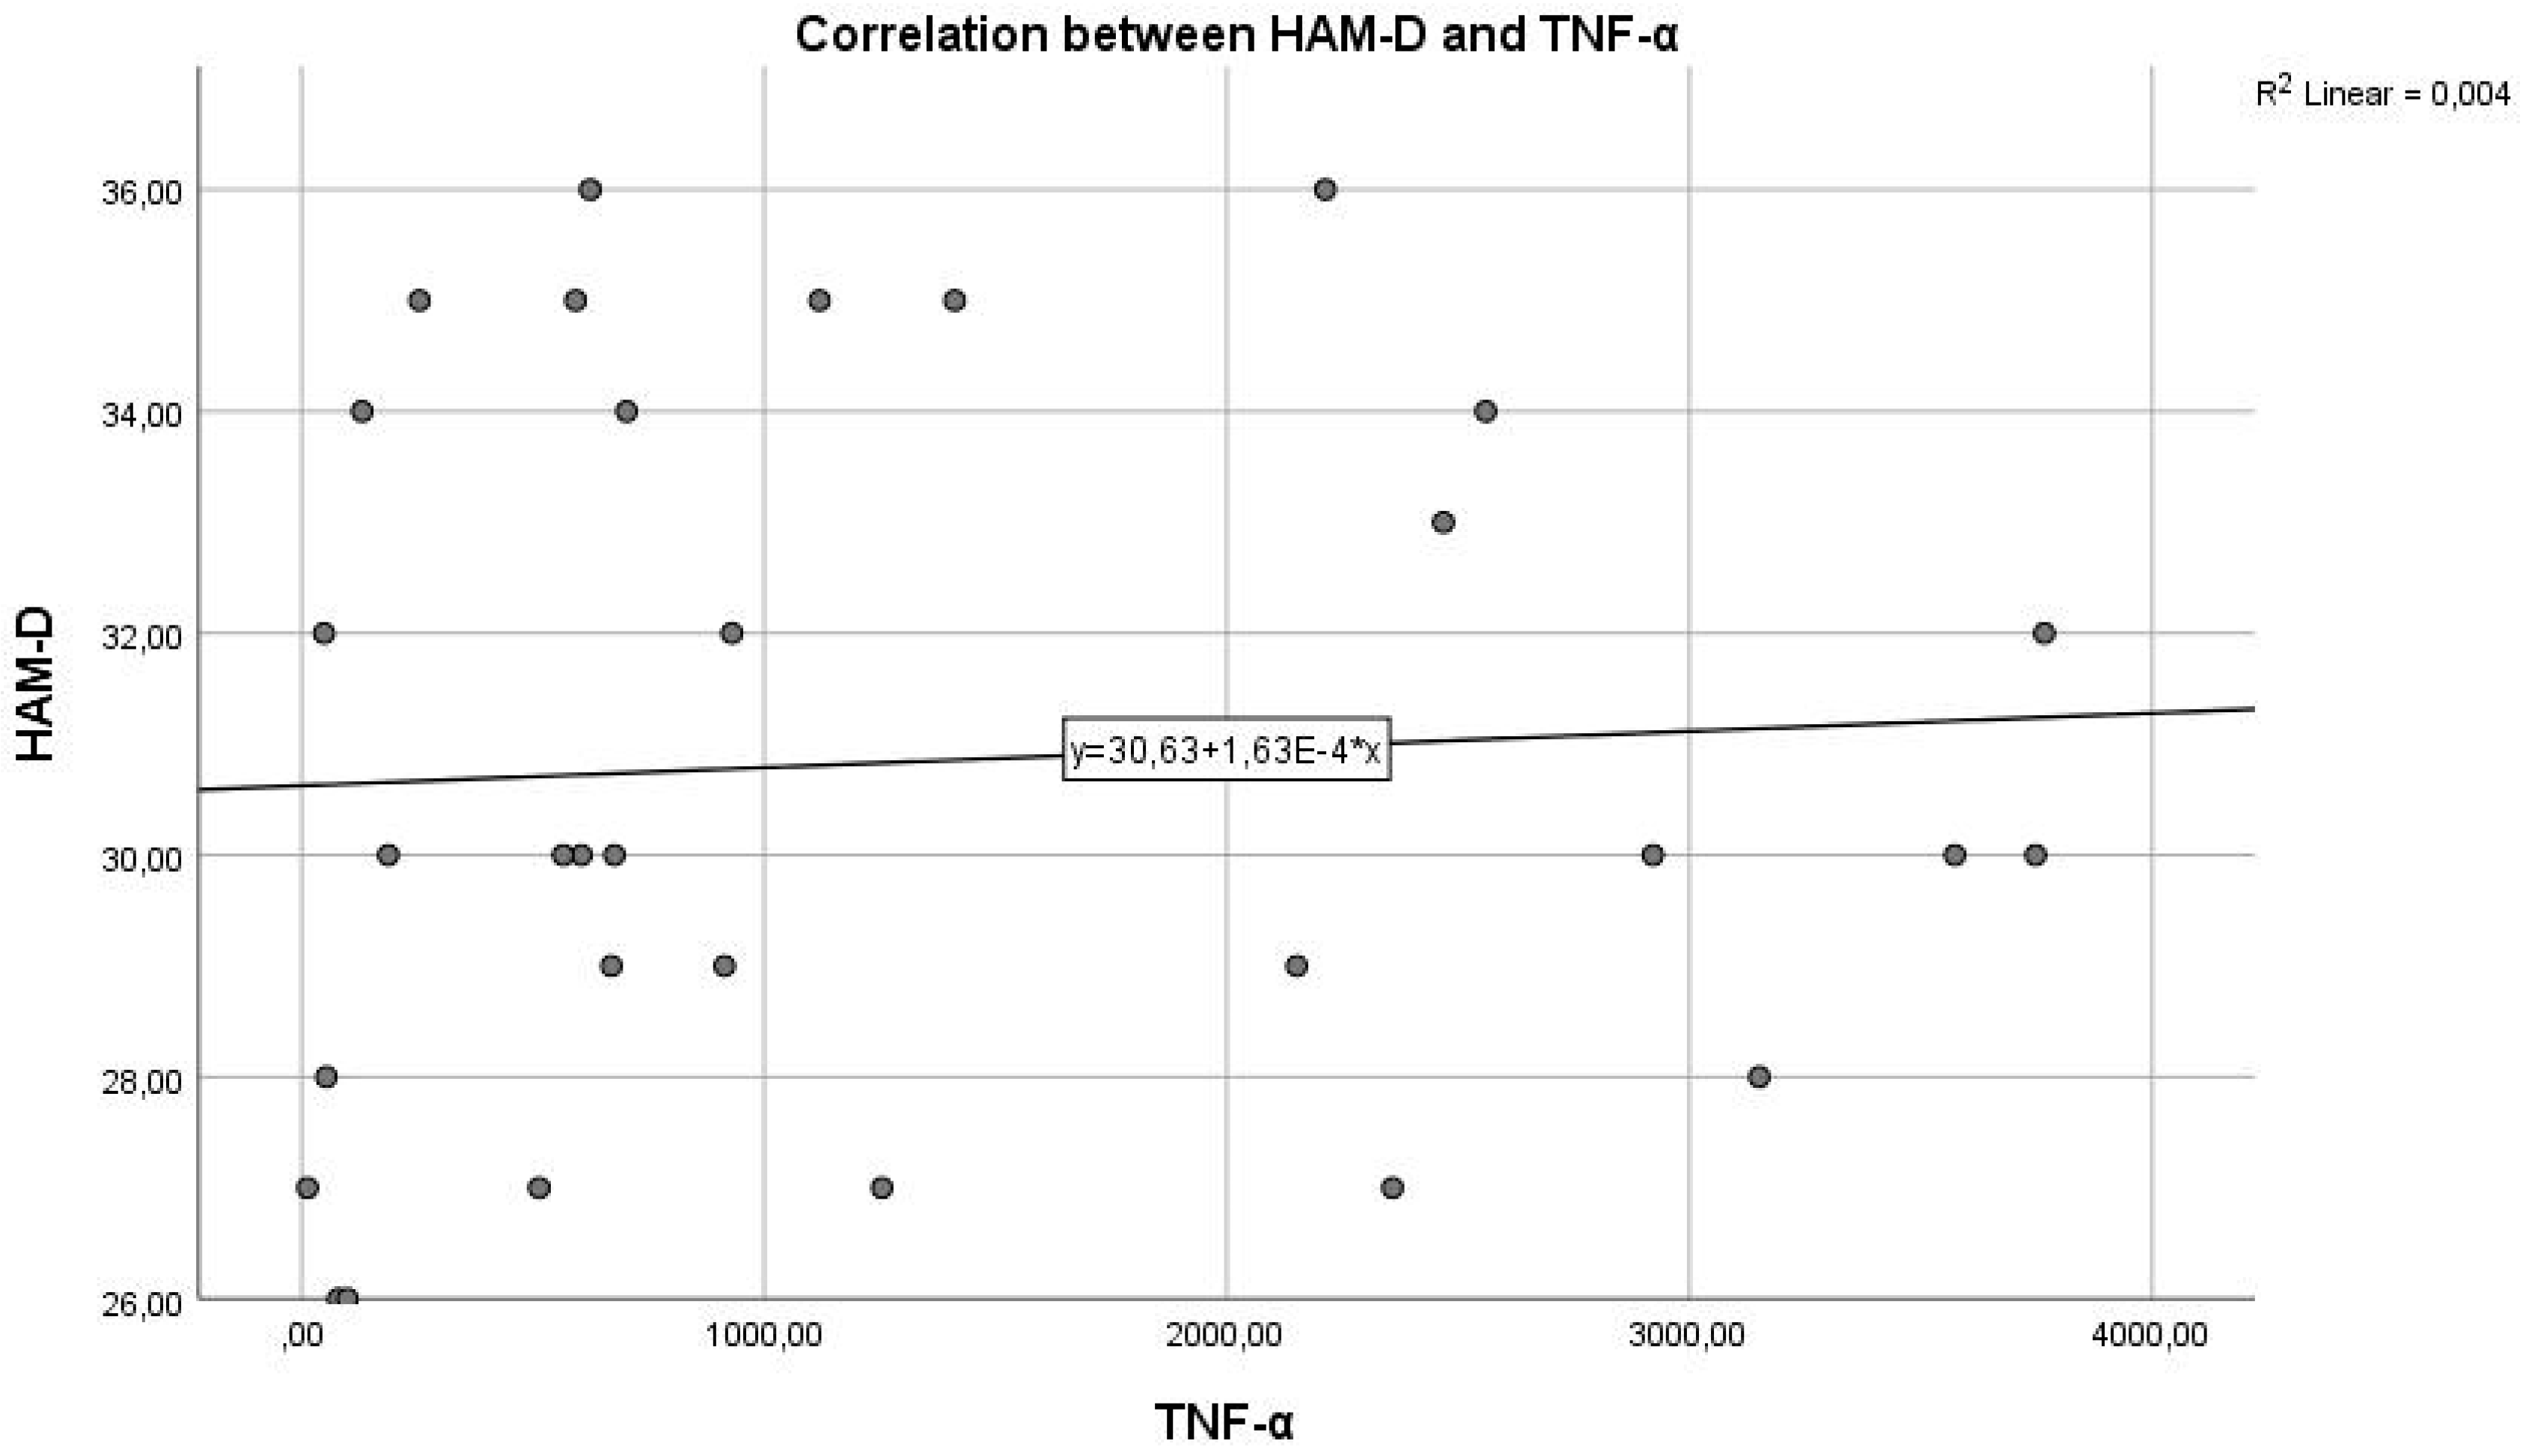
Figure 8.
Pearson correlations for IL-6 and HAM-D variables in married patients.
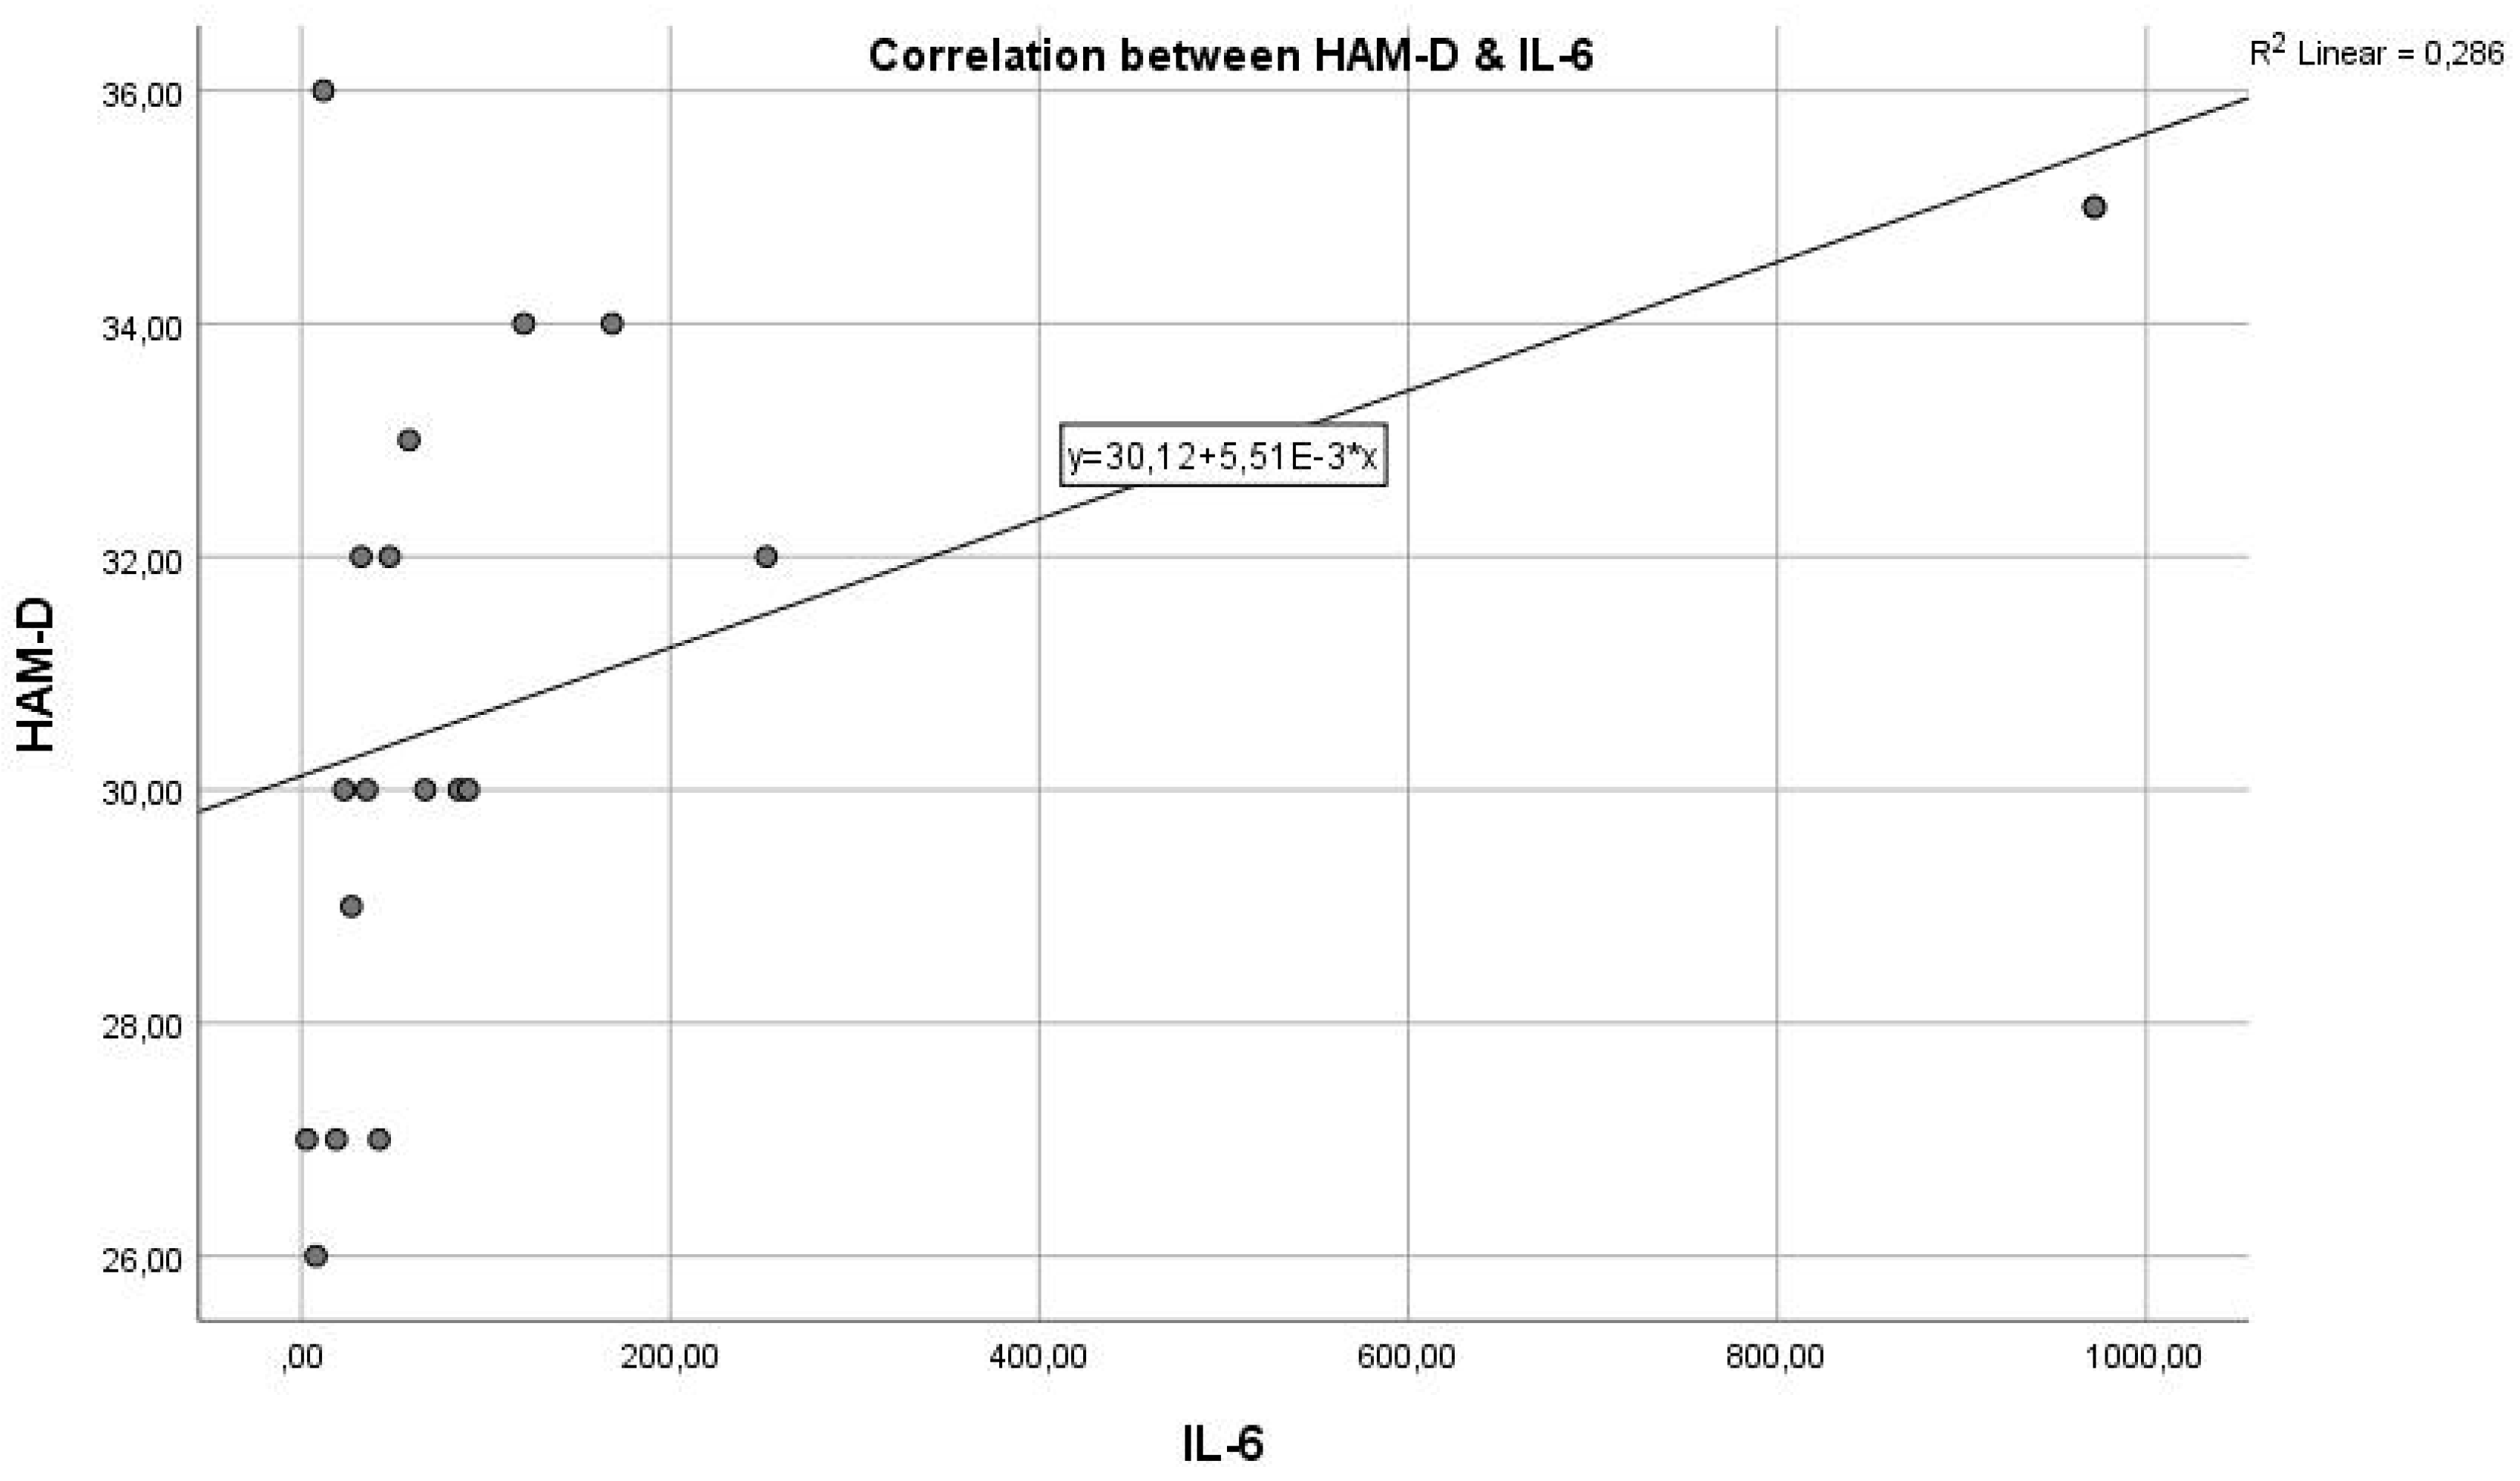
Figure 12.
Pearson correlations for TNF-α and HAM-D variables in divorced patients.
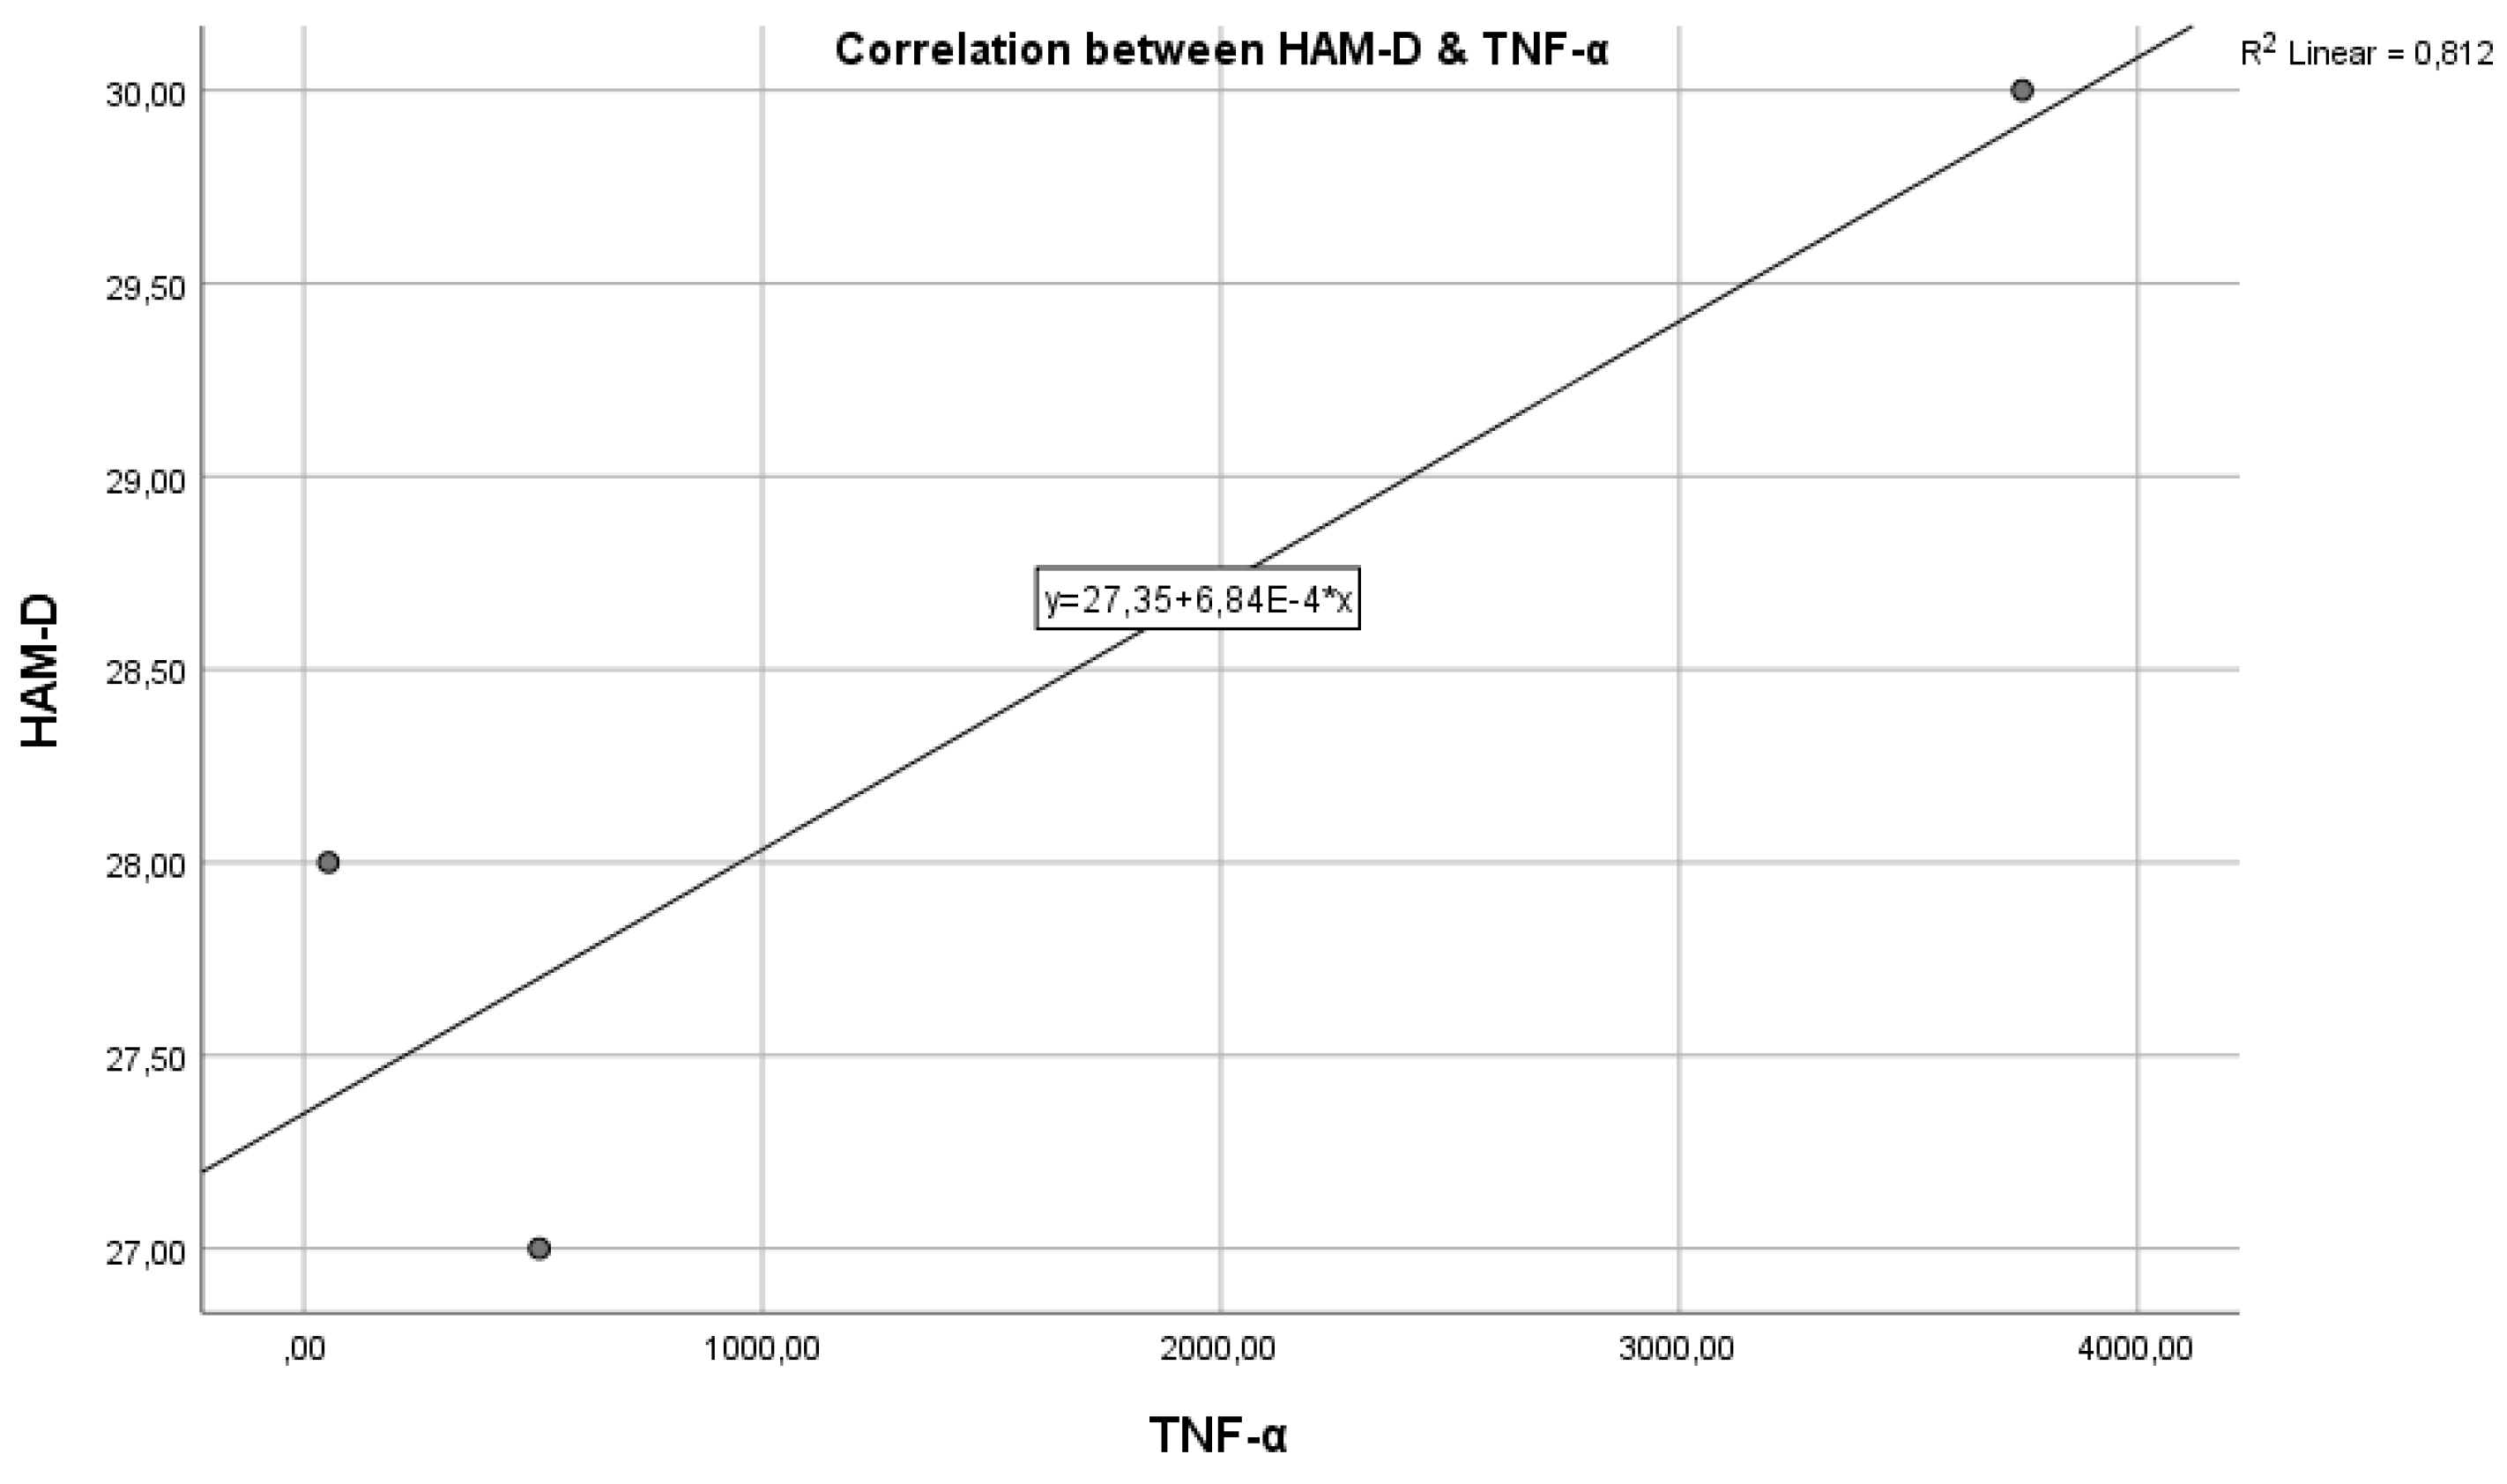
Figure 14.
Pearson correlations in the case of women from the perspective of IL-1 and HAM-D variables.
Figure 14.
Pearson correlations in the case of women from the perspective of IL-1 and HAM-D variables.
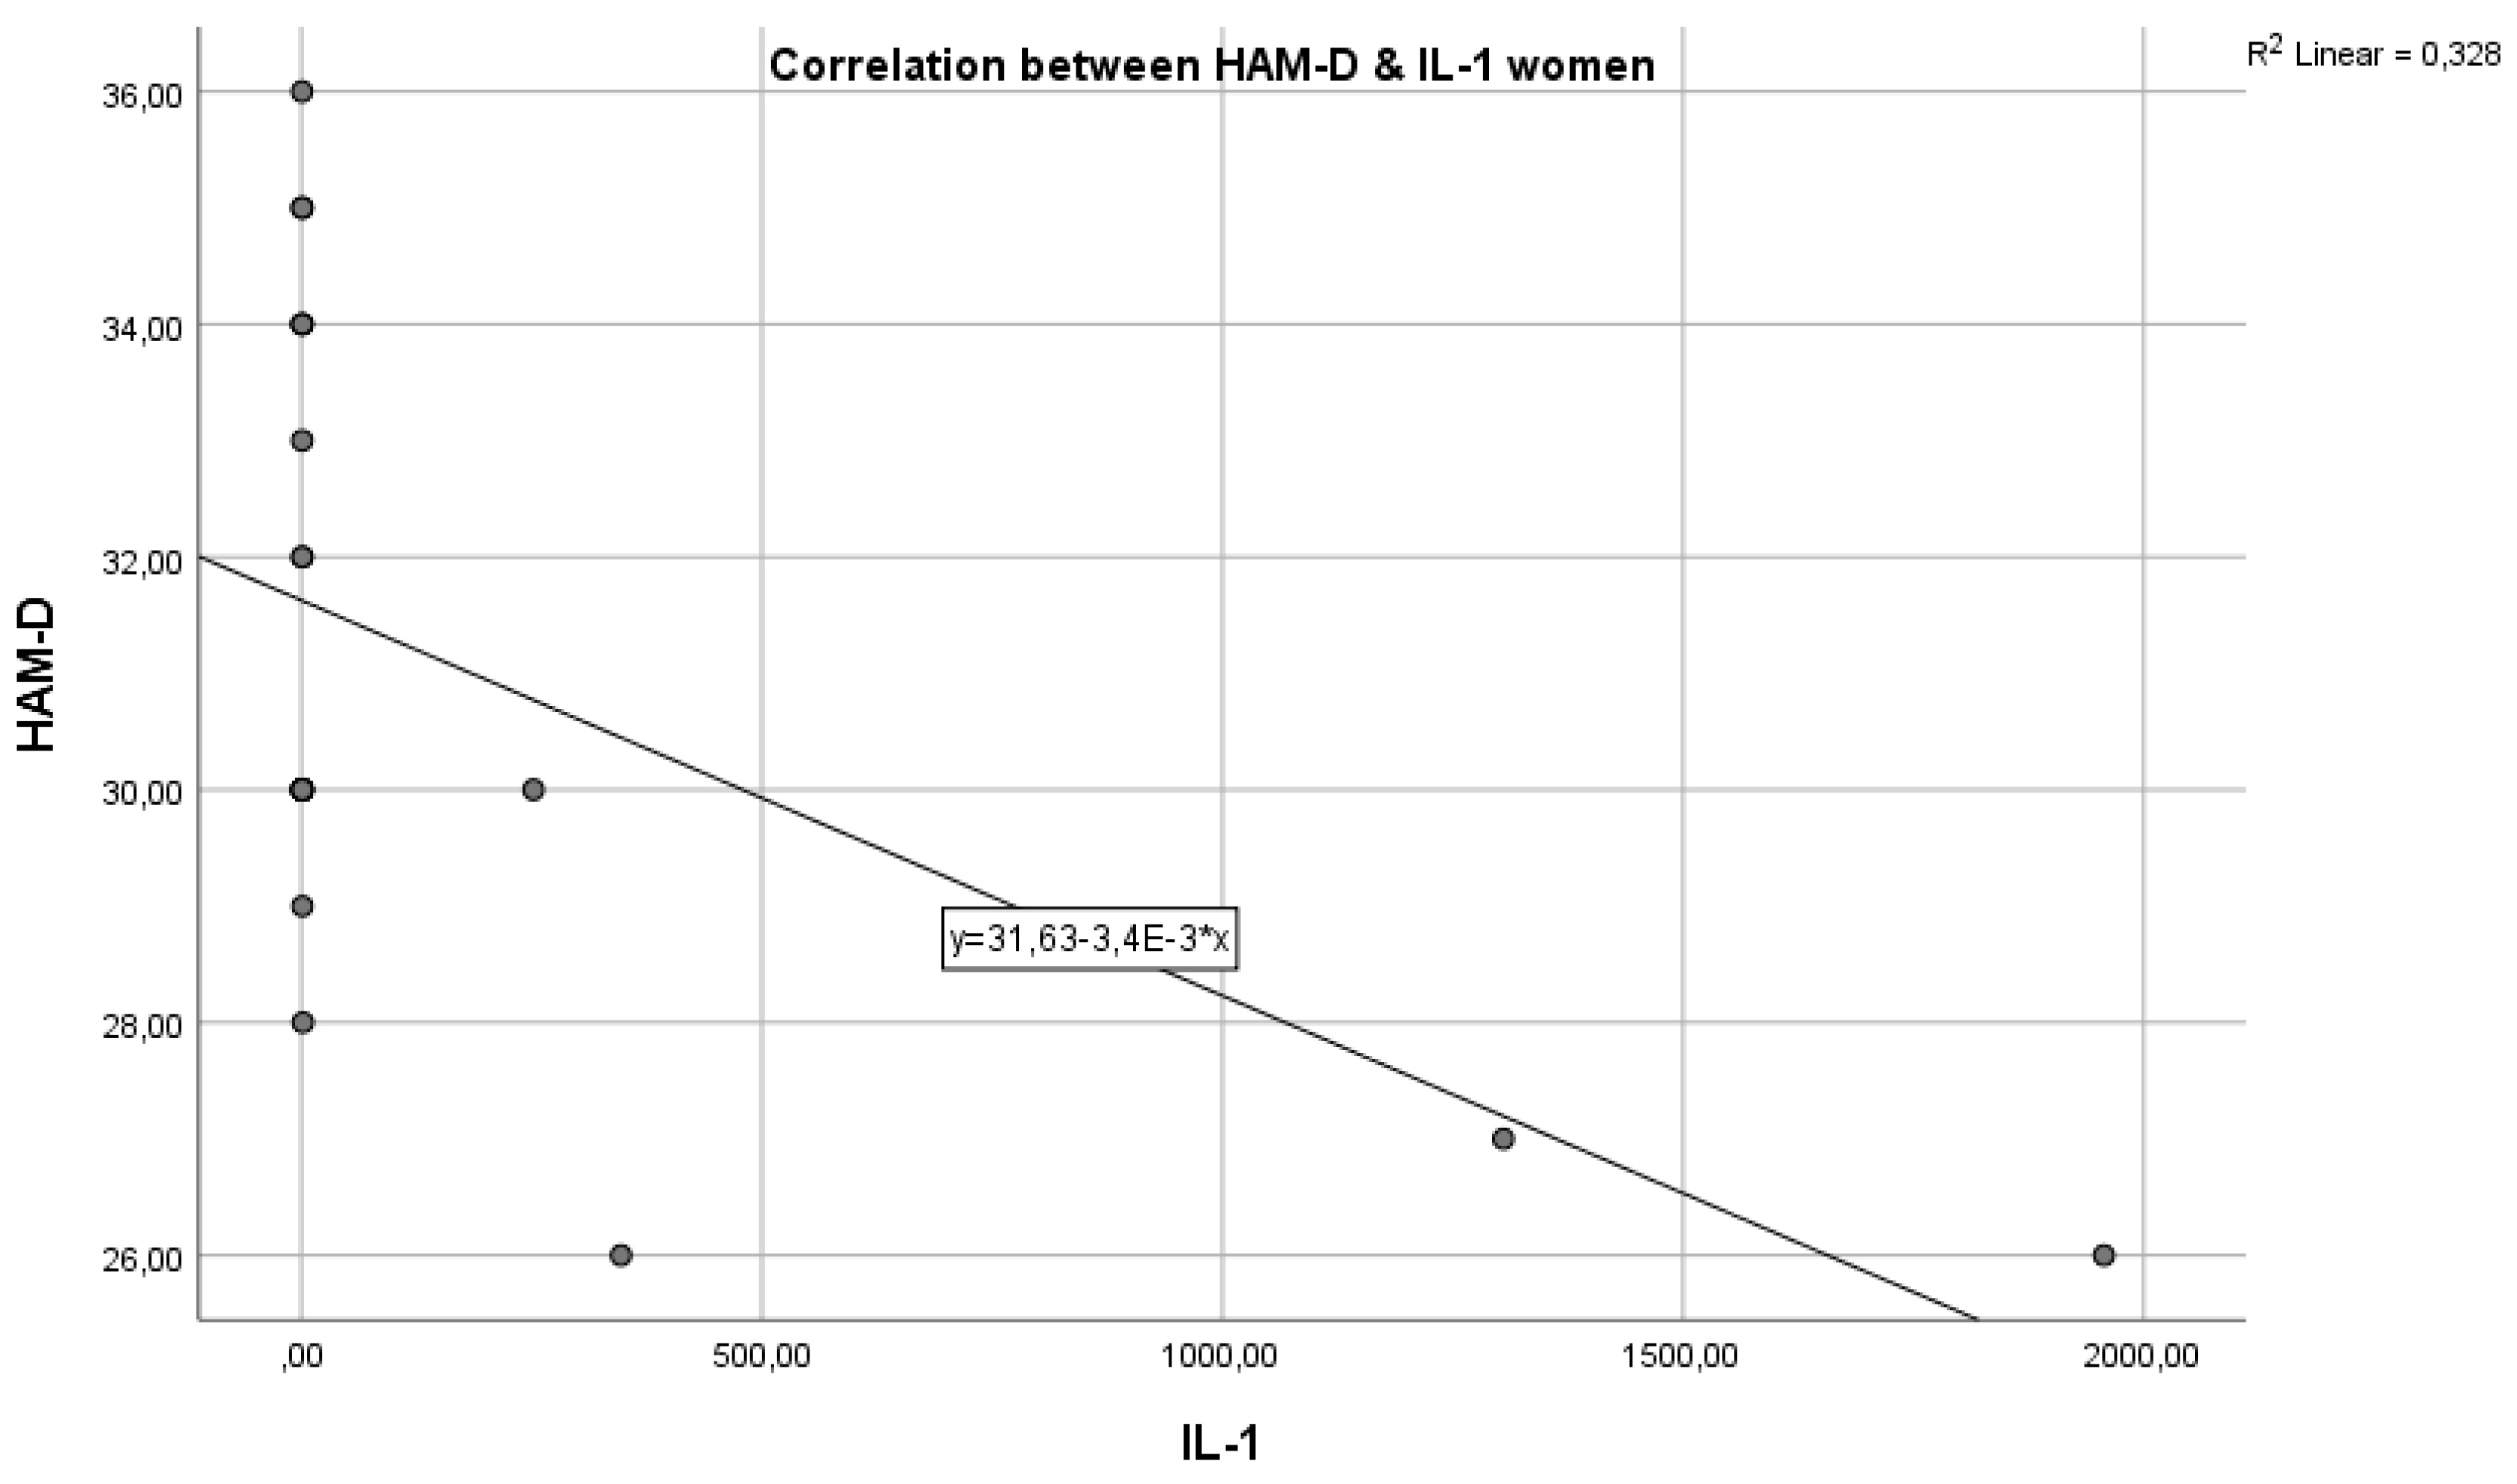
Figure 16.
Pearson correlations in the case of women from the perspective of IL-1 and TNF-α variables.
Figure 16.
Pearson correlations in the case of women from the perspective of IL-1 and TNF-α variables.
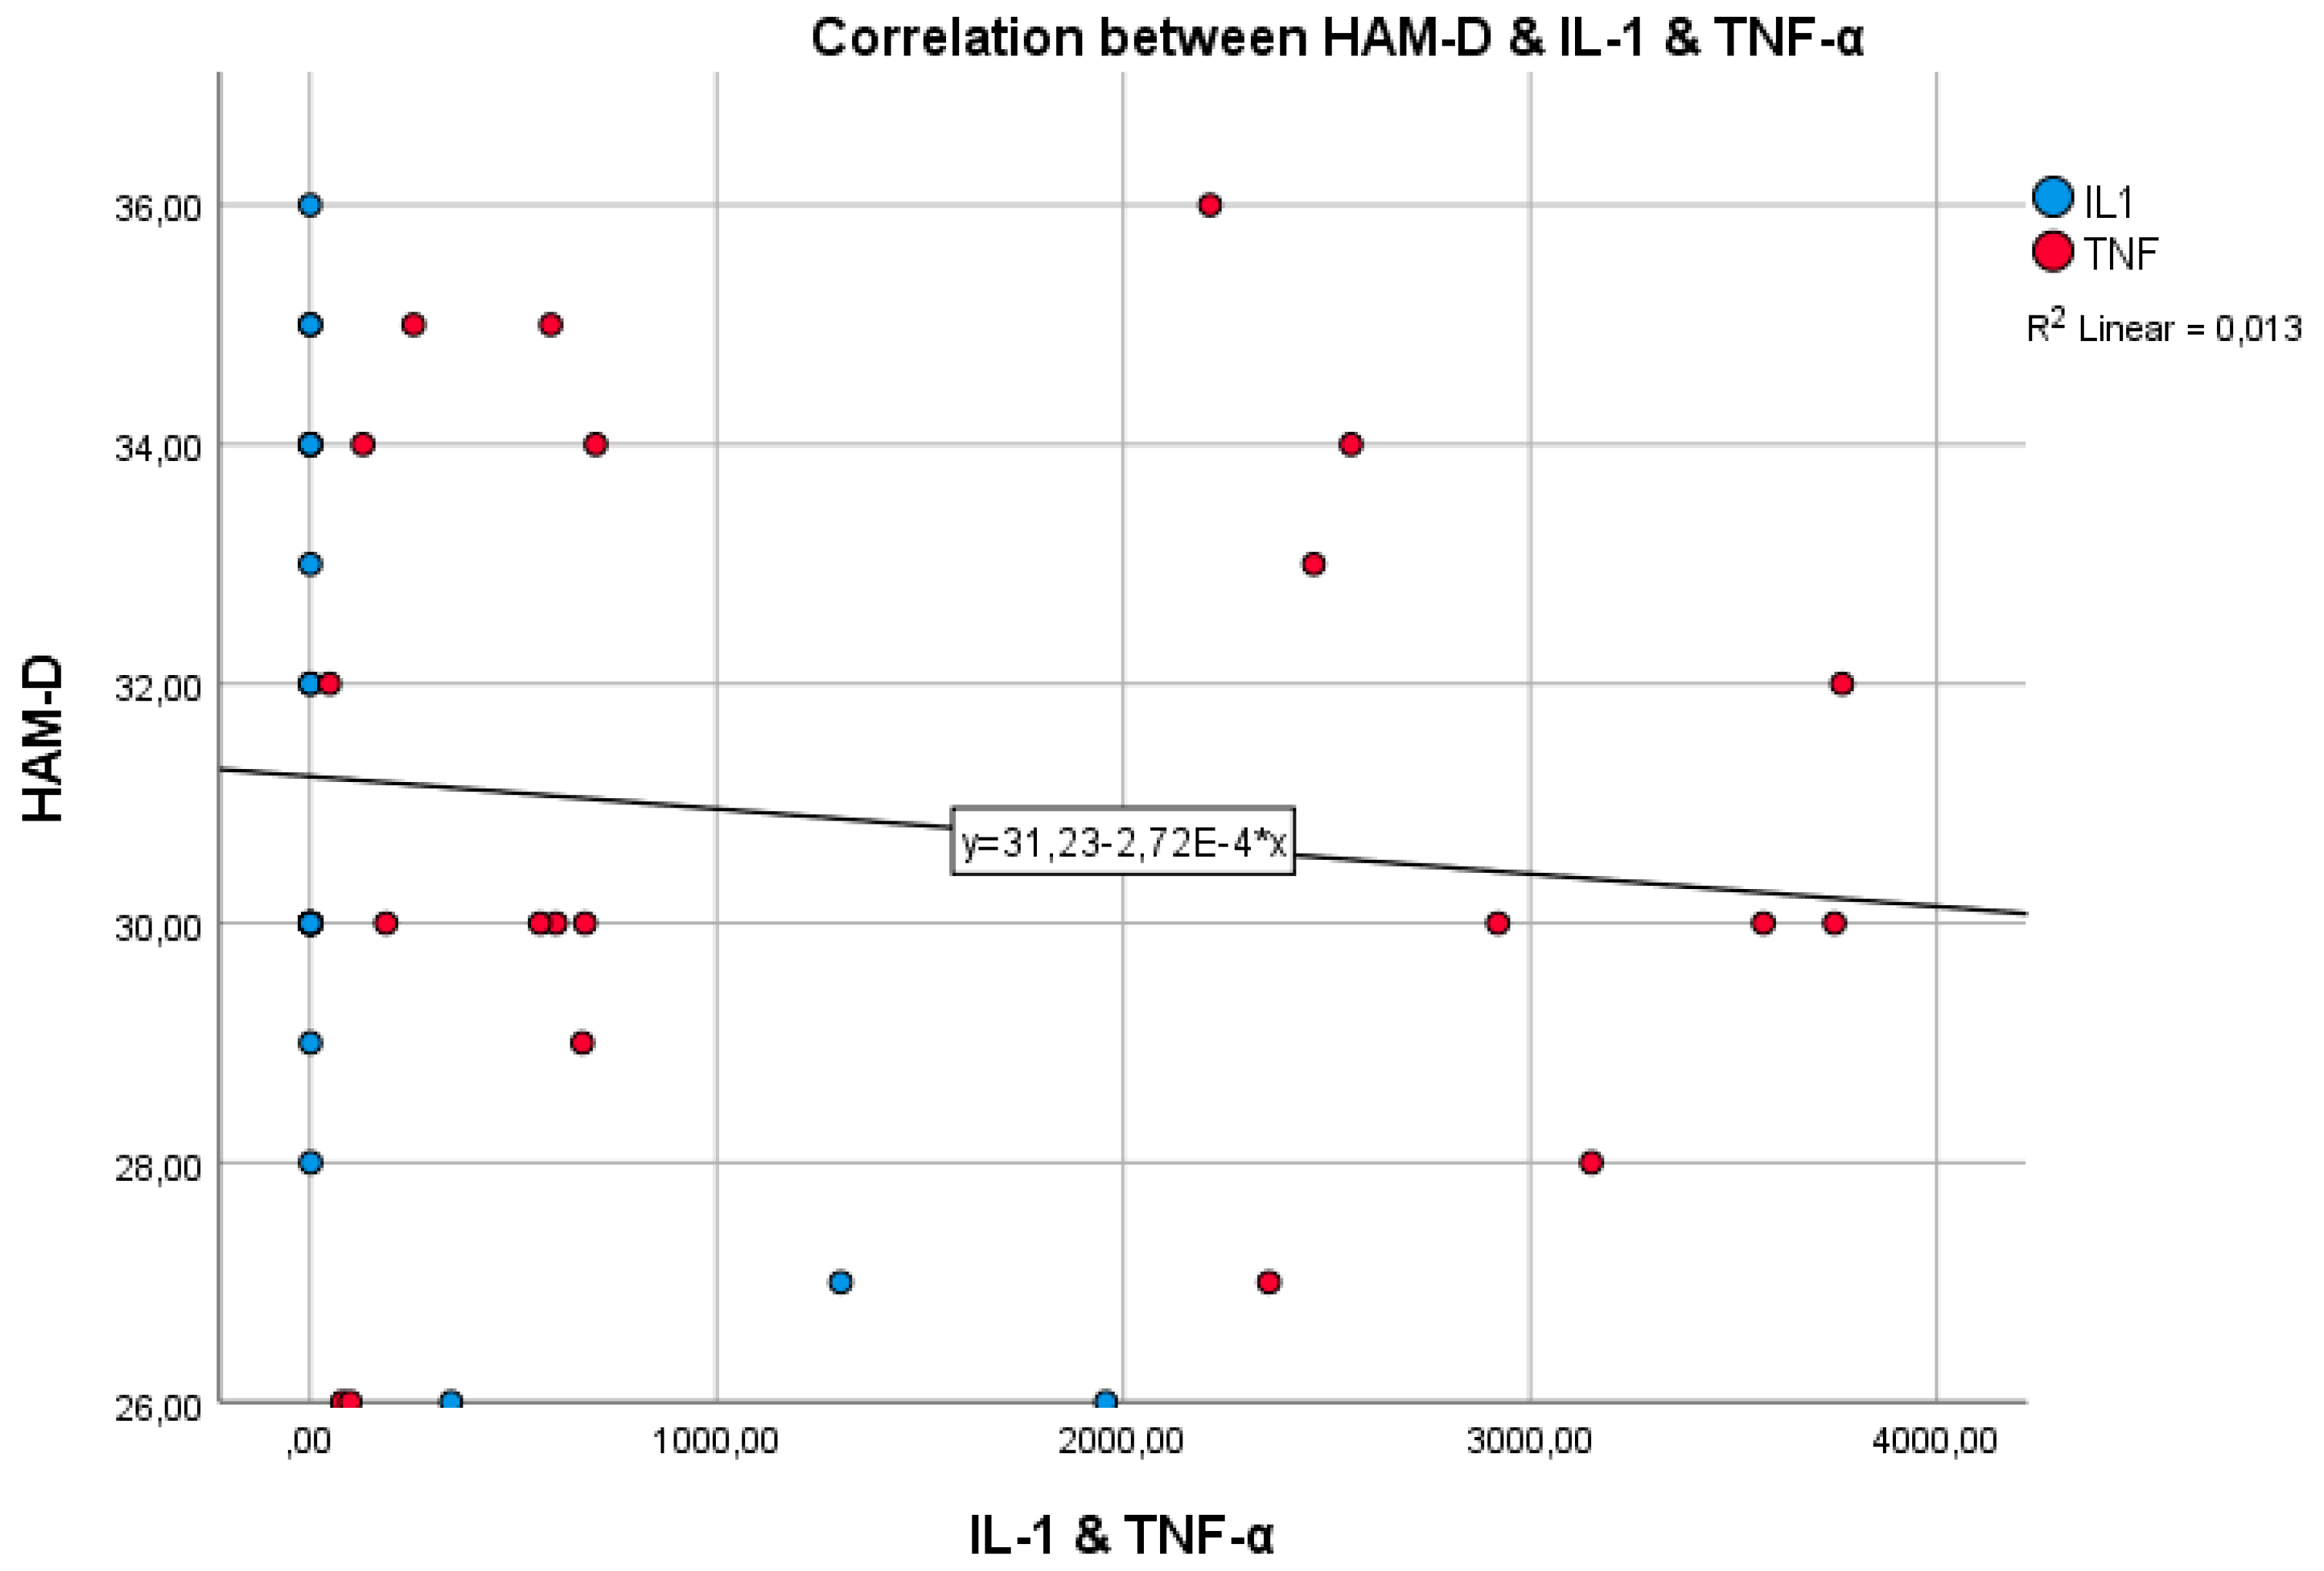
Figure 17.
Pearson correlations in the case of men from the perspective of IL-1 and HAM-D variables.
Figure 17.
Pearson correlations in the case of men from the perspective of IL-1 and HAM-D variables.
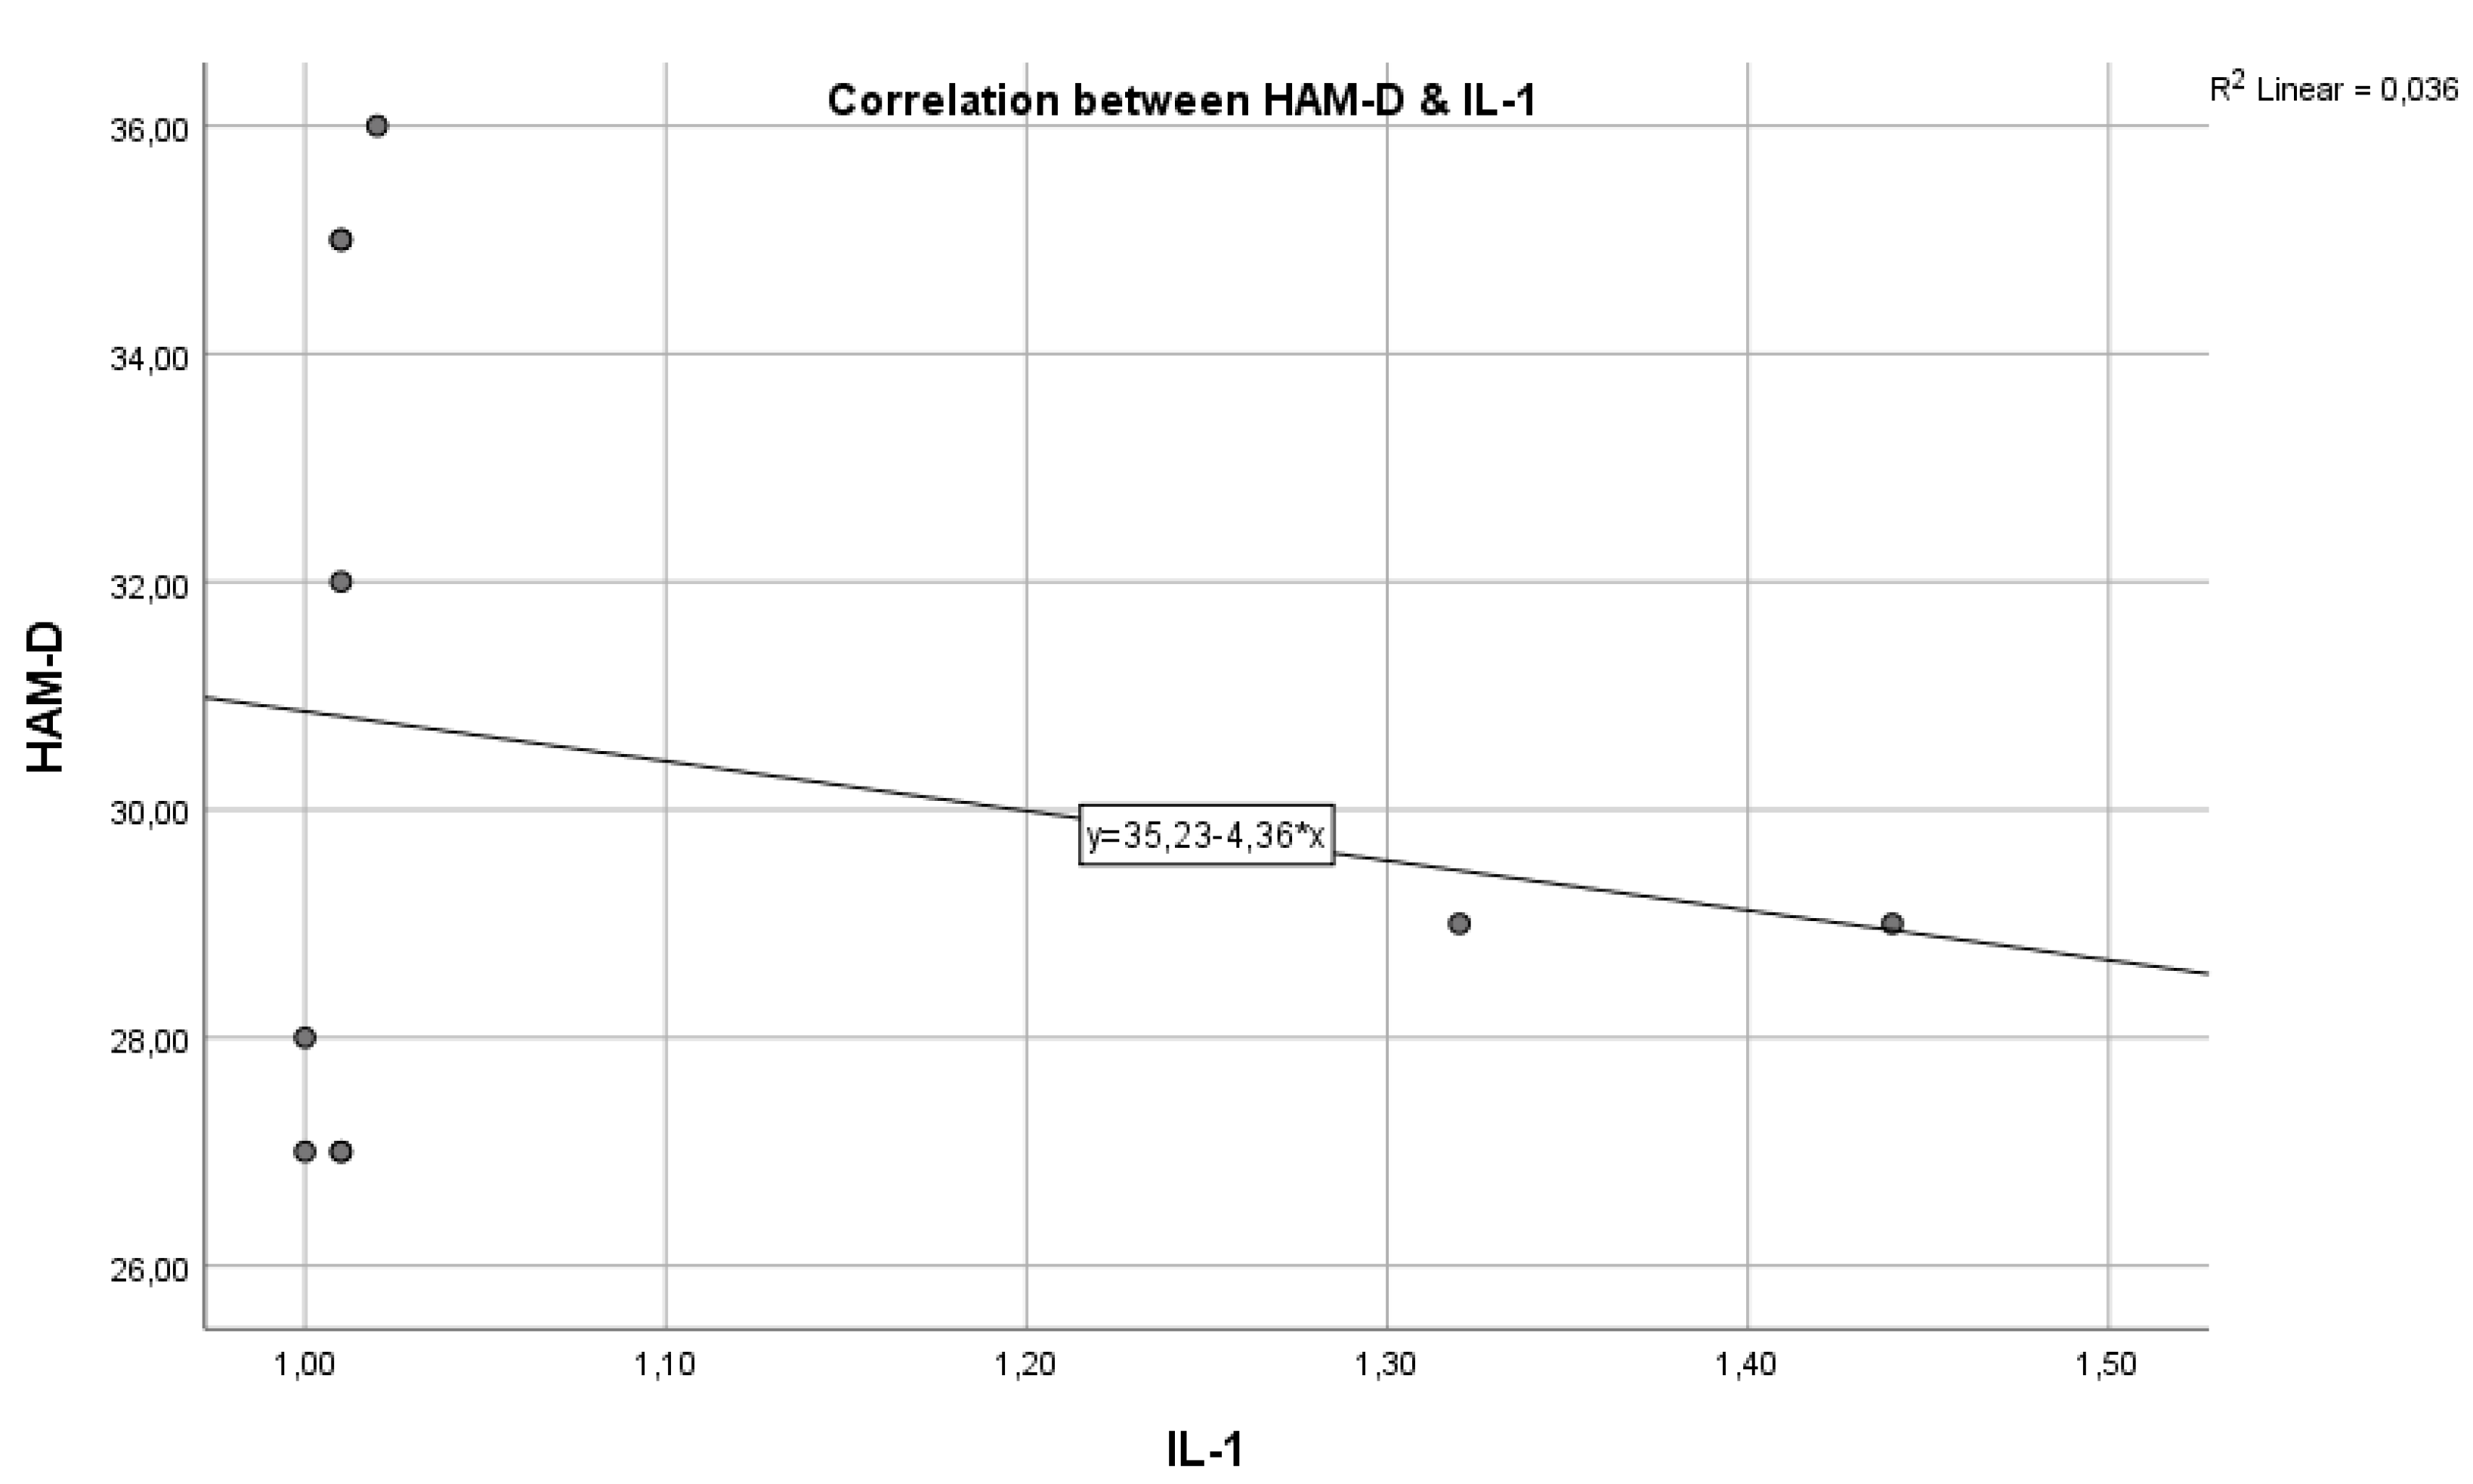
Figure 19.
Pearson correlations in the case of men from the perspective of TNF-α and HAM-D variables.
Figure 19.
Pearson correlations in the case of men from the perspective of TNF-α and HAM-D variables.
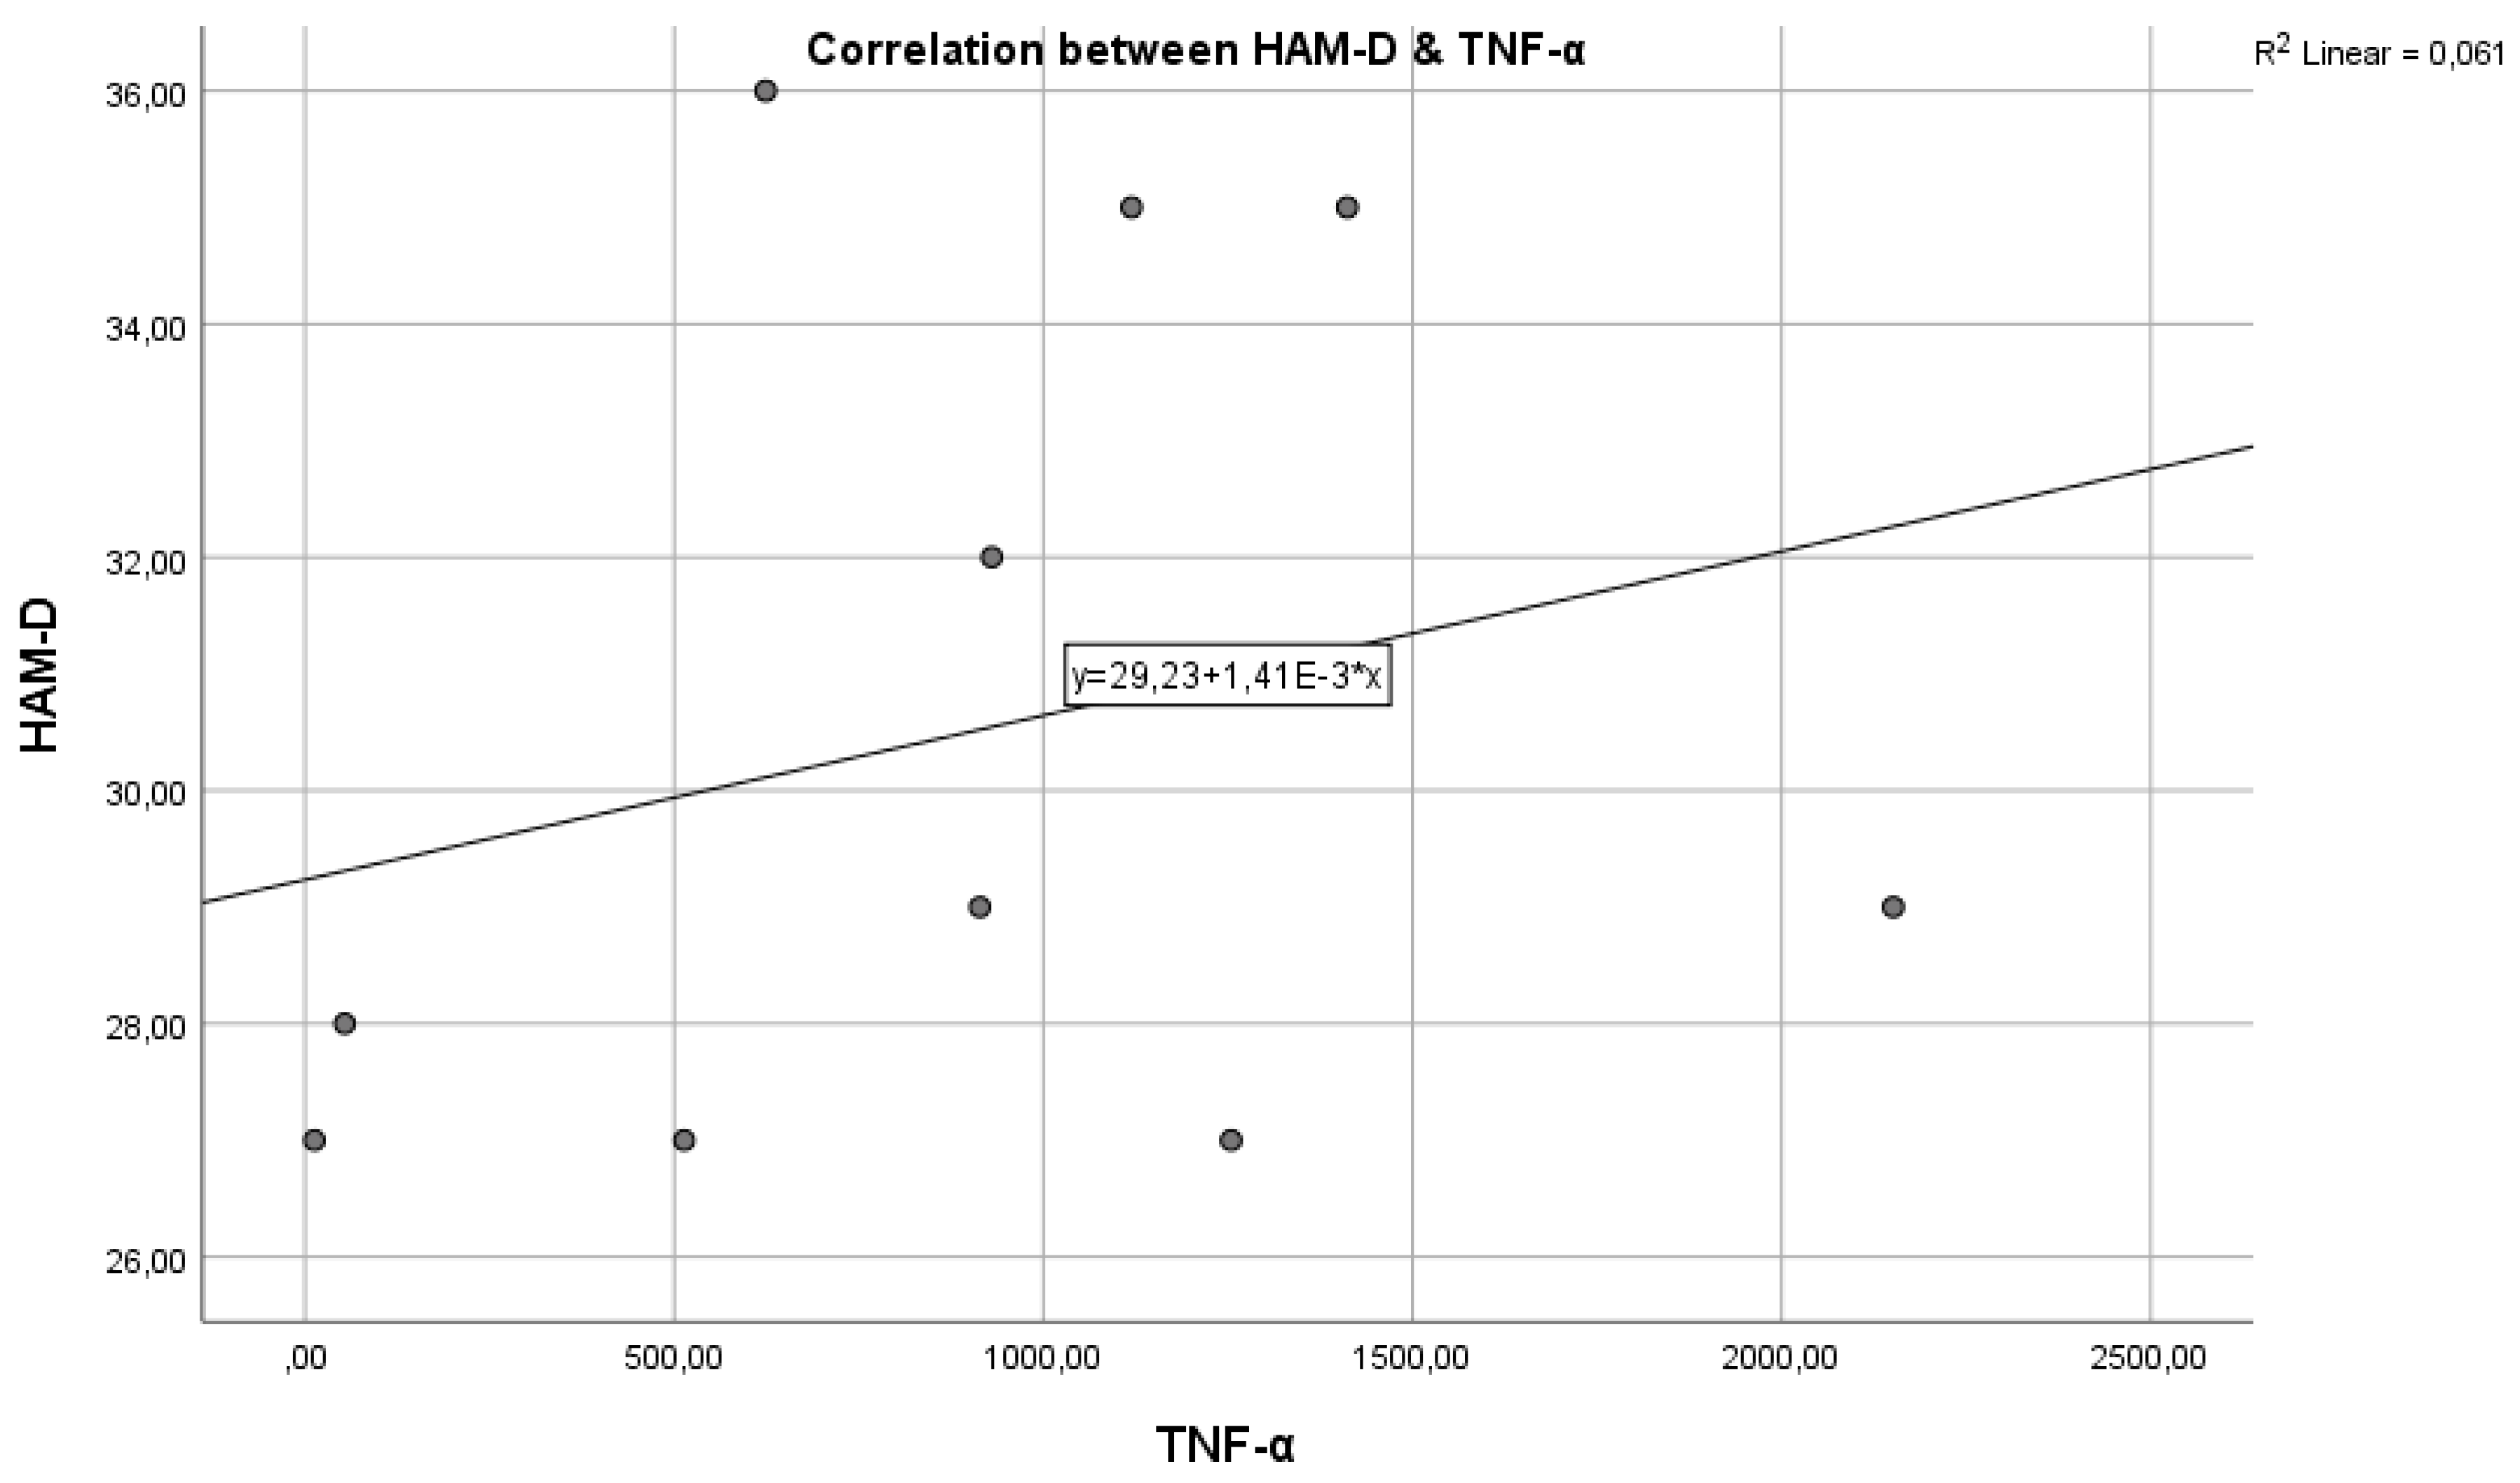
Table 3.
TNF-α mean according to the rural/urban environment of origin.
| Descriptives | |||||
| Area | Statistic | Std. Error | |||
| TNF-α | Rural | Mean | 1344,8678 | 376,63954 | |
| 95% Confidence Interval for Mean | Lower Bound | 505,6626 | |||
| Upper Bound | 2184,0730 | ||||
| 5% Trimmed Mean | 1292,7829 | ||||
| Median | 702,5800 | ||||
| Variance | 1560430,795 | ||||
| Std. Deviation | 1249,17204 | ||||
| Minimum | 53,57 | ||||
| Maximum | 3573,70 | ||||
| Range | 3520,14 | ||||
| Interquartile Range | 1958,06 | ||||
| Skewness | ,728 | ,661 | |||
| Kurtosis | -,872 | 1,279 | |||
| Urban | Mean | 1278,0314 | 275,19271 | ||
| 95% Confidence Interval for Mean | Lower Bound | 702,0464 | |||
| Upper Bound | 1854,0164 | ||||
| 5% Trimmed Mean | 1210,0533 | ||||
| Median | 795,1950 | ||||
| Variance | 1514620,546 | ||||
| Std. Deviation | 1230,69921 | ||||
| Minimum | 12,77 | ||||
| Maximum | 3766,90 | ||||
| Range | 3754,13 | ||||
| Interquartile Range | 2158,67 | ||||
| Skewness | ,940 | ,512 | |||
| Kurtosis | -,389 | ,992 | |||
Table 4.
HAM-D mean according to gender.
| Descriptives | |||||
| Statistic | Std. Error | ||||
| HAM-D | women | Mean | 31,0000 | ,64734 | |
| 95% Confidence Interval for Mean | Lower Bound | 29,6497 | |||
| Upper Bound | 32,3503 | ||||
| 5% Trimmed Mean | 31,0026 | ||||
| Median | 30,0000 | ||||
| Variance | 8,800 | ||||
| Std. Deviation | 2,96648 | ||||
| Minimum | 26,00 | ||||
| Maximum | 36,00 | ||||
| Range | 10,00 | ||||
| Interquartile Range | 4,50 | ||||
| Skewness | -,025 | ,501 | |||
| Kurtosis | -,885 | ,972 | |||
| men | Mean | 30,5000 | 1,15710 | ||
| 95% Confidence Interval for Mean | Lower Bound | 27,8824 | |||
| Upper Bound | 33,1176 | ||||
| 5% Trimmed Mean | 30,3889 | ||||
| Median | 29,0000 | ||||
| Variance | 13,389 | ||||
| Std. Deviation | 3,65908 | ||||
| Minimum | 27,00 | ||||
| Maximum | 36,00 | ||||
| Range | 9,00 | ||||
| Interquartile Range | 8,00 | ||||
| Skewness | ,570 | ,687 | |||
| Kurtosis | -1,613 | 1,334 | |||
Table 5.
Correlations of inflammation and depression in women vs. men.
| Women | |||||
| IL1 | IL6 | TNF-α | HAM-D | ||
| IL1 | Pearson Correlation | 1 | -,197 | -,177 | -,572 ** |
| Sig. (2-tailed) | ,392 | ,442 | ,007 | ||
| N | 21 | 21 | 21 | 21 | |
| IL6 | Pearson Correlation | -,197 | 1 | -,020 | ,612 ** |
| Sig. (2-tailed) | ,392 | ,930 | ,003 | ||
| N | 21 | 21 | 21 | 21 | |
| TNF-α | Pearson Correlation | -,177 | -,020 | 1 | ,000 |
| Sig. (2-tailed) | ,442 | ,930 | 1,000 | ||
| N | 21 | 21 | 21 | 21 | |
| HAM-D | Pearson Correlation | -,572 ** | ,612 ** | ,000 | 1 |
| Sig. (2-tailed) | ,007 | ,003 | 1,000 | ||
| N | 21 | 21 | 21 | 21 | |
| **. Correlation is significant at the 0.01 level (2-tailed). | |||||
| Men | |||||
| IL1 | IL6 | TNF-α | HAM | ||
| IL1 | Pearson Correlation | 1 | -,231 | ,439 | -,190 |
| Sig. (2-tailed) | ,520 | ,205 | ,599 | ||
| N | 10 | 10 | 10 | 10 | |
| IL6 | Pearson Correlation | -,231 | 1 | ,181 | ,539 |
| Sig. (2-tailed) | ,520 | ,616 | ,108 | ||
| N | 10 | 10 | 10 | 10 | |
| TNF-α | Pearson Correlation | ,439 | ,181 | 1 | ,248 |
| Sig. (2-tailed) | ,205 | ,616 | ,490 | ||
| N | 10 | 10 | 10 | 10 | |
| HAM-D | Pearson Correlation | -,190 | ,539 | ,248 | 1 |
| Sig. (2-tailed) | ,599 | ,108 | ,490 | ||
| N | 10 | 10 | 10 | 10 | |
Disclaimer/Publisher’s Note: The statements, opinions and data contained in all publications are solely those of the individual author(s) and contributor(s) and not of MDPI and/or the editor(s). MDPI and/or the editor(s) disclaim responsibility for any injury to people or property resulting from any ideas, methods, instructions or products referred to in the content. |
© 2024 by the authors. Licensee MDPI, Basel, Switzerland. This article is an open access article distributed under the terms and conditions of the Creative Commons Attribution (CC BY) license (http://creativecommons.org/licenses/by/4.0/).
Copyright: This open access article is published under a Creative Commons CC BY 4.0 license, which permit the free download, distribution, and reuse, provided that the author and preprint are cited in any reuse.


