
Submitted:
23 July 2024
Posted:
23 July 2024
You are already at the latest version
Abstract
The work is devoted to assessing changes in the water regime of the Lan River in modern conditions and the near future with the aim of developing a strategy for the rational use of the water potential of small rivers in the Belarusian Polesie region. There was a tendency towards an increase in annual runoff at the Loktyshi and Mokrovo gauging stations during the study period from 1948 to 2015, which was caused by anthropogenic factors in the form of amelioration measures. Testing the hypothesis about the homogeneity of the runoff series under consideration for periods with different averaging intervals has showed heterogeneity for some types of runoff. This was caused by intensive economic activity, which significantly disrupts the natural hydrological regime. A runoff forecast was made for the Lan River at the Mokrovo gauging station for the period up to 2035 based on archive of meteorological data using a multi-model ensemble of four CMIP5 scenarios. A slight decrease in runoff was predicted, caused by additional evaporation from the water surface of the reservoir due to increased air temperature, as well as a slight shift in the peak of the spring flood to March. Results of calculating of permissible withdrawal of surface water from the Lan River for the needs of the Loktyshi fish farm have shown great influence of the fish farm on the river runoff volume that requires strict adherence to scientifically based regimes for managing the water regime of the Loktyshi Reservoir and the Loktyshi fish farm.
Keywords:
runoff
; anthropogenic factors
; climate changes
; forecast
; Lan River
; Loktyshi fish farm
1. Introduction
The nature of fluctuations in water resources is determined by climatic factors, but starting from the second half of the 20th century, the role of the anthropogenic component in a number of cases becomes comparable to natural influences. Thus, it can be stated that the end of the 20th – beginning of the 21st century is characterized by pronounced climate variability and an increase in anthropogenic impact on water resources [1,2,3,4]. Natural causes determine the spatiotemporal fluctuations of water resources depending on differences in its physical and geographical conditions, as well as under the influence of the annual and secular course of climatic conditions affecting the formation of water resources. Intra-annual fluctuations occur constantly and consistently. The main feature of natural causes is that the changes that occur do not have a one-sided tendency [5,6,7].
Anthropogenic causes are the result of various types of human activities. They affect water resources and water quality relatively quickly and unilaterally, which is their main difference from natural causes [8,9]. The types of economic activities that cause changes in the quantitative and qualitative characteristics of water resources are very diverse and depend on the physical and geographical conditions of the territory, the characteristics of its water regime and the nature of its use [10,11].
The increased unevenness of precipitation and rising air temperatures in the territory of the Belarusian Polesie in recent decades have led to an increase in the frequency of drought events. In recent years, there have been numerous cases of shallowing, pollution and disappearance of small rivers under the influence of anthropogenic factors, which have recently been aggravated by modern climate change [12].
The listed climatic and anthropogenic factors have a huge impact on the formation of the river runoff of the Belarusian Polesie, therefore the main goal of this work was to assess changes in the flow regime of the Lan River in modern conditions and in the near future. Such an assessment will allow us to gain an understanding of the processes on the small rivers of the Belarusian Polesie and develop a scientifically based strategy for the conservation and rational use of the water potential of the small rivers in the region.
2. Materials and Methods
The Belarusian Polesie is a unique natural site, with numerous small rivers and lakes, located in the south of Belarus and covers an area of about 61 thousand km², which is approximately a third of the country's territory. The length of the region’s territory from west to east is about 500 km, from north to south – about 200 km. Small rivers of the Belarusian Polesie are very sensitive to changes in natural factors and anthropogenic impacts and are most vulnerable, unlike medium and large rivers.
The climate of the Belarusian Polesie is determined by its geographical location in the temperate latitudes of the Northern Hemisphere. The amount and nature of the distribution of atmospheric precipitation over the territory of are determined by a number of factors, the main of which are the characteristics of atmospheric circulation and the terrain. On average, 600–650 mm of precipitation falls annually in Polesie. Deviations from long-term average values are often observed. In wet years, up to 800 mm of precipitation falls, in dry years it is about 500 mm. The study area is characterized by high air humidity throughout the year, which is due to the predominance of temperate sea air from the Atlantic Ocean, relatively low temperatures in the warm season, and vast areas occupied by wetland complexes and forests. Average annual air temperature within the territory of the Belarusian Polesie for the period 1988–2015 increased by 1.3 °C compared to the period 1945–1987 and amounted to 7.8 °C.
The Lan River is a typical river of Belarusian Polesie and the left tributary of the Pripyat River (Figure 1). The length of the Lan River is 147 km, the catchment area is 2190 km2, the average annual water flow at the mouth is about 11.3 m3/s [13]. The floodplain is 0.6–1 km wide and is crossed by irrigation canals. The riverbed is canalized. The depth range in the river is 1.5–2.5 m. The width of the channel is 4–8 m, in the lower reaches 15–20 m. Small slopes of the channel and wide floodplains create favorable conditions for the accumulation of river water during high water and summer flash floods, which leads to swamping in the surrounding areas, a dense network of irrigation canals and ditches [14]. The Loktyshi reservoir of the riverbed type was created on the river in 1977 for water supply of the Loktyshi fish farm. The bottom of the reservoir is flat, mostly muddy. Water level fluctuations throughout the year are up to 2 m. The area of the reservoir is 15.9 km2, length is 6 km, maximum depth is 4.9 m, maximum width is 4.2 km, water volume is 50.2 million m3, catchment area is 940 km2 [13]. The highest flood level is observed in April, the average height above the low-water level before river regulation is 1.5 m, and the highest is 1.9 m (1947) near the village of Loktyshi.
Time series of runoff (annual, maximum, minimum summer-autumn and minimum winter) of the Lan River were used as initial data from 2 gauging stations: Loktyshi with a catchment area A = 909 km2 and observation period from 1948 to 1977 and Mokrovo (A=2550 km2; 1975–2015). For comparability of the results obtained, a single calculation period from 1948 to 2015 lasting 68 years was adopted. The restoration of gaps in data series was carried out using the “Hydrolog” computer software package [15] with the involvement of analogue rivers.
The “Hydrolog” computer program was developed in 2009 on the basis of regulatory documents and methods used in hydrology, and software is constantly being improved to take into account modern requirements in the field of hydrological calculations. The program implements many functions, one of which is the extension of time series in the absence of observational data. For this purpose, up to 9 analogue rivers from the region under study are used in automatic or manual mode. The runoff correlation coefficient between the time series of the river under study and the analogue river is used as an indicator. The program displays an assessment of the calculation period and statistical information about analogue rivers, and implements a graphical representation of the hydrographs and the difference integral curve of the studied catchment. Next, to extend the time series of the river under study, one-, two-, or three-factor models are formed depending on the required values of the correlation coefficients and the ratio of the regression coefficients to their standard deviation. For extension models, it is possible to view the given statistical parameters of the original series (norm, dispersion, coefficients of variation, asymmetries and autocorrelation). Direct extension of the hydrological series under study is carried out using several regression equations in descending order of pair or multiple correlation coefficients. When extending, the main statistical parameters of the original and extended series are compared with the corresponding graphical representation. The “Hydrolog” software has been used in many organizations in Belarus and, during experimental testing, has shown very good results, including for solving the problem of extending hydrological series [15].
The method of hydrological-climatic calculations was adapted for forecast in runoff changes of the Lan River. The method is based on the joint solution of the equations of water and heat-energy balances [16]. An algorithm and a computer model that includes a standard equation for the water balance of a land area with an independent assessment of the main elements of the balance (precipitation, evapotranspiration and climatic runoff) on an annual basis have been developed. The adapted model was used to assess possible changes in river water resources depending on certain hypotheses of climate fluctuations and anthropogenic impacts on the characteristics of the catchment area.
The equation of the water balance of the river basin for a certain period of time is as follows:
where: YC(I) – the total climatic runoff [mm]; H(I) – the total humidification resources [mm]; Z(I) – the total evaporation [mm]; ΔW(I) – changes in moisture reserves of the active soil layer; I – averaging interval.
Total evaporation is calculated as follows:
where: – the maximum evaporation [mm]; – the smallest moisture content of the soil [mm]; – the relative humidity of soil at the beginning of the calculated period; X(I) – the amount of precipitation [mm]; g(I) – the groundwater component of the water balance [mm]; r(I) – the parameter that depends on the water-physical properties and mechanical composition of soil; n(I) – the parameter that takes into account physical and geographical conditions of runoff.
Relative soil moisture at the end of the calculation period is determined from the ratios
The obtained values are compared with the relative value of the total moisture capacity . If ≤, then the calculated value of the relative average humidity is taken, otherwise, = is taken into account for the calculation, the difference (-)· refers to surface runoff.
The amount of atmospheric precipitation in the months of the cold period, minus the amount of total evaporation, is transferred to the flood period, i.e. for the month of March.
The total moisture resources are determined as follows:
The solution of the system of equations (1)–(5) is carried out using the iteration method until the value of the relative humidity of the soil at the beginning of the calculation interval is equal to the value of the relative humidity at the end of the last interval. When calculating, the initial value of humidity is taken equal to the value of the lowest moisture capacity, i.e. , where .
Climate runoff is adjusted using coefficients that take into account the influence of various factors on the formation of riverbed runoff, i.e.
where: YR(I) – total riverbed runoff [mm]; k(I) – coefficient taking into account the hydrographic parameters of the catchment.
Modeling of the river water balance is implemented in the form of a computer program and is carried out in two stages. At the first stage, the model is calibrated taking into account the known components of the water-heat balance of the river under study. The goal of model tuning is to achieve the best possible conformity between measured and calculated runoff. The model parameters are varied for all possible values until a match is found between the two runoff types. The first stage ends with the construction of runoff graphs and the output of the modeling error (Figure 2). Good conformity between measured and calculated runoff indicates the validity of the model. The obtained model parameters then used to conduct a numerical experiment.
The second stage is a direct calculation of the water balance of the river under study, using the parameters obtained during model calibration. The calculation of the elements of the water balance of the river is carried out taking into account the specific features of the watershed under consideration and described in [17].
The simulation modeling technique have been tested on almost all the main climatic characteristics, which made it possible to attract an additional large amount of hydrometeorological information about possible variants of values and changes included in the balance equations of random variables.
The modeling results indicate a high accuracy of water balance calculations for both practical application and theoretical research, which has been tested on a large number of rivers in Belarus with a catchment area of about 1000 km2, where hydrometric observations are carried out. Thus, the created computer program in the presence of data on precipitation, air temperature, air humidity deficits for the calculation period and modern values of river runoff, as well as hydrographic characteristics of the watershed, allows one to obtain predictive estimates of the water balance of small rivers of the Belarusian Polesie for the estimated future [17,23].
To obtain forecast estimates of meteorological values, time series of observations were used for the period from 1986 (the beginning of the increase in average annual air temperatures) to 2015 with monthly increments. For this period, linear trends were constructed for monthly and annual values of atmospheric precipitation, air temperature and air humidity deficits, and the resulting parameters were used to obtain average monthly and annual values for the period until 2035. The procedure for assessing climatic parameters for the estimated future is presented in more detail in the work [18].
The field measurements were carried out to assess the impact of the Loktyshi fish farm on the Lan River runoff. To determine water flow rates of different probabilities in a separate section, it was necessary to solve two problems:
- arrange a temporary water metering section and measure the main parameters of the water flow;
- determine the water content of the year of the studied watercourse at the current time.
Based on the results of standard hydrometric measurements, the marks of characteristic points of the channel were determined, on the basis of which the transverse profile of the channel was constructed, and the cross-sectional area (ω) and wetted perimeter (χ) were calculated for different filling depths using the following formulas:
where: and – coordinates of the i-th point of the polygon under consideration (Figure 3); n – the number of points of the polygon.
The relationship between the cross-sectional area ω and the average depth hcp was calculated by specifying the depth increment Δh. The depth increment is taken depending on the severity of the bottom topography of the watercourse, but it is recommended to take the number of iterations , then . The dependence of the wetted perimeter χ and hydraulic radius R were determined similarly [19].
To determine the water content of the current year, an analogue river that has a long series of observations of the hydrological regime was selected. As a preliminary analysis has shown, the water content of the year with high approximation reliability (r>0.75) is determined by the months preceding the calculated one. Then the parameters of the distribution function (three-parameter gamma distribution) were determined.
Environmental runoff is the amount of water that must remain in the river to ensure the conditions for the existence of aquatic organisms while maintaining its required quality. In this case, floodplain ecosystems are preserved, and the river remains an element of the landscape. Thus, environmental runoff ensures the quantitative and qualitative state of the water body during the lowest water period of the year.
In general, the environmental (minimum permissible) runoff should take into account the following factors [19]:
1. the volume required for the normal development of aquatic organisms - in this case, it is necessary to maintain water flow velocity in the range of 0.25-0.6 m/s (0.25 m/s is the lower limit of the velocity regime at which the rapid development of phytoplankton begins) ;
2. the river performs its natural functions - the river network transports substances and energy, thus redistributing them in time and space;
3. intra-annual variability of flow - the presence of variability in river flow throughout the year supports the natural cycles in the development of various biological species;
4. variability of runoff over the years – fluctuations in runoff volumes over the years make it possible to enrich the floodplain part of the watercourse with nutrients.
In Belarus, the volume of the environmental runoff is taken as 75% of the minimum monthly flow of the 95% probability. But this approach does not fully comply with the above requirements, namely: it does not provide intra-annual variability of runoff, does not take into account long-term cycles of water content, and in most cases the minimum water flow velocity is not achieved.
Another method was used during research, which is based on increasing the probability and implying the identification of the lower and upper limits of the runoff changes occurring in a real river. The essence of the method is to set the lower limit of environmental runoff at the level of monthly flow rates for the year of 99% probability, since these conditions are limiting from the point of view of environmental management. The determination of the parameters of the environmental runoff distribution function is based on the transfer of the probability of the average annual runoff to the predetermined probability of the environmental runoff. Namely, it is assumed that the environmental runoff of 95% of probability corresponds to the average annual runoff of 99% probability, and the environmental runoff of 25% probability is assumed to be equal to the runoff of 50% probability. Having two points on the distribution function curve of a random variable, you can select its parameters. In the conditions of Belarus, where the compilation of the water balance is aimed mainly at small or medium-sized rivers, the most effective way to determine the environmental runoff is the method of increasing the supply [20].
3. Results and Discussion
At the first stage of research, a procedure was carried out to bring hydrological series to a single calculation period from 1948 to 2015. Table 1 shows the main hydrological parameters of annual runoff, as well as the annual runoff of the different probabilities, determined using a three-parameter gamma probability distribution for two periods: directly from measured data and from representative period (68 years) for 2 gauging stations of the Lan River.
Figure 4 shows the long-term course of annual runoff for 2 gauging stations of the Lan River.
There was a tendency towards an increase in annual runoff along the Loktyshi and Mokrovo gauging stations by about 0.2 m3/s for 10 years. That was largely due to amelioration of the second half of the last century [21]. For the maximum runoff throughout the river, there was a significant decrease in the maximum runoff due to natural factors (everywhere in Belarus there was a decrease in the maximum spring flood runoff [22]) and the accumulation of part of the spring flood runoff by the Loktyshi reservoir. The general trend of changes in the minimum runoff on the territory of Belarus was a widespread increase in winter runoff caused by modern climatic warming in the cold period, as a result of frequent thaws and an increase in runoff; summer runoff has not changed with the exception of the Belarusian Polesie, where there has been a slight increase in runoff caused by large-scale amelioration [23]. Fluctuations in the minimum runoff at the Loktyshi and Mokrovo gauging stations, both in summer-autumn and in winter, are determined by the operating regime of the reservoir and are predictable.
To assess the influence of anthropogenic impacts and natural factors on runoff, the original time series of runoff were analyzed for various averaging intervals: from 1948 to 2015 (the entire observation period, 68 years); from 1948 to 1977 (period before the commissioning of the Loktyshi reservoir, 30 years); from 1978 to 2015 (period of operation of the Loktyshi reservoir and the Loktyshi fish farm, 38 years). Table 2 presents sample estimates of the main statistical parameters of the considered runoff time series for various averaging periods.
Empirical supply curves for all averaging periods correspond to a three-parameter gamma distribution, and the ratio of the asymmetry coefficient (Cs) to the coefficient of variation (Cv), as a rule, does not exceed Cs=3Cv. Since the runoff probability distribution function for such parameter estimates differs slightly from the normal distribution function, the use of parametric criteria for testing statistical hypotheses can be considered acceptable. Histograms constructed for the water flow rates under consideration indicate that the distribution is close to normal. Then the stability of sample statistics (averages and coefficients of variation) for the averaging periods 1948–1977 and 1978–2015 (assessment of the influence of the reservoir) in relation was analyzed. Table 3 shows the matrix of the Student and Fisher statistical tests for the considered types of the Lan River runoff.
Joint analysis of the Table 2 and Table 3 allowed considering runoff changes of the Lan River caused by the construction of the Loktyshi reservoir by comparing the changes that occurred with runoff for the periods 1948–1977 and 1978–2015. Over the periods under review, the runoff Loktyshi gauging station it increased by 0.74 m3/s, and at the Mokrovo gauging station there occurred no statistically significant changes. The analysis of variances has shown changes in the structure of fluctuations in the average annual runoff of the river as the F-criteria values did not exceed critical values. The maximum runoff decreased significantly by 30.6 and 32.7 m3/s respectively, while the nature of the oscillations also changed, and the amplitude of the oscillations significantly decreased. That was mostly caused by the filling of the reservoir during this period and frequent winter thaws [21]. The minimum summer-autumn river runoff increased only at the Loktyshi station (0.81 m3/s), which is statistically significant and caused by the influence of the reservoir; at the other stations some statistically insignificant increase in runoff was observed. The nature of fluctuations in the minimum summer-autumn runoff judging by the F-criteria has not undergone significant changes. The minimum winter runoff increased everywhere, respectively by 0.61 and 1.26 m3/s; and in all cases statistically significant. That was as a result of winter thaws above the reservoir and below an anthropogenic factor was added in the form of water releases from the reservoir. In addition, the nature of fluctuations in the minimum winter runoff has also changed, except at the Loktyshi gauging station. Thus, testing the hypothesis about the homogeneity of the considered parameters of annual, maximum, minimum summer-autumn and minimum winter runoff for periods with different averaging intervals was based on the use of the Student and Fisher criteria; and as the analysis showed the differences in the parameters are significant for some segments and can be recognized statistically reliable.
Runoff changes of the Lan River for 2 gauging stations under consideration were assessed using linear gradients numerically equal to the product of the regression coefficient of linear trends (α) by 10 years. The gradient characterizes the change in water flow in m3/s by 10 years. The values of runoff gradients and their significance using correlation coefficients are given in Table 4.
For the entire period under consideration (1948–2015), a statistically significant linear gradient occurred for average annual runoff at the Loktyshi gauging station – positive (0.19 m3/s by 10 years). At all gauging stations the gradients of maximum runoff are negative and statistically significant and amount to -8.13 and -7.76 m3/s by 10 years, respectively. It caused by the effect of anthropogenic factor (the filling of the reservoir) and natural factor (modern climate warming). For the minimum runoff a statistically significant positive gradient was observed in the summer-autumn period at the Loktyshi gauging station and amounted to 0.218 m3/s by 10 years; in the winter a runoff increase was observed at all gauging stations and amounted 0.182 and 0.513 m3/s by 10 years, respectively, and it is typical for the entire territory of Belarus [23]. For the period 1948–1977 an increase in annual runoff was observed at the Mokrovo gauging station (1.62 m3/s by 10 years). No significant changes have been established in the maximum runoff at all gauging stations, although there was some tendency towards a decrease in runoff. The minimum runoff, both summer-autumn and winter, increased statistically significantly only at the Loktyshi gauging station and amounted to 0.413 and 0.395 m3/s by 10 years, respectively. Between 1978 and 2015 (the operating time of the reservoir) the prevailing trend was a decrease in runoff. The maximum and minimum summer-autumn runoff at the Mokrovo gauging station decreased statistically significantly -7.96 and -0.501 m3/s by 10 years, respectively. Thus, statistical heterogeneity was established, i.e. in the Lan River basin there was intensive economic activity that significantly disrupts the natural hydrological regime.
Trends in climate fluctuations at the global and regional levels are confirmed by: an increase in global air temperature at the earth's surface, a decrease in the area of sea ice in the Arctic basin and snow cover on land, and an increase in the average sea level. According to research by leading climatologists, the change in global temperature in the 20th – early 21st centuries is characterized by general warming, which on average on Earth amounted to 0.75 ºС. During this time, the intra-annual structure of atmospheric precipitation has changed significantly. Monthly precipitation values in April-May and, especially, in August decreased by approximately 20%. Trends in long-term fluctuations in air temperature extremeness indices are consistent with the fact of global warming, when annual minimums and maximums increase, and the range between them decreases (the minimums increase faster than the maximums), and the number of days with frost decreases. Table 5 presents modeling of changes in meteorological characteristics in the territory of Belarusian Polesie until 2035, which was carried out on the basis of an archive of meteorological data using the CMIP5 multi-model ensemble of four scenarios (RCP8.5, RCP6.0, RCP4.5, RCP2.6) [23,24].
Using the considered methodology, we made forecast estimates for the Lan River at the Mokrovo gauging station for the future until 2035. Due to the significant anthropogenic impact on the Lan River runoff, model adjustment was carried out along the river analogue of the Tsna river at the Detlovichi gauging station. The rivers are located in close proximity to each other and have very similar geomorphological characteristics and climatic conditions. Figure 5 presents current and forecast values of river runoff for ensemble of four climate scenarios (RCP8.5, RCP6.0, RCP4.5, RCP2.6).
Table 6 shows the results of modeling forecast estimates of changes in the average long-term runoff of the Lan River for 2035 year.
As can be seen from Table 6, significant changes in runoff will not occur, since the forecast climate parameters have not changed significantly. A slight decrease in runoff is predicted, caused by additional evaporation from the water surface of the reservoir, due to an increase in air temperatures, and there will be a slight shift in the peak of the spring flood to the month of March [23].
To quantitatively assess the impact of the Loktyshi fish farm on the runoff of the Lan River, we carried out hydrometric measurements of water flow in sections above and below the fish farm in June, 2021 (Figure 6).
The upper section was located at a distance of 0.5 km east of the Nach village. The river bed along the section was straight. Its width was 28 meters. The shores within the section were sandy and covered predominantly with shrub and grass vegetation. The left bank was flat, while the right bank was steeper, about 1-2 meters high and filled with sandy rocks. Within the channel there was a small amount of aquatic vegetation that did not have a significant effect on the flow (Figure 7).
Based on the results of depth measurements in the upper section, a transverse profile of the Lan River was constructed and the main parameters were determined: water flow Q=1.19 m3/s; cross-sectional area F=36.72 m2; width of the river at the water's edge B=28.3 m; average flow depth hav=1.30 m; average water flow velocity Vav=0.03 m/s; maximum velocity Vmax=0.08 m/s.
The lower section is located 1.5 km northeast of the Budcha village. Within the section, the river had a straight channel within 10 meters. The banks had a significant slope. The coastline was peaty and covered with dense herbaceous vegetation, with shrubs found in places. There were also trees within the floodplain. The river bottom was sandy and muddy near the banks (Figure 8).
The main river flow parameters at the time of survey were determined: water flow Q=0.62 m3/s; cross-sectional area F=4.73 m2; width of the river at the water's edge B=8.6 m; average flow depth hav=0.55 m; average water flow velocity Vav=0.13 m/s; maximum velocity Vmax=0.15 m/s.
A comparative analysis of the studied sections showed their significant differences. Among the quantitative parameters, noteworthy is the decrease in water flow in the lower section ΔQ=-0.57 m3/s. This was caused by additional evaporation of water from the surface of the reservoir and fish ponds, as well as by the regulation of water discharge flows from the reservoir. The upper section is backed up by the Loktyshi reservoir, which caused an increase in the cross-sectional area by ΔF=31.99 m2 and the river width ΔB=19.7 m compared to the lower section. This led to an increase in the water flow velocity in the lower section, the average at ΔVav=0.10 m/s and the maximum at ΔVmax=0.07 m/s.
Based on the results of processing data from hydrometric measurements, mathematical models (discharges/levels/velocities) and curves for the relationship between velocity/discharge and water level at the Lan River sections were obtained using the method of [25]. As a special feature, it should be noted that the use of coupling curves is only permissible within the specified range. The use of extrapolation is acceptable, but can lead to significant deviations and errors.
For the upper section:
For the lower section:
Using the results obtained, an analysis of the hydrological parameters of the Lan River was carried out in the section of the river below the Loktyshi fish farm. Data on the quantitative parameters of the Lan River runoff by months and year are presented in Table 7.
Table 8 shows the results of calculating the minimum average monthly water flows of the 95% probability taking into account the intra-annual distribution of flow.
Taking into account the results of field studies and using the method of increasing the probabilities, the environmental runoff of the Lan River was determined taking into account the intra-annual distribution of runoff for various probabilities (Table 9).
The data obtained when calculating the environmental runoff made it possible to determine the values of permissible withdrawal of surface water from the river, taking into account losses due to evaporation from the water surface and filtration from reservoir. The calculation results, provided that the environmental runoff in the river is maintained, taking into account the intra-annual distribution for various probabilities are given in Table 10.
Table 10 shows the possibility of permissible withdrawal of surface water from the Lan River from 7.04 million m3 for environmental runoff of 95% probability to 23.19 million m3 for environmental runoff of 5% probability per year. The maximum permissible withdrawal of surface water from the river, taking into account the preservation of the lowest critical value of environmental runoff, cannot exceed 35.85 million m3. The largest withdrawal from the Lan River is permissible in the spring - in total from 3.05 million m3 (runoff of 95% probability) to 9.46 million m3 (runoff of 5% probability). From June to August withdrawal is not permissible, since the runoff in the river in the summer months corresponds environmental runoff, especially for 50% probability and higher.
4. Conclusions
A comprehensive analysis of hydrometric information on the of the Lan River runoff at the Loktyshi and Mokrovo gauging stations for the period from 1948 to 2015 was carried out. An increase in the average annual runoff at the Loktyshi station was established. In terms of maximum runoff, a decrease was observed at the both considered gauging stations. An increase in the minimum summer-autumn runoff was observed at the Loktyshi gauging station; a minimal winter runoff increase was observed in all areas.
Based on the runoff time series analysis, a hydrological-climatic hypothesis, and the CMIP5 multi-model ensemble of four scenarios (RCP8.5, RCP6.0, RCP4.5, RCP2.6) the modeling of changes in the Lan River runoff until 2035 was carried out. The obtained results contain a slight decrease in runoff and shift in the maximum spring runoff to earlier dates.
An assessment of the impact of the Loktyshi fish farm on the hydrological regime of the Lan River was also carried out to improve the efficiency of water resource management. First, field measurements were carried out at sections above and below the fish farm and, based on transverse profiles, hydrological parameters were calculated. Second, mathematical models have been developed that make it possible to determine water flow rates depending on the average depth of water in the section. Next, hydrological calculations were performed to determine the minimum average monthly water flow rate of 95% probability and environmental runoff, taking into account the intra-annual distribution of runoff. Finally, the values of permissible withdrawal of surface water from the river for the needs of the Loktyshi fish farm were determined.
The results obtained are relevant for the short term (10 years); however, they may require some adjustments in the future due to predicted climate changes. Forecast estimates in the runoff changes of the Lan River for the period up to 2035 are characterized by a slight change in runoff on average per year, but there is a high probability of its unevenness and directionality across seasons and months. Runoff can change especially significantly during the summer months. Increased unevenness of intra-annual runoff distribution and increased flood risks caused by sharp thaws in winter, earlier onset of spring floods and increased intensity of rain floods can lead to increased risks of extreme events, including the occurrence of low-water periods, and the likelihood of the occurrence of long-term low-water periods increases. During low-water periods, there may be a significant decrease in the flow of small rivers, deterioration of the ecological condition and recreational potential of rivers and adjacent territories, changes in the hydrogeological regime of groundwater, depletion of soil cover in the floodplain, etc. The established great influence of the Loktyshi Reservoir and the Loktyshi fish farm on the volume and regime of the Lan River runoff requires strict adherence to scientifically based regimes for managing the water regime of the reservoir.
Author Contributions
Conceptualization, A.V. and I.K.; methodology, A.V. and S.S.; software, S.P.; validation, A.V. and S.P.; formal analysis, S.S.; investigation, A.V.; resources, I.K.; data curation, A.V.; writing—original draft preparation, A.V.; writing—review and editing, S.P.; visualization, S.S.; supervision, A.V.; project administration, S.P.; funding acquisition, I.K. All authors have read and agreed to the published version of the manuscript.
Funding
This research received no external funding.
Data Availability Statement
The datasets used in this study are available in: Institute of Meteorology and Water Management—National Research Institute and Belhydromet.
Conflicts of Interest
The authors declare no conflicts of interest.
References
- Czaja, S.; Machowski, R.; Rzetala, M. Floods in the Upper Part of Vistula and Odra River Basins in the 19th and 20th Centuries. Chemistry-Didactics-Ecology-Metrology 2014, 19, 127–134. [Google Scholar] [CrossRef]
- IPCC Climate Change 2021: The Physical Science Basis Contribution of Working Group I to the Sixth Assessment Report of the Intergovernmental Panel on Climate Change Technical report.
- Stagl, J.; Hattermann, F. Impacts of climate change on the hydrological regime of the Danube River and its tributaries using an ensemble of climate scenarios. Water 2015, 7, 6139–6172. [Google Scholar] [CrossRef]
- Tomaszewski, E. Impact of Lake Gopło on low-flow regime of the upper Noteć River. Limnol. Rev. 2016, 16, 95–103. [Google Scholar] [CrossRef]
- Brönnimann, S.; Stucki, P.; Franke, J.; Valler, V.; Brugnara, Y.; Hand, R.; Slivinski, L.C.; Compo, G.P.; Sardeshmukh, P.D.; Lang, M.; Schaefli, B. Influence of warming and atmospheric circulation changes on multidecadal European flood variability. Climate of the Past 2022, 18, 919–933. [Google Scholar] [CrossRef]
- Tuel, A.; Schaefli, B.; Zscheischler, J.; Martius, O. On the links between sub-seasonal clustering of extreme precipitation and high discharge in Switzerland and Europe. Hydrology and Earth System Sciences 2022, 26, 2649–2669. [Google Scholar] [CrossRef]
- Gudmundsson, L.; Boulange, J.; Do, H.X.; Gosling, S.N.; Grillakis, M.G.; Koutroulis, A.G.; Leonard, M.; Liu, J.; et al. Globally observed trends in mean and extreme river flow attributed to climate change. Science 2021, 371, 1159–1162. [Google Scholar] [CrossRef] [PubMed]
- Tomaszewski, E. River Minimum Flow Changes under Dammed Reservoir Conditions. Limnol. Rev. 2021, 21, 63–71. [Google Scholar] [CrossRef]
- Ashour, A.; Tawab, E.; Abu-Zaid, S.; AbdAllah, A. A comparative technical study for estimating seeped water from irrigation canals in the Middle Egypt (Case study: El-Sont branch canal network). Ain Shams Eng. J. 2023, 14, 101875. [Google Scholar] [CrossRef]
- Sang, Y.F.; Wang, D.; Wu, J.C.; Zhu, Q.P.; Wang, L. Human impacts on runoff regime of middle and lower Yellow River. Water Sci. Eng. 2011, 4, 36–45. [Google Scholar]
- Sobczyński, T.; Niedzielski, P. The influence of urban agglomeration on a small natural water reservoir. Limnol. Rev. 2018, 18, 39–44. [Google Scholar] [CrossRef]
- Kirvel, I.; Volchak, A.; Parfomuk, S.; Kirvel, P. Environmental risks of water resources in the Belarusian Polesie. Limnol. Rev. 2023, 23, 21–32. [Google Scholar] [CrossRef]
- Tareeý, U.; Terentyeý, U. Blakitny skarb Belarusi: Reki, azyory, vadaskhovishchy, turyscki patencyyal vodnyh ab’ektaý (Blue treasure of Belarus: rivers, lakes, reservoirs, tourist potential of water objects); BelEn: Minsk, Belarus, 2007; 480p. (In Russian) [Google Scholar]
- Pashkov, G.; et al. Belaruskaya encyklapedyya (Belarusian encyclopedia); BelEn: Minsk, Belarus, 2002; vol.15, 552p. (In Russian) [Google Scholar]
- Volchek, A.; Parfomuk, S. Paket prikladnyh programm dlya opredeleniya raschetnyh harakteristik rechnogo stoka (Application package for determining the calculated characteristics of river flow). Vesnik Paleskaga dzhzyarzhaýnaga universiteta. Seryya pryrodaznaýchyh navuk 2009, 1, 22–30. (In Russian) [Google Scholar]
- Mezentsev, V.; Belonenko, G.; Karnatsevich, I.; Loskutov, V. Gidrologicheskiye raschety v meliorativnykh tselyakh (Hydrological calculations for land reclamation purposes); Izdat. Omsk: Omsk, Russia, 1980; 84p. (In Russian) [Google Scholar]
- Volchek, A.; Parfomuk, S. Ocenka transformacii vodnogo rezhima malykh rek Belorusskogo Polesia pod vozdeistvem prirodnykh i antropogennykh faktorov (na primere r. Jaselda) (Evaluation of water regime transformation in minor rivers of Belarusian Polesye under the influence of natural and anthropogenic factors based on the example of the Yaselda River). Vodn. Khozaistvo Ross. 2007, 1, 50–62. (In Russian) [Google Scholar]
- Korneev, V.; Volchak, A.; Hertman, L. The Strategic Framework for Adaptation to Climate Change in the Neman River Basin; United Nations Development Programme in Belarus and United Nations Economic Commission for Europe: Brest, Belarus, 2015; 64p. [Google Scholar]
- Volchak, A.; Parfomuk, S.; Sheshko, N.; Shpendik, N.; Dashkevich, D.; Sidak, S.; Kukharevich, M. Аssessment of the Krasnaya Sloboda fish farm impact on the Moroch River runoff. Vestnik of Brest State Technical University 2022, 3, 52–57. [Google Scholar]
- Volchak, A.; Parfomuk, S.; Sheshko, N.; Shpendik, N.; Dashkevich, D.; Sidak, S.; Kukharevich, M. Ocenka vliyaniya rybhoza Selec na stok reki YAsel'da (Assessment of the impact of the Selets fish farm on the flow of the Yaselda River). Vestnik of Brest State Technical University 2022, 1, 86–96. (in Russian). [Google Scholar]
- Loginov, V.; Volchek, A. Vodnyj balans rechnyh vodosborov Belarusi (Water balance of river catchments in Belarus); Tonpic: Minsk, Belarus, 2006; 160p. (In Russian) [Google Scholar]
- Volchek, A.; Volchek, A. Polovod'ya na rekah Belarusi: zakonomernosti formirovaniya i prognoz (Floods on the rivers of Belarus: patterns of formation and forecast); LAP LAMBERT Academic Publishing GmbH & Co. KG: Saarbrucken, 2012; 216p. (In Russian) [Google Scholar]
- Volchek, A.; Korneev, V.; Parfomuk, S.; Bulak, I.A. Vodnye resurcy Belarusi ih prognoz s uchetom bzmenenija klimata (Water resources of Belarus and their forecast taking into account climate change); Alternativa: Brest, Belarus, 2017; 228p. (in Russian) [Google Scholar]
- Zhan, W.; He, X.; Sheffield, J. Wood, E.F. Projected seasonal changes in large-scale global precipitation and temperature extremes based on the CMIP5 ensemble. Journal of Climate 2020, 33, 5651–5671. [Google Scholar] [CrossRef]
- Volchak, A.; et al. Uchebnaya gidrometricheskaya praktika (Educational hydrometric practice); RIVSH: Minsk, Belarus, 2020; 260p. (in Russian) [Google Scholar]
Figure 1.
The map of the study area.
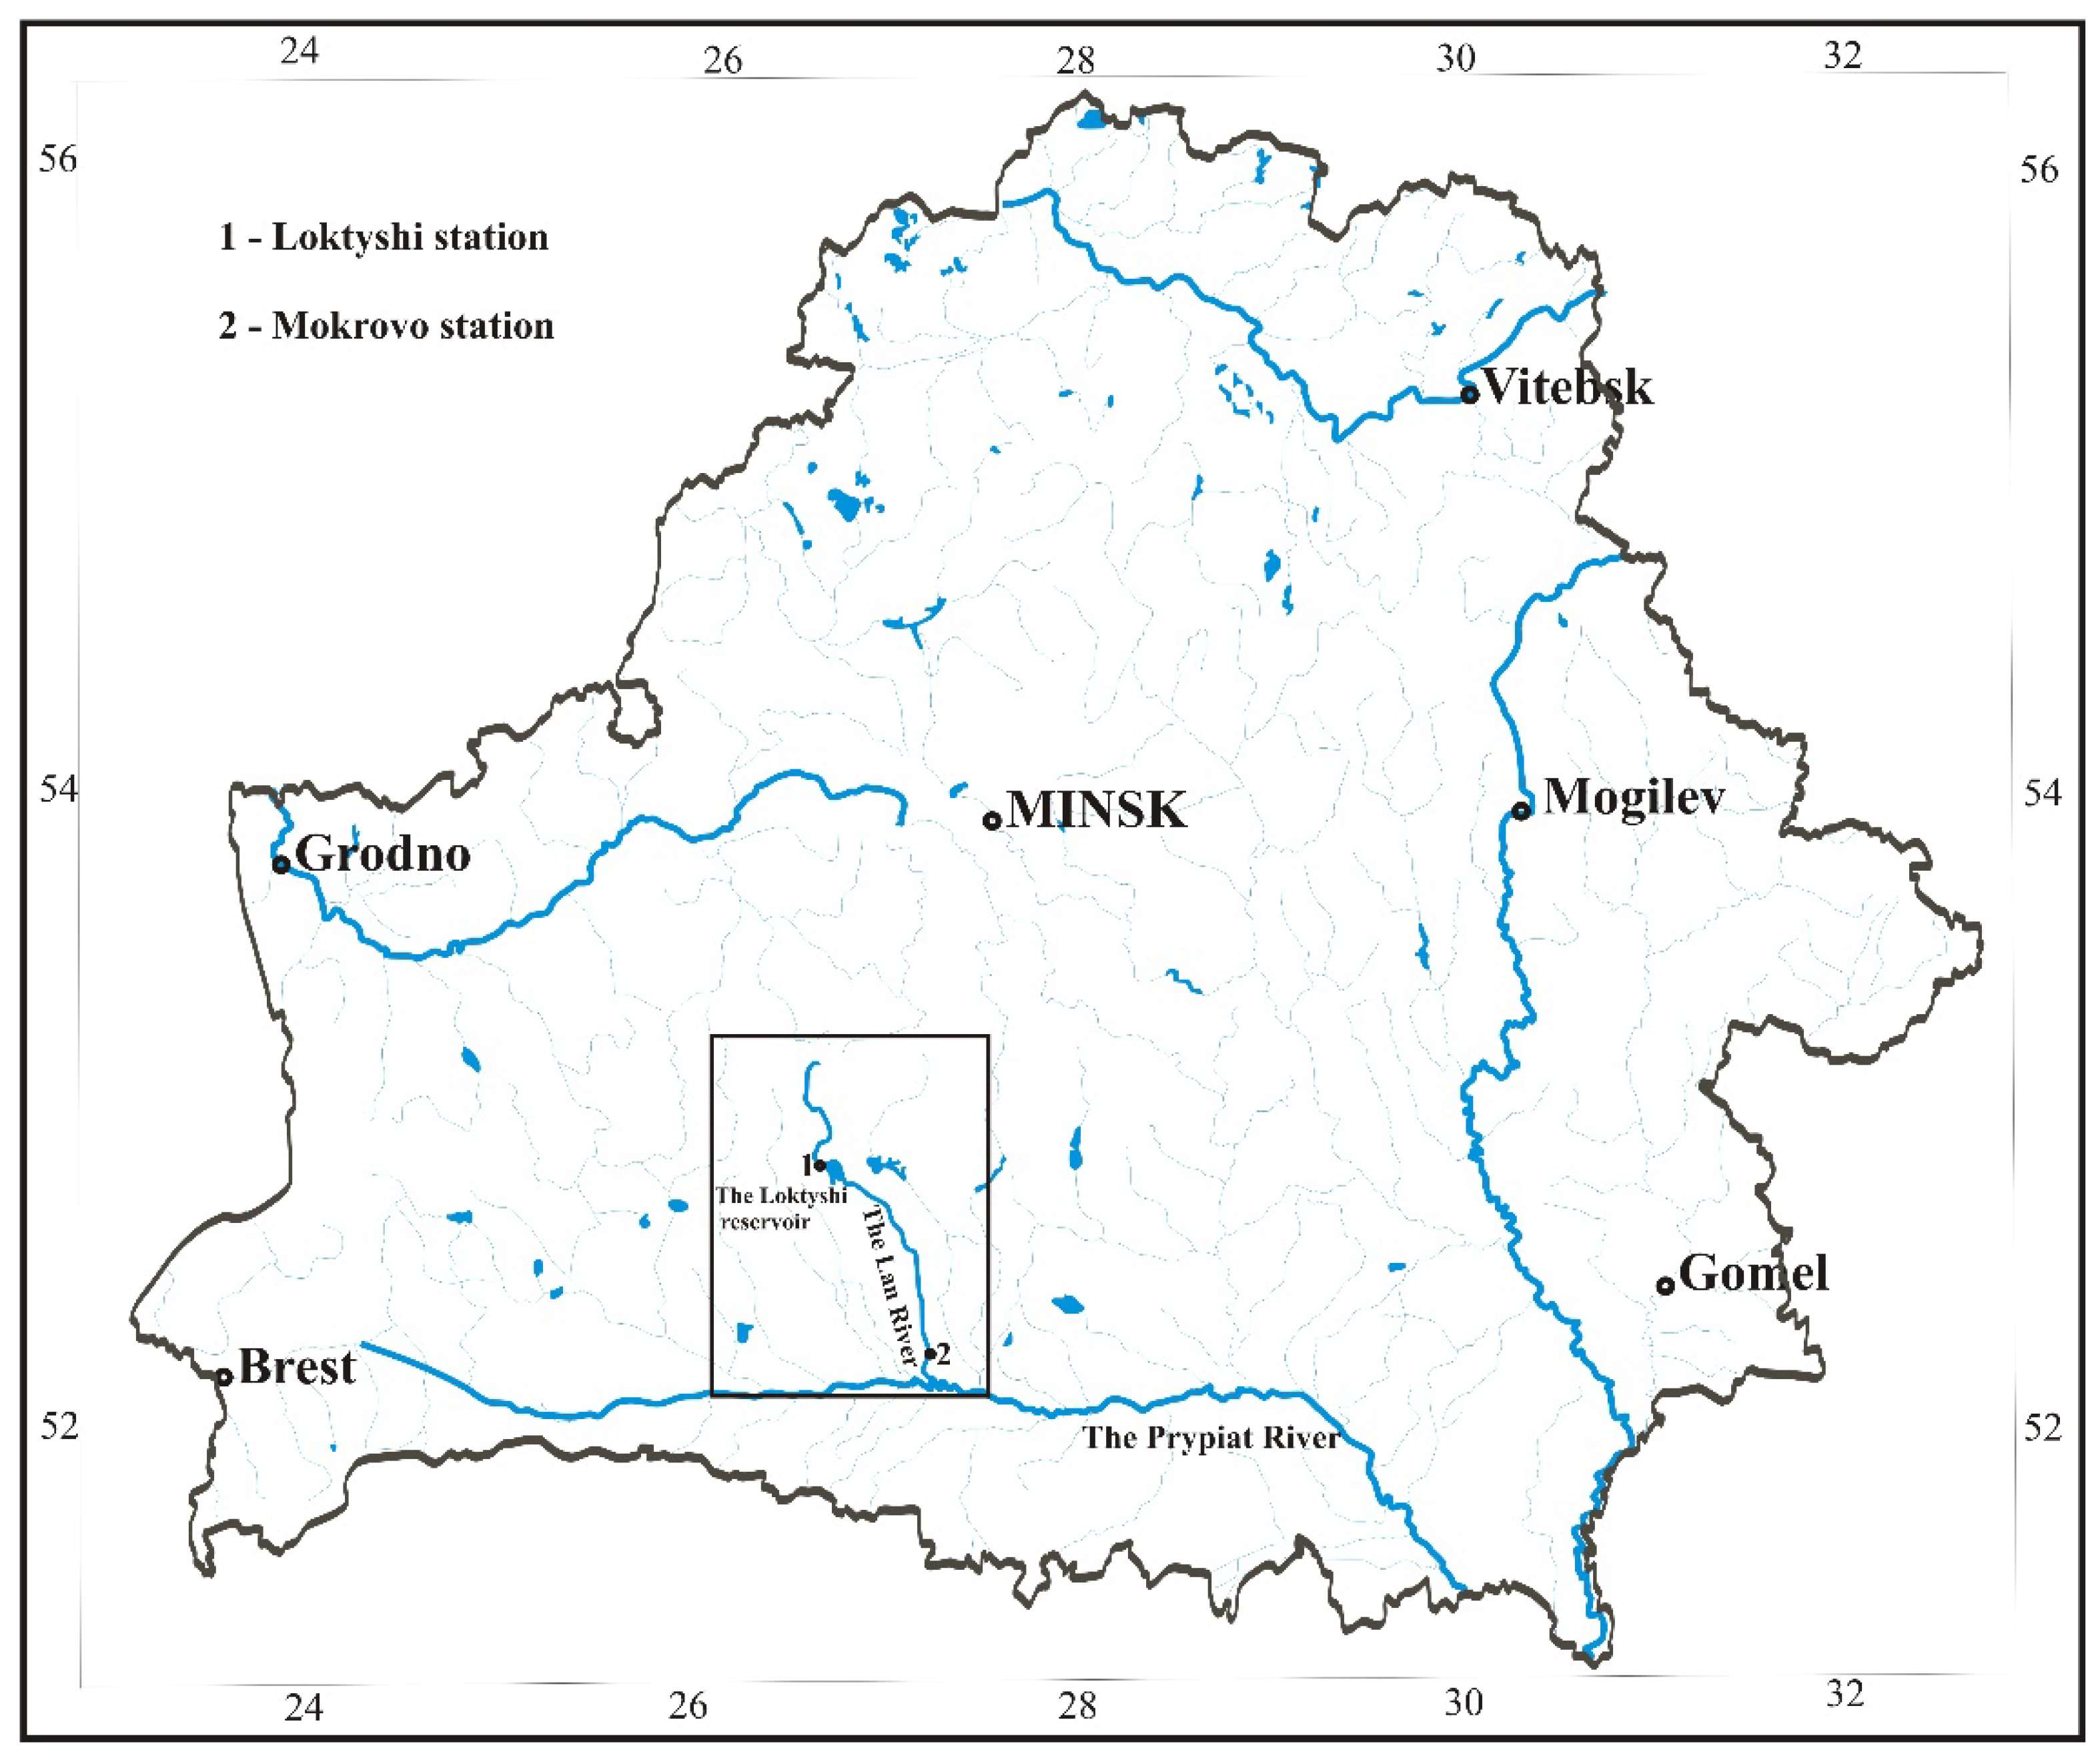
Figure 2.
Measured (------) and calculated (- - -) runoff during model calibration.

Figure 3.
Scheme of numerical processing of measurement data.
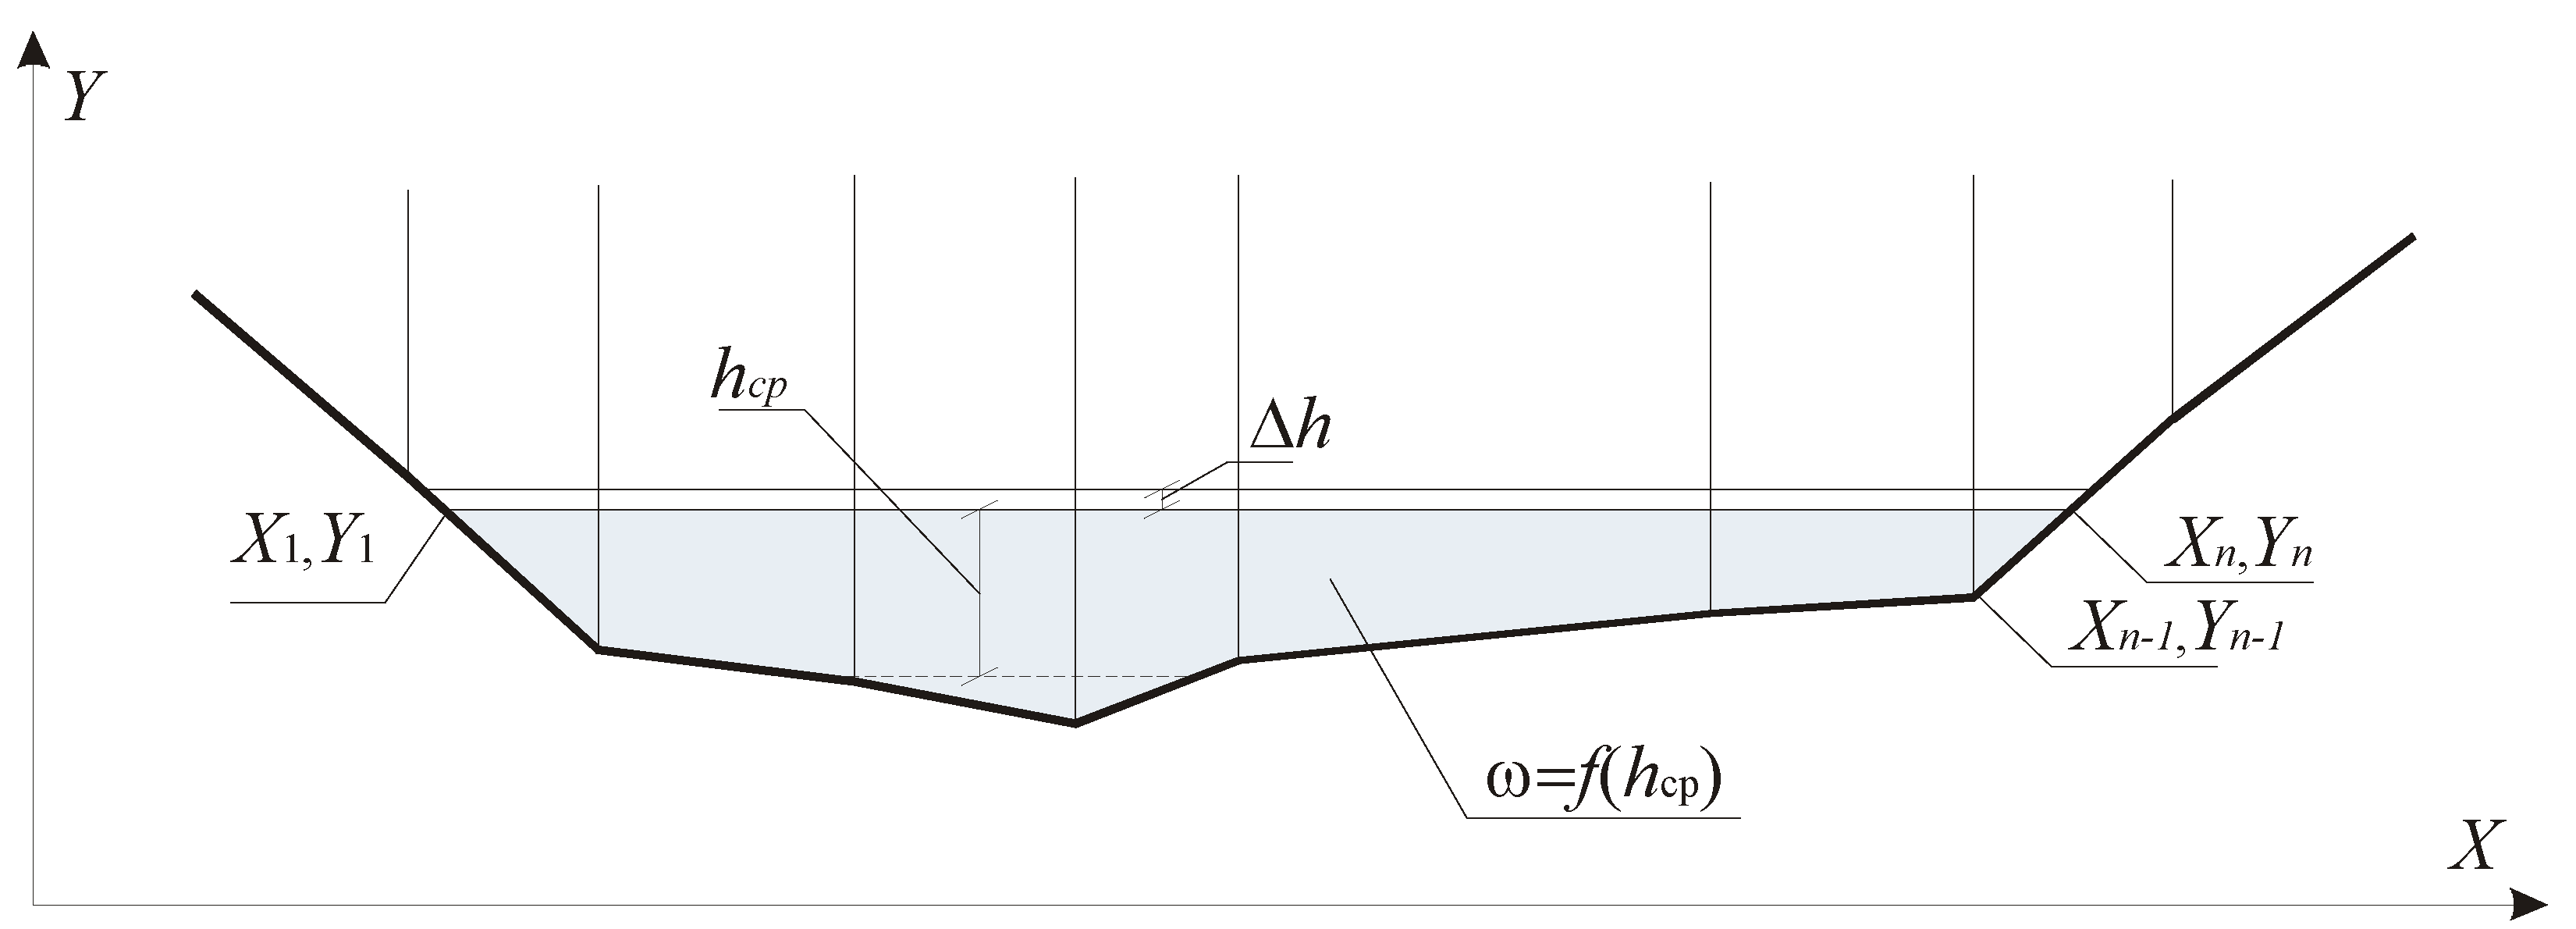
Figure 4.
The long-term courses of annual runoff of the Lan River and trends showed by straight lines for each gauging station.
Figure 4.
The long-term courses of annual runoff of the Lan River and trends showed by straight lines for each gauging station.

Figure 5.
Modern and forecast hydrographs of the Lan River runoff at the Mokrovo gauging station.
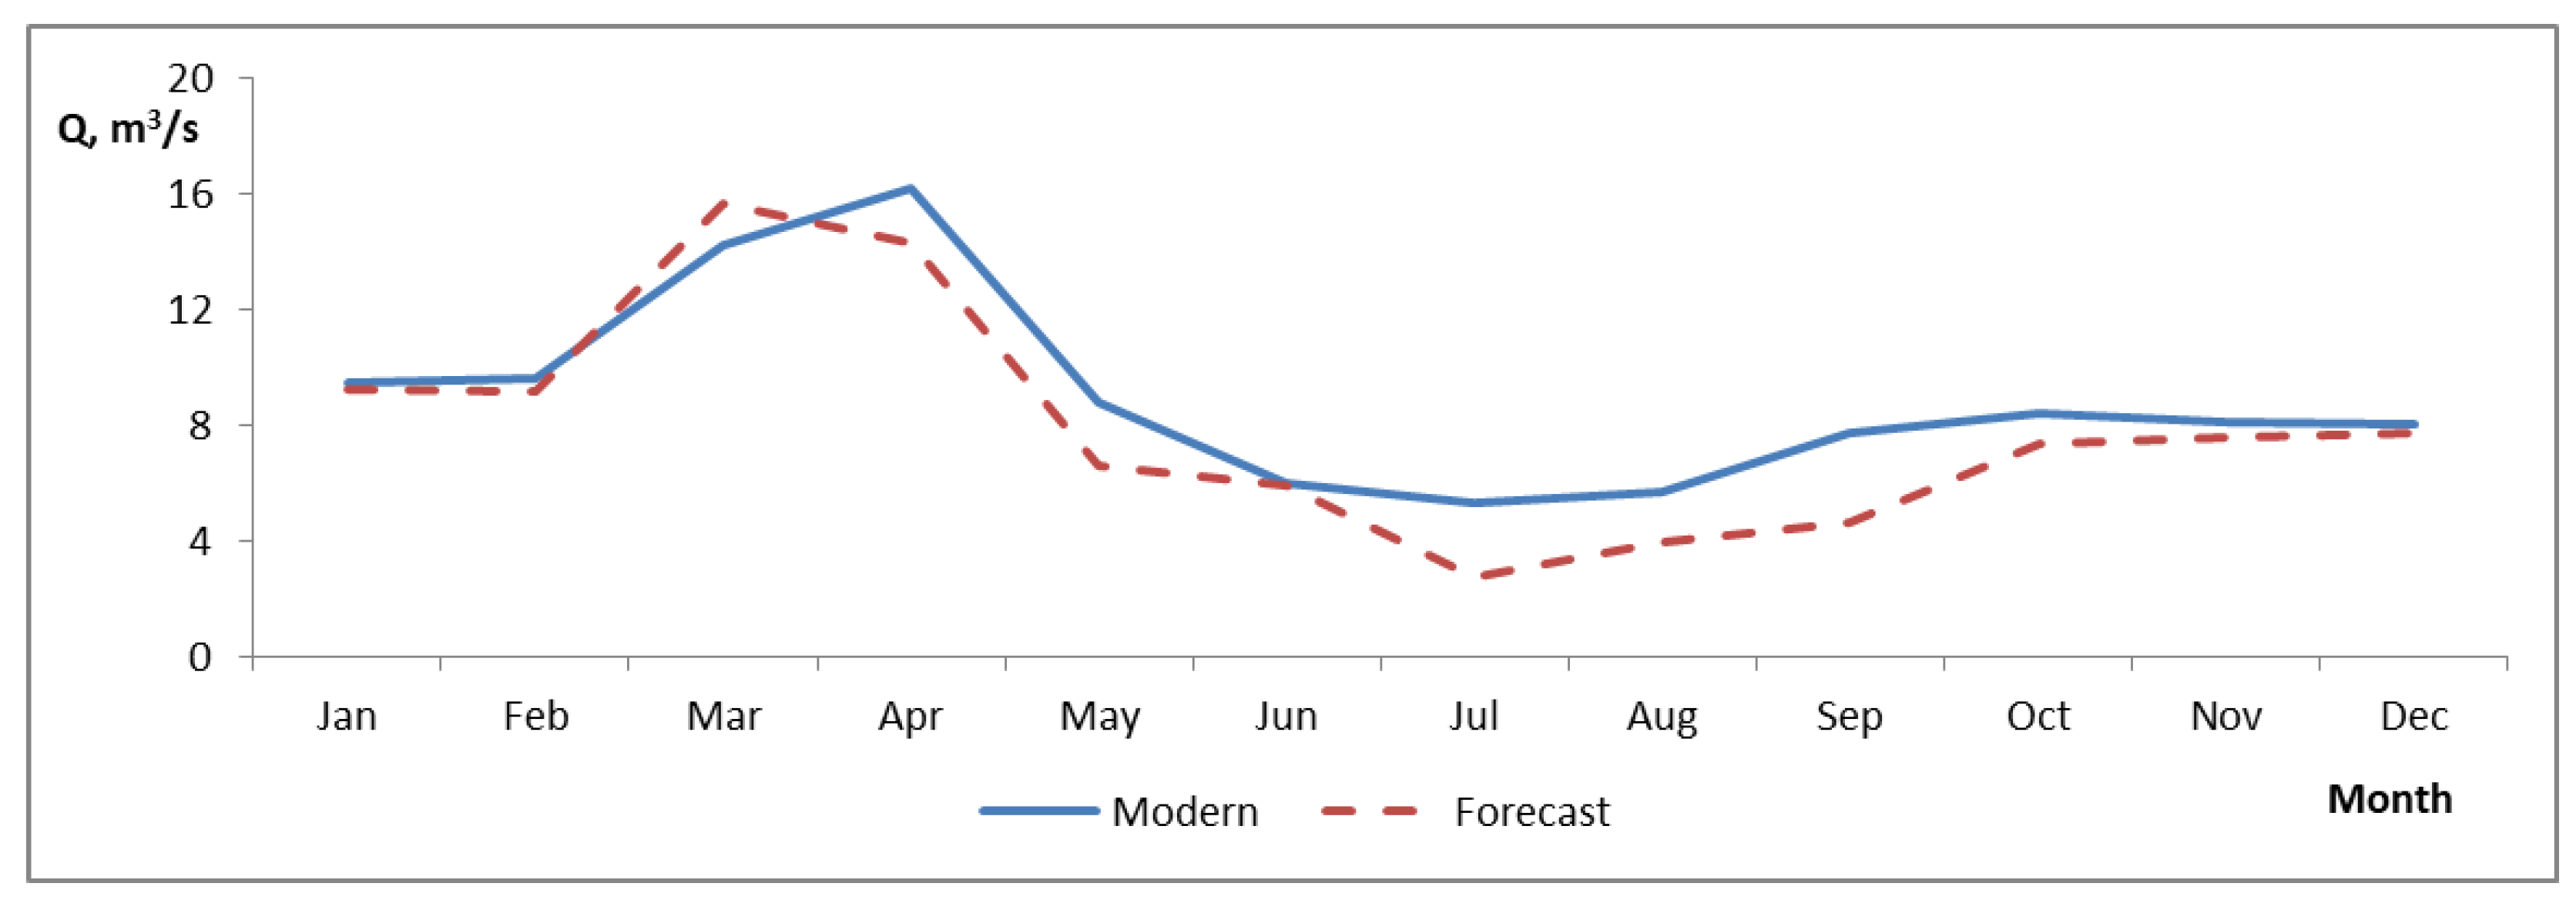
Figure 6.
Map of hydrometric measurements of water flow in upper and lower sections.

Figure 7.
Study area of the Lan River in the upper section.
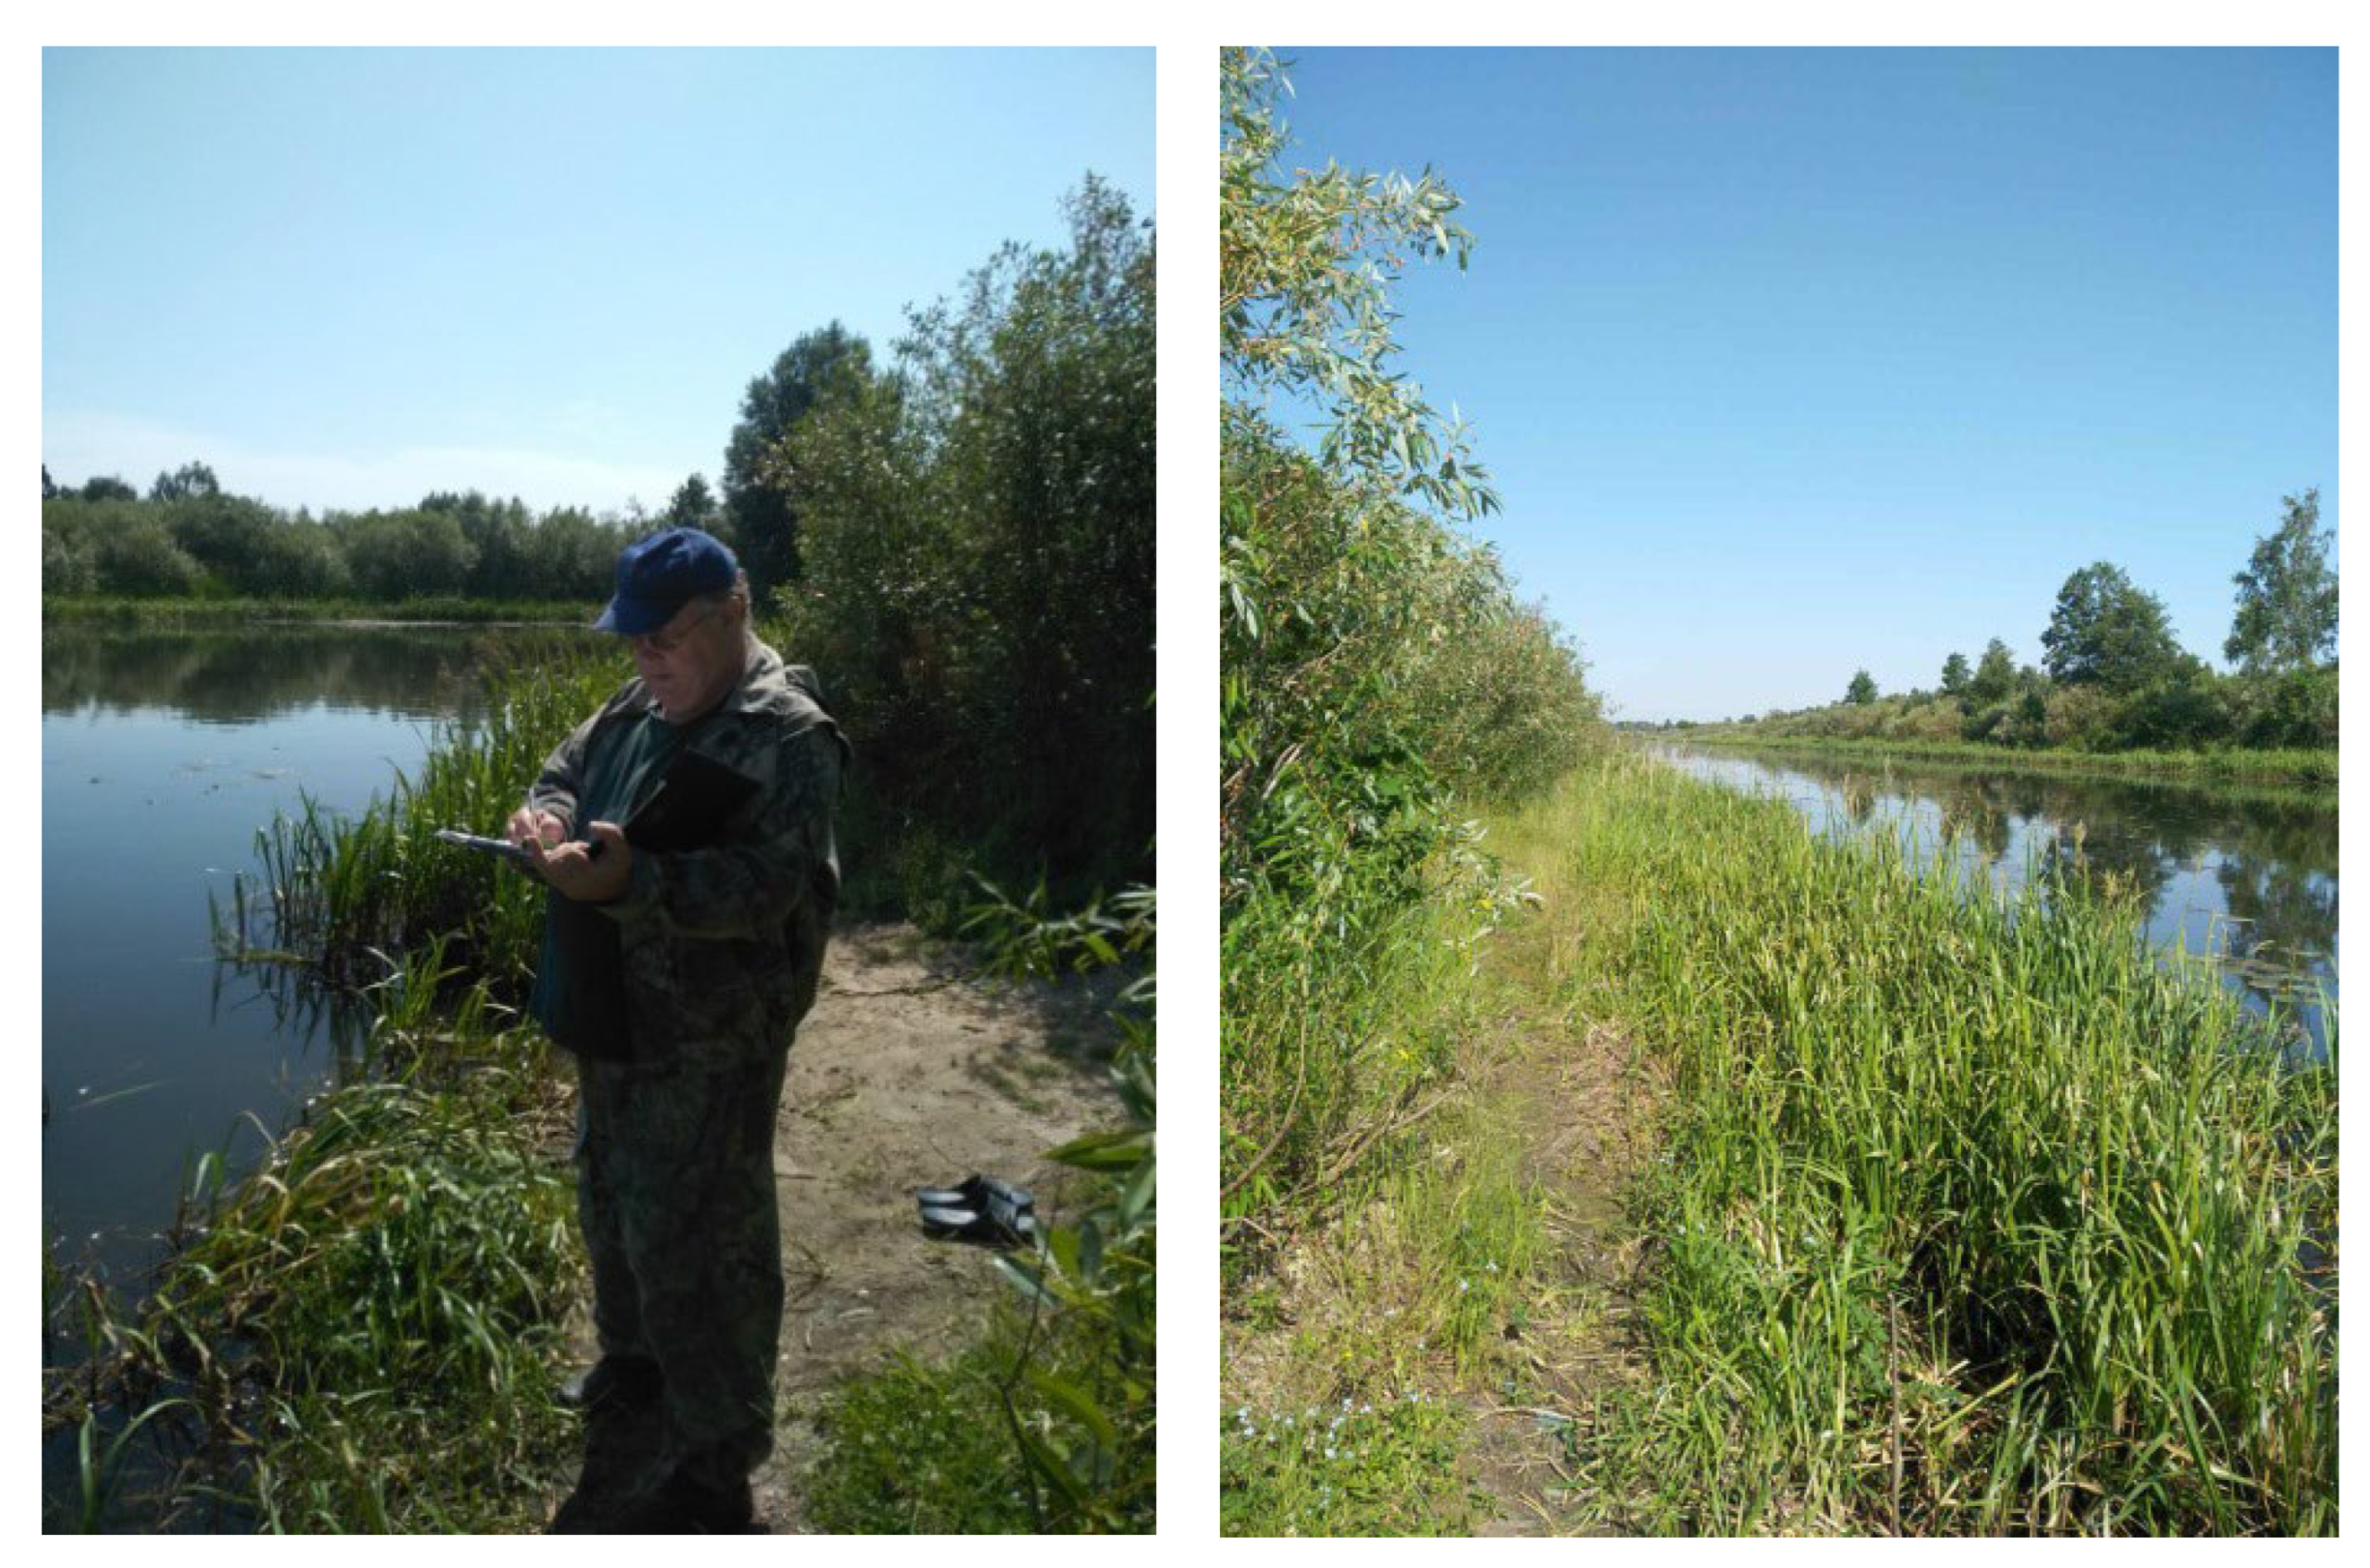
Figure 8.
Study area of the Lan River in the lower section.


Table 1.
Statistical parameters and annual runoff of the Lan River for 2 periods.
| Parameter | Gauging station | ||
|---|---|---|---|
| Loktyshi (А=909 km2) |
Mokrovo (А=2550 km2) |
||
| Number of years | 29 / 68 | 40 / 68 | |
| Period | 1948-1977 / 1948-2015 | 1975-2015 / 1948-2015 | |
| Average runoff, m3/s | 3.68±0.19 / 4.09±0.13 | 8.84±0.53 / 8.59±0.46 | |
| Autocorrelation coefficient | -0.17 / 0.19 | 0.28 / 0.12 | |
| Flow rate, m3/s | 3.71 / 4.12 | 8.84 / 8.59 | |
| Coefficient of variation (Сv) | 0.29 / 028 | 0.29 / 0.36 | |
| Ratio (Сs/Сv) | 5.5 / 4.0 | 2.5 / 2.0 | |
| Runoff of the different probabilities, m3/s | 1 % | 6.35 / 6.79 | 13.9 / 15.8 |
| 5 % | 5.26 / 5.76 | 12.1 / 13.3 | |
| 25 % | 4.15 / 4.65 | 9.96 / 10.2 | |
| 50 % | 3.58 / 4.00 | 8.68 / 8.32 | |
| 75 % | 3.22 / 3.48 | 7.51 / 6.69 | |
| 95 % | 2.64 / 2.88 | 6.09 / 4.76 | |
| 99 % | 2.37 / 2.53 | 5.22 / 3.67 | |
The numerator (or the left value) shows data determined from observation period; the denominator (or the right value) shows data determined from representative period.
Table 2.
Statistical parameters of the Lan River runoff for different averaging periods.
| Runoff type | Annual | Maximum | Minimum summer-autumn | Minimum winter | ||||
|---|---|---|---|---|---|---|---|---|
| Gauging station | Loktyshi | Mokrovo | Loktyshi | Mokrovo | Loktyshi | Mokrovo | Loktyshi | Mokrovo |
| 1948–2015 | ||||||||
| Qav, m3/s | 4.12 | 8.59 | 60.8 | 45.7 | 1.52 | 2.50 | 1.47 | 3.96 |
| Cv | 028 | 0.36 | 0.83 | 0.95 | 0.38 | 0.64 | 0.457 | 0.597 |
| Cs | 0.80 | 0.40 | 0.83 | 0.95 | 0.39 | 0.65 | 1.07 | 0.981 |
| Qр=1%, m3/s | 6.79 | 15.8 | 225 | 231 | ||||
| Qр=5%, m3/s | 5.76 | 13.3 | 159 | 137 | ||||
| Qр=25%, m3/s | 4.65 | 10.2 | 85.4 | 56.1 | ||||
| Qр=50%, m3/s | 4.00 | 8.32 | 48.6 | 35.3 | 1.50 | 2.20 | 1.36 | 3.45 |
| Qр=75%, m3/s | 3.48 | 6.69 | 1.13 | 1.37 | 1.03 | 2.32 | ||
| Qр=95%, m3/s | 2.88 | 4.76 | 0.658 | 0.612 | 0.693 | 1.29 | ||
| Qр=99%, m3/s | 2.53 | 3.67 | 0.403 | 0.305 | 0.529 | 0.838 | ||
| 1948–1977 | ||||||||
| Qav, m3/s | 3.71 | 8.36 | 81.3 | 67.0 | 1.05 | 2.74 | 1.17 | 3.21 |
| Cv | 0.29 | 0.46 | 0.71 | 0.94 | 0.43 | 0.66 | 0.63 | 0.78 |
| Cs | 1.58 | 1.38 | 1.76 | 3.29 | 1.06 | 1.66 | 3.76 | 4.31 |
| Qр=5%, m3/s | 5.26 | 14.8 | 191 | 178 | ||||
| Qр=10%, m3/s | 4.79 | 12.8 | 155 | 135 | ||||
| Qр=90%, m3/s | 2.81 | 4.66 | 0.554 | 0.998 | 0.558 | 1.31 | ||
| Qр=95%, m3/s | 2.64 | 4.02 | 0.467 | 0.760 | 0.488 | 1.10 | ||
| 1978–2015 | ||||||||
| Qav, m3/s | 4.45 | 8.88 | 49.7 | 34.3 | 1.86 | 2.39 | 1.78 | 4.47 |
| Cv | 0.26 | 0.30 | 0.95 | 0.72 | 0.21 | 0.68 | 0.34 | 0.46 |
| Cs | 1.29 | 0.75 | 2.85 | 4.00 | 0.43 | 1.69 | 1.34 | 0.91 |
| Qр=5%, m3/s | 6.16 | 12.2 | 134 | 76.9 | ||||
| Qр=10%, m3/s | 5.67 | 11.3 | 102 | 60.4 | ||||
| Qр=90%, m3/s | 3.37 | 6.61 | 1.39 | 0.858 | 1.17 | 2.33 | ||
| Qр=95%, m3/s | 3.19 | 6.11 | 1.28 | 0.651 | 1.06 | 1.94 | ||
Table 3.
Statistical criteria for various averaging intervals and types of the Lan River runoff.
| Gauging station | Loktyshi | Mokrovo | ||
|---|---|---|---|---|
| Runoff type | t | F | t | F |
| Annual | 2.68 | 1.22 | 1.20 | 1.94 |
| Maximum | 2.47 | 1.63 | 2.85 | 5.69 |
| Minimum summer-autumn | 7.77 | 1.24 | 1.42 | 1.23 |
| Minimum winter | 4.50 | 1.14 | 1.94 | 2.44 |
Bold values are statistically significant.
Table 4.
Statistical parameters of linear trends in the Lan River runoff changes for different averaging periods.
Table 4.
Statistical parameters of linear trends in the Lan River runoff changes for different averaging periods.
| Runoff type | Annual | Maximum | Minimum summer-autumn | Minimum winter | ||||
|---|---|---|---|---|---|---|---|---|
| Gauging station | Loktyshi | Mokrovo | Loktyshi | Mokrovo | Loktyshi | Mokrovo | Loktyshi | Mokrovo |
| 1948–2015 | ||||||||
| α∙10, m3/s | 0.19 | 0.18 | -8.13 | -7.76 | 0.218 | -0.117 | 0.182 | 0.513 |
| r | 0.34 | 0.12 | -0.34 | -0.39 | 0.76 | -0.15 | 0.53 | 0.40 |
| 1948–1977 | ||||||||
| α∙10, m3/s | 0.34 | 1.62 | -8.59 | -2.61 | 0.413 | 0.388 | 0.395 | 0.749 |
| r | 0.30 | 0.42 | -0.15 | -0.04 | 0.84 | 0.21 | 0.57 | 0.26 |
| 1978–2015 | ||||||||
| α∙10, m3/s | 0.06 | -0.50 | -6.80 | -7.96 | 0.065 | -0.501 | 0.015 | 0.416 |
| r | 0.06 | -0.22 | -0.19 | -0.41 | 0.18 | -0.37 | 0.03 | 0.23 |
Bold values are statistically significant.
Table 5.
Forecast estimates of changes in meteorological parameters in the territory of Belarusian Polesie until 2035.
Table 5.
Forecast estimates of changes in meteorological parameters in the territory of Belarusian Polesie until 2035.
| Time interval | ||||||||||||
|---|---|---|---|---|---|---|---|---|---|---|---|---|
| Jan | Feb | Mar | Apr | May | Jun | Jul | Aug | Sep | Oct | Nov | Dec | Year |
| Air temperature (°С) | ||||||||||||
| 2.4 | 2.2 | 1.9 | 1.6 | 1.4 | 1.6 | 2.0 | 1.9 | 1.7 | 1.6 | 1.7 | 2.0 | 1.8 |
| Precipitation (%) | ||||||||||||
| 9.0 | 5.0 | 2.0 | -6.0 | -7.0 | -8.0 | -12.0 | -10.0 | -6.0 | -4.0 | 3.0 | 4.0 | -2.5 |
| Deficiency of air humidity (%) | ||||||||||||
| 0.1 | 0.1 | 0.2 | 0.3 | 0.5 | -0.3 | -0.4 | -0.3 | -0.1 | 0.0 | 0.0 | 0.0 | 0.0 |
Table 6.
Forecast estimates of changes in average long-term runoff of the Lan River for 2035.
| Time interval | ||||||||||||
|---|---|---|---|---|---|---|---|---|---|---|---|---|
| Jan | Feb | Mar | Apr | May | Jun | Jul | Aug | Sep | Oct | Nov | Dec | Year |
| Modern runoff rates, m3/s | ||||||||||||
| 9.46 | 9.60 | 14.2 | 16.2 | 8.78 | 5.99 | 5.32 | 5.69 | 7.74 | 8.38 | 8.10 | 8.01 | 8.89 |
| Forecast runoff rates, % | ||||||||||||
| 97.3 | 95.4 | 109.9 | 88.3 | 74.8 | 98.8 | 51.7 | 68.9 | 59.6 | 87.1 | 93.5 | 96.1 | 90.0 |
| Forecast runoff rates, m3/s | ||||||||||||
| 9.20 | 9.15 | 15.6 | 14.3 | 6.57 | 5.92 | 2.75 | 3.92 | 4.61 | 7.30 | 7.57 | 7.70 | 8.00 |
Table 7.
Intra-annual distribution of the Lan River flow in an average water year.
| Time interval | ||||||||||||
|---|---|---|---|---|---|---|---|---|---|---|---|---|
| Jan | Feb | Mar | Apr | May | Jun | Jul | Aug | Sep | Oct | Nov | Dec | Year |
| Runoff rates Q, m3/s | ||||||||||||
| 3.31 | 3.36 | 4.96 | 5.65 | 3.07 | 2.10 | 1.86 | 1.99 | 2.71 | 2.93 | 2.83 | 2.80 | 3.11 |
| Coefficient of variation Сv | ||||||||||||
| 0.61 | 0.47 | 0.56 | 0.61 | 0.52 | 0.59 | 0.56 | 0.64 | 0.39 | 0.47 | 0.52 | 0.50 | 0.28 |
| Asymmetry coefficient Cs | ||||||||||||
| 1.37 | 0.40 | 1.57 | 2.18 | 1.10 | 0.70 | 0.87 | 1.54 | -0.09 | 2.63 | 1.95 | 1.12 | 0.24 |
| Autocorrelation coefficient r(1) | ||||||||||||
| 0.01 | 0.14 | 0.09 | 0.20 | 0.05 | 0.01 | -0.16 | -0.20 | 0.06 | -0.15 | 0.00 | 0.03 | 0.25 |
Table 8.
Minimum average monthly water flows of 95% probability of the Lan River, million m3.
| Time interval | ||||||||||||
|---|---|---|---|---|---|---|---|---|---|---|---|---|
| Jan | Feb | Mar | Apr | May | Jun | Jul | Aug | Sep | Oct | Nov | Dec | Year |
| 4.19 | 6.26 | 9.66 | 7.09 | 4.30 | 3.89 | 1.81 | 2.61 | 3.38 | 4.11 | 5.17 | 3.37 | 55.85 |
Table 9.
Environmental runoff of the Lan River taking into account intra-annual distribution, million m3.
Table 9.
Environmental runoff of the Lan River taking into account intra-annual distribution, million m3.
| Time interval | ||||||||||||
|---|---|---|---|---|---|---|---|---|---|---|---|---|
| Jan | Feb | Mar | Apr | May | Jun | Jul | Aug | Sep | Oct | Nov | Dec | Year |
| 95% probability | ||||||||||||
| 3.42 | 5.10 | 7.88 | 5.79 | 3.51 | 3.18 | 1.48 | 2.13 | 2.76 | 3.35 | 4.21 | 2.75 | 45.55 |
| 75% probability | ||||||||||||
| 4.90 | 7.31 | 11.28 | 8.28 | 5.02 | 4.55 | 2.11 | 3.05 | 3.95 | 4.80 | 6.03 | 3.94 | 65.22 |
| 50% probability | ||||||||||||
| 6.08 | 9.06 | 14.00 | 10.28 | 6.23 | 5.64 | 2.62 | 3.79 | 4.90 | 5.96 | 7.48 | 4.89 | 80.91 |
| 5% probability | ||||||||||||
| 8.44 | 12.58 | 19.43 | 14.27 | 8.65 | 7.83 | 3.64 | 5.26 | 6.80 | 8.27 | 10.39 | 6.79 | 112.3 |
Table 10.
Values of permissible withdrawal of surface water from the Lan River, million m3.
| Time interval | ||||||||||||
|---|---|---|---|---|---|---|---|---|---|---|---|---|
| Jan | Feb | Mar | Apr | May | Jun | Jul | Aug | Sep | Oct | Nov | Dec | Year |
| 95% probability | ||||||||||||
| 0.75 | 1.13 | 1.76 | 1.09 | 0.20 | 0.00 | 0.00 | 0.00 | 0.14 | 0.51 | 0.85 | 0.60 | 7.04 |
| 75% probability | ||||||||||||
| 0.97 | 1.45 | 2.25 | 1.46 | 0.42 | 0.13 | 0.00 | 0.00 | 0.31 | 0.72 | 1.12 | 0.77 | 9.59 |
| 50% probability | ||||||||||||
| 1.13 | 1.70 | 2.63 | 1.73 | 0.58 | 0.28 | 0.00 | 0.00 | 0.45 | 0.88 | 1.32 | 0.90 | 11.61 |
| 5% probability | ||||||||||||
| 2.03 | 3.03 | 4.70 | 3.25 | 1.50 | 1.11 | 0.06 | 0.53 | 1.17 | 1.76 | 2.43 | 1.63 | 23.19 |
Disclaimer/Publisher’s Note: The statements, opinions and data contained in all publications are solely those of the individual author(s) and contributor(s) and not of MDPI and/or the editor(s). MDPI and/or the editor(s) disclaim responsibility for any injury to people or property resulting from any ideas, methods, instructions or products referred to in the content. |
© 2024 by the authors. Licensee MDPI, Basel, Switzerland. This article is an open access article distributed under the terms and conditions of the Creative Commons Attribution (CC BY) license (http://creativecommons.org/licenses/by/4.0/).
Copyright: This open access article is published under a Creative Commons CC BY 4.0 license, which permit the free download, distribution, and reuse, provided that the author and preprint are cited in any reuse.


