

Submitted:
22 July 2024
Posted:
23 July 2024
You are already at the latest version
Abstract
Este estudio examina la implementación de redes bayesianas para el diagnóstico de afecciones respiratorias utilizando datos clínicos. Se analizaron 5725 registros de una clínica privada en Francia, obtenidos de Kaggle, centrándose en seis variables clave: glucosa en sangre, frecuencia cardíaca, saturación de oxígeno, presión arterial, temperatura y estado de salud del paciente. El objetivo era crear un modelo que mejorara la precisión y eficiencia en el diagnóstico de infecciones respiratorias. Se desarrolló una red bayesiana para modelar las interacciones fisiológicas en condiciones respiratorias, destacando la influencia de la glucosa en sangre en la oxigenación y la interacción entre la frecuencia cardíaca y la saturación de oxígeno. La mediana de la temperatura corporal fue de 38,18 °C y la mediana de la frecuencia cardíaca fue de 92,00 lpm. El modelo, basado en sólidos principios médicos, considera tanto los mecanismos patológicos directos como las respuestas compensatorias del cuerpo. Se utilizó Netica para la simulación y análisis del modelo, proporcionando una visualización clara de las probabilidades condicionales y las relaciones entre las variables. Los hallazgos demuestran que las redes bayesianas son herramientas efectivas para apoyar el diagnóstico de afecciones respiratorias, proporcionando una evaluación integral del estado de salud del paciente. La matriz de confusión reveló una precisión del 94%, una especificidad del 100% y una sensibilidad del 86,53%. Además, la calidad de la prueba para el estado "enfermo" mostró una sensibilidad de hasta el 98,49% y una especificidad de hasta el 98,85%, con un área bajo la curva ROC (AUC) de 0,9592. Estos resultados indican que el modelo tiene un alto rendimiento en la clasificación correcta de los casos de salud y enfermedad normales. Este enfoque tiene el potencial de mejorar la precisión y la eficiencia del diagnóstico, especialmente en entornos clínicos que requieren decisiones rápidas y precisas. Este estudio destaca la aplicación innovadora de las redes bayesianas en medicina respiratoria, ofreciendo una herramienta prometedora para mejorar el diagnóstico y el manejo de pacientes con afecciones respiratorias, y estableciendo una base para futuras investigaciones en el uso de métodos probabilísticos en el diagnóstico médico.
Keywords:
Bayesian Networks
; Medical Diagnosis
; Respiratory Conditions
; Probabilistic Analysis
1. Introduction
Acute respiratory conditions are common health issues in humans, particularly affecting children under five years old [1]. These conditions vary in severity, ranging from mild cases to severe forms that may require hospitalization, and are one of the main reasons for consulting emergency and primary care services [2].
Early and accurate diagnosis of these conditions is crucial to implement appropriate therapeutic measures and prevent serious complications. However, the variability in clinical manifestations and the difficulty in identifying the etiological agents present significant challenges for healthcare professionals [3]. In this context, there is a need for tools that can enhance the diagnostic process.
Bayesian networks were developed as an alternative to traditional expert systems for decision-making and prediction in uncertain situations, employing probabilistic approaches. These statistical tools model a set of conditional probability distributions, which can be adjusted based on new evidence using Bayes’ theorem [4]. In the context of respiratory conditions, Bayesian networks emerge as powerful tools that can improve the diagnostic process by modeling the probabilistic relationships between various factors and associated symptoms [5].
The objective of this study is to apply Bayesian networks for the diagnosis of respiratory conditions in children, using clinical and epidemiological data. This approach not only allows for a better understanding of the relationships between different variables but also provides a solid basis for clinical decision-making [6].
The importance of this work lies in its potential to optimize the diagnosis and treatment of respiratory conditions, reducing the associated morbidity and mortality. Identifying these conditions more accurately and quickly allows for more effective interventions, improving health outcomes and reducing the costs associated with treatment [7].
The following sections describe the materials and methods used, present the results obtained, and discuss the implications of these findings for clinical practice and future research.
2. Materials and Methods
2.1. Data Collection
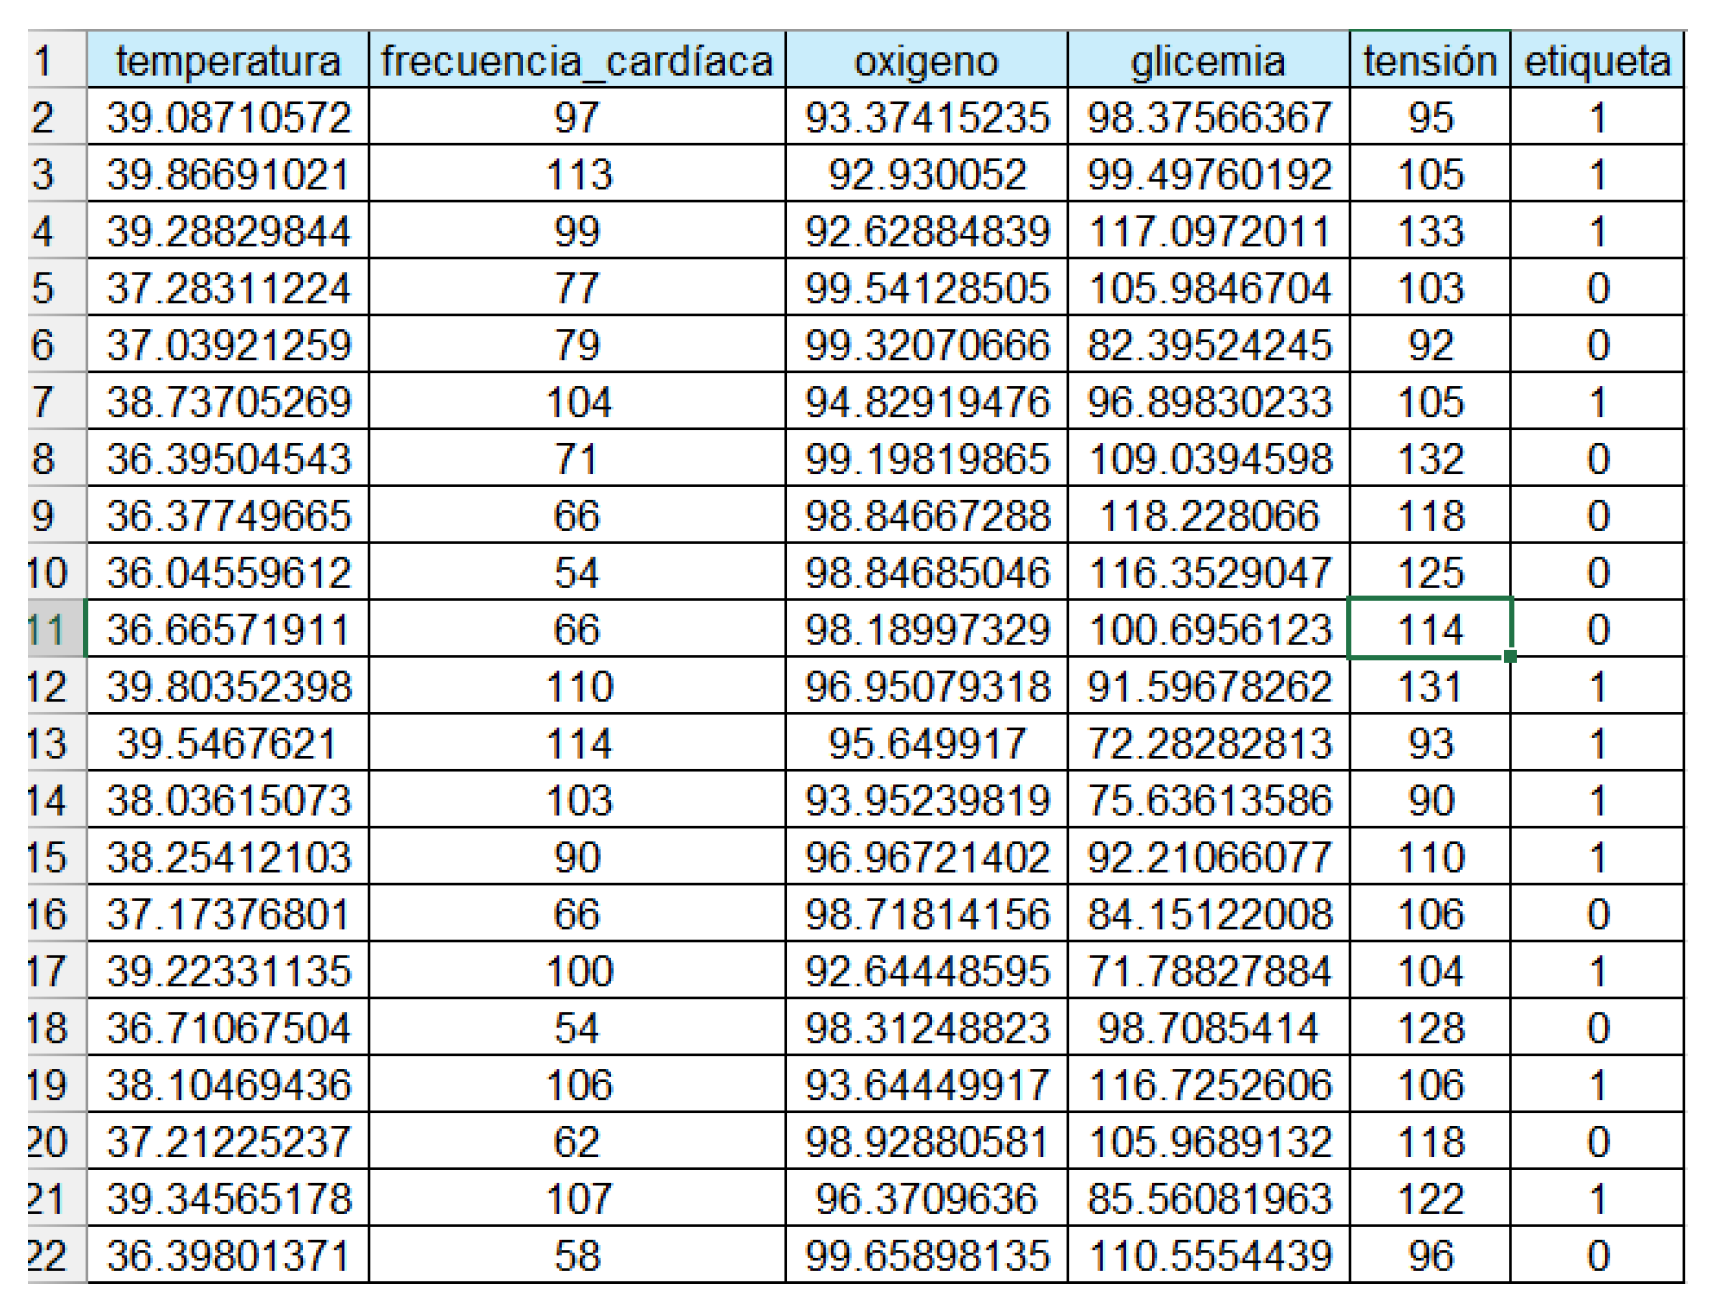
The data used in this study were obtained from the Kaggle platform, specifically from a dataset titled "observation de maladie." This dataset consists of 5725 observations collected from a private clinic in France, offering a comprehensive and accessible database on symptoms and medical conditions related to respiratory infections and other common diseases. The database contains real observations of multiple variables, including symptoms and clinical measurements, allowing for the evaluation of a person’s health status [8].
2.2. Study Variables
The key variables included in the analysis are:
Figure 1.
Table of Variables.
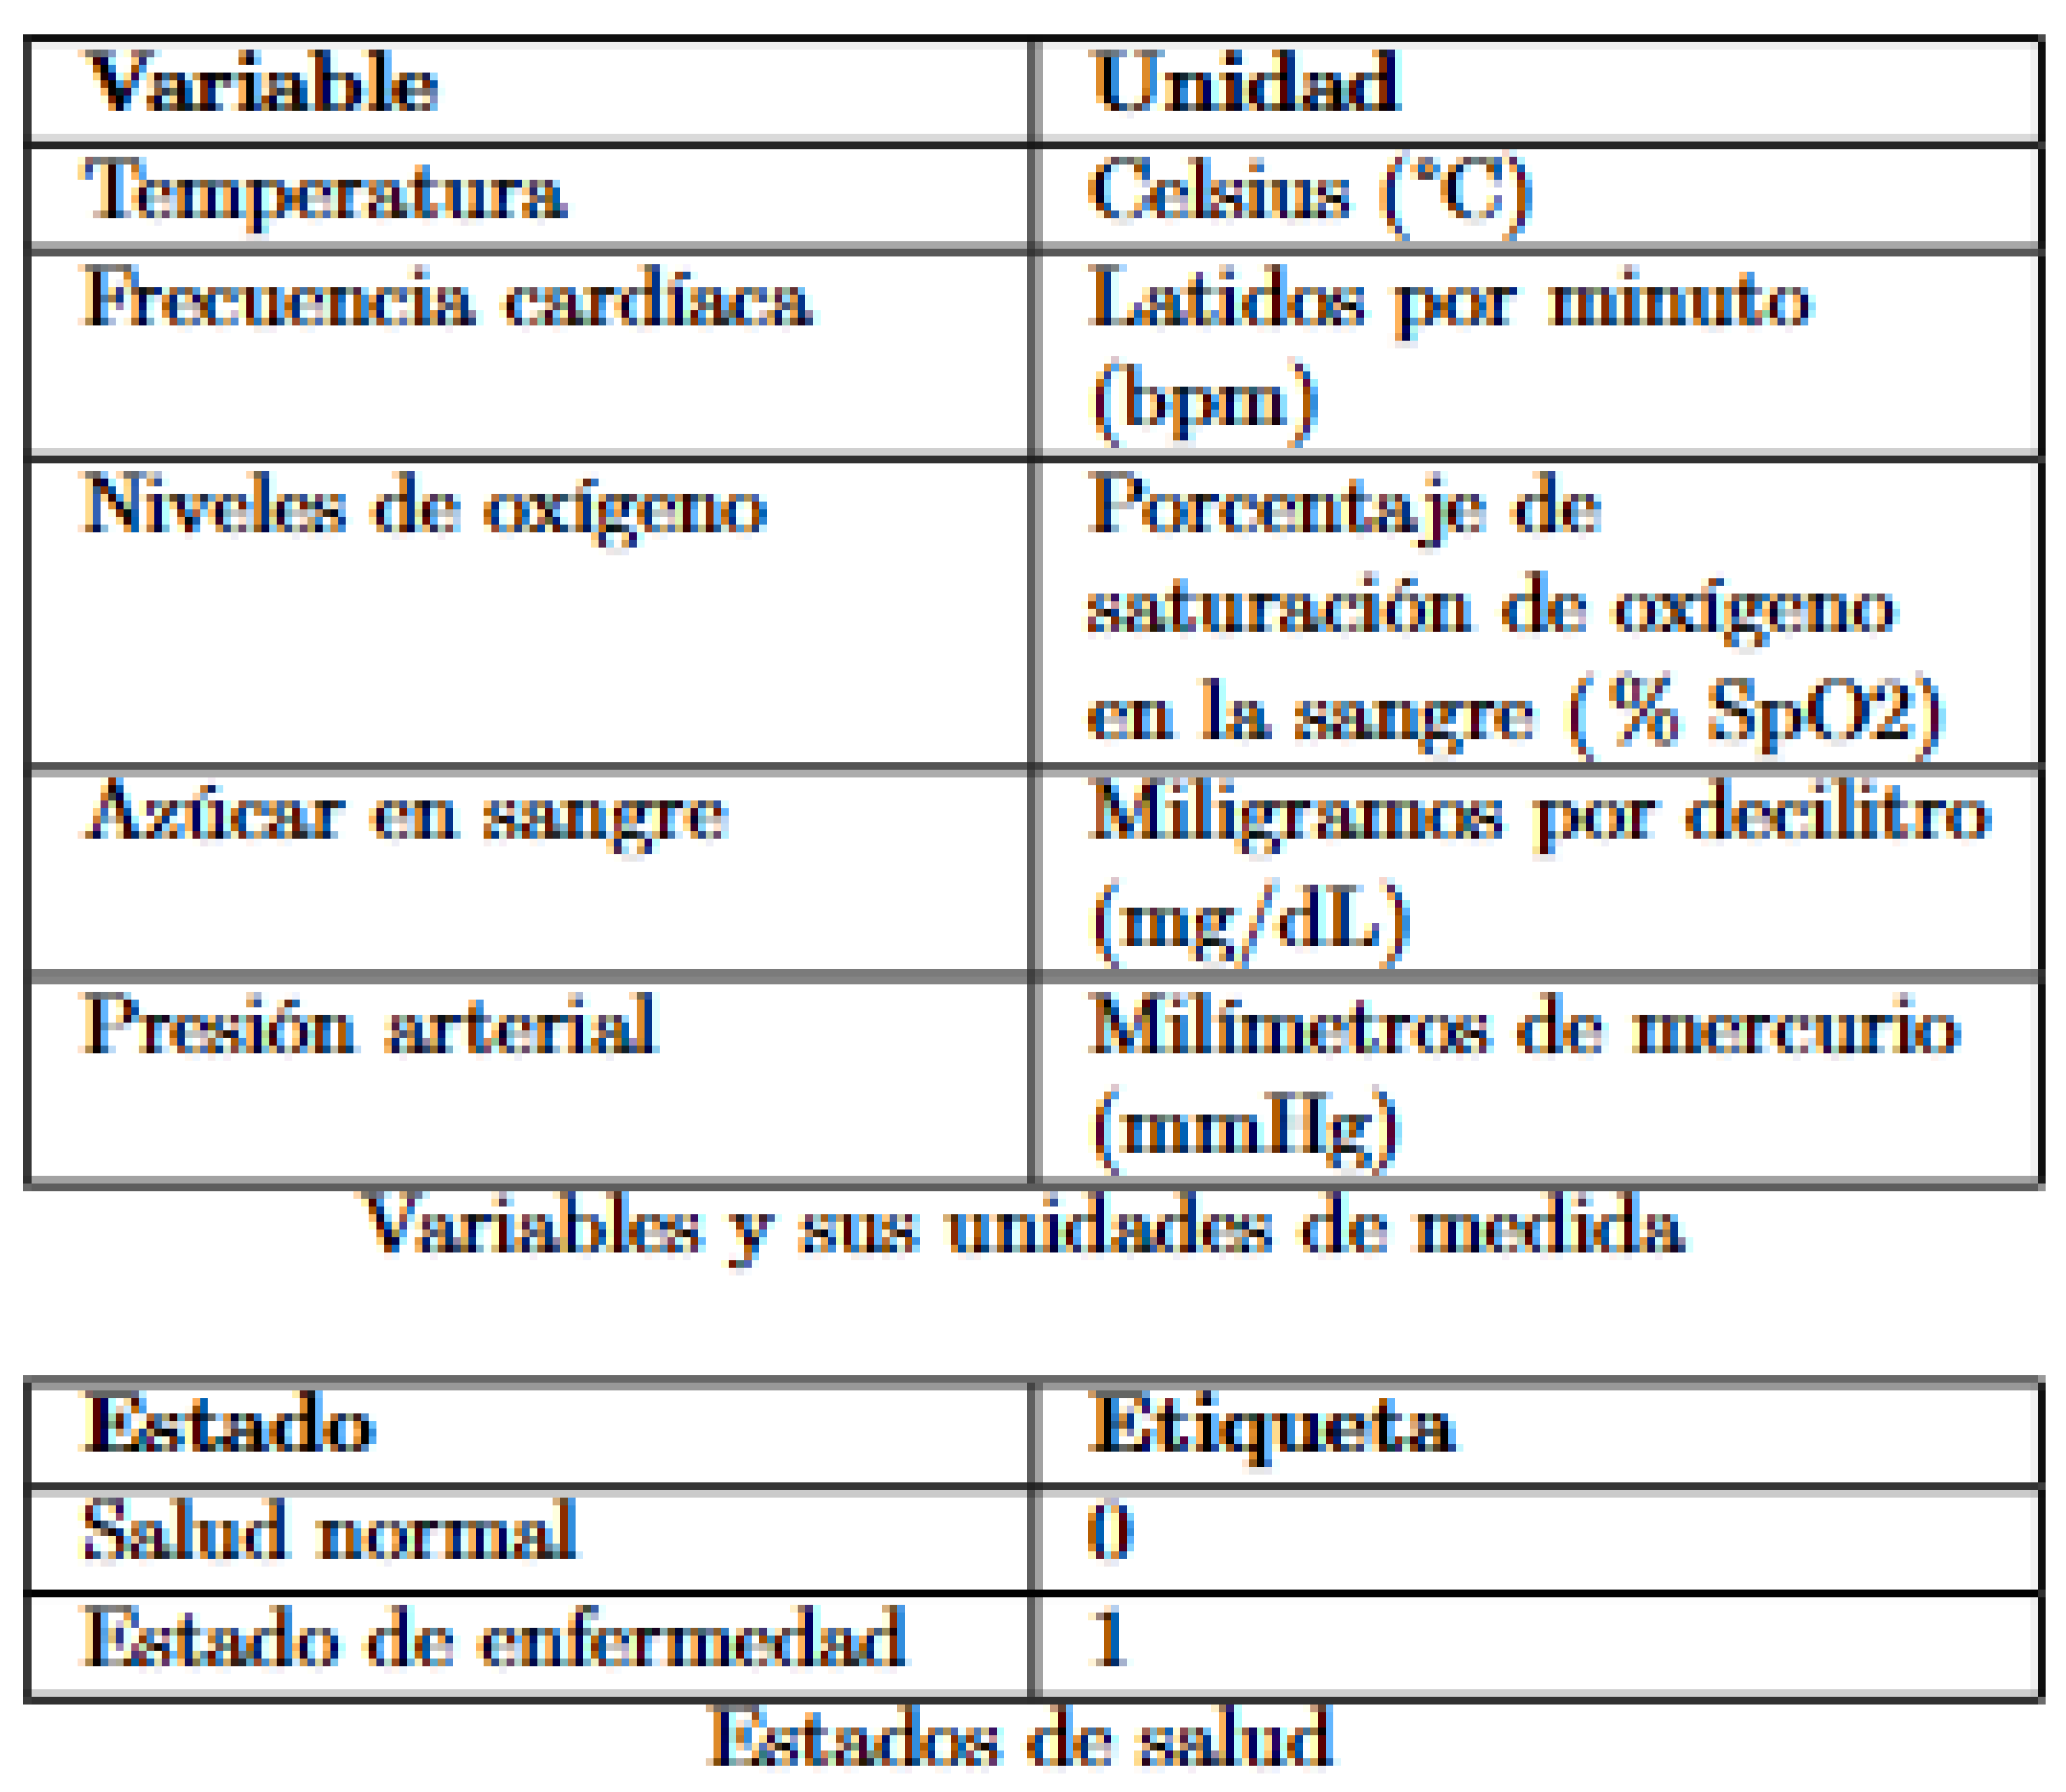
In the dataset, the "label" column classifies health status into two conditions: where "1" indicates a state of illness and "0" represents a state of normal health.
2.3. Data Preparation
For the construction of the Bayesian network, the six key variables mentioned above were used. Each of these variables was discretized to simplify the analysis and interpretation of the results. The data were selected and transformed into a suitable format for analysis with Bayesian networks, ensuring that all variables were categorical and discrete.
2.4. Data Analysis
This dataset allows for the evaluation of medical conditions related to influenza, respiratory conditions, and other common diseases. The Bayesian network constructed from these variables provides a tool for analyzing the probabilistic relationships between symptoms and the health status of patients.
3. Theoretical Framework
3.1. Bayesian Networks
Bayesian networks are probabilistic graphical models that represent a set of variables and their conditional dependencies via a directed acyclic graph (DAG) [5]. Each node in the graph represents a random variable, while the directed arcs between nodes indicate direct influence relationships among the variables. These networks allow for the compact representation of joint probability distributions, facilitating the computation of inferences and the updating of beliefs in the presence of new evidence [6].
The process of constructing a Bayesian network begins with defining the structure of the graph, which can be determined through expert knowledge or structural learning algorithms that analyze the data. Once the structure is defined, conditional probability distributions are assigned to each node, specifying how the probability of each variable depends on its parents in the graph [9].
Bayesian networks are particularly useful in the medical field due to their ability to handle uncertainty and combine evidence from multiple sources. In the diagnosis of viral respiratory infections, these networks model the relationship between symptoms, risk factors, and potential diagnoses, providing a robust framework for clinical decision-making [10].
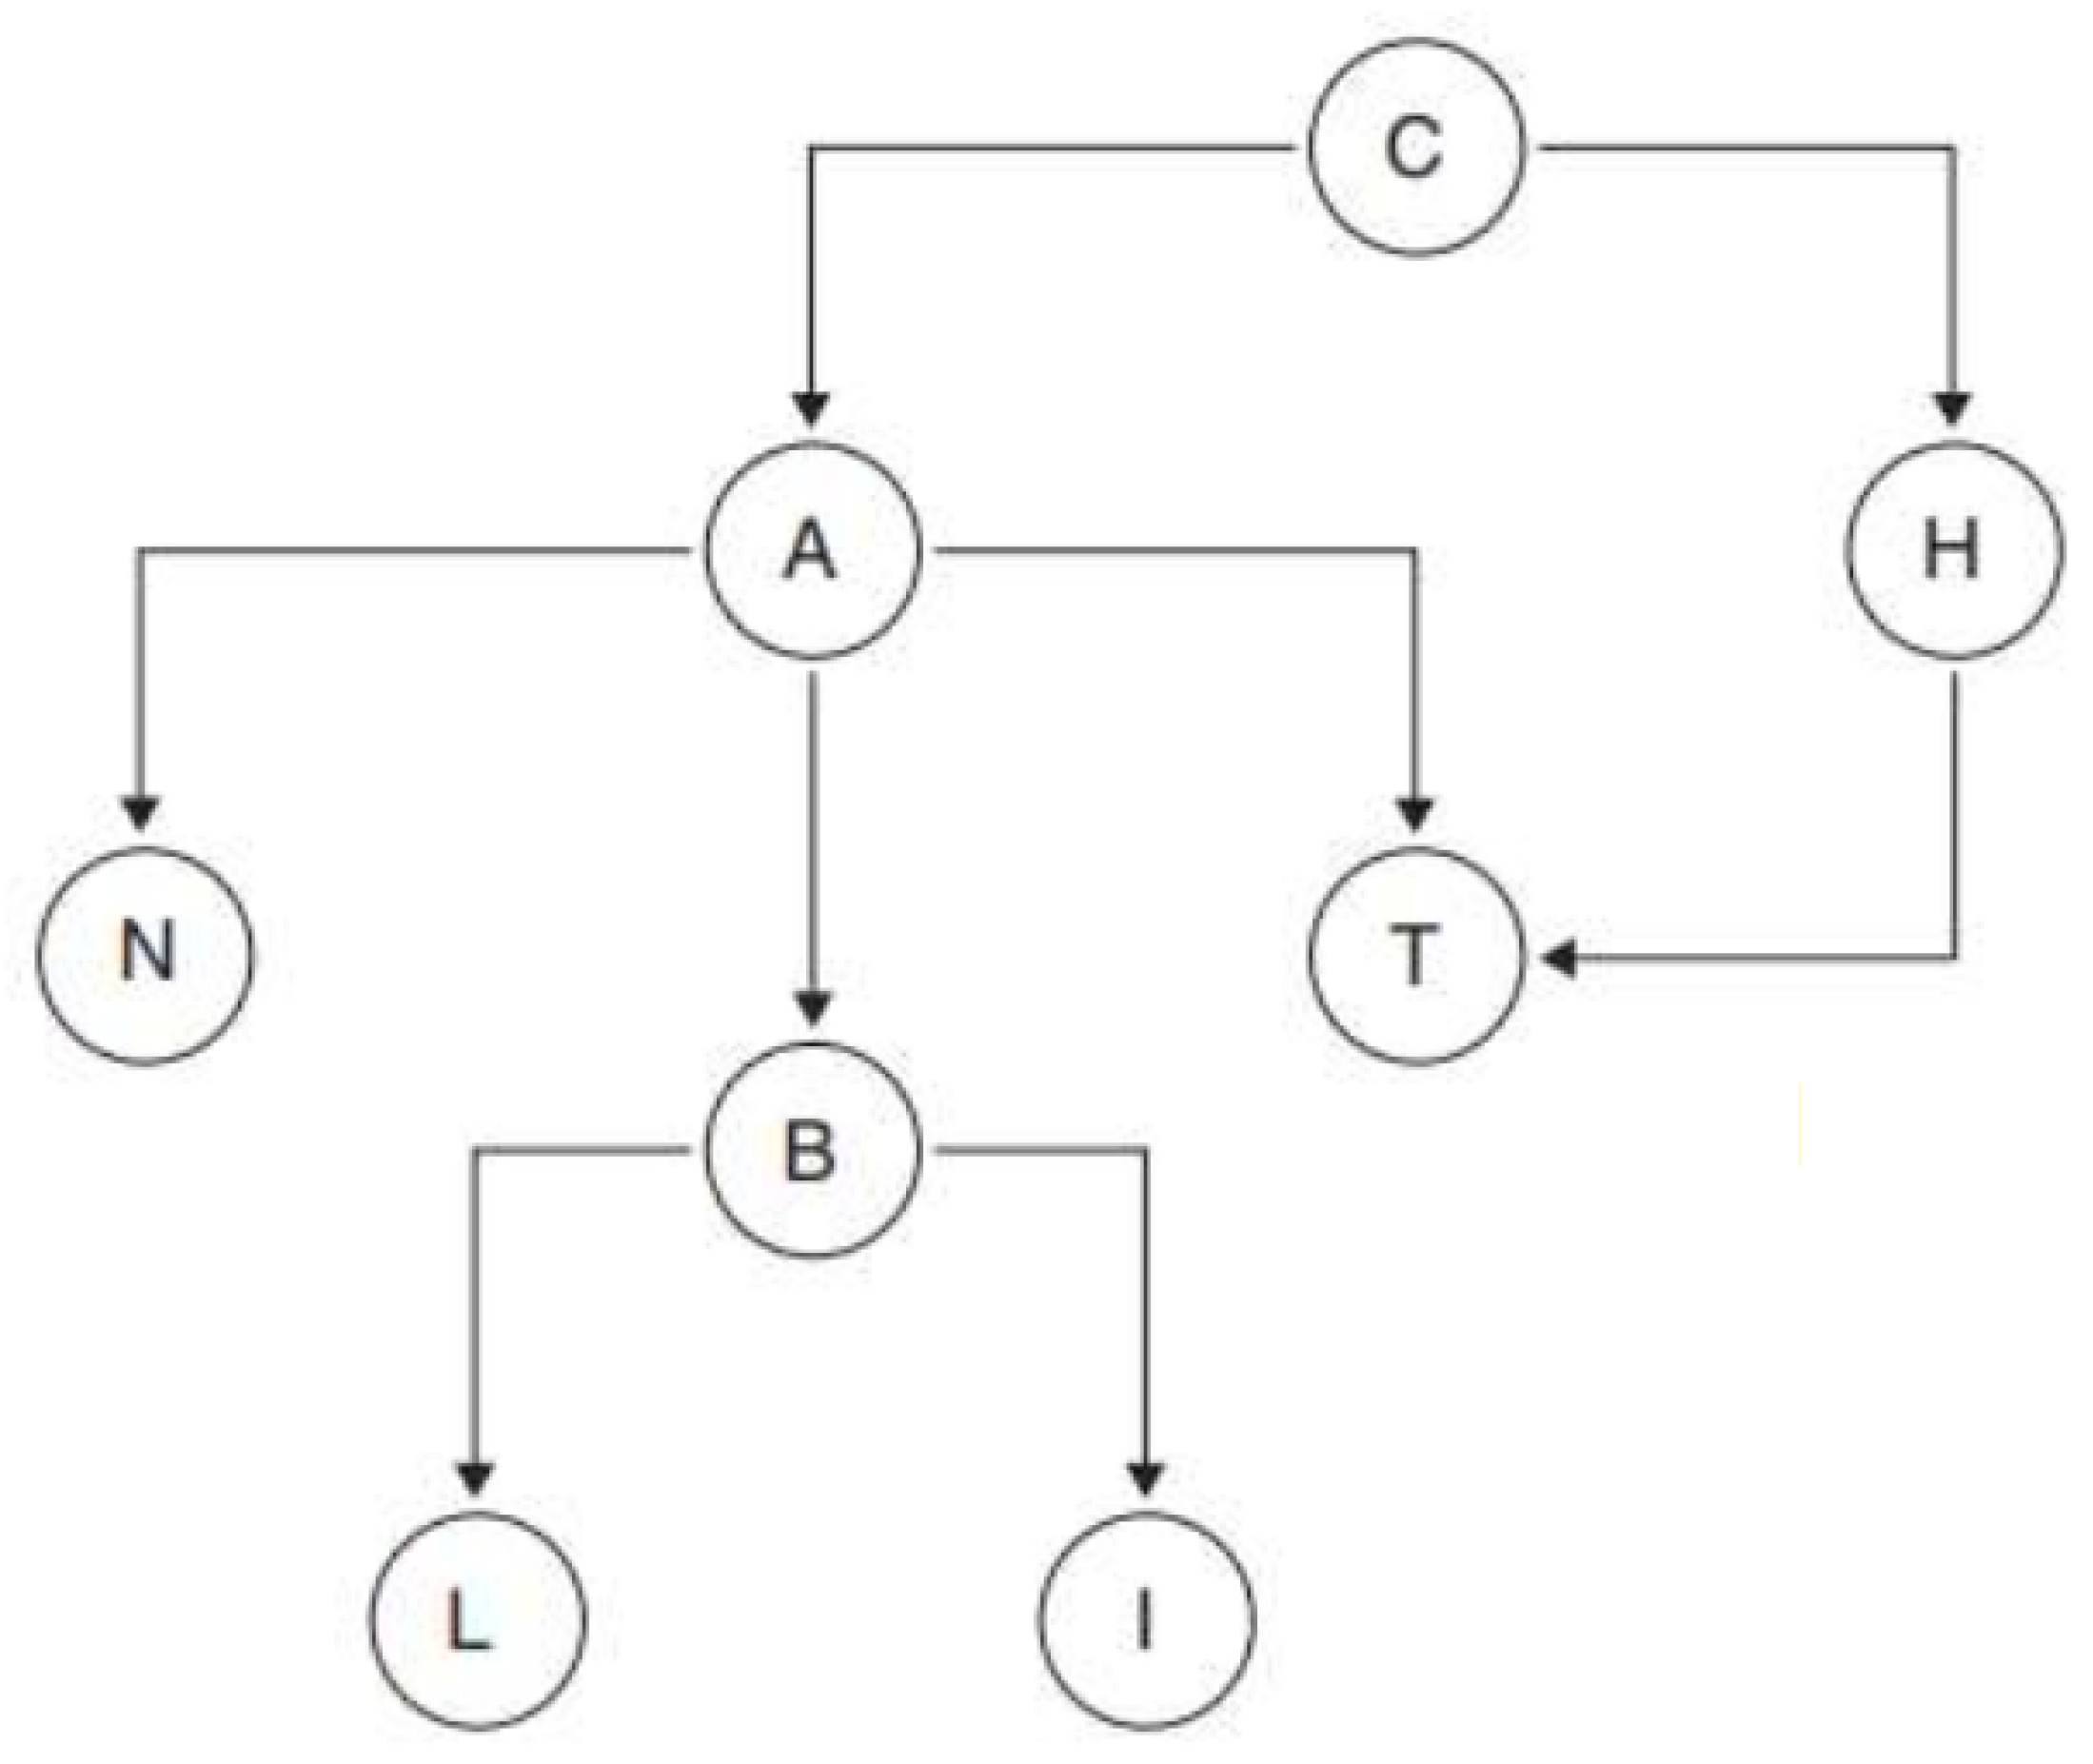
To adequately define a Bayesian network, it is essential to introduce some fundamental concepts of graph theory. Firstly, a node represents any element within a given set, denoted as V. An arc is an ordered pair of nodes (A, B) that can be visualized as an arrow connecting two nodes, indicating a direction from A to B.
A directed graph consists of a set of nodes connected by arcs that specify a mandatory direction for the transition between nodes. A path in a graph is an ordered sequence of nodes {N1, N2, ..., Nr} where, for any pair of consecutive nodes, Nj and Nj+1, there is an arrow connecting them, regardless of direction. A directed path, on the other hand, is a route where each transition between nodes follows the direction indicated by the arrows, ensuring that one can move from node Nj to node Nj+1 only if there is an arrow directly pointing from Nj to Nj+1.
A graph is considered connected if there is a path connecting any pair of nodes within the graph. A cycle is a directed path that starts and ends at the same node. A graph is acyclic if it contains no cycles, meaning there are no closed routes within the graph. In terms of hierarchical relationships, a node Y is called the parent of a node X if there is an arc going from Y to X. The set of all parents of a node X is denoted as Pa(X). Similarly, the descendants of a node X are those nodes to which arcs directly extend from X, and this set is denoted as Ds(X).
Figure 2.
Bayesian Network Graph.
3.2. Conceptual Framework
- Temperature: Body temperature is a key indicator of a patient’s health status. It is measured in degrees Celsius (°C) and can indicate fever or hypothermia.
- Heart Rate: Heart rate, measured in beats per minute (bpm), reflects the number of times the heart beats per minute. It is an important indicator of cardiovascular status.
- Oxygen: Blood oxygen saturation, expressed as a percentage (% SpO2), measures the amount of oxygen carried by hemoglobin. It is crucial for evaluating respiratory function.
- Glycemia: Glycemia is the concentration of glucose in the blood, measured in milligrams per deciliter (mg/dL). It is a vital parameter in managing metabolic diseases such as diabetes.
- Blood Pressure: Blood pressure, measured in millimeters of mercury (mmHg), indicates the force exerted by blood against the walls of the arteries. It is essential for evaluating cardiovascular health.
- Label: The label is a categorical variable that classifies the patient’s health status, with values of 0 for normal health and 1 for disease state.
4. Methodology
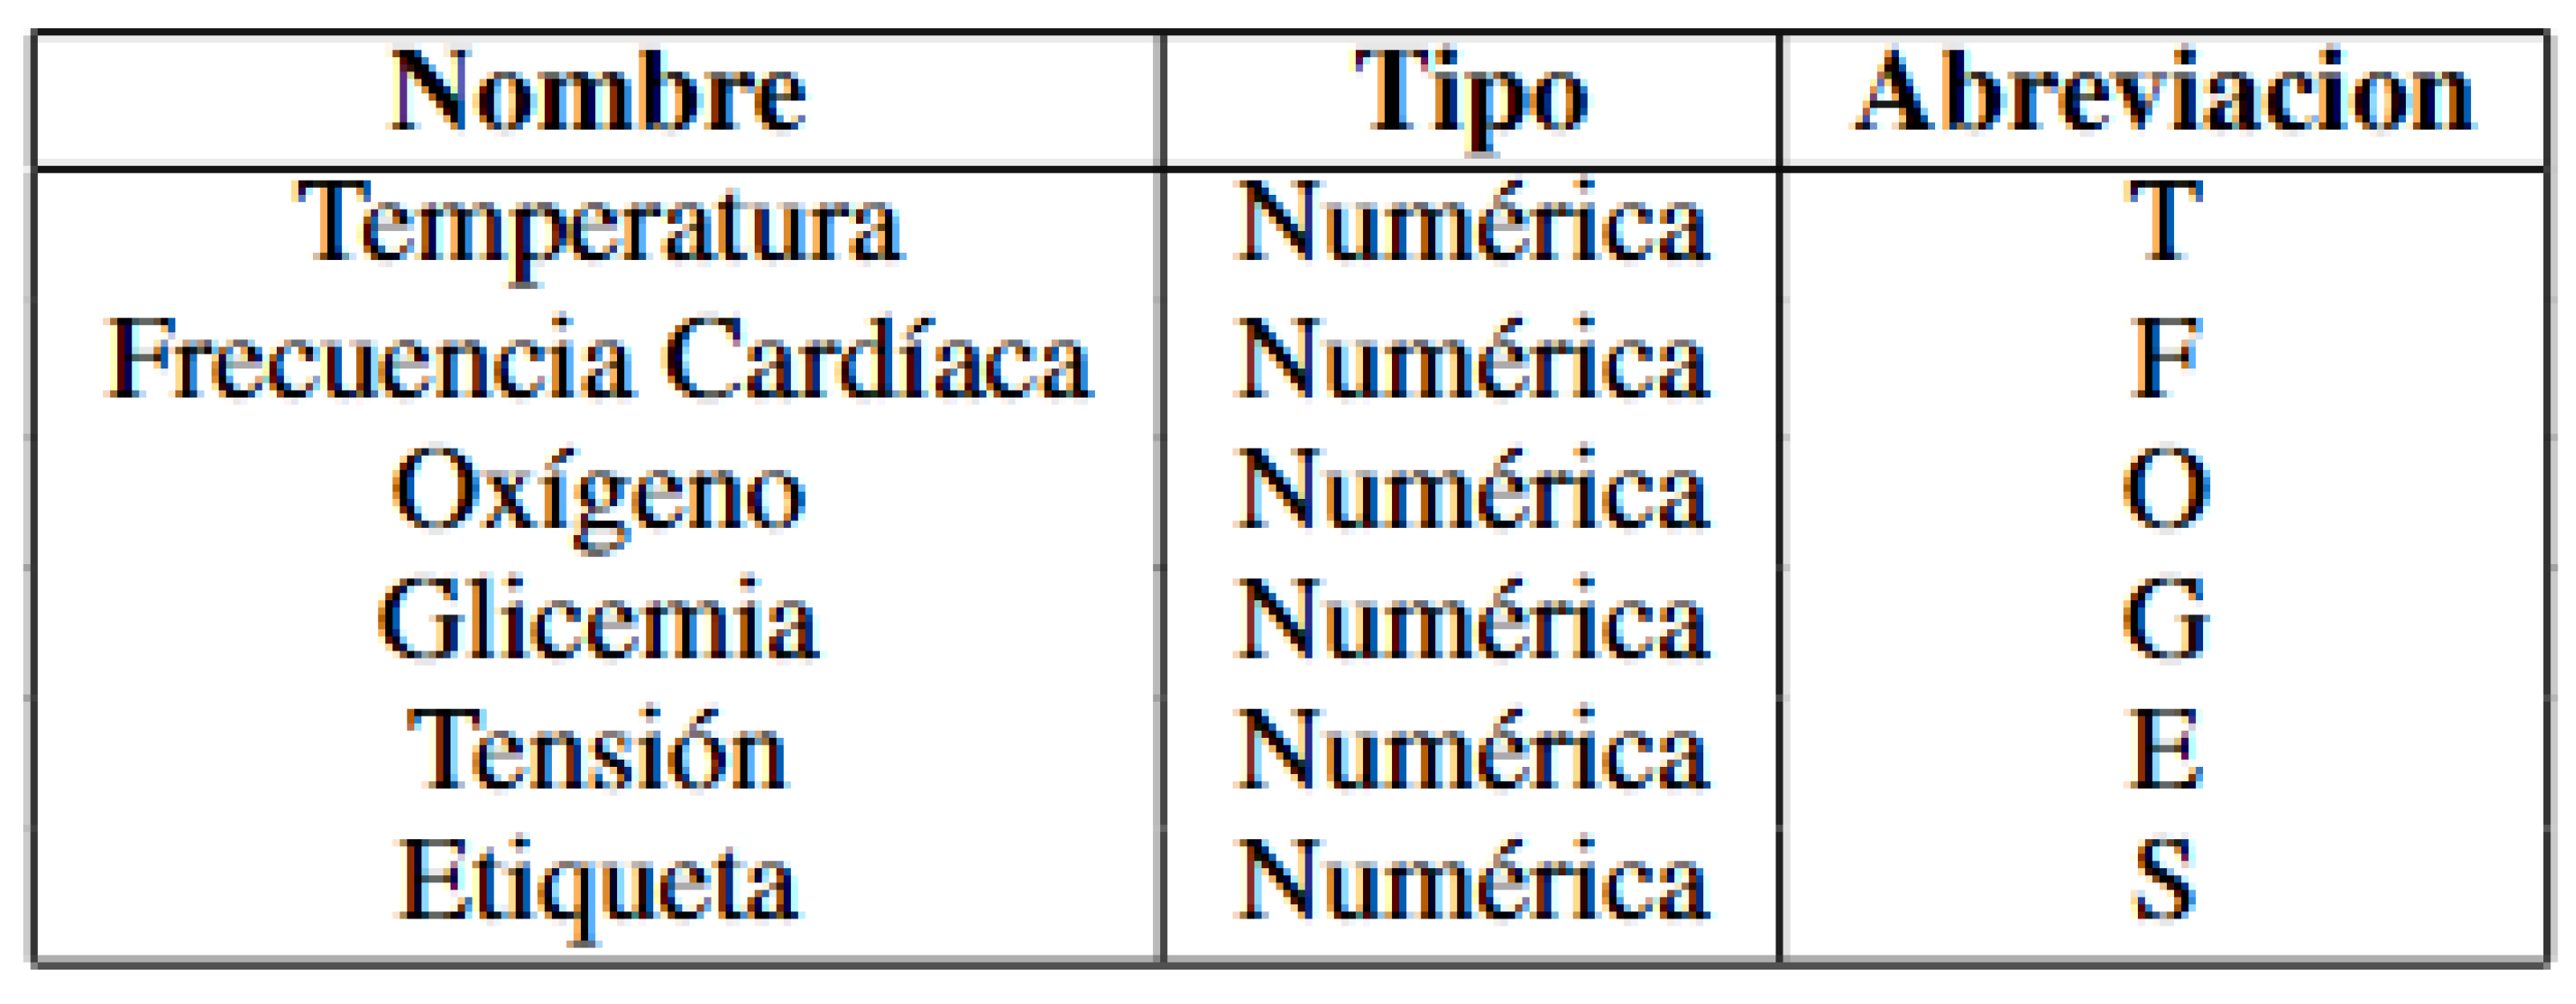
4.1. Variable Types and Abbreviations
Figure 3.
Variable Table.
4.2. Attributes for the Diagnosis of Viral Respiratory Conditions
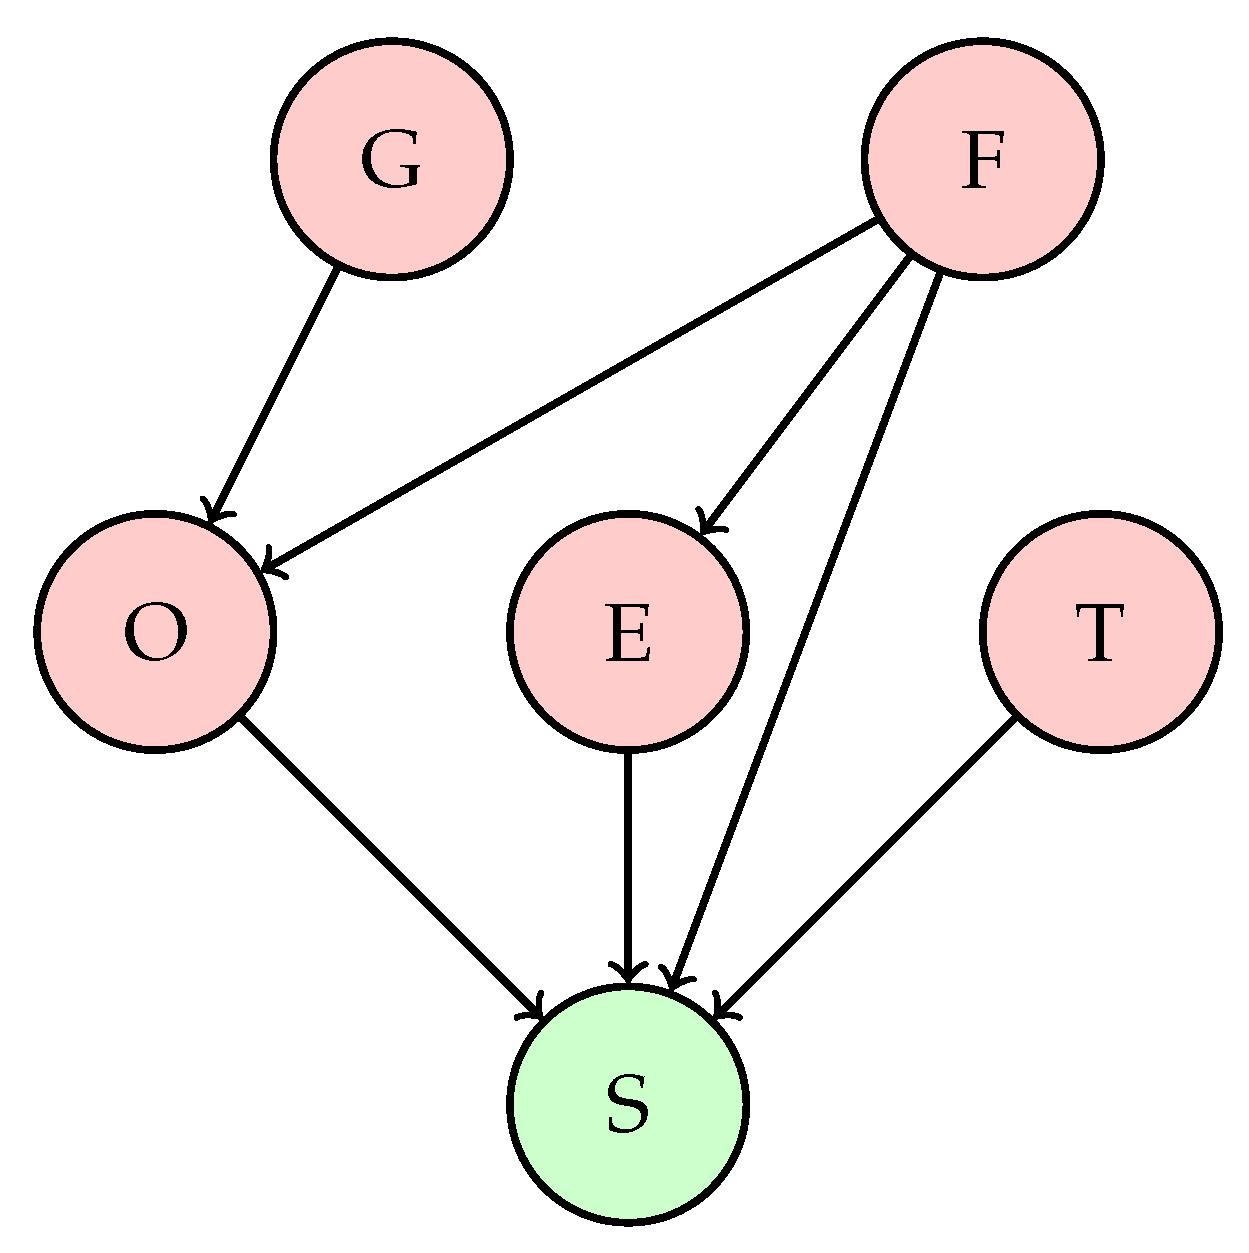
For this study on the creation of the Bayesian network, six variables were selected and their conditional relationships defined. The resulting Bayesian network is illustrated in Figure 4.
- Glycemia → Oxygen: Elevated glycemia levels may be associated with metabolic diseases affecting lung function and oxygen saturation. However, the direct relationship between glycemia and oxygen in patients with respiratory conditions is not as evident; high glycemia does not directly affect oxygen saturation but may contribute to complications that affect respiration.
- Heart Rate → Oxygen: Heart rate can reflect the body’s response to hypoxemia (low oxygen levels). In respiratory conditions, an elevated heart rate can be a response to hypoxia, where the heart attempts to compensate for the low oxygen level by increasing cardiac output. Therefore, an increase in heart rate may be associated with low oxygen levels.
- Heart Rate → Blood Pressure: Heart rate and blood pressure are interrelated, but the relationship is not always direct. In respiratory conditions, an increased heart rate may be associated with changes in blood pressure, although the exact relationship may depend on the type and severity of the respiratory disease.
- Oxygen → Label: Rationale: Oxygen saturation is a critical indicator of respiratory function. Hypoxemia is a warning sign in respiratory diseases, and its severity directly correlates with prognosis. Low oxygen levels can indicate severe pulmonary compromise, need for ventilatory support, and risk of multi-organ failure.
- Blood Pressure → Label: Variations in blood pressure can indicate complications in patients with respiratory conditions. Pulmonary hypertension, for example, can be a complication of chronic respiratory diseases. Additionally, significant changes in blood pressure can reflect a response to severe hypoxemia or other associated complications.
- Temperature → Label: Fever is a common sign of infection and can be associated with viral or bacterial respiratory conditions. An elevated temperature can indicate the presence of a respiratory infection, such as pneumonia or bronchitis, affecting the patient’s overall health status.
4.3. Discretization in Medical Variables
The application of discretization in medical variables has a particular justification due to the need to classify data into clinically relevant categories. Below are the reasons for discretizing each specific variable, including the ranges used for categorization.
Temperature
Body temperature is a fundamental indicator of health status. Two categories have been defined for temperature according to usual clinical parameters:
- "Normal": Temperature less than 37.2°C. This parameter is based on the standard definition of fever in adults, where a temperature equal to or higher than 37.2°C generally indicates fever.
- "High": Temperature equal to or higher than 37.2°C. This range includes temperatures that could indicate fever, a condition that may require medical attention.
Heart Rate
Heart rate is an important indicator of cardiovascular health. The ranges have been defined to reflect useful medical categories:
- "Low": Heart rate less than 60 beats per minute. This range is used to identify bradycardia, a condition where the heart beats more slowly than normal.
- "Normal": Heart rate between 60 and 100 beats per minute. This interval covers the range considered normal for adults at rest.
- "High": Heart rate equal to or greater than 100 beats per minute. This range identifies tachycardia, a condition where the heart beats faster than normal.
Oxygen
Blood oxygen levels are crucial for assessing respiratory function. Thresholds have been established based on clinical guidelines on oxygen saturation:
- "Critically Low": Oxygen level less than 90%. This level may indicate severe hypoxemia, requiring urgent medical intervention.
- "Low": Oxygen level between 90% and 95%. This range may indicate a slight decrease in oxygen saturation that may need monitoring.
- "Normal": Oxygen level equal to or greater than 95%. This range is considered normal and reflects an adequate oxygen saturation for most healthy individuals.
Blood Glucose
Blood glucose levels are key indicators for diagnosing diabetes and other metabolic conditions. The ranges used are:
- "Low": Blood glucose less than 70 mg/dL. This level may indicate hypoglycemia, a condition where blood glucose levels are below the normal range.
- "Normal": Blood glucose between 70 and 99 mg/dL. This interval covers the range considered normal for fasting adults.
- "High": Blood glucose equal to or greater than 99 mg/dL. This range may indicate hyperglycemia, which is a sign of possible diabetes or metabolic issues.
Blood Pressure
Blood pressure is essential for assessing cardiovascular health. Blood pressure thresholds have been defined according to common clinical categories:
- "Low": Blood pressure less than 90 mmHg. This range may indicate hypotension, a condition where blood pressure is abnormally low.
- "Normal": Blood pressure between 90 and 120 mmHg. This interval encompasses the blood pressure considered normal in adults.
- "Elevated": Blood pressure between 120 and 129 mmHg. This range may indicate elevated blood pressure that may require monitoring.
- "High": Blood pressure equal to or greater than 130 mmHg. This range defines hypertension, a condition that can increase the risk of cardiovascular diseases.
5. Results
5.1. Descriptive Analysis
Figure 5.
Histogram of Temperature.
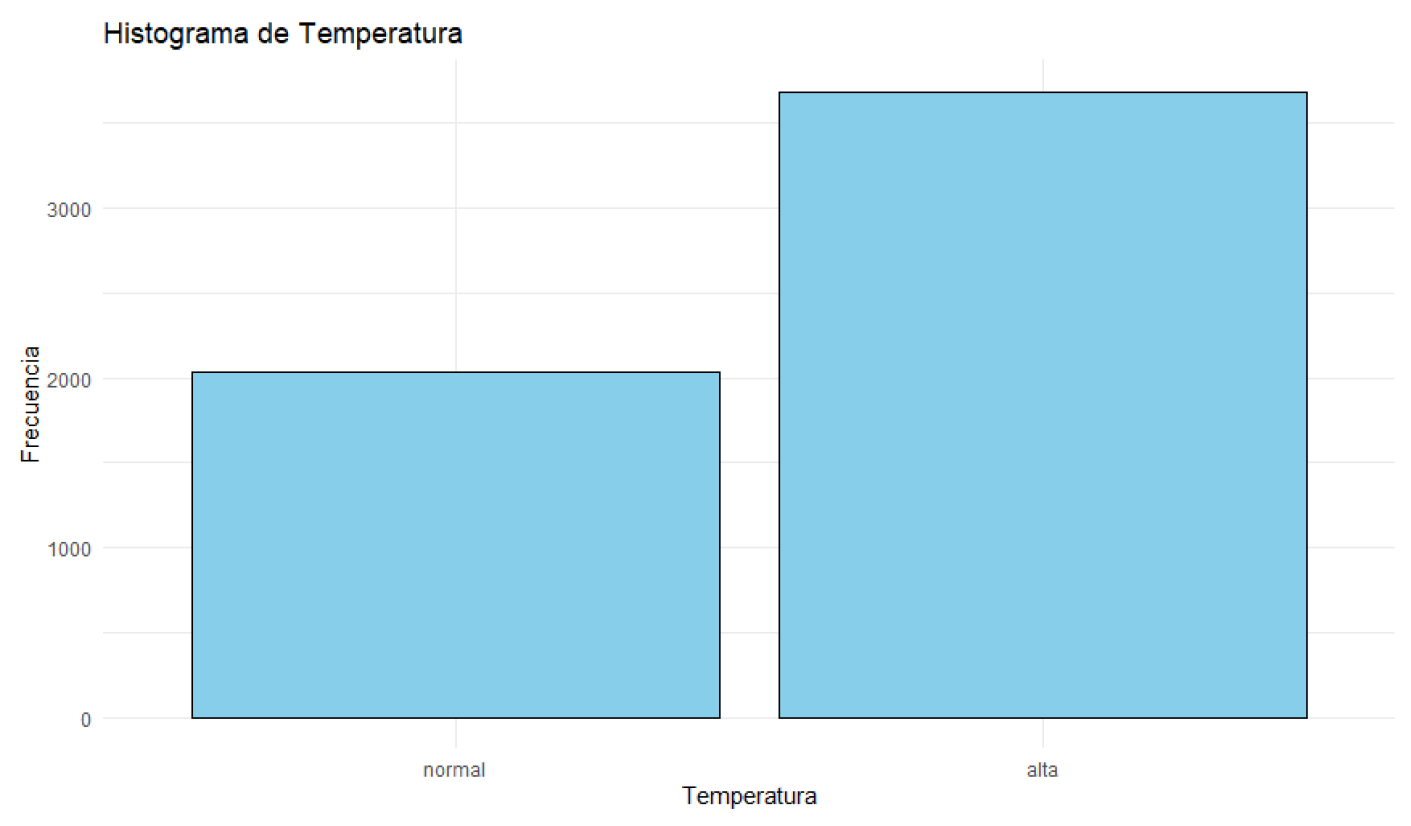
Figure 6.
Histogram of Heart Rate.
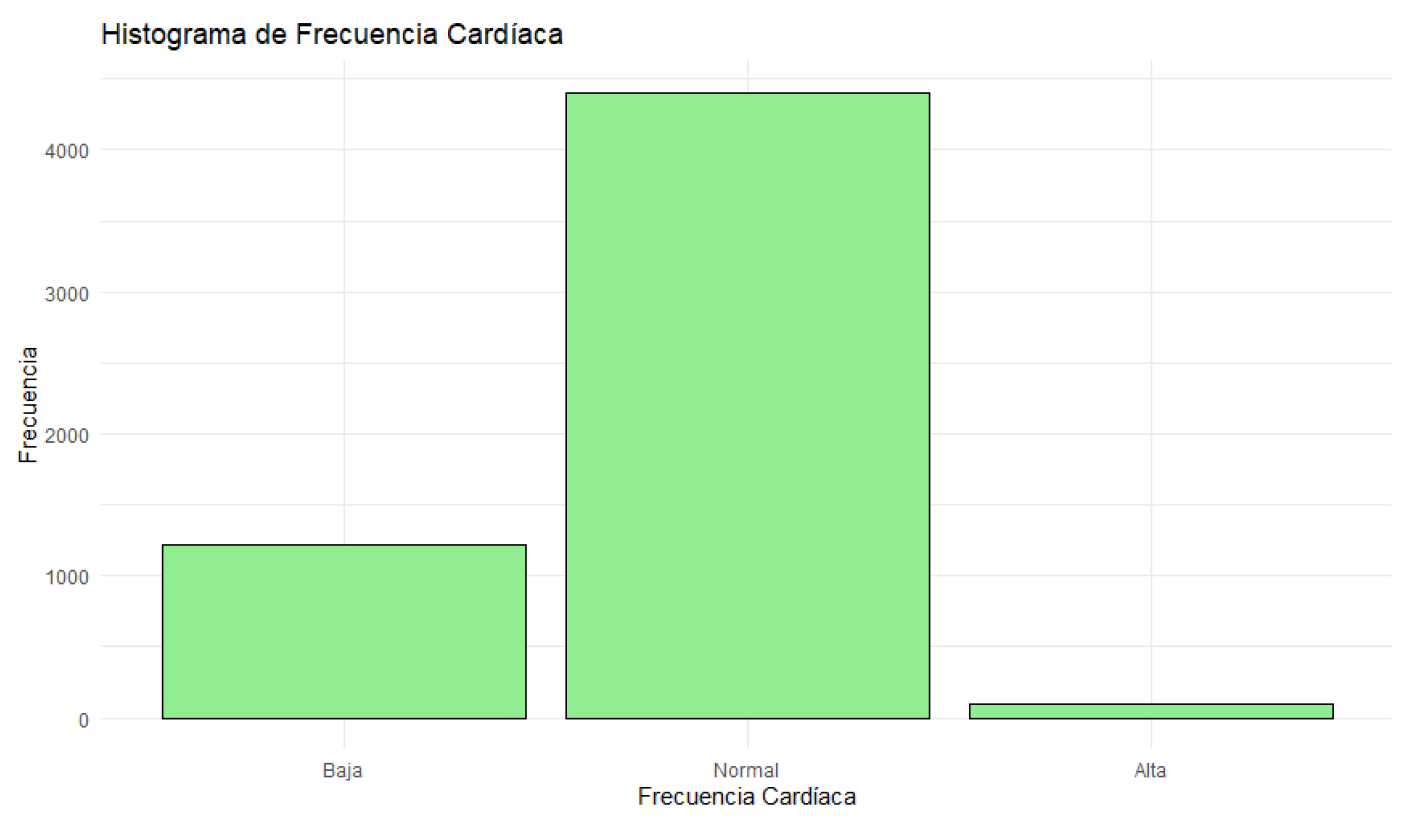
Figure 7.
Histogram of Oxygen Saturation.
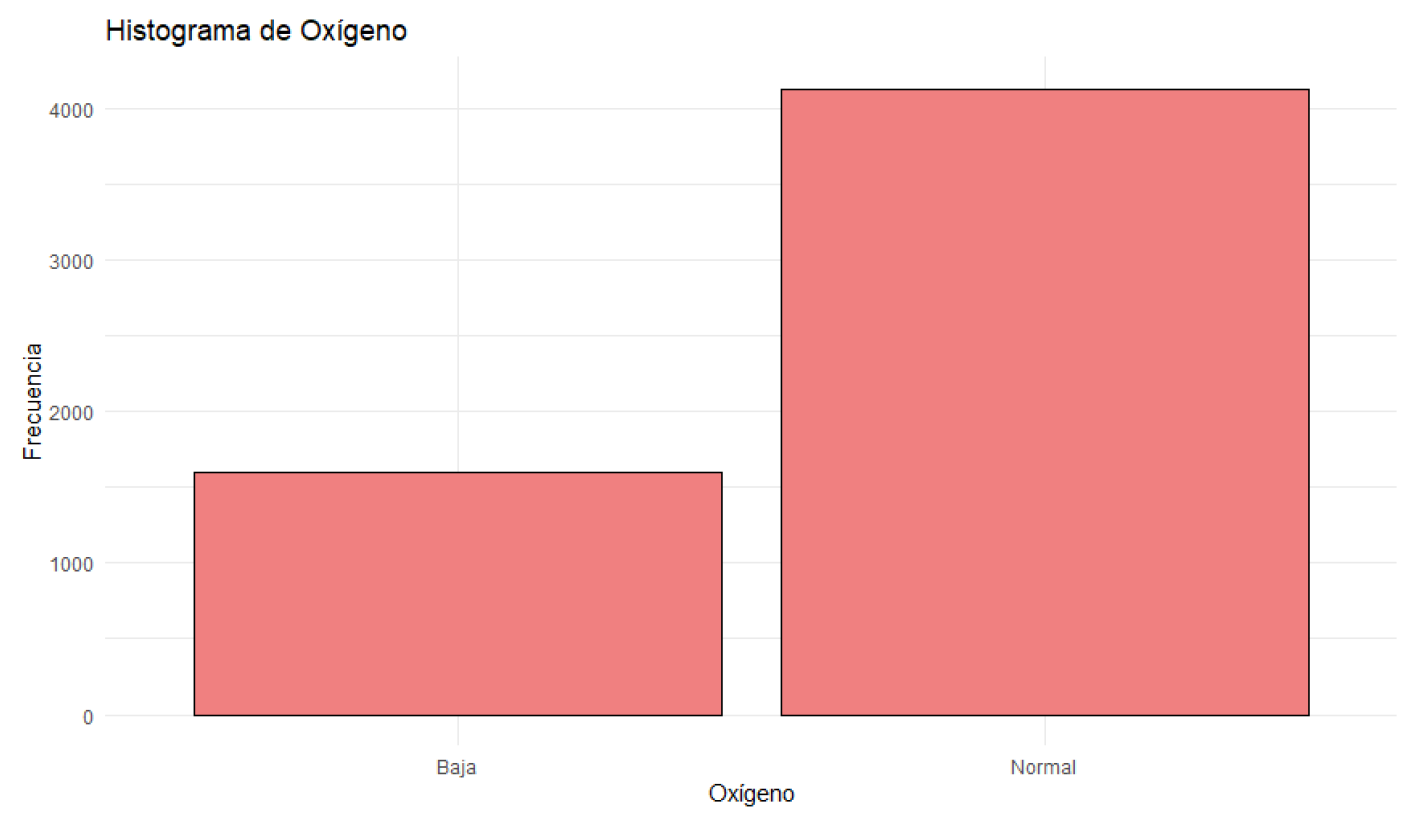
Figure 8.
Histogram of Blood Glucose.
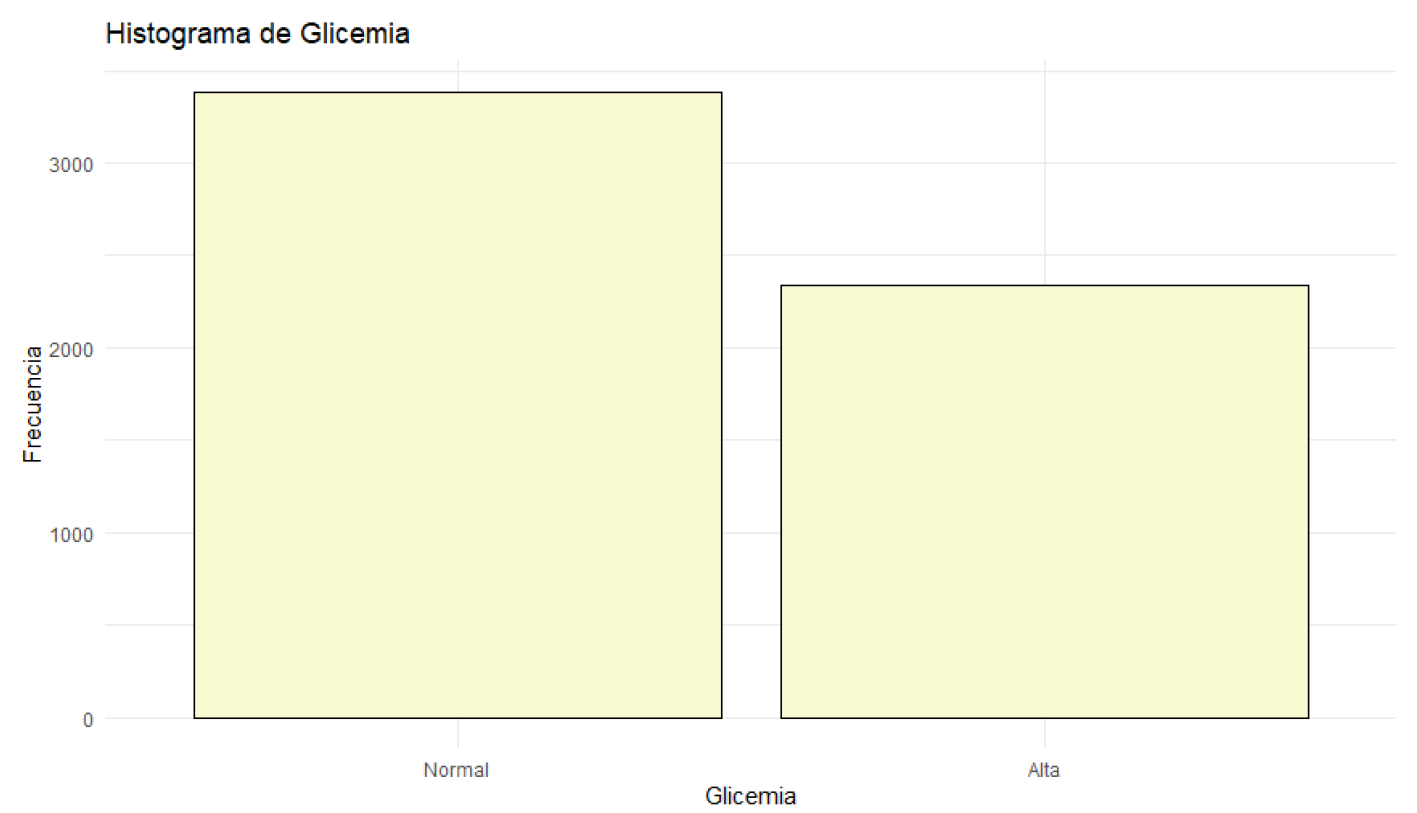
Figure 9.
Histogram of Blood Pressure.
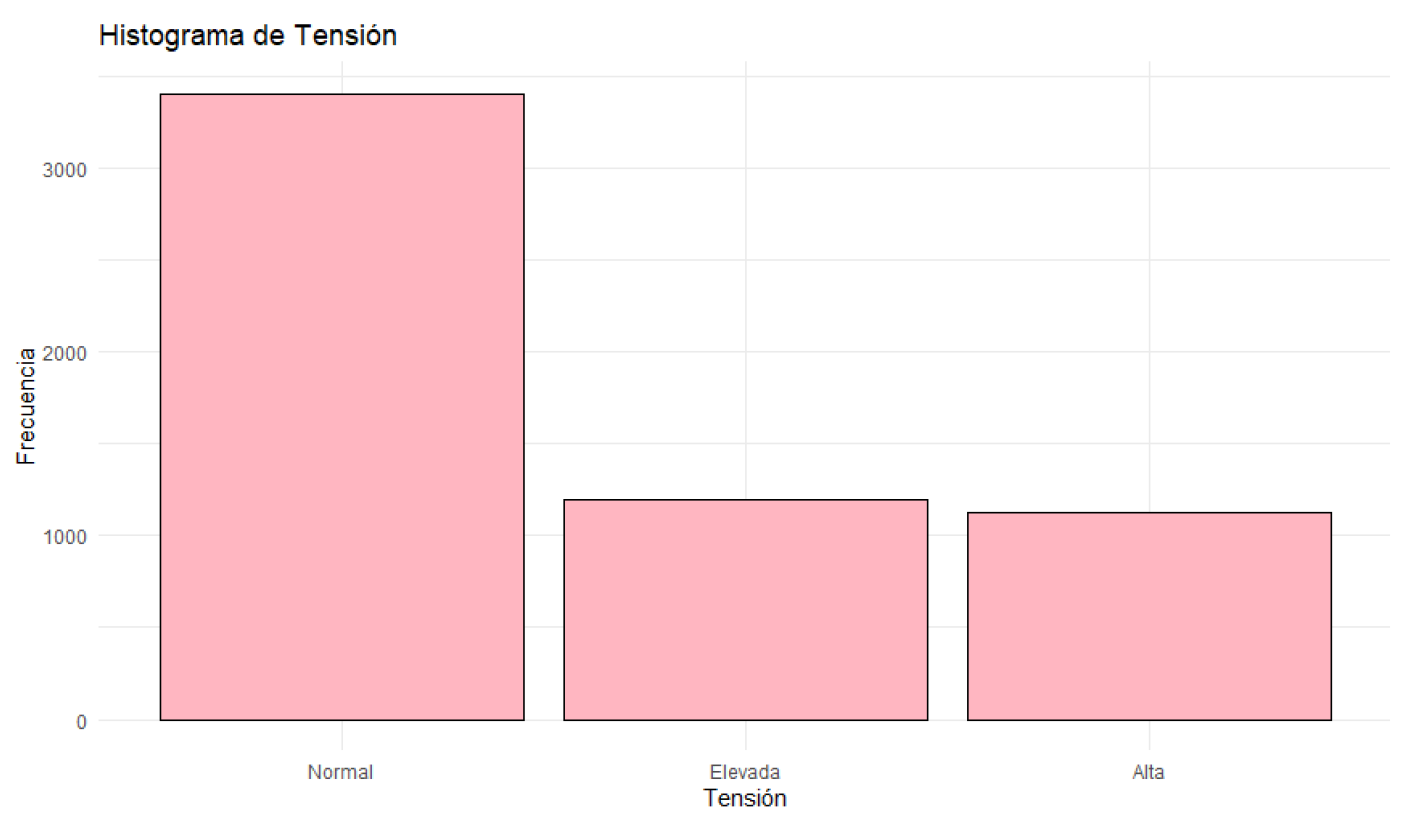
Figure 10.
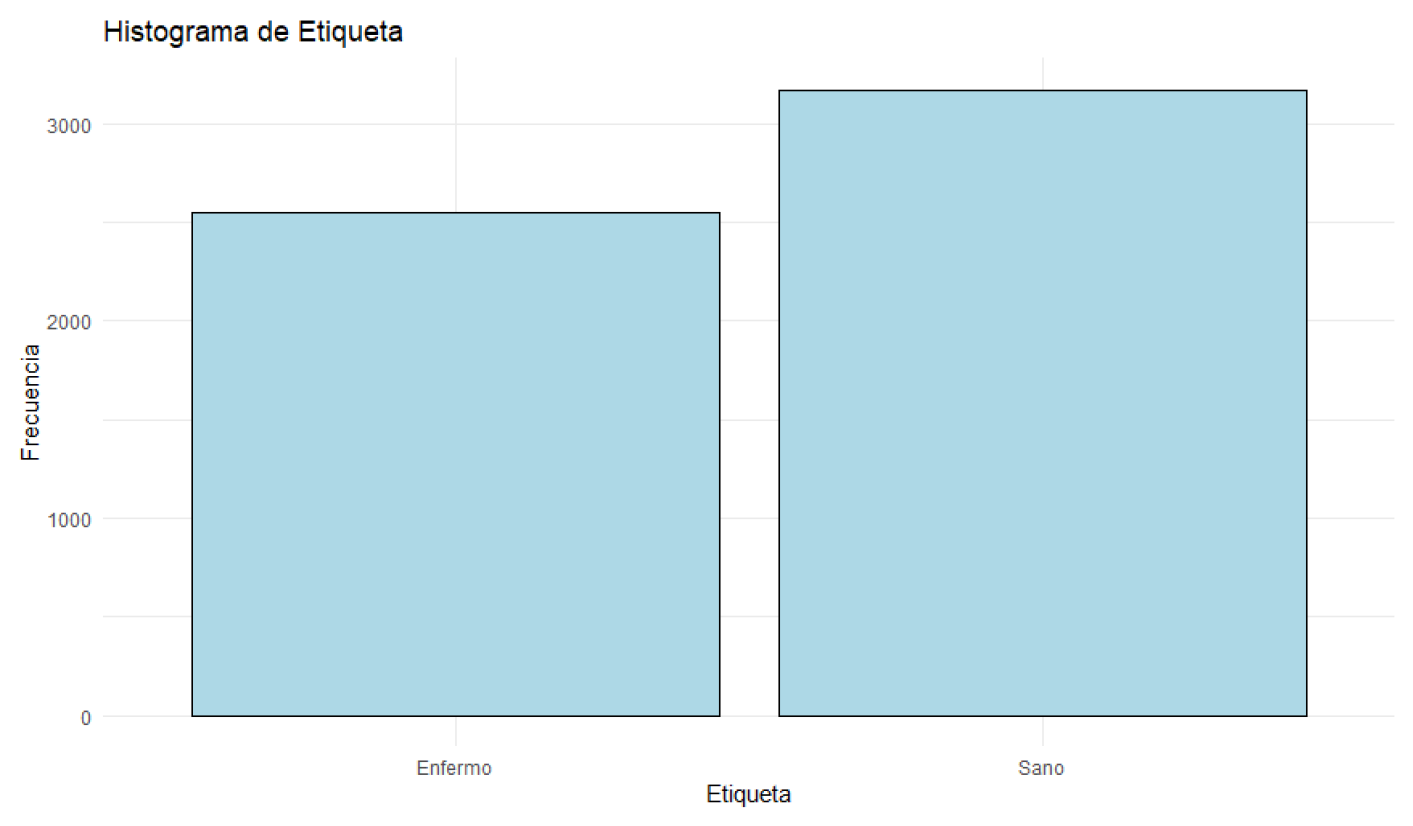
Histogram of Health Status.
The descriptive analysis of the data reveals that patients’ body temperatures range from 36.00°C to 40.00°C, with a median of 38.18°C. Most patients have temperatures close to this median.
Patients’ heart rates vary between 50 and 119 beats per minute, with a median of 92.00 beats per minute. Most patients have heart rates around this median. Blood oxygen levels range from 92% to 100%, with a median of 97.37%. Most patients have oxygen levels near this median.
Blood glucose levels fluctuate between 70.01 mg/dL and 119.98 mg/dL, with a median of 94.34 mg/dL. Glucose levels are concentrated around this median. Blood pressure varies between 90 mmHg and 139 mmHg, with a median of 114.00 mmHg. Most patients have blood pressure readings close to this median. Regarding health status, 55.56% of the patients are classified as sick, while 44.44% are in normal health. Most patients are classified as sick, although the difference is not very significant.
From a Bayesian network analysis perspective, these variables provide a robust dataset for modeling probabilistic relationships between symptoms and health states. The Bayesian network will help identify how variations in temperature, heart rate, oxygen levels, glucose, and blood pressure are conditioned by the presence of illness. This will facilitate a deeper understanding of the interactions between these variables and support clinical decision-making based on probability.
5.2. Software Netica
Para ilustrar el uso de redes bayesianas en el diagnóstico de afecciones respiratorias, se realizó una simulación utilizando el software Netica.
Figure 11.
Red construida en Netica.
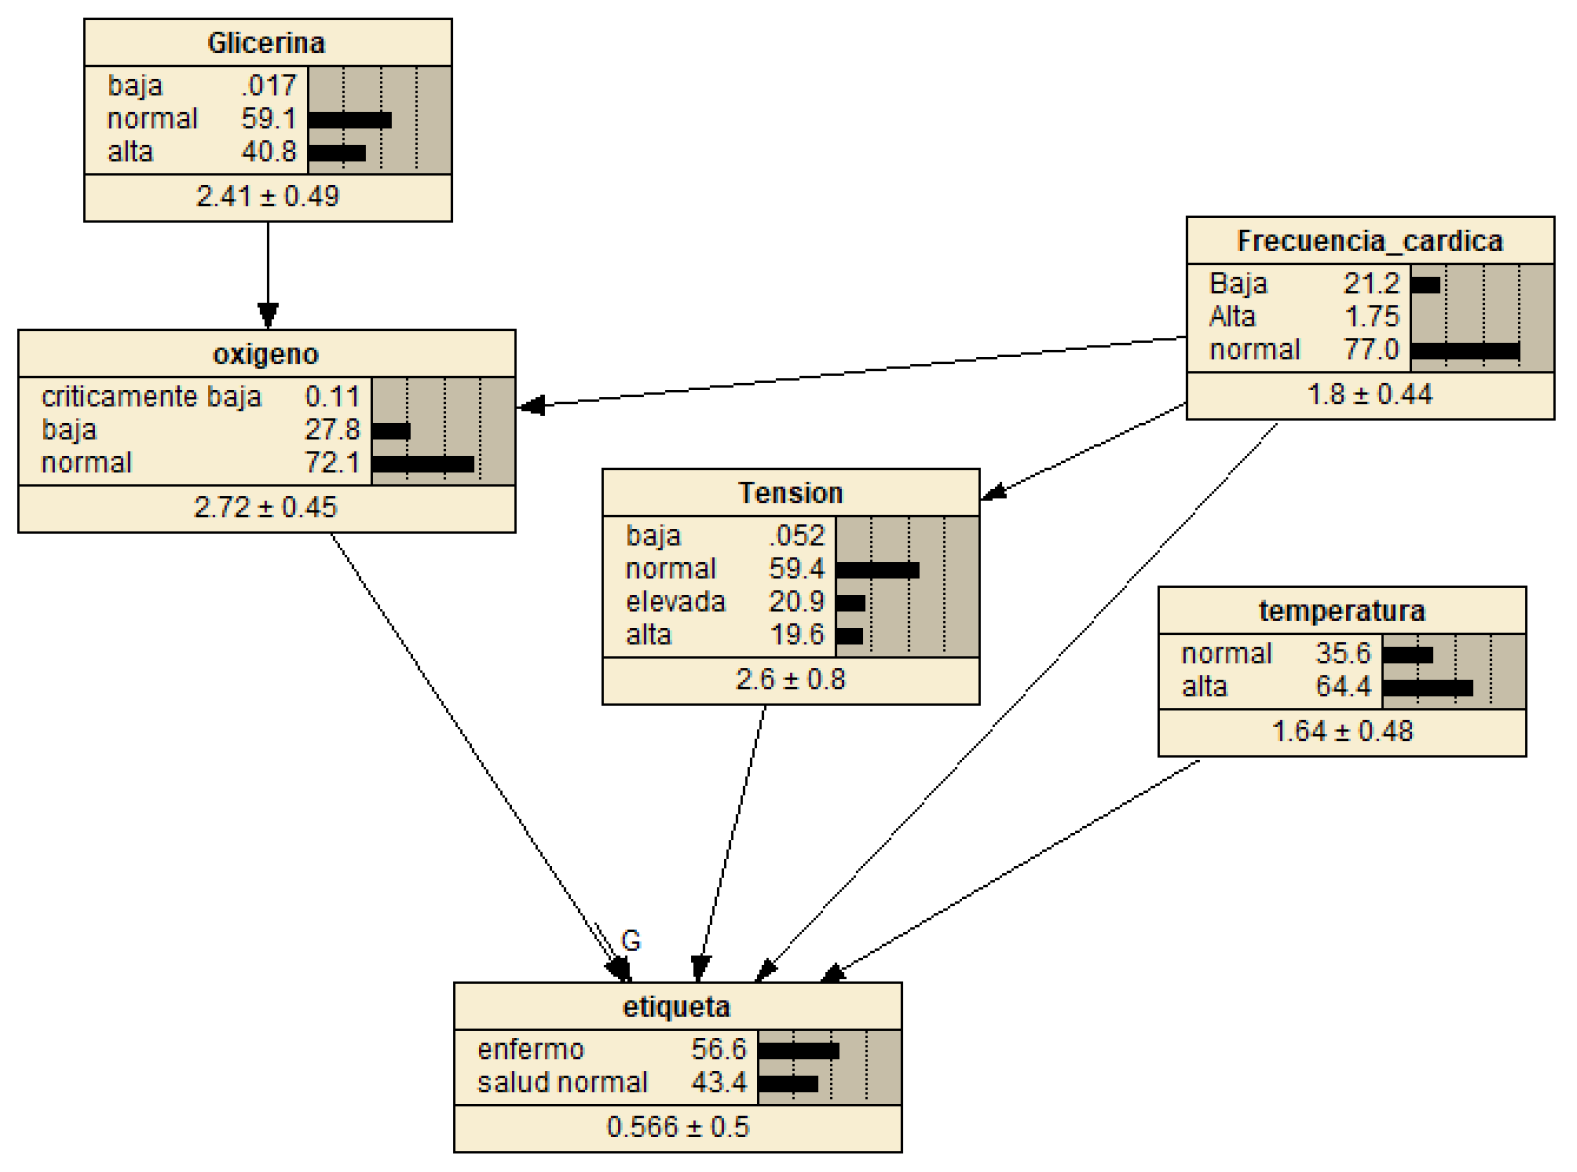
Figure 12.
Tabla de probabilidad para la variable "Etiqueta".
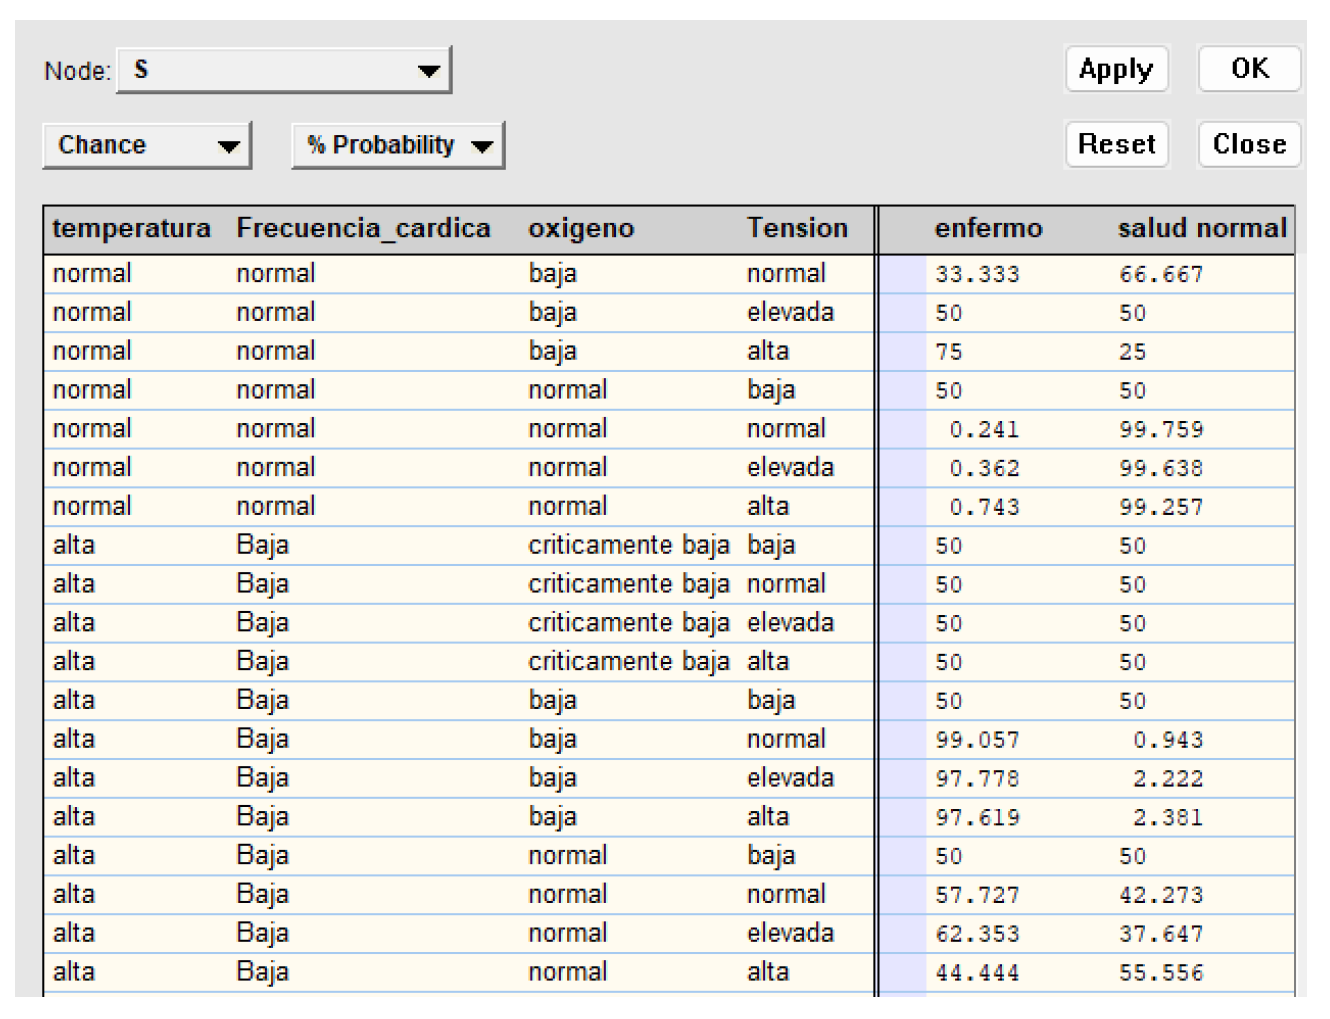
La tabla representa un modelo probabilístico de salud basado en signos vitales. Muestra cómo diferentes combinaciones de temperatura corporal, ritmo cardíaco, niveles de oxígeno y presión arterial afectan la probabilidad de que una persona esté enferma o saludable.
Este modelo permite estimar el estado de salud de un paciente basándose en mediciones simples y objetivas. Por ejemplo, una temperatura alta combinada con bajos niveles de oxígeno tiende a indicar una mayor probabilidad de enfermedad, mientras que signos vitales normales sugieren buena salud.
5.3. Matriz de Confusión
A continuación, se presentan los hallazgos más relevantes obtenidos de la matriz de confusión:
Figure 13.
Matriz de Confusión para el estado "Etiqueta".
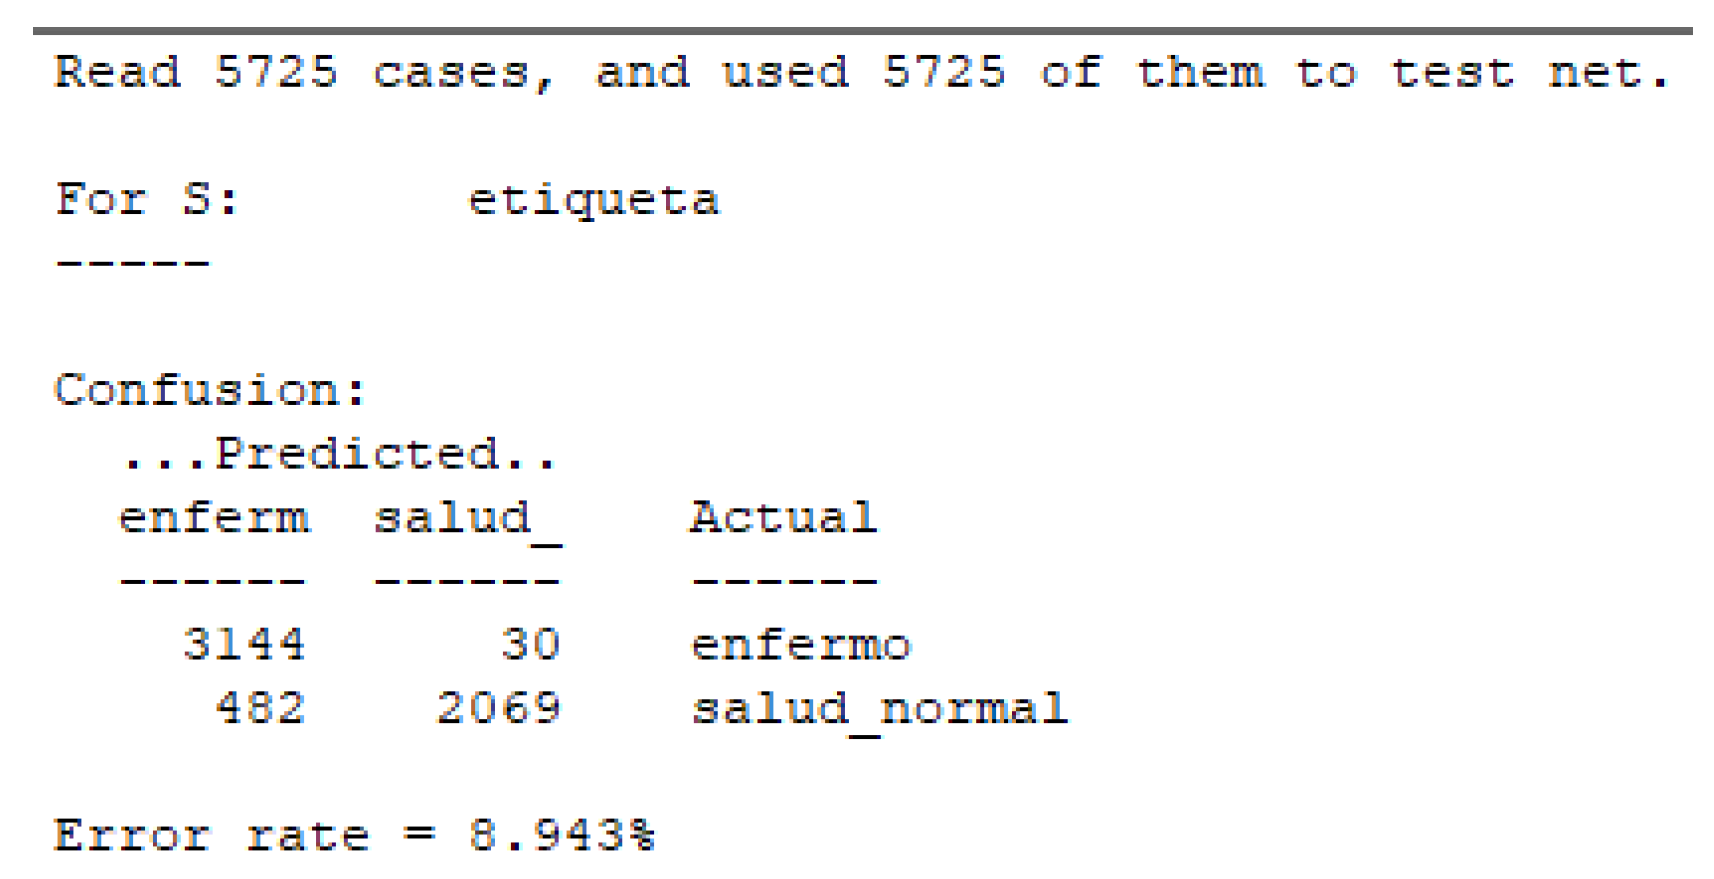
La matriz de confusión presentada muestra los resultados del modelo aplicado a los 5725 casos del dataset. En esta matriz, se observa que de los 3144 casos predichos como enfermos, 30 fueron clasificados incorrectamente, mientras que 3114 fueron clasificados correctamente como enfermos.
Por otro lado, de los 2089 casos predichos como saludables, 182 fueron incorrectamente clasificados como saludables, y 2069 fueron correctamente clasificados. Esto resulta en una tasa de error del 8.943%, lo cual indica un desempeño aceptable del modelo.
Figure 14.
Calidad de la prueba para el estado "Enfermo".
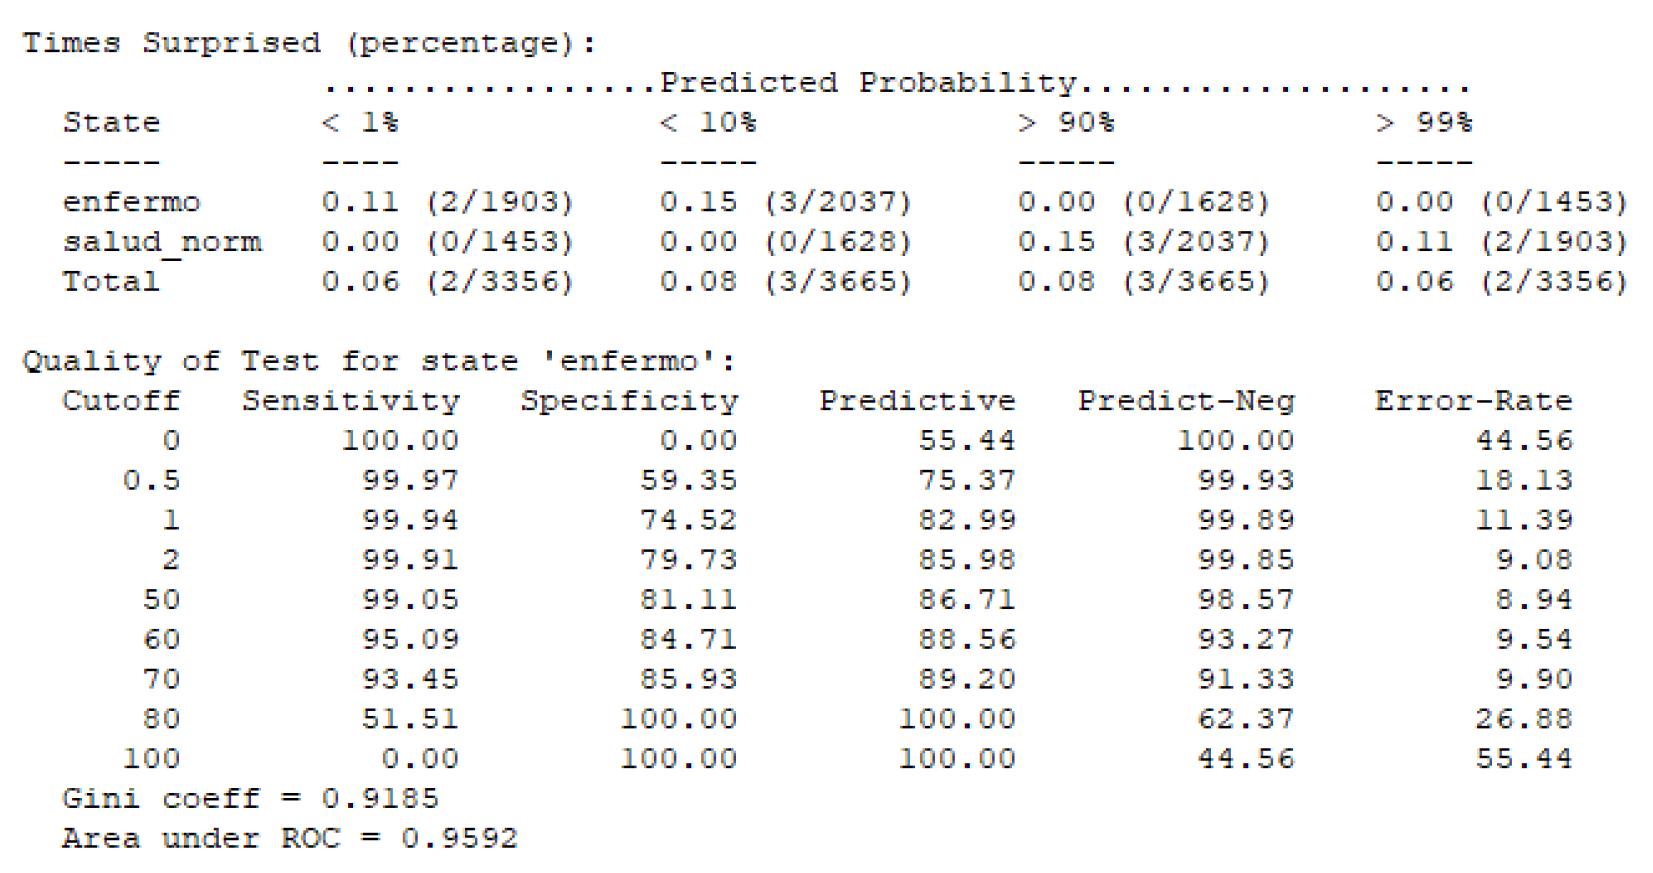
Para nuestra red bayesiana, se observa que la curva ROC presenta un área bajo la curva (AUC) de 0.9592, lo que indica un excelente rendimiento del modelo en la discriminación entre los estados de salud y enfermedad. Este valor cercano a 1 refleja la alta capacidad del modelo para distinguir correctamente entre casos "enfermos" y "no enfermos".
Además, el coeficiente Gini de 0.9185 refuerza esta conclusión, ya que un valor alto de Gini también es indicativo de una buena capacidad de discriminación del modelo.
5.3.1. Métricas de Desempeño

Table 1.
Métricas de desempeño de la red bayesiana.
| Métrica | Valor |
|---|---|
| Exactitud (Accuracy) | 0.94 |
| Intervalo de Confianza al 95% | 0.9277 - 0.9508 |
| No Information Rate | 0.555 |
| P-Valor (Acc > NIR) | < 2.2e-16 |
| Kappa | 0.877 |
| P-Valor Test de McNemar | < 2.2e-16 |
| Sensibilidad (Recall) | 0.8653 |
| Especificidad | 1.0000 |
| Valor Predictivo Positivo | 1.0000 |
| Valor Predictivo Negativo | 0.9025 |
| Prevalencia | 0.4450 |
| Tasa de Detección | 0.3851 |
| Tasa de Prevalencia de Detección | 0.3851 |
| Balanced Accuracy | 0.9326 |
La matriz de confusión y las métricas de desempeño obtenidas revelan que el modelo de Naive Bayes tiene una exactitud del 94%, lo que indica un alto nivel de precisión en las predicciones. El intervalo de confianza al 95% para la exactitud es de 0.9277 a 0.9508, proporcionando una medida de la variabilidad esperada del modelo en diferentes muestras.
5.4. Simulation Case 1
Consider a patient presenting at a clinic with the following symptoms and clinical measurements:
The patient has an elevated body temperature of 38.5°C, a high heart rate of 110 bpm, and critically low oxygen levels, registering at 88%. Despite these concerning signs, the patient’s blood glucose levels are normal, at 95 mg/dL. Additionally, the patient has elevated blood pressure at 135 mmHg.
5.4.1. Using Netica Software
Using this data, the information is input into the Bayesian network in Netica to evaluate the probability that the patient is ill.
Table 2.
Data entered into the Bayesian network.
| Variable | Value |
|---|---|
| Temperature | High |
| Heart Rate | High |
| Oxygen | Critically low |
| Blood Glucose | Normal |
| Blood Pressure | High |
Simulation Results
After inputting the data into the Bayesian network, Netica calculates the conditional probabilities and provides the following result:
Table 3.
Simulation results in Netica.
| Variable | Probability |
|---|---|
| Ill | 85.7% |
| Healthy | 14.3% |
Interpretation of the Results
The simulation in Netica indicates that, given the set of symptoms and clinical measurements provided, there is an 85.7% probability that the patient is ill. This high probability suggests that the patient shows significant signs of a respiratory condition requiring immediate medical attention.
6. Conclusions
The Naive Bayes model has demonstrated robust performance in classifying respiratory infections, with high accuracy and specificity. The results indicate a precision of 94% and a perfect specificity of 100%, suggesting that the model makes no errors in identifying cases of normal health. However, the model’s sensitivity, which measures the ability to correctly identify disease cases, is 86.53%. This implies there is room for improving the detection of positive cases and minimizing false negatives, which are critical in a clinical setting where incorrect diagnoses can lead to severe complications.
The implementation of data balancing techniques and the exploration of other classification algorithms may be valid approaches to further enhance the model’s performance. Additional methods such as using ensemble algorithms or optimizing hyperparameters could provide significant improvements in the model’s sensitivity, ensuring more precise and reliable detection of respiratory infections.
The confusion matrix and performance metrics obtained in this study suggest that the Bayesian Network model is effective for classifying respiratory infections. However, it is recommended to continue exploring and adjusting the model to increase its sensitivity and ensure greater accuracy in detecting disease cases.
Appendix A
Appendix A.1. Database
The database used in this study was obtained from the Kaggle platform. This database contains detailed information on symptoms and clinical measurements related to respiratory infections and other typical diseases.
Figure A1.
The database used.
Appendix A.2. Bayesian Network Code
The code used to build the Bayesian network and perform the simulations is available on Google Drive. This code includes the necessary scripts for data discretization, Bayesian network construction, and model evaluation.
References
- Bueno Campaña, M.; Calvo Rey, C.; Vázquez Álvarez, M.C.; Parra Cuadrado, E.; Molina Amores, C.; Rodrigo García, G.; Echávarri Olavarria, F.; Valverde Cánovas, J.; Casas Flecha, I. Infecciones virales de vías respiratorias en los primeros seis meses de vida. Anales de Pediatría 2008, 69, 400–405. [CrossRef]
- García García, M.L.; Ordobás Gabin, M.; Calvo Rey, C.; González Álvarez, M.I.; Aguilar Ruiz, J.; Arregui Sierra, A.; Pérez Breña, P. Infecciones virales de vías respiratorias inferiores en lactantes hospitalizados: etiología, características clínicas y factores de riesgo. Anales de Pediatría 2008, 69, 101–107. [CrossRef]
- García-García, M.L.; Calvo, C.; Pérez-Breña, P.; De Cea, J.M.; Acosta, B.; Casas, I. Prevalence and clinical characteristics of human metapneumovirus infections in hospitalized infants in Spain. Pediatric Pulmonology 2006, 41, 863–871. [CrossRef]
- Puga, J.L.; García, J.G.; De la Fuente Sánchez, L.; De la Fuente Solana, E.I.; others. Las redes bayesianas como herramientas de modelado en psicología. Anales de Psicología/Annals of Psychology 2007, 23, 307–316.
- Pearl, J. Probabilistic Reasoning in Intelligent Systems: Networks of Plausible Inference; Morgan Kaufmann Publishers Inc.: San Francisco, CA, USA, 1988.
- Blitzstein, J.K.; Hwang, J. Bayesian Inference: The Basics. In Introduction to Probability; Springer, 2020; pp. 25–44. [CrossRef]
- Coiras, M.; Aguilar, J.; García, M.; Casas, I.; Pérez-Breña, P. Simultaneous detection of fourteen respiratory viruses in clinical specimens by two multiplex reverse transcription nested-PCR assays. Journal of Medical Virology 2004, 72, 484–495.
- Kaggle. Kaggle Dataset: Observation de Maladie, 2023.
- Friedman, N.; Goldszmidt, M. Building classifiers using Bayesian networks. Proceedings of the Thirteenth National Conference on Artificial Intelligence - Volume 2. AAAI Press, 1996, AAAI’96, p. 1277–1284.
- Cooper, G.F.; Herskovits, E. A Bayesian method for the induction of probabilistic networks from data. Machine Learning 1992, 9, 309–347. [CrossRef]
Figure 4.
Bayesian network structure for the diagnosis of viral respiratory infections.
Disclaimer/Publisher’s Note: The statements, opinions and data contained in all publications are solely those of the individual author(s) and contributor(s) and not of MDPI and/or the editor(s). MDPI and/or the editor(s) disclaim responsibility for any injury to people or property resulting from any ideas, methods, instructions or products referred to in the content. |
© 2024 by the authors. Licensee MDPI, Basel, Switzerland. This article is an open access article distributed under the terms and conditions of the Creative Commons Attribution (CC BY) license (http://creativecommons.org/licenses/by/4.0/).
Copyright: This open access article is published under a Creative Commons CC BY 4.0 license, which permit the free download, distribution, and reuse, provided that the author and preprint are cited in any reuse.


