Submitted:
21 July 2024
Posted:
22 July 2024
You are already at the latest version
Abstract
Evaluating the economic and environmental effects of farmers' green production behaviors holds important reference value for promoting sustainable agricultural development, alleviating agricultural non-point source (NPS) pollution, and achieving the organic combination of environmental protection and economic development. This paper utilizes survey data from 1,345 farm households in the main rice production areas of Jiangxi Province, China, using the example of reduced fertilizer application (RFA) among rice farmers. By constructing a DEA—SBM model with undesirable outputs to measure environmental effects, and applying an endogenous switching model to test the economic and environmental effects of farmers' adoption of green production technologies. The study found that: (1)The behavior of RFA by farmers has a significant positive impact on their net profit per mu(NPPA), helping farmers increase their income, with the increase ranging from 2.05% to 6.54%. (2)The behavior of RFA by farmers has a significant positive impact on agricultural green productivity(AGP), contributing to the improvement of the environment, with the improvement ranging from 44.09% to 45.35%. (3)Heterogeneity analysis found inconsistencies in the income-enhancing and environmental-enhancing effects at different quantiles of NPPA and AGP. Therefore, attention should be placed on improving the agricultural product quality supervision system under the market circulation mechanism, creating land scale conditions conducive to the promotion and application of fertilizer reduction technologies, and promoting the implementation of externality internalization compensation systems.
Keywords:
farmers' green production behaviors
; reduced fertilizer application
; economic effects
; environmental effects
; endogenous switching model
1. Introduction
Promoting green agricultural development and improving agricultural ecological efficiency are essential pathways to achieving the organic integration of environmental protection and economic development. They are also crucial for advancing supply-side structural reforms in agriculture, and implementing the strategies of green agriculture and quality agriculture. For the past few years, China’s agricultural economy has developed rapidly, with fertilizers playing an indispensable driving role as a key agricultural input [1]. However, fertilizer input has surpassed the optimal level, that balances economic returns and ecological efficiency [2]. According to the law of diminishing marginal returns to factor inputs, as fertilizer application exceeds the optimal level, its marginal output declines [3,4]. Over-reliance on fertilizers suppresses agricultural economic growth and induces severe ecological crises, such as soil fertility decline, water pollution, and increased greenhouse gas emissions. Which threaten the safety of agricultural products and constrain sustainable agricultural development [5]. Under the dual pressures of economic slowdown and tightening resource and environmental constraints, the Chinese government highlights the importance of comprehensive prevention and control of agricultural NPS pollution. It calls for strengthening rural ecological civilization construction, and solid promotion of fertilizer and pesticide reduction and efficiency actions. Agricultural production must shift from over-reliance on resource consumption to an environmental friendly, and sustainable development model, striving to achieve the integrated goals of improving agricultural product quality, increasing agricultural output, and enhancing the ecological environment.
Under the context of the new era, farmers’ green production behaviors, which are crucial for improving agricultural product quality, preventing agricultural NPS pollution, and ensuring food safety, serve as a key driving force for achieving sustainable agricultural development. The RFA is a typical green agricultural production behavior and has received widespread attention from the government and academia [6]. Many farmers actively cooperate with national agricultural reduction-related work and social development goals, vigorously implementing RFA. Existing research on RFA mainly focuses on viewing this behavior as an outcome variable, exploring the obstacles to achieving RFA. The research scope primarily involves individual-level behavioral inertia changes, technical cognition, and risk preferences of farmers [7]; the allocation of production factors (land, capital, labor) at the household level [8]; and socialized services, technical training, and subsidies for green production technologies at the agricultural production level [9]. Although RFA are influenced by many factors, farmers only adopt fertilizer reduction technologies if the net profit exceed those of traditional fertilization methods [10]. Thus, whether the goal of maximizing farmers’ economic benefits can be met is key to the successful promotion of RFA. Meanwhile, under the increasingly severe trend of agricultural NPS pollution, whether RFA can address ecological environment shortcomings is also a matter of concern.
So, can RFA successfully achieve both economic and environmental goals? In the context where the contradiction between economic rationality and ecological rationality cannot be effectively reconciled, the debate on this goal continues. From the perspective of natural sciences, most studies based on field experiments, RFA plays an important role in increasing agricultural yield and improving the environment situation. For example, reducing fertilizer use by 10% in the wheat production drought-drought model, and by 24% in the dry-wet rotation mode, which can produce a certain "reduction and efficiency enhancement" effect. Remarkable differences in farmers’ economic benefits under different fruit tree irrigation and fertilization modes [11]. Some studies point out that the yield improvement effect of RFA is not significant in the initial year, but yields increase with the years of adoption [12]. Additionally, RFA helps improve soil fertility, increase soil biodiversity, enhancing soil health, ensuring crop yields, improving agricultural product quality, controlling agricultural NPS pollution, and reducing greenhouse gas emissions [13]. From an economic perspective, adopting green production technologies can reduce fertilizer use by 11.97%-20.98%, and increase agricultural operating income by 8.15%-9.07%. RFA decreases farmers’ reliance on chemical inputs, thus lowering agricultural chemical input costs [14]. Moreover, RFA can effectively promote the standardization of crop production, enhance the safety of agricultural products, increase the market competitiveness of agricultural products, and achieve a premium for green agricultural products, thereby increasing farmers’ income [15,16]. The application of soil testing and formulated fertilization technologies can increase agricultural product yields and have considerable economic benefits [17]. Green inputs can drive agricultural economic growth, achieving the goal of increasing production without increasing pollution [18]. However, some scholars argue that although RFA can reduce inputs, the current imperfect green agricultural product certification system in China, leads to insufficient premiums for green production, making it difficult for farmers to directly gain additional profits from FRA [19], which hindering farmers’ income growth goals.
The existing literature reveals several key points: First, many conclusions about the economic and environmental effects of RFA are based on natural science experiments. There is a relative lack of empirical research at the micro-farmer level using econometric models. Because the internal and external environments of natural science experiments are strictly controlled, it is difficult to effectively reveal the impact of individual farmer heterogeneity in real-world settings. Second, existing studies have a narrow scope in evaluating the effects of green agricultural production behaviors. They typically focus on the impact on crop yield or fertilizer use alone, lacking a dual evaluation system for both economic and environmental effects. Third, research from a micro-farmer perspective that measures agricultural environmental effects, mainly focuses on the actual amount or cost of fertilizers and pesticides, making it difficult to effectively identify the extent, which farmer behaviors impact the ecological environment. In view of the above, our study is based on a sample survey of 1,345 rice farmers in 30 counties (cities, districts) in Jiangxi Province, China in 2022. From a micro perspective, we construct a DEA—SBM model with undesirable outputs to measure environmental effects, and use an endogenous switching model to explore the potential economic and environmental effects of RFA in rice cultivation. This study aims to further expand existing research, and provide necessary policy references for the broader promotion of agricultural input—reduction production.
2. Theoretical Framework
2.1. Economic Effects of Farmers’ RFA
As rational economic agents, maximizing household income is the key intrinsic motivation for farmers to adopt agricultural input-reduction production practices. Therefore, the positive expectations of the economic benefits from RFA drive farmers to implement their behaviors. This paper begins by exploring the economic effects on rice farmers, analyzing the potential economic effects of RFA from three aspects: cost savings, yield increases, and product premiums.
Firstly, adopting green agricultural production methods can help farmers avoid over-reliance on chemical inputs. By reducing the amount and frequency of fertilizer applications, the input cost of fertilizers can be lowered [20]. Additionally, compared to traditional fertilization methods, farmers who use soil formulators and precision fertilizer appliances can improve fertilization efficiency. This method not only reduces the amount of fertilizer used, but also allows farmers to gain a price advantage in the market through bulk purchasing of fertilizers, thereby reducing production costs [21].
Secondly, according to the law of diminishing marginal returns on factor inputs, the relationship between fertilizer input and marginal output in agricultural production shows an "inverted U-shaped" trend [22]. When the amount of fertilizer input reaches its maximum limit, the marginal output decreases as the application amount increases. Thus, under the current agricultural production technology conditions or farming habits, blindly increasing fertilizer input, does not significantly enhance yield. Moreover, studies have shown that compared to small-scale farmers, large-scale farmers use less fertilizer but achieve higher yields [23]. This indicates that scientific and appropriate fertilization methods can increase agricultural product yields [24].
Finally, RFA can promote the standardization of crop production, improve the quality and safety of agricultural products, effectively avoid excessive fertilizer residues, increase market competitiveness, and achieve a premium for green agricultural products, thereby increasing farmers’ income. As the quality of agricultural products improves, farmers gain stronger market competitiveness and a price premium advantage in the trading market [25]. Thus, appropriate RFA provide a foundation for stable crop income, improve the commercial value of crops, and increase farmers’ economic returns [26]. Thus, the following research hypotheses is proposed:
H1:
Farmers’ RFA significantly increases the NPPA in rice production.
2.2. Environmental Effects of Farmers’ Fertilizer Reduction Behavior
Considering agricultural economic growth, it is also necessary to address the environmental issues arising from agricultural production processes. In recent years, scholars have begun to focus on the positive effects of green production technologies on the ecological environment. They have gradually incorporated agricultural pollution (such as agricultural carbon emissions, pesticide residues, and excessive fertilizer use) as undesirable outputs of agricultural production, put it into the framework for evaluating agricultural productivity [27]. By analyzing the relationship between factor inputs, economic outputs, and the ecological environment in agricultural production, the environmental effects of agriculture can be measured. AGP is a key indicator of environmental effects, representing the ability to achieve maximum agricultural output with minimal resource consumption and environmental pollution, under a certain combination of agricultural input factors [28,29].The environmental effects of farmers’ RFA are specifically reflected in the following ways: RFA can reduce agricultural NPS pollution. Unreasonable fertilizer application methods are a major cause of agricultural NPS pollution, affecting water, soil, and air. In rice production, excessive and inefficient use of chemicals leads to numerous fertilizer residue in the soil, disrupting the soil’s pH balance, causing soil acidification and compaction, and hindering sustainable agricultural development [30]. Excessive fertilizer use leads to phosphorus accumulation in the topsoil and excessive heavy metals [31], which, in eutrophic water environments, impede crop survival and severely impact the agricultural ecological environment. Soil respiration produces carbon dioxide, and over-fertilization increases the emissions of carbon dioxide, nitrogen oxides, and other gases, thus leads to atmospheric pollution [32]. RFA alleviate these environmental pollution issues and improve agricultural environmental efficiency. Thus, the following research hypotheses is proposed:
H2:
Farmers’ RFA significantly enhances AGP.
3. Data Source, Variable Selection, and Model Setting
3.1. Data Source
The sample data used in this study, were obtained from a micro-survey conducted by the research team on rice farmers in Jiangxi Province, China, from November 2022 to August 2023. The selection of samples and regions was considered based on the following: China ranks among the top in the world in rice production and consumption, with the planting area and output of rice accounting for 20% and 33% of the world’s total, respectively. According to existing research, nitrogen fertilizer in rice production contributes about 50% of the total carbon emissions in the entire production process, primarily due to improper fertilizer application [33]. Therefore, this study focuses on the fertilizer input in rice production, from the perspective of rice farmers’ production behaviors. Jiangxi Province is a traditional agricultural province and a major rice-producing area in China. For a long time, Jiangxi has promoted agricultural supply-side structural reforms, adhering to the principles of industrial agriculture, green agriculture, quality agriculture, and brand agriculture. The province has achieved a negative growth rate in fertilizer use for five years, with a reduction of 18.57% in 2022, compared to 2016. Thus, selecting rice farmers in Jiangxi Province as the research subjects, to explore the economic and environmental effects of farmers’ RFA is representative, data-supported, and practically significant.
To ensure the scientific and rational selection of survey regions and samples, the research team first divided the per capita GDP of 100 counties (cities, districts) in Jiangxi Province into three different regions: high, medium, and low. Using random sampling, 10 counties were selected from each region. Then, from each county, two townships were randomly selected, and from each township, two villages were randomly selected. Finally, 5-15 rice farming households were randomly selected from each village. The distribution of sample counties is drawn by ArcGIS as shown in Figure 1. The survey was conducted through face-to-face interviews between the interviewers and the respondents. A total of 1,500 questionnaires were distributed, with 1,410 questionnaires actually recovered, questionnaire validity rate of 94%. After excluding invalid indicators as required by the study, 1,345 valid samples were selected for analysis.
3.2. Model Setting
Considering that whether rice farmers have RFA is a non-random event, this can lead to sample selection bias. Additionally, non-random controlled trials can’t obtain information about the "counterfactual" making it difficult to identify causal relationships. Without correction, biased estimates may result. Therefore, considering the probability of rice farmers adopting RFA, estimating the treatment effects of this behavior on economic and environmental effects becomes crucial. In view of this, we employ an endogenous switching model to overcome sample selection bias caused by unobservable variables. This model can fit the effect decision equations and "counterfactual" equations, for both adopters and non-adopters of RFA, compensating for the shortcomings of previous research methods.
First, we establish the decision equation for rice farmers’ RFA as follows:
represents the unobservable variable for the decision to adopt RFA.represents the observable factors influencing the adoption of RFA.represents the parameters to be estimated.represents the random disturbance term. The impact effect equation for adopting RFA is given by:
and represent the economic and environmental effects produced by rice farmers who have adopted and those who have not adopted the RFA, respectively. represents other variables influencing these effects. This variable can overlap with in Equation (1), but there must be at least one identifiable variable not included in . This variable only affects rice farmers’ decision of whether adopt RFA, and does not affect the economic and environmental effects. Therefore, the average adoption of the RFA by other farmers in the village, excluding the farmer in question, is selected as the identifiable variable. It should be noted that due to the "herd effect," farmers’ decisions to adopt the RFA are influenced by other farmers, meeting the requirement of correlation. Meanwhile, other farmers’ decisions to adopt the RFA do not directly affect the NPPA and AGP of the farmer in question, meeting the requirement for exogeneity. is the parameter to be estimated; is the random disturbance term.
The conditional expectations of rice farmers under the two scenarios of whether they adopt the RFA:
,,v is a random disturbance term with an expected value of 0.
Next, we estimate the expected values of the economic and environmental effects in the two "counterfactual" scenarios: the effects for rice farmers who have adopted the RFA when they do not adopt it, and the effects for rice farmers who have not adopted the RFA when they do adopt it.
The average treatment effect on the treated (ATT) for the economic and environmental effects of rice farmers, who have adopted the RFA (treatment group) is represented by the difference between Equation (4) and Equation (6):
The average treatment effect on the untreated (ATU) for the economic and environmental effects of rice farmers, who have not adopted the RFA (control group) is represented by the difference between Equation (5) and Equation (7):
3.3. Variable Selection
3.3.1. Dependent Variables
(1) Economic Effect. From a "cost-benefit" perspective, this paper measures the economic effect of rice planting using the average NPPA for 2022. The calculation is based on the sales price of rice multiplied by the average yield per mu1, minus the average cost per mu. The main costs include land rent, labor costs, agricultural input (fertilizers, pesticides, seeds, herbicides), machinery costs, and other costs (such as electricity) [34].
(2) Environmental Effect. The AGP measurement model accounts for input-output slack variables, effectively addresses the bias caused by slackness and radial and angular selection of inputs and outputs. It not only achieves the required efficiency, but also provides improvement targets and degrees for input factors and the distance from undesirable outputs in decision-making units [35]. Therefore, this paper uses the DEA—SBM model based on undesirable outputs to measure AGP, which represents the agricultural environmental effect. The input indicators include land input (mu), labor input (workdays), agricultural inputs (fertilizers, pesticides, seeds, herbicides) (CNY), and machinery input (CNY). The output indicators include desirable and undesirable outputs, the desirable output is the total rice yield (in kilograms). The undesirable outputs include the emissions of nitrogen and phosphorus (in kilograms) during agricultural production. According to the material balance method [36], the emissions of nitrogen and phosphorus during rice production equal the pure content of nitrogen and phosphorus in fertilizers minus their content in the rice grains2. If the calculated index is positive, it indicates a negative impact of agricultural production on the environment; if the index is negative, it indicates a positive impact. The specific input-output descriptions and statistics are shown in Table 1.
3.3.2. Independent Variables
Currently, studies on RFA typically use the actual amount of fertilizer input for measurement [37]. Some studies identify the degree of fertilizer reduction by measuring fertilizer use efficiency [38]. With the continuous attention from the government and academia to the issue of agricultural NPS pollution, the methods for measuring fertilizer reduction have also been improved. Drawing on the measurement methods of fertilizer reduction effects by [39] and [40], this paper first calculates the optimal amount of fertilizer input in rice production by constructing a Cobb-Douglas production function. Then, by comparing the actual amount of fertilizer input by farmers with the optimal application amount, it determines whether the farmers have implemented RFA. Farmers whose actual fertilizer application amount is at or below the optimal level, are assigned a value of 1, indicating that they have RFA; otherwise, they are assigned a value of 0, indicating that they have not RFA.
3.3.3. Control Variables
To reduce estimation bias caused by omitted variables, this paper controls the following variables:①Individual characteristics, including the age, education level, risk preference, training frequency, whether the village cadres, and work experience [41].②Household characteristics, including the number of laborers and total household income [42].③Agricultural production characteristics, including land management scale, degree of land parcel consolidation, soil fertility, and distance of the land plots [43,44].Descriptive statistical analysis of the variables is shown in Table 2.
The independent sample t-test results in Table 2, shows that the average NPPA of the farmers in the fertilizer reduction sample group (677.86 CNY), is significantly higher than the farmers in the non-reduction sample group (504.78 CNY); the AGP of the farmers in the fertilizer reduction sample group (0.51) is significantly higher than the farmers in the non-reduction sample group (0.27).
4. Results and Discussion
4.1. Simultaneous Estimation Results and Analysis
To test the potential economic and environmental effects of farmers’ RFA, a simultaneous estimation was performed using the decision function of farmers’ RFA, along with the NPPA and AGP function of rice. The test results are shown in Table 3. The independence LR test for the two-stage equations, rejected the null hypothesis of mutual independence between the selection equation and the outcome equation at the 10% level. The Wald test rejected the null hypothesis, that mutual independence between the behavior equation and the outcome equation at the 5% level, indicating the model has strong significance. Additionally, the error term correlation coefficient ρ1 was significant at the 5% statistical level, suggesting that unobservable factors influence farmers’ decisions on RFA, indicating the presence of selection bias, which validates the use of the ESRM. Moreover, the estimated values of the correlation coefficient ρ1 in both sets of simultaneous equations, were significantly positive, indicating that farmers who adopted RFA, had higher NPPA and AGP than the average of the sample farmers, which is consistent with research hypotheses 1 and 2.
Regarding the selection equation, factors such as the farmer’s age, risk preference, whether the village cadres, total household income, degree of land parcel consolidation, and distance of land plots significantly influenced farmers’ RFA. In terms of the outcome equation, from the economic effect perspective, land management scale had a significant positive impact on the NPPA of rice production, indicating the presence of scale effects in rice production. The training frequency and the total number of laborers, significantly positively impacted the NPPA of farmers who have RFA, suggesting that participation in training, enhances farmers’ ability to acquire production and market information, thereby improving agricultural production benefits. Additionally, a higher number of agricultural laborers in a household, where income mainly comes from agricultural production, increases the likelihood of being exposed to and understanding green pest control technologies, resulting in greater economic effects. From the environmental effect perspective, the frequency of training participation and the number of agricultural laborers, had a significant positive impact on the AGP of farmers, further highlighting the importance of agricultural training and labor input in agricultural production. The land management scale significantly positively impacted the AGP of farmers who have RFA, indicating the presence of scale effects in green agricultural production. Soil fertility had a significant positive impact on the AGP of farmers who have RFA. For land with higher soil fertility, farmers tend to apply less fertilizer, resulting in higher environmental effects.
4.2. Analysis of the Economic Effects of Farmers’ RFA
To reflect the impact of farmers’ RFA on their NPPA and AGP, the expected values of NPPA for non-reduction households and reduction households, adjusted for sample bias, were calculated using equations (4) and (5). Additionally, the NPPA and AGP of the reduction group and non-reduction group under two "counterfactual" scenarios, were calculated using equations (6) and (7). Finally, the treatment effects of farmers’ RFA on NPPA and AGP, ATT and ATU were calculated using equations (8) and (9). The estimated average treatment effects of RFA on NPPA are shown in Table 4. The ATT value is 0.437, indicating that if farmers adopting fertilizer reduction technology did not adopt this technology, their NPPA from rice production would decrease. The ATU value is 0.131, indicating that for farmers who have not implemented fertilizer reduction, adopting this technology would increase their NPPA from rice production.
To more clearly reflect the economic effects of farmers’ RFA, the probability density distribution graphs of NPPA for reduction and non-reduction households were described separately. As shown in Figure 2 (left), if farmers who reduced fertilizer use chose not to reduce it, the probability density distribution curve of their NPPA, would shift significantly to the left. In the "counterfactual" scenario that reduction households do not reduce fertilizer, their NPPA would significantly decrease by 6.54%. Conversely, the ATU in Figure 2 (right) indicates that in the "counterfactual" scenario, non-reduction households choose to reduce fertilizer, the probability density distribution curve of their NPPA would shift to the right, suggesting that if non-reduction farmers chose RFA, their NPPA would increase by 2.05%. Hence, the fertilizer reduction behavior of sample farmers could increase their NPPA by 2.05%-6.54%. Based on the above analysis, it can be concluded that research hypothesis H1 is validated.
4.3. Analysis of the Environmental Effects of Farmers’ RFA
Table 5 presents the average treatment effects of farmers’ RFA on AGP. The results show that adopting RFA has a significant positive treatment effect on farmers’ AGP. The ATT value is 0.224, indicating that if farmers who adopted RFA did not adopt this technology, their AGP would decrease. The ATU value is 0.122, indicating that for farmers who have not implemented fertilizer reduction, adopting this behavior would increase their AGP.
To more clearly reflect the environmental effects of farmers’ RFA, the probability density distribution graphs of AGP for reduction and non-reduction households were described separately. As shown in Figure 3 (left), if farmers who reduced fertilizer use chose not to reduce it, the probability density distribution curve of their AGP would shift significantly to the left. In the "counterfactual" scenario where reduction households do not reduce fertilizer, their AGP would significantly decrease by 44.09%. Conversely, the ATU in Figure 3 (right) indicates that in the "counterfactual" scenario that non-reduction households choose to reduce fertilizer, the probability density distribution curve of their AGP would shift significantly to the right, suggesting that if non-reduction farmers chose RFA, their AGP would increase by 45.35%. Therefore, the RFA of sample farmers could increase their AGP by 44.09%-45.35%. Based on the above analysis, it can be concluded that research hypothesis H2 is validated.
4.4. Robustness Test
To ensure the reliability of the above conclusions, robustness tests were conducted by replacing the estimation methods. The OLS model, Tobit model, and Propensity Score Matching (PSM) method, were used to examine the economic and environmental effects of farmers’ RFA. The specific test results are shown in Table 6. Table 6 presents the regression results using the OLS model and Tobit model. The results show that RFA have a significant positive impact on the NPPA and the AGP of rice farmers. Table 7 shows the impact results of farmers’ RFA on NPPA and AGP, estimated by the nearest neighbor matching, kernel matching, and caliper matching. It can be found that the average treatment effect (ATT), estimated by the three matching methods is significantly positive, indicating that farmers’ RFA can significantly improve their economic and environmental effects. The results of the OLS model, Tobit model, and the PSM method, are consistent with the results of the endogenous switching model, indicating that the model results are robust.
Column of Table 7 presents the average results of the three matching methods’ ATT. It can be found that farmers’ RFA can significantly improve the economic and environmental effects of rice production. After excluding other factors, RFA can increase the NPPA of rice farmers by an average of 0.23, with an increase of 3.49%; RFA can increase the AGP of rice farmers by an average of 0.24, with an increase of 47.06%. The results of the PSM test, whether it is the increase in net profit or the increase in AGP, are within the estimation range of the endogenous switching model, further verifying the robustness of the research conclusions.
4.5. Analysis of Differences in Economic and Environmental Effects of RFA Among Farmers of Different Management Scales
To further analyze the heterogeneous effects of farmers’ RFA on economic and environmental outcomes at different quantiles, this study employs quantile regression to examine the effects at the 25th, 50th, and 75th quantiles of economic and environmental outcomes. The previous research conclusions, indicate that RFA have a significant positive impact on the NPPA and AGP. Quantile regression provides a clearer understanding, the differential impacts of RFA on various levels of NPPA and AGP. The test results are shown in Table 8. From an economic perspective, RFA have a significant positive impact across different levels of NPPA. The impact is highest at the lower net profit level (0.25 quantile), and decreases as the net profit level increases. This indicates that the economic effect of RFA diminishes, as the profit from rice production increases, suggesting that for farmers with higher profits, the economic benefits of RFA have reached an optimal level. Thus, RFA should not be a continuous practice, but should aim for the optimal application amount to maximize economic benefits. From an environmental perspective, RFA have a significant positive impact across different levels of AGP, with the impact increasing significantly as green productivity improves. This suggests that farmers with relatively low green productivity, have a stronger inertia towards high fertilizer application, and the path dependency of agricultural production limits the environmental benefits of RFA. Therefore, for farmers with relatively low AGP, improving environmental outcomes will also rely on additional collaborative measures beyond fertilizer reduction.
The above analysis is based on regression results at specific quantiles. This study further describes the marginal contributions and trends of RFA on economic and environmental outcomes across all quantiles (as shown in Figure 4). The results in Figure 4 indicate, that the coefficients of the impact of RFA on NPPA and AGP are generally greater than 0, confirming that RFA enhance both economic and environmental outcomes. These findings are consistent with the main conclusions presented earlier.
5. Conclusions
This study based on a sample of 1,345 rice farmers in Jiangxi Province, explores the economic and environmental effects of farmers’ RFA. The research results are as follows: In terms of economic effect, RFA have a significant positive impact on the NPPA, helping farmers increase their income. The increase in income ranges between 2.05% and 6.54%. In terms of economic effect, RFA significantly enhance AGP, improving the agricultural environment. The improvement ranges between 44.09% and 45.35%. The income-increasing effects and environmental improvement effects vary across different levels of NPPA and AGP. As NPPA increases, the economic effect of RFA decreases; conversely, as AGP increases, the environmental effect of RFA shows a significant upward trend.
Based on the above research conclusions, the following policy recommendations are proposed to promote green production behaviors among farmers, and effectively achieve fertilizer reduction: firstly, encourage RFA among low-profit farmers, encourage and guide low-profit farmers to adopt integrated green agricultural production technologies, to stimulate income potential. Improve the quality supervision system for green agricultural products, within the market circulation mechanism. Promote the certification of agricultural product quality, based on the quality evaluation results from monitoring departments, implement differentiated pricing for agricultural products of different quality levels. Increase the development of green and organic agricultural products, on the basis of promoting green and organic agricultural products at high quality and good prices. Secondly, create favorable land scale conditions for fertilizer reduction technology promotion: research indicates that expanding farmers’ operational scale is crucial for achieving RFA. In the context of the "three rights separation" reform in contracted land, actively promote property rights system reform, further activate the rural land management rights market, accelerating land transfer, expand farmers’ operational scale. This will facilitate RFA through scale economies. Thirdly, implement externality internalization compensation system: RFA improve the environment and enhance social benefits, thus having the characteristics of public goods. Develop corresponding compensation policies for behaviors with positive externalities, to ensure the effective implementation of RFA. Governments should provide technical, financial, and other compensations to farmers who actively adopt fertilizer reduction technologies.
Author Contributions
Conceptualization, M.L.Z. and L.Z.; methodology, M.L.Z.; software, M.L.Z.; validation, M.L.Z., L.Z. and W.Y.Z.; formal analysis, W.Y.Z.; investigation, L.Z.; resources, W.Y.Z.; data curation, M.L.Z.; writing—original draft preparation, M.L.Z.; writing—review and editing, L.Z.; visualization, W.Y.Z.; supervision, W.Y.Z.; project administration, W.Y.Z.; funding acquisition, W.Y.Z. All authors have read and agreed to the published version of the manuscript.
Funding
This research was funded by the NATIONAL NATURAL SCIENCE FOUNDATION OF CHINA, grant number 72163014.
Institutional Review Board Statement
This study was granted exemption by the Welfare Ethics Committee of Jiangxi Agricultural University (acceptance number: JXAULL-20221002). We certify that the study was performed in accordance with the 1964 declaration of HELSINKI and later amendments. Ethical review and approval were waived for this study due to REASONS: This study does not fall within the scope of ethical research. The authors use survey data from the research group at Jiangxi Agricultural University for analysis. The survey was conducted anonymously, and all participants were fully informed of the reasons for conducting the survey and the use of relevant data. No personal identity information was collected during the survey, and there were no conflicts of interest or potential risks for the rights holders.
Data Availability Statement
The raw data supporting the conclusions of this article will be made available by the authors on request.
Acknowledgments
The authors thank the precious help offered by Master Zhang Xu and Dr. Zhang Yuhan, Jiangxi Agricultural University.
Conflicts of Interest
The authors declare no conflicts of interest.
References
- McArthur, J.W.; McCord, G.C. Fertilizing growth: Agricultural inputs and their effects in economic development. Journal of development economics 2017, 127, 133–152. [Google Scholar] [CrossRef] [PubMed]
- Lyu, Y.; Yang, X.; Pan, H.; Zhang, X.; Cao, H.; Ulgiati, S.; Wu, J.; Zhang, Y.; Wang, G.; Xiao, Y. Impact of fertilization schemes with different ratios of urea to controlled release nitrogen fertilizer on environmental sustainability, nitrogen use efficiency and economic benefit of rice production: A study case from Southwest China. Journal of Cleaner Production 2021, 293, 126198. [Google Scholar] [CrossRef]
- Liu, X.; Zhang, Y.; Han, W.; Tang, A.; Shen, J.; Cui, Z.; Vitousek, P.; Willem, E.J.; Goulding, K.; Christie, P.; Fangmeier, A.; Zhang, F. Enhanced Nitrogen Deposition over China. Nature 2013, 494, 459–462. [Google Scholar] [CrossRef] [PubMed]
- Wesenbeeck, C.F.A.V.; Keyzer, M.A.; Veen, W.C.M.V.; Qiu, H. Can China’s overuse of fertilizer be reduced without threatening food security and farm incomes? Agricultural Systems 2021, 190, 103093. [Google Scholar] [CrossRef]
- Pretty, J.; Bharucha, Z.P. Sustainable intensification in agricultural systems. Annals of botany 2014, 114, 1571–1596. [Google Scholar] [CrossRef] [PubMed]
- Smith, L.E.; Siciliano, G. A comprehensive review of constraints to improved management of fertilizers in China and mitigation of diffuse water pollution from agriculture. Agriculture. Ecosystems & Environment 2015, 209, 15–25. [Google Scholar] [CrossRef]
- Blasch, J.; Kroon, B.V.D.; Beukering, P.V.; Munster, R.; Fabiani, S.; Nino, P.; Vanino, S. Farmer preferences for adopting precision farming technologies: a case study from Italy. European Review of Agricultural Economics 2022, 49, 33–81. [Google Scholar] [CrossRef]
- Hajjar, R.; Ayana, A.N.; Rutt, R.; Hinde, O.; Liao, C.; Keene, S.; Bandiaky-Badji, S.; Agrawal, A. Capital, labor, and gender: the consequences of large-scale land transactions on household labor allocation. The Journal of Peasant Studies 2020, 47, 566–588. [Google Scholar] [CrossRef]
- Ju, X.; Gu, B.; Wu, Y.; Galloway, J.N. Reducing China’s fertilizer use by increasing farm size. Global environmental change 2016, 41, 26–32. [Google Scholar] [CrossRef]
- Chianu, J.N.; Chianu, J.N.; Mairura, F. Mineral fertilizers in the farming systems of sub-Saharan Africa. A review. Agronomy for sustainable development 2012, 32, 545–566. [Google Scholar] [CrossRef]
- Parvizi, H.; Sepaskhah, A.R.; Ahmadi, S.H. Effect of drip irrigation and fertilizer regimes on fruit yields and water productivity of a pomegranate (Punica granatum (L.) cv. Rabab) orchard. Agricultural Water Management 2014, 146, 45–56. [Google Scholar] [CrossRef]
- Lundy, M.E.; Pittelkow, C.M.; Linquist, B.A.; Liang, X.; Groenigen, K.J.V.; Lee, J.; Six, J.; Venterea, R.T.; Kessel, C.V. Nitrogen fertilization reduces yield declines following no-till adoption. Field Crops Research 2015, 183, 204–210. [Google Scholar] [CrossRef]
- Li, P.; Zhang, H.; Deng, J.; Fu, L.; Chen, H.; Li, C.; Xu, L.; Jiao, J.; Zhang, S.; Wang, J.; Ying, D.; Li, H.; Hu, F. Cover crop by irrigation and fertilization improves soil health and maize yield: Establishing a soil health index. Applied Soil Ecology 2023, 182, 104727. [Google Scholar] [CrossRef]
- Hawkesford, M.J. Reducing the reliance on nitrogen fertilizer for wheat production. Journal of cereal science 2014, 59, 276–283. [Google Scholar] [CrossRef] [PubMed]
- Midingoyi, S.K.G.; Kassie, M.; Muriithi, B.; Diiro, G.; Ekesi, S. Do Farmers and the Environment Benefit from Adopting Integrated Pest Management Practices? Evidence from Kenya. Journal of Agricultural Economics 2019, 2, 452–470. [Google Scholar] [CrossRef]
- Tian, M.; Zheng, Y.; Sun, X.; Zheng, H. A research on promoting chemical fertiliser reduction for sustainable agriculture purposes: Evolutionary game analyses involving ‘government, farmers, and consumers’. Ecological Indicators 2022, 144, 109433. [Google Scholar] [CrossRef]
- Liu, Y.; Ruiz-Menjivar, J.; Zhang, L.; Zhang, J.; Swisher, M.E. Technical training and rice farmers’ adoption of low-carbon management practices: the case of soil testing and formulated fertilization technologies in Hubei, China. Journal of Cleaner Production 2019, 226, 454–462. [Google Scholar] [CrossRef]
- Zhang, F. Agriculture green development: A model for China and the world. Front. Agr. Sci. Eng 2020, 7, 5–13. [Google Scholar] [CrossRef]
- Sherf, M.H. When is Standardization Slow? International Journal of IT Standards and Standardization Research 2003, 19–32. [Google Scholar] [CrossRef]
- Wu, P.; Liu, F.; Li, H.; Cai, T.; Zhang, P.; Jia, Z. Suitable fertilizer application depth can increase nitrogen use efficiency and maize yield by reducing gaseous nitrogen losses. Science of the Total Environment 2021, 781, 146787. [Google Scholar] [CrossRef]
- Alene, A.D.; Manyong, V.M.; Omanya, G.; Mignouna, H.D.; Bokanga, M.; Odhiambo, G. Smallholder market participation under transactions costs: Maize supply and fertilizer demand in Kenya. Food policy 2008, 33, 318–328. [Google Scholar] [CrossRef]
- Wang, X.; Shao, S.; Li, L. Agricultural inputs, urbanization, and urban-rural income disparity: Evidence from China. China Economic Review 2019, 55, 67–84. [Google Scholar] [CrossRef]
- Yang, Y.; He, Y.; Li, Z. Social Capital and the Use of Organic Fertilizer: An Empirical Analysis of Hubei Province in China. Environmental Science and Pollution Research 2020, (1), 15211–15222. [Google Scholar] [CrossRef] [PubMed]
- Snyder, C.S.; Bruulsema, T.W.; Jensen, T.L.; Fixen, P.E. Review of greenhouse gas emissions from crop production systems and fertilizer management effects. Agriculture, Ecosystems & Environment 2009, 133, 247–266. [Google Scholar] [CrossRef]
- Abate, G.T.; Bernard, T.; Janvry, A.D.; Sadoulet, E.; Trachtman, C. Introducing quality certification in staple food markets in Sub-Saharan Africa: Four conditions for successful implementation. Food Policy 2021, 105, 102173. [Google Scholar] [CrossRef]
- Wang, Z.; Geng, Y.; Liang, T. Optimization of reduced chemical fertilizer use in tea gardens based on the assessment of related environmental and economic benefits. Science of the total environment 2020, 713, 136439. [Google Scholar] [CrossRef] [PubMed]
- Hamid, S.; Wang, K. Environmental total factor productivity of agriculture in South Asia: a generalized decomposition of Luenberger-Hicks-Moorsteen productivity indicator. Journal of Cleaner Production 2022, 351, 131483. [Google Scholar] [CrossRef]
- Liu, Y.; Sun, D.; Wang, H.; Wang, X.; Yu, G.; Zhao, X. An evaluation of China’s agricultural green production: 1978–2017. Journal of Cleaner Production 2020, 243, 118483. [Google Scholar] [CrossRef]
- Chen, W.; Chen, J.; Xu, D.; Liu, J.; Niu, N. Assessment of the practices and contributions of China’s green industry to the socio-economic development. Journal of cleaner production 2017, 153, 648–656. [Google Scholar] [CrossRef]
- Tripathi, S.; Srivastava, P.; Devi, R.S.; Bhadouria, R. Influence of synthetic fertilizers and pesticides on soil health and soil microbiology. Agrochemicals detection, treatment and remediation. Butterworth-Heinemann 2020, 25–54. [Google Scholar] [CrossRef]
- Bai, L.Y.; Zeng, X.B.; LI, L.F.; Chang, P.E.N.; Li, S.H. Effects of land use on heavy metal accumulation in soils and sources analysis. Agricultural Sciences in China 2010, 9, 1650–1658. [Google Scholar] [CrossRef]
- Wang, Y.; Zhu, Y.; Zhang, S.; Wang, Y. What Could Promote Farmers to Replace Chemical Fertilizers with Organic Fertilizers? Journal of cleaner production 2018, (199), 882–890. [Google Scholar] [CrossRef]
- Cheng, K.; Pan, G.; Smith, P.; Luo, T.; Li, L.; Zheng, J.; Zhang, X.; Han, X.; Yan, M. Carbon footprint of China’s crop production—An estimation using agro-statistics data over 1993–2007. Agriculture, ecosystems & environment 2011, 142, 231–237. [Google Scholar] [CrossRef]
- Pimentel, D.; Hurd, L.E.; Bellotti, A.C.; Forster, M.J.; Oka, I.N.; Sholes, O.D.; Whitman, R.J. Food production and the energy crisis. Science 1973, 182, 443–449. [Google Scholar] [CrossRef] [PubMed]
- Liu, D.; Zhu, X.; Wang, Y. China’s agricultural green total factor productivity based on carbon emission: an analysis of evolution trend and influencing factors. Journal of Cleaner Production 2021, 278, 123692. [Google Scholar] [CrossRef]
- Hoang, V.N.; Coelli, T. Measurement of agricultural total factor productivity growth incorporating environmental factors: A nutrients balance approach. Journal of Environmental Economics and Management 2011, 62, 462–474. [Google Scholar] [CrossRef]
- Snyder, C.S.; Bruulsema, T.W.; Jensen, T.L.; Fixen, P.E. Review of greenhouse gas emissions from crop production systems and fertilizer management effects. Agriculture, Ecosystems & Environment 2009, 133, 247–266. [Google Scholar] [CrossRef]
- Ladha, J.K.; Pathak, H.; Krupnik, T.J.; Six, J.; Kessel, C.V. Efficiency of fertilizer nitrogen in cereal production: retrospects and prospects. Advances in agronomy 2005, 87, 85–156. [Google Scholar] [CrossRef]
- Zhang, Q.; Dong, W.; Wen, C.; Li, T. Study on factors affecting corn yield based on the Cobb-Douglas production function. Agricultural Water Management 2020, 228, 105869. [Google Scholar] [CrossRef]
- Asamoah, E.K.; Ewusie Nunoo, F.K.; Osei-Asare, Y.B.; Addo, S.; Sumaila, U.R. A production function analysis of pond aquaculture in Southern Ghana. Aquaculture Economics & Management 2012, 16, 183–201. [Google Scholar] [CrossRef]
- Li, H.; Cao, A.; Twumasi, M.A.; Zhang, H.; Zhong, S.; Guo, L. Do female cadres improve clean energy accessibility in villages? Evidence from rural China. Energy Economics 2023, 126, 106928. [Google Scholar] [CrossRef]
- Xu, D.; Guo, S.; Xie, F.; Liu, S.; Cao, S. The impact of rural laborer migration and household structure on household land use arrangements in mountainous areas of Sichuan Province, China. Habitat International 2017, 70, 72–80. [Google Scholar] [CrossRef]
- Zhong, L.; Wang, J.; Zhang, X.; Ying, L.; Zhu, C. Effects of agricultural land consolidation on soil conservation service in the Hilly Region of Southeast China–Implications for land management. Land Use Policy 2020, 95, 104637. [Google Scholar] [CrossRef]
- Teshome, A.; Graaff, J.D. , Ritsema, C.; Kassie, M. Farmers’ perceptions about the influence of land quality, land fragmentation and tenure systems on sustainable land management in the north western Ethiopian highlands. Land degradation & development 2016, 27, 884–898. [Google Scholar] [CrossRef]
| 1 | Note: 1 mu≈667 m2 or 0.067 ha. |
| 2 | This research does not consider the nitrogen and phosphorus elements present in the soil and seeds. According to field surveys, farmers mainly use urea and compound fertilizers. Referring to the Reference Calculation Table for Pure Fertilizer Content:the nitrogen content in urea is 46%,the nitrogen and phosphorus contents in compound fertilizers are 15.18% and 27.43%, respectively (calculated based on the average standards of 14 main compound fertilizers).According to the Handbook of Agricultural Technology and Economics:The nitrogen content in every 100 kilograms of rice is 2.05 kilograms,the phosphorus content is 0.95 kilograms. |
Figure 1.
Distribution of Sample Counties. The map data in Figure 1 are from DataV. GeoAtlas. https://datav.aliyun.com/portal/school/atlas/area_selector, accessed on 27 05 2024.
Figure 1.
Distribution of Sample Counties. The map data in Figure 1 are from DataV. GeoAtlas. https://datav.aliyun.com/portal/school/atlas/area_selector, accessed on 27 05 2024.
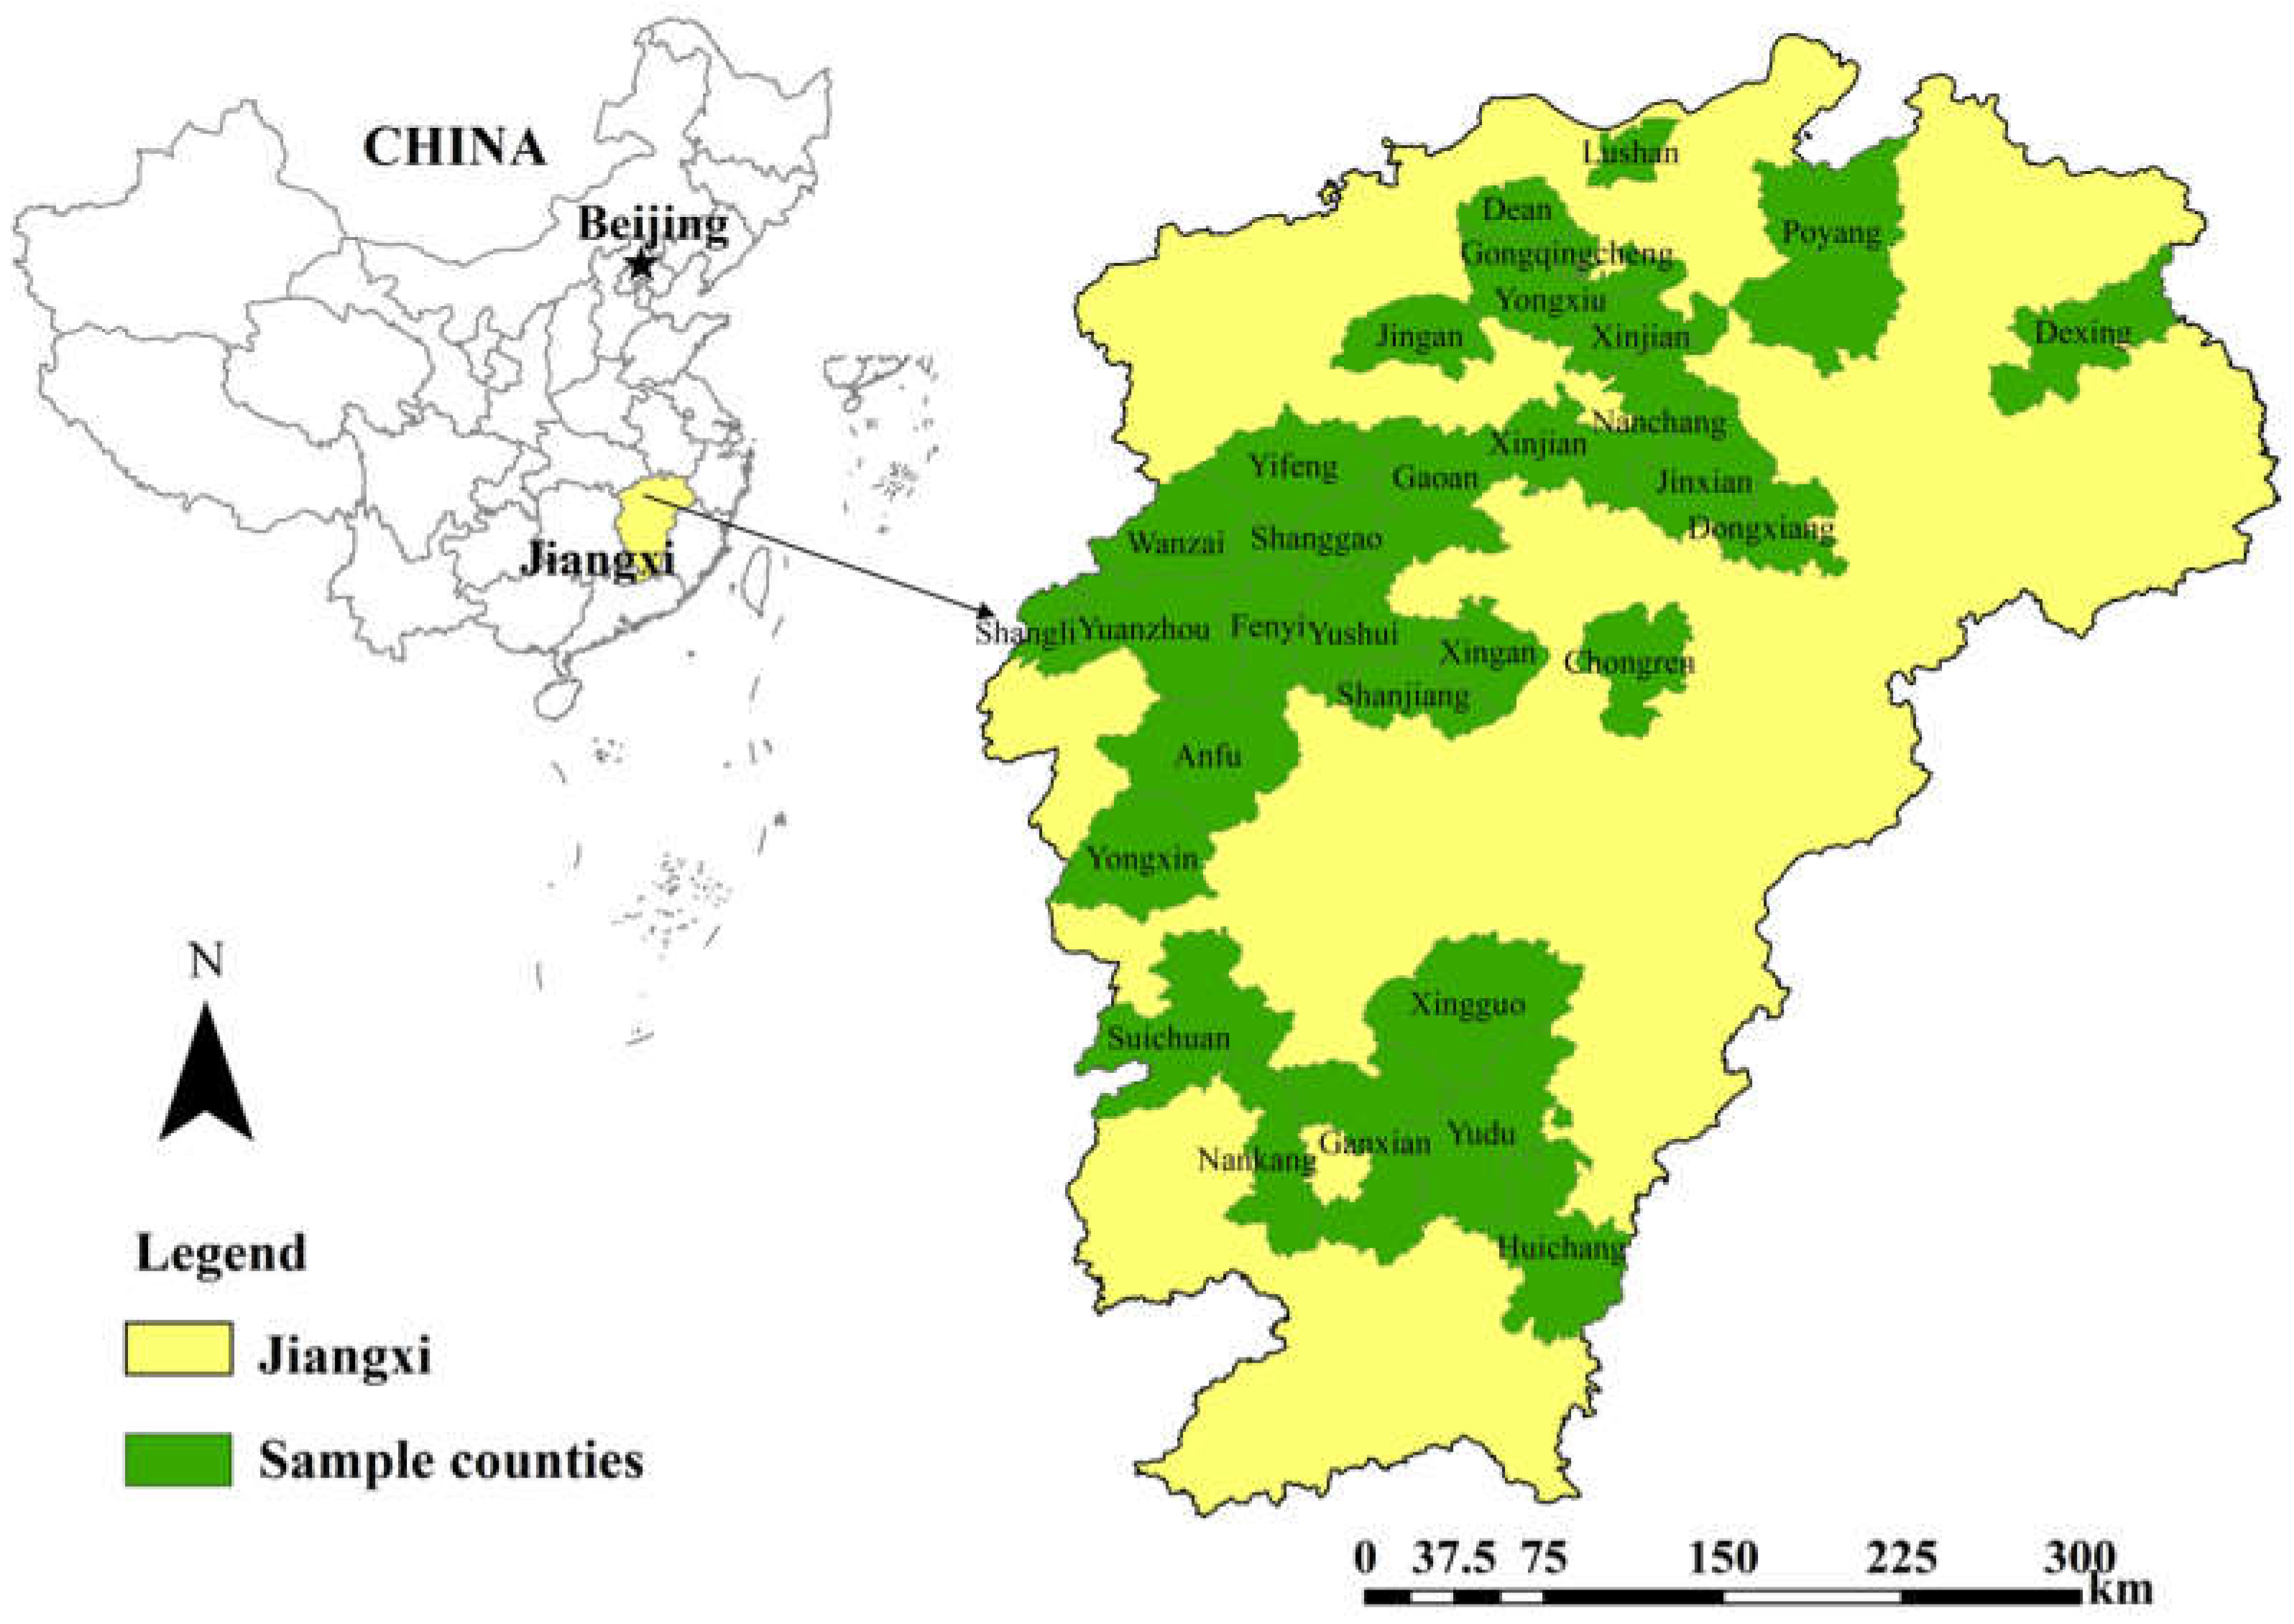
Figure 2.
Probability density of farmer’s NPPA in two scenarios.
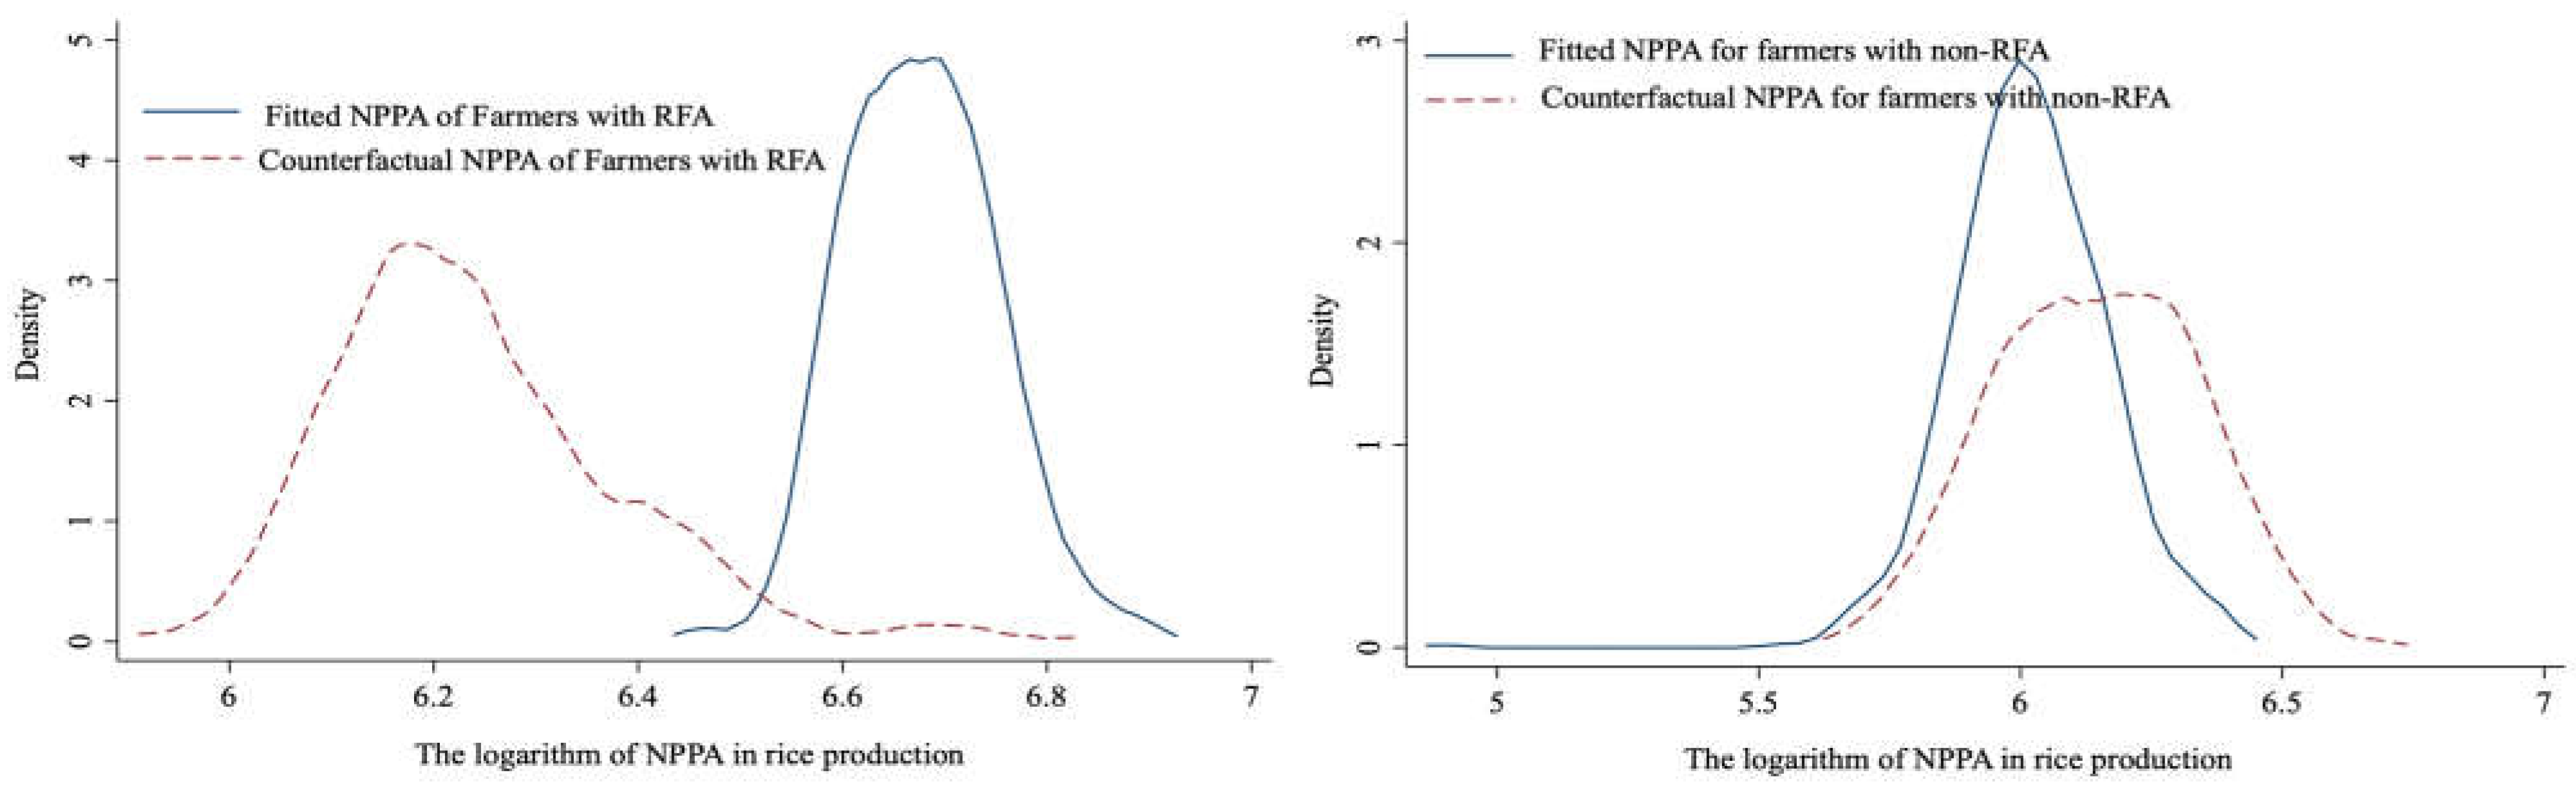
Figure 3.
Probability density of AGP in two scenarios.
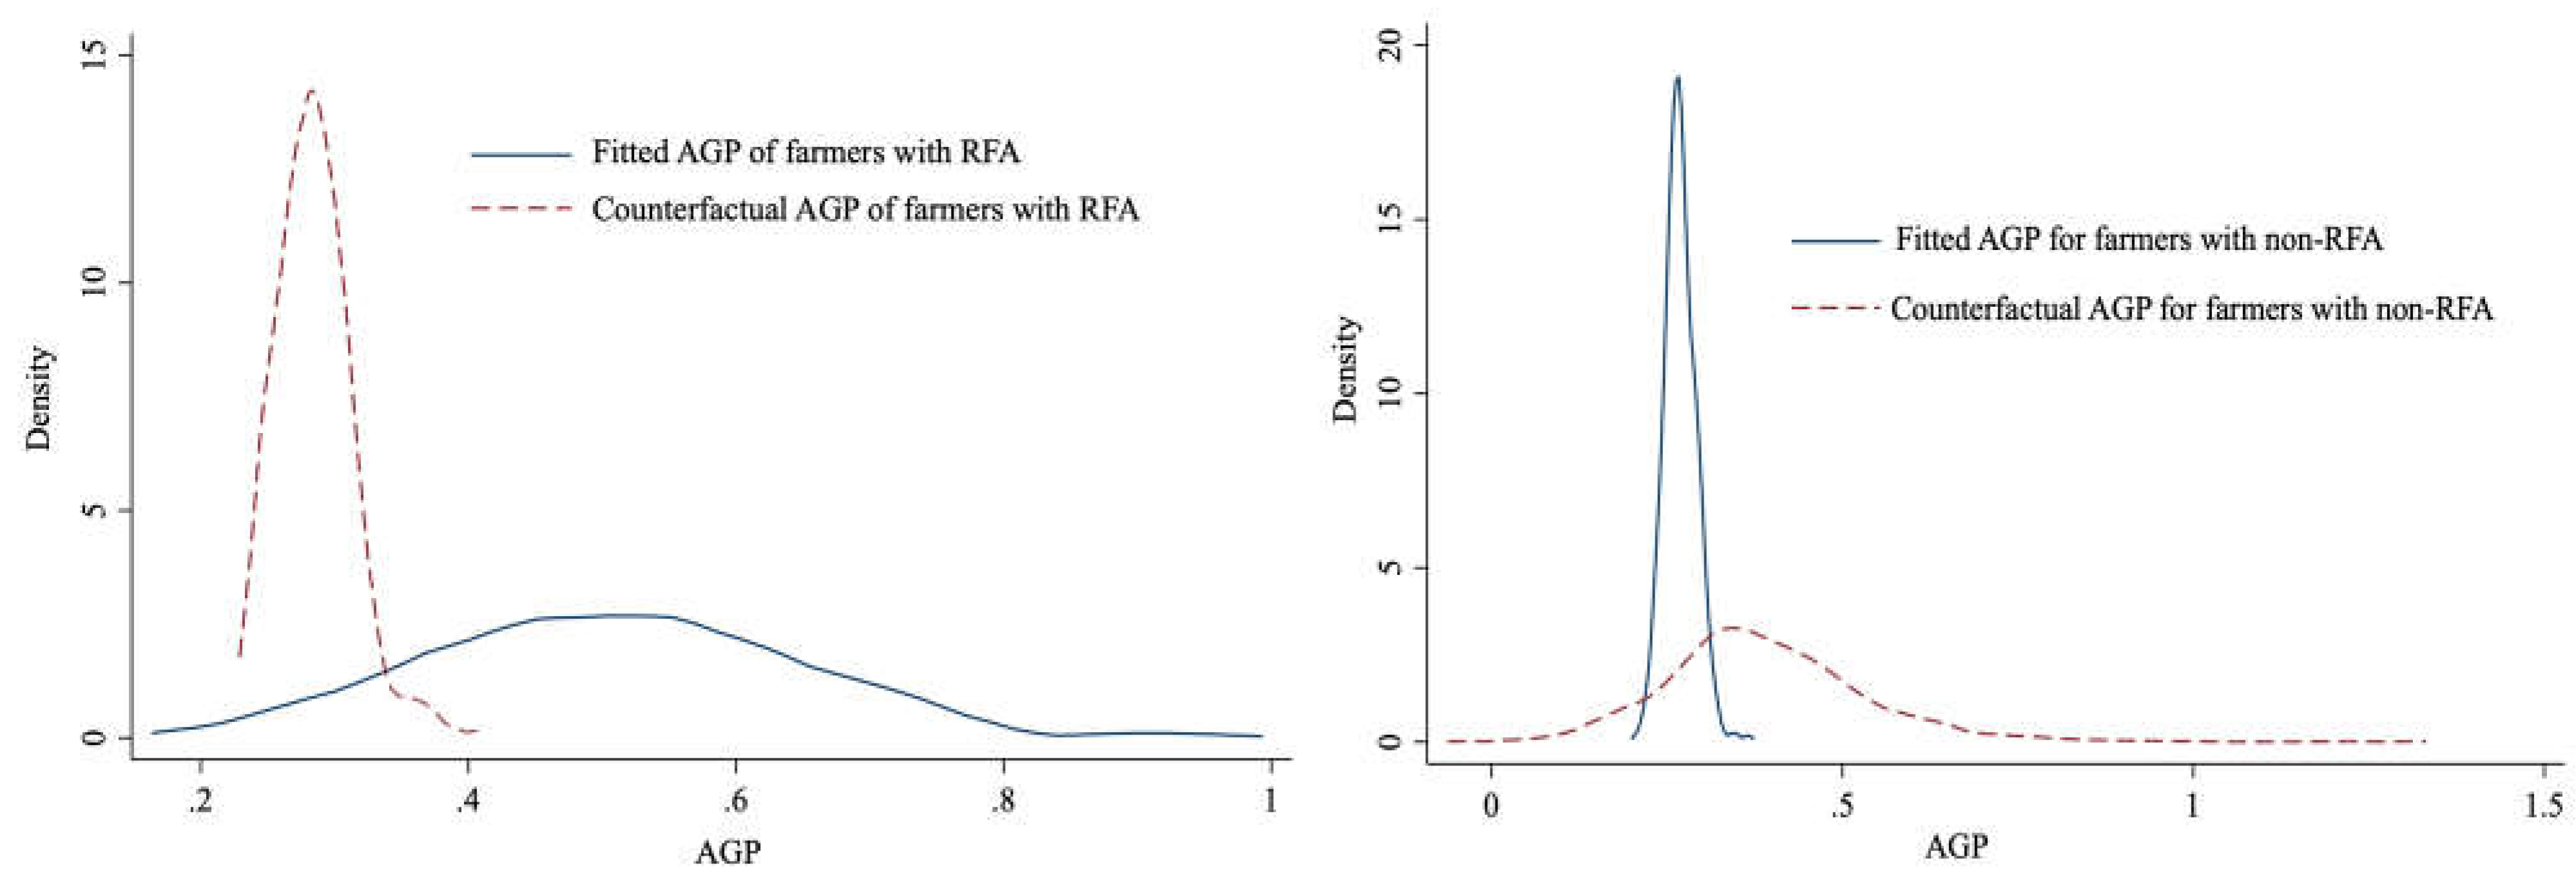
Figure 4.
Interquartile regression coefficients and trends.
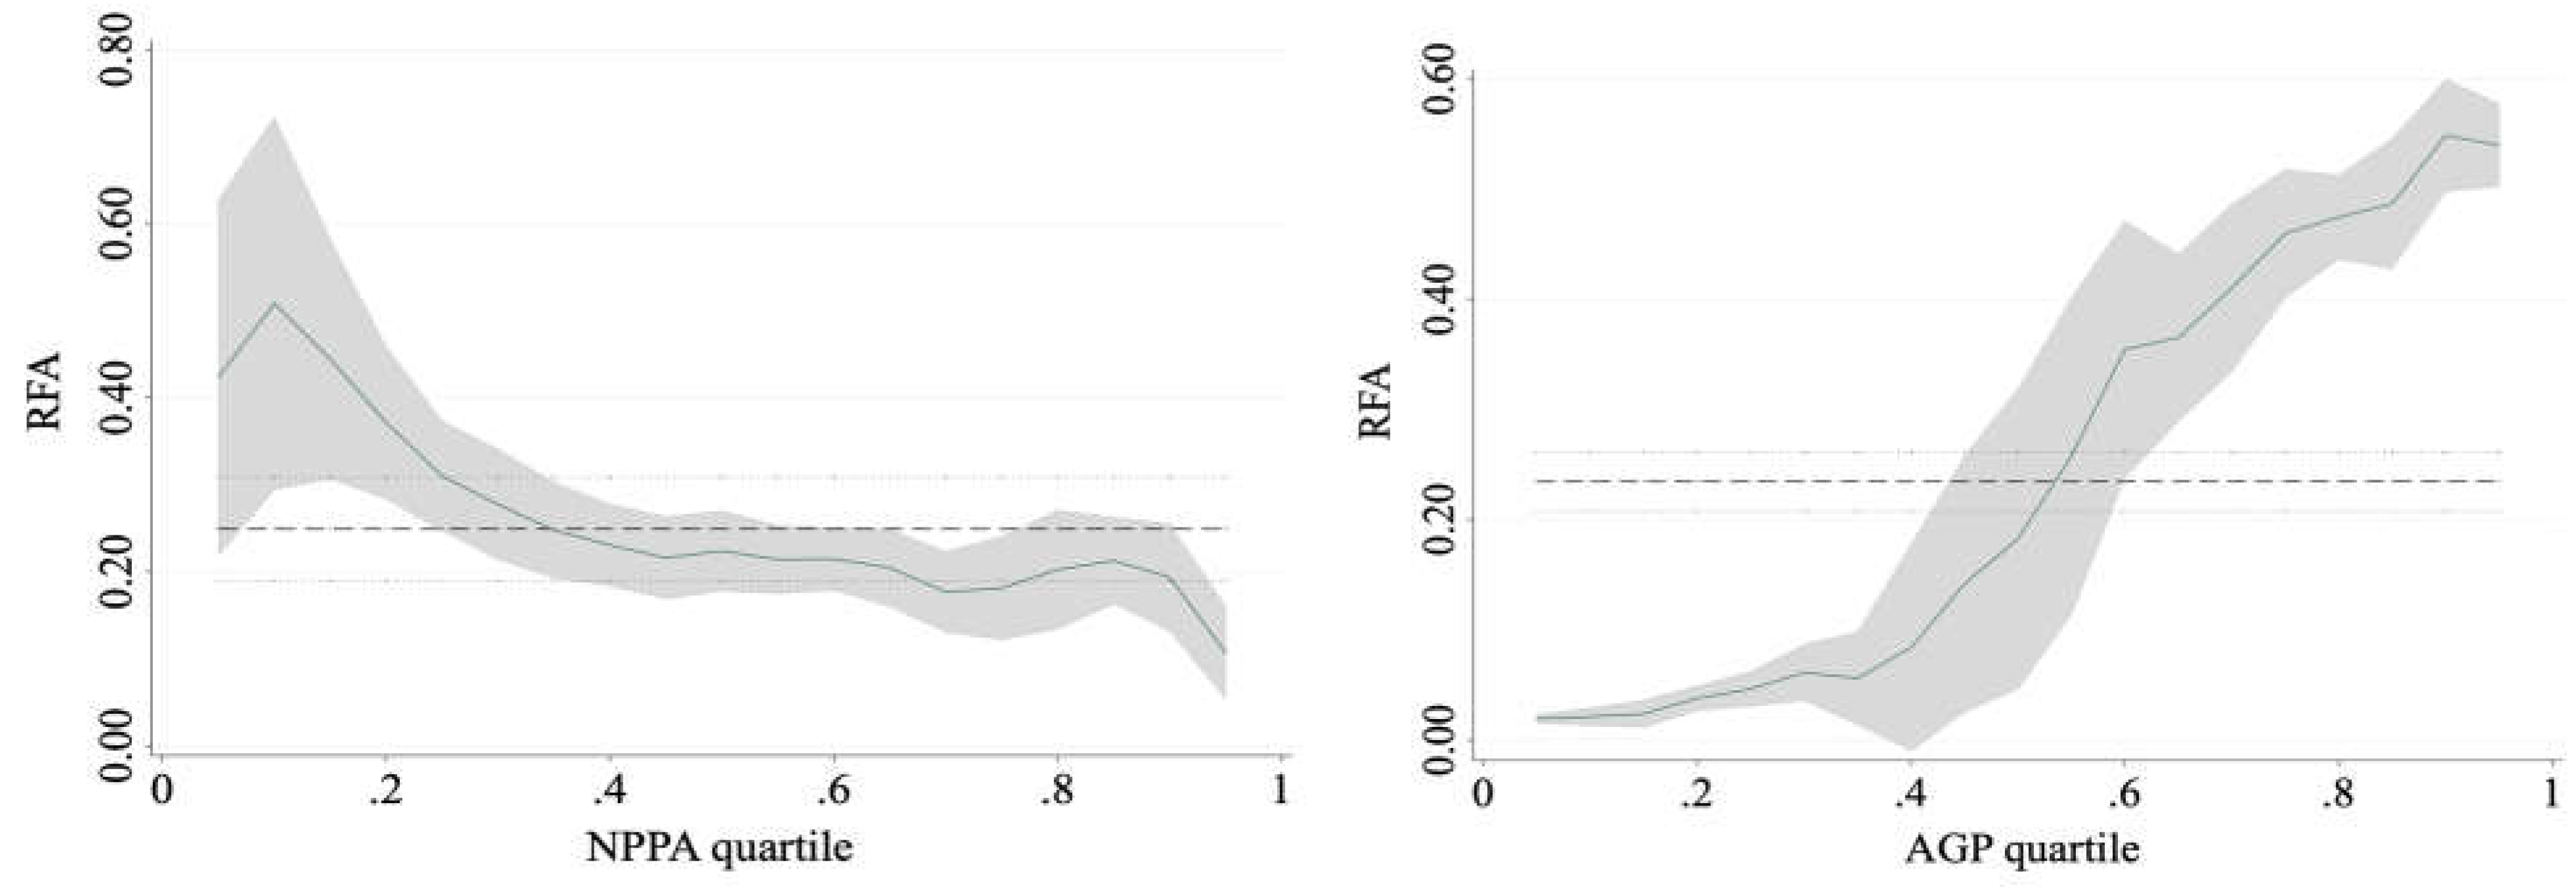

Table 1.
Input-Output Indicators for Measuring the Agricultural Environmental Effects.
| Typology | Indicator | Description of indicators |
|---|---|---|
| Input indicators | Land input | Crops sown (mu) |
| Labor input | Including own-account and hired labor hours (hours) | |
| Seed input | Total cost of seeds purchased (CNY) | |
| Fertilizer input | Total cost of fertilizer purchases, including compost and fertilizer (CNY) | |
| Pesticides input | Total cost of pesticides purchase (CNY) | |
| Herbicides input | Total cost of herbicide purchase (CNY) | |
| Mechanical input | Total cost including owned and hired machinery (CNY) | |
| Expected outputs | Output | Total crop production (catty) |
| Non-expected outputs | Nitrogen emissions | Nitrogen emissions from agricultural production (catty) |
| Phosphorus emissions | Phosphorus emissions from agricultural production (catty) |
Table 2.
Variable Definitions and Descriptive Analyses.
| Variable Name | Meaning and Assignment | Reduction | Non-reduction | Discrepancy | ||
|---|---|---|---|---|---|---|
| Average Value | Standard Deviation | Average Value | Standard Deviation | |||
| RFA | Fertilizer reduction application or not?0=no, 1=yes | n=1078 | n=267 | - | ||
| Economic effects | Farmer’s net return per mu from rice production in 2022(CNY) | 677.86 | 13.51 | 504.78 | 7.00 | 173.08*** |
| Environmental effects | The DEA—SBM model based on non-expected output measures AGP with values between 0 and 1 | 0.51 | 0.02 | 0.27 | 0.01 | 0.24*** |
| Age | Actual age of farm householder (years) | 51.54 | 0.49 | 55.01 | 0.28 | 3.47*** |
| Education level | Educational attainment of farmers, 1 = primary school and below, 2 = junior high school, 3 = senior high school/vocation secondary school/technical school/vocational high school, 4 = post-secondary school, 5 = bachelor’s degree and above | 1.87 | 0.05 | 1.87 | 0.03 | -0.01 |
| Risk preference | 1 = risk aversion; 2 = risk neutrality; 3 = risk appetite | 1.85 | 0.05 | 1.50 | 0.02 | 0.35*** |
| Training frequency | Frequency of farmers’ participation in agricultural technology training,1 = never; 2 = occasionally; 3 = often | 1.43 | 0.04 | 1.32 | 0.02 | 0.12*** |
| Whether the village cadres | Whether the farmer is a village cadre?0=no, 1=yes | 0.27 | 0.03 | 0.29 | 0.01 | 0.02 |
| Work experience | 1 = always farming, 2 = part-time farming, 3 = labor or business, 4 = other | 0.27 | 0.03 | 0.29 | 0.01 | 0.02 |
| Total household income | Gross farm household income (ten thousand) | 9.03 | 0.95 | 5.95 | 0.19 | 3.07*** |
| The number of laborers | Total number of agricultural laborers in farming households (person) | 1.83 | 0.04 | 1.84 | 0.02 | 0.01 |
| Land management scale | Total actual operating scale of rice production(mu) | 98.57 | 7.19 | 77.39 | 2.82 | 21.18*** |
| Degree of land parcel consolidation | 1 = very scattered; 2 = more scattered; 3 = partially contiguous; 4 = all contiguous | 3.11 | 0.05 | 2.43 | 0.03 | 0.69*** |
| Soil fertility | Soil fertility status of the largest plots,1=poor; 2=medium; 3=good; 4=excellent | 3.21 | 0.04 | 2.87 | 0.03 | 0.25*** |
| Distance of the land plots | Distance of largest plot from farmer’s house(kilometre) | 0.94 | 0.03 | 1.79 | 0.13 | 0.84*** |
Table 3.
Impact of Farmers’ RFA on NPPA of rice production.
| Variable Name | RFA | NPPA of rice | AGP | ||
|---|---|---|---|---|---|
| Decision Models | Reduction | Non-reduction | Reduction | Non-reduction | |
| Age | -0.026*** | 0.002 | -0.003 | -0.001 | -0.004 |
| (0.006) | (0.002) | (0.002) | (0.001) | (0.002) | |
| Education level | -0.036 | 0.019 | 0.022 | 0.004 | 0.016 |
| (0.063) | (0.017) | (0.025) | (0.005) | (0.025) | |
| Risk preference | 0.272*** | -0.008 | 0.033 | -0.012** | 0.028 |
| (0.063) | (0.019) | (0.023) | (0.006) | (0.023) | |
| Training frequency | 0.080 | 0.006 | 0.068** | 0.013* | 0.083*** |
| (0.075) | (0.023) | (0.029) | (0.007) | (0.028) | |
| Whether the village cadres | -0.185* | 0.037 | -0.064 | 0.019** | -0.056 |
| (0.111) | (0.030) | (0.044) | (0.009) | (0.044) | |
| Work experience | -0.046 | 0.076*** | -0.033 | -0.005 | -0.008 |
| (0.063) | (0.020) | (0.042) | (0.006) | (0.022) | |
| Total household income | 0.020*** | 0.006** | -0.002 | 0.001 | 0.001 |
| (0.007) | (0.002) | (0.002) | (0.001) | (0.002) | |
| The number of laborers | 0.022 | -0.014 | 0.132*** | 0.019*** | 0.132*** |
| (0.073) | (0.020) | (0.029) | (0.006) | (0.029) | |
| Land management scale | 0.496*** | -0.016 | 0.013 | 0.000 | 0.011 |
| (0.054) | (0.015) | (0.025) | (0.005) | (0.026) | |
| Degree of land parcel consolidation | 0.120** | 0.010 | -0.047 | 0.000 | 0.051* |
| (0.054) | (0.014) | (0.029) | (0.004) | (0.027) | |
| Soil fertility | 0.001 | 0.001** | 0.001** | -3.351 | 0.001* |
| (0.001) | (0.000) | (0.007) | (0.000) | (0.000) | |
| Distance of the land plots | -0.351*** | -0.001 | 0.016 | 0.001 | 0.011 |
| (0.051) | (0.003) | (0.034) | (0.001) | (0.034) | |
| Identifying Variables | 3.798*** | ||||
| -0.335 | |||||
| Constant term | -2.294*** | 6.155*** | 6.200*** | 0.266*** | 0.281 |
| -0.473 | (0.131) | (0.208) | (0.041) | (0.206) | |
| ρ0 | - | -0.361*** | - | 0.102 | - |
| (0.096) | - | (0.134) | - | ||
| ρ1 | - | - | 0.180* | - | 0.284** |
| - | (0.107) | - | (0.118) | ||
| Wald test | - | 30.63*** | 29.63** | ||
| LR test | - | chi2(2) =14.09 Prob > chi2 = 0.001 |
chi2(2) =6.18 Prob > chi2 = 0.046 |
||
| Sample volume | 1345 | 1078 | 267 | 1078 | 267 |
Note: *, **, and *** indicate significant at the 10%, 5%, and 1% levels, respectively, with robust standard errors in parentheses. Also to attenuate the heteroskedasticity of the data in the model, the NPPA of rice in the model was treated as logarithmic.
Table 4.
Mean treatment effect of farmers’ RFA on NPPA.
| Groups | Fertilizer reduction |
No fertilizer reduction | ATT | ATU |
|---|---|---|---|---|
| Fertilizer reduction | 6.677 | 6.239 | 0.437*** | - |
| No fertilizer reduction | 6.526 | 6.396 | - | 0.131*** |
Note: *, **, and *** indicate significant at the 10%, 5%, and 1% levels, respectively, with robust standard errors in parentheses.
Table 5.
Mean treatment effects on the impact of farmers’ RFA on AGP.
| Groups | Fertilizer reduction |
No fertilizer reduction | ATT | ATU |
|---|---|---|---|---|
| Fertilizer reduction | 0.508 | 0.285 | 0.224*** | - |
| No fertilizer reductio | 0.391 | 0.269 | - | 0.122*** |
Note: *, **, and *** indicate significant at the 10%, 5%, and 1% levels, respectively, with robust standard errors in parentheses.
Table 6.
Results of OLS and Tobit regressions on the economic effects of framers’ RFA.
| Variable | Economic effects (OLS) |
Environmental effects (Tobit) |
|---|---|---|
| RFA | 0.249*** | 0.234*** |
| (0.026) | (0.014) | |
| Control variable | control | control |
| Constant term | 6.192*** | 0.224*** |
| (0.113) | (0.037) | |
| R2/Pseudo R2 | 0.091 | -1.022 |
| Cample volume | 1345 | 1345 |
Note: *, **Note: *, **, and *** indicate significant at the 10%, 5%, and 1% levels, respectively, with robust standard errors in parentheses.
Table 7.
PSM regression results of economic and environmental effects of framers’ RFA.
| Matching method |
Economic effects (NPPA) |
Environmental effects (AGP) |
||
| ATT | T | ATT | T | |
| Nearest neighbor matching | 0.239*** | 7.53 | 0.239*** | 10.87 |
| Kernel matching | 0.236*** | 8.46 | 0.242*** | 11.39 |
| Caliper matching | 0.223*** | 7.49 | 0.239*** | 11.08 |
| Average value | 0.233 | - | 0.240 | - |
Note: *, **, and *** indicate significant at the 10%, 5%, and 1% levels, respectively.
Table 8.
Quantile regression of economic and environmental effects of framers’ RFA.
| Variable |
Economic effects (NPPA) |
Environmental effects (AGP) |
||||
| 0.25 quartile | 0.5 quartile | 0.75 quartile | 0.25 quartile | 0.5 quartile | 0.75 quartile | |
| RFA | 0.309*** | 0.224*** | 0.181*** | 0.046*** | 0.182*** | 0.460*** |
| (0.034) | (0.030) | (0.181) | (0.124) | (0.054) | (0.029) | |
| Control variable | control | control | control | control | control | control |
| Constant term | 5.885*** | 6.279*** | 6.577*** | 0.144*** | 0.181** | 0.304*** |
| (0.187) | (0.148) | (0.129) | (0.038) | (0.080) | (0.059) | |
| R2 | 0.073 | 0.056 | 0.049 | 0.048 | 0.048 | 0.228 |
| Sample volume | 1345 | 1345 | 1345 | 1345 | 1345 | 1345 |
Note: *, **, and *** indicate significant at the 10%, 5%, and 1% levels, respectively, with robust standard errors in parentheses.
Disclaimer/Publisher’s Note: The statements, opinions and data contained in all publications are solely those of the individual author(s) and contributor(s) and not of MDPI and/or the editor(s). MDPI and/or the editor(s) disclaim responsibility for any injury to people or property resulting from any ideas, methods, instructions or products referred to in the content. |
© 2024 by the authors. Licensee MDPI, Basel, Switzerland. This article is an open access article distributed under the terms and conditions of the Creative Commons Attribution (CC BY) license (http://creativecommons.org/licenses/by/4.0/).
Copyright: This open access article is published under a Creative Commons CC BY 4.0 license, which permit the free download, distribution, and reuse, provided that the author and preprint are cited in any reuse.


