Submitted:
16 July 2024
Posted:
17 July 2024
You are already at the latest version
Abstract
Nicotiana benthamiana plants infected with a potato virus Y isolate (PVYO) under ambient conditions of 25 °C and ~405 parts-per-million (ppm) ambient CO2 display symptoms of chlorosis, leaf curling, and stunting. However, under elevated temperature and CO2 levels (30 °C, 970 ppm), systemic viral titers decrease several-fold, and plants appear asymptomatic. Under the latter conditions we have studied how infection, drought, or both combined affect infection, drought-driven loss of leaf turgor, plant water content, stomatal conductance, metabolome, and hormone (ABA, SA, and JA) levels. We found that drought did not affect viral titers. As expected, drought decreased plant water content and stomatal conductance. Under drought conditions, infection did not alter significantly final water content or loss of leaf turgor progression, but it increased the levels of some sugars and other osmo-protectants. Infection and drought altered the levels of many components of the metabolome. Some components altered by infection were not altered by drought, but most of those altered by drought were also altered by infection. Drought increased the levels of ABA, infection increased the levels of ABA, SA, and JA, and altered their relative balance. The effects of drought and of infection on hormone levels were cumulative when combined. Thus, under ambient conditions that turn a severe infection into an asymptomatic one both, plant physiology parameters and the interplay with drought are affected.
Keywords:
Asymptomatic infections by plant viruses
; plant responses to abiotic stresses and viral infections
; climate change and viral infections
; asymptomatic infections and environment conditions
; physiology alterations caused by plant virus infections
1. Introduction
Plant viruses have been traditionally viewed as pathogens and parasites because outbreaks in crops of symptomatic viral infections can cause very important economic losses. However, it has been suggested that this view may be biased [1], for mainly two reasons: on the one hand, it has been shown that some symptomatic infections, in experimental plants or in crops, can increase the tolerance of the host to additional biotic or non-biotic stresses, notably drought [2,3,4,5,6,7,8,9], although this is by no means the case in all virus/host patho-systems [10]. On the other hand, it has been observed that in nature many infections cause little or no symptoms, and tend to be persistent [1,11,12]. Together, the benefits that infections give to the host in its response to additional stresses, and the presence in nature of attenuated or cryptic infections, add a symbiotic mutualistic dimension to plant-virus interactions [1].
Beneficial effects to plants of symptomatic viral infections when they cope with additional stresses derive from the alterations in host gene expression that infections induce, which have physiology and morphology effects. Physiology alterations can originate from the use by the virus of plant molecular resources to multiply and disperse, and also from the activation of plant resistance responses. These can be specific, such as is the small RNA (sRNA)-based interference targeted at viral genetic material that have sequence homology to those sRNAs [13], or generic, such as systemic acquired resistance, or immunity responses triggered when plant receptors recognize some pathogen material (protein or genetic) as alien. With regard to the former, it has been recently shown for the first time that that an sRNA of viral sequence induced by the plant silencing machinery during infection of common beans by a Carlavirus induces the downregulation of a host gene via the autophagy pathway, which itself regulates positively stomatal aperture, thus providing in this way some protection against drought to infected plants [8]. With regard to the latter generic responses, in them cascades of interlinked pathways are activated that lead to metabolic re-programming, in which hormones are also involved [14,15,16,17,18,19,20], which can provide generic, unspecific protection to pathogens.
Viruses need to compensate or neutralize both these responses in order to infect plants successfully, and to do that, they express specific factors that interfere with antiviral silencing defenses, such as silencing suppressors [21], and with generic immunity responses, which could be the same factors that also have suppressor function, or different ones [22,23]. Interference from viral suppressors with endogenous plant sRNA-mediated regulation, development pathways, and responses to stresses [24] also lead on the other hand to pathologies.
Changes in physiology caused by infection, and the responses to infection can thus lead to pathogenesis and to changes in the morphology of the plant [25]. Common symptoms include plant stunting and affections to leaves during their development that create chlorotic mosaics in their mesophyll or vasculature, deformation, curling, and overall thickening, relative to fully expanded, healthy leaves. It is noteworthy to mention that these physical changes, common to many symptomatic infections, can by themselves alter gas exchanges between plants and their environment, when compared to uninfected plants or to plants with asymptomatic infections. The contribution of symptomatic infections to the responses of plants to ambient stresses is thus intermingled with the alterations in plant morphology that they induce.
Our knowledge on physiology effects of infections by RNA viruses and how they affect plant responses to additional biotic or abiotic stresses comes mainly from infections that are symptomatic to different degrees [2,3,6,7,9], despite asymptomatic or latent infections as defined by [26], being common in nature. Remarkably, information available on asymptomatic infections originates mainly from viruses that originally were symptomatic: one source of information are infections by symptomatic viruses that become latent or attenuated when mutations affect negatively essential functions of their viral factors, and is usually associated with reduced viral levels. This effect has been the basis for cross-protection, a practice used to prevent ulterior infections by more pathogenic virus strains. Targets for such mutations are often the viral suppressors of silencing. In this regard, Potyvirus suppressor-deficient variants have been generated in the lab by site-directed mutagenesis in the silencing-suppressor HCPro [27,28,29,30]. In this regard, a lab-generated tobacco vein banding mosaic virus (TVBMV) variant, expressing a mutated, suppression-deficient HCPro, was used by [30] to characterize transcriptome and hormone expression changes that it induced in its attenuated infection of Nicotiana benthamiana, relative to uninfected plants. However, the work did not analyze the effect of infection on the host response to an additional stress. Additional reported sources of asymptomatic infections involve chimeric viruses such as a lab-generated plum pox virus/PVY potyvirus that is initially un-adapted to this host [31]. However, it can adapt naturally with time, and increase its virulence, by incorporating mutations in its HCPro [32]. Mutations in the viral replicase of the Tobamovirus pepper mild mottle virus, which also has the suppressor function, are also reported to create attenuated viruses, capable of providing cross protection [33].
A second source of information on beneficial effects of asymptomatic infections to abiotic stresses comes from intact symptomatic viruses without functional deficiencies in their essential factors, when they infect plants that harbor resistances to them, thus displaying attenuated symptoms. This is for example the case of a tomato yellow leaf curl geminivirus (TYLCV) isolate in its systemic infection of a resistant tomato (line GF967; [34]). In this case, correlation was found between a differential accumulation of osmo-protectants in the plants latently infected and their enhanced tolerance to drought, relative to uninfected plants [34].
There is a potential third source of data on asymptomatic infections that involves infection of a compatible host by a normally symptomatic virus, under ambient conditions that turn it asymptomatic. In this third case both, virus and host would be unaltered. It is known that infections alter their pathogenicity when ambient parameter thresholds are surpassed [2,35,36,37,38]. In this regard, we had previously described that infection of N. benthamiana plants by a potato virus Y (PVYO) isolate shifted from causing severe symptoms (stunting, leaf curling, even death in small plantlets) under conditions of 25 °C and ~405 parts-per-million (ppm) CO2 levels, to being asymptomatic under conditions of 30 °C and 970 ppm of CO2 with viral titers being very low [37,38]. We have determined here under these latter ambient conditions, how infection by PVY affects the physiology of N. benthamiana plants, and its interplay with drought, when the two are combined.
2. Materials and Methods
2.1. Plants and Viruses
The experimental plant N. benthamiana and a Scottish PVYO isolate [39] were used in the experiments.
2.2. Plant Growing Conditions, and Experimental Schedule
To investigate effects on N. benthamiana plants of an asymptomatic PVY infection, of water deprivation (drought), or of both combined, three experiments were performed that followed a schedule similar to the one shown schematically in Figure 1: small plantlets were individually potted and kept for a few days in a growth chamber that had an adjustable photoperiod, temperature and CO2 levels described in [38], with settings of 16h day/8h night, at constant 25 °C and elevated levels of CO2 (970 ppm). After these few days of acclimation to high CO2 levels, plants were dusted in three leaves with carborundum, and were either mock-inoculated or inoculated with virus extract. Immediately afterwards temperature was risen to 30 °C. As virus inoculum, we used an extract made from leaves of PVY-infected N. benthamiana plants that had been grown at standard 25 °C and ambient CO2 levels, ground in phosphate buffer 0.1 M, pH8 (1/1 weight/vol).
Ten days after inoculation, pots were saturated with water by immersion, excess water was allowed to drain, and from that day onwards plants were either watered normally (20 ml of water/pot/day) or not at all (drought conditions). For each of the four possible combinations [mock/watered (MW); infected/watered (IW); mock/drought (MD); infected/drought (ID)] 15 plants were used, making a total of 60 starting plants. Plants were rotated in the tray during the length of the experiment, to minimize any locational effect, as shown in Figure 1. At the end of the experiment the whole aerial part of the plant was collected to determine its water content, except a single fully expanded leaf from the top of each plant, which was detached from the rest of the plant and from which tissues were collected for the determination of relative systemic viral titers, the metabolome, and hormone levels, as shown in Figure 1. The timings for assessment of loss of leaf turgor progression are also indicated in the Figure. This first experiment was repeated twice (without the hormone and metabolome analysis, which were performed only in the first experiment), with the following differences: plants were one week older at the time of their inoculation with PVY extract and thus larger in size than the first experiment, and the water withdrawal period lasted for 9 days, instead of the 13 days of the first experiment.
2.3. Determination of Viral Titers
Relative systemic PVY titers in individual plants were determined serologically by western blot analysis of total protein extracts using a polyclonal antibody to the viral coat protein (CP), kindly donated by Dr. César Llave (CIB-CSIC, Madrid, Spain). At the end of the first experiment (day 29), a single leaf was detached from each individual plant, and a central leaf disc of 2 cm in diameter was excised using a cylindrical borer, as shown in Figure 1. These leaf discs were ground mechanically in extraction buffer (0.1 M Tris-HCl pH 8, 10 mM EDTA, 0.1 M LiCl, 1% -mercaptoethanol and 1% SDS). Total protein extracts where then combined 1:1 with Laemmli 2x buffer, heated at 95 °C for 5 minutes, clarified by 5 minutes bench centrifugation at top speed, and fractionated in 15% SDS-PAGE (Sodium Dodecyl Sulphate-Polyacrylamide Gel Electrophoresis), followed by the transfer of the resolved proteins to PVDF membranes, and the serological detection of the CP bands. Prior to antibody incubation, membranes were stained with Ponceau-S Red to obtain controls of loading (the stained Rubisco band), and then blocked in 5% de-fatted milk in PBS for antibody incubation. Relative quantification of CP band intensities was made with ImageJ software (www.imagej.nih.gov), and the statistical analysis of the densitometry data was done with SPSS Statistics software, version 29 (IBM, Armonk, NY, USA).
2.4. Determination of Plant Water Content, and Assessment of Loss of Leaf Turgor under Drought Conditions
To visually assess loss of leaf turgor caused by drought in the three experiments, plants were monitored individually, and the turgor of their leaves was assessed daily after pot saturation with water until the end of the experiments. Loss of turgor was considered to occur when a leaf was no longer fully expanded, and started to wilt. Loss of leaf turgor always appeared first in the lower leaves of the plant. Five turgor values were assigned daily to each plant: 0, no loss of turgor was observed in any of its leaves; 0.25, when at least one leaf in the fourth lower quartile of the plant showed loss of turgor; 0.5 or 0.75, when the loss of turgor progressed to leaves in the third and second middle-quartiles upwards, respectively, or 1 when loss of turgor reached leaves in the first, upper quartile of the plant.
Plant water content was measured in the three experiments as follows: the whole aerial part of each plant was collected on the last day of the experiments, with the exception in the first experiment of the leaf detached for the determination of viral titers, and the hormone and metabolome analysis, as shown in Figure 1. The individual fresh weight of each plant was determined, and plants were then placed for five days in a dry oven at 65 °C. Once dehydrated, they were weighed again (dry weight). The difference in weight informed of their water content: [(fresh weight - dry weight)/ fresh weight] x 100.
Stomatal conductance was measured in the first and third experiments using a leaf porometer [SC-1, Meter Group (formerly Decagon), Pullman, WA, USA] on day 1 after cessation of watering, and again at the end of the experiment (days 13 or 9 after cessation of watering, depending on the experiment). For each type of condition (mock/watered; mock/drought; infected/watered; infected/drought) measures were taken at least from five plants in non-detached, fully expanded leaves. In the first experiment, and in order to minimize disturbances caused during measuring to the temperature, humidity and CO2 partial pressure conditions around plants, measures were taken through a plastic screen that maintained insulation between the exterior environment and the growth chamber when its double doors were opened. A sealable incision in that screen allowed only for the instrument and the arm of the person taking the measures to enter the chamber and reach the plants. In the third experiment, there was no plastic screen. Measures were taken in the same time of the morning, since stomatal aperture varies along the day.
Statistical analysis of data was performed using SPSS Statistics software version 29 (IBM, USA) as specified in each Figure of the Results section.
2.5. Metabolome and Hormone Analysis
The leaves detached from each individual plant at the end of the first experiment minus an excised central disc that was used for the determination of viral titers, were split into two halves as shown in Figure 1, which were separately weighed, frozen in liquid nitrogen, and stored at -80 °C. A minimum of seven of the leaves sampled in each of the four combinations (MW, IW, MD, ID) were subject to metabolome (one half leaf) and hormone (the opposite half leaf) analysis. For the metabolome analysis (53 compounds), extraction was performed as described [40]. Derivatization and gas chromatography coupled to time of-flight mass spectrometry (GC/TOF-MS) analyses were carried out as described [41]. Both, chromatograms and mass spectra were evaluated using TAGFINDER [42]. The metabolite profiling data generated was then subject to statistical analysis by Dunnett’s test. Hierarchical clustering and principal component analyses for clustering metabolite data were performed using R package. For the analysis of hormone levels in fresh tissues [of abscisic acid (ABA), salicylic acid (SA), and jasmonic acid (JA)], sample preparation, extraction and derivatization were performed as described [43]. A volume of 1 µl of each sample was injected into a GC/TOF-MS system. The samples were quantified using internal standards [2H6]-ABA [2H4]-SA [2H6]-JA (OlChemIm Ltd., Olomouc, Czech Republic). For statistical analysis of data, SPSS Statistics software (IBM, USA) was used.
3. Results
3.1. At 30 °C and 970 ppm of CO2, Viral Titers in an Asymptomatic PVY Infection in Either Absence or Presence of Drought, Remain Comparably Low
We confirmed that N. benthamiana plants remained asymptomatic after infection with a PVYO isolate, when kept at 30 °C and 970 ppm of CO2, with normal watering regimes. Their aspect was similar to those of uninfected plants (Figure 2A), and viral titers were several-fold lower than those found in watered plants kept under standard conditions of 25 °C and 410 ppm CO2 (Figure 2B), as had been reported previously [37,38]. We found that when plants were subjected to drought, those observations did not change and that there were no significant differences in viral titers between well-watered plants and plants subject to drought (Figure 2B).
We designed experiments to study physiology effects on N. benthamiana plants kept at 30 °C and 970 ppm CO2 of infection by PVYO, of drought, or of both combined. Experiment 1 is schematically shown in Figure 1: 60 plantlets were kept for seven days after potting under conditions of 25 °C and 970 ppm CO2. On day 7, half of the plants (30) were inoculated with PVY and the other half were mock inoculated, and temperature was increased to 30 °C. Several days after inoculation with virus half of the infected plants and half of the mock plants were normally watered, while the other half was subjected to watering withdrawal. There were thus four groups, each starting with 15 plants: MW; IW; MD; and ID.
3.2. At 30 °C and 970 ppm of CO2, an Asymptomatic PVY Infection Does Not Significantly Prevent the Loss of Leaf Turgor Caused by Drought
We assessed the daily loss of leaf turgor in plants subjected to lack of watering in the three experiments. Loss of turgor was considered to occur when a leaf started to wilt at its edges and could not remain fully expanded. This effect appeared first in the lower leaves of the plant, and progressed towards the upper leaves with time. We observed that in the three separate experiments the loss of leaf turgor seemed to appear in mock plants earlier than infected plants earlier, with a delay in all cases of approximately one day. However, at the end of the assessment period in the first and second experiments the loss-of-turgor values of uninfected vs. infected plants converged, but this convergence had yet to be reached at the end of the third experiment (Figure 3). Because starting plants in the second and third experiment were larger in size than those used in the first experiment, their loss-of-turgor under drought conditions progressed faster. Point-biserial correlations were run to determine the relationship between the dependent variable (speed of loss-of-turgor progression) and a dichotomous variable (uninfected vs. infected plants) at time points when those differences were larger (days 10, 11 and 12 of experiment 1; days 7 and 8 of exp. 2 and of exp. 3), using Pearson or Spearman correlations, depending on whether the dependent displayed normal or near-normal distribution, or not. Although weak negative correlation between loss-of-turgor progression and infection was found for all the time points analyzed, none was statistically significant.
3.3. At 30 °C and 970 ppm of CO2, an Asymptomatic PVY Infection in Either Absence or Presence of Drought, Does Not Affect The Final Plant Water Content
We measured the total water content in the aerial parts of the four types of plants (MW, MD, IW, ID), at the end of the three experiments. As expected, in the three experiments drought reduced significantly the final plant water content of uninfected plants (MW vs. MD; Figure 4). However, in infected plants (IW vs. ID), drought reduced significantly the final plant water content of the plants of experiments 1 and 2, but not of experiment 3 (Figure 4).
We also assessed leaf stomatal conductance during experiments 1 and 3, and at two time points: the day after cessation of watering of the plants that were to be subjected to drought, and at the end of the experiment. We found that drought [second time point, 13 and 9 days after watering withdrawal (daww), depending on the experiment] reduced conductance significantly in both, non-infected and in infected plants (MW vs. MD, IW vs. ID, respectively; Figure 5). Infection reduced conductance significantly in both experiments in the first time-point, one day after cessation of watering, when there was not any drought effect (MW vs. IW, at 1 daww; Figure 5). However, at the later time point there were no statistically significant differences in conductance caused by infection among the well-watered plants (MW vs. IW), and in plants under drought (where conductance was already lower than in well-watered plants) infection reduced it further significantly only in the first experiment (Figure 5).
Although conductance profiles were similar in both experiments, their measured values were higher in the first experiment. In the first experiment measures were taken through an insulating screen to prevent disturbing the environment surrounding the measured plants, whereas in the third experiment, there was no screen and measures were taken through an opened phytotron door.
3.3. At 30 °C and 970 ppm of CO2, an Asymptomatic PVY Infection, Drought, or the Two Combined, Alter Differently the Metabolome
Differences in the accumulation of 53 different compounds present in fully-developed upper leaves were determined at the end of the first experiment for the four types of plants (MW; IW; MD; ID). Significant variations were found in many compounds, relative to the MW values, used as control (Figure 6). Infection and/or drought induced marked increases in the sugar maltose and fructose. Levels of organic acids such as glycerate, malate, quinate, threonate, and citrate also increased several-fold. Interestingly, infection increased markedly the levels of several compounds that were not induced by drought, among them histidine, xylose, galacturonate, and the non-protein amino acid GABA. However, the contrary situation was much less frequent: increases in compounds induced by drought alone that were not induced equally or to higher levels also by infection alone (i.e., 3-cis-caffeoylquinic acid). Effects of infection and/or of drought on the levels of the osmo-protectant amino acids proline, valine and glycine were not evident, but increases in the amino acids glutamine and histidine were significant, and were additive when both, drought and infection were combined (Figures 6 and Figure S1, heat map).
Dendrogram analysis showed that the individual samples (individual plants) distinctly clustered along the four types of treatment to which they belonged (MW, IW, MD, and ID; Figure 7A). Principal component analysis (PCA) was used to sort the metabolome data, and it also showed a clear separation between the four types of treatments analyzed, indicating the robustness of the analysis. Two principal components explained 70.25% of the overall variance of metabolome profiles (51,42 and 18,82% for principal component 1 (PC1) and principal component 2 (PC2), respectively; Figure 7B). PC1 seems to highlight a difference between virus-infected and non-infected samples.
3.4. At 30 °C and 970 ppm of CO2, an Asymptomatic PVY Infection, Drought or the Two Combined, Alter Hormone Levels Differently
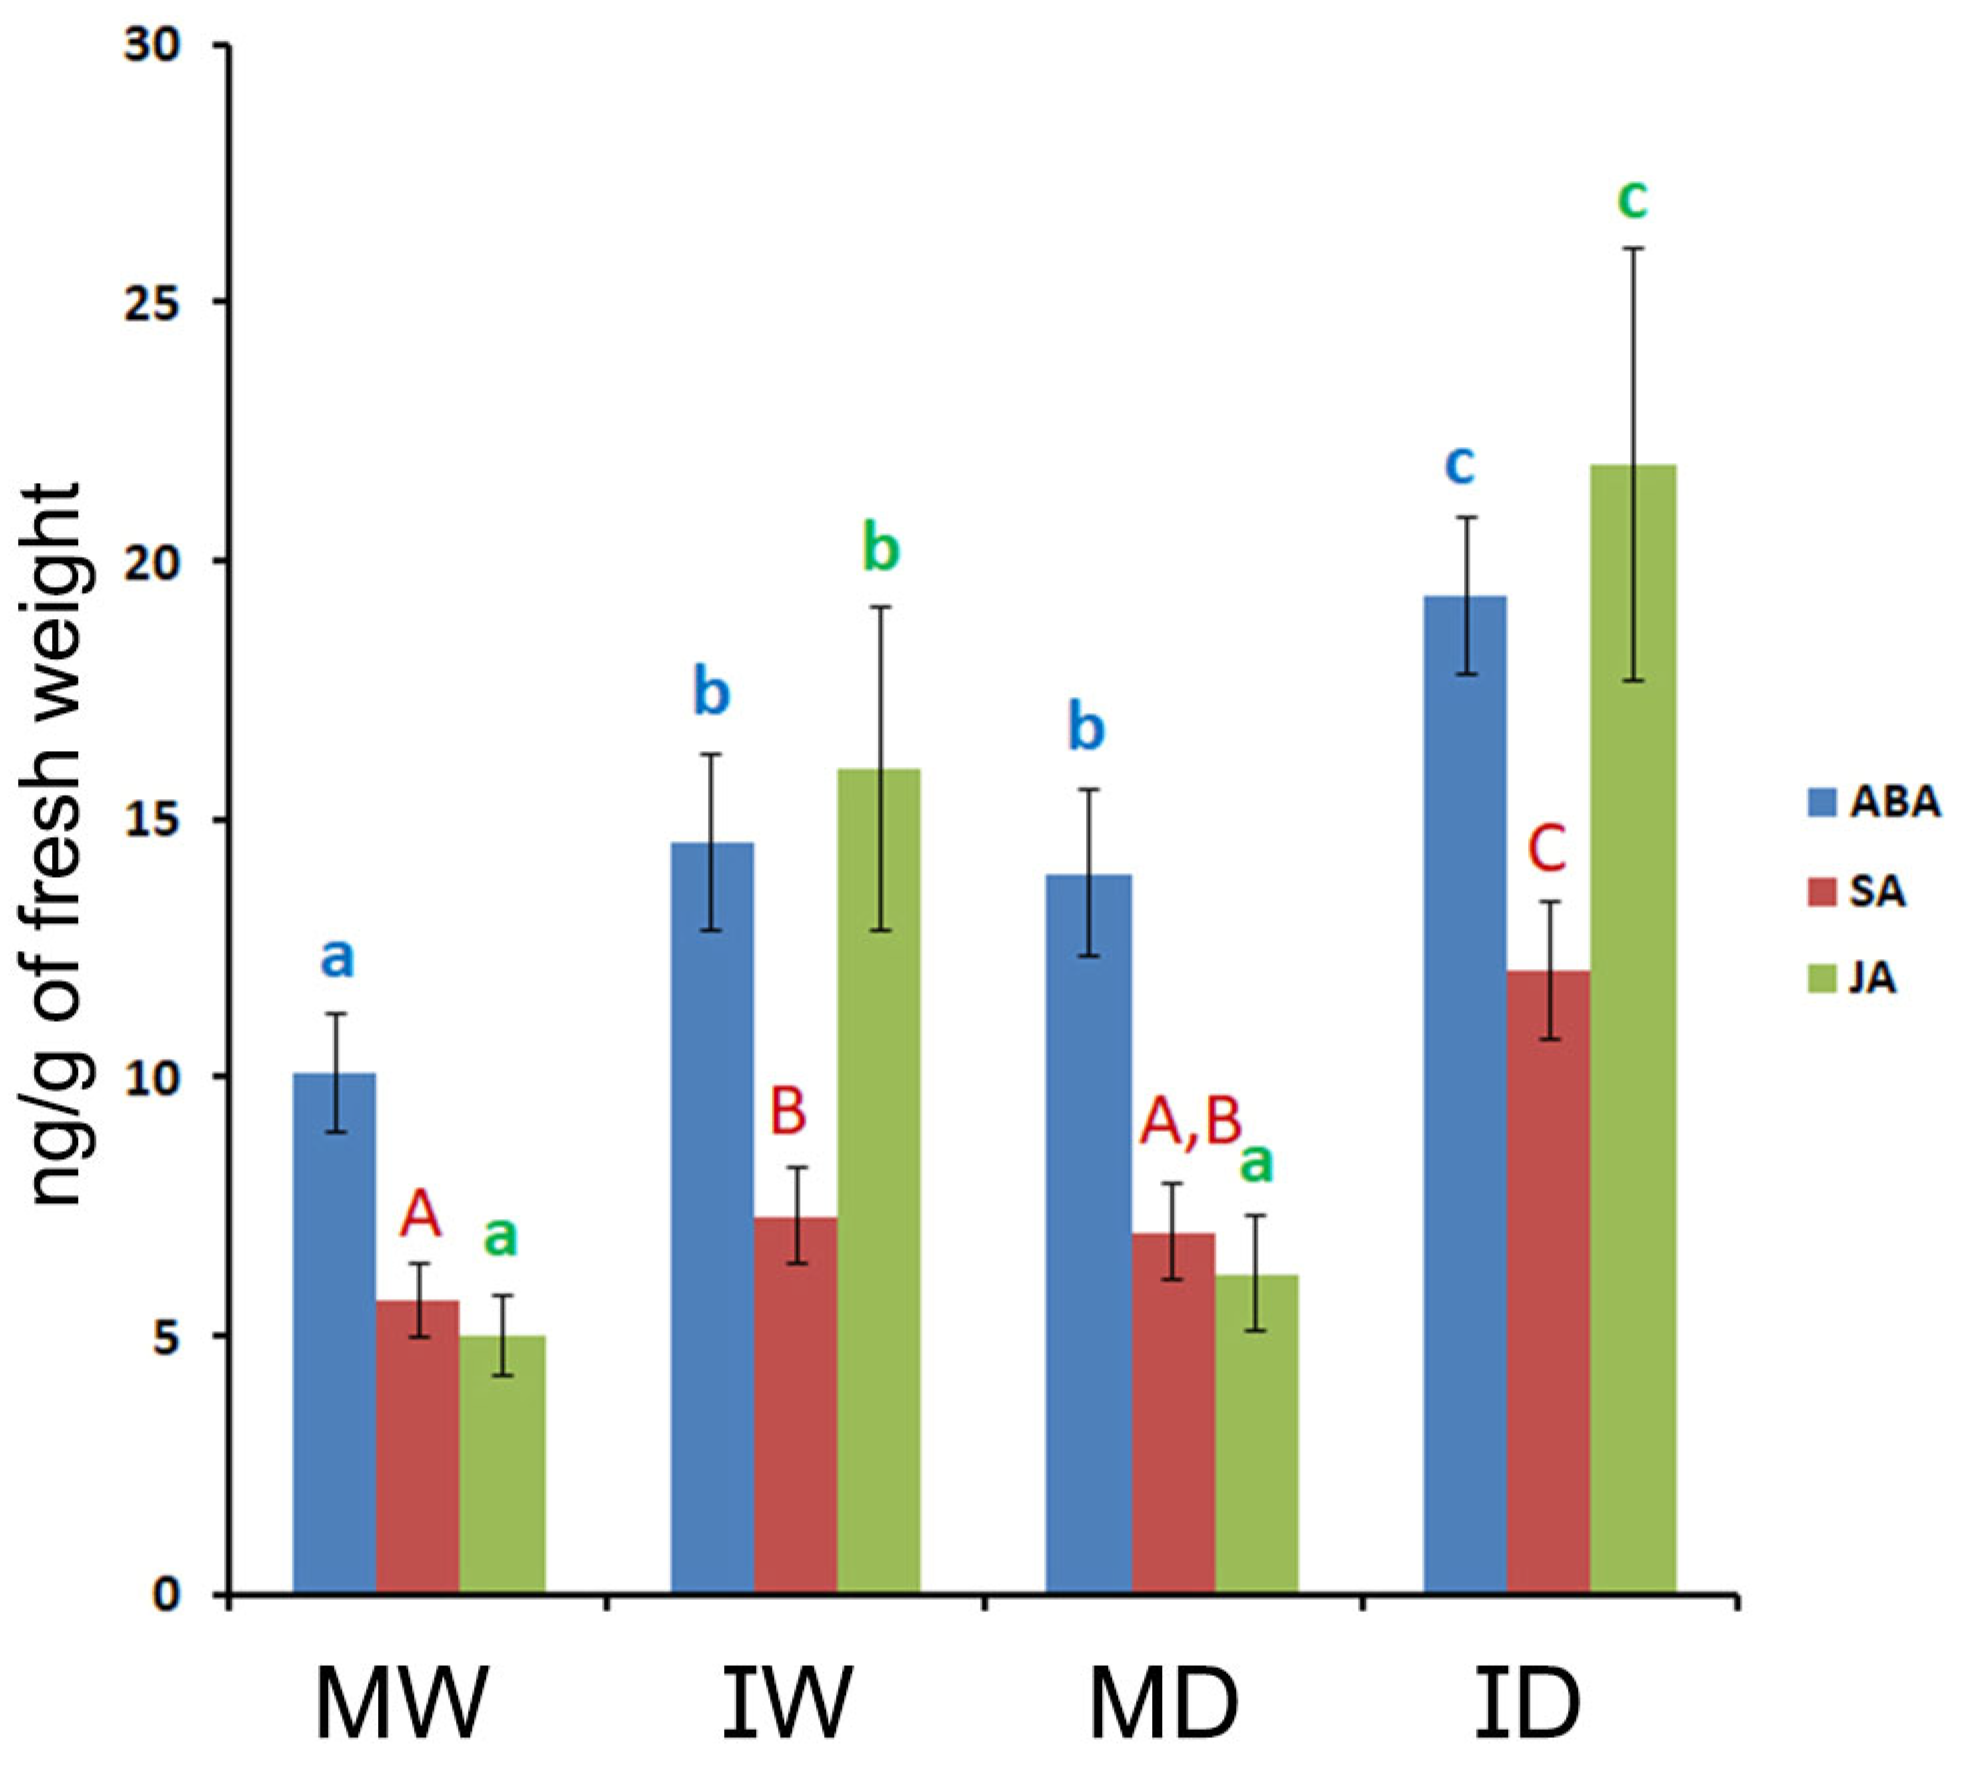
The levels of the plant hormones ABA, SA and JA in fresh-weight, fully-developed leaf tissue samples from the four types of plants (MW, MD, IW, ID) were determined, and we found that drought only increased significantly the levels of ABA (Figure 8). By contrast, PVY infection increased significantly the levels of the three hormones (Figure 8). Infection induced a differential increase in JA levels that was much higher than those of the other two hormones, thus altering also the relative balance between the three hormones (Figure 8). This led to two distinct patterns between the three hormones emerged in the four types of plants, that were determined by infection or its absence (pattern 1: MW, MD vs. pattern 2: IW, ID; Figure 8). Interestingly also, the effects on hormone levels of infection and of drought combined were found to be cumulative (Figure 8).
4. Discussion
Plant viruses have co-evolved with terrestrial plants with flowers since the latter appeared around two hundred million years ago, and diversified enormously, and also with their dispersing vectors. Compatible interactions have developed during this coevolution, which are determined by specific molecular interactions. They have led in many instances to natural infections that are cryptic, or near asymptomatic [1,11]. In addition to this, it has been shown that some symptomatic viral infections can benefit infected hosts in their broader interaction with the environment, for example in their responses to drought [2,3,7,9], thus providing beneficial trade-offs to the infected host that may ultimately also help the virus remain in the environment. These two observations have given a symbiotic edge to plant/virus interactions, and to their co-evolution. However, we still view viruses as basically parasitic entities because they “sequester” the cellular machinery to complete their biological cycle, and because infection outbreaks cause important losses to agriculture.
Extensive literature is available on how infections by viruses that are symptomatic to different degrees affect crops in their physiology. In the case of PVY, effects on the metabolome of potato plants by different viral variants of different infection severity are available [44,45]. However, infection on physiology effects of an infection induced by a normally symptomatic virus in a normally compatible host when it turns asymptomatic not only asymptomatic but subliminal because of environmental conditions is not available. The latter is however the scenario of the patho-system PVYO/N. benthamiana under circumstances of elevated temperature (30 °C) and CO2 levels: the virus is still able to infect the plants systemically, but with a near ten-fold drop in viral titers, and an absence of visual infection symptoms [37,38] (Figure 2). The infection is thus not only asymptomatic but subliminal. This gave us the opportunity to study whether and how such an infection of a normal experimental plant by a normal virus could affect the physiology of the plant, and its interplay with another abiotic stress, drought. It also allowed us to dissect effects on physiology parameters that are caused directly by the infection itself from secondary ones that could be caused by alterations in morphology that the infection induces in this host (such as in its water exchange with the atmosphere), which in the N. benthamiana/PVY system are severe under standard ambient conditions: chlorosis mosaics in leaves, leaf curling and thickening, plant stunting, and even death in small plantlets.
We assessed whether the asymptomatic infection had any effect on loss of leaf turgor progression in three separate experiments, and we observed a slight delay in its appearance in infected vs. mock plants in the three experiments (Figure 3). However, this delay was not statistically significant for any of the time points assessed. In addition, in experiments 1 and 2 the loss of turgor converged at the end of both experiments, but not at the end of experiment 3, which could have had more time to continue. It should be noted that measures of total plant water content are taken at the end of the experiments because they require the destruction of the plant. We thus lack information on the evolution of plant water content at intermediate times during the experiments. However, given the turgor data, water content at the end of experiment 3 could be considered equivalent to measuring water content at an intermediate time in the other two experiments. Interestingly, experiment 3 is the only experiment in which an effect of infection on final plant water content could be observed: infection did not alter significantly the final plant water content in experiments 1 and 2 under conditions of drought, but in experiment 3 that loss of water content appeared attenuated in the infected plants, to the point of being not significant when compared to well-watered plants (ID vs. MW and IW; Figure 4). Thus, the asymptomatic infection has no negative effect on the response of the plant to drought, and could have a positive yet temporary effect on the ability of the plant to keep its water content.
With regard to metabolic alterations, we found that those induced by either the asymptomatic infection of N. benthamiana by our PVYO isolate at 30 °C and 970 ppm of CO2, by drought, or by the two combined were all significant, despite the absence of visible symptoms caused by infection (Figure 6). Alterations induced by infection alone were of a scale comparable to those induced by drought, although affecting the 53 compounds differently (Figure 6). In this regard, there were increases in the levels of some compounds caused by infection alone that were not induced by drought, or to a much lesser extent. However, the reverse was far less common: increases in the levels of some compounds induced by drought alone that were not also matched, or induced to higher levels by infection. When drought and infection combined, the latter increased further the levels of some sugars, such as fructose, and those of other osmo-protectants, such as glutamine (Figure 6). This could help the plant protect itself temporarily against drought, and explain the data on final water content in experiment 3 (Figure 4).
With regard to hormone levels, drought only caused a significant increase in the levels of ABA (Figure 8), which would explain the stomatal closure and reduced conductance (Figure 4). In contrast to drought, the asymptomatic infection led to significant increases in the levels of all three hormones ABA, SA, and JA, and in particular to a larger relative increase in the levels of JA, which altered the relative balance between the three hormones (Figure 8). Interestingly also, when infection and drought combined, their separate effects on the three hormones studied were clearly cumulative (Figure 8).
5. Conclusions
In conclusion, from our results it emerges that under ambient conditions that cause a symptomatic PVY become symptomless, infection does not have any negative effect on the response of plants to drought, and could even have a limited and temporary positive effect on their ability to retain water based on their exchange of water (Figure 3 and Figure 4), and the increases in osmo-protectants that it induces (Figure 6). We also demonstrate its profound effects on the physiology of the plants, affecting their metabolome and hormonal levels and balances, despite its not affecting the plant external appearance. When infection and drought combined, their effect on a few of the metabolome compounds were additive, and this was clearly the case for the hormones assessed.
Supplementary Materials
The following supporting information can be downloaded at the website of this paper posted on Preprints.org, Figure S1: The effects of PVY infection, of drought, or of both combined, on the metabolome of Nicotiana benthamiana plants grown at 30 °C and 790 ppm ambient CO2
Author Contributions
Conceptualization, Francisco del Toro; Data curation, José Vallarino; Formal analysis, Eva Mencía; Funding acquisition, Francisco Tenllado; Investigation, Francisco del Toro, Eva Mencía and Sonia Osorio; Methodology, José Vallarino, Farshad Rakhshandheroo and Sonia Osorio; Project administration, Francisco Tenllado; Validation, Mongia Makki and Hao Sun
Funding
This study was funded by grant PID2022-137691OB-I00, from the Spanish Ministry of Science and Innovation (MCIN/AEI/10.13039/501100011033), and by the European Union Next Generation EU/PRTR. SO acknowledges also funding by grant PID2021-128527OB-I00 from the Spanish Ministry of Science and Innovation (MCIN/AEI/10.13039/501100011033). JGV acknowledges the support by MCIN/AEI, CNS2022-136099, and Ramón y Cajal programme (RYC2021-034936-1). HS was funded by a 4-year PhD fellowship (No. 202108390033) from the National Scholarship Council of the People’s Republic of China.
Data Availability Statement
Data generated described in this article are available from the corresponding authors upon request.
Conflicts of Interest
The authors declare no conflicts of interest.
References
- Roosinck, M.J.; García-Arenal, F. Ecosystem simplification, biodiversity loss and plantvirus emergence. Curr. Op. Virol. 2015, 10, 56–62. [Google Scholar] [CrossRef] [PubMed]
- Aguilar, E.; Cutrona, C.; del Toro, F.; Vallarino, J.; Osorio, S.; Pérez Bueno, M. L.; Barón, M.; Chung, B-N. ; Canto, T.; Tenllado, F. Virulence determines beneficial trade-offs in the response of virus-infected plants to drought via induction of salicylic acid. Plant Cell Environ. 2017, 40, 2909–2930. [Google Scholar] [CrossRef]
- Corrales-Gutierrez, M.; Medina-Puche, L. ; Yu,Y.; Wang, L.; Ding, X.; Luna, A. P.; Bejarano, E. R.; Castillo, A. G.; and Lozano-Duran, R. The C4 protein from the geminivirus Tomato yellow leaf curl virus confers drought tolerance in Arabidopsis through an ABA-independent mechanism. Plant Biotechnol. J. 2020, 18, 1121–1123. [Google Scholar]
- González, R.; Butković, A.; Escaray, F.J.; Martínez-Latorrea, J.; Meleroa, I.; Pérez-Parets, E.; Gómez-Cadena, A.; Carrasco, P.; Elena, S.F. Plant virus evolution under strong drought conditions results in a transition from parasitism to mutualism. Natl. Acad. Sci. USA 2021, 118, e2020990118. [Google Scholar] [CrossRef]
- Prakash, V.; Nihranz, C.T.; Casteel, C.L. The Potyviral Protein 6K2 from Turnip Mosaic Virus Increases Plant Resilience to Drought. Mol. Plant-Microbe Interact. 2023, 36, 189–197. [Google Scholar] [CrossRef] [PubMed]
- Roossinck, M.J. A new look at plant viruses and their potential beneficial roles in crops. Mol. Plant Pathol. 2015, 16, 331–333. [Google Scholar] [CrossRef] [PubMed]
- Westwood, J.H.; Mccann, L.; Naish, M.; Dixon, H.; Murphy, A.M.; Stancombe, M.A.; Carr, J.P. A viral RNA silencing suppressor interferes with abscisic acid-mediated signalling and induces drought tolerance in Arabidopsis thaliana. Mol. Plant Pathol. 2013, 14, 158–170. [Google Scholar] [CrossRef]
- Wu, X.; Chen, S.; Zhang, Z.; Zhou, W.; Sun, T.; Ning, K.; Xu, M.; Ke, X.; Xu, P. A viral small interfering RNA-host plant mRNA pathway modulates virus-induced drought tolerance by enhancing autophagy. Plant Cell, 2024, 00, 1–18. [Google Scholar] [CrossRef]
- Xu, P.; Chen, F.; Mannas, J.P.; Feldman, T.; Sumner, L.W.; Roossinck, M.J. Virus infection improves drought tolerance. New Phytol. 2008, 180, 911–921. [Google Scholar] [CrossRef] [PubMed]
- Bergès, S. E.; Vasseur, F.; Bediée, A.; Rolland, G.; Masclef, D.; Dauzat, M.; van Munster, M.; Vile, D. Natural variation of Arabidopsis thaliana responses to Cauliflower mosaic virus infection upon water deficit. PLOS Pathog. 2020, 16e1008557. [Google Scholar] [CrossRef]
- Lefeuvre, P.; Martin, D.P.; Elena, S.F.; Shepherd, D.N.; Roumagnac, P.; Varsani, A. Evolution and ecology of plant viruses. Nat. Rev. Microbiol. 2019, 17, 632–644. [Google Scholar] [CrossRef]
- Roossinck, M.J. The good viruses, viral mutualistic symbioses. Nat. Rev. Microbiol. 2011, 9, 99–108. [Google Scholar] [CrossRef] [PubMed]
- Baulcombe, D. RNA silencing in plants. Nature 2004, 431, 356–363. [Google Scholar] [CrossRef] [PubMed]
- Alazem, M.; Lin, N-S. Roles of plant hormones in the regulation of host–virus interactions. Mol. Plant Pathol. 2015, 16, 529–540. [Google Scholar] [CrossRef] [PubMed]
- Collum, T.D.; Culver, J.N. The impact of phytohormones on virus infection and disease. Curr. Opin. Virol. 2016, 17, 25–31. [Google Scholar] [CrossRef] [PubMed]
- Palukaitis, P. ; Yoon, J-Y. Defense signaling pathways in resistance to plant viruses, Crosstalk and finger pointing. Adv. Virus Res 2024, 118, 77–212, ISSN 0065-3527. [Google Scholar]
- Robert-Seilaniantz, A.; Grant, M.; Jones, J.D.G. Hormone crosstalk in plant disease and defense, more than just Jasmonate-Salicylate Antagonism. Annu. Rev. Phytopathol. 2011, 49, 317–343. [Google Scholar] [PubMed]
- Sharma, A.; Shahzad, B.; Kumar, V.; Kohli, S.K.; Sidhu, G.P.S.; Bali, A.S.; Handa, N.; Kapoor, D.; Bhardwaj, R.; Zheng, B. Phytohormones regulate accumulation of osmolytes under abiotic stress. Biomolecules 2019, 9, 285. [Google Scholar] [CrossRef] [PubMed]
- Zhao, S.; Li, Y. Current understanding of the interplays between host hormones and plant viral infections. PLOS Pathogens 2021, 17, e1009242. [Google Scholar]
- Zhu, F.; Xi, D.H.; Yuan, S.; Xu, F.; Zhang, D.W.; Lin, H.H. Salicylic acid and jasmonic acid are essential for systemic resistance against tobacco mosaic virus in Nicotiana benthamiana. Mol. Plant-Microbe Interact. 2014, 27, 567–577. [Google Scholar] [PubMed]
- Burgyán, J.; Havelda, Z. Viral suppressors of RNA silencing. Trends Plant Sci. 2011, 16, 265–272. [Google Scholar] [CrossRef]
- Huang C, Sede AR, Elvira-González L, Yan Y, Rodriguez M, Mutterer J, Boutant E, Shan L, Heinlein M. dsRNA-induced immunity targets plasmodesmata and is suppressed by viral movement proteins. Plant Cell 2023, 35, 3845–3869.
- Nicaise, V.; Candresse, T. Plum Pox Virus Capsid Protein Suppresses Plant Pathogen-Associated Molecular Pattern (PAMP)-Triggered Immunity. Mol. Plant Pathol. 2017, 18, 878–886. [Google Scholar]
- Wu, H.; Li, B.; Iwakawa, H-O. ; Pan, Y.; Tang, X.; Ling-hu, Q.; Liu, Y.; Sheng, S.; Feng, L.; Zhang, H.; Zhang, X.; Tang, Z.; Xia, X.; Zhai, J.; Guo, H. Plant 22-nt siRNAs mediate translational repression and stress adaptation. Nature 2020, 581, 89–93. [Google Scholar] [CrossRef]
- Pallas, V.; García, J.A. How do plant viruses induce disease? Interactions and interference with host components. J. Gen. Virol. 2011, 92, 2691–2705. [Google Scholar] [CrossRef]
- Ilyas, R.; Rohde, M.J.; Richert-Pöggeler, K.R.; Ziebell, H. To be seen or not to be seen, latent infection by tobamoviruses. Plants 2022, 11, 2166. [Google Scholar] [CrossRef]
- Atreya, C.D.; Atreya, P.L.; Thornbury, D.W.; Pirone, T.P. Site-Directed Mutations in the Potyvirus HC-PRO Gene Affect Helper Component Activity, Virus Accumulation, and Symptom Expression in Infected Tobacco Plants. Virology 1992, 191, 106–111. [Google Scholar] [CrossRef]
- Shiboleth, Y.M.; Haronsky, E.; Leibman, D.; Arazi, T.; Wassenegger, M.; Whitham, S.; Gaba, V.; Gal-On, A. The conserved FRNK box in HC-Pro, a plant viral suppressor of gene silencing, is required for small RNA binding and mediates symptom development. J. Virol. 2007, 81, 13135–13148. [Google Scholar] [CrossRef]
- Torres-Barceló, C.; Martín, S.; Darós, J.A.; Elena, S.F. From hypo- to hypersuppression, effect of amino acid substitutions on the RNA-silencing suppressor activity of the tobacco etch potyvirus HC-Pro. Genetics, 2008, 180, 1039–1049. [Google Scholar] [CrossRef]
- Geng, C.; Wang, H-Y. ; Liu, J.; Yan, Z-Y.; Tian, Y-P.; Yuan, X-F.; Gao, R.; Li, X-D. Transcriptomic changes in Nicotiana benthamiana plants inoculated with the wild-type or an attenuated mutant of tobacco vein banding mosaic virus. Mol. Plant Pathol. 2017, 18, 1175–1188. [Google Scholar] [CrossRef]
- Sun, H.; del Toro, F.; Makki, M.; Tenllado, F.; Canto, T. Adaptation of a potyvirus chimera increases its virulence in a compatible host through changes in HCPro. Plants 11, 2262.
- Sun, H.; Ciska, M.; Makki, M.; Tenllado, F.; Canto, T. Adaptive substitutions at two amino acids of HCPro modify its functional properties to separately increase the virulence of a potyviral chimera. Mol. Plant Pathol. 2024. [Google Scholar] [CrossRef]
- Yoon, J.Y.; Ahn, H.I.; Kim, M.; Tsuda, S.; Ryu, K.H. Pepper mild mottle virus pathogenicity determinants and cross protection effect of attenuated mutants in pepper. Virus Res. 2006, 118, 23–30. [Google Scholar] [CrossRef]
- Shteinberg, M.; Mishra, R.; Anfoka, G.; Altaleb, M.; Brotman, Y.; Moshelion, M.; Gorovits, R.; and Czosnek, H. Tomato yellow leaf curl virus (TYLCV) promotes plant tolerance to drought. Cells 2021, 10, 2875. [Google Scholar] [CrossRef]
- Choi, K.S.; del Toro, F.; Tenllado, F.; Canto, T.; Chung, B-N. A Model to Explain Temperature Dependent Systemic Infection of Potato Plants by Potato virus Y. Plant Pathol. J. 2017, 33, 206–211. [Google Scholar] [CrossRef]
- Chung B-N. ; Canto, T.; Tenllado, F.; Choi, K.S.; Joa, J.H.; Ahn, J.J.; Kim, C.H.; Do, K.S. The effects of high temperature on infection by Potato virus Y, Potato virus A, and Potato leafroll virus. Plant Pathol. J. 2016, 32, 321–328. [Google Scholar] [CrossRef]
- del Toro, F.J.; Aguilar, E.; Hernández-Walias, F.J.; Tenllado, F.; Chung, B-N. ; Canto, T. High temperature, high ambient CO2 affect the interactions between three positive-sense RNA viruses and a compatible host differentially, but not their silencing suppression efficiency. PLOS ONE 2015, 10, e136062. [Google Scholar] [CrossRef]
- del Toro, F.; Rakhsandehroo, F.; Larruy, B.; Aguilar, E.; Tenllado, F.; Canto, T. Effects of simultaneously elevated temperature and CO2 levels on Nicotiana benthamiana and its infection by different positive-sense RNA viruses are cumulative and virus type-specific. Virology 2017, 511, 184–192. [Google Scholar] [CrossRef]
- Barker, H.; McGeachy, K.D.; Toplak, N.; Gruden, K.; Žel, J.; Browning, I. Comparison of Genome Sequence of PVY Isolates with Biological Properties. Am. J. Pot. Res. 2009, 86, 227–238. [Google Scholar] [CrossRef]
- Osorio, S.; Vallarino, J.G.; Szecowka, M.; Ufaz, S.; Tzin, V.; Angelovici, R.; Fernie, A.R. Alteration of the interconversion of pyruvate and malate in the plastid or cytosol of ripening tomato fruit invokes diverse consequences on sugar but similar effects on cellular organic acid, metabolism, and transitory starch accumulation. Plant Physiol. 2013, 161, 628–643. [Google Scholar] [CrossRef]
- Lisec, J.; Schauer, N.; Kopka, J.; Willmitzer, L. Fernie, A.R. Gas chromatography mass spectrometry-based metabolite profiling in plants. Nat. Protoc. 2006, 1, 387–396. [Google Scholar] [CrossRef]
- Luedemann, A.; Strassburg, K.; Erban, A.; Kopka, J. TagFinder for the quantitative Analysis of gas chromatography mass spectrometry–(GC-MS)-based metabolite profiling experiments. Bioinformatics 2008, 24, 732–737. [Google Scholar] [CrossRef]
- Vallarino, J.G.; Osorio, S. Simultaneous determination of plant hormones by GC-TOF-MS. Plant Signal Transduct. 2016, 1363, 229–237. [Google Scholar]
- Kogovšek, P.; Pompe-Novak, M.; Petek, M.; Fragner, L.; Weckwerth, W.; Gruden, K. Primary metabolism, phenylpropanoids and antioxidant pathways are regulated in potato as a response to potato virus Y infection. PLOS ONE 2016, 11, e0146135. [Google Scholar] [CrossRef]
- Manasseh, R.; Berim, A.; Kappagantu, M.; Moyo, L.; Gang, D.R.; Pappu, H.R. Pathogen-triggered metabolic adjustments to potato virus Y infection in potato. Front. Plant Sci. 2023, 13, 1031629. [Google Scholar] [CrossRef]
Figure 1.
Schematic representation of the conditions of plant growth, the timing of virus inoculation, the start of watering withdrawal, and the type of leaf tissue sampled, for the different analyses performed. Plants (total of 60 Nicotiana benthamiana plants, organized in four trays, with 15 plants in each) were kept at 25 °C and 970 ppm of CO2 for 7 days after potting. On day 7, 30 plants were inoculated with PVY and the other 30 were mock-inoculated, and temperature was increased to 30 °C. On day 16, pots were saturated with water and from that day onwards, plants were either watered normally or not at all (watering withdrawal, drought conditions). There were therefore four types of treatment (uninfected/well-watered; uninfected/drought; infected/well-watered; infected/drought), each with 15 plants. The experiment finished 22 days after virus inoculation. Time points at which samples were taken for the analyses indicated. The lower square diagram to the left describes how the 15 plants inside each tray were moved daily, to minimize any locational effects on the measures taken. The four trays also rotated position daily.
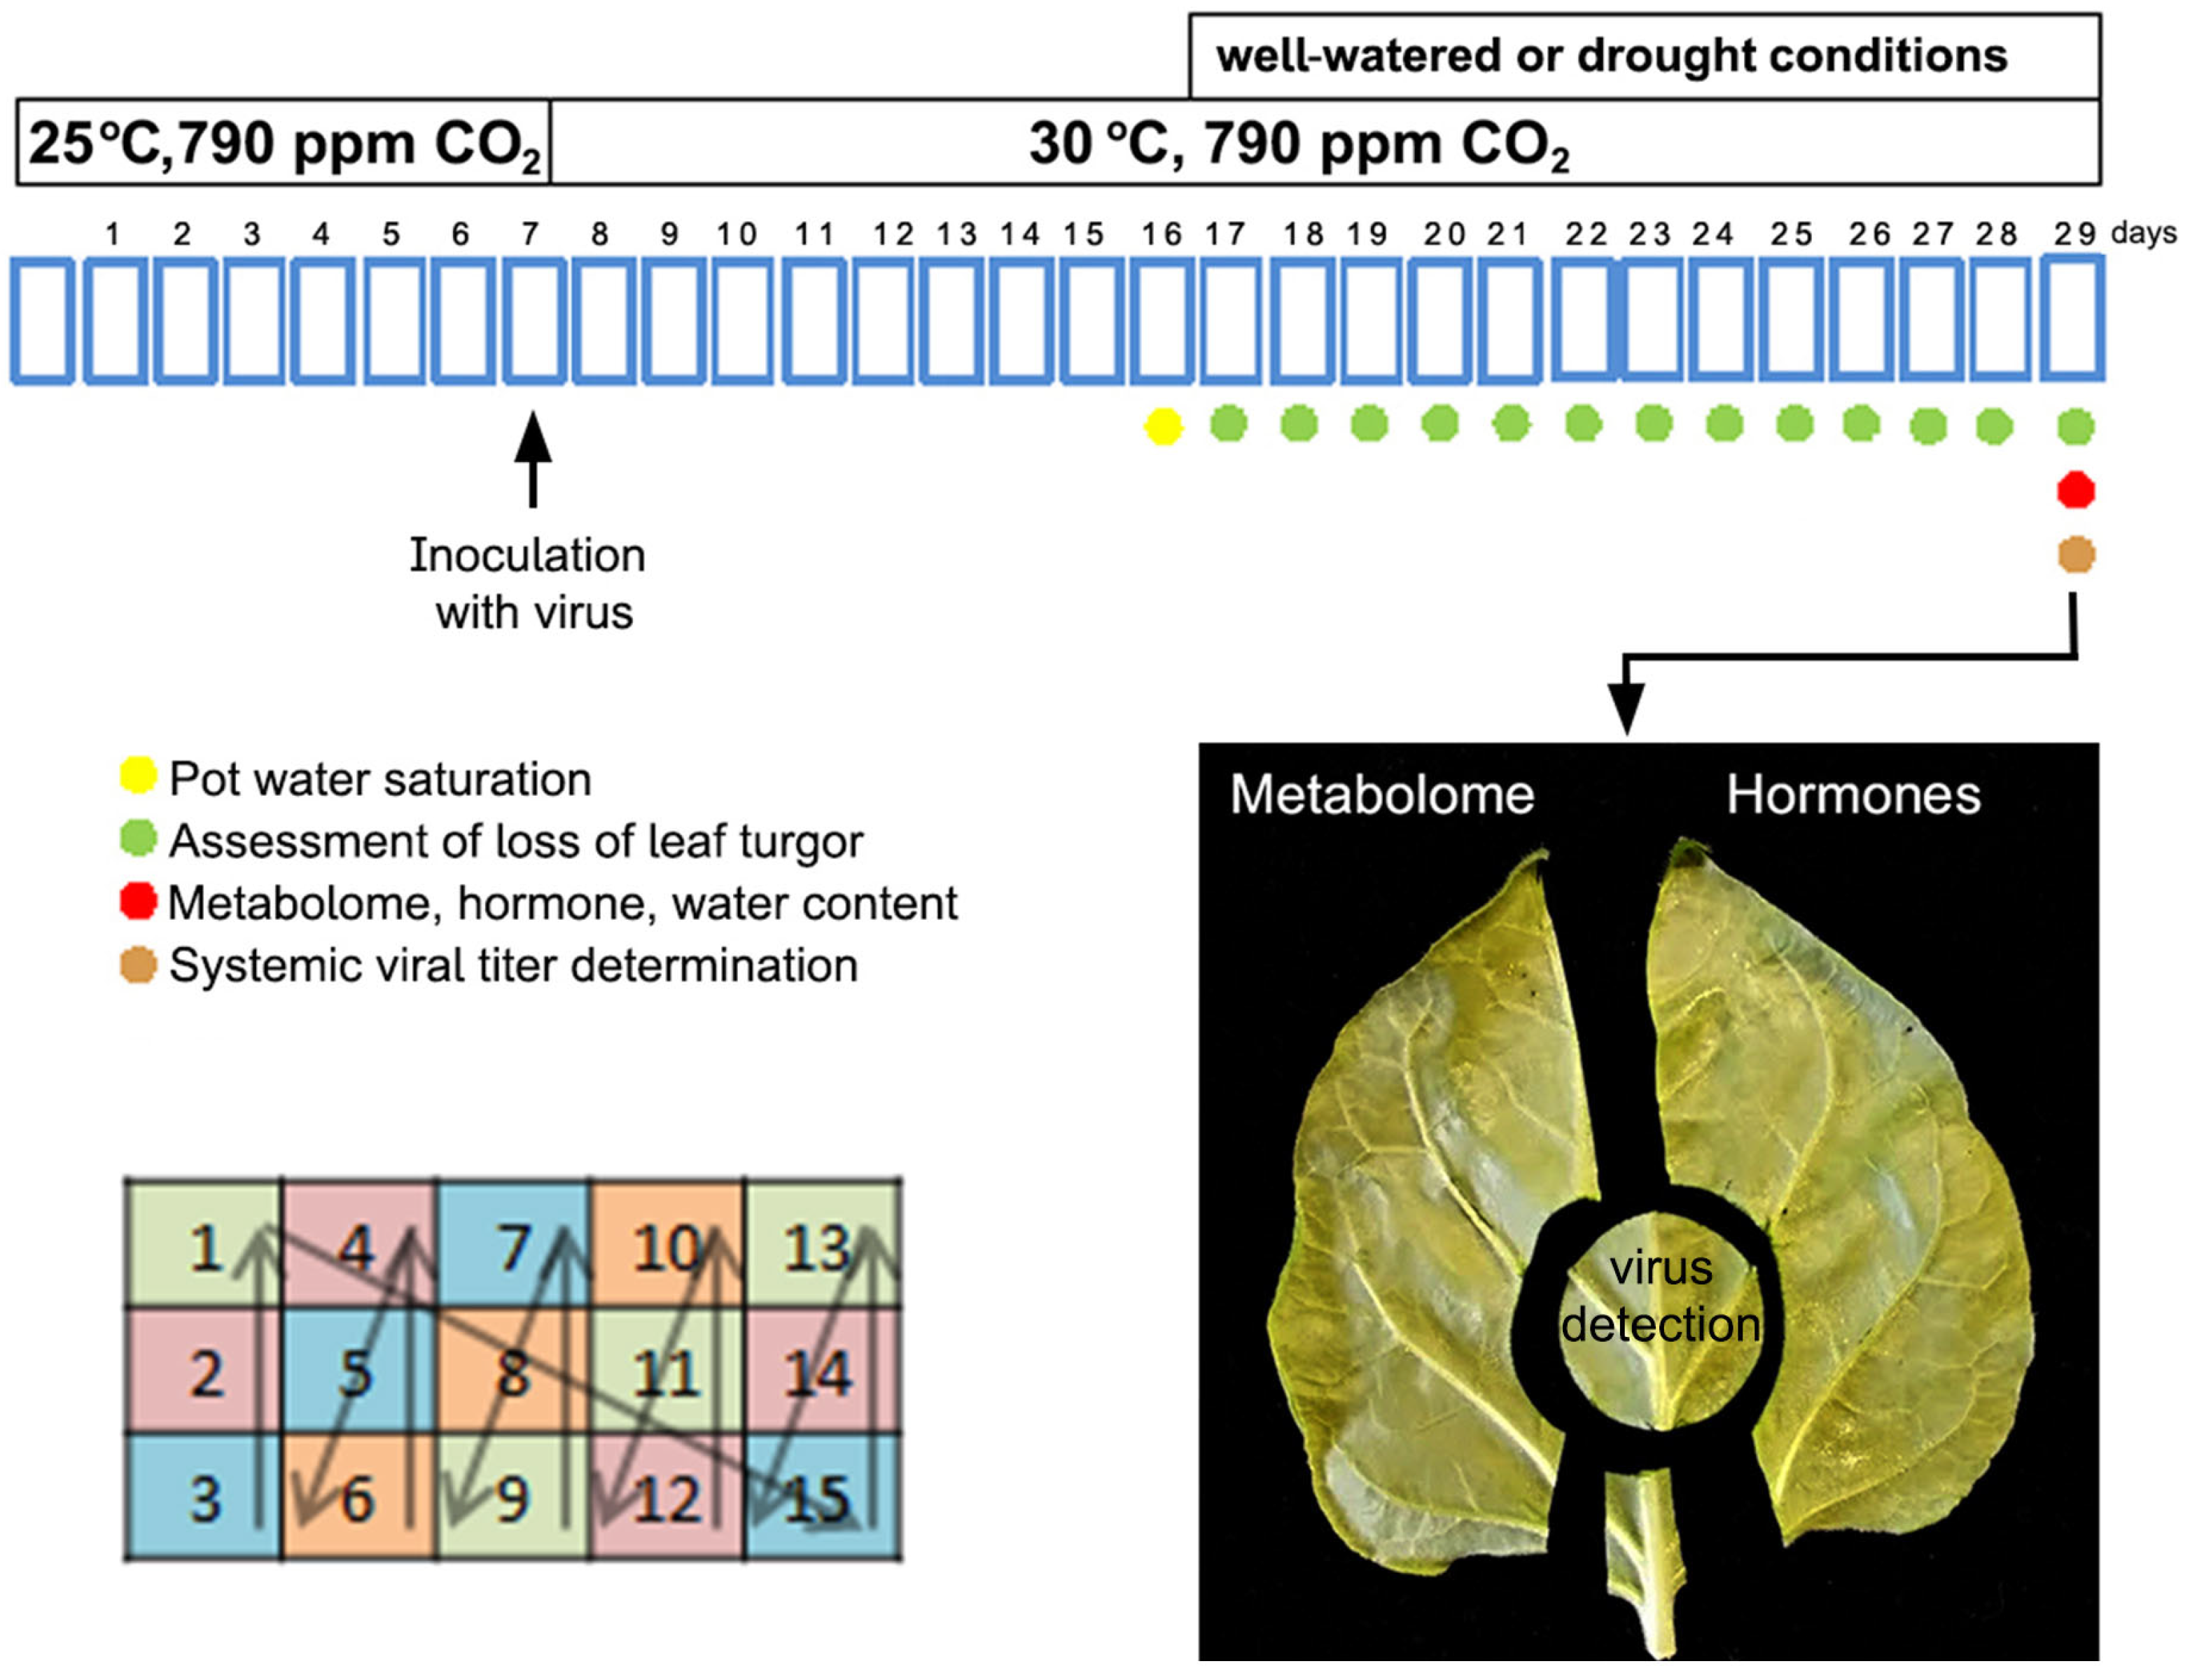
Figure 2.
The effects on visual infection symptoms and on viral titers of an infection by PVY of Nicotiana benthamiana plants under 30 °C and 790 ppm CO2 ambient conditions. (A), No visual differences with uninfected plants were apparent. Each panel shows upper and lateral views of a plant. Plants were kept either under conditions of 25 °C and ambient (~ 410 ppm) CO2 (two panels to the left), or 30 °C and 790 ppm CO2 (two panels to the right). The upper panels show uninfected plants, and the lower panels PVY-infected plants. Images were taken two weeks after inoculation. (B), infected, well-watered plants (IW) and infected plants subject to drought (ID) held comparable viral titers at 22 days post inoculation, 13 days after watering withdrawal in the case of plants under drought conditions. Plants labeled L, M, and S correspond to larger, medium and smaller plants, respectively. Titers were several-fold lower than those found in plants kept at 25 °C and ambient CO2 levels (arbitrary value of 1). Ns indicates not significant differences at P < 0.05. Anova.
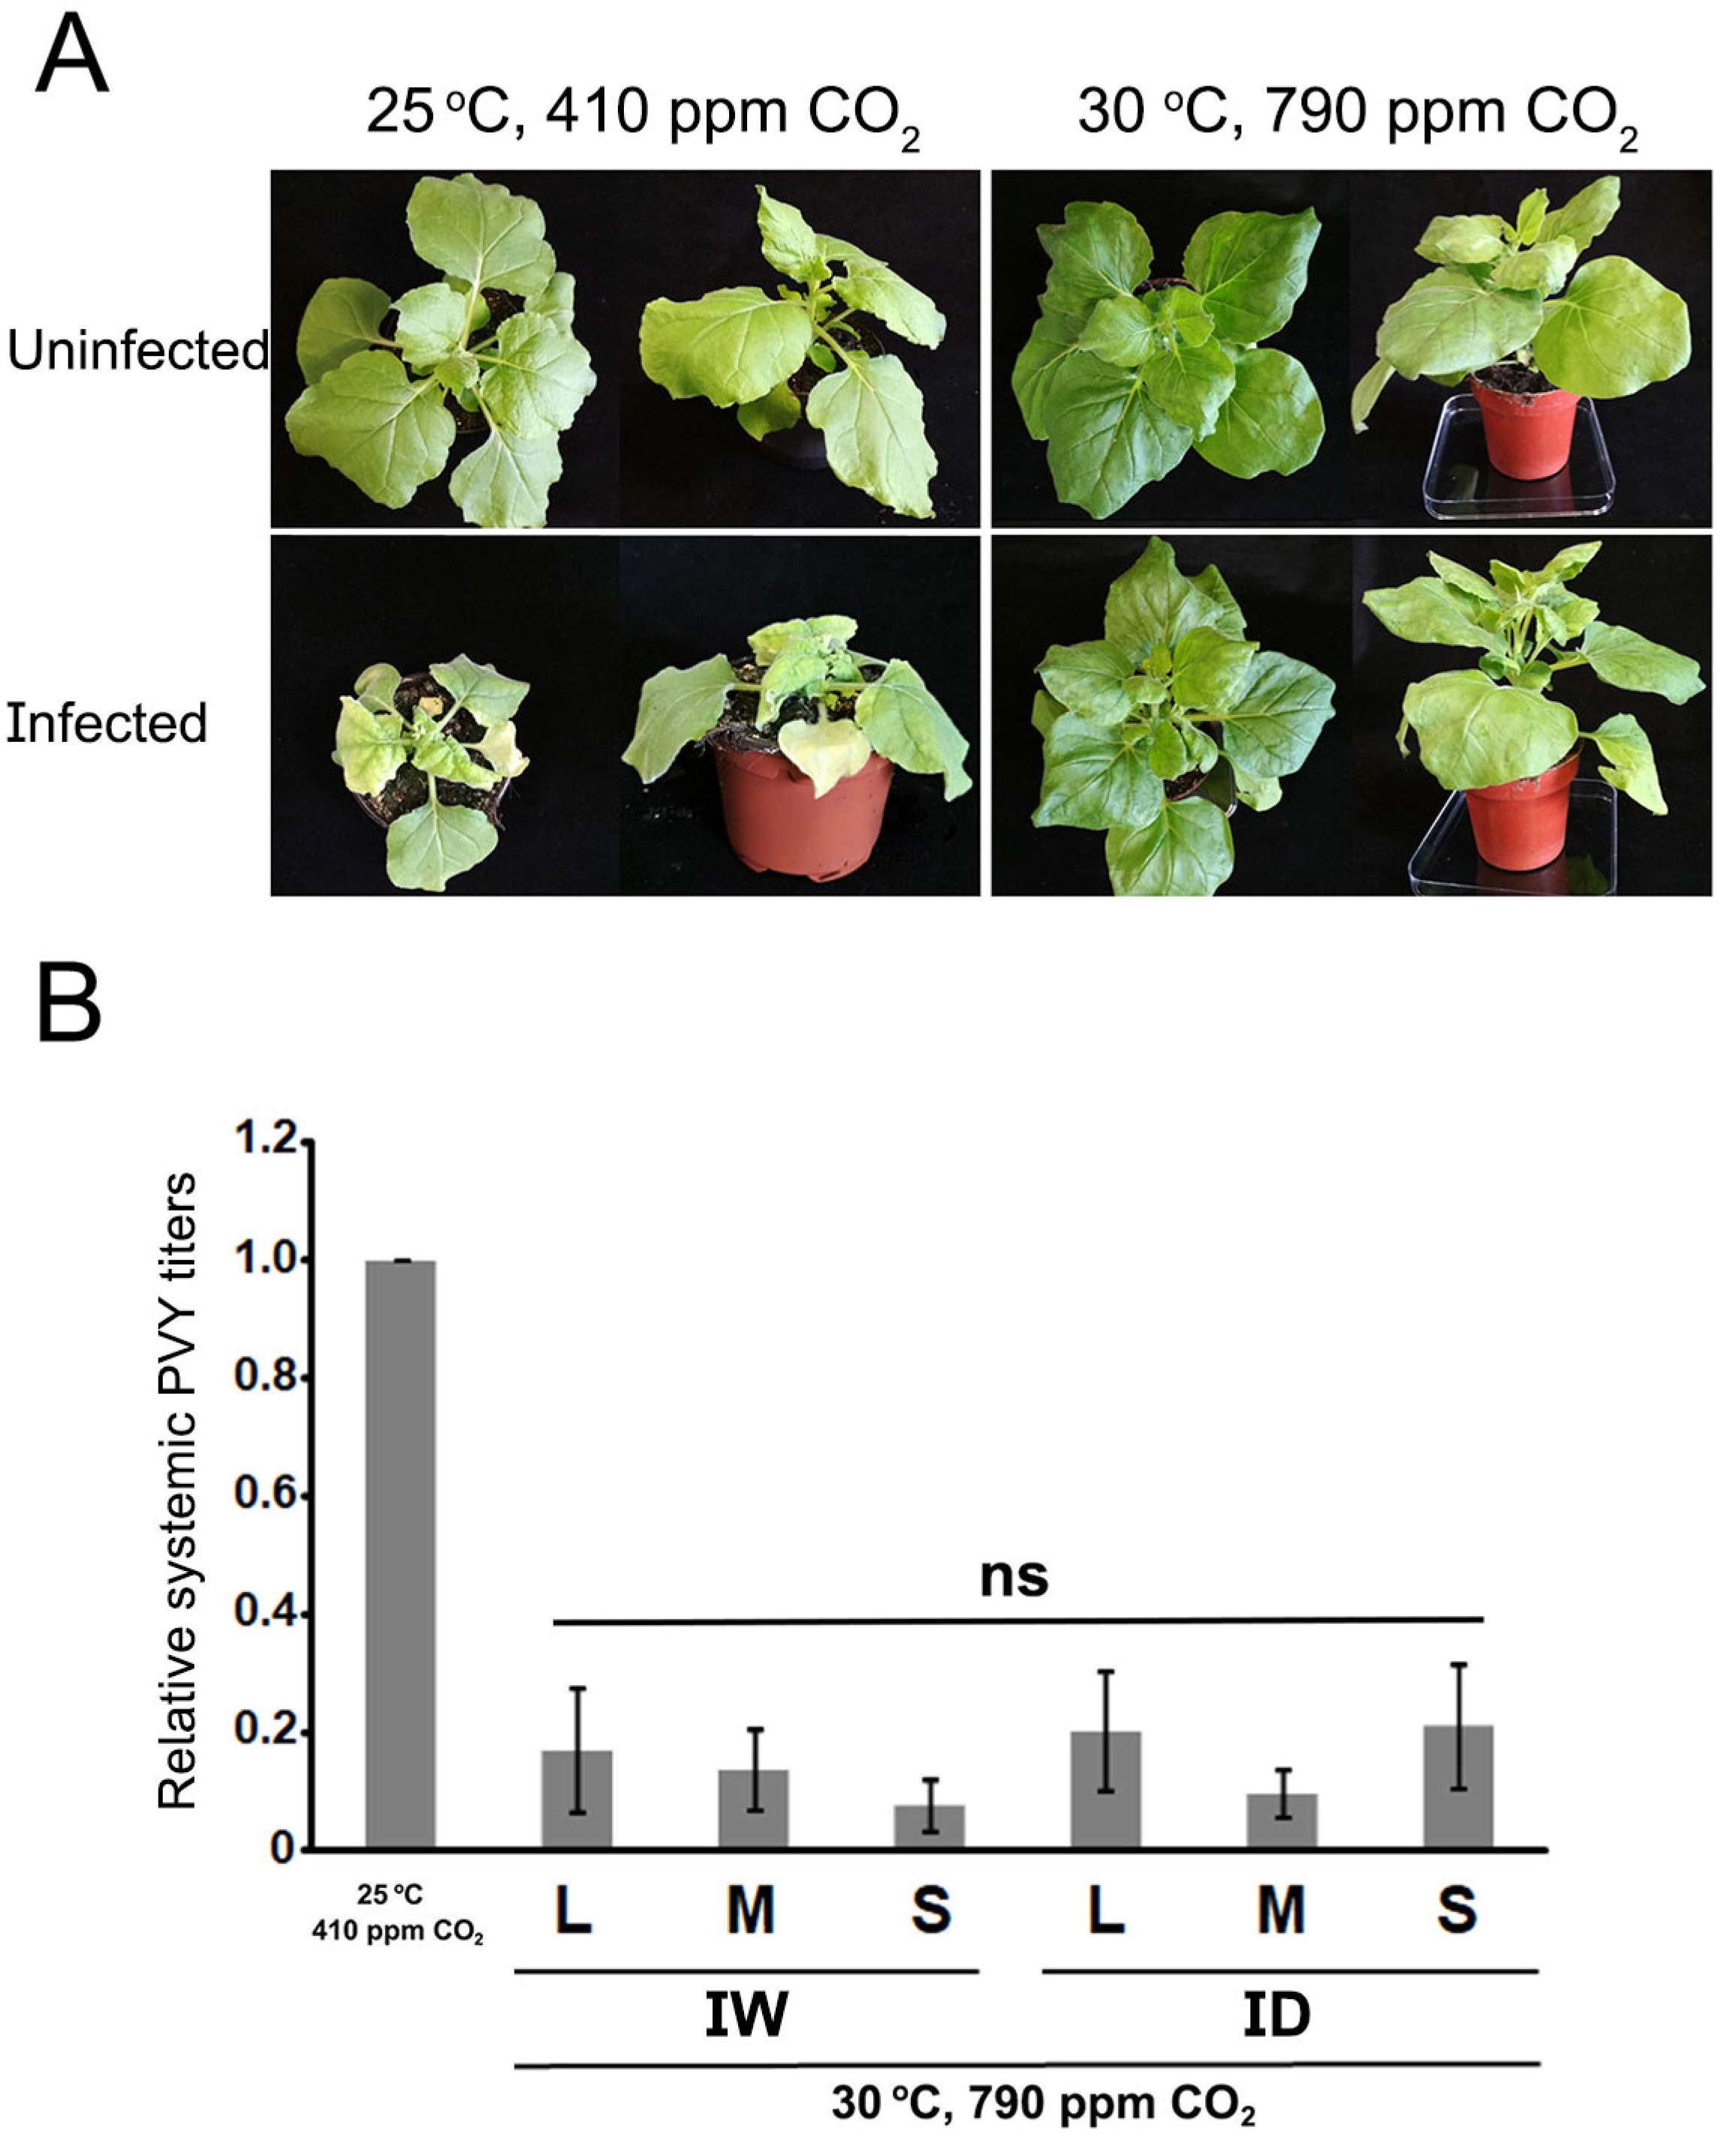
Figure 3.
The effect of PVY infection on the progressive loss of leaf turgor in Nicotiana benthamiana plants grown at 30 °C and 790 ppm ambient CO2 under drought conditions. The three charts display the loss-of-leaf turgor progression of mock vs. infected plants during drought (mock/drought, MD vs. infected/drought, ID) in three separate experiments. Individual plants were assessed daily for signs of leaf wilting. In each experiment, of 30 plants subject to watering withdrawal (drought), 15 were uninfected and 15 were infected with PVY. Wilting appeared first in the lowest leaves, and progresses upwards. Plants without signs of wilting were given the value of 0,0. If any leaf in the lower quartile of the plant displayed any sign of wilting the plant was given the value 0.25; if wilting progressed to leaves of the middle and upper middle quartiles they were given the values 0.5 and 0.75, respectively; and 1 if wilting appeared in leaves of the top quartile (the upper part) of the plant. A schematic representation of those plant quartiles is shown to the right of the upper chart. Each data point shows the average value for the plants tested. Although in the three experiments point biserial correlation tests indicated weak negative correlation between loss of turgor and infection, none were statistically significant. .
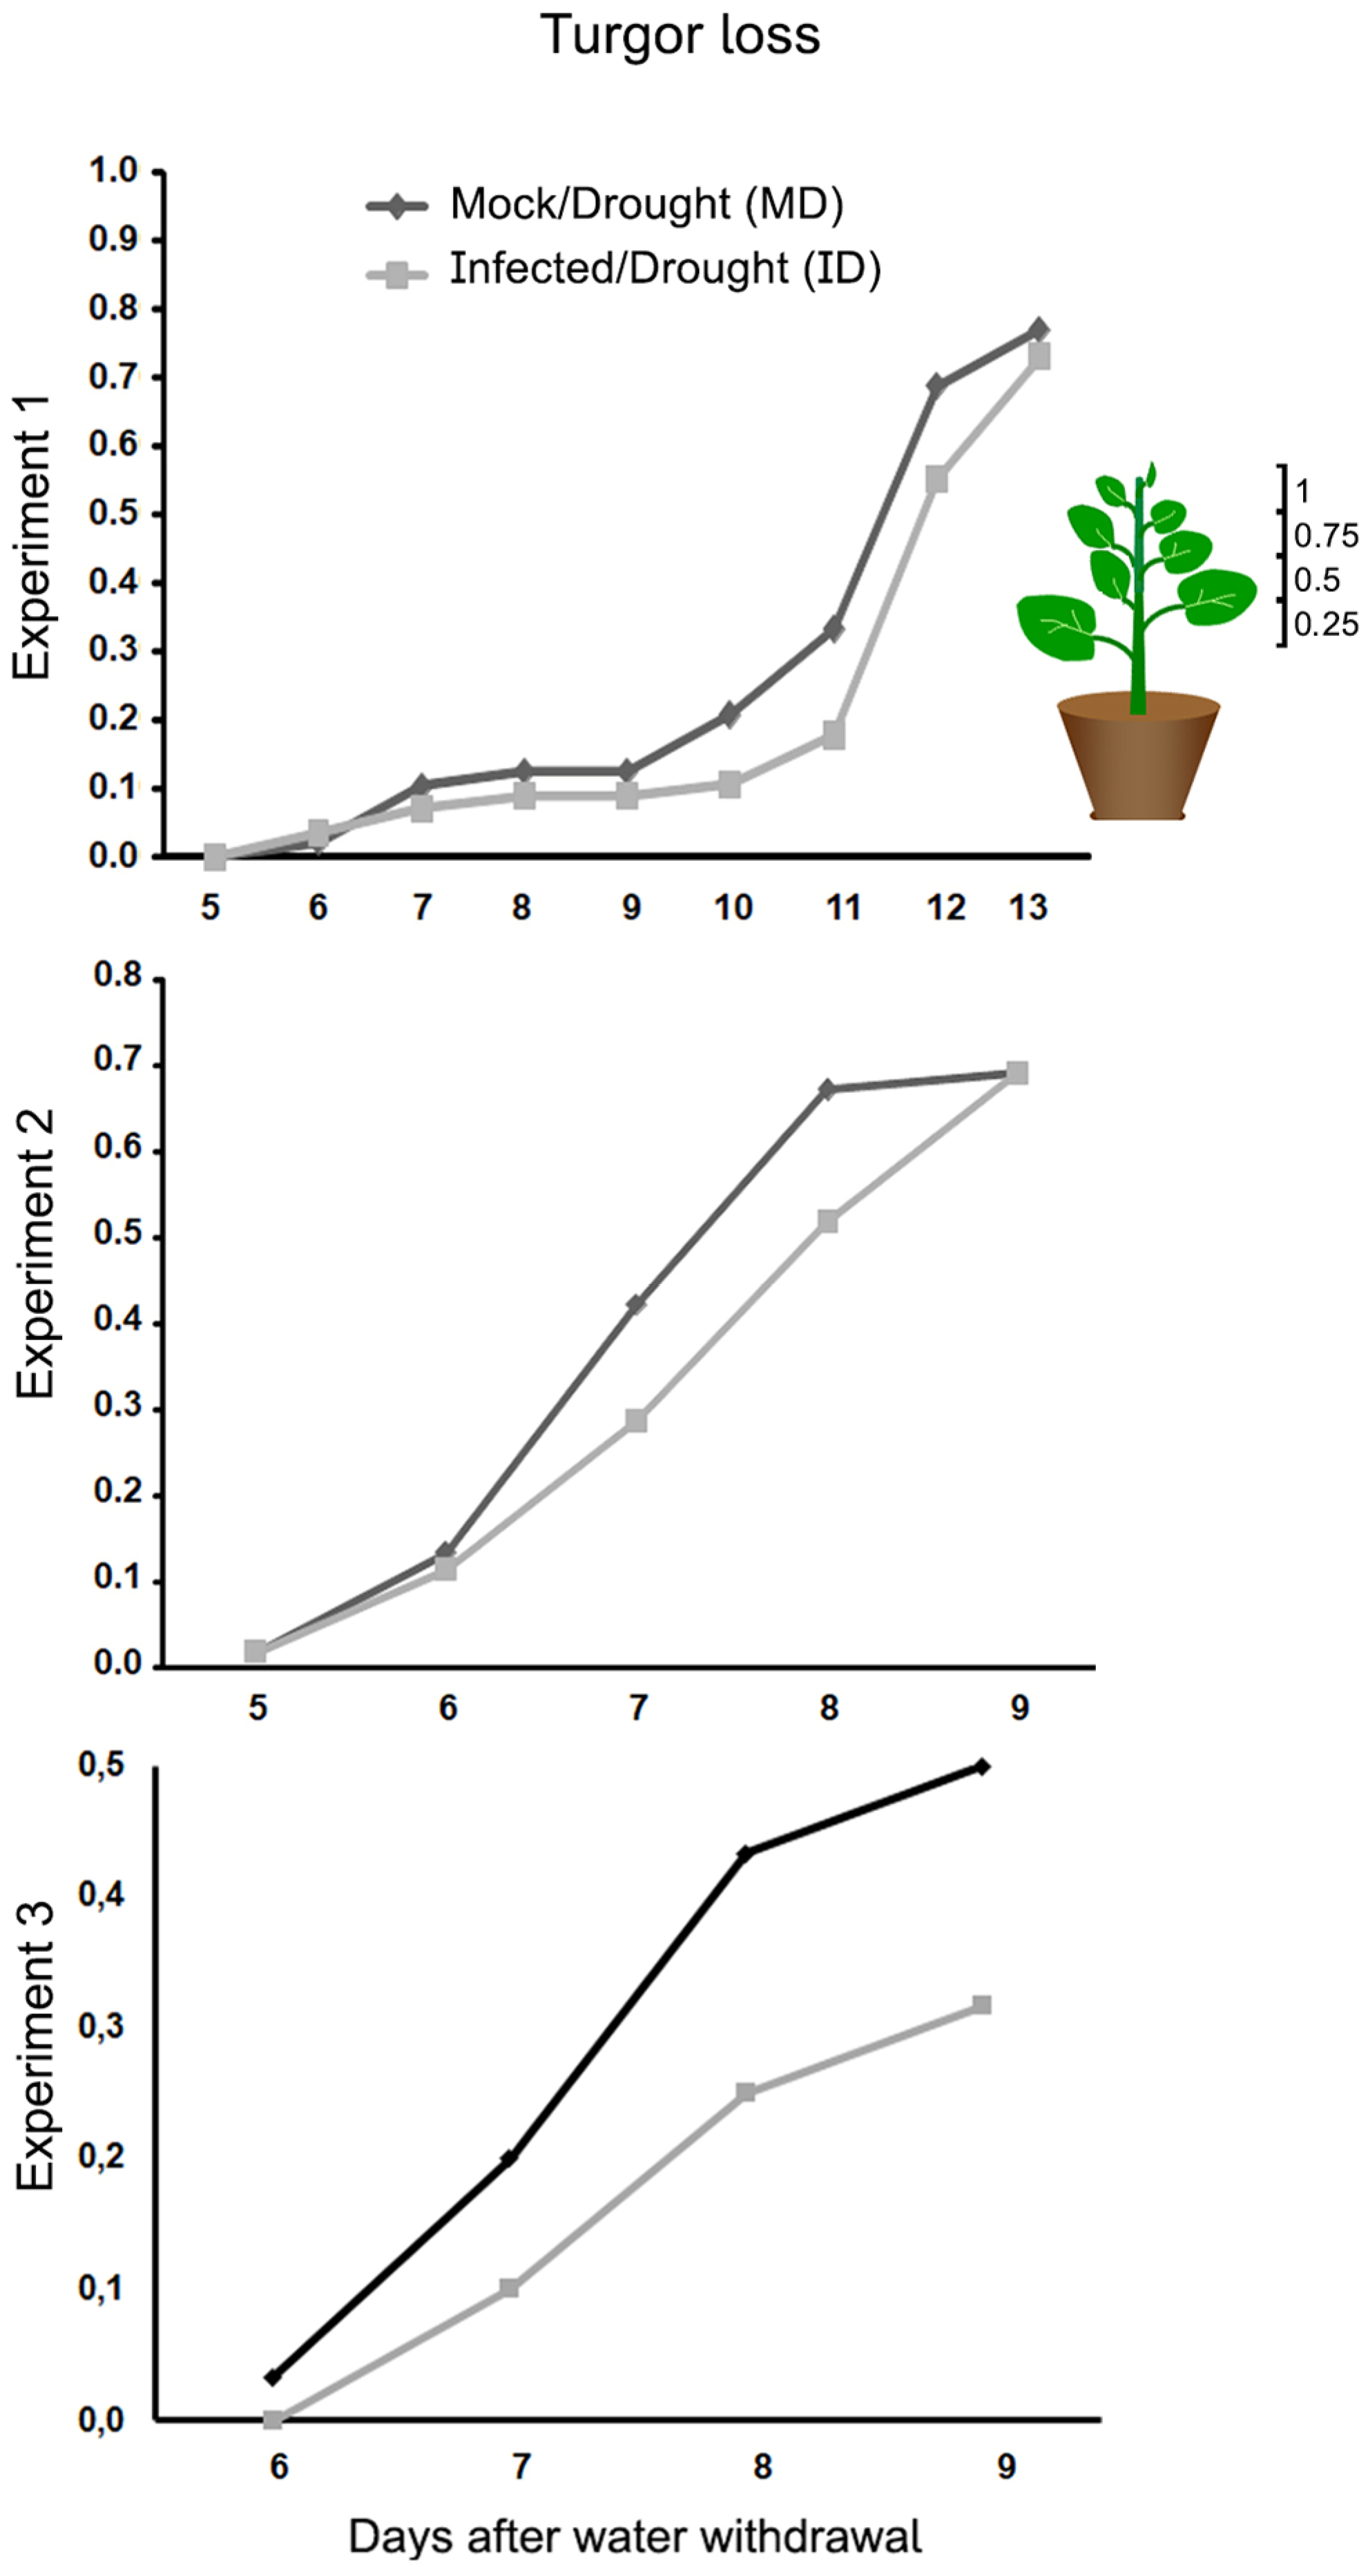
Figure 4.
The effect of a PVY infection on the water content of Nicotiana benthamiana plants grown at 30 °C and 790 ppm ambient CO2. Water content was assessed at the end of three experiments [13, 9, and 9 days after watering withdrawal (daww), respectively]. Water content in plants was significantly affected by drought in the three experiments, but not by infection in experiments 1 and 2. In experiment 3 by contrast, the loss of water content was not significant. MW, mock/watered; IW, infected/watered; MD, mock/drought; ID, infected/drought. Different letters in the charts indicate significant differences at P < 0.05. Post-Hoc, Tukey.
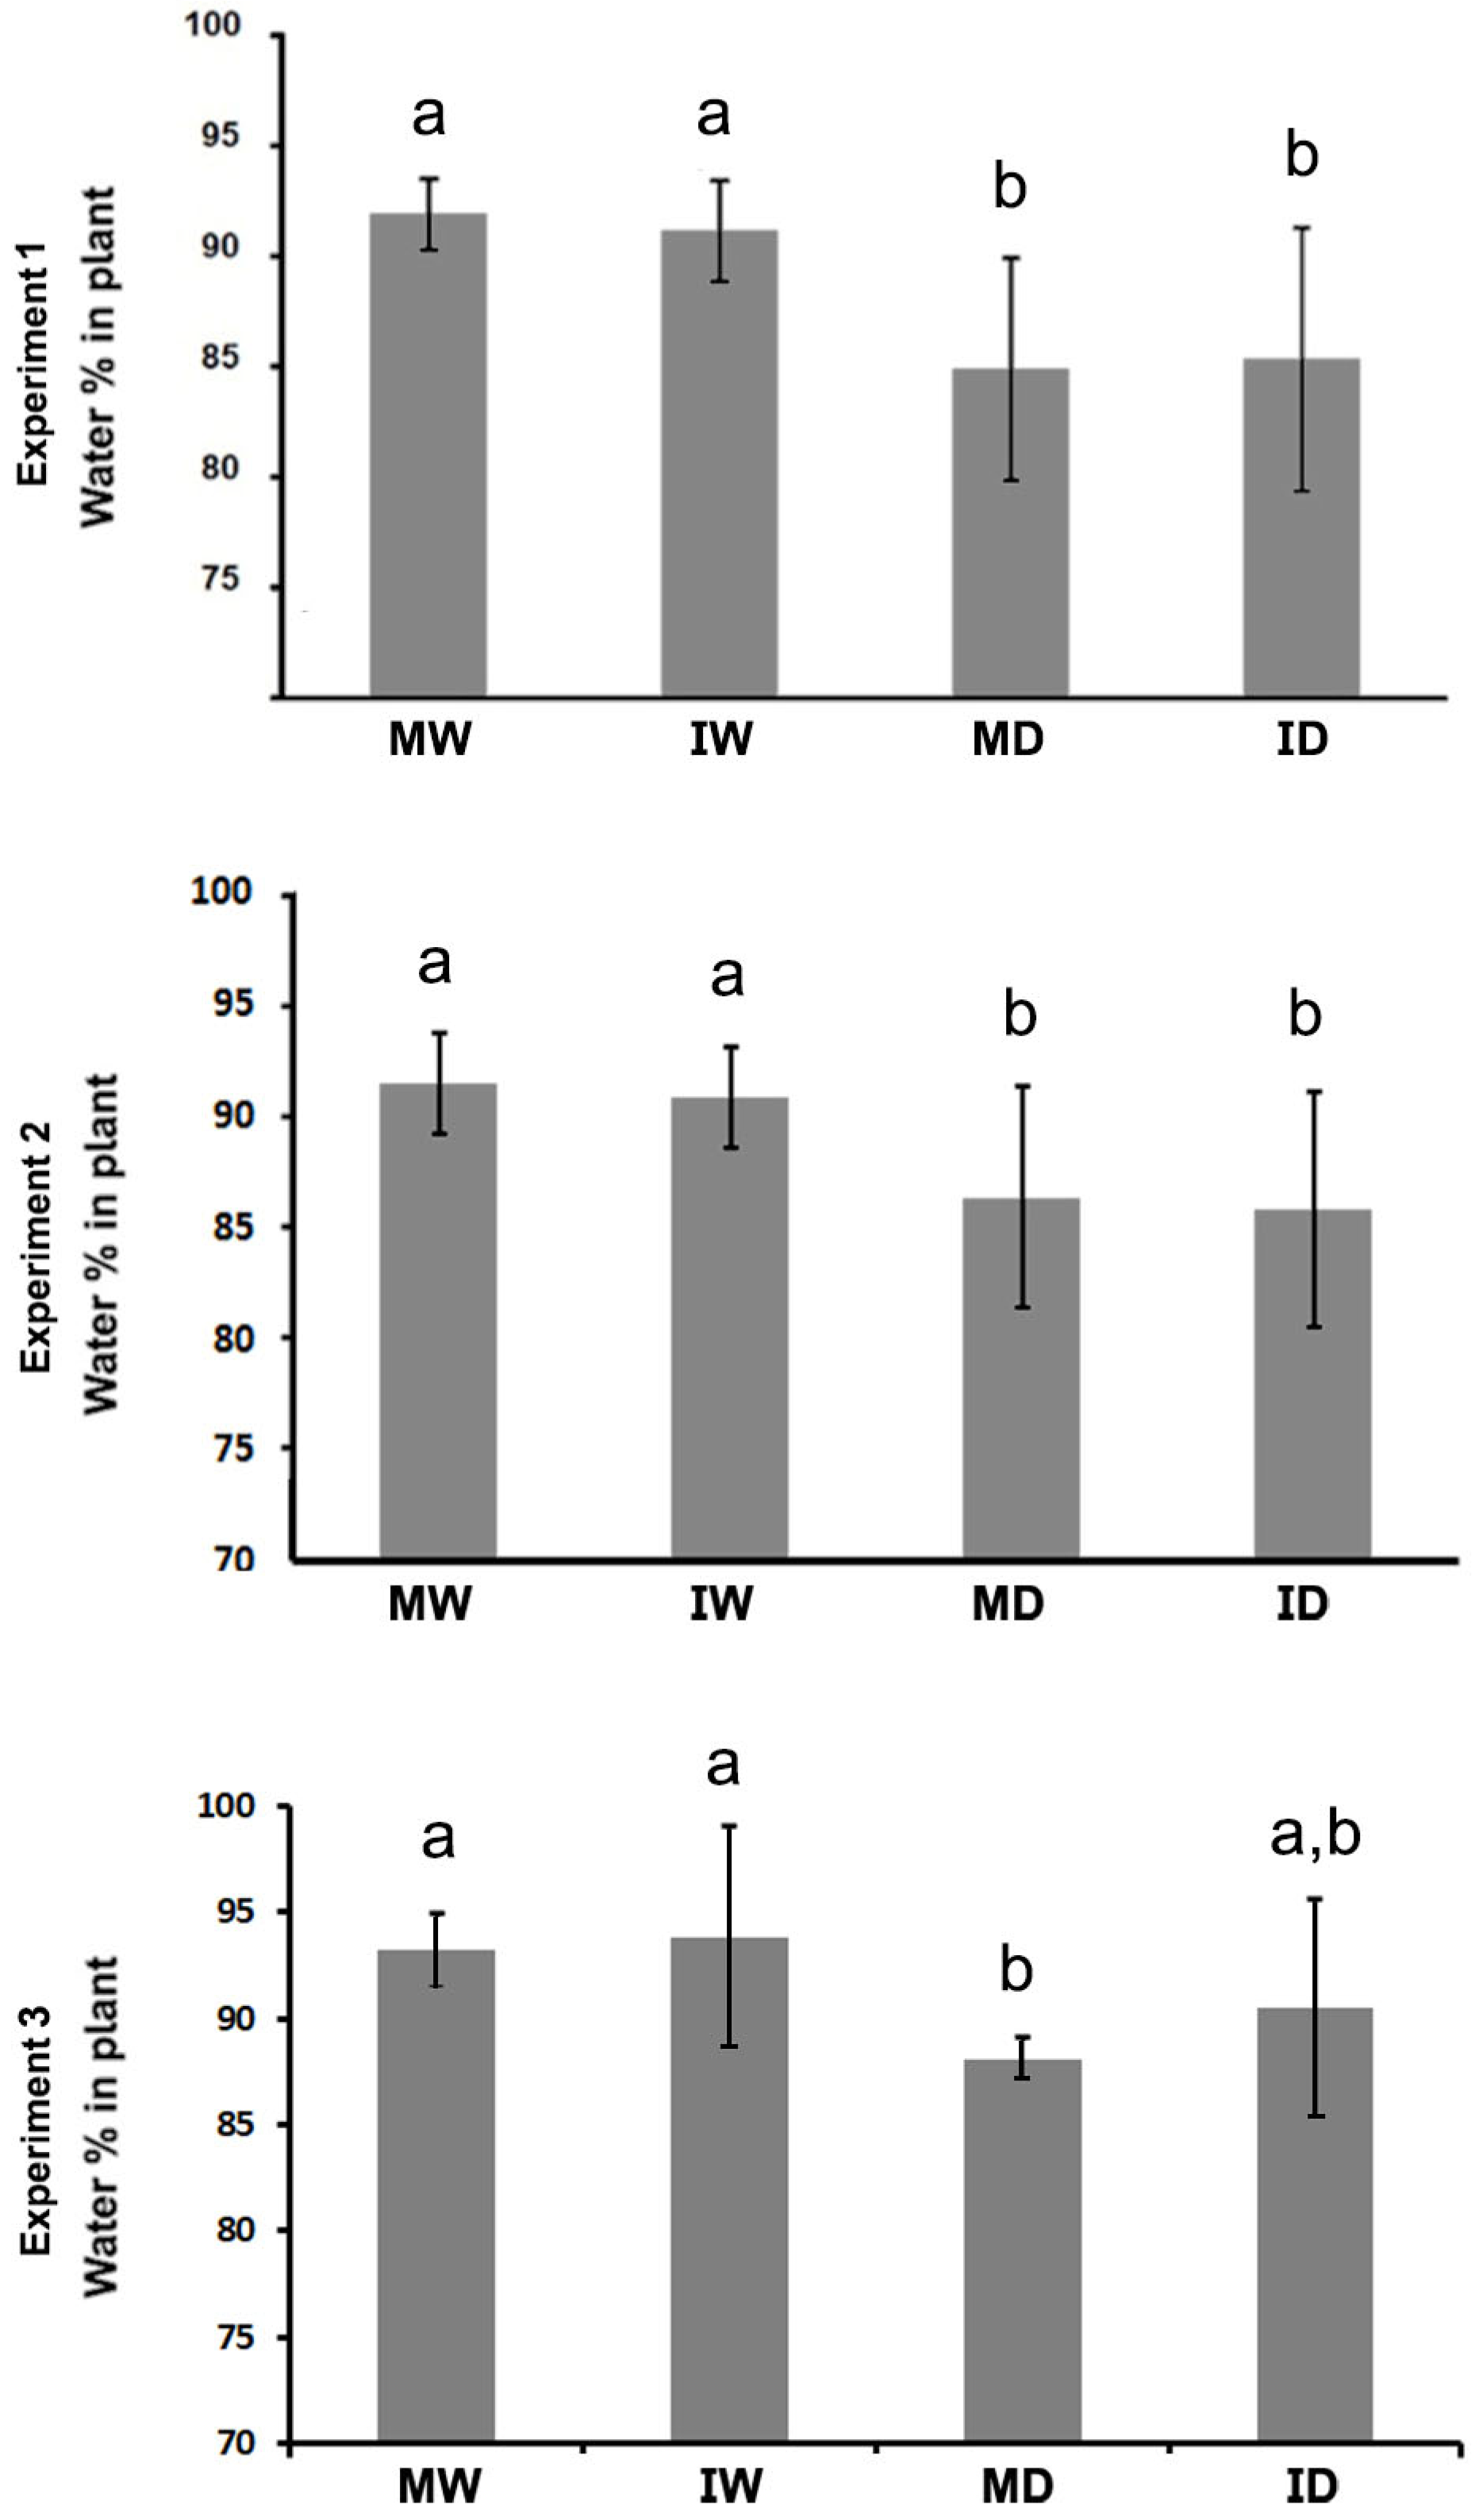
Figure 5.
The effect of a PVY infection and of drought on stomatal conductance in leaves of Nicotiana benthamiana plants grown at 30 °C and 790 ppm ambient CO2. Measures of stomatal conductance in two experiments (upper and lower charts, respectively) were taken at two time points: on day 1 after watering withdrawal (daww), and at the end of experiment (13 and 9 daww, respectively). In both experiments, at the early measurement time (absence of drought) infection reduced significantly stomatal conductance, but this was always the case at the later measurement time. Drought (later measurement time) reduced conductance significantly in all cases. MW, mock/watered; IW, infected/watered; MD, mock/drought; ID, infected/drought. Different letters in the charts indicate significant differences at P < 0.05. Post-Hoc, Tukey. ** in the charts indicate significant differences at P < 0.05. Student t-test.
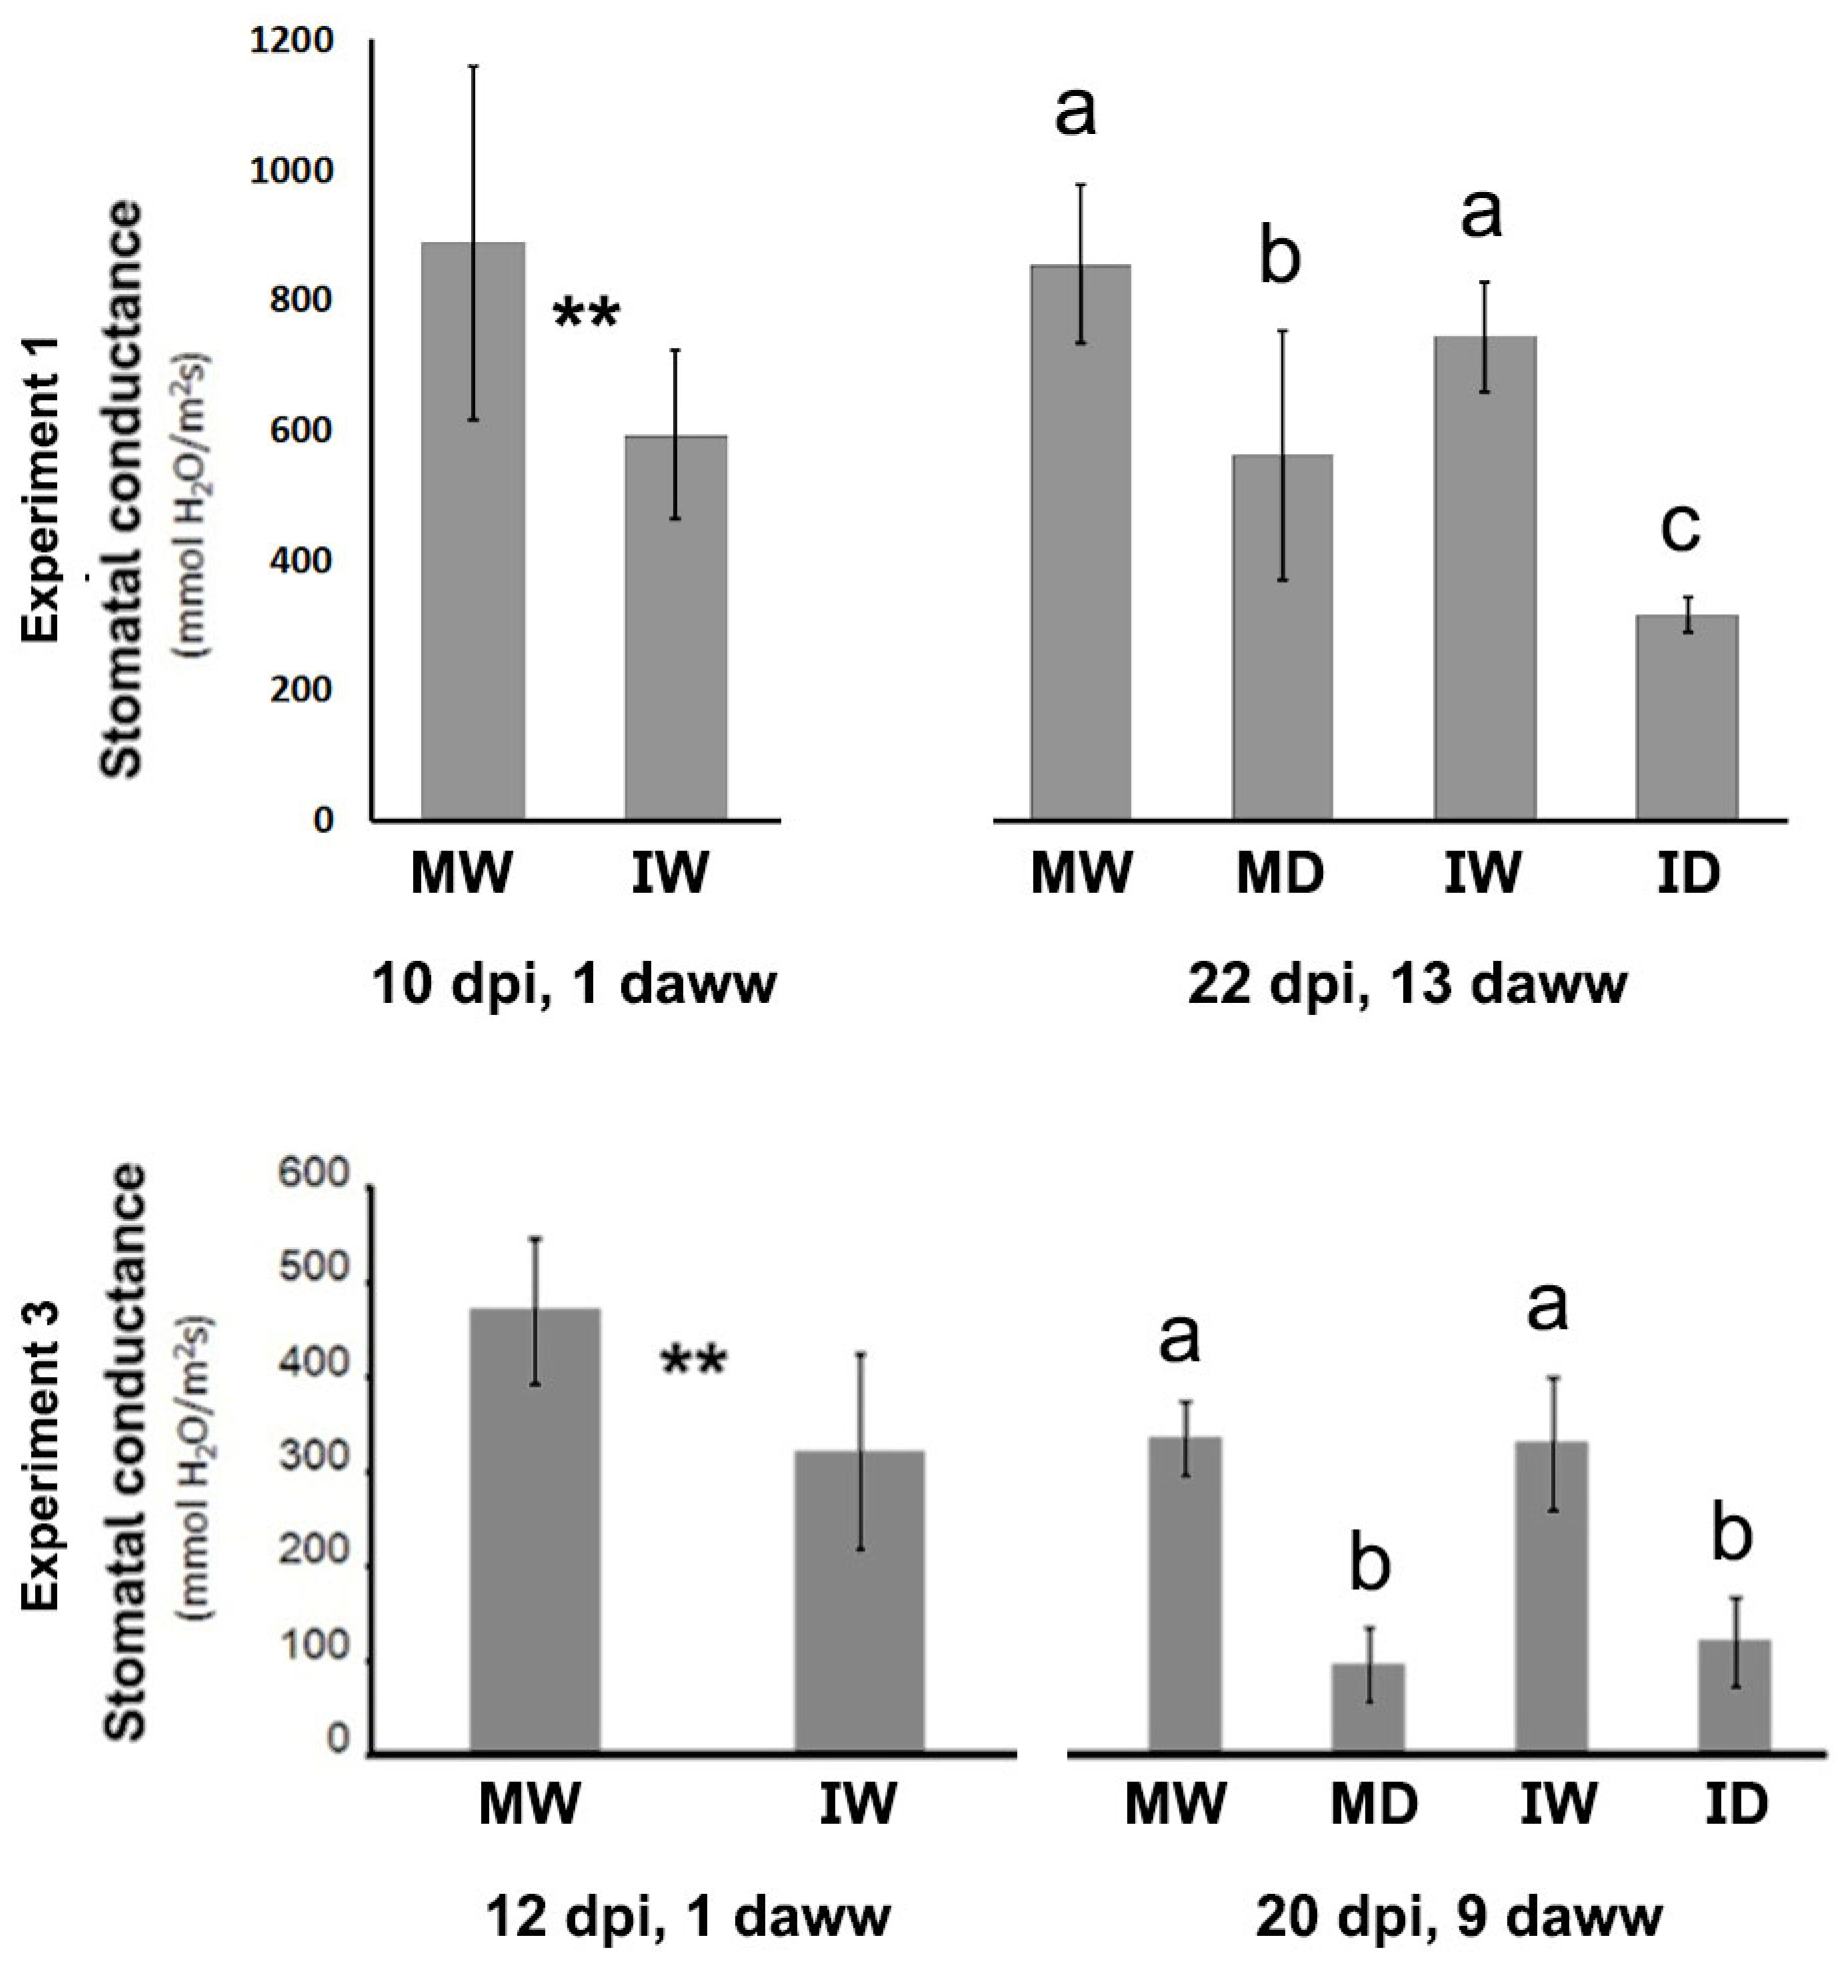
Figure 6.
The effects of PVY infection, of drought, or of both combined, on the metabolome of Nicotiana benthamiana plants grown at 30 °C and 790 ppm ambient CO2. (A), The chart shows changes in the individual levels of 53 compounds present in fresh leaf tissues from plants kept under each of the four separate treatments (MW, mock/watered; MD, IW, infected/watered; mock/drought; ID, infected/drought). Their levels were relativized to those found in the MW plants, with the average values from the eight MW plants given the arbitrary value of 1. (B), The charts detail the accumulation of the sugar fructose (left chart), and of the amino acid proline (right chart) in the four types of plants. Different letters indicate significant differences at P < 0.05. Post Hoc, Tukey.
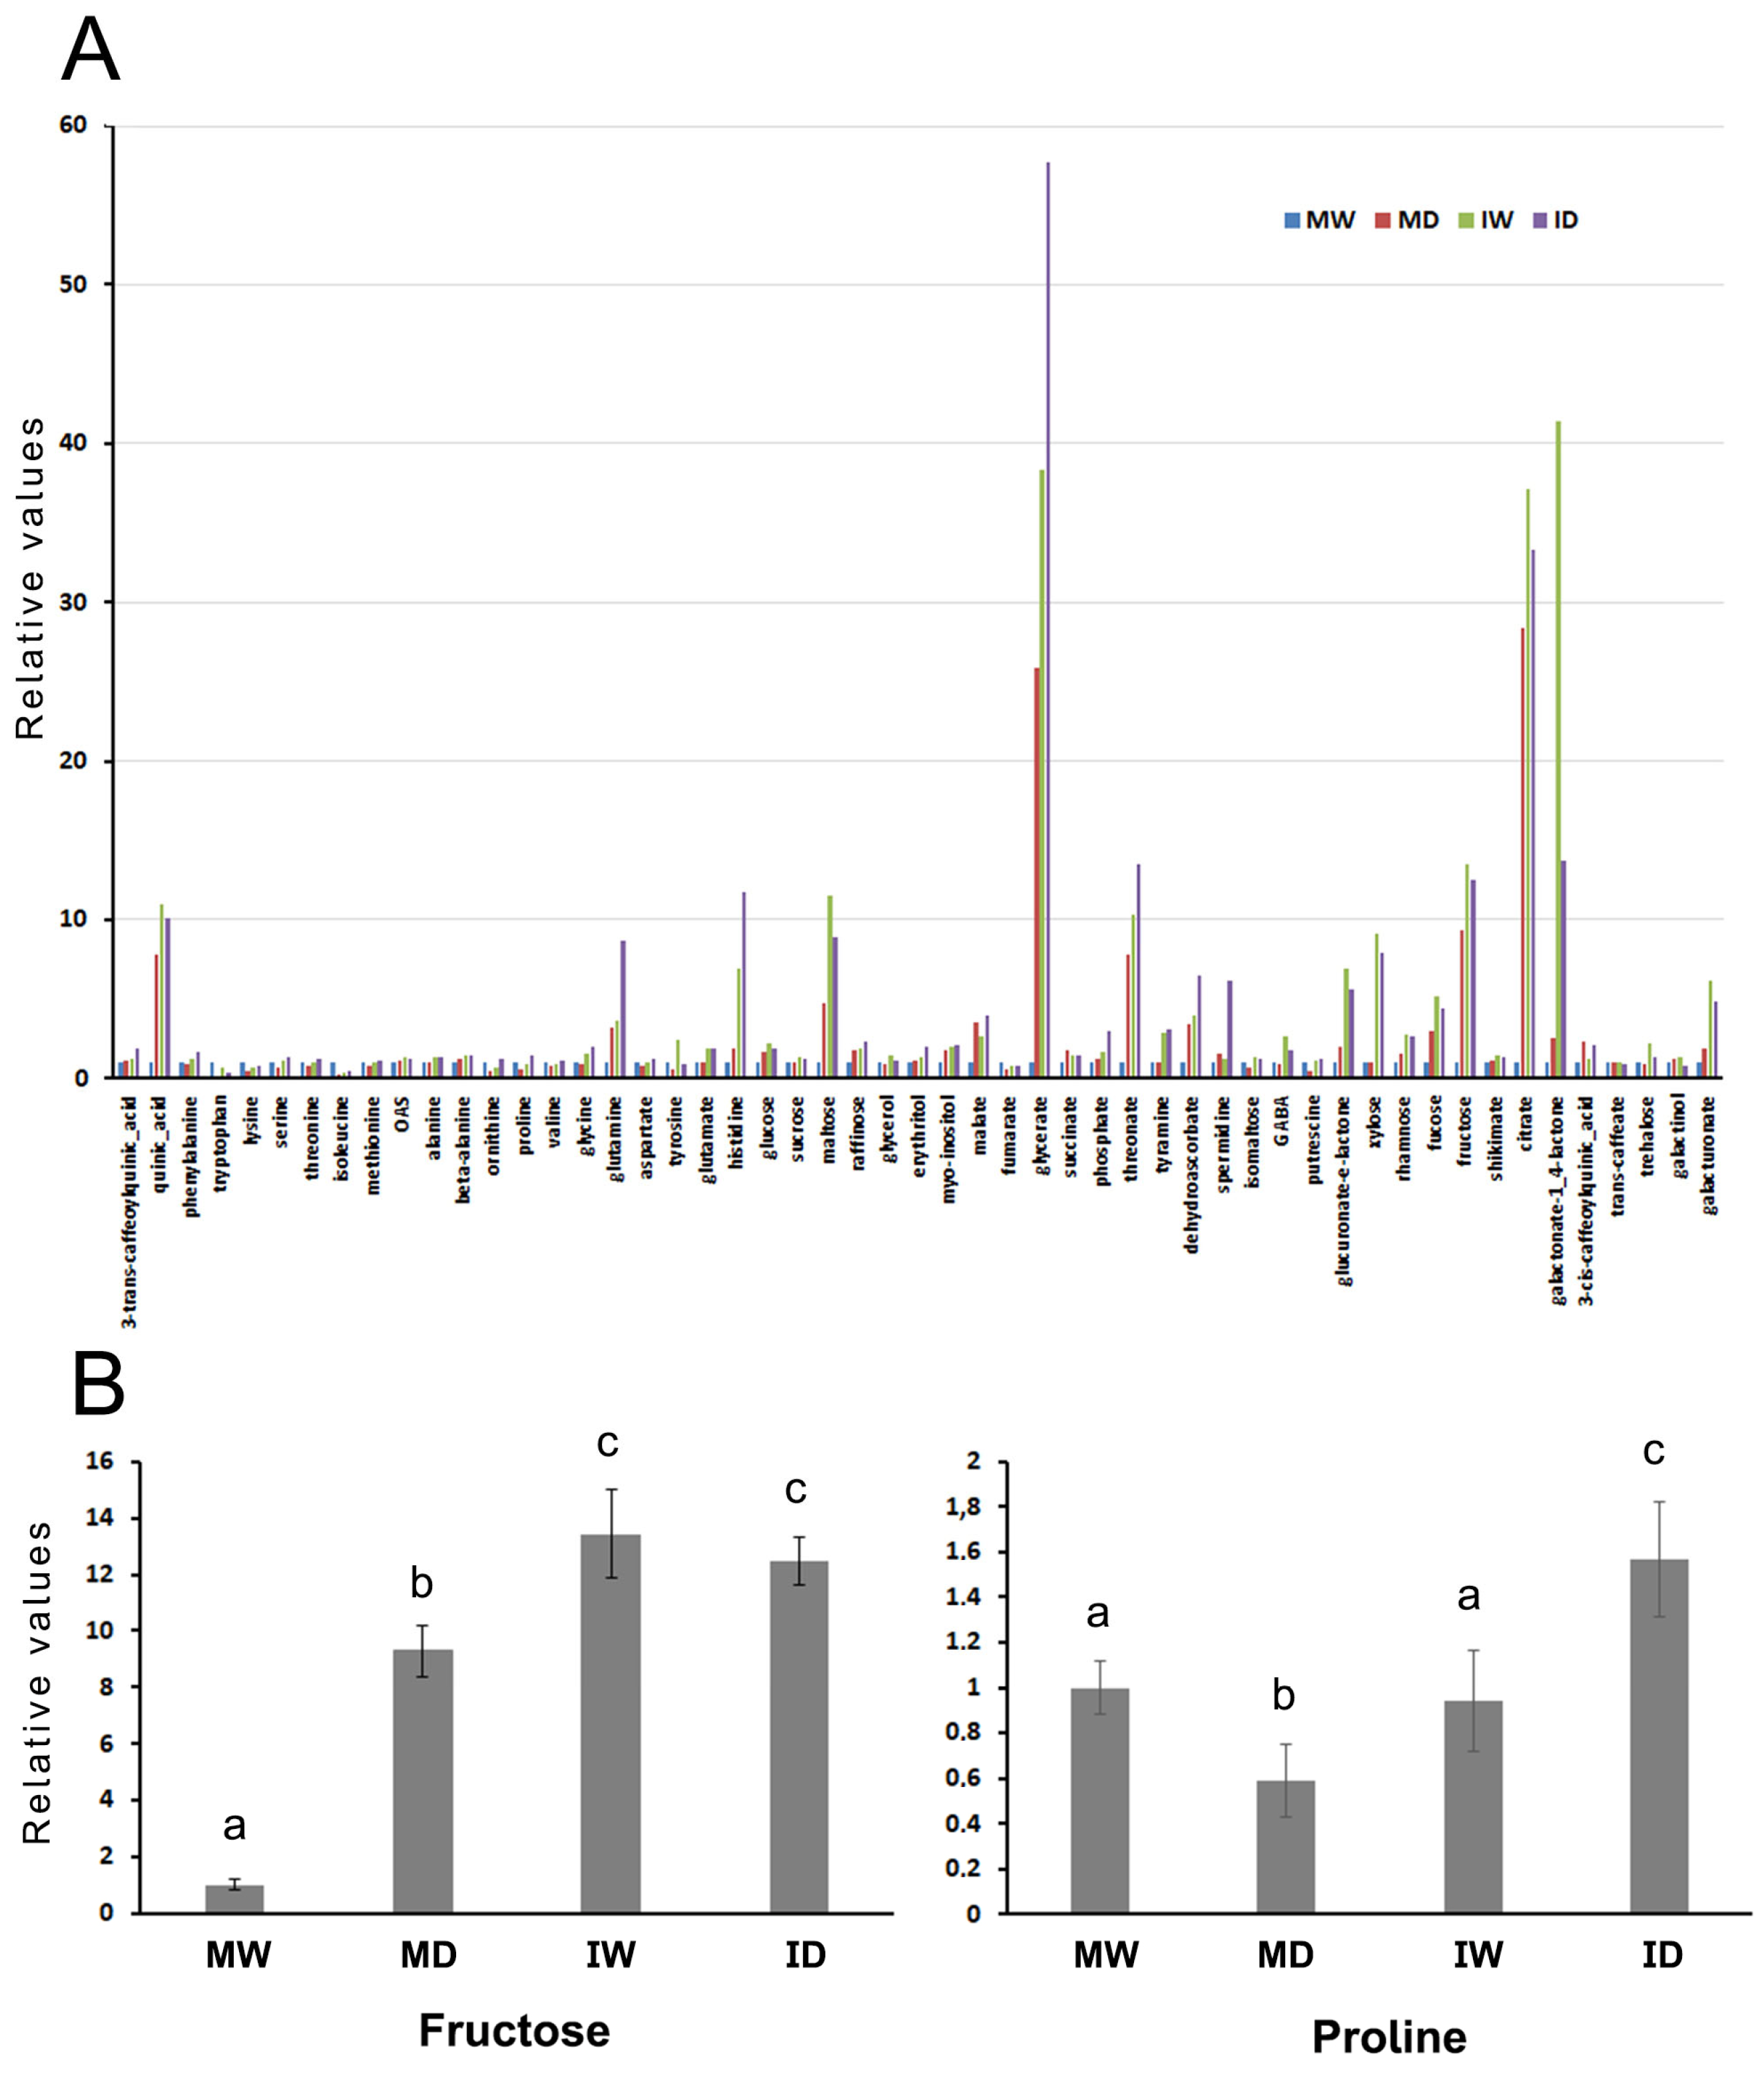
Figure 7.
The effects of PVY infection, of drought, or of both combined, on the metabolome of Nicotiana benthamiana plants grown at 30 °C and 790 ppm ambient CO2. (A), Hierarchical cluster dendrogram of the metabolic data for the four separating treatments combinations (mock/watered, MW; infected/watered, IW; mock/drought, MD; infected/drought, ID) as mean values of 53 compounds. Hierarchical clustering was performed using R package. (B), principal component analysis (PCA) to sort the 53-component metabolome analysis in each of the four types of samples analyzed (MW, in blue; IW, in red; MD, in brown; ID, in green). The two principal components explained 70.25% of the overall variance of metabolite profiles: 51.42% for principal component 1 (PC1) and 18.82% principal component 2 (PC2). Together with PC3 (8.94%) they explain 79.19% of the variance. Each individual biological replicate is represented in the score plots.
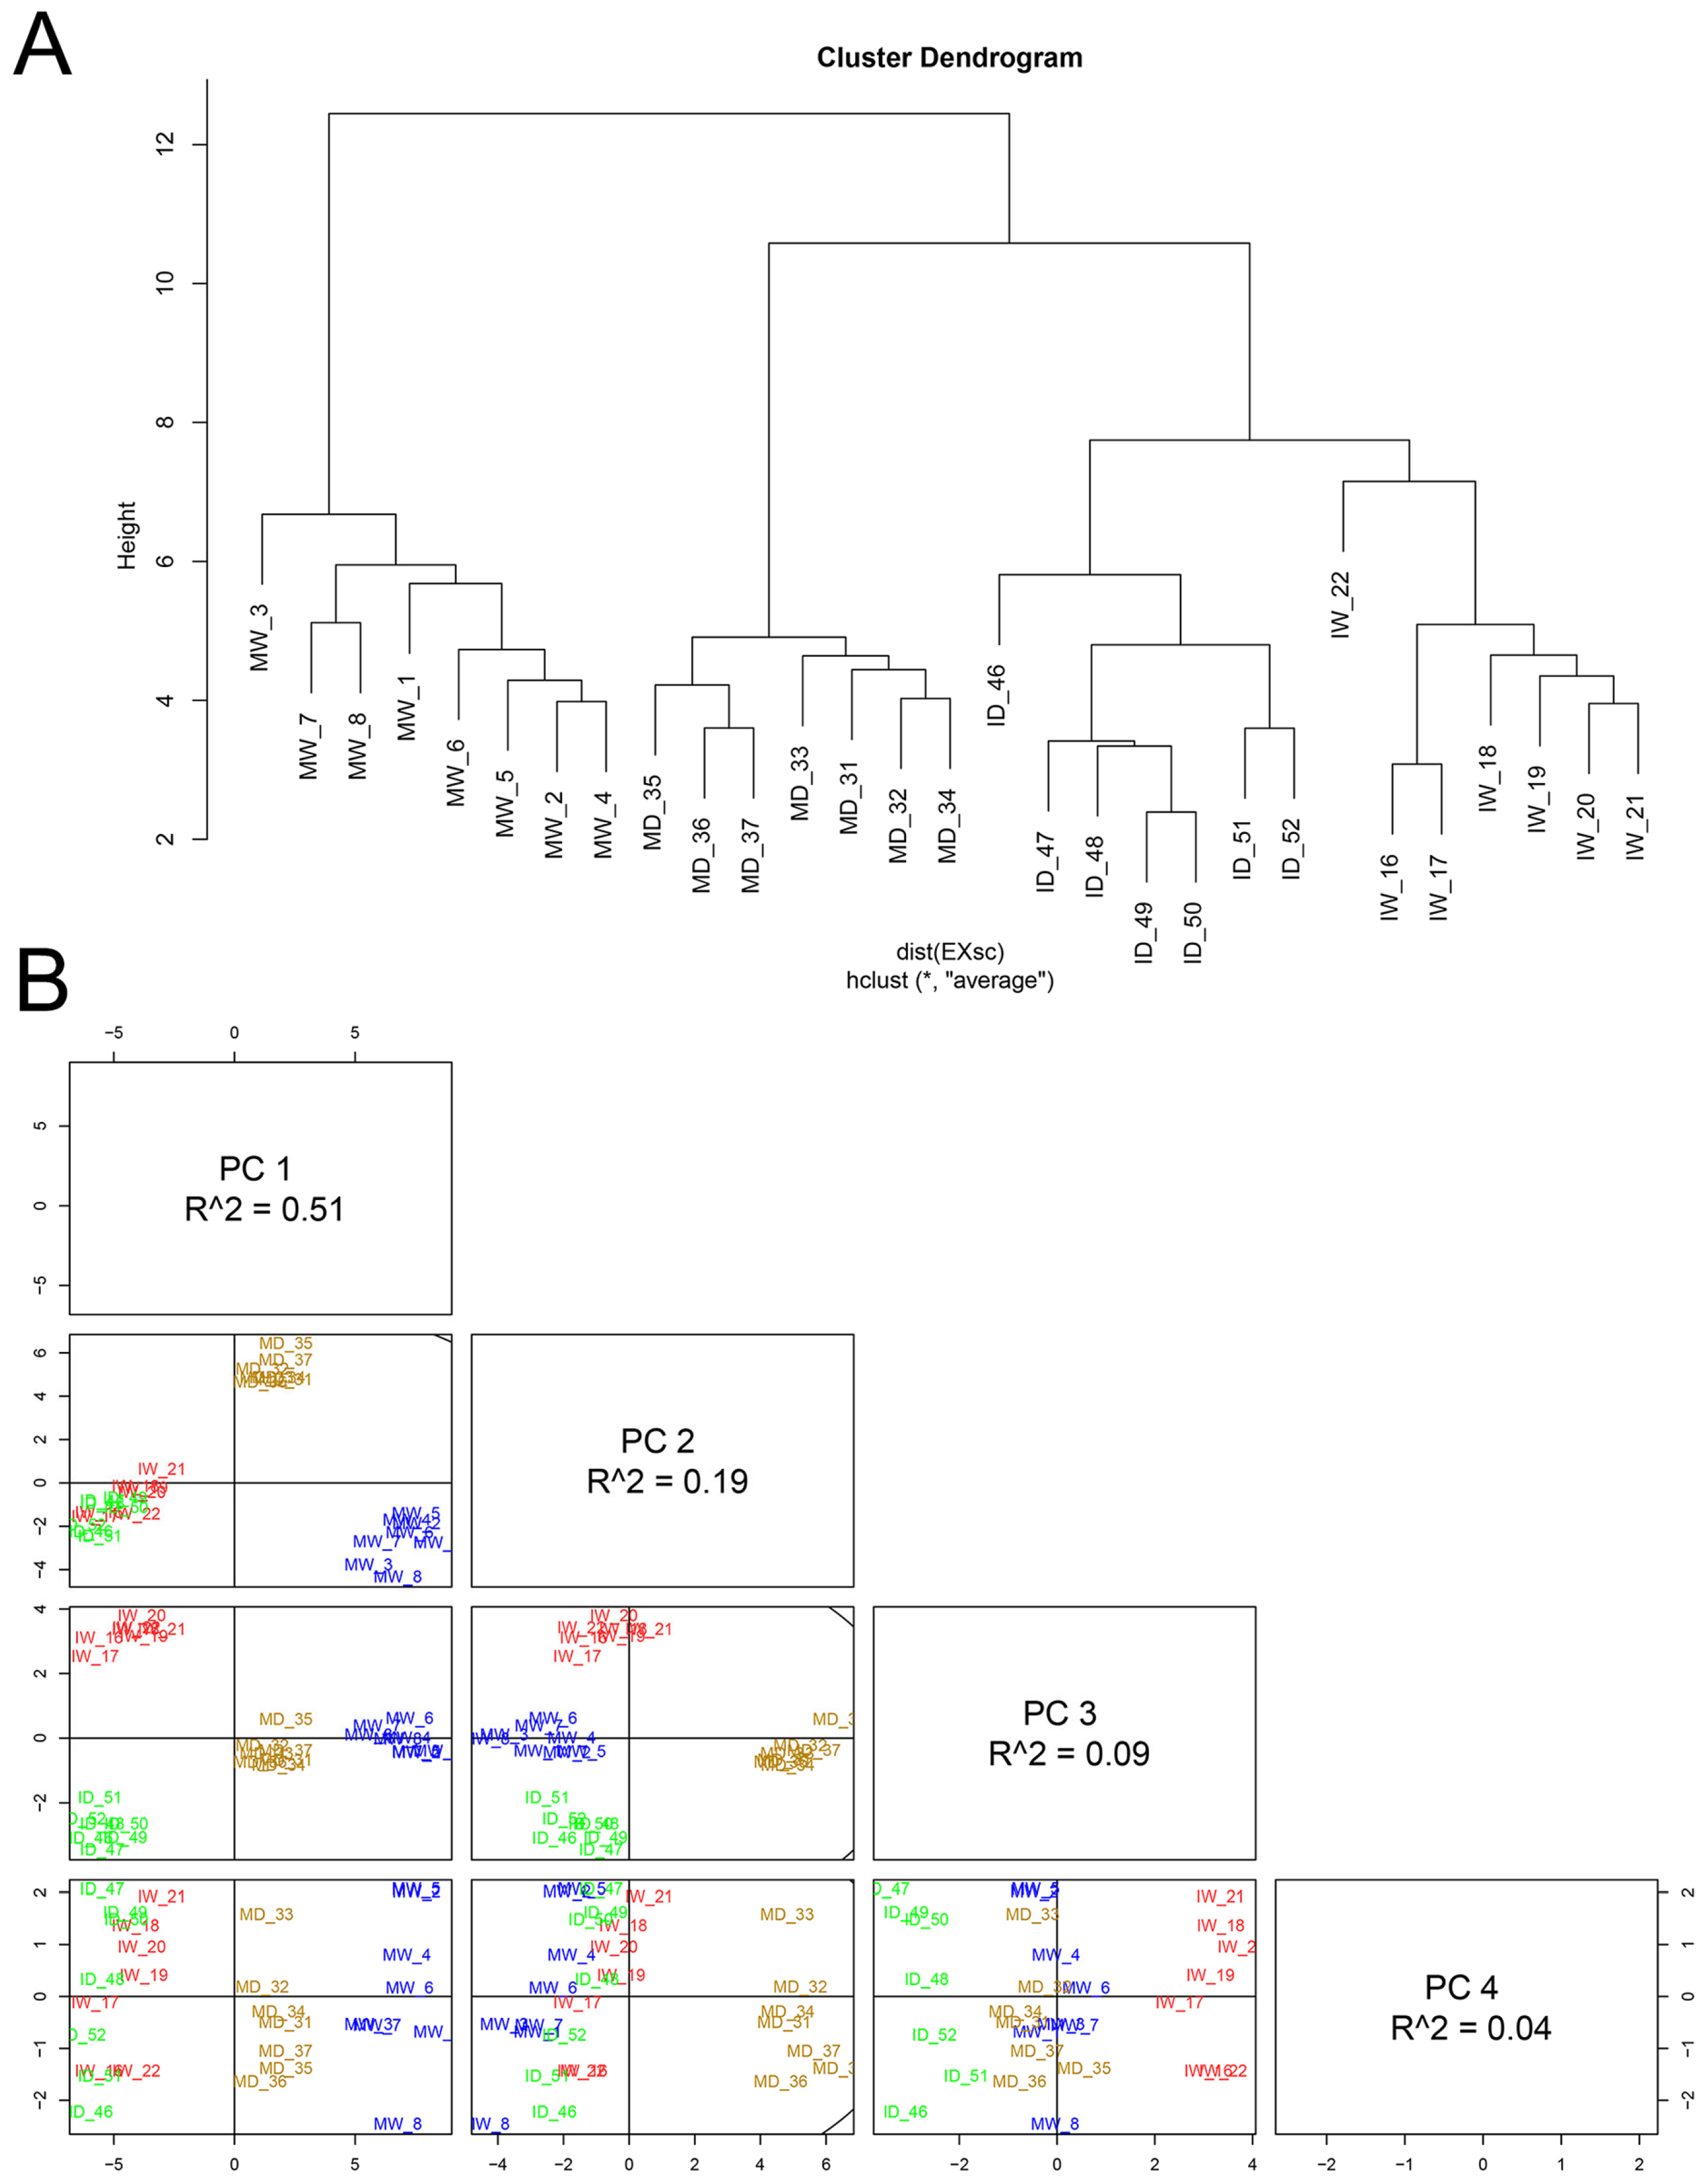
Figure 8.
The effects of PVY infection, of drought, or of both combined, on the hormone levels of Nicotiana benthamiana plants grown at 30 °C and 790 ppm ambient CO2. The levels of three hormones (abscisic acid (ABA), salicylic acid (SA) and jasmonic acid (JA) were quantified in four types of plants: mock/watered, MW; infected/watered, IW; mock/drought, MD; infected/drought, ID. Infected plants were assessed 22 days after inoculation, and those plants subjected to drought had been the last 13 days without watering. Infection significantly increased the levels of the three hormones. Drought only those of ABA. The increase in JA levels caused by infection was differentially higher, and led to two types of hormone profiles (MW and MD vs. IW and ID), defined by the presence/absence of infection. Within the same color, different letters indicate significant differences at P < 0.05. Post Hoc, Tukey.
Disclaimer/Publisher’s Note: The statements, opinions and data contained in all publications are solely those of the individual author(s) and contributor(s) and not of MDPI and/or the editor(s). MDPI and/or the editor(s) disclaim responsibility for any injury to people or property resulting from any ideas, methods, instructions or products referred to in the content. |
© 2024 by the authors. Licensee MDPI, Basel, Switzerland. This article is an open access article distributed under the terms and conditions of the Creative Commons Attribution (CC BY) license (http://creativecommons.org/licenses/by/4.0/).
Copyright: This open access article is published under a Creative Commons CC BY 4.0 license, which permit the free download, distribution, and reuse, provided that the author and preprint are cited in any reuse.


