

Submitted:
15 July 2024
Posted:
16 July 2024
You are already at the latest version
Abstract
The digital world is increasingly invading our reality, which leads to the formation of a significant reflection of the processes and activities taking place in the smart city. Such activities include well-known urban events, celebrations, and those with a very local character. Due to the mass occurrence, events have a comparable influence on the formation of the spirit and the urban atmosphere. This work presents an enhanced semantic version of the ConvTree algorithm - SemConvTree. It allows considering the semantic component of the data obtained by using semi-supervised learning of topic modeling ensemble (consisting of improved models BERTopic, TSB-ARTM, SBert-Zero-Shot). We also present an improved event search algorithm based on both statistical evaluations and semantic analysis of posts. This algorithm allows fine-tuning the mechanism of discovering the required entities with the specified particularity (such as a particular topic). Experimental studies were conducted within the area of New York City. They showed an improvement in the detection of posts devoted to events (about 40% higher f1-score) due to the accurate handling of events of different scales. These results lead in the long term to talk about the potential perspective in creating a semantic platform for the analysis and monitoring of urban events in the future.
Keywords:
Event Detection
; Geo Gridsp
; Natural Language Processing
; Information Retrieval
; Neural Networks
Highlights
The main finding
Enhanced Event Detection Accuracy
The introduction of the SemConvTree model, which integrates improved versions of BERTopic, TSB-ARTM, and SBert-Zero-Shot, enables an enhancement in the detection accuracy of urban events. The model’s ability to incorporate semantic analysis along with statistical evaluations allows it to discern and categorize events from social media data more precisely. This results in approximately a 40% increase in the F1-score for event detection compared to previous methods.
Semantic Analysis for Event Identification The SemConvTree model leverages semi-supervised learning techniques to analyze the semantic content of social media posts. This approach helps to understand the contexts of urban events, improving the identification process. The model not only recognizes the occurrence of events but also categorizes them into groups based on their semantic characteristics, which is crucial for effective urban management and planning.
Implications of the main finding
The increased accuracy in event detection ensures that urban planners and emergency services can respond more effectively to both planned and unplanned urban events. More accurate data leads to better resource allocation, ensuring that services are deployed where they are most needed. This could lead to enhanced safety, improved traffic management, and better crowd control during events, enhancing urban living conditions.
By effectively categorizing urban events based on their semantic characteristics, city administrators can gain insights into the types of events that are prevalent in different areas of the city. This can inform more targeted community engagement strategies, help in the planning of public services and facilities, and ensure that urban policies are closely aligned with the actual dynamics of the city. Additionally, this can aid in long-term urban development strategies by identifying evolving trends and shifts in urban activity patterns.
1. Introduction
Nowadays, social networks are of vital importance to many people. Over half of the world’s population [1] uses social media to express emotions, share their thoughts and support social relationships. Regular users publish information about their daily life, and organizers of mass events broadcast public content via official pages. This trend makes social networks a valuable data source for various tasks dedicated to analyzing urban processes in Smart Cities[2]. Such data allows the creation of recommendation or crime monitoring systems based on detecting multi-scale events. Moreover, previous studies have revealed [3,4] that information about remarkable events, such as hurricanes, earthquakes and floods, appears in social networks faster than in traditional media. Among the diversity of social media, Instagram and Twitter are the most suitable for event detection tasks [5]. Both are highly widespread and continue to increase in popularity [6]. Posts in these sources may contain not only text data, images or videos, but some are also pinned to particular locations and time stamps, simplifying the identification of events. However, data from social media contains a large amount of noise: posts devoted to food, clothes, spam or advertisements do not reflect information about any event and lead to poor results [7].
In the scope of this work, we refer to one of the most basic definitions of event [8] and describe an urban event.
Definition 1.
An event is a significant thing that happens at some specific time and place.
Definition 2.
An urban event is an event that happens in an urban environment.
In order to detect new events, authors of the most advanced solutions usually use historical data and predict the number of new posts for specific locations [9,10,11]. Algorithms based on this scheme recognize candidates if the predicted value is lower than the real one. The main disadvantage of this approach is the need to set a high sensitivity threshold and the impossibility of noise processing. This idea allows for obtaining admissible results for detecting events presented by many posts (e.g. stadium soccer games, large concerts). However, such methods frequently need to be more sensible to cover less popular events and are represented by only a few posts. In order to distinguish such events, we introduce two following definitions:
Definition 3.
A high-scale event is an event which is represented in data by more than three posts.
Definition 4.
A low-scale event is an event which is not a high-scale event.
However, semantic analysis of content might help to solve not only the challenging task of multi-scale events detection but also to filter posts that contain noise and complicate events detection in general.
In this work, we set a goal to focus on low-scale event detection. Adding such events to the consideration of high-scale ones not only makes it possible to detect urban events online precisely but also allows us to make a live map of the city changing in real-time, to study various processes of the city related to leisure, work and recreation of citizens due to more significant number of detected events.
We emphasize that low-scale events could reflect personal aspects of citizens’ lives, although analyzed sources are publicly available. Thus the extracted knowledge should be treated carefully. Nevertheless, analyzing the distribution of such events in the city can help provide the necessary infrastructure for where such events are held. For example, an event detection approach could find which parks are regularly used for wedding photosets. Then it makes sense to build special constructions or to fence off dangerous areas in this park. Similarly, the proposed algorithm would help handle such low-scale events as car accidents. Extracting this knowledge might lead to traffic stream reorganizing and could have a strong positive social impact.
Our urban event detection approach is based on anomaly detection (i.e. abnormal number of posts detection concerning historical data). To achieve this goal, we have designed and implemented an early event detection software package consisting of several components:
- data collectors;
- semantics extraction and ranking module;
- the adaptive mesh generation module;
- anomaly detection module;
- anomaly filtering and event linking module.
Our main contribution is developing an algorithm capable of detecting urban events of different scales that opens up the scope for investigating urban processes in dynamics at a granular level. The algorithm has significantly increased the number of detectable events (from tens to hundreds of events per day for New York City) compared to other event detection approaches.
2. Related Works
Social networks have become an essential part of our daily lives, documenting people’s movements, experiences, and emotions, including information about events in which they are involved. Research has shown that real-life events, including personal ones, leave their mark on social media [12,13]. It happens through the direct mentioning of the event or changes in patterns of users’ behavior on social media. Popular social networks worldwide, such as Twitter and Instagram [5,6,14,15], enable users to share geo-tagged posts with text and pictures. Such posts are highly valuable as they can provide significant insights into high- and low-scale events in their life. The online nature of social networks has allowed researchers to identify and track many real-life events, from high-scale events like natural disasters such as hurricanes and floods [16,17], to lower-scale events like traffic accidents and protests [10,18,19].
Event detection through social media data analysis has been the focus of numerous research papers [14,20,21,22,23,24]. One of the popular techniques in the field is to use is anomaly detection techniques to identify unusual or unexpected patterns of behavior that deviate from the normal. In the context of social networks, anomalies can be caused by a variety of factors, such as sudden changes in user behavior, and the emergence of new topics or trends. The basic idea behind anomaly detection for event detection in social networks is to monitor network activity and identify patterns that differ significantly from the norm.
2.1. Frequency-Based Methods
In the early days of research, various frequency-based techniques were often used to detect anomalies or novelties in data streams [25,26,27,28]. Many authors were interested in using clustering or classification of words to identify new events by the usage of an abnormal lexicon [29]. Various algorithms were used to find anomalous increases in word usage, such as TF-IDF [30,31,32], N-grams [33,34], and wavelet analysis [35]. In [30] the authors used TF-IDF and Hidden Markov mode to find and choose keywords from posts and then graph structure to identify connected components which were considered events. In this paper they only used keywords, ignoring the spatio-temporal nature of events. The study [36] proposed searching for clusters of data in both time and space as they expect users to post more than usual to describe the event. However, they did not consider the content of individual tweets.
Most authors combined the usage of text features with spatial and temporal features [14,31,37,38]. In [37] researchers used a sliding window and tracked shifts in IDF value against the average value to identify events using temporal information to define a window size. The authors in [31] employed a TF-IDF technique to compare a new post to all previous posts in the collection. Several papers used the idea of ‘bursts of activity’, in [39] Kleinberg proposed an algorithm based on a statistical framework that models the stream using an infinite-state automaton based on hidden Markov models, the article had a significant impact on the field of event detection inspiring several subsequent research papers [38,40,41,42,43]. The research [44] Zhou et. al. used spatial features by employing joint distribution of keywords, named entities, and locations to identify events.
In [45] authors presented a method, which utilized both spatial and temporal features of data to model a normal state of the target area and movement patterns, they would identify events as deviations from the normal behaviors. However, this method does not filter the noise in social media, this problem would be addressed in [11], where authors utilize the idea of the normal state of the city but propose a more effective algorithm for splitting the area using adaptive geogrids. This approach and considering users’ behavior seasonality allowed authors to obtain a high detection accuracy and outperform other methods. Several other articles use a historical grid [46,47] to increase anomaly detection accuracy. Users can adjust a map for the necessary scale, control the timeline, and obtain results with high space and time domain granularity by interacting with such systems. Moreover, this approach allows ranking, which aims to search for burst events given particular time and space limitations.
2.2. Modern Techniques
2.2.1. Modern NLP
Extracting semantic information from social media data is an important component of event detection research. By analyzing the meaning and context of words and phrases in social media posts, event detection models can gain a better understanding of the content and accurately identify events. Therefore, in this section, we will focus on various NLP methods used for analyzing social media posts and detecting events.
One commonly used approach in NLP is word embeddings [15,48]. Word embeddings are vector representations of words in a high-dimensional space, where words with similar meanings are located close to each other in this space, which helps to capture the semantic relationships between them. There has been a lot of research on word embeddings in recent years [49,50,51]. In 2013, Mikolov et al. [49] introduced the Word2Vec algorithm, which uses a neural network to learn word embeddings from large text corpora. Word2Vec has been widely used and has become a baseline for many NLP tasks and was used in [52] for event detection. Another work [53] presented an approach, Embed2Detect, based on word embeddings and hierarchical agglomerative clustering.
One of the most well-known approaches, GeoBurst+ [9], which is an improvement over GeoBurst [7], performs keyword embedding to capture the subtle semantics of tweet messages. Those systems enable practical and real-time event detection from geo-tagged tweet streams. They use keyword clustering of tweets, followed by the classification of clusters by topics and spatio-temporal coordinates.
Recently transformer-based models, such as BERT, RoBERTa, and SBERT [54,55,56], have achieved state-of-the-art performance on various NLP tasks, including event detection in social media posts. These models can learn to represent words and phrases in the context of the surrounding text, capturing complex semantic relationships between words and phrases, which makes them useful for identifying events and their related information. BERT (Bidirectional Encoder Representations from Transformers) is a popular and effective approach. In recent years, there have been several studies demonstrating the effectiveness of BERT for event detection in social media posts. For instance, authors of [57] applied it together with Recurrent Neural Networks to detect Chinese events, while in [19] authors used BERT together with CNN to detect traffic events using data from Twitter. The authors of [58] proposed to use BERT together with an attention-based bidirectional long short-term memory mode (BERT-Att-BiLSTM) for detecting emergency-related posts.
Some contemporary methods utilize dependency graphs [59], which depict the grammatical structure of a sentence as a directed graph, with words represented as nodes and edges denoting grammatical relationships. In works [60] and [61] researchers approached event detection by building a dependency graph for each sentence and utilizing Graph Convolution Networks (GCNs) [62] to extract events. The model [63] MOGANED employs Graph Attention Networks [64] to derive multi-order word representations, resulting in high precision and f1 scores. In [65] authors suggested an improvement over previous homogeneous models using Graph Transformer Networks (GTN) which is able to produce a heterogeneous graph, whose output is then classified by multi-layer perceptron with attention. This approach demonstrates an improvement in the f1 score over homogeneous graph models approaching SOTA performance. However, all those models only use textual features of the data to search for events.
In spite of the fact, that large language models (LLMs) dominate in overall NLP benchmarks, using LLMs in the context of this study might be impractical for several reasons [66]. Firstly, LLMs require significant computational resources and storage, which may not be feasible for urban analytics applications and our case special (smaller research projects with no direct economic effect). Secondly, LLMs often necessitate extensive work on fine-tuning or preparing training datasets, especially in applicability to the specific nuances of urban event detection case. Additionally, LLMs can sometimes produce results that are difficult to interpret or to be controlled due to their black-box nature, which poses challenges for accountability in urban data analytics. Moreover, the high costs associated with deploying and maintaining LLMs can be prohibitive, especially for smaller research projects or municipal budgets.
2.2.2. Multimodal Approaches
Event detection approaches for social networks mainly focus on textual information, while multimedia items from social media often contain linked metadata, also features like images, videos, and audio. Some additional features can be derived from texts too, such as emoji, errors, length, and tone. Taking into account all of these features could significantly improve event extraction from social network data. However, the resulting features are normally heterogeneous which makes them challenging to combine for analysis. To cluster such multimedia data, there are two primary methods: early fusion, where features are combined before processing, and late fusion, where each modality is processed separately and then combined [67].
In a recent paper [68], the authors introduced a new technique called Multi-View Graph Attention Network (MVGAN) to detect events in social networks. This approach enhances the understanding of events by aggregating neighboring nodes and fusing multiple views in a social event graph. The authors first build a heterogeneous graph by incorporating hashtags, then, use graph convolutional networks to learn event-specific representations from different perspectives, such as text semantics and time distribution. In the study [69], the authors employed a late fusion approach to combine visual and scenic image features with textual metadata to identify flooding in Flickr Images. They then utilized the Direct Backpropagation method to train a neural network for classification purposes.
Another research [70], predicted if two objects are from the same event by utilizing multimodal representation vectors derived from pictures metadata and computing distances between them. This method was then used in [71] to construct a multimodal graph-based method for event detection. The authors compared images to construct a graph, where edges indicate that two images belong to the same event, and then used graph-based clustering to identify events. The authors of [72] introduced a new method called Dual Recurrent Multimodal Model (DRMM) to enable effective feature aggregation of images and sentences. DRMM utilizes pre-trained BERT and ResNet models to encode sentences and images, respectively, and employs alternating dual attention for feature selection.
Other researchers report using the fusion of such features as time, scene, and objects [73], geotags, photos, and text [74], and text and image metadata of photos [75] for event detection in social media data.
The sentiment is another useful feature for event detection. Analyzing the emotional tone of social media posts to infer the sentiment of individuals toward a specific event or topic. The general idea is that during a significant event, people may express strong emotions on social media, and these sentiments can be used to detect and track the event. For instance, authors of [17] employed sentiment for training the Support Vector Machines to identify and extract disaster-related posts from Twitter. Other linguistic features for training include raw and lexical textual data, syntactic features, lexical expansion features, and sentiment. In [16], the authors employed sentiment analysis, among other methods, to identify and locate natural disasters like floods, bushfires, and earthquakes using social media data. In another study, [76], the authors utilized sentiment detection techniques in combination with the FastText model and Bi-LSTM for traffic event detection and condition analysis, which led to high-accuracy results.
2.2.3. Filtering Noise
To accurately identify events from social media posts, it is essential to distinguish between relevant posts and those that are unrelated noise. Therefore, in addition to analyzing the raw text descriptions using embedding techniques, we also applied topic modeling methods to classify the posts. Topic modeling can help to identify the underlying topics discussed in a set of posts, which can then be used to filter out irrelevant posts that are not related to the event of interest. By using topic modeling in conjunction with embedding analysis, we can improve the accuracy of event detection by reducing the amount of noise in the data.
Latent Dirichlet Allocation (LDA) is a popular topic modeling algorithm that can be used to identify the latent topics discussed in a set of posts [77]. LDA assumes that each post is a mixture of several topics, and each topic is characterized by a probability distribution over the words in the posts. By learning these probability distributions, LDA can identify the most probable topics discussed in the posts. It was shown that applying LDA to an event detection problem results in promising results. For example, Sokolova M. et al. [78] successfully used LDA to detect social events in Kenya.
Some researchers use graph-based approaches for topic detection research. Graph models are used to represent the frequency of word co-occurrence in documents, which can then be partitioned into multiple communities. Each community represents a distinct topic, and the documents within the corpus can be assigned to the topic to which they are most closely related. For instance, Zhang et al. [79] combined a word co-occurrence graph with a semantic information graph established using LDA. The method in [80] creates a keyword graph from social media data and detects local events in the graph using a geographic dictionary.
In this work, we apply a more recent topic modeling approach called BigARTM [81], which is based on Additive Regularization of Topic Models (ARTM) [82]. BigARTM is a flexible and scalable approach that allows a combination of post descriptions and other types of content, such as spatial and temporal coordinates. This idea uses similar principles as multimodal embedding from the TrioVecEvent framework [83]. We also applied the BERTopic [84] technique, which uses the SBERT framework to perform the embedding of texts, then performs HDBSCAN clustering of embeddings and a class-based TF-IDF to model topics’ evolution over time.
2.3. Low-Scale Events
Event detection through social media data analysis has been the focus of numerous research papers, with Afyouni et al. [21] publishing one of the most comprehensive surveys to date, considering hundreds of articles published from 2010 to 2021. The survey shows that different approaches are being used by researchers to detect events, however, despite the extensive research in this field, there remains a lack of articles dedicated to low-scale event detection. Low-scale events refer to small, localized events that occur in a specific time and place, such as a car accident, a street protest, or a natural disaster. These events are important to detect and track, as they can have significant impacts on individuals and communities.
Krumm J. and Horvitz E. [10] identify low-scale events by analyzing a tweet’s time series for different spatial scales and time frames. Their approach Eyewitness achieved very high precision by applying a decision tree classifier. However, it was outperformed in future research works.
GeoBurst+ [9] allowed finding low-scale events, but the f1 score of this algorithm is not significant. Nevertheless, experiments provided by authors show that GeoBurst+ significantly outperforms GeoBurst and other baseline algorithms.
In 2019 Wei et al. [85] presented a methodology for automatically detecting the latest events from geo-tagged tweets. This way of prediction exploits the dynamics of Twitter in general and the historical data for particular locations, leading to improvements in detecting events and showing better results compared to GeoBurst and Eyewitness. It also uses historical and spatial grids but achieves better results using long short-term memory (LSTM) to predict the expected number of tweets in the future.
EvenTweet [18] system was developed by Abdelhaq et al. in 2019 to detect and track low-scale events, such as natural disasters, protests, and traffic accidents on Twitter. The method looks for bursty words and then performs geo-clustering to find anomalous bursts of activity. One potential drawback is that EvenTweet relies heavily on keyword-based approaches to identify events, which may limit its ability to detect events that do not have clear keywords or hashtags associated with them.
In the scope of this work, we focus on developing a new approach capable of low-scale events handling based on the idea of a historical grid and convolutional quadtrees proposed in [11] using the key idea of their algorithm of creating a grid with cells which depends on the size of the volume of the posts. quote
3. Semantic Convolutional Quadtree
Anomaly detection approaches can vary in many research areas, including urban environment analysis and urban event detection tasks. The ConvTree algorithm was created to solve anomaly detection, prediction and clustering problems by processing geospatial and temporal data from social networks. Article [11] shows how the quadtree can be constructed based on the convolution mechanism, effectively distributing the influence between neighbouring areas and using frequency characteristics to find anomalies in urban social network data. However, the presented method has limitations in sensitivity and event detection ranges. Analysis and research of this algorithm showed its high sensitivity to noise, which is why the author of the original article had to set low sensitivity thresholds to maintain a high level of accuracy. Thus, the method manages well with high-scale events but is not suitable for capturing low-scale ones. In this section, we describe an algorithm that allows going beyond the limitations and making semantic sense of the found events.
3.1. ConvTree
Traditional frequency-based anomaly detection algorithms have a significant disadvantage in detecting events at multiple scales because of the predefined splitting criteria that are not related to data. To overcome this limitation, Visheratin et al. [11] proposed an efficient approach to frequency-based anomaly detection using the algorithm, which uses convolutional quadtrees and adaptive geogrids for detecting events in geo-data. By employing an advanced variant of quadtree called the Convolutional Quadtree (ConvTree), authors leverage the spatial distribution of data points to subdivide the target region. This ingenious use of quadtree enables the system to accurately differentiate between regions with high and low posting frequency, thereby amplifying the sensitivity of the event detection algorithm.
The quadtree data structure was selected by the authors for its ability to cover the entirety of the target area while offering scalability that facilitates the precise localization of a diverse spectrum of events, spanning a wide range of scales. However, the quadtree does not consider the spatial distribution of data during splitting. To address this limitation, the authors improved the quadtree by adding the functionality of split point search based using convolutional neural networks (CNNs).
To build a convolutional quadtree, the authors first split the target area into a uniform grid and create a matrix of the same size as the grid. They assign every element of the matrix a value equal to the weighted sum of points in the corresponding grid cell region. Then they perform a number of sequential convolutions on the initial matrix. The usage of convolutions helps take into account the inter-influence of neighboring elements and neutralize the adjacency effects of splitting the target area into the matrix. In order to select a split point the descending gradient is calculated on the normalized output matrix G starting at the maximum point. On each step, k authors select an array of values located at the distance k from the maximum point along any axis and greater or equal to the gradient value acquired in the previous step. They continue the process of gradient calculation until the subset becomes empty:
The gradient is calculated using the equation:
where is a threshold parameter responsible for the sensitivity of the algorithm, and since the convolved matrix was normalized. The optimal value for was empirically found to be 0.8. Then, the authors select the coordinates of the vertex of the square formed on step , which is closest to the center of the matrix. This point is used to split the area into four child elements, and the process of convolution and split point search is recursively performed for each child element.
The event detection pipeline operates through four essential steps: data collection, historical grid generation, anomalies search, and event detection (Figure 1). In the data collection phase, the authors gather copious amounts of social network data over a minimum of one year to enable statistical analysis across all months. In the data collection phase, the authors gather copious amounts of social network data over a minimum of one year to enable statistical analysis across all months. The authors also derive baseline hashtags for each cell for every possible combination of month, day type, and hour, thereby establishing behavioral norms for the city. Next, in the anomalies search phase, the system conducts a comprehensive search for anomalies, wherein the current posting activity in a geogrid cell is compared against the baseline value derived from historical data. Subsequently, the algorithm proceeds to the event detection phase, where cells with anomalous behavior are processed. Upon identifying anomalous behavior, the algorithm proceeds to the event detection phase, where hashtags usage analysis is performed to identify the events. This entails constructing a post graph within the anomalous cell, with edges representing common hashtags, followed by splitting the graph into connected components. A connected component is considered an event if its size exceeds the threshold value.
The authors have validated the efficacy of their proposed method through experiments conducted on real-world datasets. The developed algorithm is adept at learning the appropriate underlying distributions for diverse datasets and detecting anomalous behavior. The experiments demonstrate that the method is capable of accurately detecting events of various scales and surpasses baseline algorithms in terms of spatiotemporal precision.
However, the presented method has certain limitations with regard to sensitivity and event detection ranges. Analysis and research on the algorithm revealed its susceptibility to noise, necessitating the authors to set low sensitivity thresholds to maintain a high level of accuracy. Consequently, while the method performs well in detecting high-scale events, it may not be suitable for capturing low-scale ones. In the subsequent section, we outline an algorithm that overcomes these limitations and enables semantic interpretation of the detected events.
3.2. Semantic-Based Model for Anomalies Detection
The task of event detection most often arises in large cities or districts. Therefore, let us consider the following geogrid for the investigated urban area:
where , , and and – are latitude’s and longitude’s min and max values. Geogrid cell corresponds to the geographic area, which covered latitude from to and longitude from to .
Let us introduce the concept of discrete-time, represented by a set of hourly intervals T. We also introduce the concept of time periods as unions of subsets of hourly intervals , which are chosen according to the selected strategy of the algorithm. In our case, we consider time periods, corresponding to each of the 24 hours for weekdays and weekends separately for each of the 12 months of the year, constructed during the original tree formation. Thus, the number of time periods we consider, following the described logic of aggregation of hourly intervals, is 576.
The set of documents related to the time period and the geographic area, represented by grid cell is described as follows:
where – is a geogrid cell to which the geotag of document belongs, and – is the time zone to which the document’s timestamp belongs.
The semantics of each document are described through an extracted and generated list of topics . Thus, for each hour interval , for each geographic area there is a vector of topic distribution:
where .
For each geogrig cell we also calculate aggregated semantic (topic) vector aggregated though time period :
The original ConvTree algorithm used to detect anomalies by partitioning the geospace into regions that are subsets of a grid S, each characterized by the less than value of the number of posts per time period : . The value of the hyperparameter was chosen empirically by the authors and was equal to 12. To test the effectiveness of the semantic-based model, we should compare the results of identifying anomalies as bursts of posts frequency above the threshold value (according to the original ConvTree algorithm) and the results of anomalies detection using further introduced semantic threshold . In SemConvTree we transformed frequency attribute into the weighted sum of semantic attributes:
, each of which is calculated using the following formula:
Here is the adjustment factor, . It helps to highlight differences in the distribution of topics, and allows to increase or decrease the importance of the topic in the case of a directional event detection problem. This coefficient works as a regularizer and allows for additional tuning to recognize events on different topics.
In this work, we used the same values of the coefficient for different topics when conducting experimental research to solve the problem of event detection of arbitrary topics and to compare the results with other methods. Nevertheless, investigating the possibility of adjusting the influence of topics on the event detection task and conducting experiments in this area is on the list of tasks for the near future.
This extension of ConvTree – SemConvTree significantly increases the limits of applicability in the area of social data analysis as we can research different scales of events: high-scale events could be analysed on the level of , while low-scale events and events of specific topics could be separately found on level.
Following this idea, in the paper, we suggest an improvement of the previously developed algorithm by adding semantic module for two main aims: to decrease data noise (removing ads, reasoning thoughts, etc.), and decrease overall barrier for low-scale event detection.
3.3. Construction Algorithm
This section describes an algorithm for event detection with adaptive geogrids. Adaptive geo-grids, aka semantic convolutional quadtrees, partition the city space into regions of different sizes. The more posts there are in a region, the more leaves for that region will be in the adaptive grid to partition the whole space into cells with approximately the same number of posts. The convolutions make this quadtree more productive, and the semantic component gives the posts a ranking to reduce the influence of noise and advertising on the algorithm and increase the importance of posts related to event topics.
The discovery pipeline consists of two main parts: historical mode and online mode (Figure 2). For the historical mode, we collect open posts from the previous year to build historical adaptive grids with posts. After that, they and the real-time flow of posts are fed to the anomaly detection module, which detects anomalous bursts of posts in the city space. Afterwards, the detected anomalies are passed to the event detection module, which performs anomaly post-filtering and links posts in anomalies into events.
One of the critical components of the algorithm is the post-ranking module. An ensemble of three models is used to determine the potential importance of a post for the event detection task: BigARTM, BERTopic, and zero-shot classification based on Semantic BERT (Figure 3), which will be described in more detail in the respective sections. The first two models are unsupervised methods of thematic modelling; the second one implements the concept of group-supervised, which differs from the first two in that it has predefined classes of texts. For each post, the label is determined by the majority votes of the three ranking module models, and then the weighted posts are fed to the remaining blocks of the algorithm.
4. Semantic Filtering
One of the essential hyperparameters of the ConvTree algorithm is the maximum number of posts in a quadtree leaf. When building a tree, the furthest partitioning into smaller areas stops when the number of posts in this area is less than this threshold value. The lower this value, the more sensitive the algorithm becomes to finding anomalies. In the original article, threshold 12 was empirically selected for noise resistance and maintaining a high level of accuracy. The developed semantic filtering algorithm made it possible to reduce this value to 3 while maintaining noise resistance and improving the accuracy and completeness of detectable events.
This data might be precise for a particular area and time despite the possibility of distinguishing commonly used types of noise and events. Classes with small sizes may not occur in training data, even for large labelled datasets. Thus, applying unsupervised (or semi-supervised) approaches is a potentially more flexible solution for social media post classification. In particular, we have applied three models: BERTopics, TSB-ARTM, and SBERT-Zero-Shot.
4.1. BERTopic
Based on the BERTopic approach, the filter module assigns a tag to the post according to the subject tag to which it belongs. Clusters (i.e. topics) obtained by BERTopic can be interpreted as groups of posts related to events or groups consisting of noisy posts. We used a marked-up dataset to determine the cluster type and assigned a label concerning the distribution of labelled posts inside. A label with the most significant fraction of posts becomes the label of the whole cluster. As some clusters might not contain any labelled posts, there is no possibility of determining their type. In such cases, the algorithm marks the cluster as devoted to events. In other words, this module filters only clusters which can be successfully recognized as consisting of noisy data. The same logic is hidden behind assigning a label to outlines formed by HDBSCAN. Due to the necessity of using a labelled dataset to classify posts, this module is considered a semi-supervised filtering approach.
4.2. TSB-ARTM
Additive regularization of topic models (ARTM) [82] is an evolution of models based on LDA [77]. It allows combining regularizers to create models with given properties. This multi-criteria approach is based on optimizing a weighted sum of the primary criterion (log-likelihood) and some additional criterion regulators. Such an approach allows one to consider several optimization criteria simultaneously, as well as several different quality metrics, the help of which is used to validate the constructed model.
Besides additional criteria-regularizers, ARTM allows us to use various additional modalities, such as a timestamp or geospatial coordinate. Using such modalities made it possible to consider the seasonality and the hypothesis about the temporal solid and spatial connectivity of event posts. Our developed TSB-ARTM model uses as additional modalities a generalized timestamp (month of the post) and information about the urban sector to which the post belongs. This algorithm, as well as BERTopic, is an algorithm for thematic modelling without a teacher, and the same semi-supervised strategy was used to determine advertising topics for BERTopic.
4.3. SBert-Zero-Shot
The key idea of applying the Sentence-BERT model for zero-shot classification is hidden in calculating similarities between embeddings of social media text descriptions and predefined classes.
Firstly, we used two lists of categories for noise data and events defined during data analysis (this process is described more precisely in subparagraph 5.1). Secondly, we have obtained embeddings for two lists of predefined classes and all social media descriptions using the pre-trained sentence-transformers model «paraphrase-multilingual-MiniLM-L12-v2» [86]. This model maps paragraphs to a dense vector space and has established itself for clustering and semantic search NLP tasks. The last step of our approach was dedicated to calculating cosine similarities between each embedding of social media data and embeddings of predefined classes. As a result, we assigned social media descriptions to the most similar class and changed the label to a binary value reflecting the determined text description type: noise or event.
4.4. Models Comparison
The developed models were compared on a manually labelled dataset from the New York City, USA posts for 2019. In 2019 February, June and October, three one-day intervals were chosen to account for season and time of day differences. Three 1-hour periods were considered: the morning from 10 am to 11 am, the afternoon from 4 pm to 5 pm, and the evening from 10 pm to 11 pm.
Table 1 compares the completeness of promotional and non-events themes for each model separately and when used in an ensemble. The results show that using an ensemble of the three described models with the selection of the majority opinion allows a significant increase in the completeness of the selection of non-event posts, which subsequently has a significant impact on the increase in the quality of event selection.
5. Experimental Evaluation
The leading indicators in this problem are the number of different-scale events found by the algorithm and their precision and recall. Comparisons were made to the city of New York, which has one of the highest Instagram activity levels.
5.1. DataSet
There is no publicly available dataset which is suitable for low-scale event detection. Nevertheless, we managed to collect data by ourselves. Data is extracted from the popular social platform Instagram via the Legacy API and credentials, golang web scrapping techniques and libraries without any search keywords or specific topics of interest. For crawling, lists of New York City locations were extracted from the Facebook API. Each location was collected from the beginning of 2018 to April 2020. In total, for New York City were collected more than 26 million posts with text, timestamps, ordinates and other meta-information that is used in multimodal models.
In order to apply semi-supervised filtering modules, obtain candidate embeddings for SBert-Zero-Shot and evaluate the results of the whole pipeline, we defined categories of events. We used crowd-sourced judges to label part of the dataset. To define categories, we manually analyzed the dataset and distinguished the most frequent types of events (e.g., festivals, shows, sports competitions) and the most frequent noise topics (e.g., food, advertisement). Taking into account the necessity to cover all possible types of events and noise data, we have also added classes which aim to cover the rest of the possible candidates: «other private events», «other global events», and «other» for the rest of noise data. As a part of the dataset, we extracted posts for three one-hour periods of one-day intervals in three different months. More precisely, we picked days from June, October and February for the morning one from 10 am to 11 am, the afternoon one from 4 pm to 5 pm and the evening one from 10 pm to 11 pm. This choice is explained by the motivation to cover seasonality trends of social media users’ activities. As a result, we extracted 5829 posts, of which 646 judges were labelled on the Yandex Toloka platform. The judges were paid $US 0.01 per answer. We have also limited each judge to a maximum of 250 judgements. Due to the complicated semantics of posts, we added an opportunity to assign several labels to one text and expanded the list of categories with two additional ones: «future events» and «retrospective events». The list of defined categories and the number of labelled posts devoted to the categories are shown in Table 2.
5.2. Experimental Studies
To conduct event detection experiments, the dataset was divided into two parts, the first being Instagram posts from 2018, which were used to build historical data and adaptive grids and the second part from early 2019 to April 2020 was used to search for events in New York City. Through ranking, we were able to significantly increase the sensitivity of the quadtree to anomalous bursts, which allowed us to find not only more high-scale events, Table 3, but also allowed us to find a huge number of low-scale events. Due to different data sources (Instagram and Twitter), as well as different time intervals at which the search for events was carried out, the comparison of algorithms is not honest and the lack of large generally accepted available datasets with markup for the correct alignment of algorithms is one of the problems of the event detection task to be solved in the future [86].
Our main goal was to add to the algorithm the ability to detect low-scale events, but we also managed to increase the accuracy and completeness for high-scale events. At the same time, significantly more low-scale events were found, and the total number of events found increased from 10 thousand to 177 thousand, a 16-fold increase, Table 4.
Table 5 clearly shows the differences between the quality of event extraction by the ConvTree model [11] and the developed multimodal algorithm with an additional filtering step. The substantial increase in precision and recall metrics is due to comparing the algorithms on a dataset containing many posts related to low-scale events. The filtering-based model allows us to find such events qualitatively, while the original algorithm [11] is more focused on finding global events.
6. Conclusion and Future Works
In this paper, we developed an algorithm capable of low-scale events detection - Semantic Convolution Tree, which extends the existing solutions’ functionality by considering the topic modelling and selecting the most expressed to solve the event detection problem. We have shown how the semantic module was constructed based on an unsupervised learning mechanism using an ensemble approach of topic models. We also indicated how the BERTopic, TSB-ARTM, and SBert-Zero-Shot models were refined to consider temporal and spatial modalities. The event detection algorithm showed a significant increase in the number of found events (more than 16 times more) and detection accuracy. However, we still see a significant front of research on developing this direction. For example, we plan to process multi-dimensional event probability weights (textual semantic and spatial semantic) and to use integrated data from other social networks and other regions of the world (cities from other countries for additional cross-cultural analysis). Moreover, we also plan to extract anomalies both from the distribution of all messages and from a few messages relating to a particular topic. Similarly, obtaining separate metrics for specific categories would be interesting to compare them from the detectability point of view. Another idea is to include additional modalities, such as retrospective and future events labels. Finally, there is a considerable research gap in comparing different event detection methods. We plan to create and publish a universal dataset allowing researchers to compare their approaches conveniently.
7. Compliance with Ethical Standards
Research related to analyzing and processing social media data can carry the risk of revealing personal and vulnerable information. Referring to the ethics flag, we would like to explain our vision of event detection systems from this perspective. Our research focuses not only on event detection but also on the study of urban processes in general. Of course, personal events should not be shared, but analyzing the distribution of such events in the city can help provide the necessary infrastructure for the location of such events. For example, this framework helps to find which parks are regularly used for wedding photo shoots. This information can be the starting point for setting up infrastructure and increasing the level of interest. In addition, the proposed algorithm is also capable of handling other small-scale events, such as car accidents. Our algorithm can be used to highlight potentially dangerous road sections. Extracting this knowledge can lead to reorganizing traffic flows and have a strong positive social impact.
8. Research Data Policy and Data Availability Statement
For ethical reasons, the dataset used in this publication cannot be published, as we have not fully anonymized the data for the publication as part of this work. However, we are currently developing a single anonymized multimodal dataset for event detection approaches, which will be published in the public domain.
References
- Dixon, S.J. Number of social media users worldwide from 2017 to 2028(in billions), May, 2024. https://doi.org/https://www.statista.com/statistics/278414/number-of-worldwide-social-network-users/.
- Wolniak, R.; Stecuła, K. Artificial Intelligence in Smart Cities—Applications, Barriers, and Future Directions: A Review. Smart Cities 2024, 7.3, 1346–1389. [Google Scholar] [CrossRef]
- S., P.; C., D.; Guy, M. Twitter earthquake detection: earthquake monitoring in a social world. Annals of Geophysics 2012, 54. [Google Scholar] [CrossRef]
- Osborne, M.; Moran, S.; McCreadie, R.; Lunen, A.V.; Sykora, M.; Cano, E.; Ireson, N.; Macdonald, C.; Ounis, I.; He, Y.; et al. Real-Time Detection, Tracking, and Monitoring of Automatically Discovered Events in Social Media. In Proceedings of the Proceedings of 52nd Annual Meeting of the Association for Computational Linguistics: System Demonstrations.; p. 2014. [CrossRef]
- Lim, B.H.; Lu, D.; Chen, T.; Kan, M.Y. Instagram. In Proceedings of the Proceedings of the 2015 IEEE/ACM International Conference on Advances in Social Networks Analysis and Mining 2015.; p. 2015. [CrossRef]
- Giridhar, P.; Wang, S.; Abdelzaher, T.; Amin, T.A.; Kaplan, L. Social Fusion: Integrating Twitter and Instagram for Event Monitoring. In Proceedings of the 2017 IEEE International Conference on Autonomic Computing (ICAC). IEEE, July 2017. [Google Scholar] [CrossRef]
- Zhang, C.; Zhou, G.; Yuan, Q.; Zhuang, H.; Zheng, Y.; Kaplan, L.; Wang, S.; Han, J. GeoBurst: Real-Time Local Event Detection in Geo-Tagged Tweet Streams. In Proceedings of the Proceedings of the 39th International ACM SIGIR Conference on Research and Development in Information Retrieval, New York, NY, USA, 2016; pp. 16513–522. [CrossRef]
- McMinn, A.; Moshfeghi, Y.; Jose, J. Building a large-scale corpus for evaluating event detection on twitter. Otober 2013, pp. 409–418. [CrossRef]
- Zhang, C.; Lei, D.; Yuan, Q.; Zhuang, H.; Kaplan, L.; Wang, S.; Han, J. GeoBurst+: Effective and Real-Time Local Event Detection in Geo-Tagged Tweet Streams. ACM Trans. Intell. Syst. Technol. 2018, 9. [Google Scholar] [CrossRef]
- Krumm, J.; Horvitz, E. Eyewitness. In Proceedings of the Proceedings of the 23rd SIGSPATIAL International Conference on Advances in Geographic Information Systems.; p. 2015. [CrossRef]
- Visheratin, A.A.; Mukhina, K.D.; Visheratina, A.K.; Nasonov, D.; Boukhanovsky, A.V. Multiscale event detection using convolutional quadtrees and adaptive geogrids. In Proceedings of the Proceedings of the 2nd ACM SIGSPATIAL Workshop on Analytics for Local Events and News.; p. 2018. [CrossRef]
- Saha, K.; Seybolt, J.; Mattingly, S.M.; Aledavood, T.; Konjeti, C.; Martinez, G.J.; Grover, T.; Mark, G.; De Choudhury, M. What Life Events Are Disclosed on Social Media, How, When, and By Whom? In Proceedings of the Proceedings of the 2021 CHI Conference on Human Factors in Computing Systems, New York, NY, USA, 2021; CHI ’21. [CrossRef]
- DiCarlo, M.F.; Berglund, E.Z. Use of social media to seek and provide help in Hurricanes Florence and Michael. Smart Cities 2020, 3.4, 1187–1218. [Google Scholar] [CrossRef]
- Becker, H.; Naaman, M.; Gravano, L. Beyond Trending Topics: Real-World Event Identification on Twitter. Proceedings of the International AAAI Conference on Web and Social Media 2021, 5, 438–441. [Google Scholar] [CrossRef]
- Khodabakhsh, M.; Kahani, M.; Bagheri, E.; Noorian, Z. Detecting life events from Twitter based on temporal semantic features. Knowledge-Based Systems 2018, 148, 1–16. [Google Scholar] [CrossRef]
- Sufi, F.K. AI-SocialDisaster: An AI-based software for identifying and analyzing natural disasters from social media. Software Impacts 2022, 13, 100319. [Google Scholar] [CrossRef]
- Cresci, S.; Tesconi, M.; Cimino, A.; Dell’Orletta, F. A.; Dell’Orletta, F. A Linguistically-Driven Approach to Cross-Event Damage Assessment of Natural Disasters from Social Media Messages. In Proceedings of the Proceedings of the 24th International Conference on World Wide Web, New York, NY, USA, 2015; pp. 151195–1200. [CrossRef]
- Abdelhaq, H.; Sengstock, C.; Gertz, M. EvenTweet: Online localized event detection from twitter. Proceedings of the VLDB Endowment 2013, 6, 1326–1329. [Google Scholar] [CrossRef]
- Neruda, G.A.; Winarko, E. Traffic Event Detection from Twitter Using a Combination of CNN and BERT. In Proceedings of the 2021 International Conference on Advanced Computer Science and Information Systems (ICACSIS); 2021; pp. 1–7. [Google Scholar] [CrossRef]
- Timokhin, Stanislav, M.S.; Antoniou, C. Predicting venue popularity using crowd-sourced and passive sensor data. Smart Cities 2020, 3.3, 42. [CrossRef]
- Afyouni, I.; Aghbari, Z.A.; Razack, R.A. Multi-feature, multi-modal, and multi-source social event detection: A comprehensive survey. Information Fusion 2022, 79, 279–308. [Google Scholar] [CrossRef]
- Said, N.; Ahmad, K.; Regular, M.; Pogorelov, K.; Hassan, L.; Ahmad, N.; Conci, N. a: Disasters Detection in Social Media and Satellite imagery, 2019; arXiv:cs.IR/1901.04277].
- Atefeh, F.; Khreich, W. A Survey of Techniques for Event Detection in Twitter. Comput. Intell. 2015, 31, 132–164. [Google Scholar] [CrossRef]
- Saeed, Z.; Abbasi, R.; Maqbool, O.; Sadaf, A.; Razzak, I.; Daud, A.; Aljohani, N.; Xu, G. Twitter: A Survey and Framework on Event Detection Techniques. Journal of Grid Computing 2019. [Google Scholar] [CrossRef]
- Chandola, V.; Banerjee, A.; Kumar, V. Anomaly Detection: A Survey. ACM Comput. Surv. 2009, 41. [Google Scholar] [CrossRef]
- Markou, M.; Singh, S. Novelty detection: a review—part 1: statistical approaches. Signal Processing 2003, 83, 2481–2497. [Google Scholar] [CrossRef]
- Ada, I.; Berthold, M.R. Unifying Change – Towards a Framework for Detecting the Unexpected. In Proceedings of the 2011 IEEE 11th International Conference on Data Mining Workshops; 2011; pp. 555–559. [Google Scholar] [CrossRef]
- Dries, A.; Rückert, U. Adaptive concept drift detection. Statistical Analysis and Data Mining: The ASA Data Science Journal 2009, 2, 311–327. [Google Scholar] [CrossRef]
- al Liu, N., Topic Detection and Tracking. In Encyclopedia of Database Systems; LIU, L.; ÖZSU, M.T., Eds.; Springer US: Boston, MA, 2009; pp. 3121–3124. [CrossRef]
- Zhang, X.; Chen, X.; Chen, Y.; Wang, S.; Li, Z.; Xia, J. Event detection and popularity prediction in microblogging. Neurocomputing 2015, 149, 1469–1480. [Google Scholar] [CrossRef]
- Brants, T.; Chen, F.; Farahat, A. A. A System for New Event Detection. In Proceedings of the Proceedings of the 26th Annual International ACM SIGIR Conference on Research and Development in Informaion Retrieval, New York, NY, USA, 2003; pp. 03330–337. [CrossRef]
- Kaleel, S.B.; Abhari, A. Cluster-discovery of Twitter messages for event detection and trending. Journal of Computational Science 2015, 6, 47–57. [Google Scholar] [CrossRef]
- Aiello, L.M.; Petkos, G.; Martin, C.; Corney, D.; Papadopoulos, S.; Skraba, R.; Göker, A.; Kompatsiaris, I.; Jaimes, A. Sensing Trending Topics in Twitter. IEEE Transactions on Multimedia 2013, 15, 1268–1282. [Google Scholar] [CrossRef]
- Lampos, V.; Cristianini, N. Nowcasting Events from the Social Web with Statistical Learning. ACM Trans. Intell. Syst. Technol. 2012, 3. [Google Scholar] [CrossRef]
- Weng, J.; Yao, Y.; Leonardi, E.; Lee, B.S. Event Detection in Twitter. Proceedings of the International AAAI Conference on Web and Social Media 2011, pp. 1–21.
- Cheng, T.; Wicks, T. Event Detection using Twitter: A Spatio-Temporal Approach. PloS one 2014, 9, e97807. [Google Scholar] [CrossRef]
- Weiler, A.; Grossniklaus, M.; Scholl, M. Event Identification and Tracking in Social Media Streaming Data. 14, Vol. 1133. 20 March.
- He, Q.; Chang, K.; Lim, E.P. Analyzing Feature Trajectories for Event Detection. In Proceedings of the Proceedings of the 30th Annual International ACM SIGIR Conference on Research and Development in Information Retrieval, New York, NY, USA, 2007; pp. 07207–214. [CrossRef]
- Kleinberg, J. Bursty and Hierarchical Structure in Streams. Proceedings of the ACM SIGKDD International Conference on Knowledge Discovery and Data Mining 2002, 7. [Google Scholar] [CrossRef]
- Fung, G.P.C.; Yu, J.X.; Yu, P.S.; Lu, H. Parameter Free Bursty Events Detection in Text Streams. In Proceedings of the Proceedings of the 31st International Conference on Very Large Data Bases.; pp. 200505181–192.
- He, Q.; Chang, K.; Lim, E.P.; Zhang, J. Bursty Feature Representation for Clustering Text Streams. In Proceedings of the SDM; 2007. [Google Scholar]
- Kumar, R.; Novak, J.; Raghavan, P.; Tomkins, A. On the Bursty Evolution of Blogspace. In Proceedings of the Proceedings of the 12th International Conference on World Wide Web, New York, NY, USA, 2003; pp. 03568–576. [CrossRef]
- Mei, Q.; Zhai, C. Discovering Evolutionary Theme Patterns from Text: An Exploration of Temporal Text Mining. In Proceedings of the Proceedings of the Eleventh ACM SIGKDD International Conference on Knowledge Discovery in Data Mining, New York, NY, USA, 2005; pp. 05198–207. [CrossRef]
- Zhou, D.; Chen, L.; He, Y. An Unsupervised Framework of Exploring Events on Twitter: Filtering, Extraction and Categorization. In Proceedings of the Proceedings of the Twenty-Ninth AAAI Conference on Artificial Intelligence.; pp. 2015152468–2474.
- Lee, R.; Wakamiya, S.; Sumiya, K. Discovery of unusual regional social activities using geo-tagged microblogs. World Wide Web 2011, 14, 321–349. [Google Scholar] [CrossRef]
- Feng, W.; Zhang, C.; Zhang, W.; Han, J.; Wang, J.; Aggarwal, C.; Huang, J. STREAMCUBE: Hierarchical spatio-temporal hashtag clustering for event exploration over the Twitter stream. In Proceedings of the 2015 IEEE 31st International Conference on Data Engineering. IEEE, April 2015. [Google Scholar] [CrossRef]
- Rehman, F.U.; Afyouni, I.; Lbath, A.; Basalamah, S. Understanding the Spatio-Temporal Scope of Multi-scale Social Events. In Proceedings of the Proceedings of the 1st ACM SIGSPATIAL Workshop on Analytics for Local Events and News.; p. 2017. [CrossRef]
- Khodabakhsh, M.; Kahani, M.; Bagheri, E.; Noorian, Z. Detecting Life Events From Twitter based on Temporal Semantic Features. Knowledge-Based Systems 2018, 148. [Google Scholar] [CrossRef]
- Mikolov, T.; Chen, K.; Corrado, G.; Dean, J. Efficient Estimation of Word Representations in Vector Space, 2013. arXiv:cs.CL/1301.3781].
- Peters, M.E.; Neumann, M.; Iyyer, M.; Gardner, M.; Clark, C.; Lee, K.; Zettlemoyer, L. 2018; arXiv:cs.CL/1802.05365].
- Pennington, J.; Socher, R.; Manning, C. Glove: Global Vectors for Word Representation. Jan. 2014, Vol. 14, pp. 1532–1543. [CrossRef]
- Zhang, Y.; Shirakawa, M.; Hara, T. A General Method for Event Detection on Social Media. In Proceedings of the Symposium on Advances in Databases and Information Systems; 2021. [Google Scholar]
- Hettiarachchi, H.; Adedoyin-Olowe, M.; Bhogal, J.; Gaber, M.M. Embed2Detect: temporally clustered embedded words for event detection in social media. Machine Learning 2021, 111, 49–87. [Google Scholar] [CrossRef]
- Devlin, J.; Chang, M.W.; Lee, K.; Toutanova, K. BERT: Pre-training of Deep Bidirectional Transformers for Language Understanding, 2018. [CrossRef]
- Liu, Y.; Ott, M.; Goyal, N.; Du, J.; Joshi, M.; Chen, D.; Levy, O.; Lewis, M.; Zettlemoyer, L.; Stoyanov, V. RoBERTa: A Robustly Optimized BERT Pretraining Approach, 2019. [CrossRef]
- Reimers, N.; Gurevych, I. Sentence-BERT: Sentence Embeddings using Siamese BERT-Networks. In Proceedings of the Proceedings of the 2019 Conference on Empirical Methods in Natural Language Processing.; p. 2019.
- Wei, Z.; Yongli, W. Chinese Event Detection Combining BERT Model with Recurrent Neural Networks. In Proceedings of the 2020 5th International Conference on Mechanical, Control and Computer Engineering (ICMCCE); 2020; pp. 1625–1629. [Google Scholar] [CrossRef]
- Huang, L.; Shi, P.; Zhu, H.; Chen, T. Early detection of emergency events from social media: a new text clustering approach. Natural Hazards 2022, 111, 1–25. [Google Scholar] [CrossRef]
- McDonald, R.; Nivre, J. Analyzing and Integrating Dependency Parsers. Computational Linguistics 2011, 37, 197–230. [Google Scholar] [CrossRef]
- . [CrossRef]
- Liu, X.; Luo, Z.; Huang, H. Jointly Multiple Events Extraction via Attention-based Graph Information Aggregation. In Proceedings of the Proceedings of the 2018 Conference on Empirical Methods in Natural Language Processing.; p. 2018. [CrossRef]
- Kipf, T.N.; Welling, M. Semi-Supervised Classification with Graph Convolutional Networks, 2017. arXiv:cs.LG/1609.02907].
- Yan, H.; Jin, X.; Meng, X.; Guo, J.; Cheng, X. Event Detection with Multi-Order Graph Convolution and Aggregated Attention. In Proceedings of the Proceedings of the 2019 Conference on Empirical Methods in Natural Language Processing and the 9th International Joint Conference on Natural Language Processing (EMNLP-IJCNLP), Hong Kong, China, November 2019; pp. 5766–5770. [CrossRef]
- Veličković, P.; Cucurull, G.; Casanova, A.; Romero, A.; Liò, P.; Bengio, Y. Graph Attention Networks, 2018. arXiv:stat.ML/1710.10903].
- Dutta, S.; Ma, L.; Saha, T.K.; Lu, D.; Tetreault, J.; Jaimes, A. GTN-ED: Event Detection Using Graph Transformer Networks, 2021. arXiv:cs.CL/2104.15104].
- Raiaan, M. A. K., M. M.S.H.F.K.F.N.M.S.S.M.M.M.J.A.S. A review on large Language Models: Architectures, applications, taxonomies, open issues and challenges. IEEE Access 2024, 12, 26839–26874. [Google Scholar] [CrossRef]
- Snoek, C.G.M.; Worring, M.; Smeulders, A.W.M. Early versus late fusion in semantic video analysis. In Proceedings of the MULTIMEDIA ’05; 2005. [Google Scholar]
- Cui, W.; Du, J.; Wang, D.; Kou, F.; Xue, Z. MVGAN: Multi-View Graph Attention Network for Social Event Detection. ACM Transactions on Intelligent Systems and Technology 2021, 12, 1–24. [Google Scholar] [CrossRef]
- Jony, R.I.; Woodley, A.; Perrin, D. Fusing Visual Features and Metadata to Detect Flooding in Flickr Images. In Proceedings of the 2020 Digital Image Computing: Techniques and Applications (DICTA); 2020; pp. 1–8. [Google Scholar] [CrossRef]
- Petkos, G.; Papadopoulos, S.; Kompatsiaris, I. Social event detection using multimodal clustering and integrating supervisory signals. Proceedings of the 2nd ACM International Conference on Multimedia Retrieval, ICMR 2012 2012. [CrossRef]
- Schinas, M.; Papadopoulos, S.; Petkos, G.; Kompatsiaris, I.; Mitkas, P. Multimodal Graph-based Event Detection and Summarization in Social Media Streams. October 2015, pp. 189–192. [CrossRef]
- Tong, M.; Wang, S.; Cao, Y.; Xu, B.; Li, J.; Hou, L.; Chua, T.S. Image Enhanced Event Detection in News Articles. Proceedings of the AAAI Conference on Artificial Intelligence 2020, 34, 9040–9047. [Google Scholar] [CrossRef]
- Guo, C.; Tian, X. Event recognition in personal photo collections using hierarchical model and multiple features. 2015 IEEE 17th International Workshop on Multimedia Signal Processing (MMSP) 2015, pp. 1–6.
- Kaneko, T.; Yanai, K. Event photo mining from Twitter using keyword bursts and image clustering. Neurocomputing 2016, 172, 143–158. [Google Scholar] [CrossRef]
- Zaharieva, M.; Zeppelzauer, M.; Breiteneder, C. Automated Social Event Detection in Large Photo Collections. In Proceedings of the Proceedings of the 3rd ACM Conference on International Conference on Multimedia Retrieval, New York, NY, USA, 2013; pp. 13167–174. [CrossRef]
- Ali, F.; Ali, A.; Imran, M.; Naqvi, R.A.; Siddiqi, M.H.; Kwak, K.S. Traffic accident detection and condition analysis based on social networking data. Accident Analysis & Prevention 2021, 151, 105973. [Google Scholar] [CrossRef]
- Blei, D.M.; Ng, A.Y.; Jordan, M.I. Latent Dirichlet Allocation. The Journal of Machine Learning Research 2003, 3, 993–1022. [Google Scholar]
- Sokolova, M.; Huang, K.; Matwin, S.; Ramisch, J.J.; Sazonova, V.; Black, R.; Orwa, C.; Ochieng, S.; Sambuli, N. Topic Modelling and Event Identification from Twitter Textual Data. ArXiv 2016. arXiv:abs/1608.02519.
- Zhang, C.; Wang, H.; Cao, L.; Wang, W.; Xu, F. A Hybrid Term-Term Relations Analysis Approach for Topic Detection. Know.-Based Syst. 2016, 93, 109–120. [Google Scholar] [CrossRef]
- Choi, D.; Park, S.; Ham, D.; Lim, H.; Bok, K.; Yoo, J. Local Event Detection Scheme by Analyzing Relevant Documents in Social Networks. Applied Sciences 2021, 11, 577. [Google Scholar] [CrossRef]
- Vorontsov, K.; Frei, O.; Apishev, M.; Romov, P.; Dudarenko, M. BigARTM: Open Source Library for Regularized Multimodal Topic Modeling of Large Collections. In Communications in Computer and Information Science; Springer International Publishing, 2015; pp. 370–381. [CrossRef]
- Vorontsov, K.V. Additive regularization for topic models of text collections. Doklady Mathematics 2014, 89, 301–304. [Google Scholar] [CrossRef]
- Zhang, C.; Liu, L.; Lei, D.; Yuan, Q.; Zhuang, H.; Hanratty, T.; Han, J. TrioVecEvent. In Proceedings of the Proceedings of the 23rd ACM SIGKDD International Conference on Knowledge Discovery and Data Mining.; p. 2017. [CrossRef]
- Grootendorst, M. BERTopic: Neural topic modeling with a class-based TF-IDF procedure, 2022. arXiv:cs.CL/ 2203.05794].
- Wei, H.; Zhou, H.; Sankaranarayanan, J.; Sengupta, S.; Samet, H. DeLLe. In Proceedings of the Proceedings of the 3rd ACM SIGSPATIAL International Workshop on Analytics for Local Events and News.; p. 2019. [CrossRef]
- Korneev, A.; Kovalchuk, M.; Filatova, A.; Tereshkin, S. Towards comparable event detection approaches development in social media. Procedia Computer Science 2022, 212, 312–321. [Google Scholar] [CrossRef]
Figure 1.
Scheme of events detection pipeline of ConvTree algorithm
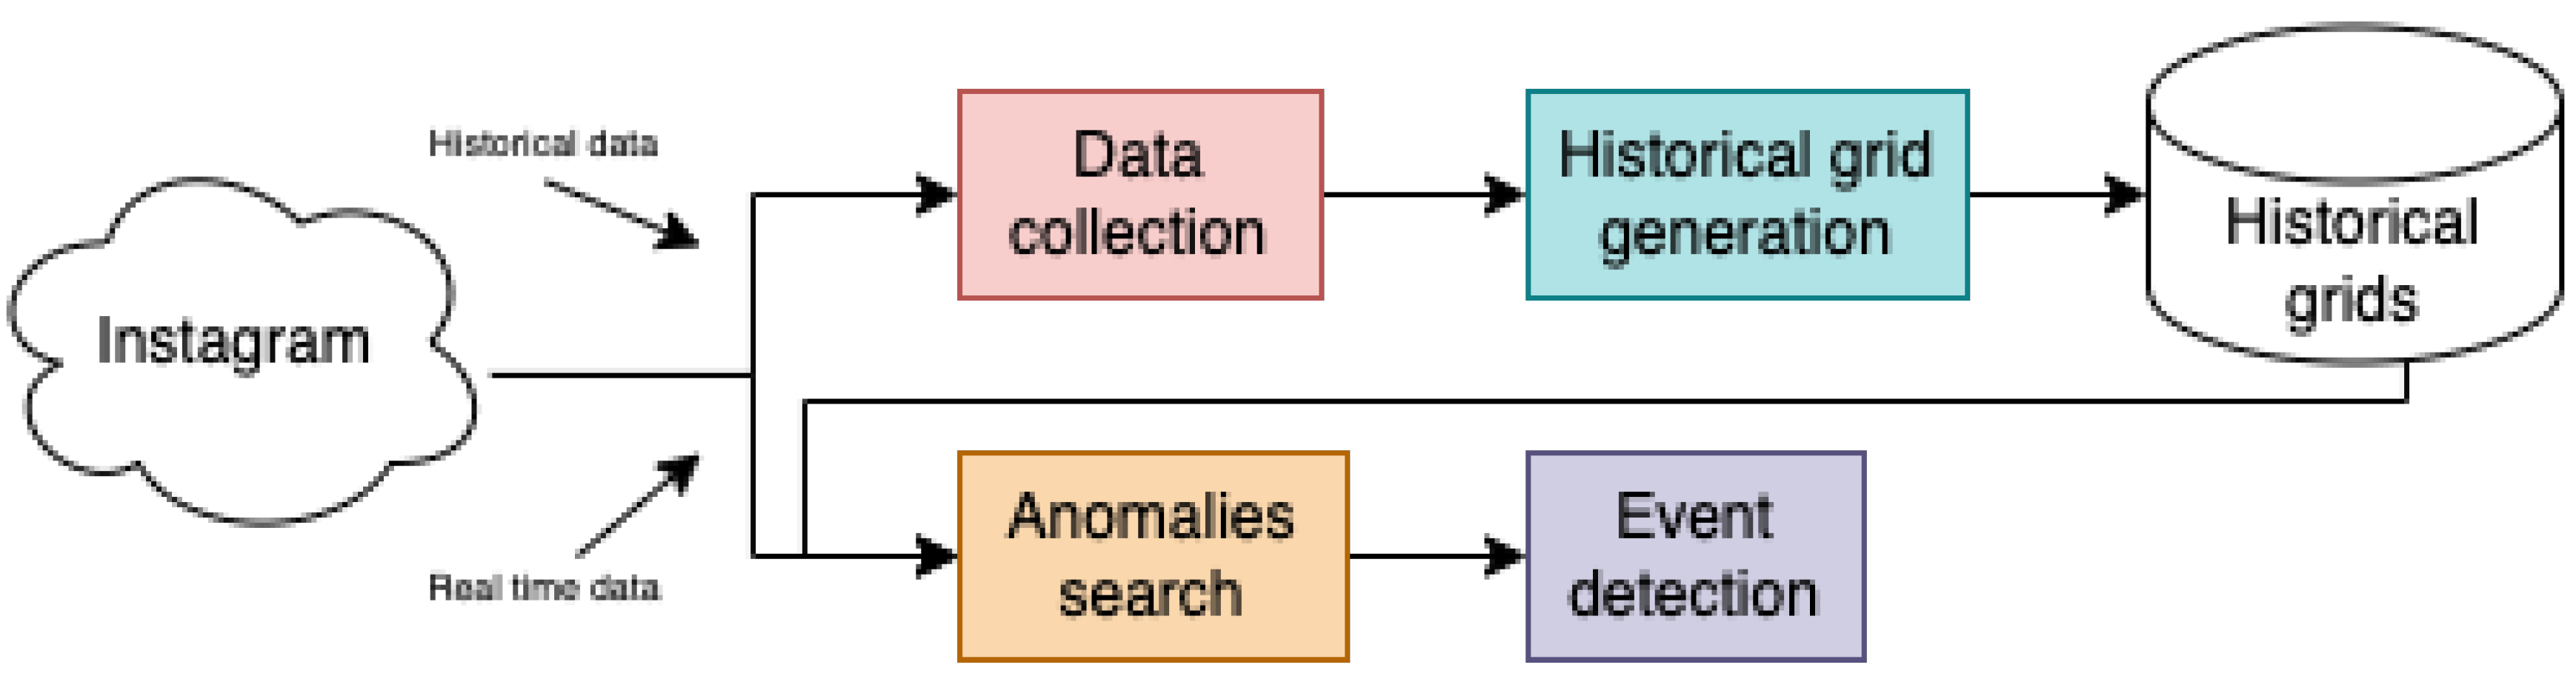
Figure 2.
Pipeline of the event detection system SemConvTree
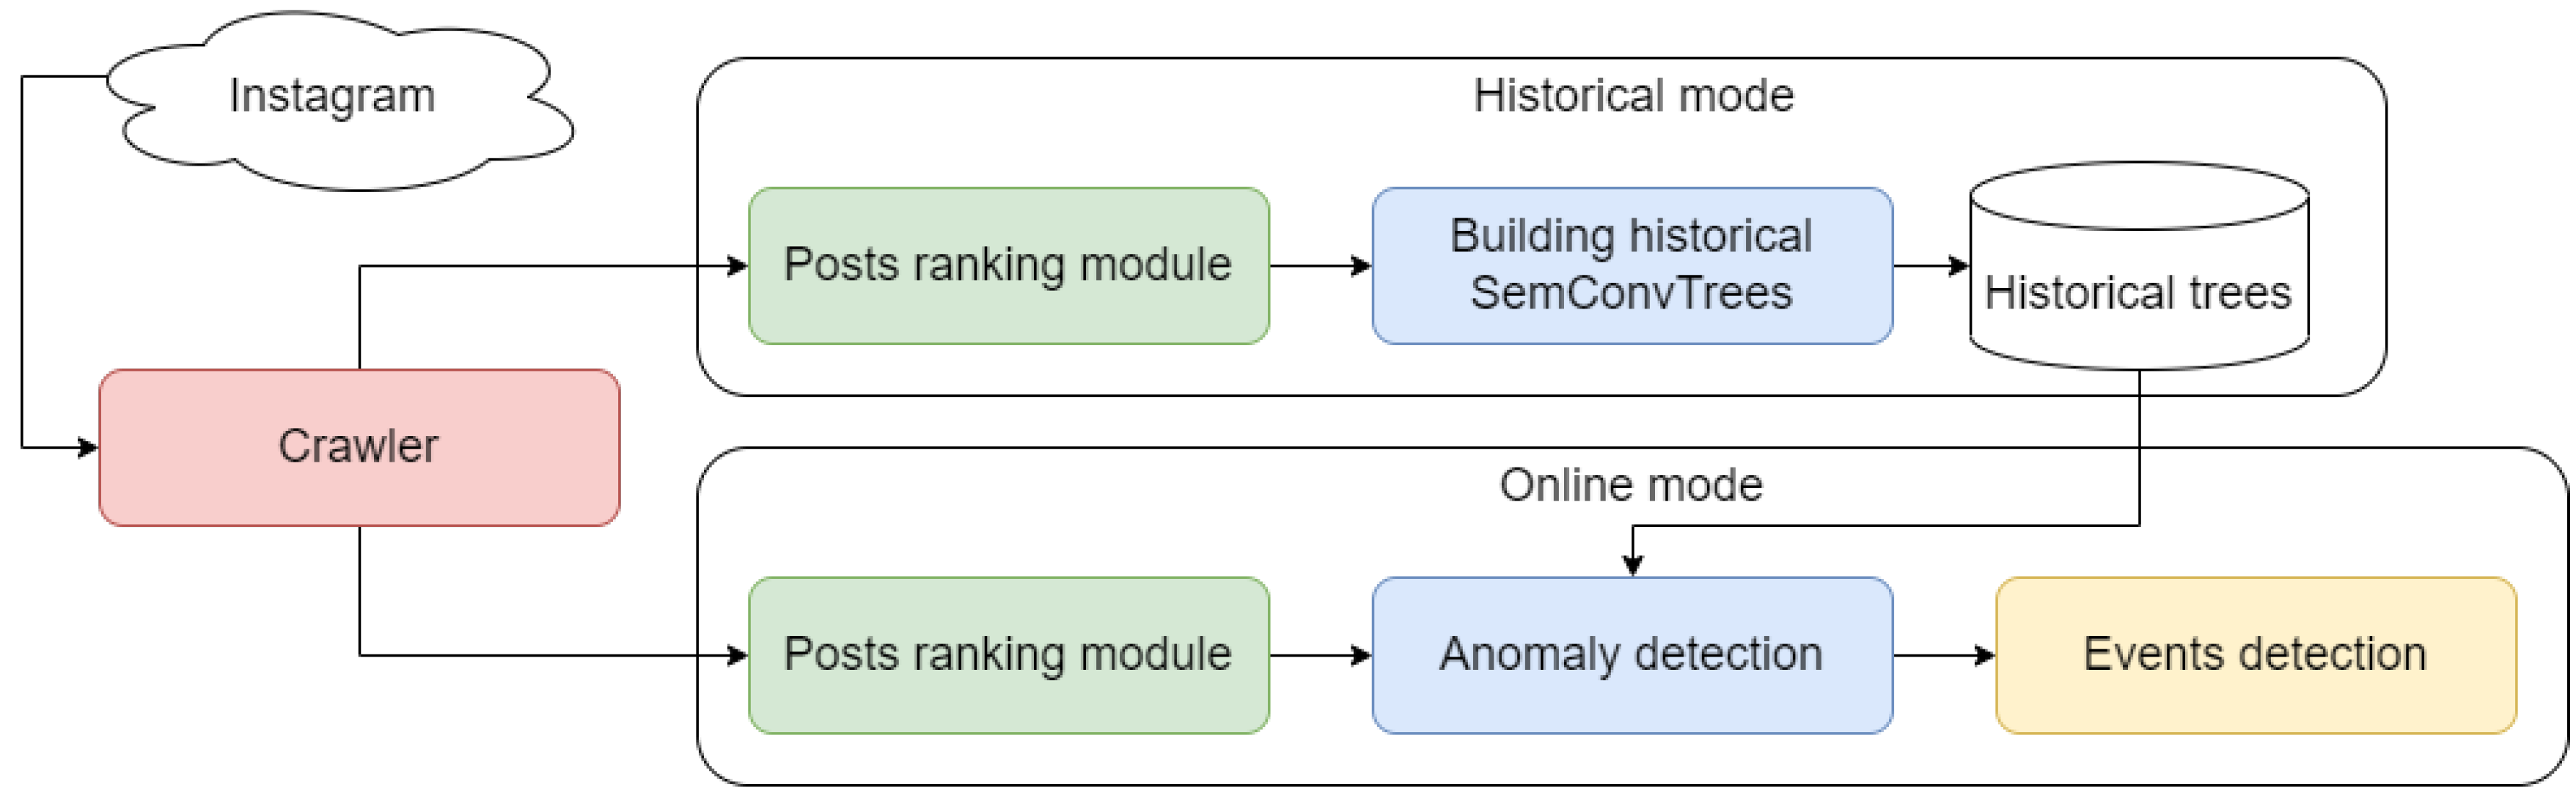
Figure 3.
Scheme of the post ranking module
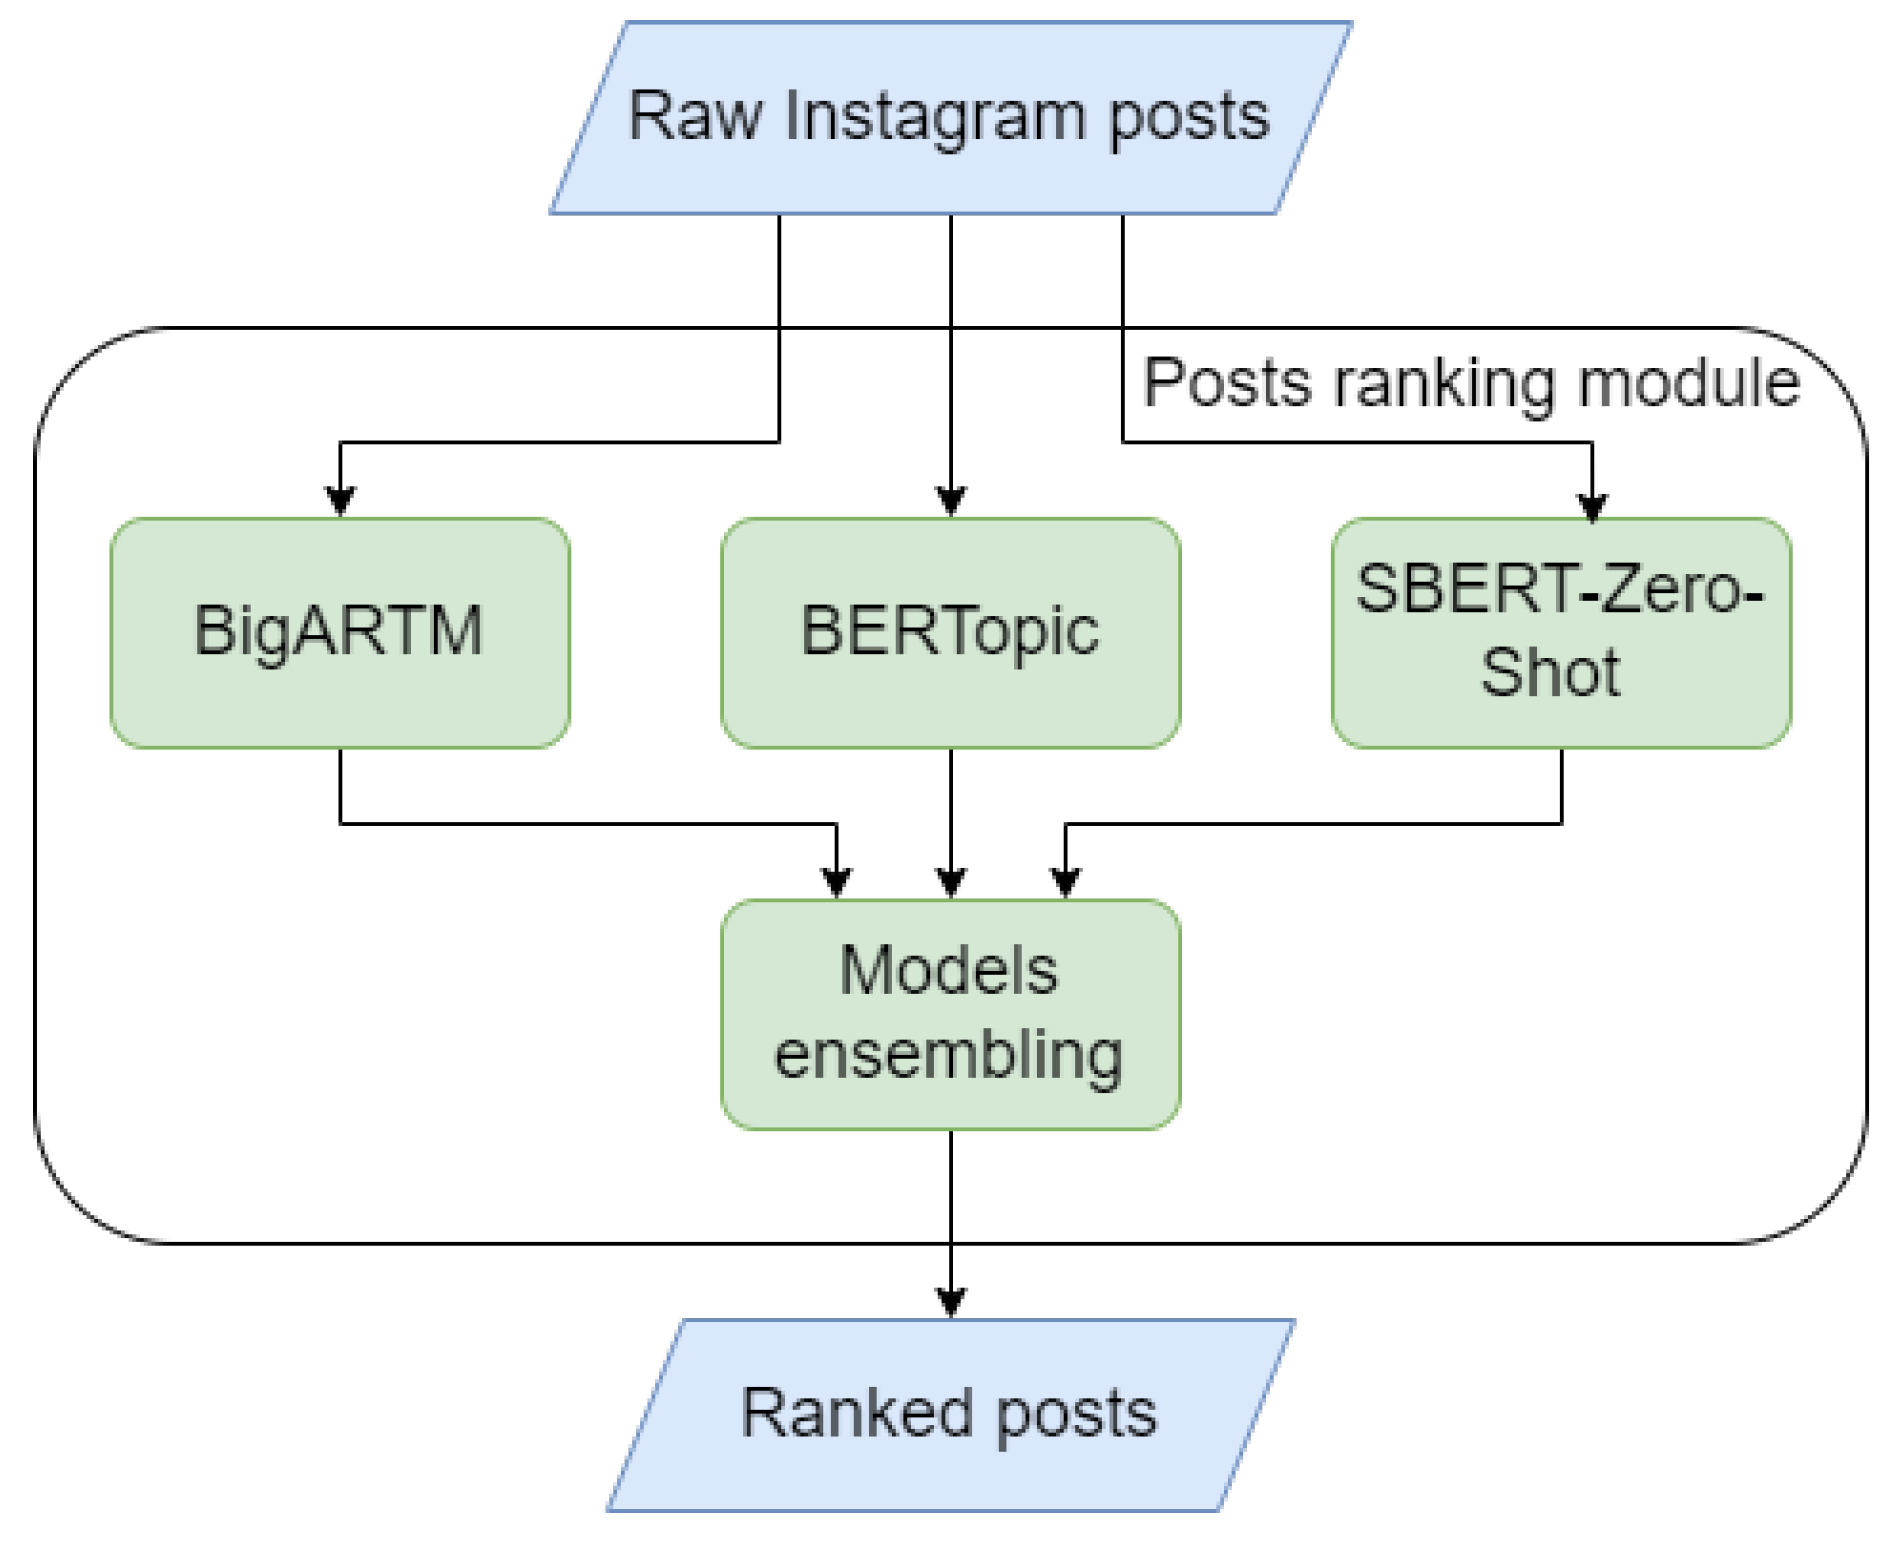

Table 1.
Filtering step results for posts by time of day: morning (M), afternoon (A), evening (E), - and for posts by month: February (Feb), June (Jun), October (Oct)
Table 1.
Filtering step results for posts by time of day: morning (M), afternoon (A), evening (E), - and for posts by month: February (Feb), June (Jun), October (Oct)
| Model | Recall of the non-events posts detection | ||||||
|---|---|---|---|---|---|---|---|
| All | M | A | E | Feb | Jun | Oct | |
| BERTopic | 0.42 | 0.43 | 0.39 | 0.41 | 0.42 | 0.43 | 0.39 |
| TSB-ARTM | 0.51 | 0.48 | 0.5 | 0.49 | 0.48 | 0.52 | 0.51 |
| SBert-Zero-Shot | 0.46 | 0.44 | 0.47 | 0.46 | 0.45 | 0.47 | 0.48 |
| Models ensemble | 0.61 | 0.59 | 0.6 | 0.62 | 0.59 | 0.6 | 0.61 |
Table 2.
Categories and posts number
| Category | Posts number | Category | Posts number |
|---|---|---|---|
| Festival | 64 | Concert | 115 |
| Sport event | 317 | National holiday | 214 |
| Show/ Flashmob/ Pride | 55 | Exhibition | 46 |
| Stroll/ Camping | 120 | Accident | 2 |
| Lectures/Conferences | 3 | Other | 2289 |
| Other private event | 135 | Private celebration | 157 |
| Food | 594 | Other public event | 164 |
| Event advertisement | 80 | Other advertisement | 205 |
| Future event | 17 | Retrospective event | 36 |
| Unsure | 2031 |
Table 3.
Precision and recall comparison with other approaches
| Method | precision | recall | avg. events per day |
|---|---|---|---|
| Eyewitness [10] | 70% | - | - |
| GeoBurst+ [9] | 35% | 48% | - |
| TrioVecEvent [83] | 78% | 60% | - |
| ConvTree [11] | 77% | 18% | 22.2 |
| SemConvTree | 86% | 64% | 365.6 |
Table 4.
Comparison of the original algorithm with low sensitivity, with high sensitivity, where a lot of advertising and noise, and the finalized algorithm with filtered advertising and noise
Table 4.
Comparison of the original algorithm with low sensitivity, with high sensitivity, where a lot of advertising and noise, and the finalized algorithm with filtered advertising and noise
| Method | count of | count of |
|---|---|---|
| events | event posts | |
| ConvTree | 10757 | 151084 |
| ConvTree with high | 263533 | 803454 |
| sensitive and noise events | ||
| SemConvTree | 177315 | 538628 |
Table 5.
Multi-scale events detection results comparison
| Model | All | Feb | Jun | Oct | ||||
|---|---|---|---|---|---|---|---|---|
| Prec | Rec | Prec | Rec | Prec | Rec | Prec | Rec | |
| ConvTree [11] | 0.77 | 0.18 | 0.78 | 0.21 | 0.77 | 0.17 | 0.77 | 0.17 |
| SemConvTree | 0.86 | 0.64 | 0.87 | 0.58 | 0.85 | 0.63 | 0.86 | 0.64 |
Disclaimer/Publisher’s Note: The statements, opinions and data contained in all publications are solely those of the individual author(s) and contributor(s) and not of MDPI and/or the editor(s). MDPI and/or the editor(s) disclaim responsibility for any injury to people or property resulting from any ideas, methods, instructions or products referred to in the content. |
© 2024 by the authors. Licensee MDPI, Basel, Switzerland. This article is an open access article distributed under the terms and conditions of the Creative Commons Attribution (CC BY) license (http://creativecommons.org/licenses/by/4.0/).
Copyright: This open access article is published under a Creative Commons CC BY 4.0 license, which permit the free download, distribution, and reuse, provided that the author and preprint are cited in any reuse.


