Submitted:
13 July 2024
Posted:
15 July 2024
You are already at the latest version
Abstract
This study was conducted to investigate heavy metal contamination and potential health risk of ground water of selected municipal solid waste (MSW) disposal sites of Khyber Pakhtunkhwa (KP) Pakistan. For this purpose a total of 30 composite samples of both surface and ground water were collected from dumpsites of Abbottabad, Bannu and Peshawar. The collected samples were analyzed for physico-chemical parameters and heavy metals by following standard methods. Results indicated that pH values were found within the acceptable limits specified by national environmental quality standards (NEQS) and world health organization (WHO). Mean concentrations of heavy metals were within NEQS and WHO limits, except for Ni which exceeded the NEQS and WHO limit of 0.02 mg/L in all samples, Similarly, Mn exceeded the limit set by NEQS and WHO (0.5 mg/L) in the ground water samples collected from Bannu dumpsite. The multivariate analysis indicated that the heavy metal contamination of the groundwater of the selected dumpsites was anthropogenic. The pollution index (PI) values (PI≥100) of Mn and Ni indicated very high pollution at individual levels while collectively based on heavy metals pollution index (HPI) values (HPI ≥ 200) the ground water of all the selected dumpsites were found highly polluted. Whereas, the hazard index (HI) values (HI ≥ 5) suggested adverse health effects. It was concluded that the ground water of all the dumpsites was highly polluted with heavy metals particularly Ni and Mn thus, posing a high health risk.
Keywords:
surface water
; groundwater
; heavy metals
; pollution index
; hazard index
1. Introduction
Environmental problems caused by solid waste is a critical and emerging issue. As, the generation rate of MSW is rising with increase in global population. Disposal of hazardous waste from households such as batteries, paint residue, ash, treated wood, electronic waste, industrial waste, and construction waste can contribute to the risk of heavy metals at municipal disposal sites [1]. Inadequate source separation waste management plan with no established laws and current final disposal systems can lead to environmental pollution. Unmanaged dumping of solid waste may have unacceptable consequences on terrestrial and surface water bodies through runoff and leachate [2]. Leachate released is a source of heavy metals and has a higher tendency to pollute surface and ground water than industrial wastewater [3].
The complex interactions of heavy metals with different components of the ecosystem lead to the assessment of the dumping site for potential environmental contamination [4]. The heavy metals that are mostly focused on in studies of environmental issues are cadmium (Cd), manganese (Mn) copper (Cu), nickel (Ni) and lead (Pb) [5,6,7,8,9,10,11]. Cadmium is carcinogenic agent as well as nephrotoxic element (Sharma et al., 2015). Next, Mn is an essential trace element for humans, but long-term environmental or occupational exposure can lead to numerous health problems [12]. Moreover, copper is an essential element for the growth and development of the human body [13] and their consumption in excess may lead to health problems such as reproductive system disorder, anemia, irritability, stomach diseases, kidney disorder, liver disease, skin and eye irritation [14,15,16]. Similarly, Ni is a known hematotoxic, immunotoxic, neurotoxic, genotoxic, reproductive toxicant, pulmonary toxicant, nephrotoxic, hepatotoxic, and carcinogen [17]. In continuation, Pb exposure tends to cause central nervous system toxicity, especially in children, and may cause encephalopathy [18].
Therefore potential environmental and health risk assessment of heavy metals present in MSW are essential to recommend to relevant authorities for effective solid waste management. That is why, this study was designed to investigate physicochemical parameters and heavy metals in surface water (leachate) and ground water of selected dumpsites of Abbottabad, Bannu and Peshawar. Moreover, the study also evaluated potential health risk of heavy metals in the dumping sites groundwater.
2. Materials and Methods
2.1. Study Area Overview
The Khyber Pakhtunkhwa (KP), Pakistan, spans diverse terrain from high mountains to plains, including urban centers such as Abbottabad, Bannu and Peshawar etc. Base on the climate, rainfall, temperature, altitude and topography the province of KP is divided into different ecological zones as reported in the climate change policy, developed by the provincial Environmental Protection Agency [19]. Three urban setups (Abbottabad, Bannu and Peshawar) from three different ecological zones of the KP province were included in the study. Abbottabad is located at 34.1495°N latitude and 73.2117°E longitude in Hazara District. It is located at an altitude of about 1,260 meters above sea level. It has a moderate climate and receives about 1,200 mm to 1,500 mm of rainfall annually. Bannu is another important city in KP that serves as the headquarters of Bannu District. It is located at 32.9861°N latitude and 70.6042°E longitude. It experiences a semi-arid climate and receives about 200 mm to 300 mm of rainfall annually. Peshawar, the capital of KP, is located approximately at 34.0150°N latitude and 71.5250°E longitude. It experiences a semi-arid climate where annual rainfall ranges from 400 mm to 600 mm. Much of the rainfall occurs in all the locations during the monsoon season, which typically runs from July to September. Due to rapid urbanization, inadequate infrastructure, and limited resources waste management in KP region faces challenges especially in urban setups,where municipal solid waste is collected from homes, commercial areas and public places, and is transported and disposed of openly by municipal workers in dumping sites located nearby the urban setups.
2.2. Surface and Ground Water Sampling
Base on the ecological zones both surface and ground water sampling was done from three urban setups namely Abbottabad, Peshawar and Bannu. The surface water samples were collected from mid-July to August, 2018. For this purpose surface water sample points were selected based on the natural streams draining the study area, flow regimes and topography. Next, composite samples were taken from the dumpsite at five sampling points. Points SW1–SW4 were located at all four directions while SW5 in the middle of the dumpsite [20]. For ground water quality assessment composite samples were collected in clean polyethylene bottles having 1 L capacity from the available sources.
2.3. Physico-Chemical and Heavy Metals Analysis
pH and EC were determined by using pH cum conductivity meter (OHAOS-ST, 300). While heavy metal concentrations (Cd, Mn, Cu, Ni, and Pb) in surface and groundwater samples were measured using atomic absorption spectrometer (AAS, PG-9900). A standard curve was obtained by running a prepared standard solution for each heavy metal. One hundred milliliters of each sample was transferred to a beaker. Concentrated 5 ml. Hydrochloric acid was added and heated using a hot plate until the volume was reduced to 20 ml. The sample was cooled and then filtered. The pH of the digest sample was adjusted to 4 by adding 5.0 N NaOH. The sample was transferred to a 100 ml volumetric flask and then diluted to the mark with deionized water. The digested samples were used for heavy metal analysis [20].
2.3. Quality Control
For quality assurance it was made sure to drain the source for at least 5 minutes to eliminate immobile water before collection of a ground water sample. Next, all reading were taken in triplicate after standardization of the equipment used. Furthermore, standard chemicals of analytical grate were used and glassware were acid washed and dried before use to eliminate any contamination.
2.4. Heavy Metals Pollution and Health Risk Assessment
2.4.1. Pollution Evaluation Index (PEI)
In order to evaluate single metal contamination, a single factor evaluation index was proposed by [21] that can be computed using eq (1).
Where, Pi, Ci and Si are the environmental quality index of pollutant i, concentration of ith parameter in sample and standard concentration of ith parameter respectively.
2.4.2. Metal Index (MI)
To have an idea of the overall ground water quality of the selected dumpsites the MI was used [22].
MI = ∑ [Ci / (MAC) i ]
Where, Ci and (MAC) i are the concentration of ith parameter in sample and maximum allowable concentration of ith parameter respectively. For ground water quality evaluation critical value of MI is 1. The MI values ˃1 represents a potential health risk warning [23].
2.4.3. Heavy Metals Pollution Index (HPI)
Where; n, is the total number of parameters considered, Wi, is the unit weightage of the ith parameter and Qi, is the sub index of the ith parameter that is calculated by eq. 2.
Where; Mi, Ii, and Si are monitored, ideal and standard values, of the ith parameter of the examined heavy metals.
2.4.4. Heavy Metal Evaluation Index (HEI)
HEI is another heavy metals evaluation index that is used to get overall idea of potential water contamination [26].
Where; Hc and Hmac are observed and maximum permissible limit of the ith parameter respectively.
2.4.5. Health Risk Assessment
Assessment of health risk associated with study heavy metals was calculated by following the method used by [27]. For this purse average daily dose (ADD) and hazard identification (Hazrad index) were done. The ADD was calculated by using eq (6).
The details of input parameters of eq. 5 are given in Table 3 (collected through survey).
Hazard Index (HI)
The hazard index was calculated by the following eq (7).
Where HQ is the value of hazard quotient that can be calculated by using eq (8).
2.5. Statistical Analysis
For range, mean, standard deviations and Pearson correlation analysis IBM (16.2) SPSS software was used. While for PCA analysis and cluster analysis PAST (3.14) was used.
3. Results and Discussions
3.1. Physico-Chemical Characteristics of Surface Water
Results of pH, EC and HMs mean values, investigated in surface water (leachate) of all the selected dumpsites i.e. Abbottabad, Bannu and Peshawar are given in Table 1. The pH ranged from 6.8 -7.3 <7.05 >, 6.7-7.2 <7.00>, and 6.9 to 7.4 <7.12> in the selected landfills of Abbottabad, Bannu and Peshawar, respectively. Next, the electrical conductivity was ranged from 12,195.0- 16,193.0 <14430.73>, from 11,882.0-24, 144.0 <16061.25> and from 18,124.3- 21,686.3 <19824.08> μS/cm in the selected landfills of Abbottabad, Bannu and Peshawar, respectively. All pH values were within the acceptable range of 6.5 to 8.5, as set forth in NEQS. While, high values of EC were observed, indicating high conductivity that might be due to the presence of dissolved salts or minerals. Fluctuation in the values of both pH and EC observed at all the locations might be due to difference in MSW composition, environmental conditions and lethogenic characteristics that existed at the selected dumpsites [29,30,31]. Whereas, the concentrations of HMs (Cd, Mn, Cu, Ni, and Pb) were found sequentially as, the Cd (0.01- 0.04 ˂0.02˃, 0.02-0.10 ˂0.05˃ and 0.001-0.02 ˂0.02˃ mg/l), Mn (0.0-2.3 ˂0.71˃, 0.0-1.7 ˂0.85˃ and 0.0 to 1.1 ˂0.57˃ mg/L), Cu (ND), Ni (1.9-2.7 ˂2.41˃, 1.5-2.7 ˂1.49˃ and 1.1 to 2.7 ˂2.3˃ mg/L) and Pb (0.0-0.2 ˂0.08˃, 0.0 -1.00 ˂0.72˃ and 0.0 to 1.3 ˂0.53˃ mg/L) in Abbottabad, Bannu and Peshawar dumpsites across different sampling points (SW1, SW2, SW4, SW5), (SW1, SW2, SW3, SW5) and (SW1, SW2, SW3, SW5) respectively. The mean concentrations of Cd at all the locations were found less (below the NEQS limit of 0.10 mg/L). However, its continuous flow from leachate to sinks i.e. soil and underground water may build up its concentrations due to the process of accumulation [3,32]. While mean concentrations of Mn, Ni, and Pb were found crossing the NEQS permissible limits, indicating potential contamination issues. The highest mean concentrations of Ni and Mn in the surface water of all the locations might be due to used batteries, electronic devices, demolition waste and ghee wrappers disposed in the dumping site along with MSW [1]. Overall, the HMs mean concentrations were observed in order of Ni> Mn > Pb >Cd>Cu in the selected dumpsites.

Table 1.
Mean pH, EC and HMs values of surface water (leachate) of the selected dumpsites.
| Location | Sample code | pH | EC | Cd | Mn | Cu | Ni | Pb |
|---|---|---|---|---|---|---|---|---|
| mean ± SD | mean ± SD (µS/cm) | mean ± SD (mg/L) | ||||||
| Abbottabad | SW1 | 7.3 ±0.2 | 16193 ±1149.5 | 0.04±0.011 | 2.34±0.173 | - | 2.5 ±0.3 | 0.19 ±0.011 |
| SW2 | 7.2 ±0.1 | 14144.7 ± 1278.1 | 0.01±0.001 | 0.11±0.021 | - | 2.7±0.23 | 0.01 ±0.003 | |
| SW4 | 6.9 ±0.05 | 12195 ±1134.2 | 0.01±0.001 | 0.01±0.001 | - | 1.9±0.01 | 0.01 ±0.002 | |
| SW5 | 6.8 ±0.1 | 15190.23 ±1049.5 | 0.02±0.003 | 0.41±0.003 | - | 2.56±0.2 | 0.11±0.013 | |
| Overall mean | 7.05 ±0.24 | 14430.73 ± 1152.82 |
0.02 ±0.005 | 0.71 ±0.05 | - | 2.41 ± 0.17 | 0.08±0.007 | |
| Bannu | SW1 | 7.2±0.13 | 12026.4 ±109.7 | 0.1±0.03 | 1.74±0.125 | - | 1.5±0.031 | 0.95±0.08 |
| SW2 | 7.1±0.16 | 11882 ±1195.8 | 0.02±0.001 | - | - | 1.6±0.042 | 0.02±0.002 | |
| SW3 | 7±0.1 | 24144 ±1254.2 | 0.08±0.012 | 1.14±0.178 | - | 1.5±0.01 | 0.57±0.03 | |
| SW5 | 6.7±0.14 | 16192.6 ±1189.7 | 0.02±0.001 | 0.50±0.037 | - | 1.36±0.037 | 1.34±0.07 | |
| Overall mean | 7.00 ±0.22 | 16061.25 ± 937.35 |
0.05 ±0.01 | 0.85 ± 0.08 | 1.49±0.02 | 0.72 ±0.04 | ||
| Peshawar | SW1 | 7.4±0.1 | 19295.3±246.6 | 0.03±0.001 | 1.13±0.023 | - | 2.7 ±0.512 | 1.03±0.011 |
| SW2 | 7.2±0.11 | 18124.3±675.6 | 0.02±0.001 | 0.02±0.025 | - | 2.7 ±0.311 | 1.09±0.019 | |
| SW3 | 7±0.2 | 21686.3±1392.4 | 0.001±0.0003 | 1.1±0.07 | - | 1.1 ±0.116 | 0.03±0.004 | |
| SW5 | 6.9±0.05 | 20190.43± 794.9 | 0.03 ±0.013 | 0.02±0.005 | - | 2.7 ±0.194 | 0.20±0.0218 | |
| Overall mean | 7.12 ±0.20 | 19824.08 ± 893.23 | 0.02 ±0.008 | 0.57 ±0.03 | 2.3 ±0.30 | 0.53 ±0.03 | ||
| NEQS | 6-9 | - | 0.1 | 1.5 | 1.0 | 1.0 | 0.5 | |
3.2. Heavy Metal Analysis of Groundwater
The results of groundwater samples collected from selected dumpsites are summarized in Table 2. The pH values were 7.00 -7.10 <7.05>, 6.87-7.30 <7.14> and 6.73-7.27 <6.98>. After that, the EC values were 243.33-1043.00 <667.19>, 420.70-1072.70 <684.15> and 429.74-985.70 <675.03 > μS/cm. Mn concentrations were 0.001-0.220 <0.005>, 0.511-0.690 <0.561> and 0.000-0.530 <0.06> mg/L, while Ni concentrations were 0.780 - 4.340 <1.88 >, 0.380-2.660 <0.52 > and 0.310-2.660 <2.02 > mg/L in Abbottabad, Bannu and Peshawar across various groundwater samples (GW1 to GW6) respectively. The mean pH values were within the acceptable pH range specified by NEQS, which is 6.5 to 8.5. The observed fluctuation in pH values of the ground water may be due to the presence of humic acid that is produced during biological decomposition of organic waste [33]. This may also be due to age of the dumpsites, as pH of the leachate that gets into water and soil increases with the age of landfill [34]. The observed variations in the mean EC values of the groundwater might be due to leachate (surface water) percolation that usually contain high concentration of dissolve ions exhibits quite low electrical resistivity, soil cation exchange capacity, soil texture, porosity and permeability [33,34,35]. The mean concentrations of heavy metals were within NEQS limits, except for Ni which exceeded the NEQS limit of 0.02 mg/L in all samples, Similarly, Mn exceeded the limit set by NEQS (0.5 mg/L) in the groundwater samples collected from Bannu dumpsite. Retention and leaching of HMs from soil into ground water is affected by a soil type and properties, pH and redox conditions, organic matter content, water flow and precipitation patterns and, HMs concentrations and chemical forms [36,37]. Cadmium usually forms complex with organic matter like humic acids, making it less available for leaching [38]. Furthermore, Cd can also replaces other ions on soil exchange sites, retaining it in soil. It can also precipitate as insoluble compounds like cadmium carbonate or hydroxide that is quite stable in soil making it difficult for water to leach it out [39]. However, the mobility of Cd is higher than Pb but lower than that of Ni and Mn [40,41]. The higher mean concentrations of both Ni and Mn in ground water of the selected dumpsites might be due to their higher mobility and percolation as compare to other HMs [41,42]. Overall, the HMs were found in order of Ni>Mn>Cu, Cd and Pb.
Table 2.
Mean pH, EC and HMs values of groundwater of the selected dumpsites.
| Location | Sample code | pH | EC | Cd | Mn | Cu | Ni | Pb |
|---|---|---|---|---|---|---|---|---|
| mean ±SD | mean ±SD (µS/cm) | Mean ±SD (mg/L) | ||||||
| Abbottabad | GW1 | 7.08±0.17 | 599.48±122.23 | - | 0.001±0.00 | - | 1.09±0.11 | - |
| GW2 | 7.00±0.2 | 794.67±73.51 | - | 0.002±0.001 | - | 1.24±0.15 | - | |
| GW3 | 7.08±0.3 | 645±117.44 | - | 0.003±0.001 | - | 0.78±0.01 | - | |
| GW4 | 7.07±0.29 | 243.33±78.69 | - | 0.01±0.003 | - | 1.13±0.1 | - | |
| GW5 | 7.02±0.27 | 677.67±116.08 | - | 0.005±0.001 | - | 2.67±0.17 | - | |
| GW6 | 7.07±0.31 | 1043±228.58 | - | - | - | 4.34±0.35 | - | |
| Overall mean | 7.05 ±0.26 |
667.19 ±122.76 | - | 0.005±0.001 | - | 1.88 ±0.15 |
- | |
| Bannu | GW1 | 7.10±0.2 | 929.7±215.16 | - | 0.56±0.02 | - | 0.38±0.13 | - |
| GW2 | 6.97±0.15 | 1072.7±267.74 | - | 0.69±0.07 | - | 1.37±0.05 | - | |
| GW3 | 7.30±0.11 | 531.37±68.58 | - | 0.52±0.03 | - | 0.41±0.01 | - | |
| GW4 | 7.29±0.11 | 420.7±18.03 | - | 0.51±0.13 | - | 0.33±0.07 | - | |
| GW5 | 7.14±0.26 | 664.37±118.58 | - | 0.55±0.11 | - | 0.41 ±0.11 | - | |
| GW6 | 7.03±0.13 | 486.03±84.58 | - | 0.54±0.08 | - | 0.32±0.03 | - | |
| Overall mean | 7.14 ± 0.17 | 684.15 ± 128.78 | - | 0.561 ± 0.07 | - | 0.52 ± 0.07 |
- | |
| Peshawar | GW1 | 6.94±0.13 | 932.13 ±167.33 | - | 0.01±0.001 | - | 2.34±0.13 | - |
| GW2 | 6.87±0.12 | 985.70 ±268.16 | - | 0.002±0.001 | - | 2.66±0.01 | - | |
| GW3 | 7.27±0.05 | 429.74 ±73.58 | - | 0.01±0.003 | - | 1.25 ±0.12 |
- | |
| GW4 | 7.05±0.1 | 538.33±61.74 | - | 0.01±0.002 | - | 2.03±0.22 | - | |
| GW5 | 6.99±0.1 | 675.31 ±139.03 | - | - | - | 2.53 ±0.04 |
- | |
| GW6 | 6.73±0.2 | 489.03 ±68.58 | - | - | - | 1.28 ±0.19 |
- | |
| Overall mean | 6.98 ±0.12 |
675.03 ±113.07 | - | 0.063 ± 0.002 | 2.02 ± 0.12 |
- | ||
| NEQS | 6.5-8.5 | - | 0.01 | 0.5 | 2 | 0.02 | 0.05 | |
| WHO | 6.5-8.5 | - | 0.003 | 0.5 | 2 | 0.02 | 0.01 | |
3.3. Pearson’s Correlation Analysis
The Pearson’s correlation analysis was used to identify relationships among the studied parameters as well as evaluate common sources for heavy metals detected in groundwater samples. Correlation matrix (Figure 1) displays correlation between different parameters: pH, EC, Cd, Mn, Cu, Ni, and Pb. pH was found to be negatively correlated with EC, indicating that as pH increases (becomes more alkaline), electrical conductivity tends to decrease in vice versa. Next EC was found moderately positive correlated with Ni concentrations. While Ni showed a moderate negative correlation with Mn, indicating an inverse relationship in the groundwater of the dumpsites.
Figure 1.
Study area map of selected dumpsites with surface and groundwater sampling points.
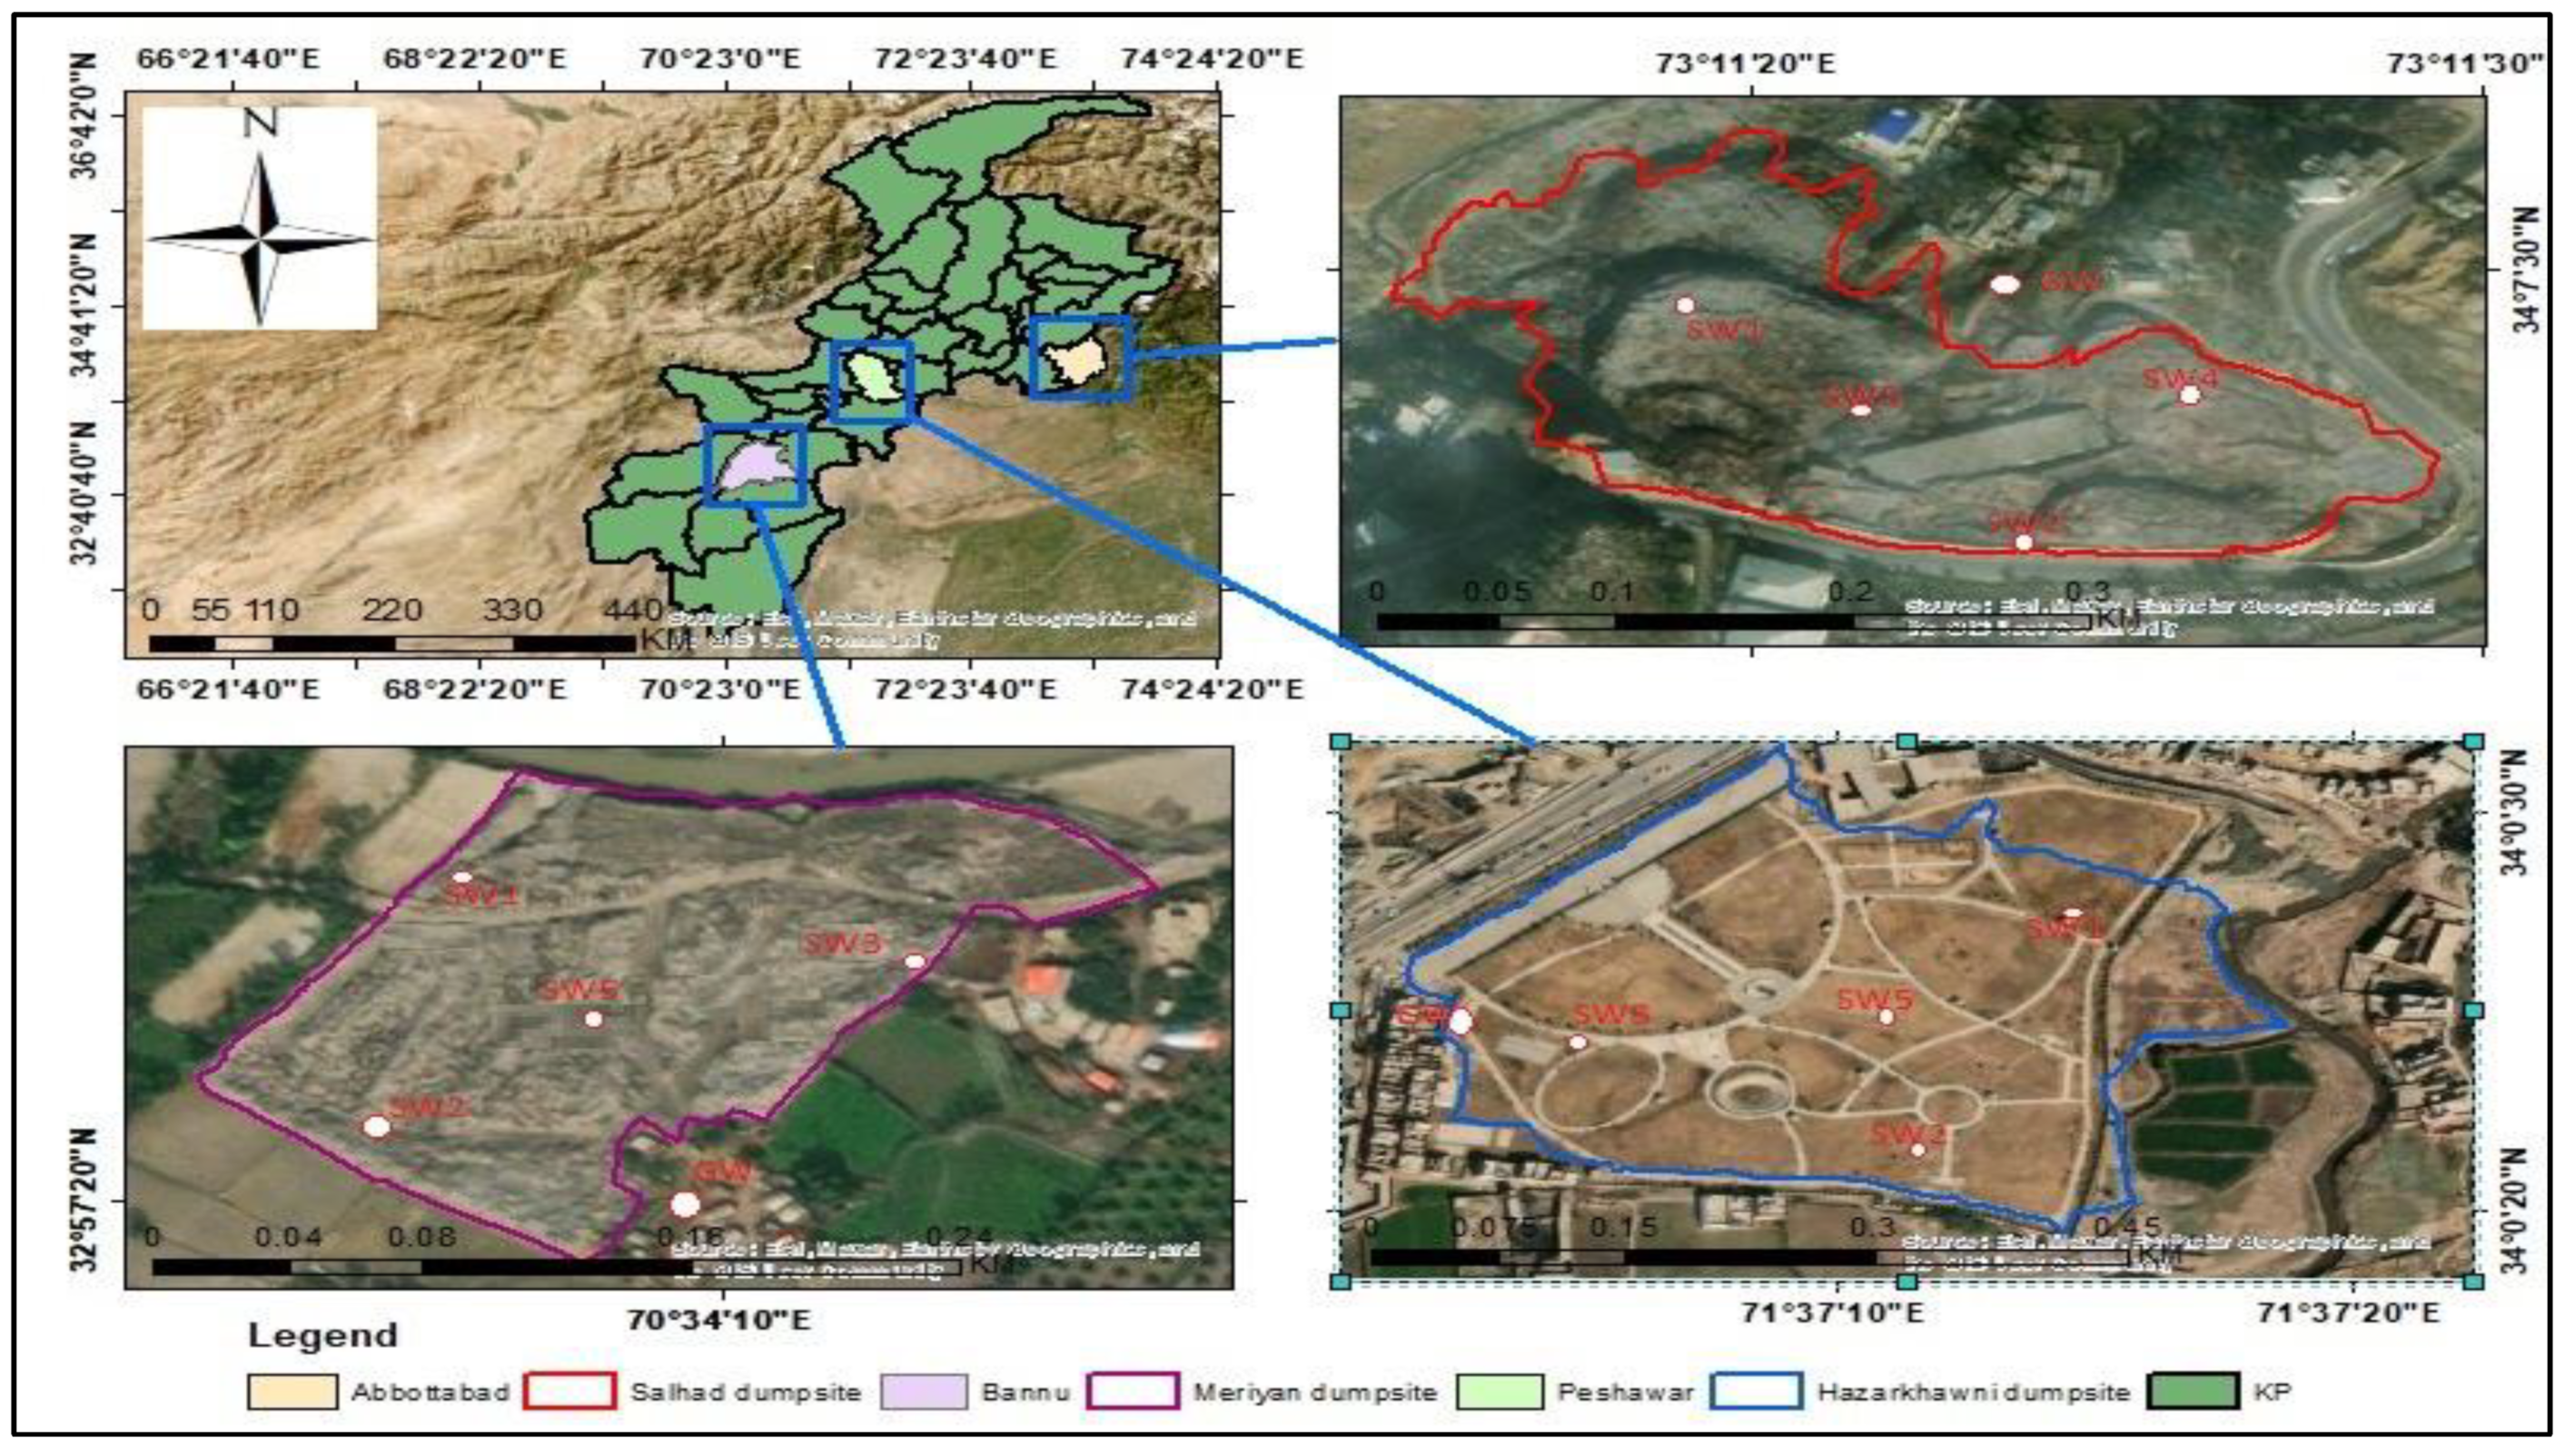
Figure 1.
Pearson’s correlation matrix of various ground water quality parameters.
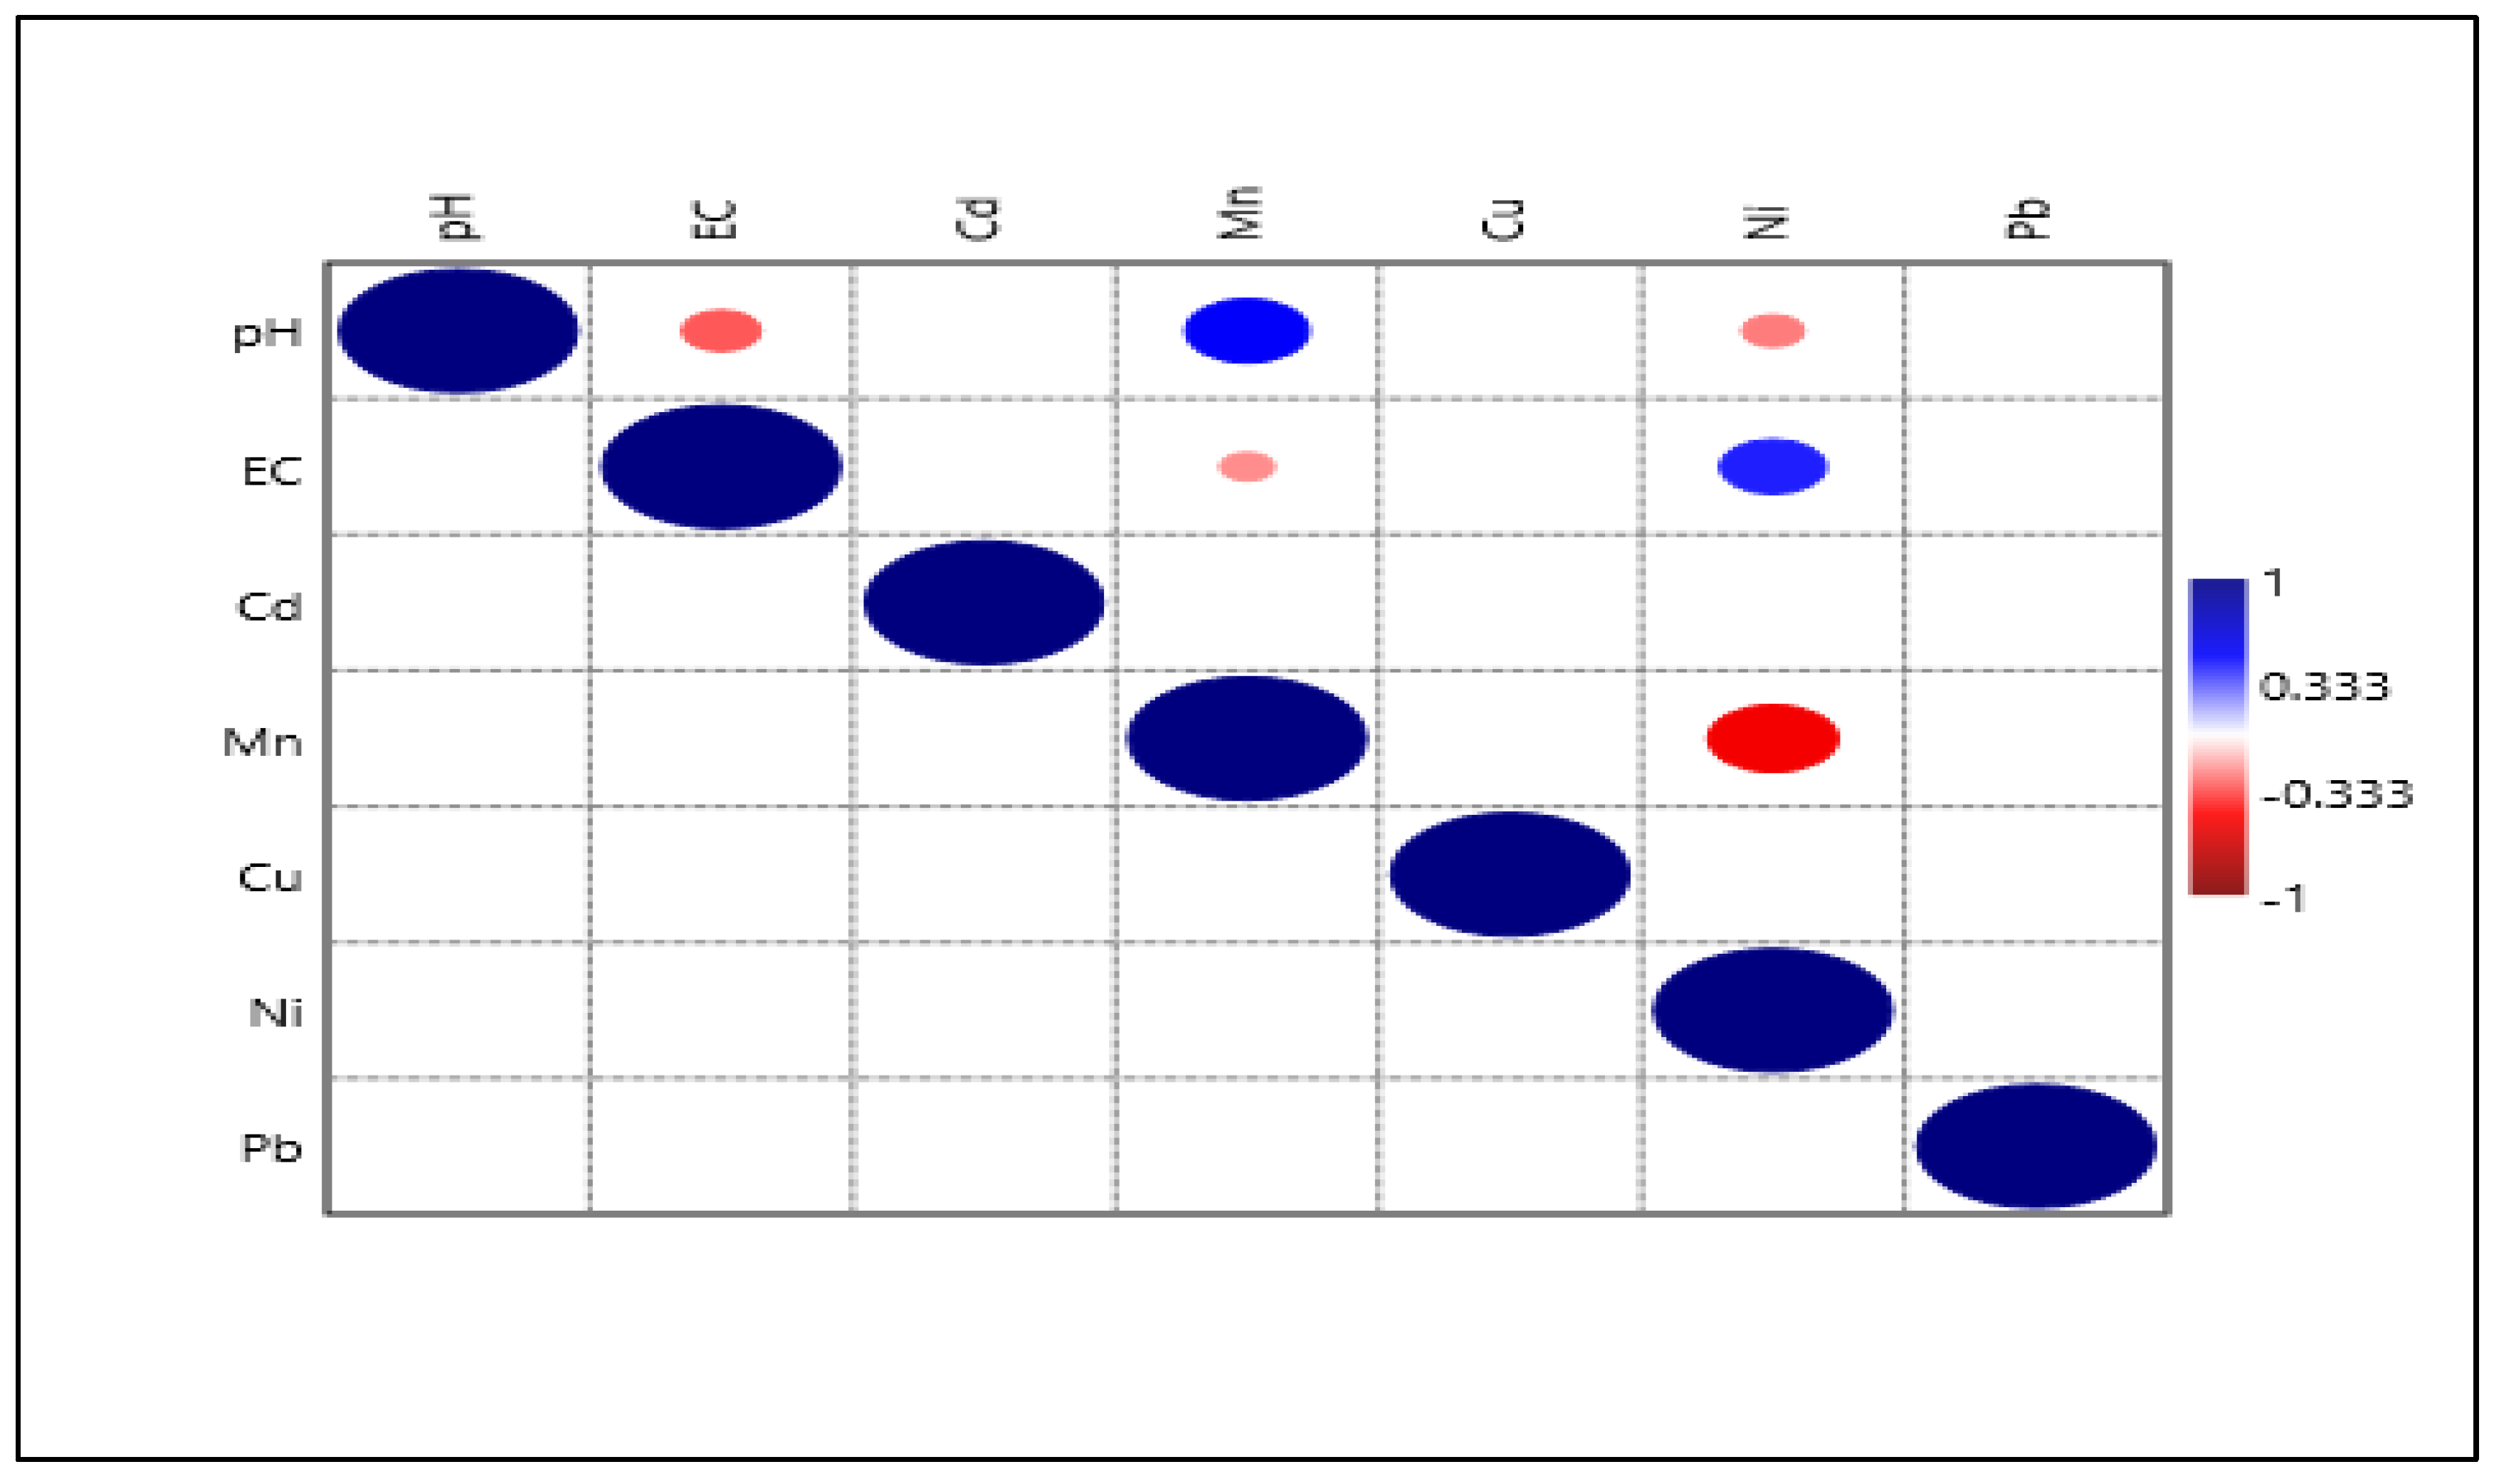
This indicated that the HMs concentrations are closely related to presence of organic matter and other pollutants in ground water of dumpsites [43].
3.4. Principal Component Analysis
The environmental parameters (pH, EC, Mn, and Ni) measured in the dumpsites groundwater, along with their respective principal components analysis results are summarized in Table 3. Each site had two principal components (PC 1 and PC 2) derived from the parameters, with corresponding eigenvalues indicating the amount of variance explained by each PC. The percentages of variance and cumulative variance explained by PC 1 and PC 2 provided insights into the variance and patterns observed in environmental data across the sites. The pH showed positive and negative loadings at all sites. In Abbottabad, the pH depicts negative loading on PC 1 (-0.26) and positive on PC 2 (0.34). Bannu showed the strongest negative loading on PC 1 (-0.50) and minimal positive loading on PC 2 (0.07). Peshawar showed a negative loading on PC1 (-0.37) and a strong positive loading on PC2 (0.80). Differences in pH values of groundwater of the dumpsites indicated the presence of leachate, which resulted in lowering of the pH due to organic acids and decomposition byproducts [38]. In PCA, pH negative loadings on PC 1 and positive loadings on PC 2 reflected varying degrees of leachate infiltration and local lethogenic effects. Next, at all sites, EC showed positive loadings on both PC 1 and PC 2, with varying magnitudes (Abbottabad: PC 1 = 0.70, PC 2 = 0.05; Bannu: PC 1 = 0.55, PC 2 = 0.14; Peshawar: PC 1) = 0.57, pc 2 = 0.28). High electrical conductivity values of groundwater of the dumpsites indicated high ionic concentrations of dissolved salts or pollutants [32,33]. Positive loadings on both PCAs indicated consistent effects of dumpsite leachates on groundwater salinity, influenced by landfill leachate composition and surrounding soil properties. Furthermore, Mn showed consistent loadings across PCs at all sites, indicating common geological sources (negative loading on PC 1, positive on PC 2). Nickel also showed stable positive loads on both PCs. These metals often originate from industrial waste, batteries or electronic equipment and empty ghee wrappers found in landfills [44]. The PCA loadings revealed its presence in groundwater, with consistent positive loadings indicating continued contamination from dumpsite runoff or leachate seepage.
Table 3.
Principal component analysis of dumpsites groundwater of the selected urban areas.
| Parameters | Abbottabad | Bannu | Peshawar | |||
|---|---|---|---|---|---|---|
| PC 1 | PC 2 | PC 1 | PC 2 | PC 1 | PC 2 | |
| pH | -0.26 | 0.34 | -0.50 | 0.07 | -0.37 | 0.80 |
| EC | 0.70 | 0.05 | 0.55 | 0.14 | 0.57 | 0.28 |
| Cd | - | - | - | - | - | - |
| Mn | -0.44 | 0.65 | -0.45 | 0.76 | -0.50 | 0.23 |
| Ni | 0.50 | 0.68 | 0.49 | 0.63 | 0.53 | 0.48 |
| Pb | - | - | - | - | - | - |
| Eigenvalue | 1.95 | 1.09 | 2.81 | 0.62 | 2.53 | 0.86 |
| % of variance | 48.70 | 27.28 | 70.30 | 15.38 | 63.25 | 21.46 |
| % Cumulative variance | 48.70 | 75.98 | 70.30 | 85.68 | 63.25 | 84.71 |
3.5. Ground Water Pollution Assessment
Both single metal based and overall heavy metals pollution assessment of the ground water of the selected dumpsites was shown by Figure 2. The PEI values of all selected HMs were found less than 0.1 (PEI˂ 0.1) indicated low pollution accept Mn and Ni. The PEI values of Mn contamination of groundwater of Abbottabad and Peshawar dumpsites were found less than 0.1 indicated low pollution while at Bannu dumpsite it was found greater than 0.1 (PEI ≥ 0.1) indicated very high level of pollution. Next, the PEI values of Ni were found greater than 0.1 showed very high pollution of the said metal in ground water of all the selected dumpsites [21]. According to the MI values all the selected dumpsites were seriously polluted with heavy metals as all the MI values were found ˃ 6 [23]. The HPI values were found greater 200 (HPI ≥ 200, very high pollution) indicated overall pollution status of groundwater of the selected dumpsites. It was concluded that PI values (PI≥100) of Mn and Ni indicated very high pollution at individual levels while collectively based on HPI values (HPI ≥ 200) the ground water all the selected dumpsites were found highly polluted [24,25]. The Cd values were also found higher than 3 indicated high degree of contamination in all the sleeted dumpsites’ groundwater [45]. Next, the HEI values were found higher than 20 indicated overall high degree of contamination of the ground water of all study areas [26].
Figure 2.
Summarized presentation of all the calculated heavy metal indices for evaluation of ground water quality of all the selected dumpsites.
Figure 2.
Summarized presentation of all the calculated heavy metal indices for evaluation of ground water quality of all the selected dumpsites.
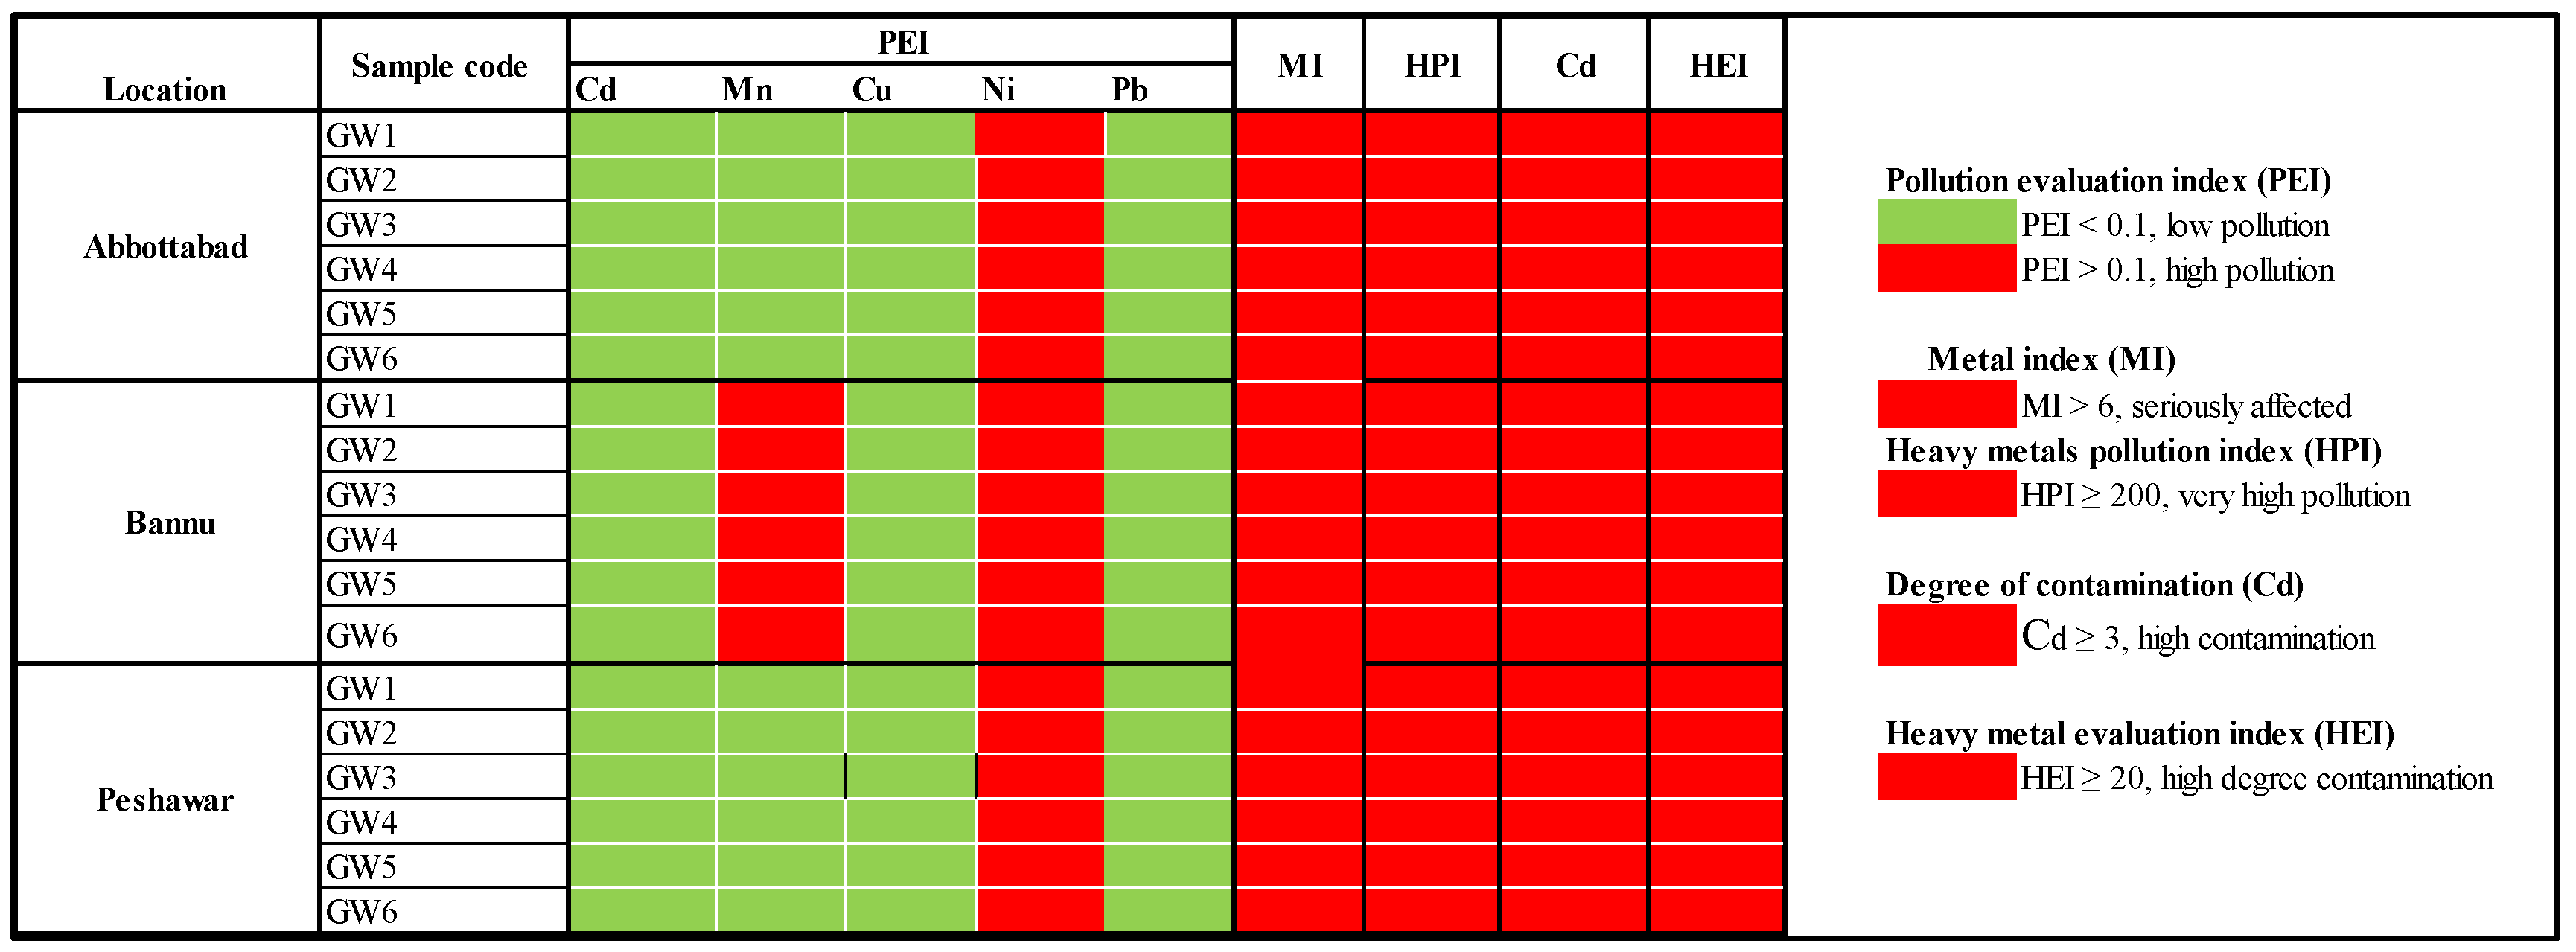
Table 4.
Input parameters for calculating average daily dose (ADD) values.
| Exposure parameters | Symbols | Units | Value |
|---|---|---|---|
| Ingestion rate | IR | L/day | 2.3 |
| Average time | AT | years | 67.9 |
| Exposure duration | ED | years | 67.9 |
| Exposure frequency | EF | days/year | 365 |
| Body weight | BW | kg | 59 |
Table 5.
Heavy metals with oral reference dose (RfD).
| Heavy metals | Oral RfD (mg/kg/day) |
|---|---|
| Cd | 0.000057 |
| Mn | 0.013 |
| Cu | 0.04 |
| Ni | 0.0022 |
| Pb | 0.00035 |
Source: WHO, 2011 [46].
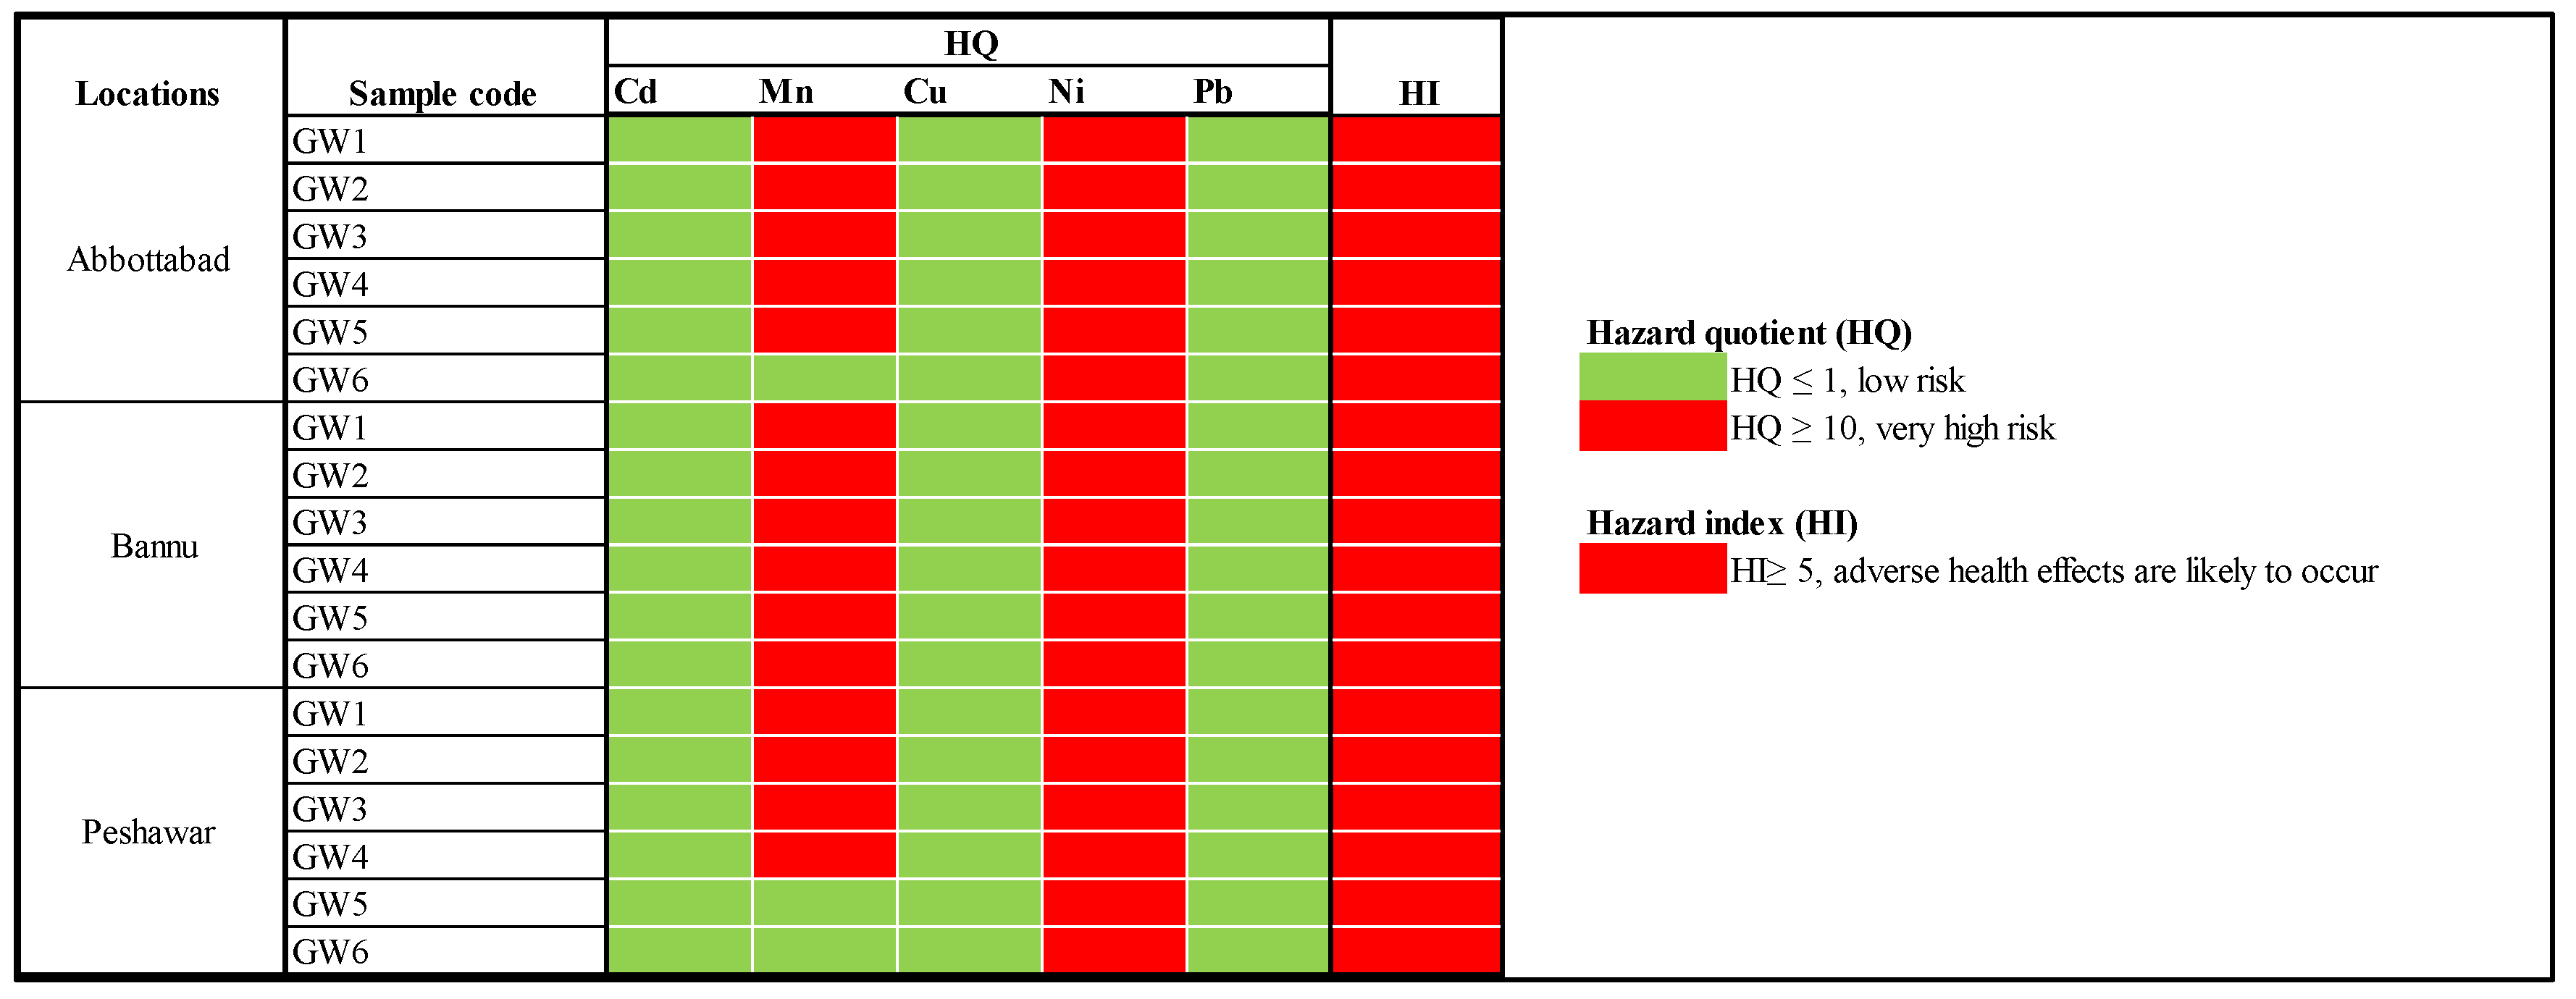
The ADD values for collected groundwater samples were calculated by using the input parameters values given in Table 4. The HQ values for individual heavy metals were calculated by dividing the ADD values by RfD values (as given in Table 5). Cd, Cu and Pb showed low health risk (HQ ≤ 1). While Mn and Pb showed a very high risk (HQ ≥ 10) at almost all samples collected from ground water sources at the selected dumpsites of Abbottabad, Bannu and Peshawar (figure 3). Whereas, the HI values (HI ≥ 5) of all samples collected from the selected dumpsites indicated adverse health effects likely to occur in all selected dumpsites (Figure 3). It was concluded from the HQ and HI calculated values that the ground water of all the dumpsites was highly polluted with Ni thus, posing a high risk of adverse health effects were likely to occur in the selected urban dumpsites. As the urbanization correlates directly with a surge in municipal solid waste (MSW) generation [47]. This increase not only amplifies the health risks associated with inadequate waste management but also underscores the necessity for developing sustainability assessment criteria when choosing MSW technologies [48,49]. Moreover, addressing the issue of illegal MSW dumping demands innovative solutions, such as employing AI techniques like deep learning for enhanced detection capabilities and effective management of MSW [50].
Figure 3.
Summarized presentation of hazard indices of ground water of the selected dumpsites.
4. Conclusion
The selected MSW dumpsites receive mixed wastes (household, market, industrial), undergoing physico-chemical and biological transformation upon dumping. This generates a thick, semiliquid byproduct (leachate) containing heavy metals, impacting surface and groundwater. Fluctuations in pH, EC, and heavy metal concentrations (Cd, Mn, Cu, Ni, Pb) were observed in both surface and groundwater due to MSW composition and environmental conditions at dumpsites. Surface water pH was within permissible limits, but EC, Mn, Ni, and Pb exceeded NEQS limits. Groundwater pH and EC were within limits, but Mn and Ni concentrations surpassed permissible NEQS limits. MI values indicated serious heavy metal pollution (MI > 6), with HPI values (> 200, very high pollution) confirming overall groundwater pollution. HQ values showed low health risk (HQ ≤ 1) for Cd, Cu, Pb, and very high risk (HQ ≥ 10) for Mn and Pb in groundwater samples. HI values (HI ≥ 5) suggested potential adverse health effects at all dumpsites, emphasizing the need for MSW segregation and leachate treatment to mitigate heavy metal pollution. Untreated leachates pose significant environmental and public health risks in the surrounding areas dependent on these water resources.
Acknowledgments
The author is very thankful to the Department of Environmental Science the University of Haripur, KP Pakistan Laboratory for providing the water analysis facilities. The author is also grateful to Water Supply and sanitation Company (WSSC) Peshawar, Bannu and Abbottabad for granting access to the dumpsites.
Conflicts of Interest
The authors declare that this research was conducted without any commercial or financial relationships that can be constructed as potential conflict of interest.
References
- Ishchenko, V. and Vasylkivskyi, I., 2020. Environmental pollution with heavy metals: case study of the household waste. Sustainable production: Novel trends in energy, environment and material systems, pp.161-175.
- Bansal, R. , Hans, M. and Bansal, E., 2023. Impact of Solid Waste Disposal on Inland Water Wetlands: Solid Waste Management. In Handbook of Research on Safe Disposal Methods of Municipal Solid Wastes for a Sustainable Environment (pp. 285-295). IGI Global.
- Ma, S., Zhou, C., Pan, J., Yang, G., Sun, C., Liu, Y., Chen, X. and Zhao, Z., 2022. Leachate from municipal solid waste landfills in a global perspective: Characteristics, influential factors and environmental risks. Journal of Cleaner Production, 333, p.130234.
- Adamcová, D., Radziemska, M., Ridošková, A., Bartoň, S., Pelcová, P., Elbl, J., Kynický, J., Brtnický, M. and Vaverková, M.D., 2017. Environmental assessment of the effects of a municipal landfill on the content and distribution of heavy metals in Tanacetum vulgare L. Chemosphere, 185, pp.1011-1018.
- Balali-Mood, M., Naseri, K., Tahergorabi, Z., Khazdair, M.R. and Sadeghi, M., 2021. Toxic mechanisms of five heavy metals: mercury, lead, chromium, cadmium, and arsenic. Frontiers in pharmacology, 12, p.643972.
- Rahman, Z. and Singh, V.P., 2019. The relative impact of toxic heavy metals (THMs)(arsenic (As), cadmium (Cd), chromium (Cr)(VI), mercury (Hg), and lead (Pb)) on the total environment: an overview. Environmental monitoring and assessment, 191, pp.1-21.
- Bashir, S.M., Niyi, A.J., Ngozi, I.J., Evaristus, O.E. and Onyinyechi, O.E., 2019. Trace Metals Content of Soil around a Municipal Solid Waste Dumpsite in Gombe, Nigeria: Assessing the Ecological and Human Health Impact. Journal of Chemical Health Risks, 9(3).
- Olagunju, E., Badmus, O., Ogunlana, F. and Babalola, M., 2018. Environmental impact assessment of waste dumpsite using integrated geochemical and physico-chemical approach: A case study of Ilokun waste dumpsite, Ado-Ekiti, Southern Nigeria. Civil Engineering Research Journal, 4(2), pp.001-0013.
- Ihedioha, J.N., Ukoha, P.O. and Ekere, N.R., 2017. Ecological and human health risk assessment of heavy metal contamination in soil of a municipal solid waste dump in Uyo, Nigeria. Environmental geochemistry and health, 39, pp.497-515.
- Abasi, O.I., Esom, N.E., Ezekiel, I.O. and Philip, O.N., 2015. Evaluation of pollution status of heavy metals in the groundwater system around open dumpsites in Abakaliki urban, Southeastern Nigeria. African Journal of Environmental Science and Technology, 9(7), pp.600-609.
- Ajah, K.C., Ademiluyi, J. and Nnaji, C.C., 2015. Spatiality, seasonality and ecological risks of heavy metals in the vicinity of a degenerate municipal central dumpsite in Enugu, Nigeria. Journal of Environmental Health Science and Engineering, 13, pp.1-15.
- Gandhi, D., Rudrashetti, A.P. and Rajasekaran, S., 2022. The impact of environmental and occupational exposures of manganese on pulmonary, hepatic, and renal functions. Journal of Applied Toxicology, 42(1), pp.103-129.
- Madden, E.F. and Fowler, B.A., 2000. Mechanisms of nephrotoxicity from metal combinations: a review. Drug and chemical toxicology, 23(1), pp.1-12.
- Khalaf, E.M., Taherian, M., Almalki, S.G., Asban, P., Kareem, A.K., Alhachami, F.R., Almulla, A.F., Romero-Parra, R.M., Jawhar, Z.H., Kiani, F. and Noroozi Manesh, I., 2023. Relationship between exposure to heavy metals on the increased health risk and carcinogenicity of urinary tract (kidney and bladder). Reviews on Environmental Health, (0). [CrossRef]
- Hejazy, M., Koohi, M.K., Bassiri Mohamad Pour, A. and Najafi, D., 2018. Toxicity of manufactured copper nanoparticles-A review. Nanomedicine Research Journal, 3(1), pp.1-9.
- Roychoudhury, S., Nath, S., Massanyi, P., Stawarz, R., Kacaniova, M. and Kolesarova, A., 2016. Copper-induced changes in reproductive functions: in vivo and in vitro effects. Physiological research, 65(1).
- Das, K.K., Das, S.N. and Dhundasi, S.A., 2008. Nickel, its adverse health effects & oxidative stress. Indian journal of medical research, 128(4), pp.412-425.
- Lidsky, T.I. and Schneider, J.S., 2003. Lead neurotoxicity in children: basic mechanisms and clinical correlates. Brain, 126(1), pp.5-19.
- Khyber Pakhtunkhwa environmental protection agency, 2016. Climate change policy. https://epakp.gov.pk/wp-content/uploads/2022/03/KP-Climate-Change-Policy-Approved-2017.pdf.
- Boateng, T.K., Opoku, F. and Akoto, O., 2019. Heavy metal contamination assessment of groundwater quality: a case study of Oti landfill site, Kumasi. Applied water science, 9(2), p.33.
- Prasanna, M.V., Praveena, S.M., Chidambaram, S., Nagarajan, R. and Elayaraja, A., 2012. Evaluation of water quality pollution indices for heavy metal contamination monitoring: a case study from Curtin Lake, Miri City, East Malaysia. Environmental Earth Sciences, 67, pp.1987-2001.
- Tamasi, G. and Cini, R., 2004. Heavy metals in drinking waters from Mount Amiata (Tuscany, Italy). Possible risks from arsenic for public health in the Province of Siena. Science of the total environment, 327(1-3), pp.41-51.
- Lyulko, I., Ambalova, T. and Vasiljeva, T., 2001. To integrated water quality assessment in Latvia. In MTM (monitoring tailor-made) III, proceedings of international workshop on information for sustainable water management, Netherlands (pp. 449-452).
- Prasad B. and Bose J., Evaluation of the heavy metal pollution index for surface and spring water near a limestone mining area of the lower Himalayas. Environmental Geology, 41(1), 183- 188(2001).
- Mohan, S. V.; Nithila, P.; Reddy, S. J., (1996). Estimation of heavy metal in drinking water and development of heavy metal pollution index. J. Environ. Sci. Health A., 31 (2), 283-289.
- Edet AE, Offiong OE (2002) Evaluation of water quality pollution indices for heavy metal contamination monitoring. A study case from Akpabuyo–Odukpani area, Lower Cross River Basin (southeastern Nigeria). GeoJournal 57:295–304.
- Wongsasuluk, P., Chotpantarat, S., Siriwong, W. and Robson, M., 2014. Heavy metal contamination and human health risk assessment in drinking water from shallow groundwater wells in an agricultural area in Ubon Ratchathani province, Thailand. Environmental geochemistry and health, 36, pp.169-182.
- Lim, H.S., Lee, J.S., Chon, H.T. and Sager, M., 2008. Heavy metal contamination and health risk assessment in the vicinity of the abandoned Songcheon Au–Ag mine in Korea. Journal of geochemical exploration, 96(2-3), pp.223-230.
- Aboyeji, O.S. and Eigbokhan, S.F., 2016. Evaluations of groundwater contamination by leachates around Olusosun open dumpsite in Lagos metropolis, southwest Nigeria. Journal of environmental management, 183, pp.333-341. [CrossRef]
- Bhalla, B., Saini, M.S. and Jha, M.K., 2013. Effect of age and seasonal variations on leachate characteristics of municipal solid waste landfill. International Journal of Research in Engineering and Technology, 2(8), pp.223-232.
- Biswas, A.K., Kumar, S., Babu, S.S., Bhattacharyya, J.K. and Chakrabarti, T., 2010. Studies on environmental quality in and around municipal solid waste dumpsite. Resources, Conservation and Recycling, 55(2), pp.129-134.
- Daniel, A.N., Ekeleme, I.K., Onuigbo, C.M., Ikpeazu, V.O. and Obiekezie, S.O., 2021. Review on effect of dumpsite leachate to the environmental and public health implication. GSC Advanced Research and Reviews, 7(2), pp.051-060. [CrossRef]
- Najafi Saleh, H., Valipoor, S., Zarei, A., Yousefi, M., Baghal Asghari, F., Mohammadi, A.A., Amiri, F., Ghalehaskar, S. and Mousavi Khaneghah, A., 2020. Assessment of groundwater quality around municipal solid waste landfill by using Water Quality Index for groundwater resources and multivariate statistical technique: a case study of the landfill site, Qaem Shahr City, Iran. Environmental geochemistry and health, 42, pp.1305-1319.
- Przydatek, G. and Kanownik, W., 2019. Impact of small municipal solid waste landfill on groundwater quality. Environmental Monitoring and Assessment, 191, pp.1-14.
- Ohwoghere-Asuma, O. and Aweto, K.E., 2013. Leachate characterization and assessment of groundwater and surface water qualities near municipal solid waste dump site in Effurun, Delta State, Nigeria. Journal of Environment and earth Science, 3(9), pp.126-134.
- Hussein, M., Yoneda, K., Mohd-Zaki, Z., Amir, A. and Othman, N., 2021. Heavy metals in leachate, impacted soils and natural soils of different landfills in Malaysia: An alarming threat. Chemosphere, 267, p.128874.
- Tahiri, A.A., Laziri, F., Yachaoui, Y., El Allaoui, A. and Tahiri, A.H., 2017. Heavy metals leached from the waste from the landfill in the city of Meknes, and their impact on groundwater. J. Mater. Environ. Sci, 8, pp.1004-1014.
- Chaab, A., Moezzi, A.A., Sayyad, G.A. and Chorom, M., 2016. CASE STUDY: EFFECT OF COMPOST AND HUMIC ACID IN MOBILITY AND CONCENTRATION OF CADMIUM AND CHROMIUM IN SOIL AND PLANT.
- Kubier, A., Wilkin, R.T. and Pichler, T., 2019. Cadmium in soils and groundwater: A review. Applied Geochemistry, 108, p.104388.
- Rékási, M. and Filep, T., 2015. Factors determining Cd, Co, Cr, Cu, Ni, Mn, Pb and Zn mobility in uncontaminated arable and forest surface soils in Hungary. Environmental Earth Sciences, 74, pp.6805-6817.
- Rinklebe, J. and Shaheen, S.M., 2014. Assessing the mobilization of cadmium, lead, and nickel using a seven-step sequential extraction technique in contaminated floodplain soil profiles along the central Elbe River, Germany. Water, Air, & Soil Pollution, 225, pp.1-20.
- Singh, J., Rawat, K.S. and Kumar, A., 2013. Mobility of cadmium in sewage sludge applied soil and its uptake by radish (Raphanus sativus L.) and spinach (Spinacia oleracea L.). Int. J. Agric. Food Sci. Technol, 4(4), pp.291-296.
- Onyekwelu, I.L. and Aghamelu, O.P., 2019. Impact of organic contaminants from dumpsite leachates on natural water sources in the Enugu Metropolis, southeastern Nigeria. Environmental monitoring and assessment, 191(9), p.543.
- Ishchenko, V., 2019. Heavy metals in municipal waste: the content and leaching ability by waste fraction. Journal of Environmental Science and Health, Part A, 54(14), pp.1448-1456.
- Backman, B., Bodiš, D., Lahermo, P., Rapant, S. and Tarvainen, T., 1998. Application of a groundwater contamination index in Finland and Slovakia. Environmental geology, 36, pp.55-64.
- WHO (2011) Guidelines for drinking-water quality (4th ed.). Geneva, Switzerland.
- Rehman, F. and Khan, A., 2022. Environmental impacts of urbanization encroachment in the lowlands of khyber pakhtunkhwa, Pakistan. Sustainability, 14(19), p.11959.
- Akmal, T. and Jamil, F., 2021. Assessing health damages from improper disposal of solid waste in metropolitan Islamabad–Rawalpindi, Pakistan. Sustainability, 13(5), p.2717.
- Le, P.G., Le, H.A., Dinh, X.T. and Nguyen, K.L.P., 2023. Development of sustainability assessment criteria in selection of municipal solid waste treatment technology in developing countries: a case of Ho Chi Minh City, Vietnam. Sustainability, 15(10), p.7917.
- Shahab, S. and Anjum, M., 2022. Solid waste management scenario in india and illegal dump detection using deep learning: an AI approach towards the sustainable waste management. Sustainability, 14(23), p.15896.
Disclaimer/Publisher’s Note: The statements, opinions and data contained in all publications are solely those of the individual author(s) and contributor(s) and not of MDPI and/or the editor(s). MDPI and/or the editor(s) disclaim responsibility for any injury to people or property resulting from any ideas, methods, instructions or products referred to in the content. |
© 2024 by the authors. Licensee MDPI, Basel, Switzerland. This article is an open access article distributed under the terms and conditions of the Creative Commons Attribution (CC BY) license (http://creativecommons.org/licenses/by/4.0/).
Copyright: This open access article is published under a Creative Commons CC BY 4.0 license, which permit the free download, distribution, and reuse, provided that the author and preprint are cited in any reuse.


