
Submitted:
12 July 2024
Posted:
14 July 2024
You are already at the latest version
Abstract
Popular geo-computer vision works make use of aerial imager with sizes ranging from 64 × 64 to 1024 × 1024 pixels without any overlap, although the learning process of deep learning models can be affected by the reduced semantic context or the lack of information near image boundaries. In this work, the impact of three image sizes (256 × 256, 512 × 512, and 1024 × 1024 pixels) and two image overlap levels (no overlap and 12.5% overlap) on the performance of road classification models was statistically evaluated. For this, two convolutional neural networks used in various tasks of geospatial object extraction were trained (using the same hyperparameters) on a large dataset (containing aerial image data covering 8650 km² of the Spanish territory that was labelled with binary road information) under twelve different scenarios, each scenario featuring a different combination of tile size and overlap. To assess their generalisation capacity, the performance of all resulting models was evaluated on a data from novel areas covering approximately 825 km². The performance metrics obtained were analysed using appropriate descriptive and inferential statistical techniques to evaluate the impact of the performance at distinct levels of the fixed factors (tile size, tile overlap, neural network architecture). Statistical tests were applied to study the main and interaction effects of the fixed factors on the performance. A significance level of 0.05 was applied to all the null hypothesis tests. The results were highly significant for the main effects (p-values lower than 0.001), while the two-way and three-way interaction effects among them had different levels of significance. The results indicate that the training of road classification models on images with a higher tile size (more semantic context) and tile overlap (additional border context and continuity) significantly impacts their performance. The best model was trained on a dataset featuring tiles with a size of 1024 × 1024 pixels and a 12.5% overlap and achieved a loss value of 0.0984, an F1 score of 0.8728, and an ROC-AUC score of 0.9766, together with an error rate of 3.5% on the test set.
Keywords:
road classification
; aerial orthoimagery
; deep learning
; image size
; image overlap
; convolutional neural networks
; statistical performance evaluation
1. Introduction
Data intensive artificial intelligence models have proven their potential in research and professional workflows related to computer vision for geospatial feature detection and extraction. Here, aerial image data plays a fundamental role, but due to computational requirements, researchers employ the division of the available imagery into smaller image tiles. Some of the most popular works in the field use tile data with sizes of 64 × 64, 128 × 128, 256 × 256, 512 × 512, or 1024 × 1024 pixels. The tile size (also referred as “image size/ resolution” in some parts of the manuscript to represent the dimensions of an image) represents the pixel count in an image, and it is important to note that higher tile size contain more information scene information and provide more semantic context. Another key component is the tile overlap, which represents the amount (expressed in percentages), by which an image tile includes the area of an adjacent tile.
It can be considered that higher tile sizes and overlap levels could enhance the learning process of deep learning (DL) models. However, this aspect has not been properly explored, although additional scene information and continuity have the potential to increase the performance of the trained models. The overlap could be considered as a natural data augmentation technique, as it exposes the model to more aspects of the orthoimage tiles, while the additional scene information from higher tile sizes could impact the generalisation capacity of DL implementations by providing more learning context. This could be beneficial, especially for road classification models (a continuous geospatial element that is complex in nature), as they can learn from slightly different perspectives of the area, potentially improving their ability to generalise.
Therefore, the objective of this work is to study the effects of the tile size and overlap levels on the performance prediction of road classification models on novel test data and to identify the optimal combination of size and overlap that would enable a higher generalisation performance. The authors believe that the study could provide relevant insights applicable to the experimental designs of subsequent geospatial studies as the identification of optimal tile size and tile overlap level can contribute to achieving higher DL performance with a lower number of experiments, leading to a decrease in energy consumption required for training. The starting premise of the study is, “For the classification of continuous geospatial elements in aerial imagery with DL techniques, models trained on data with higher tile size and overlap achieve a higher generalisation capacity”. The study involves the binary classification of aerial orthophotos divided into image tiles labelled ‘Road’ or ‘No Road (Background)’ labels using deep learning implementations.
The road classification task involves classifying aerial imagery divided in tiles into ‘Road’ or ‘No Road’ classes (supervised, binary classification task). In binary approaches based on supervised learning, independent samples of are observed. The feature exists in an abstract space , while the labels (representing “Road”/ “No_Road”, in this case). This rule (called classifier), built to predict given , is a function and a classifier with a low classification error, is desired. Since , follows a Bernoulli distribution, but assumptions for the conditional distribution of given cannot be made.
However, the regression function of onto can be written as, where . , where is the noise responsible for the fact that may not contain enough information to predict perfectly. The presence of this noise means that the classification error cannot be driven to zero, regardless of what classifier is used. However, if , it can be considered that contains no information about , and that, if “1” is more likely to be the correct label. A Bayes classifier, , can be used as a function defined by the rule in Equation 1.
This rule, although optimal, cannot be computed because the regression function is not known. Instead, the algorithm has access to the input data which contains information about and, thus, information about . The discriminative approach described in [1] states that assumptions on what image predictors are likely to perform correctly cannot be made—this allows the elimination of image classifiers that do not generalise well. The measure of performance for any classifier is its classification error, and it is expected that with enough observations, the excess risk, , of a classifier , will approach zero (by getting as close as possible to ). In other words, the classification error can be driven towards zero, as the size of the training dataset increases () (if is too small, it is unlikely that a classifier with a performance close to that of the Bayes classifier will be found). In this way, it is expected to find a classifier that performs well in predicting the classes, even though a finite number of observations is available (and thus, a partial knowledge of the distribution ) (the mathematical description of the task was adapted from [2]).
Supervised learning tasks also enable the application of transfer learning techniques to reuse the weights resulted from the training of neural networks on large datasets (such as ImageNet Large Scale Visual Recognition Challenge, or ILSVRC [3]). Transfer learning allows a model to start from pre-learned weights (instead of random weight initialisation) and to make use of the learned feature maps (in computer vision applications, earlier layers extract generic features such as edges, colours, textures, while later layers contain more abstract features) [4].
A large dataset with high variability is fundamental for obtaining DL models that have a high generalisation capacity. The use of a high quality dataset is also important for the statistical analysis of their performance. For this reason, the SROADEX data [5] (containing binary road information covering approximately 8650 km2 of the Spanish territory) was used to generate new datasets featuring tiles with sizes of 256 × 256, 512 × 512, or 1024 × 1024 pixels and 0% or 12.5% overlap. The DL models were trained under twelve scenarios based on the combination of different tile size and overlap levels and Convolutional Neural Network (CNN) architectures. Except for these factors, the training of the road classification models was carried out under the same conditions (same hyperparameters, and data augmentation and transfer learning parameters), so that differences in performance metrics are mainly caused by the considered factors. The experiments were repeated three times to reduce the randomness of convergence associated with DL models and enable the statistical analysis, as ANOVA is valid with as little as three samples (a higher repetitions would have resulted in unrealistic training times).
To evaluate the generalisation capability of the models, a test set containing new tiles from a single orthoimage from a north-western region of Spain (Galicia, unseen during training and validation) was generated. The test area covers approximately 825 km2 and can be considered highly representative of the Spanish geography. Afterwards, multiple descriptive, inferential, and main and interaction effect tests were applied to statistically analyse the performance and assess the impact of the tile size, tile overlap, and convolutional neural network (CNN) architecture on the computed metrics. The results show that a higher tile size and overlap enable the development of models that achieve improved road classification performance on unseen data. The findings could guide future work in optimising the mentioned aspects for better model performance.
The main contributions are summarised as follows.
- The impact of the tile size and overlap levels on the binary classification of roads was studied on a very large-scale dataset containing aerial imagery covering approximately 8650 km2 of the Spanish territory. Two popular CNN models were trained on datasets with different combinations of tile sizes (256 × 256, 512 × 512, or 1024 × 1024 pixels) and tile overlaps (0% and 12.5%) to isolate their effect on performance. The evaluation was later carried out on a new orthoimage of approximately 825 km2 containing novel data.
- An in-depth descriptive and inferential statistical analysis and evaluation was performed next. The main effects of tile size, tile overlap and CNN architecture on the performance metrics obtained on testing data, were found to be highly significant (with computed p-values lower than 0.001). Their joint two-way and three-way interaction effects on the performance had different levels of significance and varied from highly significant to non-significant.
- Additional perspectives on the impact of these factors on the performance are provided through an extensive discussion, where additional insights and limitations are described and recommendations for similar geo-studies are proposed.
The rest of the manuscript is organised as follows. Section 2 presents similar studies that are found in the specialized literature. Section 3 describes the data used for training and evaluating the DL models. Section 4 details the training method applied. In Section 5, the performance metrics on unseen data are reported and statistically analysed. The results are extensively discussed in Section 6. Finally, Section 7 presents the conclusions of the study.
2. Related Works
Given the expected rise of autonomous vehicles and their need for higher definition road cartography and better road decision support system, road classification is becoming one of the more important geo-computer vision applications for public agencies. Nonetheless, roads, as continuous geospatial elements, present several challenges related to their different spectral signatures caused by varied materials used for pavement, the high variance of road types (highways, secondary roads, urban road, etc.), the absence of clear markings, and differences in widths, that make their classification in aerial imagery difficult. Furthermore, the analysis of remotely sensed images also presents associated challenges such as the presence of occlusions or shadows in the scenes. Therefore, the task of road classification can be considered complex.
Recent work on this topic takes the deep learning approach to model the input-output relations of the data and obtain a more complex classification function capable of describing road-specific features and achieving a higher generalisation capacity (indicated by a high performance on testing data that was not modelled during training).
In the specialized literature, authors such as Reina et al. [6] and Lee et al. [7], among others, identify the need to tile large scenes from medical or remote sensing images due to the memory limitations of GPUs (mainly for semantic segmentation tasks). It was observed that the tiling procedure introduces artifacts in the feature map learning of the models, and the analysis of optimal tile sizes becomes necessary.
After evaluating ten tiles size sizes varying from 296 × 296 to 10,000 × 10,000 pixels, Lee et al. [7] conclude that the best tile sizes for the lung cancer detection between 500 and 1000. It is important to note that the number of images used in medical imaging rarely surpasses few dozens and training models like VGGNet [8] (featuring tens of millions of parameters) can be considered a strong indicator of overfitting (where DL models “memorize” the noise in the training data to achieve a higher performance). A higher occurrence of prediction errors near the borders of the tiles was also identified in relevant geo-studies such as [9], or [10]). For these reasons, and considering the size of the dataset, we considered appropriate to evaluate three popular tile sizes found in relevant geo-studies (namely, 256× 256, 512 × 512 and 1024× 1024 pixels).
Ünel et al. [11] recognised the benefit of image tiling in surveillance applications and proposed a PeleeNet model for real-time detection of pedestrians and vehicles from high-resolution imagery. Similarly, Akyon et al. [12] proposed the Slicing Aided Hyper Inference (SAHI) framework for surveillance applications to detect small objects and objects that are far away in the scene.
In addition, relevant studies in the medical field [13] have also noted the convenience of having overlap between tiles in the training dataset. Some authors consider that an optimal overlap percentage of 50% [14] can be applied as a data augmentation technique to improve the performance of the models. Nonetheless, we only selected the 12.5% level of overlap for this study because it ensures that information near tile edges can be correctly processed during training and avoids lower data variability that would be introduced by generating tiles with higher overlap (possibly leading to a biased model, as it would be exposed to many similar data points). In addition, a smaller level of overlap also avoids the processing of an excessive amount of information resulting from higher overlap levels.
Recently, Abrahams et al. [15] proposed a data augmentation strategy based on random rotations and reflections of the training tiles (without overlap between tiles) called “Flip-n-Slide” to perform semantic segmentation of images where the orientation of the objects in the scenes is important. These studies indicate the relevance of this work in the current geo-computer vision landscape.
Since our DL task is to identify parts of large high-resolution aerial images that contain road elements (at country level, for a subsequent semantic segmentation of the tiles that contain roads), the purpose of our research is to study the optimal tile size for division (tiling) and tile overlap strategy. We consider this aspect to be a topic of great interest for current geo-studies and projects.
As no additional references relevant to our study were identified, articles related to the use of CNNs on image data for road applications that were published after 2018 in peer-reviewed scientific journals will be described and commented on next. In this regard, one of the most discussed areas in the literature is the detection of road defects for safety and maintenance purposes. Chun and Ryu [16] proposed the use of CNNs and autoencoders to classify oblique images acquired by a circulating vehicle and identify asphalt defects that can cause accidents. Semi-supervised methods were applied to create a novel dataset and data augmentation techniques were used to train the models that demonstrated their effectiveness on 450 test datasets. Maeda et al. [17] identified the lack of datasets of road deficiencies that would allow road managers to be aware of the defects and evaluate their state for use or repair without compromising safety. The authors generated a dataset of approximately 9000 images and labelled approximately 14,000 instances with eight types of defects. Object detection models were trained afterward to locate the defects in images and additional tests were performed in various scenarios in Japan. Liang et al. [18] proposed the Lightweight Attentional Convolutional Neural Network to detect road damage in real time on vehicles.
Rajendran et al. [19] proposed the use of a CNN to identify potholes and road cracks in images taken from a camera connected to a Universal Serial Bus (USB) to create an IoT system that informs the authorities responsible for such defects (so further actions or repair planning can be taken). Zhang et al. [20] benchmarked different CNN models based on AlexNet, ResNet, SqueezeNet, or ConvNet to detect faults and compare their performance. Fu et al. [21] proposed a CNN architecture (StairNet) and compared different trained network models based on EfficientNet, GoogLeNet, VGG, ResNet, and MobileNet to identify defects in the concrete pavement. For validation, a platform to run the algorithms was created and a proof of concept on the campus of Nanjing University was developed. Finally, Guzmán-Torres et al. [22] proposed an improvement in the VGGNet architecture to classify defects in road asphalt. The training was carried out on the dataset containing 1198 image samples that they generated (HWTBench2023). Transfer learning was used during training to achieve accuracy and F1 score metrics of over 89%.
The works of He et al. [23], Fakhri and Shah-Hosseini [24], Zhu et al. [25] and Jiang Y. [26] use CNNs for the detection of roads from satellite or very high resolution images. In the first article, the authors seek to optimise the hyperparameters of the models. In the second work, in addition to the RGB (Red, Green, Blue) images, prediction data obtained from a previous binary road classification with Random Forest is also incorporated as input for the CNN models to achieve F1 score metrics of 92% on the Massachusetts dataset. In the third paper, qualitative improvements in the results are obtained by replacing the ReLU function in the fully connected network (FCN) with a Maximum Feature Mapping (MFM) function, so that the suppression of a neuron is not done by threshold, but by a competitive relation. In the fourth case, the authors propose a post-processing of the results of the trained CNN network based on a Wavelet filter to eliminate the noise of the areas without roads, obtaining as a result a binary “Road/ No road” classification.
There are also studies aimed at identifying road intersections. Higuchi and Fujimoto [27] implemented a system that acquires information with a two-dimensional laser range finder (2D LRF), allowing the determination of the movement direction of the autonomous navigating robot to detect road intersections. Eltaher et al. [28] generated a novel dataset by labelling approximately 7550 road intersections in satellite images and trained the EfficientDet object detection model to obtain the centre of the intersections with average accuracy and recall levels of 82.8% and 76.5%, respectively.
Many existing studies focus on differentiating the types of road surfaces. Dewangan and Sahu [29] used computer vision techniques to classify the road surface into five classes (curvy, dry, ice, rough, and wet) and obtained accuracies of over 99.9% on the Oxford RobotCar. Lee et al. [30] proposed a model based on signal processing using a continuous wavelet transform, acoustic sensor information, and a CNN to differentiate thirteen distinct types of pavements in real time. The model was trained on a novel dataset containing seven types of samples (with around 4000 images per category) and delivered an accuracy superior to 95%.
Another important task is the processing of aerial imagery with road information to assign a binary label [31] or a continuous value [32] to the tile. Cira et al. [33] proposed two frameworks based on CNNs to classify image tiles of size 256 × 256 pixels that facilitate the discrimination of image regions where no roads are present to avoid applying semantic segmentation to image tiles when roads are not expected. de la Fuente Castillo et al. [34] proposed the use of grammar-guided genetic programming to obtain new CNN networks for binary classification of image tiles that achieve performance metrics similar to those achieved by other state-of-the-art models. In [32], CNNs were trained to process aerial tiles with road information to predict the orientation of straight arrows on marked road pavement.
In the literature review, it was noted that most existing works focus on processing reduced datasets that cover smaller areas and generally feature ideal scenes (where road elements are grouped into clearly defined regions [35]). Nonetheless, the use of reduced dataset may not be suitable if models capable of large-scale classification are pursued (as also discussed in [36]). For this reason, data from the SROADEX dataset [5] (containing orthoimagery covering approximately 8650 km2 of the Spanish territory that was labelled with road information) was used in this study. This adds real world complexity to the road classification task, to avoid focusing on ideal study scenes and to achieve DL models with a high generalisation capacity.
3. Data
The data used for this study are RGB aerial orthoimages from the Spanish regions covered by the SROADEX dataset [5], binary labelled with the “Road” and “No road” classes. More details regarding the procedure applied for labelling the data and tile samples can be found in the SROADEX data paper [5]. As mentioned above, the orthoimages forming the SROADEX dataset cover approximately 8650 km2 of the Spanish territory.
The digital images within SROADEX have a spatial resolution of 0.5 m and are produced and openly provided by the National Geographical Institute of Spain through the National Plan of Aerial Orthophotography product (Spanish: “Plan Nacional de Ortofotografía Áerea”, or PNOA [37]). They are produced by Spanish public agencies that acquired the imagery in photogrammetric flights performed under optimal meteorological conditions. The resulting imagery was orthorectified to remove geometric distortions, radiometrically corrected to balance the histograms, and topographically corrected using terrestrial coordinates of representative ground points using the same standardised procedure defined by their producers.
Taking advantage of this labelled information, the full orthoimages were divided into datasets featuring tiles with (1) a size of 256 × 256 pixels and 0% overlap, (2) a size of 256 × 256 pixels and 12.5% overlap, (3) a size of 512 × 512 pixels and 0% overlap, (4) a size of 512 × 512 pixels and 12.5% overlap, (5) a size of 1024 × 1024 pixels and 0% overlap, and (6) a size of 1024 × 1024 pixels and 12.5% overlap. The tiling strategy applied involved a sequential division of the full orthoimage with the different combinations of tile overlap and tile size selected. To ensure a correct training, tiles with road elements shorter than 25 m were deleted (in the case of tiles of 512 × 512 pixels, this means that the sets only contain tiles where roads occupy at least 50 pixels; while in the case of 1024 × 1024 pixels, they only contain tiles where roads occupy more than 21 pixels). Afterwards, each combination of tile size and tile overlap was split into training and validation sets by applying the division criterion of 95:5%. In this way, six training and six validation sets, corresponding to the combination of each tile size and tile overlap, were generated.
The test set is formed by approximately 825 km2 of binary road data from four novel regions that were divided into image tiles with 0% overlap at the three tile sizes considered. The test areas were selected because they contain diverse types of representative Spain scenery and enable the statistical validity of the tests applied to objectively evaluate the generalisation capacity of the models. Figure 1 shows the territorial distribution of the train and validation sets (SROADEX data, signalled with blue rectangles) and the test area (signalled with orange rectangles), while Table 1 shows the number of images and pixels used for training, validation, and testing sets across different tile sizes and overlaps considered.
In Table 1, it can be observed that the percentages of tiles containing road increases as the tile size increases, to the detriment of tiles that do not contain road elements. For instance, at a tile size of 256 × 256 pixels, the dataset is balanced in terms of the two binary classes (approximately 47.5% of data is labelled with the positive class and 52.5% is labelled with the negative class), whereas, at a tile size of 1024 × 1024 pixels, the data labelled with the “Road” class represents approximative 90% of the samples. This is to be expected, given that, as the scene area increases, the probability of a tile not containing a road decreases. As a result, the class imbalance between the “Road” and “No Road” classes increases as the tile size increases. This implies that the training procedure must incorporate balancing techniques to ensure a correct training and prevent models that are biased towards the positive class.
Regarding the normality of the data, given the size of the sample data (approximately 16 billion pixels × 3 RGB channels, organized in approximately 527,000 images in SROADEX), and following the Central Limit Theorem [38] that states that a large, independent sample variable approximates to a normal distribution as a sample size becomes larges, regardless of the actual distribution shape of the population, it was assumed that the training and testing data follows a normal distribution. Therefore, given the large dataset size, instead of conducting an empirical test of normality, which would be computationally and practically challenging, we proceeded with the analysis based on the assumption of normality explained, which is a common practice in such scenarios.
4. Training Method
To carry out a comparative study that allows understanding the effect on the performance of different neural network architectures trained for the same task, two classification models, VGG-v1 and VGG-v2 (proposed in Table 1 of [39]), that have demonstrated their appropriateness in relevant works related to geospatial objects classification [10,40], were selected for training. Briefly, the models are based on the convolutional base of VGG16 [8], followed by a global average pooling layer, two dense layers (with [512, 512] units for VGG-v1 and [3072, 3072] units for VGG-v2) with ReLU [41] activations, a dropout layer with a ratio of 0.5 for regularisation, together with a final dense layer with one unit and sigmoid activation that enables the binary classification.
Table 2 shows that the road classification models were trained under twelve different scenarios, each with a different combination of CNN architecture (VGG-v1 and VGG-v2), size (256 × 256 pixels, 512 × 512 pixels, and 1024 × 1024 pixels), and overlap (0% and 12.5%). This approach enables a detailed understanding of how these factors interact and impact the performance of the trained models and which combinations deliver the best results.
To reduce the sources of uncertainty, the standard procedure for training DL models for classification was applied. In this regard, the pixel values of the orthoimage tiles from the training and validation sets were normalised (rescaled from the range [0, 255] to the range [0, 1]) to avoid calculations on large numbers. Afterwards, in-memory data augmentation techniques with small parameter values of up to 5-10% were applied to the training images in the form of random rotations, height and width shifts, or zooming inside tiles (if empty pixels resulted from these operations, they will be assigned with the pixel values from the nearest boundary pixel). Furthermore, random vertical and horizontal flips were applied to expose the convolutional models to more data aspects and ensure the control of the overfitting behaviour specific to models with large number of trainable parameters. Given the structured approach to data collection, instead of a random weight initialisation approach, the weights were initialised by applying transfer learning from ILSVRC [3]. This enables the re-use of the features on the large-scale data for the road classification task.
In Section 3, it was discussed that the probability of a tile not containing a road decreases as the tile size increases (there is an inherently higher probability that a larger area contains at least one road), which resulted in higher class imbalance in favour of the “Road” class. To tackle the class imbalance observed in Table 1 and the associated overfitting behaviour, a weight matrix was applied to penalise the road classification model when wrongly predicting the over-represented class. The weight matrix contains class weights that were computed with Equation 2.
In Equation 2, represents the weight for class , represents the total number of samples in the training set, is the number of classes (in this case, ), while the term represents the number of samples in class . The formula ensures that the underrepresented “No_Road” class will have a higher influence on the training evolution to balance the overrepresentation of the “Road” class at higher tile sizes.
The loss function is the binary cross-entropy and can be defined with the formula defined in Equation 3.
In the context of binary road classification, the loss from Equation 3 measures the “closeness” between the expected “Road” and “No Road” labels and the predictions delivered by the road classification model; represents the number of available samples in the training scenario, is the true label of the -th sample ( is either 0 or 1), and presents the predicted probability of the -th sample being in the positive class (a value between 0 and 1 that represent the model’s confidence that the label of the -th sample is “Road”; a decision limit of 0.5 is applied to infer the positive or negative class label). The dot symbol “” indicates an element-wise multiplication between the corresponding vectors.
The resulting weighted loss function is minimised with the Adam optimiser [42] (with a learning rate of 0.001) by applying the stochastic gradient descent approach (as the selected loss function is differentiable), the loss for each sample being scaled by the class weight defined earlier. Intuitively, a model that predicts the expected labels will achieve a low loss value.
In the experimental design, it was established that the DL model configurations associated with each training scenarios from Table 2 will be trained in three different iterations for thirty epochs over the entire dataset. It is important to note that although higher sizes provide more scene information, they also require more computational resources and, consequently, a smaller batch size. The batch size selected for each training scenario was the maximum allowed by the available graphics card. All training experiments were carried out on a Linux server with the Ubuntu 22.04 operating system that featured a dedicated NVIDIA V100-SXM2 graphical card with 16 gigabytes of video random access memory (VRAM). As for the software, the training and evaluation scripts were built with Keras [43] and TensorFlow [44], together with their required library dependencies. The code featuring the training and evaluation of the DL implementations, the test data, and the resulting road classification models are available in the Zenodo repository [45] and are distributed under a CC-BY 4.0 license.
5. Results
The performance metrics results of the road classification models trained under the scenarios described in Table 2, are reported in Appendix A. The performance is expressed in terms of loss, accuracy, ROC-AUC score, and precision, recall, and F1 score for the training, validation, and test sets, for each of the three training iterations carried out. The decision threshold for the probability predicted by the model was 0.5 (as discussed in the “Introduction”)—a predicted probability higher or equal to 0.5 would be considered a positive sample, while tiles with a predicted value lower than the threshold are assigned to the negative class.
The loss is calculated with Equation 3. Accuracy is computed using the confusion matrix of the model (expressed in terms of true positive (TP), true negative (TN), false positive (FP) and false negative (FN) predictions) and measures the proportion of correctly predicted samples over the total set size (Equation 4). The precision (proportion of TP among the positive predictions of the model, Equation 5), recall (number of TP among the actual number of positive samples, Equation 6) and F1 score (harmonic mean of precision and recall, Equation 7) metrics offer a more comprehensive perspective of the misclassified cases compared to accuracy, as they consider both FP and FN predictions. The ROC-AUC score is an indicate of the capacity of a model in distinguishing between the positive and negative classes and measures the area under the receiver operating characteristic curve (a plot of the TP rate against the FP rate at various thresholds from (0,0) to (1,1)) by using the prediction scores and the true labels.
The metrics on the training set range from 0.0719 to 0.2270 in the case of the loss, from 0.9072 to 0.9715 in terms of accuracy, from 0.8738 to 0.9190, 0.9073 to 0.9650, and 0.8223 to 0.9137 for the F1 score, precision, and recall metrics, respectively, and from 0.9703 to 0.9909 in the case of the ROC-AUC score. The metrics on the validation set range from 0.0878 to 0.2574 in terms of loss, from 0.8959 to 0.9673 for accuracy, from 0.8475 to 0.9030, 0.8930 to 0.9650, and 0.7939 to 0.9021 for the F1 score, precision, and recall, respectively, and from 0.9628 to 0.9853 in terms of the ROC-AUC score. The metrics on the test set range from 0.0947 to 0.4951 in terms of loss, from 0.8222 to 0.9763 in terms of accuracy, from 0.7924 to 0.8862, 0.8051 to 0.9764, and 0.7662 to 0.8360 in the case of the F1 score, precision, and recall, respectively, with the AUC-ROC score ranging from 0.8939 to 0.9840.
The values of these metrics also vary across different training scenarios and their experiment iterations. For instance, the validation loss in training scenario 3 ranges from 0.1978 to 0.2152, while for scenario 6 it ranges from 0.0941 to 0.1035. Other examples are the training F1 scores from scenario 8 (ranging from 0.9104 to 0.9133) and scenario 9 (with values ranging from 0.9051 to 0.9134), or the test ROC-AUC scores that range from 0.9700 to 0.9706 in training scenario 6 and from 0.9356 to 0.9517 in the case of training scenario 5.
Therefore, the values obtained present important differences across the training scenarios considered and across the experiment iterations and suggest that the trained road classification models were learning at different rates, probably due to the difference in the model architectures and the tile overlap and tile size levels considered (given that the variability of the training and test sets is similar and that the test set covers the same area). This indicated that more in-depth analysis is needed to better understand the performance metrics differences. This study is centred on statistically studying the performance metrics from Appendix A and uses the metrics obtained by the models on unseen, test data to identify the factors that have the greatest effect on the generalisation capacity of the road classification models. The statistical analysis was performed with the SPSS software [46].
5.1. Mean Performance on Testing Data Grouped by Training Scenarios
First, to explore the relationship between the performance metrics and the training IDs, detailed descriptive statistics were obtained (including means and their standards deviations) and the statistical analysis of variance (ANOVA) was applied to analyse the differences between group means. The dependent variables are the performance metrics on the test set (loss, accuracy, F1 score, precision, recall and ROC-AUC score), while the training scenarios act as fixed factors. The objective was to verify if statistical differences are present between metrics grouped by training scenario ID (N=3 samples within each training scenario).
The results are presented in Table 3 in terms of mean performance metrics and their standard deviations, and the ANOVA F1-statistics and their p-values. An F-statistic is the result of the ANOVA test applied to verify if the means between two populations are significantly different and represents the ratio of the variance of the means (between groups) over the mean of the variances (within groups). The p-value associated indicates the probability of the variance between the mean groups is random, with a p-value of lower than 0.05 being considered statistically significant. The Eta (η) and Eta squared (η2) measures of association are also provided. Eta (η) is a correlation ratio that measures the degree between a categorical independent variable and a continuous dependent variable, ranging from 0 (no association) to 1 (perfect association). Eta Squared (η2) represents an ANOVA measure of effect size that represents the proportion of the total variance in the dependent variable that is associated with the groups defined by the independent variable.
In Table 3, it can be observed that all corresponding p-values of the F-statistic are smaller than 0.001 and indicate statistically significant difference between the loss, accuracy, F1 score, precision, recall and ROC-AUC score obtained by the trained models and the different training scenario IDs. These values imply that, for all the studied performance metrics, the variation between groups (different training IDs) is much larger than the variation within groups (same training ID) and suggest that the training ID has a significant effect on the performance of the road classification model across all the metrics considered.
Regarding the η and η2 measures of association, the values are close to 1 and indicate that the training ID had a significant effect on all the metrics considered and that a considerable proportion of the variance in each metric can be explained by the training ID. The values from Table 3 indicate an extremely strong positive association between the accuracy and the training ID of the road classification model, a very strong positive association between the loss, the F1 score, precision and ROC-AUC score, and a strong positive association between the recall and the training ID.
The F-statistics and their p-values does not reveal which training IDs are different from the others when there is a significant difference. To reduce the length of the study, the analysis of the boxplots of the performance metrics grouped by training ID was carried out on the loss, F1 score and ROC-AUC score. These metrics are considered appropriate for evaluating the performance on the test set with imbalanced data (in Table 1, it can be observed that the test set features very different number of positive and negative images at higher sizes), as the F1 score represents the harmonic mean of precision and recall, and it ensures that a model is robust in terms of false positives and false negatives. The ROC-AUC score is based on the predicted probabilities and indicates the capability of a model in distinguishing between the classes and is widely used for imbalanced datasets. As an additional comment, the accuracy is more suitable when evaluating symmetric datasets, as it can lead to a misleading measure of the actual performance in class imbalances scenarios. A comparison of the training scenarios in terms of performance metrics can be found in Figure 2.
In Figure 2, the boxplots of the training scenarios with IDs 1 to 6 present the performance metrics obtained by the VGG-v1 trained for road classification on datasets featuring tiles with a size of 256 × 256 and 0% overlap (scenario 1) to 1024 × 1024 and 12.5% overlap (scenario 6), while scenarios 7-10 contain the same information for the VGG-v2 model. The performance of the configurations follows a similar pattern. The loss progressively decreases for scenarios 1 to 6 and 7 to 12, while the F1 and ROC-AUC scores seem to increase in the same way (indicating an increase in performance as higher size tiles are used). Also, from the overlap perspective, by comparing pairs of consecutive scenarios, the F1 and ROC-AUC scores seem to be higher in scenarios with an even training ID (that feature tiles with an overlap of 12.5%), while the loss values seem to be smaller (possibly indicating a higher performance in scenarios featuring a 12.5% overlap). The highest median F1 and ROC-AUC scores and lowest median loss seem to belong to scenario 12, which is closely followed by scenarios with IDs 11 and 6. Training ID 12 features high variability in the F1 score but a low loss value computed on the unseen test data.
Next, given that the test sample sizes vary greatly (the test sets of higher sizes feature a lower number of images), the Scheffe test was applied to compare the performances in terms of the F1 and ROC-AUC scores and loss values and to identify the best performing ones. Scheffe’s method is a statistical test used for post-hoc analysis after ANOVA, where a comparison is made between each pair of training ID means (it is more conservative in controlling the Type I error rate for all possible comparisons) using a t-test adjusted for overall variability of the data, while maintaining the level of significance at 5%. It is used to make all possible contrasts between group means and outputs the homogeneous subsets that can be obtained. All groups from this analysis feature a sample size . In Table 4, the post-hoc test results are presented in terms of homogeneous subsets of configurations for the F1 and ROC-AUC scores and loss metrics grouped by the training scenario ID after applying the Scheffe’s method as described above.
The homogeneous subsets reported in Table 4 contain proposed configurations whose performances are not significantly different from each other at a level of significance of 5%. For example, configurations 6, 11 and 12 do not have a significantly different F1 and AUC ROC scores (highest values) and loss (lowest values). These configurations are not common between the different homogeneous subsets obtained, implying significantly different performance compared to the rest of the configurations, with the models obtained from the training scenario 12 being the best performers. These post-hoc test results support the observations of the boxplots from Figure 2.
5.2. Performance of the Best Model
The performance achieved by each of the trained models is presented in Appendix A. In Table 3, the computed metrics were grouped by scenario ID and their overall descriptive statistics on the test set were presented. It can be found that all road classification models achieved a high generalisation capacity, as their performance on unseen data reaches mean levels of 0.3111, 0.9043, 0.8286, 0.8700, 0.8019, and 0.9288 in terms of loss, accuracy, F1 score, precision, recall and ROC-AUC scores, respectively, with associated standard deviations of 0.1396, 0.0599, 0.0284, 0.0666, 0.0177, and 0.0292, respectively.
In the statistical analysis carried out in Section 5.1, a significant variability in the metrics was observed across different training iterations and subsets of the data and models. The best training scenario was 12, as it obtained the highest mean performance on unseen data. The three models trained in this scenario achieved mean values of loss, accuracy, F1 score, precision, recall and ROC-AUC score of 0.1018, 0.9749, 0.8751, 0.9659, 0.8195 and 0.9786, respectively. By crossing this information with the data from Appendix A, it can be observed that the best training iteration from this scenario was the third one, where loss values of 0.0948, 0.0948 and 0.0984, F1 score values of 0.8871, 0.8871 and 0.8728, and ROC-AUC scores of 0.9808, 0.9808 and 0.9766, were achieved on the train, validation, and test set, respectively. In Figure 3, the confusion matrix of the best CNN model (VGG-v2, trained with images of 1024 × 1024, with an overlap of 12.5%) computed on the train, validation, and test set can be found.
By analysing the error rates from the confusion matrix obtained by the best VGG-v2 model on the test set, it can be found that the resulting model correctly classified 38,585 training samples (35,768 as the positive class and 2,817 as the negative classes), while incorrectly predicting 266 negative samples as belonging to the “Road” class and 1015 “Road” samples as belonging to the negative class, the error rate (ratio between incorrect predictions and total samples) on the training set being 3.2% (Figure 3(a)). On the validation set, the model correctly predicted 1886 positive and 140 negative samples while incorrectly predicting 11 negative samples as positives and 62 positive samples as negatives (as observed in Figure 3(b)). The corresponding error rate is 3.5%. On the test set, the best performance model correctly predicted 2917 positive and 126 negative samples, while incorrectly predicting 6 negative samples as positive and 74 positive samples as belonging to the negative class (Figure 3(c)). The associated error rate is 2.6% and proves the high generalisation capability of the CNN models as the error rate is slightly lower when compared to the training and validation sets.
In Figure 2(a), it can be observed that the best scenario (ID=12) shows a higher variance in the F1 score. One cause could be the inherent randomness associated with the training process of DL models (where the weights have a random component in their initialization, or the random selection of mini batches). This randomness can introduce variability in convergence and performance (even if the models are trained on the same representative, large-scale data) and result in F1 scores that are not entirely consistent across runs. In some experiments, the model might be making more accurate positive class predictions (“Road” class), while in others, it might be better at predicting the negative (“No road”) class, a behavior conditioned by the precision-recall tradeoff. It is important to mention that performance metrics should be evaluated globally, not at the level of a single metric. Scenario 12 is not one of those where higher variability is present in the loss metrics or ROC-AUC score.
5.3. Mean Performance on Unseen Test Data Grouped by Tile Size, Overlap and Neural Network Architecture
In this section, the selected fixed factors are the tile size, tile overlap, and the DL architecture trained. The loss, accuracy, F1 score, precision, recall and AUC-ROC scores on the test set (performance metrics) act again as the dependent variables. ANOVA was applied to obtain the mean and standard deviation of the dependent variables and the inferential statistics (F statistic and its p-value, together with η and η2). The results are grouped by tile size (N=12 samples for each of the three tile sizes considered), tile overlap (0% and 12.5%, N=18 samples for each group) and trained CNN architecture (VGG-v1 and VGG-v2, N=18 for each group). The results are presented in Table 5.
In Table 5, it can be observed that the mean loss values decrease as the tile size increases (from 0.1415 to 0.32 and 0.1415, in the case of the 256 × 256, 512 × 512, and 1024 × 1024 tile sizes, respectively). The standard deviation of the loss values contains small values across each considered size (from 0.0222 to 0.0371). This behaviour is repeated in the case of the accuracy, precision, and ROC-AUC score. The F1 score and its recall component do not display this constant increase pattern. One of the more plausible explanations for this situation could be the significant class imbalance in the data. Given the class weights applied, it seems that the models trained on tiles with a size of 512 × 512 pixels favoured a higher precision (a good identification of the minority class) at the expense of recall metrics (where the majority class is frequently misclassified), resulting in a lower F1 score.
Nonetheless, the p-values in the ANOVA table (corresponding to the F statistic for the tile size as a fixed factor) are smaller than 0.001 for all the dependent variables and indicate that the differences in the metrics across the tile sizes are statistically significant (the observed trends are unlikely to be random). The values of the measures of effect size (η and η2) suggest that tile size has a large effect on these metrics and a very strong positive association between the tile size and the performance metrics (values for η and η2 superior to 0.90, and even approaching 0.99 in the case of loss and accuracy), except for the recall, where the measures of effect indicate a strong positive association in the correlation ratio η (eta) of approximately 0.8 and a substantial effect size of approximately 0.63 (implying that 63% of the variation in recall is attributable to the variation in tile size).
In relation to the overlap as a fixed factor, the mean performance metrics present a slight increase in the “12.5% overlap” level when compared to the “No overlap” group, for all the metrics except for loss (where the average value decreases, which signals a better performance). This indicates a slight increase in the performance of the models trained on tiles featuring an overlap. The standard deviation of the “12.5% overlap” group indicates a slightly more variable performance when there is an overlap between adjacent images. As for the inferential statistics, the computed p-values are higher than 0.05 and indicate that the differences in performance metrics between the two levels of tile overlap are not statistically significant. The η values indicate a weak relationship between tile overlap and each of the performance metrics, while the η2 values show that only a very small proportion of the variance in each performance metric can be explained by tile overlap (for example, the η2 value of 0.015 for the F1 score implies that only 1.5% of the variance in F1 score can be attributed to the level of tile overlap).
When considering the CNN architectures as a fixed factor, similarly to the “overlap” as an independent variable, the means of the performance metrics slightly increase for every metric, except for loss (where a slight decrease can be observed), indicating a slight increase in performance for the VGG-v2 model trained for road classification. They suggest that, on average, the two models perform similarly. The standard deviations of performance metrics of VGG-v2 present slightly higher values when compared to those obtained by the VGG-v1 group and indicate slightly higher variability in the performance of VGG-v2 (for example, the standard deviation of accuracy is 0.0602 for VGG-v1 and 0.0613 for VGG-v2). All the p-values are higher than 0.05 and indicate that the differences in the mean metrics between the two models are not statistically significant. The η values are low and indicate a weak relationship between CNN architectures and the dependent variables (performance metrics). The η2 values are even lower and indicate that an insignificant proportion of the variance in the metrics can be attributed to the model (in the case of accuracy, it approaches zero).
However, the p-values from the ANOVA table do not reveal which groups of the fixed terms are different from the others when there is a significant difference. For this reason, the analysis of the boxplots of the performance metrics grouped by the tile size, tile overlap, and CNN architecture was carried out next for the loss, F1 score and ROC-AUC score values (as illustrated in Figure 4).
When grouping the metrics by the tile size, an increase in the median performance metrics can be observed at higher tile sizes (together with a decrease in the loss, which is also attributed to better performance), with the exception of the F1 score for the tile size of 512 × 512 pixels which, as discussed before, could be caused by class imbalance present in the data or by a generally more pronounced sensitivity of the CNN models to predicting the positive class at this particular size (a mean higher precision was observed in Table 5). The results are aligned with those obtained in similar works [10].
When grouping the performance metrics by the tile overlap, it can be observed that the median F1 and ROC-AUC scores increase in models trained over data with 12.5% overlap (and subsequently, the loss values decrease) when compared to the boxplot featuring models trained on data with no overlap.
Finally, in the case of the boxplots grouped by the trained CNN model in Figure 4, it can be observed that, although the median F1 and ROC-AUC scores are slightly higher in the case of VGG-v1 (and the median loss value is smaller), the variability of the VGG-v2 is higher. The upper whiskers corresponding to the F1 and ROC-AUC score performance values reach a considerably higher value (and a considerably smaller loss value) when compared to VGG-v1. These values were all computed on unseen, testing data; the boxplot results support the observations from Table 5. Post hoc tests are not performed in this section, because of the reduced number of groups within the fixed factors.
Next, to quantify the impact of the independent variables on the performance, factorial ANOVA was applied for analysing the main and interaction effects of the fixed factors on the metrics.
5.4. Main and Interaction Effects with Factorial ANOVA
In this section, factorial ANOVA is applied to examine whether the means of F1 and ROC-AUC scores and loss metrics as dependent variables are significantly different across the groups from the training ID, CNN architecture (model), tile size and overlap as fixed factors and whether there are significant interactions between two or more independent variables on the dependent variables. This type of analysis is applied to understand the influence of different categorical independent variables (fixed factors) on a dependent variable.
Factorial ANOVA studies the main effect of each factor (ignoring the effects of the other factors) and studies their interaction effect (combined effect of two or more factors, which could be different from the sum of their main effects) on each dependent variable. For the interaction effect, the null hypothesis states that “the effect of one independent variable on the dependent variable does not differ depending on the level of another independent variable”. A rejected null hypothesis (p-value <0.05) indicates that significant differences exist between the means of two or more independent groups.
The results of the factorial ANOVA test are presented in Table 6. Table 6 is divided into the various sources of variation; each source of variation being tested against the three dependent variables (the performance metrics considered) at a significance level of 0.05. The assumptions of factorial ANOVA have been met in this study, as the observations are independent, the residuals follow a normal distribution, and the variance of the observations is homogeneous.
“Corrected Model" and "Intercept" are statistical terms used in the context of regression analysis in “Between-Subjects” factorial ANOVA tables and provide details related to the relationship between the studied variables. In Table 6, “Corrected Model” (source ID = 1) refers to the sums of squares that can be attributed to all the effects in the model (fixed and random factors, covariates, and their interactions), excluding the intercept. The F-test for the corrected model indicates whether the model explains any variance in the dependent variable (whether the variation in the performance metrics can be explained by the independent variables). The p-values are lower than 0.001, therefore the model is highly statistically significant. The “intercept” (source ID = 2) represents the mean value of the dependent variable when all independent variables are zero; the associated p-values for the three dependent variables (F1 score, ROC-AUC score, and loss) are lower than 0.001, showing that the model intercepts are significantly different from zero.
The main effect null hypothesis studies the marginal effect of a factor when all other factors are kept at a fixed level and states that the effect is not significant on the dependent variables. As can be observed in Table 6, the effect of the fixed factors “Size” (source ID = 4) and “Overlap” (source ID = 5) on the performance metrics is statistically significant (p-values lower than 0.05 in all cases). This indicates the tile size and tile overlap significantly explain the variation in the dependent variables (F1 and ROC-AUC scores and loss) and that there is a highly significant difference in performance due to different tile sizes (p-values lower than <0.001 for each performance metric) and significant differences caused by tile overlap levels (p-values of 0.0038, <0.001, and 0.0055 for the respective dependent variables). As for the main effect of the CNN models (source ID = 3) on the dependent variables, the p-values for the F1 score and loss are greater than 0.05, indicating that the effect of CNN architecture (“Model”) on these variables is not statistically significant. However, the effect of the CNN architecture on the ROC-AUC score is significant (p-value < 0.05).
As for the interaction effect between tile size and tile overlap (source ID = 6) on the performance metrics, the p-value for F1 score is greater than 0.05, indicating that the interaction effect is not significant for this variable. However, the interaction effect is significant for the ROC-AUC score (p-value <0.05). A similar behaviour (non-significant interaction effect for the F1 and loss metrics, but significant for the ROC-AUC score) is displayed by the interaction effect between the CNN model and the overlap (source ID = 8). The interaction effect between the CNN architecture and size pair of fixed factors (source ID = 8) is statically significant for the ROC-AUC score, but not statistically significant for the loss and F1 score as dependent variables (the computed p-values are higher than 0.05). Nonetheless, the p-value of approximately 0.06 for the F1 score is only slightly above the 0.05 threshold and can be considered to suggest a trend in data.
In the case of the interaction effect between the three fixed factors (CNN architecture, tile size and tile overlap—source ID = 9), the difference in performance is not significant (p-values of 0.8685, 0.0601 and 0.9805 for the F1 and ROC-AUC scores and loss, respectively). Again, the p-value corresponding to 0.06 for the ROC-AUC score is only slightly above the 0.05 threshold and can suggest a trend in data. In Table 6, “error” (source ID = 10) represents the unexplained variation in the dependent variables. Finally, “total” (source ID = 11) represents the total variation in the dependent variables, while “Corrected Total” (source ID = 12) represents the total variation in the dependent variables after removing the variation due to the model.
As a post-hoc analysis following the factorial ANOVA, the Estimated Marginal Means (EMMs), or predicted marginal means, were computed to help interpret the results from Table 6. EMMs represent the means of the dependent variables across distinct levels of each factor, averaged over the other factors (to control for the effects of other factors), and are useful for understanding the interaction effects of multiple fixed factors on the performance metrics. In this case, EMMs provide the mean performance metric (F1 score, ROC-AUC score, and loss) at each level of the fixed factors averaged over the levels of the considered factors. For the two-way interaction between tile size and overlap (Size * Overlap, Source ID = 7 in Table 6), the metrics are averaged over the levels of tile size (256 × 256, 512 × 512, and 1024 × 1024 pixels), and tile overlap (0% and 12.5%). For the three-way interaction between the tile size, overlap, and CNN architecture (VGG-v1 and VGG-v2), the metrics averaged over the levels of the three considered factors (Model * Size * Overlap, Source ID = 9 in Table 6). The plot of the EMMs from Figure 5 illustrates the means for the interaction effects of the two and three fixed factors mentioned on the dependent variables. Appendix B presents the numerical values of the EMMs for the two-way interaction between the tile size and overlap (Size * Overlap) on the F1 and AUC-ROC scores and loss values. Appendix C presents the EMMs values of the three-way interaction effect between the CNN architecture, tile size, and overlap (Model * Size * Overlap) on the same performance metrics.
Subplots (a), (d) and (g) of Figure 5 present the EEMs of the two-way interaction between the tile size and tile overlap. The graphics suggest that the values of the mean F1 and AUC scores increase as the tile size and tile overlap increases, while the mean loss values decrease as the size increases (an indicator of a better performance). When accounting for the three-way interaction (the rest of Figure 5’s subplots), it can be observed that the VGG-v2 model displays better performance when compared to VGG-v1 across all dependent variables for all tile sizes and overlaps. For both CNN architectures, the F1 score generally increases as the tile size increases from 256 × 256 to 1024 × 1024 pixels and it slightly improves when the tiles present a 12.5% overlap. This behaviour is also displayed for the ROC-AUC score metric, the value of the model trained on tiles of 1024 × 1024 pixels with a 12.5% overlap is considerably higher. Additionally, VGG-v2 achieved a lower loss when compared to the VGG-v1 model across all tile sizes and overlaps (a lower loss value is an indicator of better performance). As found in Figure 5, the loss decreases as the tile size increases from 256 × 256 to 1024 × 1024 pixels for both models and is slightly lower on models trained with tiles featuring a 12.5% overlap.
6. Discussion
This work was focused on statistically studying the generalisation capacity of road classification models using unseen testing data and was centred on assessing the impact of different tile size and overlap levels on the performance metrics. The indicators of performance considered were the loss, F1 score, and ROC-AUC score, as these metrics ensure robustness and class distinction (the accuracy may mislead scenarios of imbalanced data present at higher tile sizes).
In this study, a significance level of 0.05 was applied for testing the null hypotheses. If the p-value is lower than 0.05, it can be concluded that the corresponding result is statistically significant. For p-values lower than 0.001, the result is considered highly significant (the observed data has less than 0.1% chance to occur under a correct null hypothesis). Conversely, a p-value > 0.05 (not significant) can be interpreted as there being no robust evidence to reject the null hypothesis. Finally, a p-value slightly above 0.05 can be considered indicative of a trend in the data.
6.1. On the Homogeneity of the Performance and Differences Between Training, Validation, and Testing Results
The data distribution of the training, validation, and test sets can be found in Table 1, the performance metrics being presented in Appendix A. The metrics from the “Train” columns of Appendix A indicate the performance of the models on data they were trained on. As expected, the values are higher on this set, as this data was directly used to model the classification function of the road classification model. At the end of each training iteration, the model had access to its corresponding validation set to compute the loss and tune its training parameters—the performance on the validation data is generally lower than on the training data but is expected to be close if the model generalises well. The testing data has not been processed during training or validation and provides an unbiased evaluation of the resulting model that reflects the real-world usage performance. A considerably better performance on the training data compared to the validation and test data would indicate overfitting. Underfitting would be indicated by low scores across all sets.
The results from Appendix A and Table 1 show a high degree of homogeneity in the metrics from the same scenario settings. The results do not present marked overfitting or underfitting behaviour—the results show good performance and consistent performance across sets and indicate well-fitted models. Overfitting would be indicated by a high training score but low validation and test scores. The performance generally decreases from the training set to the validation data and to the test data. The metrics are highest on the training set, slightly lower on the validation set, and lowest on the test set.
The loss value is higher for the test set compared to the train and validation sets across all experiments—this is expected as the model had no access to the test data during training. Nonetheless, the relatively low loss values suggest that the model can make reasonably accurate predictions on the test data. Across all experiments, the F1 score is consistently highest on the training set, followed by the validation set, and lowest on the test set. The F1 score and ROC-AUC score, which are measures of the performance and discriminative ability of a model, respectively, show similar trends to the loss values. The ROC-AUC scores are high for all sets across all experiments, indicating that the models have high discrimination capacity between classes. A higher performance on the training set is a common pattern (a model is best tuned to the data it was trained on) but the performance on the validation and test set is also high and suggests that the model is not overfitting.
6.2. On the Training Scenarios and the Best Model
The descriptive statistics from Table 3 show that the models present a reduced standard deviation within the same training scenario. For example, within the same scenario ID, the highest standard deviation value for the loss is present in Training ID 1 (±0.0322), in Training ID 12 (±0.0101) for the F1 score, and in Training ID 5 (±0.0082) for the ROC-AUC score. However, noticeable variations in performance were observed across different training scenarios. For example, Training ID 12 yields the lowest mean loss value (0.1018), while training ID 8 yields the highest mean loss (0.4783—smaller values indicate better performances). For the F1 performance metric, the minimum mean value is present in Training ID 3 (0.804) while the maximum mean value corresponds to Training ID 12 (0.8751). As for the ROC-AUC metric, Training ID 1 obtained the minimum mean value (0.8976), while the maximum mean value (0.9786) was obtained by Training ID 12. Therefore, the training scenario significantly impacted the performance of a model, the variation between groups (different training IDs) being much larger than the variation within groups (same training ID). This can also be noted in Figure 2. All the corresponding p-values are smaller than 0.001 and indicate highly significant statistical differences—the training scenario significantly impacted the ability of the model to generalise to unseen data.
The η and η2 measures of association from Table 3 have values close to 1 and indicate a very strong positive association between the loss, the F1, and ROC-AUC scores and the training ID. The values imply that the training scenario had a significant effect on the performance and that a considerable proportion of the variance in each metric can be explained by the training ID.
The results of the post-hoc Scheffe test (Table 4) revealed that Training IDs 5, 6, 11, and 12 consistently performed better across the three metrics considered for the homogeneous sets and suggested that these scenarios are likely the best performing ones. Alternatively, the models from Training IDs 1 and 2 appear to display worse performance across the considered metrics. Figure 2 shows that the highest median F1 and ROC-AUC scores and lowest median loss are associated with scenario 12. The best performing model was the VGG-v2 model trained in scenario 12 (on tiles of 1024 × 1024 pixels and 12.5% overlap) which achieved a loss value of 0.0984, an F1 score of 0.8728, and an ROC-AUC score of 0.9766, together with an error rate of 3.5% on the test set (as described in Section 5.3).
The loss values show some degree of homogeneity across different experiments and iterations, especially within the same training scenario. The F1 scores vary more significantly across different training scenarios and indicate that the precision and recall components were influenced by the training scenario ID. The ROC-AUC scores (indicating the ability of a model in distinguishing between classes) proved to be relatively consistent regardless of the specific experiment or iteration.
6.3. On the Tile Size and Tile Overlap
The increasing class imbalance between the positive and negative classes at higher tile sizes (from approximately 47.5:52.5% to 90:10% for the 256 × 256 and 1024 × 1024 tile sizes, respectively, as presented in Table 1) was tackled by applying a class weight matrix during training (as described in Section 4) to prevent models that are biased towards the overrepresented class.
Table 5 shows that the loss performance for size levels ranges from 0.4717 (256 × 256 pixels) to 0.1415 (1024 × 1024 pixels). When analysing the F1 score metric, the mean values range between 0.8056 (512 × 512 pixels) and 0.8667 (1024 × 1024 pixels), while for the ROC-AUC metric, the mean values are between the value 0.9002 (256 × 256 pixels) and 0.9660 (1024 × 1024 pixels). It can also be highlighted that the maximum standard deviation for the loss metric (0.037) is observed for the 1024 × 1024 size. For the F1 and ROC-AUC scores, the standard deviations are generally lower than 0.01 across each size level and indicate a similar performance of the models across the training scenarios. The 1024 × 1024 pixels size obtained the highest mean performance on unseen data for every considered metric. The dependent variables indicate a higher performance of the trained models at higher sizes. The results suggest that more semantic information from a scene helps the models in making more accurate predictions (considerably higher mean precision) but might also make the correct identification of all actual positive cases more difficult (slightly lower mean recall).
In relation to the tile overlap levels, the analysis of the results shows that the mean values of the loss range from 0.3001 (12.5% overlap) to 0.3221 (no overlap). These mean values also increase from 0.8252 (no overlap) to 0.8320 (12.5% overlap) for the F1 score metric and from 0.9250 (no overlap) to 0.9326 (12.5% overlap) for the ROC-AUC score metric. The standard deviations indicate a slightly higher variability at higher overlap. The differences in median performance between the two overlaps can also be identified in Figure 4. It can be considered that a tile overlap of 12.5% results in better performance than 0% overlap across all metrics. This might suggest that the use of overlapping tiles could help the models in making more accurate predictions due to the more context and continuity provided.
When accounting for the results grouped by the CNN architecture levels (Table 5 and Figure 4), it can be observed that the VGG-v1 model performed slightly worse than VGG-v2 in terms of performance (mean loss, F1 and ROC-AUC scores values of 0.3159 and 0.3062, 0.8272 and 0.8299, and 0.9261 and 0.9315, respectively). The variability in performance metrics is slightly higher for the better CNN architecture. Both VGG-v1 and VGG-v2 models perform better with higher tile sizes (1024 × 1024 pixels) across all performance metrics.
The η and η2 measures of association indicate the strength and direction of the relationship between the independent variables and the performance metrics (values closer to one suggest a stronger relationship). For tile size, the η values (between 0.796 to 0.999), and the η2 values (between 0.634 to 0.997) are very high and suggest that tile size significantly affects the performance metrics. For tile overlap and CNN architecture, the η and η2 values are relatively low, suggesting a weaker relationship. This indicates that, while tile overlap and the choice of model do have some effect on the performance metrics, their impact is less significant compared to the tile size. The trend is also encountered in the case of the η2 values (that indicate the proportion of the variance in each performance metric that can be explained by the independent variable).
The results from Section 5.2 indicate that the use of higher size tiles leads to a better average road classification performance, with a highly significant p-value of less than 0.001 (the models trained on tiles of 1024 × 1024 pixels delivered the best results). The tile overlap of 12.5% slightly outperforms the 0% overlap, and VGG-v2 slightly outperforms VGG-v1. The p-values might suggest that the differences in the means of the performance metrics between the two levels of tile overlap (0% and 12.5%) and CNN architectures (VGG-v1 and VGG-v2) might not have a substantial impact on the performance and could be caused by randomness. However, it is important to note that statistical significance does not always equate to practical significance. In this case, given the reduced number of training repetitions at the scenario level (due to the high computational cost required), the results might imply that the significance cannot be identified by analysing the mean values alone. This aspect is also indicated by the median results from Figure 4, with better performances being achieved by a model with a higher number of trainable parameters at a higher overlap. For this reason, more statistical analysis was carried out to study the main and the interaction effect on these metrics by applying factorial ANOVA tests.
6.4. On the Main and Interaction Effects of Tile Size, Tile Overlap and Neural Network Architecture
The null hypothesis can be rejected if the p value is < 0.05 (it implies that a significant effect on the performance metrics can be observed when all other factors are kept at a fixed level). As found in Table 6, the main effect of the tile size is highly significant (p-value lower than 0.001). The main effect of the tile overlap is also highly significant for the ROC-AUC score (p-value less than 0.001) and significant for the F1 score and loss metrics (p-values of 0.0038 and 0.0055, respectively). The main effect of the CNN architecture as a fixed term on the performance proved to be non-significant for the F1 score and loss as dependent variables (p-values higher than 0.05) and significant for the ROC-AUC score (p-value of 0.0014).
The effect on the performance metrics of the interactions between the combined factors analysed in this study was also evaluated. The p-value tests verify if the effect of the model on the dependent variables changes at different levels of the independent term. A significant p-value would suggest that the effect of one of the independent factors on the dependent variables depends on the level of a second independent factor, and vice versa. A p-value lower than 0.05 means that the combined effect on the performance is not significantly different from what would be expected based on their individual effects and there is not enough evidence to reject the null interaction effect hypothesis.
The p-values for the interaction effect between model and tile size (Model * Size) are highly significant for the ROC-AUC score (p-value < 0.001), significant for loss (p-value of 0.0034), but not significant for the F1 score (p-value of 0.0649). These p-values test whether the effect of the model on the dependent variables changes at different tile sizes. The significant p-value suggests that the effect of the model on the loss and ROC-AUC metric depends on the tile size, and vice versa.
The interaction effects of the tile size and tile overlap factors on the performance and CNN architecture and tile overlap factors on the metrics are not significant for the F1 score (p value > 0.05), but it is significant for the ROC-AUC score. This means that the effect of the tile size on the ROC-AUC score depends on the tile overlap level (in the case of the “Model * Overlap” interaction effect) and that the effect of the CNN architecture on the ROC-AUC metric changes at both overlap levels (for the “Model * Overlap” interaction effect), and vice versa.
The p-values for the three-way interaction among CNN architecture, tile size, and tile overlap (Model * Size * Overlap) are not statistically significant for any of the dependent variables (p > 0.05), but in the case of the ROC-AUC score, the p-value of 0.06 is low enough to indicate a trend. Nonetheless, the values imply that the combined effect of model, size and overlap on the performance is not significantly different from what would be expected based on their individual effects and their two-way interactions.
Therefore, while the main effects of tile size and overlap are significant, their interaction effects with the model are not consistently significant across all performance metrics. These statistical interpretations suggest nonetheless that higher tile sizes and a small amount of overlap can improve the performance of these models. The graphics from Figure 5 support these findings.
6.5. A Qualitative Ranking of the Contributions of the Factors to the Performance
Although the statistical tests applied in this study do not rank the contributions of the tile size, tile overlap, and CNN model on the DL model performance, the experimental and analysis designs that provided the results from Table 3, Table 4, Table 5 and Table 6 and Figure 2, Figure 3, Figure 4 and Figure 5 offer significant insights into the effects of these factors on the performance of the models and enable a global, qualitative ranking of the importance of the factors. However, it is important to note that the ranking is based on the road classification results achieved in this study for this specific dataset, tile overlap, and CNN models used in our study. The relative contributions of these factors may vary for other tasks, datasets, or DL models, and further research is needed to generalise these findings (these aspects will be commented more in depth in Section 6.6).
In this work, the factor with the highest impact on the performance of road classification models proved to be the tile size. In Table 5 and Figure 4 (a), (b), (c), where the performance metrics were grouped by tile size, it can be observed that larger tile sizes consistently result in better performance metrics (lower loss, higher F1 score, and ROC-AUC score). The difference between the tile size levels indicates that the factor could be considered the most influential factor for the analysis in this study. The results indicate that models trained on larger tiles (1024 × 1024 pixels) performed better than those trained on smaller tiles, and this is likely caused by the increased semantic context provided by larger tiles. Furthermore, the main effect of the tile size on performance proved to be highly statistically significant, with p-values <0.001 for all metrics in Table 6 (Source ID = 4).
The second most influential factor on the model performance can be considered the tile overlap. In Table 5 and Figure 4 (d), (e), (f), it can be observed that, when the metrics were grouped by tile overlap, the models trained with a 12.5% overlap consistently outperform those trained without overlap (although to a lesser degree). The main effect of the tile overlap on performance (Source ID = 5 in Table 6) proved to be highly statistically significant for the ROC-AUC score metrics and statistically significant for the loss and F1 score. Therefore, road recognition models trained with a 12.5% overlap outperformed those trained without any overlap and the results indicate that additional border context and continuity likely helps the learning process.
In this study, the CNN model architecture can be considered as the least influential factor for the performance. Data from subplots (g), (h), (i) of Figure 4 and Table show that differences in performance between the different CNN architectures are less pronounced than the differences observed for tile size and tile overlap. In addition, the main effect of the CNN model (Source ID = 3 in Table 6) on the performance varies from significant for the ROC-AUC score to non-significant for the loss and F1 score. Therefore, although the choice of CNN architectures considered in this study also affected the performance, the contribution of the factor might be considered less important than the tile size or tile overlap.
Although these insights are also supported by the EMMs plots from Figure 5 and by the data from , this qualitative ranking is related to the current study and the specific impact of the tile size, tile overlap, and CNN model factors, as these insights are conditioned to the dataset and training settings specific to this study. Please note that the addition of other CNN models and tile overlap, or tile size levels could result in a significantly different impact on the performance.
6.6. On the Uncertainty of the Models, the Limitations of the Study, and Future Directions
To reduce overfitting and enable a high generalisation capacity of the road classification models, the study was conducted on the data from the SROADEX dataset (where 8650 km2 from representative regions of Spain were labelled with binary road information). Given the scope of this study, six training and validation sets for each tile size and overlap combination were considered by applying a 95:5% split criterion (as detailed in Section 3). A novel test set featuring data unseen during training was labelled from a single, representative orthoimage covering approximately 825 km2 to assess the real-world generalisation performance of the resulting models. As the p-values are highly dependent on the sample size, the use of training datasets, with high data variability, ensures the statistical significance of the results.
It is also important to mention that studying the normality of the data (using statistical tests like Shapiro-Wilk or Kolmogorov-Smirnov) before applying statistical analysis is important for images, as factors like lighting conditions, the characteristics of the cameras used for data capturing, or other specific features within images can result in data distributions that are not normal (i.e., skewed). If data does not follow a normal distribution (for example, if the images used have a lot of dark pixels, the distribution of pixel intensities could be skewed towards the lower end of the range), some form of transformation (like a log transformation) must be applied to approximate it more to the normal distributed (otherwise, non-parametric statistical methods that do not assume normality have to be applied). Nonetheless, in this study, given the considerable sample size and following similar statistical situations, the assumption of data normality was considered (as explained at the end of Section 3).
The standard procedure for training DL models for classification was applied and included normalisation of the pixel values to interval [0,1], in-memory data augmentation techniques with small parameters and the application of transfer learning. A weight matrix was applied to the training to penalise the model when trying to predict the overrepresented class. The same hyperparameters values were applied to all training scenarios.
The experiments were repeated three times for each training scenario presented in Table 2 to reduce the randomness associated with DL model convergence—a higher number of training repetitions can be considered for a future study, as more significant insights can be achieved by applying statistical tests on a higher number of training iterations (resulting in a higher number of degrees of freedom). Nonetheless, by conducting the experiments on a large dataset, it is expected that the effect of this drawback is reduced (as the training on large datasets helps the model converge and results in models with similar performance). Additionally, although there were only three repetitions at the Training Scenario ID level (so that the ANOVA analysis from Section 5.1 could be valid), this experimental design resulted in N=12, N=18, and N=18 samples for each level of the groups analysed in Section 5.3 (the performance achieved on the test set when grouped by tile size, tile overlap, and trained CNN architecture). A higher number of training repetitions would have resulted in unfeasible computation times, as the current experiments lasted for around six months on the available computational infrastructure.
Another drawback of the study is the reduced number of CNN architectures trained, or the reduced number of overlap levels and tile sizes considered. Nonetheless, these drawbacks was strongly conditioned by the available computational budget, as the introduction of new models or tile size and overlap levels (for example, multiples of 12.5%) would greatly increase the amount of training scenarios. Although it would be beneficial to further validate these findings with additional experiments, the computational cost required is significantly higher. To solve this, future studies could select an experimental design that enables a higher number of experiments by experimenting with a smaller dataset or by renting a sufficient computational infrastructure, with enough computational budget.
The lower interpretability of the models, intrinsic to deep learning implementations that model classification functions with millions of parameters, can also be mentioned as a challenge, as interpretability is sacrificed for high levels of performance. While the statistical analysis provides valuable insights, it is also important to consider other factors such as the practical implications of the results and the potential impact of false positives and false negatives.
Finally, statistical interpretations always have associated the possibility that the actual impact of tile overlap on model performance might depend on other factors not considered in this analysis. However, given the statistical significance level computed, the findings and insights of this study could be valuable for improving the performance of DL models that are trained in workflows that are relevant to the experiments. Nonetheless, the study is based on binary road data (continuous geospatial element) and might not be applicable to all geospatial classification works.
We hope that more studies will focus on exploring the optimal sizes and overlaps for additional models to provide guidelines that would improve the experimental decisions taken by researchers and professionals in the field. It is expected that the number of training scenarios considered in future geo-studies could be reduced by following statistically proven findings and optimal combinations.
7. Conclusions
This study was focused on statistically analysing the impact of the tile size and tile overlap on the performance of the CNN models trained for the road classification task. Real-world, aerial orthoimagery data labelled with binary road information that covered a large part of the Spanish territory was used to train and test the DL implementations. The aim was to objectively study the impact of the image size and overlap on the performance and identify the optimal combination of size and overlap levels that would enable a higher generalization of DL road classification models.
A comprehensive statistical evaluation of the performance metrics was applied. The performance of the models on the validation and test sets was close to the performance on the training set and suggested that the models are robust (no underfitting or overfitting behaviour was detected). The results on unseen data were statistically analysed. The performance was consistent across different training scenarios and iterations, suggesting a high generalisation capacity of the trained DL models. The VGG-v2 model trained on data with a tile size of 1024 × 1024 pixels and a tile overlap of 12.5% yields the best performance in terms of higher accuracy and F1 score, and lower loss.
The variation in performance metrics across different training scenarios indicated the relative importance of the fixed factors on the performance (i.e., that the levels of tile size led to a significant change in the performance metrics). The p-values of the main effects test for size and overlap as fixed factors were highly significant (p-value lower than 0.001) and demonstrated the important impact of these two independent variables on the road classification model performance. The “Model * Size” interaction effect was highly significant across each metric considered, while the “Size * Overlap” and “Model * Overlap” interaction effects were only significant for the ROC-AUC score. For the rest of the metrics, the two-way and the interaction effects were not significant (p-values higher than 0.05). The post-hoc results support and assert the findings.
These results suggest that the tile size and overlap, as well as their interaction, play a significant role in the performance and show that higher tile sizes (1024 × 1024 pixels) and a small amount of overlap (12.5%) between adjacent image tiles can improve the performance of models trained for road classification. These findings show the benefit of additional scene information and additional continuity of the objects near the borders by providing more learning context and can guide the selection of model settings for optimal performance in future geospatial classification studies. This combination of tile size and overlap resulted in a higher generalisation capacity of the trained DL models. Future studies could consider additional tile overlap and tile size levels.
Nonetheless, more research with models with a larger number of trainable parameters and a higher number of training repetitions for each scenario could be carried out to further assess and understand the impact on the performance in more detail (the additional computational budget requirements made it unfeasible for this study). Future studies should also tackle the semantic segmentation of geospatial objects, given the importance of this DL operation for road cartography generation, and the extraction errors found near the borders that are often mentioned as a challenge in existing specialised works. Future studies can also approach the explainability and interpretability of CNN models by means of analysis of the convolution kernels or the feature maps learned by the trained models, or the exploration of more random tiling strategies.
Code and Data Availability Statement
The code featuring the training and evaluation of the implementation, the test data and the resulting road classification models are available at the Zenodo repository (https://zenodo.org/records/10835684) and are distributed under an CC-BY 4.0 license. The training and validation sets are based on the binary SROADEX dataset (https://zenodo.org/records/6482346) that was re-split in tiles that feature the image sizes (256 × 256, 512 × 512, and 1024 × 1024 pixels) and image overlaps (0% and 12.5%) considered in this study. Due to the size on disk of approximately 546 gigabytes, this data is only available upon request from the corresponding author.
Funding
This research received funding from the “Deep learning applied to the recognition, semantic segmentation, post-processing, and extraction of the geometry of main roads, secondary roads and paths (SROADEX)” project (grant PID2020-116448GB-I00, funded by the AEI).
Author Contributions (CRediT statement)
Calimanut-Ionut Cira: conceptualisation, data curation, formal analysis, investigation, methodology, software, validation, visualisation, writing–original draft, writing–review and editing; Miguel-Ángel Manso-Callejo: data curation, funding acquisition, investigation, project administration, resources, validation, visualisation, writing–original draft, writing–review and editing; Naoto Yokoya: formal analysis, validation, visualisation, writing–review and editing; Tudor Sălăgean: validation, writing–review and editing; Ana-Cornelia Badea: validation, writing–review and editing. All authors have read and agreed to the published version of the manuscript.
Institutional Review Board Statement
Not applicable.
Acknowledgment
The authors thank the anonymous reviewers for their suggestions that improved the analyses and for recommending interesting future lines of work.
Conflicts of Interest
The authors declare no conflict of interest. The funders had no role in the design of the study; in the collection, analyses, or interpretation of data; in the writing of the manuscript; or in the decision to publish the results.
AppendixA. Performance metrics (mean loss, accuracy, F1 score, precision, recall, and ROC-AUC score) obtained by the road classification models trained in the twelve training scenarios (the experiments were three repetitions) presented in Table 2 on the training, validation, and test sets.
Appendix B. Estimated Marginal Means (EMMs) for the interaction between the tile size and tile overlap as fixed factors (Size * Overlap) on the performance metrics (F1 score, ROU-AUC score, and loss value) as dependent variables.
| Dependent Variable | Tile Overlap (%) | Tile Size (pixels × pixels) | Mean | Std. Error | 95% Confidence Interval | |
| Lower Bound | Upper Bound | |||||
| F1 score | 0 | 256 | 0.8098 | 0.0027 | 0.8042 | 0.8153 |
| 512 | 0.8036 | 0.0027 | 0.7981 | 0.8092 | ||
| 1024 | 0.8621 | 0.0027 | 0.8566 | 0.8677 | ||
| 12.5 | 256 | 0.8172 | 0.0027 | 0.8116 | 0.8227 | |
| 512 | 0.8076 | 0.0027 | 0.8020 | 0.8131 | ||
| 1024 | 0.8712 | 0.0027 | 0.8657 | 0.8768 | ||
| ROC-AUC score | 0 | 256 | 0.8988 | 0.0030 | 0.8926 | 0.9050 |
| 512 | 0.9188 | 0.0030 | 0.9126 | 0.9250 | ||
| 1024 | 0.9575 | 0.0030 | 0.9513 | 0.9637 | ||
| 12.5 | 256 | 0.9017 | 0.0030 | 0.8955 | 0.9079 | |
| 512 | 0.9217 | 0.0030 | 0.9154 | 0.9279 | ||
| 1024 | 0.9745 | 0.0030 | 0.9683 | 0.9807 | ||
| Loss | 0 | 256 | 0.4749 | 0.0105 | 0.4535 | 0.4963 |
| 512 | 0.3284 | 0.0105 | 0.3070 | 0.3498 | ||
| 1024 | 0.1629 | 0.0105 | 0.1415 | 0.1844 | ||
| 12.5 | 256 | 0.4685 | 0.0105 | 0.4471 | 0.4899 | |
| 512 | 0.3116 | 0.0105 | 0.2902 | 0.3330 | ||
| 1024 | 0.1201 | 0.0105 | 0.0987 | 0.1416 | ||
Appendix C. Estimated Marginal Means (EMMs) for the interaction between the CNN architecture, tile size, and tile overlap as fixed factors (Model * Size * Overlap) on the performance metrics (F1 score, ROU-AUC score, and loss value) as dependent variables.
| Dependent Variable | Model | Tile Size (pixels × pixels) | Tile Overlap (%) | Mean | Std. Error | 95% Confidence Interval | |
| Lower Bound | Upper Bound | ||||||
| F1 score | VGG-v1 | 256 | 0 | 0.8096 | 0.0037 | 0.8020 | 0.8172 |
| 12.5 | 0.8182 | 0.0037 | 0.8106 | 0.8258 | |||
| 512 | 0 | 0.8044 | 0.0037 | 0.7968 | 0.8120 | ||
| 12.5 | 0.8079 | 0.0037 | 0.8003 | 0.8155 | |||
| 1024 | 0 | 0.8559 | 0.0037 | 0.8483 | 0.8635 | ||
| 12.5 | 0.8673 | 0.0037 | 0.8597 | 0.8749 | |||
| VGG-v2 | 256 | 0 | 0.8099 | 0.0037 | 0.8023 | 0.8175 | |
| 12.5 | 0.8161 | 0.0037 | 0.8085 | 0.8237 | |||
| 512 | 0 | 0.8029 | 0.0037 | 0.7953 | 0.8105 | ||
| 12.5 | 0.8072 | 0.0037 | 0.7996 | 0.8148 | |||
| 1024 | 0 | 0.8684 | 0.0037 | 0.8608 | 0.8760 | ||
| 12.5 | 0.8751 | 0.0037 | 0.8675 | 0.8827 | |||
| ROC-AUC score | VGG-v1 | 256 | 0 | 0.8976 | 0.0026 | 0.8922 | 0.9030 |
| 12.5 | 0.9004 | 0.0026 | 0.8950 | 0.9058 | |||
| 512 | 0 | 0.9194 | 0.0026 | 0.9140 | 0.9248 | ||
| 12.5 | 0.9243 | 0.0026 | 0.9189 | 0.9297 | |||
| 1024 | 0 | 0.9445 | 0.0026 | 0.9391 | 0.9499 | ||
| 12.5 | 0.9703 | 0.0026 | 0.9649 | 0.9757 | |||
| VGG-v2 | 256 | 0 | 0.9000 | 0.0026 | 0.8946 | 0.9054 | |
| 12.5 | 0.9029 | 0.0026 | 0.8975 | 0.9083 | |||
| 512 | 0 | 0.9182 | 0.0026 | 0.9128 | 0.9236 | ||
| 12.5 | 0.9190 | 0.0026 | 0.9136 | 0.9244 | |||
| 1024 | 0 | 0.9705 | 0.0026 | 0.9651 | 0.9759 | ||
| 12.5 | 0.9786 | 0.0026 | 0.9732 | 0.9840 | |||
| Loss | VGG-v1 | 256 | 0 | 0.4736 | 0.0125 | 0.4478 | 0.4993 |
| 12.5 | 0.4587 | 0.0125 | 0.4329 | 0.4845 | |||
| 512 | 0 | 0.3290 | 0.0125 | 0.3033 | 0.3548 | ||
| 12.5 | 0.3026 | 0.0125 | 0.2768 | 0.3284 | |||
| 1024 | 0 | 0.1932 | 0.0125 | 0.1674 | 0.2189 | ||
| 12.5 | 0.1385 | 0.0125 | 0.1127 | 0.1642 | |||
| VGG-v2 | 256 | 0 | 0.4763 | 0.0125 | 0.4505 | 0.5020 | |
| 12.5 | 0.4783 | 0.0125 | 0.4525 | 0.5041 | |||
| 512 | 0 | 0.3278 | 0.0125 | 0.3020 | 0.3536 | ||
| 12.5 | 0.3206 | 0.0125 | 0.2948 | 0.3464 | |||
| 1024 | 0 | 0.1327 | 0.0125 | 0.1069 | 0.1585 | ||
| 12.5 | 0.1018 | 0.0125 | 0.0760 | 0.1276 | |||
References
- Rigollet, P. 18.657: Mathematics of Machine Learning. Massachusetts Institute of Technology: MIT OpenCourseWare 2015, 7.
- Cira, C.-I. Contribution to Object Extraction in Cartography : A Novel Deep Learning-Based Solution to Recognise, Segment and Post-Process the Road Transport Network as a Continuous Geospatial Element in High-Resolution Aerial Orthoimagery. PhD Thesis, Universidad Politécnica de Madrid, 2022.
- Russakovsky, O.; Deng, J.; Su, H.; Krause, J.; Satheesh, S.; Ma, S.; Huang, Z.; Karpathy, A.; Khosla, A.; Bernstein, M.; et al. ImageNet Large Scale Visual Recognition Challenge. Int J Comput Vis 2015, 115, 211–252. [Google Scholar] [CrossRef]
- Cira, C.-I.; Alcarria, R.; Manso-Callejo, M.-Á.; Serradilla, F. Evaluation of Transfer Learning Techniques with Convolutional Neural Networks (CNNs) to Detect the Existence of Roads in High-Resolution Aerial Imagery. In Applied Informatics; Florez, H., Leon, M., Diaz-Nafria, J.M., Belli, S., Eds.; Springer International Publishing: Cham, 2019; Vol. 1051, pp. 185–198 ISBN 978-3-030-32474-2.
- Manso-Callejo, M.-Á.; Cira, C.-I.; González-Jiménez, A.; Querol-Pascual, J.-J. Dataset Containing Orthoimages Tagged with Road Information Covering Approximately 8650 Km2 of the Spanish Territory (SROADEX). Data in Brief 2022, 42, 108316. [Google Scholar] [CrossRef] [PubMed]
- Reina, G.A.; Panchumarthy, R.; Thakur, S.P.; Bastidas, A.; Bakas, S. Systematic Evaluation of Image Tiling Adverse Effects on Deep Learning Semantic Segmentation. Front. Neurosci. 2020, 14, 65. [Google Scholar] [CrossRef] [PubMed]
- Lee, A.L.S.; To, C.C.K.; Lee, A.L.H.; Li, J.J.X.; Chan, R.C.K. Model Architecture and Tile Size Selection for Convolutional Neural Network Training for Non-Small Cell Lung Cancer Detection on Whole Slide Images. Informatics in Medicine Unlocked 2022, 28, 100850. [Google Scholar] [CrossRef]
- Simonyan, K.; Zisserman, A. Very Deep Convolutional Networks for Large-Scale Image Recognition. In Proceedings of the 3rd International Conference on Learning Representations, ICLR 2015, Conference Track Proceedings; Bengio, Y., LeCun, Y., Eds.; San Diego, CA, USA, May 7-9, 2015, 2015.
- Cira, C.-I.; Alcarria, R.; Manso-Callejo, M.-Á.; Serradilla, F. A Deep Learning-Based Solution for Large-Scale Extraction of the Secondary Road Network from High-Resolution Aerial Orthoimagery. Applied Sciences 2020, 10, 1–18. [Google Scholar] [CrossRef]
- Cira, C.-I.; Manso-Callejo, M.-Á.; Alcarria, R.; Bordel Sánchez, B.B.; González Matesanz, J.G. State-Level Mapping of the Road Transport Network from Aerial Orthophotography: An End-to-End Road Extraction Solution Based on Deep Learning Models Trained for Recognition, Semantic Segmentation and Post-Processing with Conditional Generative Learning. Remote Sensing 2023, 15, 2099. [Google Scholar] [CrossRef]
- Unel, F.O.; Ozkalayci, B.O.; Cigla, C. The Power of Tiling for Small Object Detection. In Proceedings of the 2019 IEEE/CVF Conference on Computer Vision and Pattern Recognition Workshops (CVPRW); IEEE: Long Beach, CA, USA, June 2019; pp. 582–591.
- Akyon, F.C.; Onur Altinuc, S.; Temizel, A. Slicing Aided Hyper Inference and Fine-Tuning for Small Object Detection. In Proceedings of the 2022 IEEE International Conference on Image Processing (ICIP); IEEE: Bordeaux, France, October 16 2022; pp. 966–970.
- Zeng, G.; Zheng, G. Holistic Decomposition Convolution for Effective Semantic Segmentation of Medical Volume Images. Medical Image Analysis 2019, 57, 149–164. [Google Scholar] [CrossRef] [PubMed]
- An, Y.; Ye, Q.; Guo, J.; Dong, R. Overlap Training to Mitigate Inconsistencies Caused by Image Tiling in CNNs. In Artificial Intelligence XXXVII; Bramer, M., Ellis, R., Eds.; Lecture Notes in Computer Science; Springer International Publishing: Cham, 2020; Vol. 12498, pp. 35–48 ISBN 978-3-030-63798-9.
- Abrahams, E.; Snow, T.; Siegfried, M.R.; Pérez, F. A Concise Tiling Strategy for Preserving Spatial Context in Earth Observation Imagery 2024.
- Chun, C.; Ryu, S.-K. Road Surface Damage Detection Using Fully Convolutional Neural Networks and Semi-Supervised Learning. Sensors 2019, 19, 5501. [Google Scholar] [CrossRef]
- Maeda, H.; Sekimoto, Y.; Seto, T.; Kashiyama, T.; Omata, H. Road Damage Detection Using Deep Neural Networks with Images Captured Through a Smartphone. CoRR 2018, abs/1801.09454.
- Liang, H.; Lee, S.-C.; Seo, S. Automatic Recognition of Road Damage Based on Lightweight Attentional Convolutional Neural Network. Sensors 2022, 22, 9599. [Google Scholar] [CrossRef] [PubMed]
- Rajendran, T.; N, M.Imtiaz.; K, Jagadeesh.; D, A.Kareem. Road Obstacles Detection Using Convolution Neural Network and Report Using IoT. In Proceedings of the 2022 4th International Conference on Smart Systems and Inventive Technology (ICSSIT); IEEE: Tirunelveli, India, January 20 2022; pp. 22–26.
- Zhang, T.; Wang, D.; Lu, Y. Benchmark Study on a Novel Online Dataset for Standard Evaluation of Deep Learning-Based Pavement Cracks Classification Models. KSCE J Civ Eng 2024, 28, 1267–1279. [Google Scholar] [CrossRef]
- Fu, R.; Cao, M.; Novák, D.; Qian, X.; Alkayem, N.F. Extended Efficient Convolutional Neural Network for Concrete Crack Detection with Illustrated Merits. Automation in Construction 2023, 156, 105098. [Google Scholar] [CrossRef]
- Guzmán-Torres, J.A.; Morales-Rosales, L.A.; Algredo-Badillo, I.; Tinoco-Guerrero, G.; Lobato-Báez, M.; Melchor-Barriga, J.O. Deep Learning Techniques for Multi-Class Classification of Asphalt Damage Based on Hamburg-Wheel Tracking Test Results. Case Studies in Construction Materials 2023, 19, e02378. [Google Scholar] [CrossRef]
- He, L.; Peng, B.; Tang, D.; Li, Y. Road Extraction Based on Improved Convolutional Neural Networks with Satellite Images. Applied Sciences 2022, 12, 10800. [Google Scholar] [CrossRef]
- Fakhri, S.A.; Shah-Hosseini, R. Improved Road Detection Algorithm Based on Fusion of Deep Convolutional Neural Networks and Random Forest Classifier on VHR Remotely-Sensed Images. J Indian Soc Remote Sens 2022, 50, 1409–1421. [Google Scholar] [CrossRef]
- Zhu, Y.; Yan, J.; Wang, C.; Zhou, Y. Road Detection of Remote Sensing Image Based on Convolutional Neural Network. In Image and Graphics; Zhao, Y., Barnes, N., Chen, B., Westermann, R., Kong, X., Lin, C., Eds.; Lecture Notes in Computer Science; Springer International Publishing: Cham, 2019; Vol. 11902, pp. 106–118 ISBN 978-3-030-34109-1.
- Jiang, Y. Research on Road Extraction of Remote Sensing Image Based on Convolutional Neural Network. J Image Video Proc. 2019, 2019, 31. [Google Scholar] [CrossRef]
- Higuchi, R.; Fujimoto, Y. Road and Intersection Detection Using Convolutional Neural Network. In Proceedings of the 2020 IEEE 16th International Workshop on Advanced Motion Control (AMC); IEEE: Kristiansand, Norway, September 14 2020; pp. 363–366.
- Eltaher, F.; Miralles-Pechuán, L.; Courtney, J.; Mckeever, S. Detecting Road Intersections from Satellite Images Using Convolutional Neural Networks. In Proceedings of the Proceedings of the 38th ACM/SIGAPP Symposium on Applied Computing; ACM: Tallinn Estonia, March 27 2023; pp. 495–498.
- Dewangan, D.K.; Sahu, S.P. RCNet: Road Classification Convolutional Neural Networks for Intelligent Vehicle System. Intel Serv Robotics 2021, 14, 199–214. [Google Scholar] [CrossRef]
- Lee, S.-K.; Yoo, J.; Lee, C.-H.; An, K.; Yoon, Y.-S.; Lee, J.; Yeom, G.-H.; Hwang, S.-U. Road Type Classification Using Deep Learning for Tire-Pavement Interaction Noise Data in Autonomous Driving Vehicle. Applied Acoustics 2023, 212, 109597. [Google Scholar] [CrossRef]
- Cira, C.-I. ; Alcarria, Ramón; Manso-Callejo, Miguel Ángel; Serradilla, Francisco A Deep Convolutional Neural Network to Detect the Existence of Geospatial Elements in High-Resolution Aerial Imagery. Proceedings 2019, 19, 1–4. [Google Scholar] [CrossRef]
- Cira, C.-I.; Díaz-Álvarez, A.; Serradilla, F.; Manso-Callejo, M.-Á. Convolutional Neural Networks Adapted for Regression Tasks: Predicting the Orientation of Straight Arrows on Marked Road Pavement Using Deep Learning and Rectified Orthophotography. Electronics 2023, 12, 3980. [Google Scholar] [CrossRef]
- Cira, C.-I.; Alcarria, R.; Manso-Callejo, M.-Á.; Serradilla, F. A Framework Based on Nesting of Convolutional Neural Networks to Classify Secondary Roads in High Resolution Aerial Orthoimages. Remote Sensing 2020, 12, 1–22. [Google Scholar] [CrossRef]
- de la Fuente Castillo, V.; Díaz-Álvarez, A.; Manso-Callejo, M.-Á.; Serradilla García, F. Grammar Guided Genetic Programming for Network Architecture Search and Road Detection on Aerial Orthophotography. Applied Sciences 2020, 10, 3953. [Google Scholar] [CrossRef]
- Alshaikhli, T.; Liu, W.; Maruyama, Y. Automated Method of Road Extraction from Aerial Images Using a Deep Convolutional Neural Network. Applied Sciences 2019, 9, 4825. [Google Scholar] [CrossRef]
- Zhang, Z.; Zhang, X.; Sun, Y.; Zhang, P. Road Centerline Extraction from Very-High-Resolution Aerial Image and LiDAR Data Based on Road Connectivity. Remote Sensing 2018, 10, 1284. [Google Scholar] [CrossRef]
- Centro Nacional de Información Geográfica, Instituto Geográfico Nacional Plan Nacional de Ortofotografía Aérea. Available online: https://pnoa.ign.es/ (accessed on 10 March 2024).
- Fischer, H. A History of the Central Limit Theorem: From Classical to Modern Probability Theory; Springer New York: New York, NY, 2011; ISBN 978-0-387-87856-0.
- Manso-Callejo, M.A.; Cira, C.-I.; Alcarria, R.; Gonzalez Matesanz, F.J. First Dataset of Wind Turbine Data Created at National Level with Deep Learning Techniques from Aerial Orthophotographs with a Spatial Resolution of 0.5 m/Pixel. IEEE J. Sel. Top. Appl. Earth Observations Remote Sensing 2021, 14, 7968–7980. [Google Scholar] [CrossRef]
- Manso-Callejo, M.-Á.; Cira, C.-I.; Arranz-Justel, J.-J.; Sinde-González, I.; Sălăgean, T. Assessment of the Large-Scale Extraction of Photovoltaic (PV) Panels with a Workflow Based on Artificial Neural Networks and Algorithmic Postprocessing of Vectorization Results. International Journal of Applied Earth Observation and Geoinformation 2023, 125, 103563. [Google Scholar] [CrossRef]
- Agarap, A.F. Deep Learning Using Rectified Linear Units (ReLU). CoRR 2018, abs/1803.08375.
- Kingma, D.P.; Ba, J. Adam: A Method for Stochastic Optimization. In Proceedings of the 3rd International Conference on Learning Representations, ICLR 2015, Conference Track Proceedings; Bengio, Y., LeCun, Y., Eds.; San Diego, CA, USA, May 7-9, 2015, 2015.
- Chollet, F. Keras. Available online: https://github.com/fchollet/keras (accessed on 14 May 2020).
- Abadi, M.; Barham, P.; Chen, J.; Chen, Z.; Davis, A.; Dean, J.; Devin, M.; Ghemawat, S.; Irving, G.; Isard, M.; et al. TensorFlow: A System for Large-Scale Machine Learning.; Savannah, GA, USA, November 2 2016; p. 21.
- Manso Callejo, M.A.; Cira, C.-I.; Iturrioz, T.; Serradilla Garcia, F. Train and Evaluation Code, Road Classification Models and Test Set of the Paper “Impact of Image Resolution and Image Overlap on the Prediction Performance of Convolutional Neural Networks Trained for Road Classification” 2024.
- IBM Corp IBM SPSS Statistics for Macintosh.
Figure 1.
Map with the distribution of the regions covered by the orthophotos used in the study. Note: Each number within the map represents the official zone nomenclature found in the 1:50,000 National Topographic Map that is produced by the National Geographical Institute of Spain.
Figure 1.
Map with the distribution of the regions covered by the orthophotos used in the study. Note: Each number within the map represents the official zone nomenclature found in the 1:50,000 National Topographic Map that is produced by the National Geographical Institute of Spain.
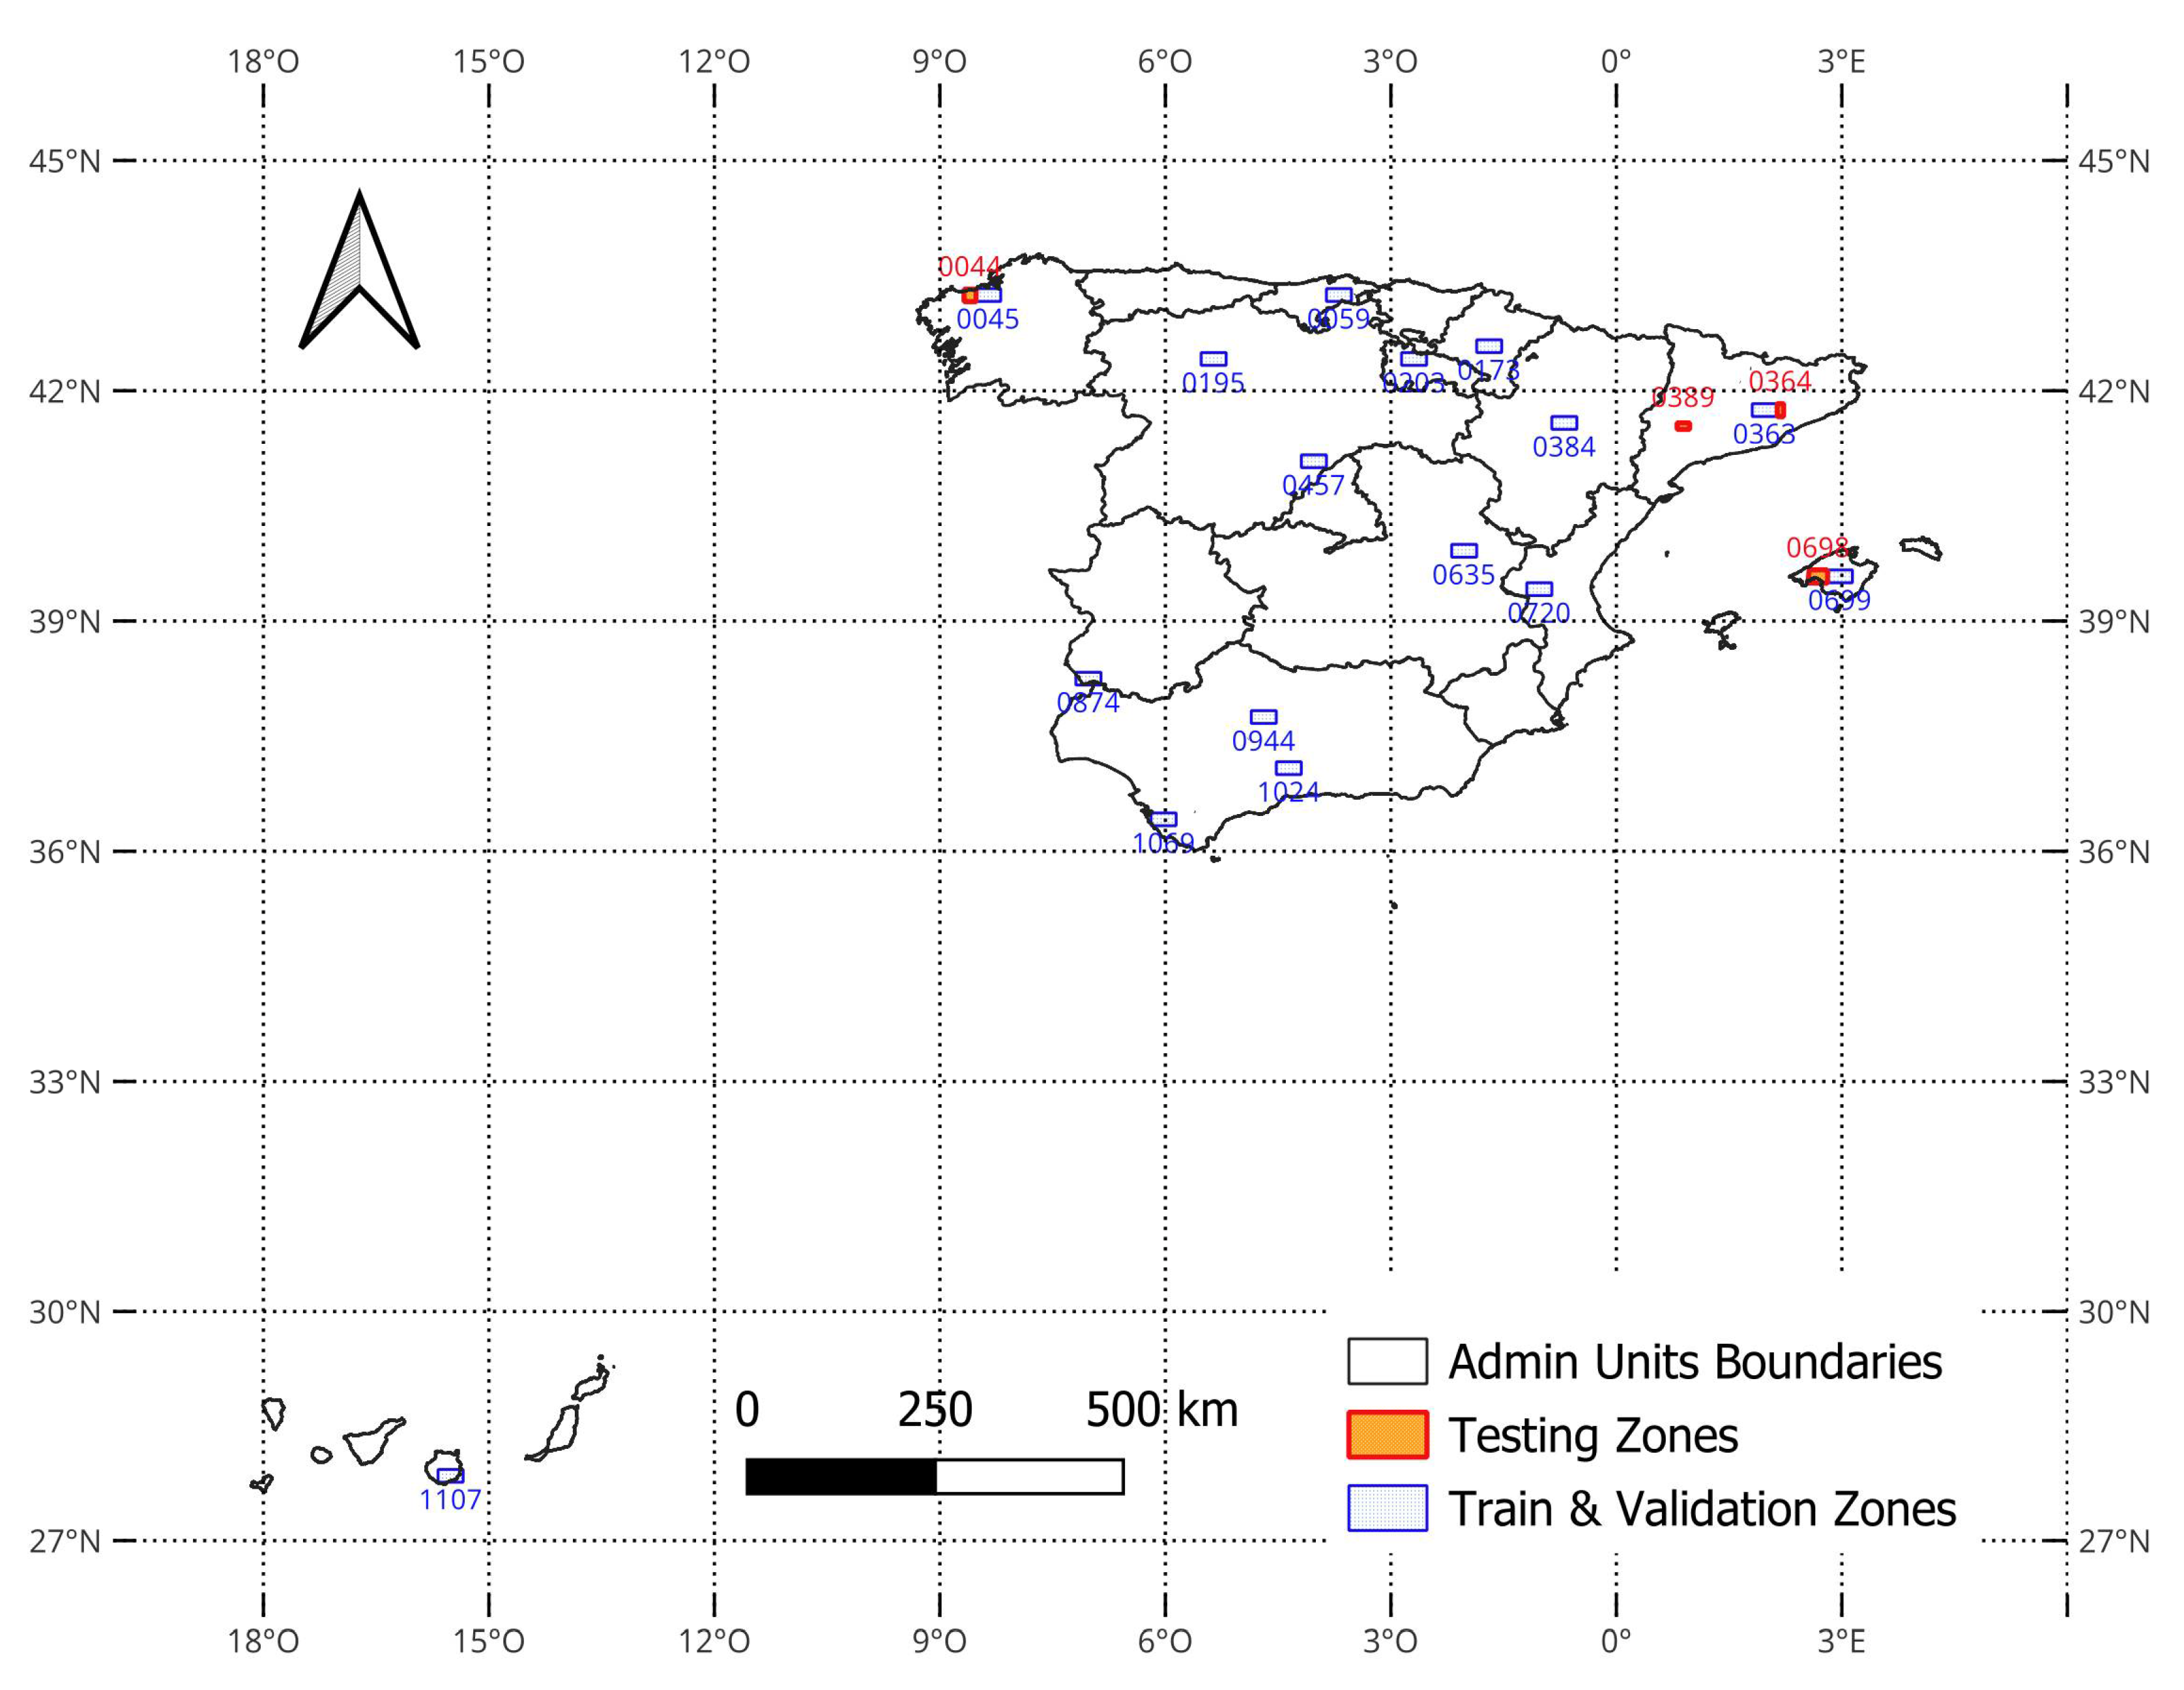
Figure 2.
Boxplots of the performance metrics obtained by the road classification models grouped by their training IDs in terms of (a) F1 scores (b) ROC-AUC scores and (c) loss values.
Figure 2.
Boxplots of the performance metrics obtained by the road classification models grouped by their training IDs in terms of (a) F1 scores (b) ROC-AUC scores and (c) loss values.
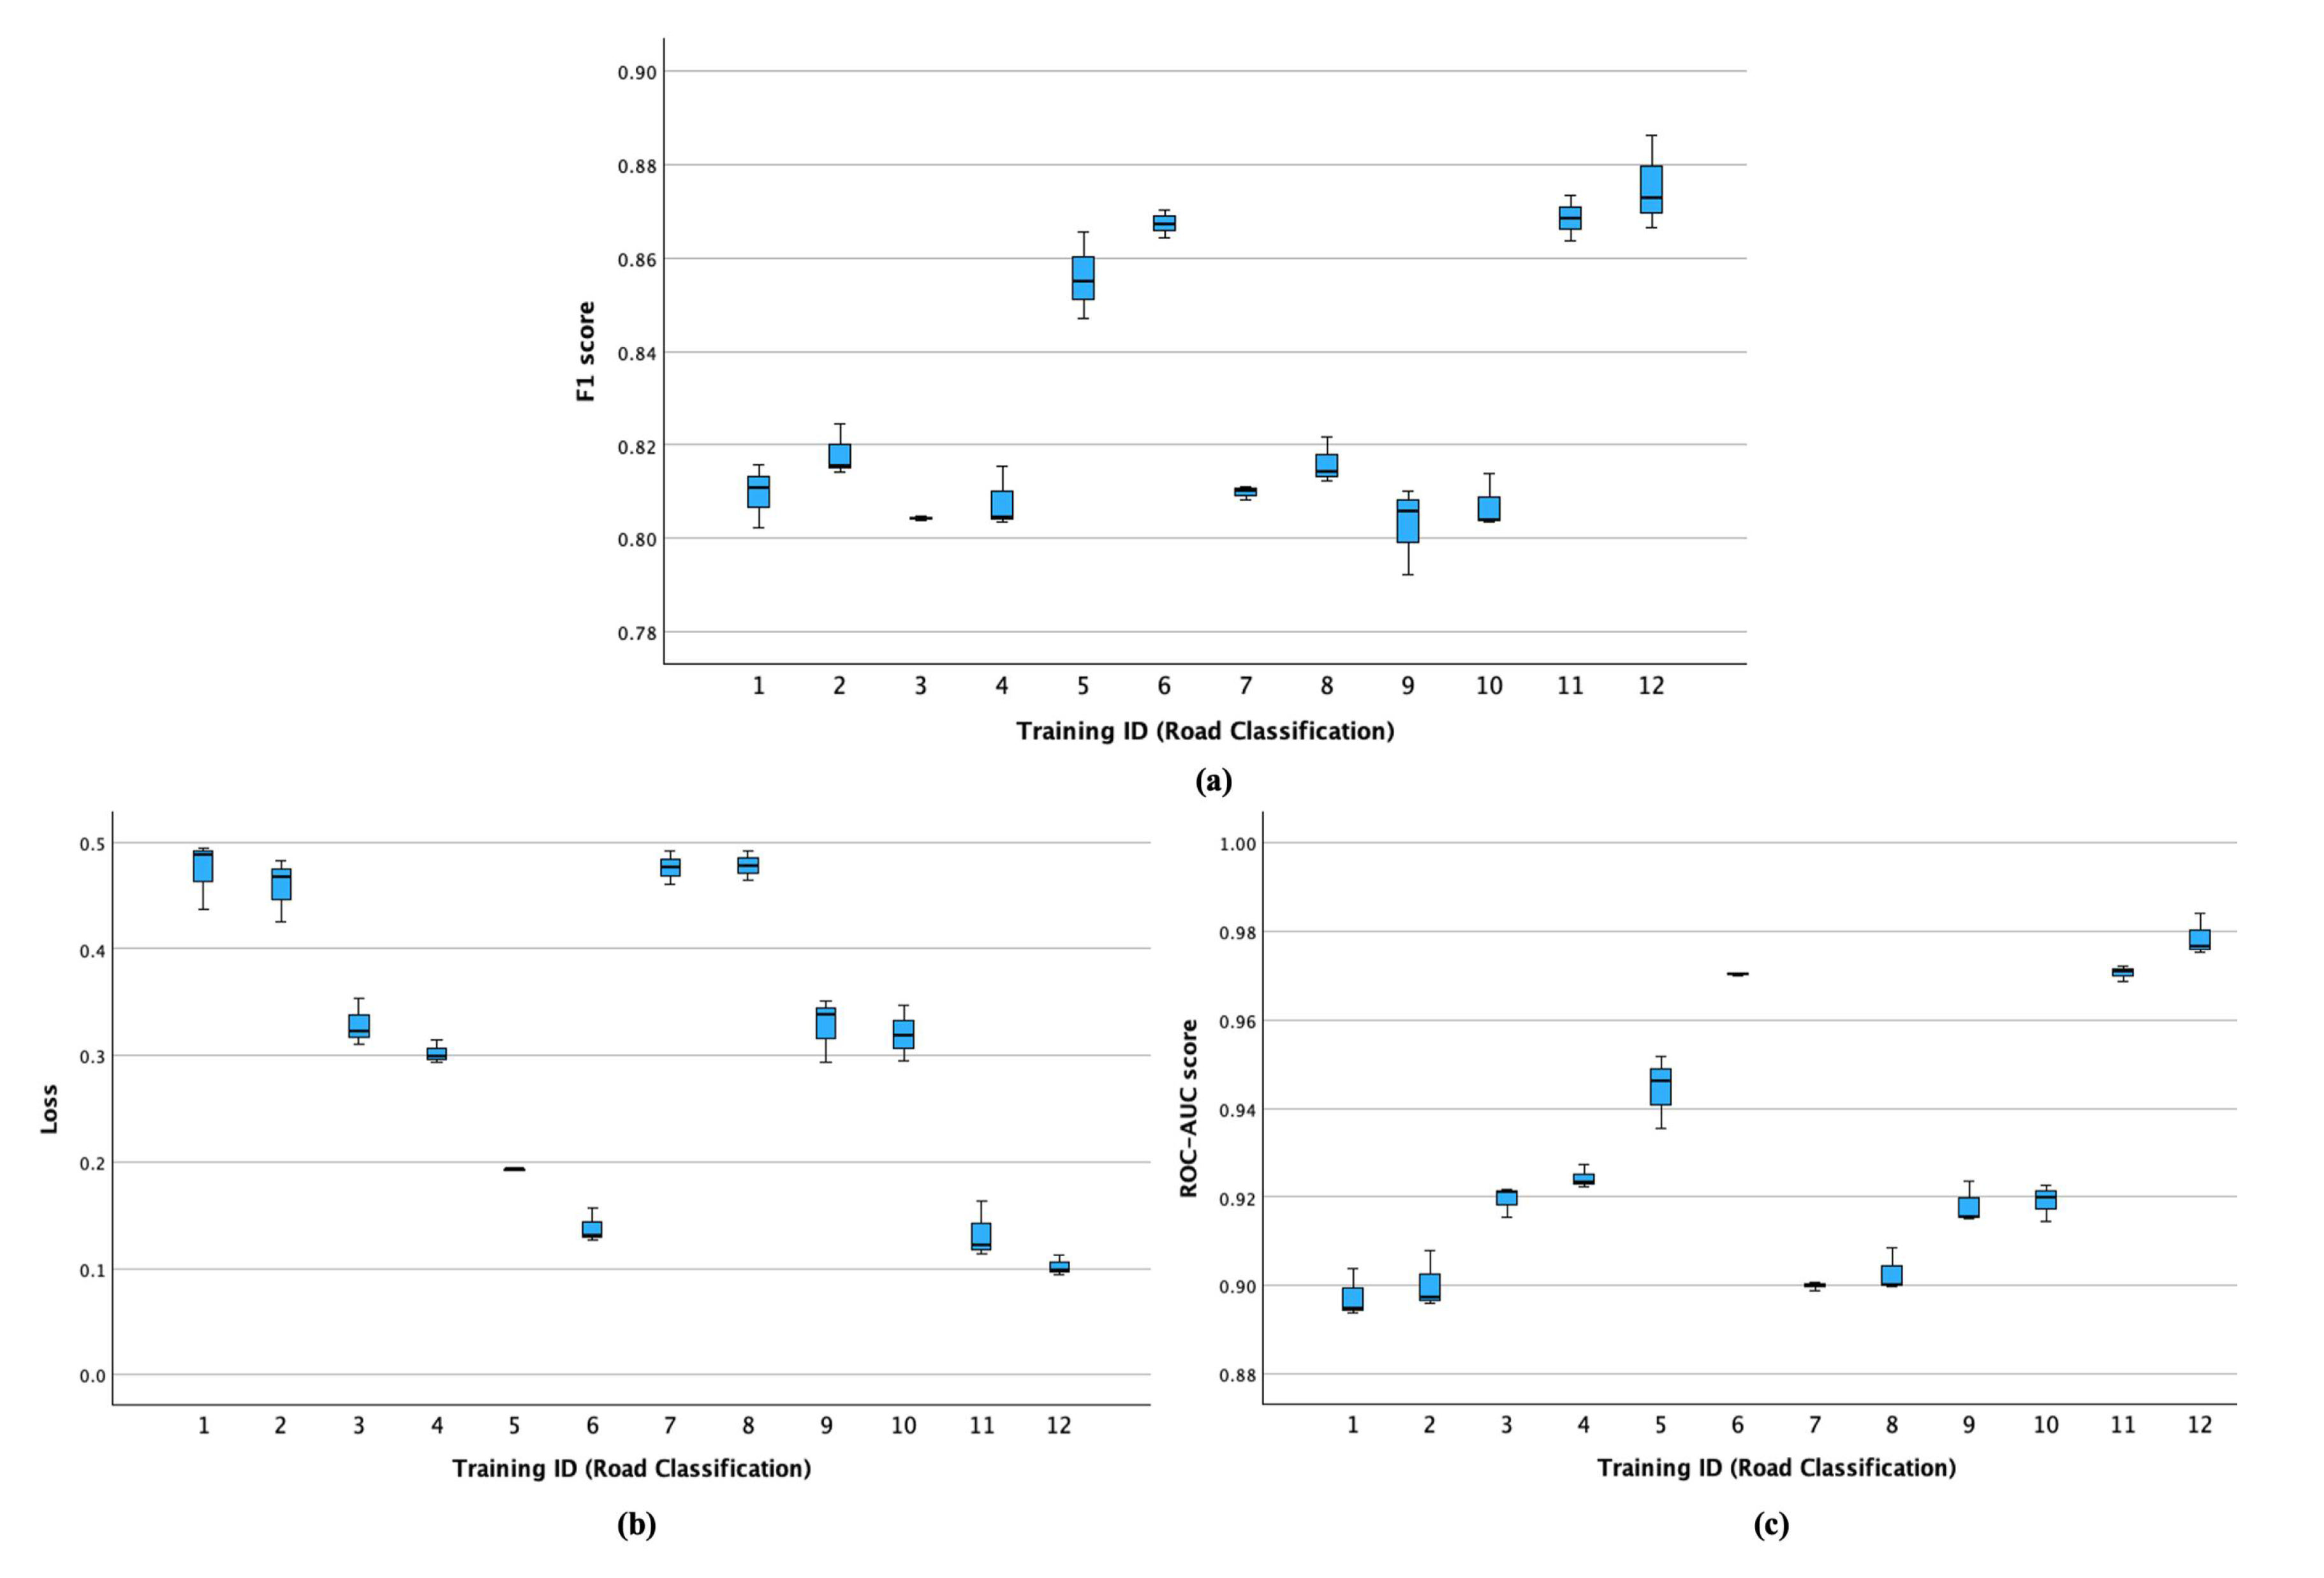
Figure 3.
Confusion matrices obtained by the model that achieved the highest mean metrics in scenario ID 12 (VGG-v2 network trained with tiles featuring a size of 1024 × 1024 pixels and an overlap of 12.5%) on (a) the train set containing , (b) the validation set containing tiles, and (c) on unseen data (test set containing tiles). Note: The ratios of true and false predictions between sets are similar and indicate a good performance (lack of underfitting) and a lack of overfitting behaviour.
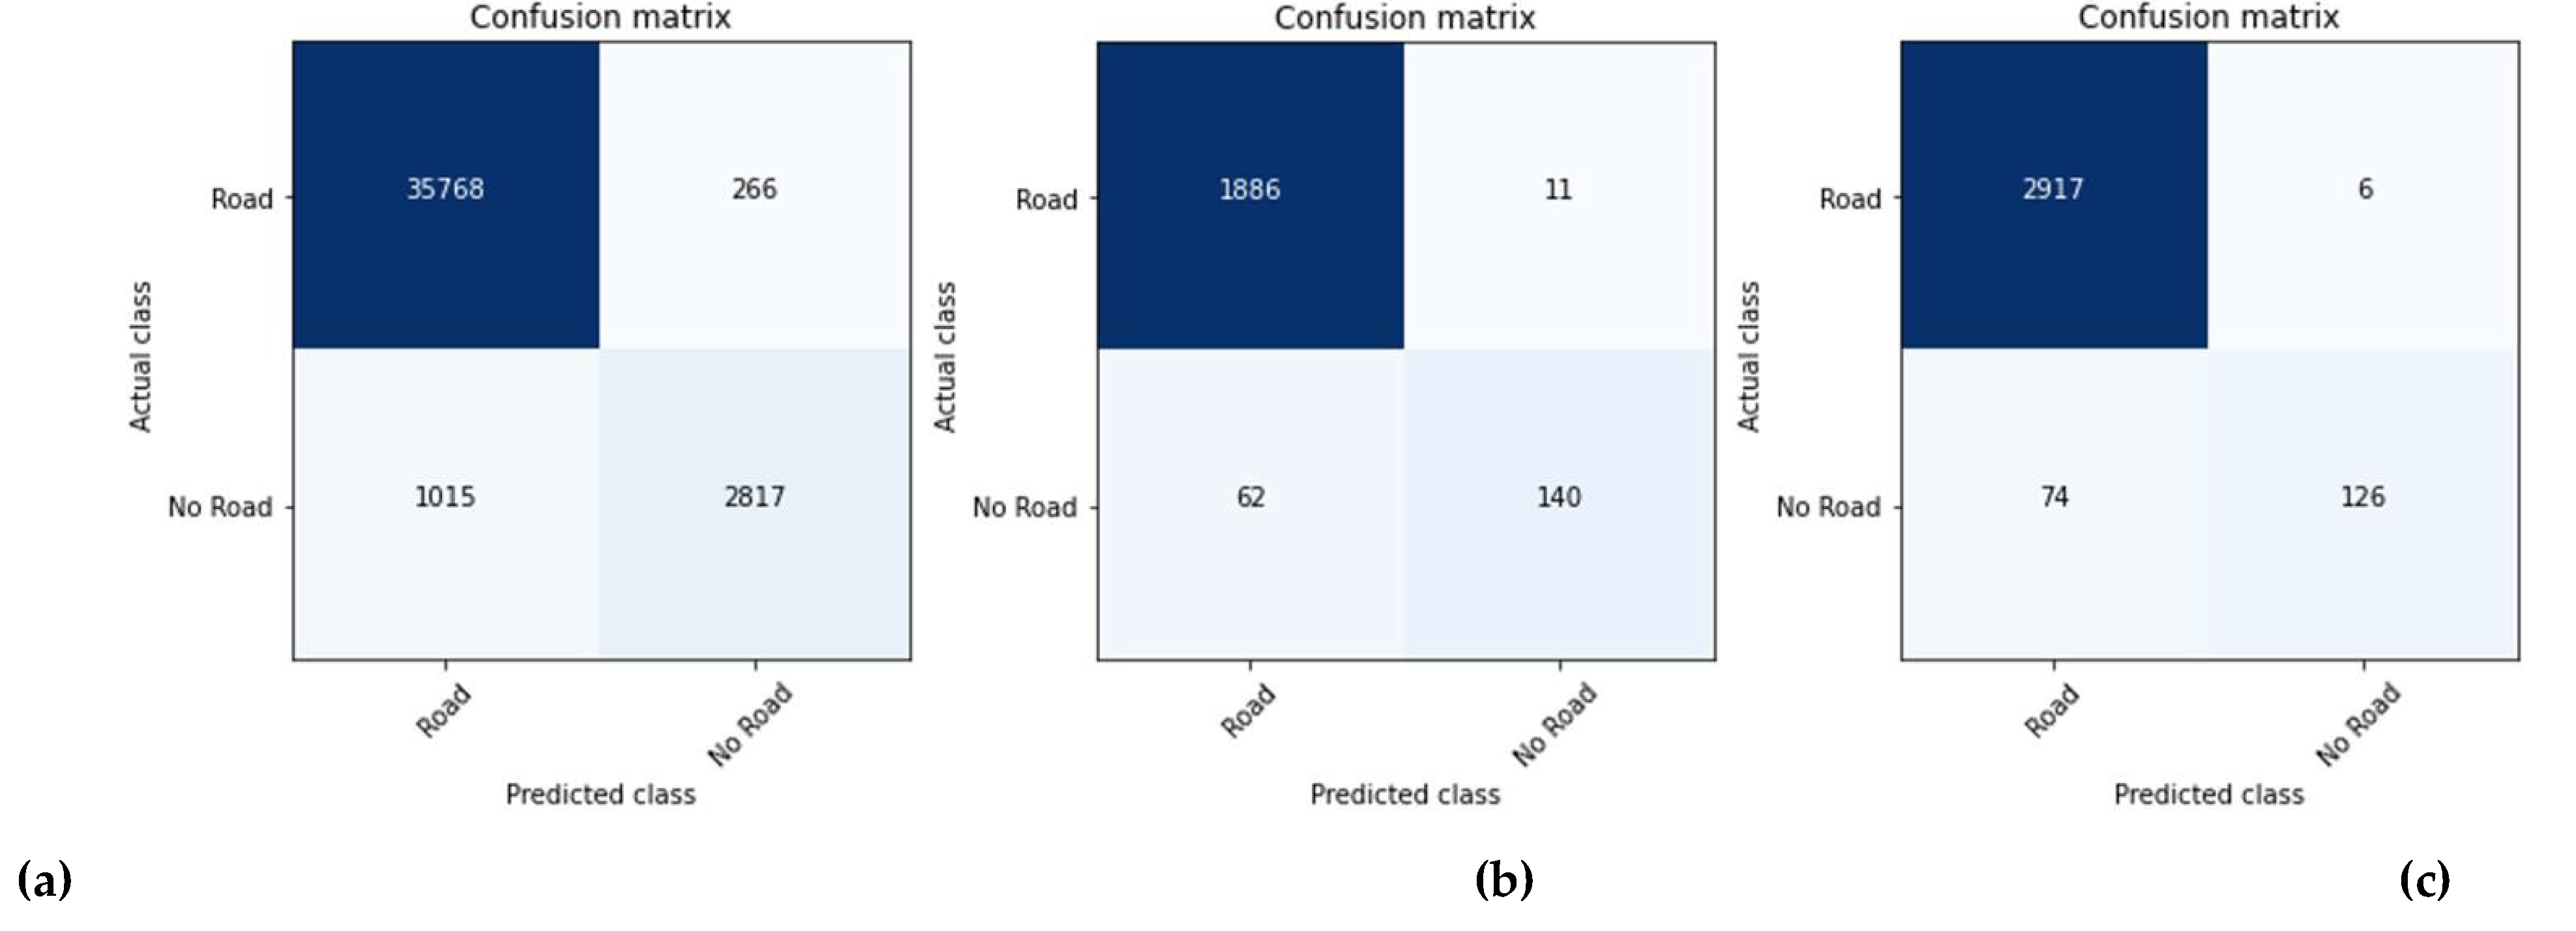
Figure 4.
Boxplots of the F1 score, ROC-AUC scores and loss values grouped by the levels of (a), (b), (c) tile size, (d), (e), (f) tile overlap and (g), (h), (i) road classification model, respectively.
Figure 4.
Boxplots of the F1 score, ROC-AUC scores and loss values grouped by the levels of (a), (b), (c) tile size, (d), (e), (f) tile overlap and (g), (h), (i) road classification model, respectively.
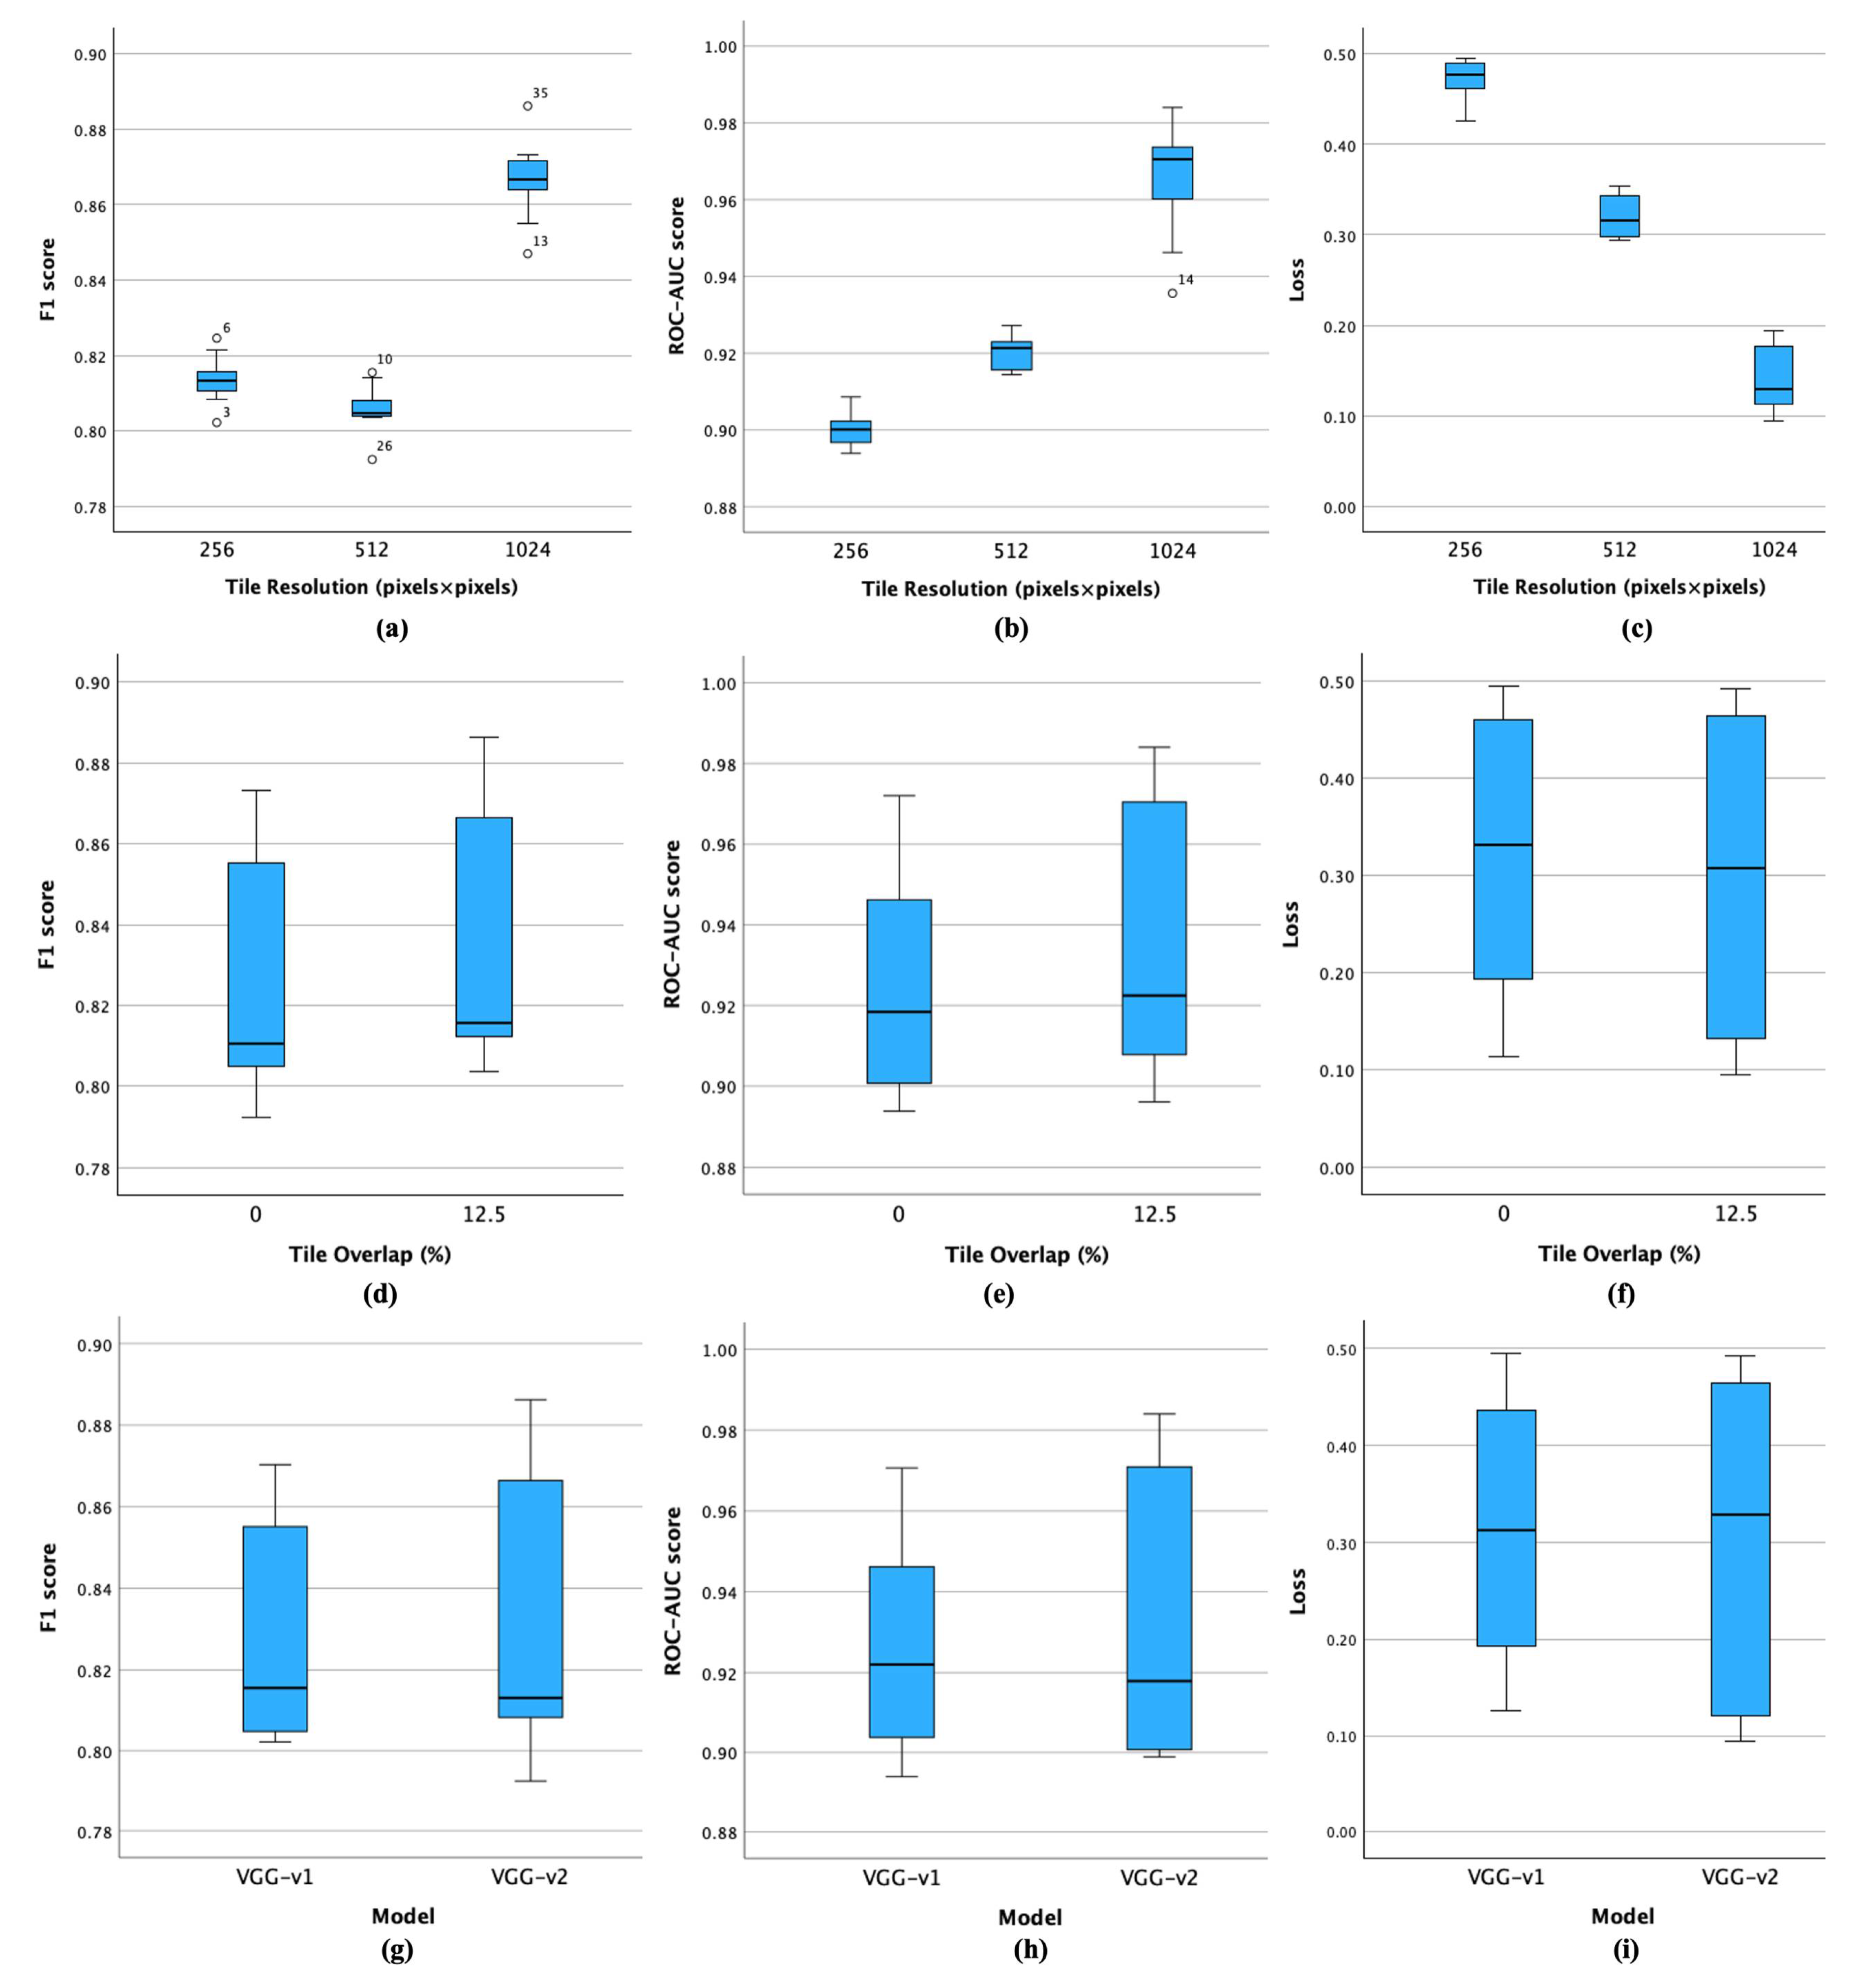
Figure 5.
Estimated Marginal Means (EMMs) of the two-way interaction between the tile size and overlap (Size * Overlap) on the (a) F1 score (d) ROC-AUC score and (g) loss value together with the EMMs of the three-way interaction effect between the CNN architecture, the tile size, and tile overlap as fixed factors (Model * Size * Overlap) on the (a), (b) F1 score, (c), (d), ROC-AUC score and (e), (f) loss value.
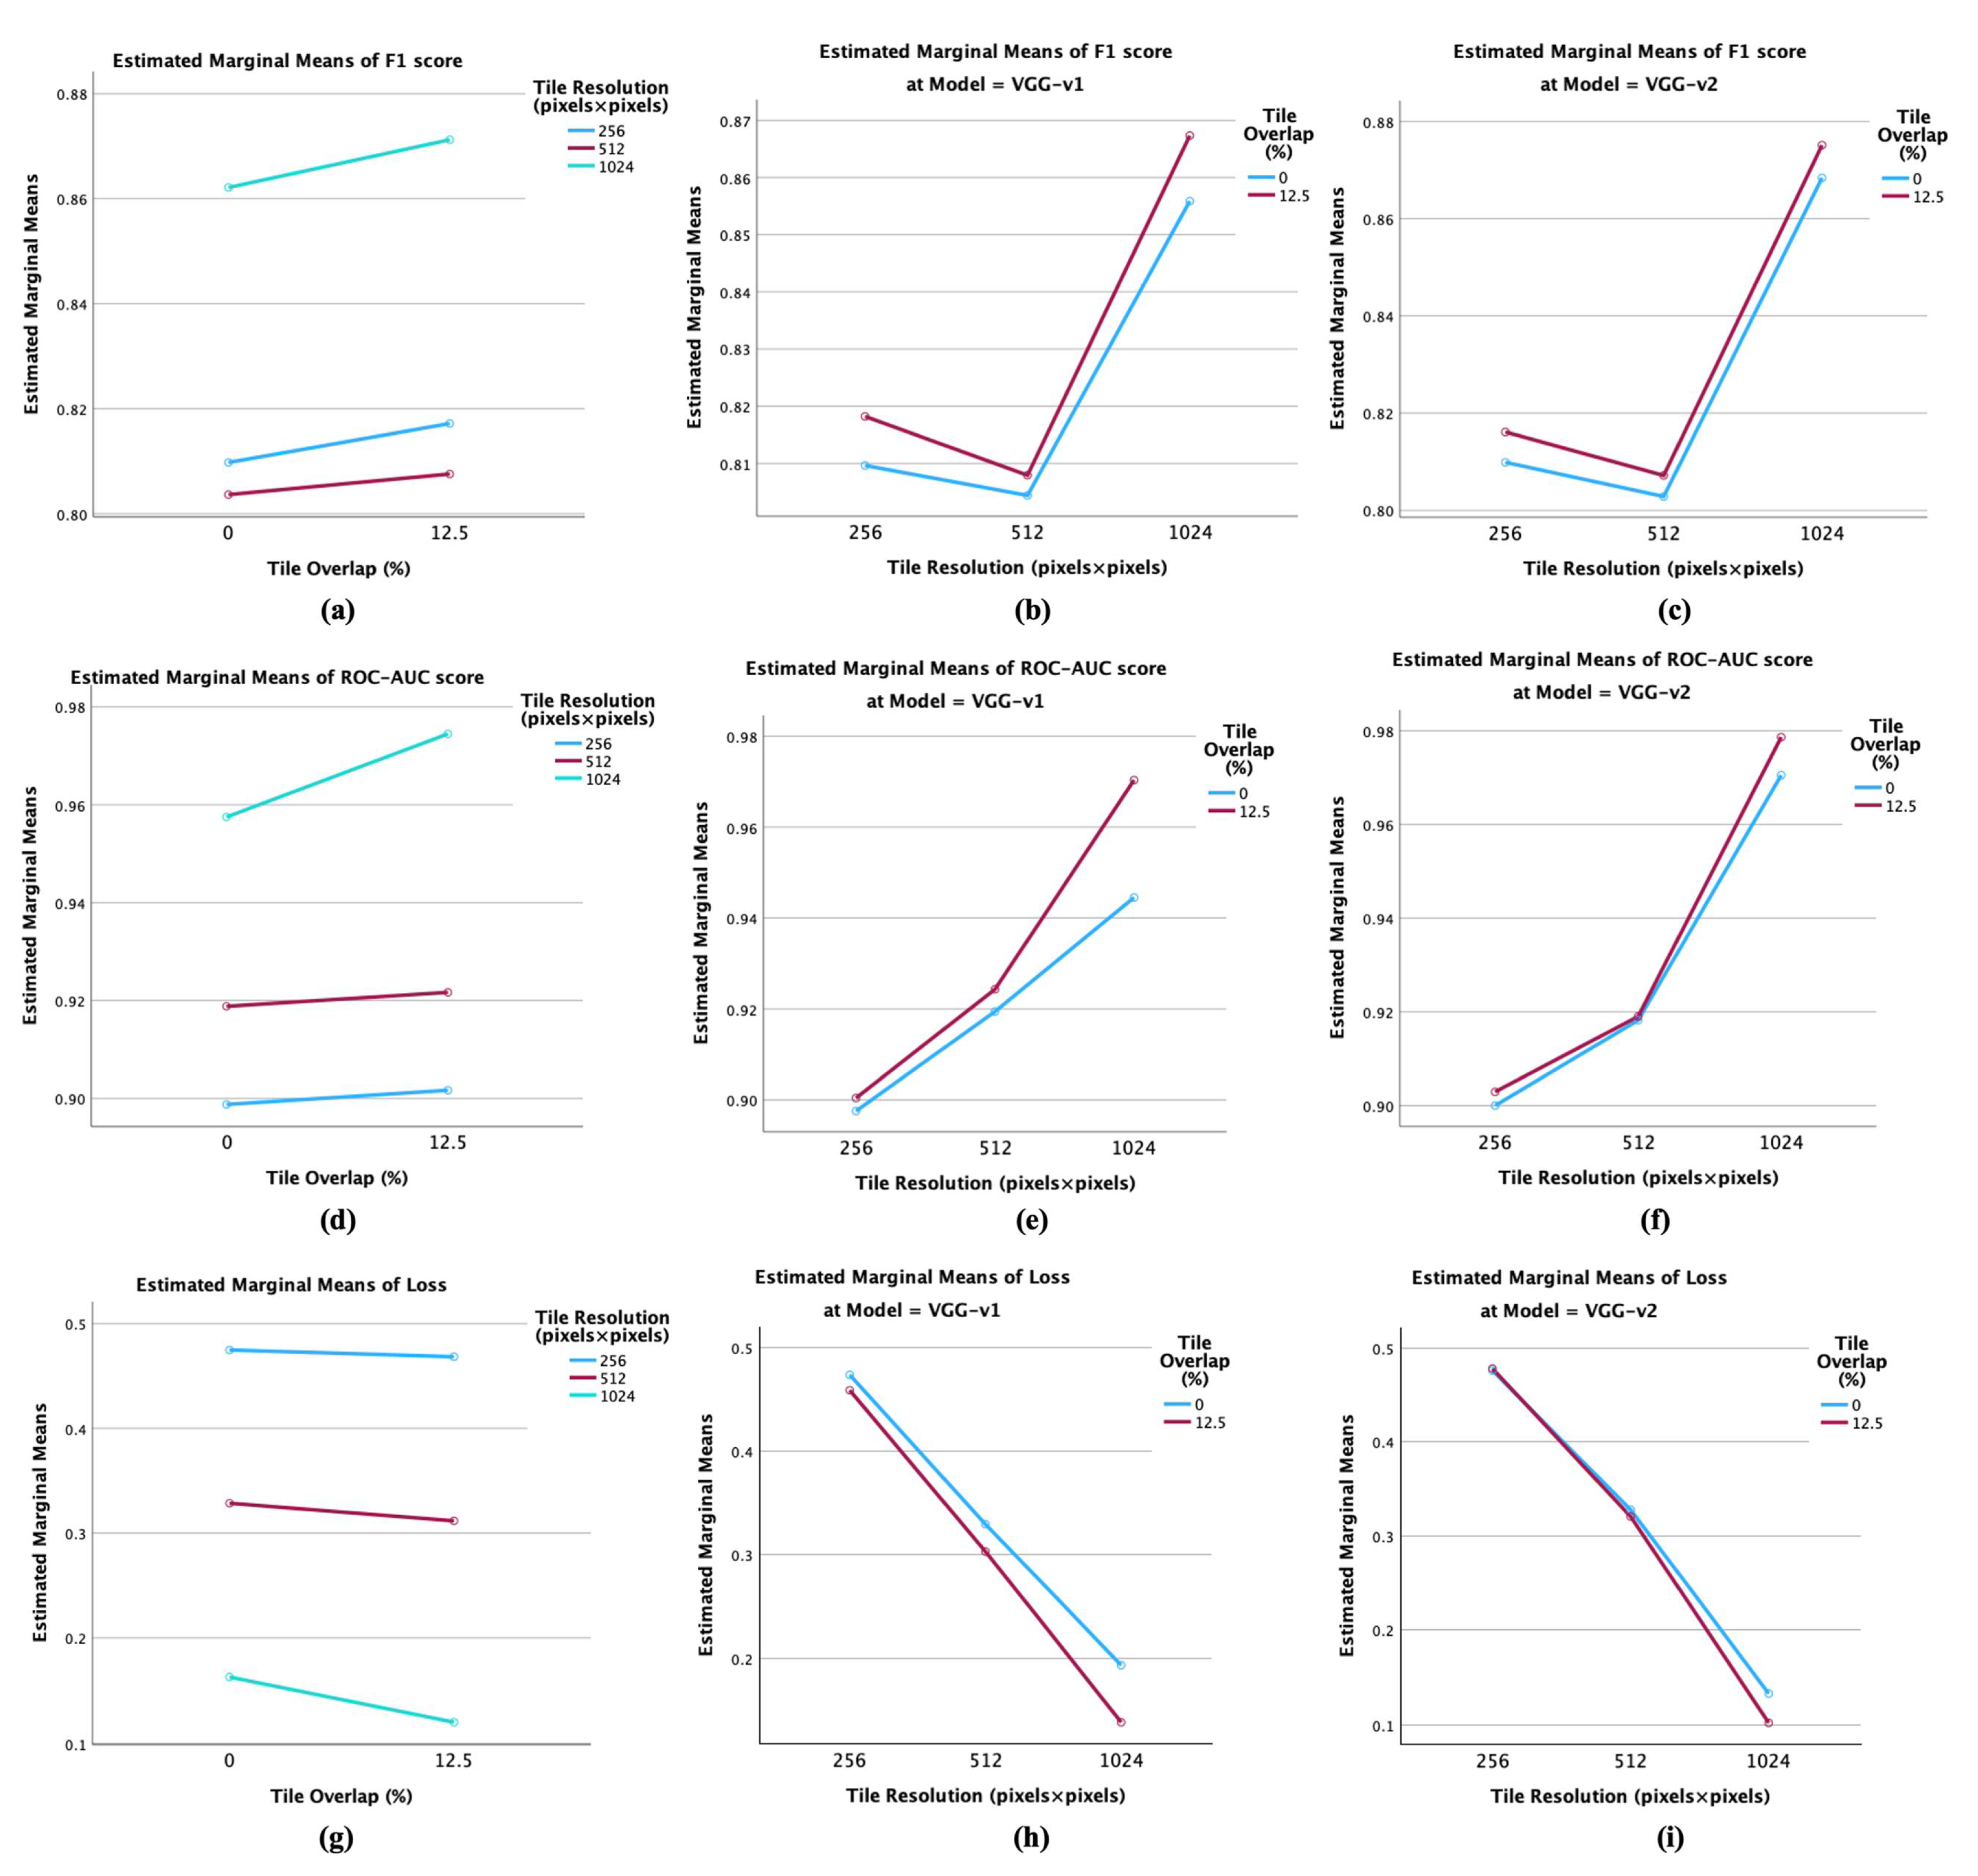

Table 1.
Distribution of the image tiles for the road classification task in the train, validation, and test sets.
Table 1.
Distribution of the image tiles for the road classification task in the train, validation, and test sets.
| Tile size (pixels) | Tile overlap (%) |
Set | Class (no. images) | |
| Road | No Road | |||
| 256 × 256 | 0% | Train | 237,919 | 262,879 |
| Validation | 12,523 | 13,826 | ||
| Percentage of data | 47.51% | 52.49% | ||
| 12.5% | Train | 312,092 | 340,567 | |
| Validation | 16,426 | 17,925 | ||
| Percentage of data | 47.82% | 52.18% | ||
| Test set (novel area, no overlap) | 33,584 | 18,255 | ||
| Percentage of data | 64.79% | 35.21% | ||
| 512 × 512 | 0% | Train | 90,475 | 34,085 |
| Validation | 4,762 | 1794 | ||
| Percentage of data | 72.64% | 27.36% | ||
| 12.5% | Train | 118,078 | 42,448 | |
| Validation | 6215 | 2287 | ||
| Percentage of data | 73.53% | 26.47% | ||
| Test set (novel area, no overlap) | 10,916 | 1871 | ||
| Percentage of data | 85.37% | 14.63% | ||
| 1024 × 1024 | 0% | Train | 27,705 | 3124 |
| Validation | 1457 | 165 | ||
| Percentage of data | 89.86% | 10.14% | ||
| 12.5% | Train | 36,034 | 3,832 | |
| Validation | 1897 | 202 | ||
| Percentage of data | 90.39% | 9.61% | ||
| Test set (novel area, no overlap) | 2923 | 200 | ||
| Percentage of data | 93.60% | 6.40% | ||
Notes: (1) The data is organised by the tile sizes, namely 256 × 256, 512 × 512 and 1024 × 1024 pixels and by the percentages of tile overlap (0% and 12.5% overlap). (2) The training and validation sets were obtained by applying a splitting criterion of 95:5% on binary data labelled with road information from an area of approximately 8650 km2. The test set contains novel binary road data covering approximately 825 km2, that were divided in tiles of studied sizes with no overlap. (3) The spatial resolution of the image tiles is 0.5 m. Therefore, a tile of 256 × 256 pixels covers a land area of approximately 0.016 km2, a tile of 512 × 512 pixels covers approximately 0.065 km2, while a tile of 1024 × 1024 pixels covers approximately 0.262 km2.
Table 2.
Training scenarios considered for the road classification with convolutional neural networks.
Table 2.
Training scenarios considered for the road classification with convolutional neural networks.
| Training Scenario ID |
Deep Learning Model | Tile Size (pixels) | Tile Overlap (%) |
|---|---|---|---|
| 1 | VGG-v1 | 256 × 256 | 0 |
| 2 | 12.5 | ||
| 3 | VGG-v1 | 512 × 512 | 0 |
| 4 | 12.5 | ||
| 5 | VGG-v1 | 1024 × 1024 | 0 |
| 6 | 12.5 | ||
| 7 | VGG-v2 | 256 × 256 | 0 |
| 8 | 12.5 | ||
| 9 | VGG-v2 | 512 × 512 | 0 |
| 10 | 12.5 | ||
| 11 | VGG-v2 | 1024 × 1024 | 0 |
| 12 | 12.5 |
Note: The training of each scenario was repeated three times to enable the statistical analysis (as ANOVA is valid with as little as three samples) and to control the randomness effect associated with the DL models convergence.
Table 3.
Means and their standard deviations, F-statistics and their p-value, together with Eta (η) and Eta squared (η²) association measures (ANOVA results) of the loss, accuracy, F1 score, precision, recall and ROC-AUC score as dependent variables and the training scenarios as fixed factor.
Table 3.
Means and their standard deviations, F-statistics and their p-value, together with Eta (η) and Eta squared (η²) association measures (ANOVA results) of the loss, accuracy, F1 score, precision, recall and ROC-AUC score as dependent variables and the training scenarios as fixed factor.
| Independent Variable | Category ж (Training ж Scenario ID) | Statistical Measure | Loss | Accuracy | F1 score | Precision | Recall | ROC-AUC score | |
| Training Scenario ID (Road Classification) | 1 | Mean | 0.4736 | 0.8272 | 0.8096 | 0.8116 | 0.8081 | 0.8976 | |
| Std. Deviation | 0.0322 | 0.0053 | 0.0069 | 0.0054 | 0.0089 | 0.0054 | |||
| 2 | Mean | 0.4587 | 0.8325 | 0.8182 | 0.8156 | 0.8214 | 0.9004 | ||
| Std. Deviation | 0.0298 | 0.0044 | 0.0056 | 0.0045 | 0.0075 | 0.0064 | |||
| 3 | Mean | 0.3290 | 0.9101 | 0.8044 | 0.8358 | 0.7809 | 0.9194 | ||
| Std. Deviation | 0.0218 | 0.0018 | 0.0005 | 0.0090 | 0.0044 | 0.0033 | |||
| 4 | Mean | 0.3026 | 0.9113 | 0.8079 | 0.8372 | 0.7857 | 0.9243 | ||
| Std. Deviation | 0.0104 | 0.0013 | 0.0066 | 0.0041 | 0.0123 | 0.0025 | |||
| 5 | Mean | 0.1932 | 0.9717 | 0.8559 | 0.9633 | 0.7931 | 0.9445 | ||
| Std. Deviation | 0.0015 | 0.0008 | 0.0093 | 0.0170 | 0.0182 | 0.0082 | |||
| 6 | Mean | 0.1385 | 0.9734 | 0.8673 | 0.9618 | 0.8080 | 0.9703 | ||
| Std. Deviation | 0.0164 | 0.0005 | 0.0030 | 0.0080 | 0.0049 | 0.0003 | |||
| 7 | Mean | 0.4763 | 0.8259 | 0.8099 | 0.8090 | 0.8112 | 0.9000 | ||
| Std. Deviation | 0.0154 | 0.0025 | 0.0015 | 0.0033 | 0.0014 | 0.0010 | |||
| 8 | Mean | 0.4783 | 0.8311 | 0.8161 | 0.8149 | 0.8184 | 0.9029 | ||
| Std. Deviation | 0.0143 | 0.0068 | 0.0049 | 0.0084 | 0.0027 | 0.0049 | |||
| 9 | Mean | 0.3278 | 0.9088 | 0.8029 | 0.8312 | 0.7814 | 0.9182 | ||
| Std. Deviation | 0.0303 | 0.0026 | 0.0093 | 0.0062 | 0.0150 | 0.0048 | |||
| 10 | Mean | 0.3206 | 0.9116 | 0.8072 | 0.8399 | 0.7828 | 0.9190 | ||
| Std. Deviation | 0.0260 | 0.0024 | 0.0059 | 0.0050 | 0.0065 | 0.0042 | |||
| 11 | Mean | 0.1327 | 0.9733 | 0.8684 | 0.9544 | 0.8126 | 0.9705 | ||
| Std. Deviation | 0.0267 | 0.0005 | 0.0048 | 0.0074 | 0.0096 | 0.0017 | |||
| 12 | Mean | 0.1018 | 0.9746 | 0.8751 | 0.9659 | 0.8195 | 0.9786 | ||
| Std. Deviation | 0.0093 | 0.0016 | 0.0101 | 0.0086 | 0.0145 | 0.0047 | |||
| Inferential Statistics | F-statistic | 130.338 | 1115.404 | 60.938 | 216.721 | 7.412 | 130.648 | ||
| p-value | <0.001 | <0.001 | <0.001 | <0.001 | <0.001 | <0.001 | |||
| η | 0.992 | 0.999 | 0.983 | 0.995 | 0.879 | 0.992 | |||
| η² | 0.984 | 0.998 | 0.965 | 0.990 | 0.773 | 0.984 | |||
| Total (Descriptive Statistics) | Mean | 0.3111 | 0.9043 | 0.8286 | 0.8700 | 0.8019 | 0.9288 | ||
| Std. Deviation | 0.1396 | 0.0599 | 0.0284 | 0.0666 | 0.0177 | 0.0292 | |||
Note: (1) The F-statistics and their corresponding p-values and the measures of association are obtained from ANOVA test applied on means to verify if there are significant differences in the performance metrics means (the fixed factor being the Training ID), at a significance level of 0.05. (2) The training scenario with the best performance and the statistically significant ANOVA results on the mean performance metrics are represented in bold.
Table 4.
Homogeneous subsets obtained by applying the Scheffe’s post-hoc test in terms of F1 and ROC-AUC scores and loss grouped by Training IDs at a significance level of 0.05.
Table 4.
Homogeneous subsets obtained by applying the Scheffe’s post-hoc test in terms of F1 and ROC-AUC scores and loss grouped by Training IDs at a significance level of 0.05.
| F1 score | ROC-AUC score | Loss | ||||||||||||
| Training ID | Subset | Training ID | Subset | Training ID | Subset | |||||||||
| 1 | 2 | 1 | 2 | 3 | 4 | 5 | 6 | 1 | 2 | 3 | 4 | |||
| 9 | 0.8029 | 1 | 0.8976 | 12 | 0.1018 | |||||||||
| 3 | 0.8044 | 7 | 0.9000 | 0.9000 | 11 | 0.1327 | 0.1327 | |||||||
| 10 | 0.8072 | 2 | 0.9004 | 0.9004 | 6 | 0.1385 | 0.1385 | |||||||
| 4 | 0.8079 | 8 | 0.9029 | 0.9029 | 0.9029 | 5 | 0.1932 | |||||||
| 1 | 0.8096 | 9 | 0.9182 | 0.9182 | 0.9182 | 4 | 0.3026 | |||||||
| 7 | 0.8099 | 10 | 0.9190 | 0.9190 | 10 | 0.3206 | ||||||||
| 8 | 0.8161 | 3 | 0.9194 | 0.9194 | 9 | 0.3278 | ||||||||
| 2 | 0.8182 | 4 | 0.9243 | 3 | 0.3290 | |||||||||
| 5 | 0.8559 | 5 | 0.9445 | 2 | 0.4587 | |||||||||
| 6 | 0.8673 | 6 | 0.9703 | 1 | 0.4736 | |||||||||
| 11 | 0.8684 | 11 | 0.9705 | 7 | 0.4763 | |||||||||
| 12 | 0.8751 | 12 | 0.9786 | 8 | 0.4783 | |||||||||
| p-value | 0.650 | 0.314 | p-value | 0.997 | 0.051 | 0.107 | 0.990 | 1.000 | 0.910 | p-value | 0.946 | 0.426 | 0.996 | 1.000 |
Notes: (1) Training IDs that are found in the same homogeneous subset display generalisation performance that is not significantly different from each other. (2) If a configuration is not common in two homogeneous subsets, it suggests that there is a statistically significant difference in performance between that training ID and the ones in the other subset. (3) The mean squared error was 4.07-5 for the F1 score, 2.043-5 for the ROC-AUC score and 0 for loss, respectively. (4) The homogeneous subsets with the best mean performance are represented in bold.
Table 5.
ANOVA analysis of the mean road classification metrics across the various levels of tile size, overlap, and CNN architecture.
Table 5.
ANOVA analysis of the mean road classification metrics across the various levels of tile size, overlap, and CNN architecture.
| Independent Variable | Category | Statistical Measure | Loss | Accuracy | F1 score | Precision | Recall | ROC-AUC score | |
| Tile Size (pixels × pixels) |
256 | Mean | 0.4717 | 0.8292 | 0.8135 | 0.8128 | 0.8148 | 0.9002 | |
| Std. Deviation | 0.0222 | 0.0051 | 0.0059 | 0.0056 | 0.0076 | 0.0046 | |||
| 512 | Mean | 0.3200 | 0.9104 | 0.8056 | 0.8360 | 0.7827 | 0.9202 | ||
| Std. Deviation | 0.0228 | 0.0021 | 0.0059 | 0.0063 | 0.0091 | 0.0041 | |||
| 1024 | Mean | 0.1415 | 0.9733 | 0.8667 | 0.9613 | 0.8083 | 0.9660 | ||
| Std. Deviation | 0.0371 | 0.0013 | 0.0096 | 0.0104 | 0.0149 | 0.0140 | |||
| Inferential Statistics | F-statistic | 411.747 | 5730.323 | 246.451 | 1283.264 | 28.559 | 174.008 | ||
| p-value | <0.001 | <0.001 | <0.001 | <0.001 | <0.001 | <0.001 | |||
| η | 0.981 | 0.999 | 0.968 | 0.994 | 0.796 | 0.956 | |||
| η2 | 0.961 | 0.997 | 0.937 | 0.987 | 0.634 | 0.913 | |||
| Tile Overlap (%) |
0 | Mean | 0.3221 | 0.9028 | 0.8252 | 0.8675 | 0.7979 | 0.9250 | |
| Std. Deviation | 0.1339 | 0.0616 | 0.0278 | 0.0677 | 0.0167 | 0.0266 | |||
| 12.5 | Mean | 0.3001 | 0.9057 | 0.8320 | 0.8726 | 0.8060 | 0.9326 | ||
| Std. Deviation | 0.1481 | 0.0600 | 0.0294 | 0.0674 | 0.0181 | 0.0320 | |||
| Inferential Statistics | F-statistic | 0.219 | 0.021 | 0.510 | 0.050 | 1.948 | 0.599 | ||
| p-value | 0.643 | 0.886 | 0.480 | 0.825 | 0.172 | 0.444 | |||
| η | 0.080 | 0.025 | 0.122 | 0.038 | 0.233 | 0.132 | |||
| η2 | 0.006 | 0.001 | 0.015 | 0.001 | 0.054 | 0.017 | |||
| Model (CNN architecture) |
VGG-v1 | Mean | 0.3159 | 0.9044 | 0.8272 | 0.8709 | 0.7995 | 0.9261 | |
| Std. Deviation | 0.1288 | 0.0602 | 0.0261 | 0.0678 | 0.0170 | 0.0263 | |||
| VGG-v2 | Mean | 0.3062 | 0.9042 | 0.8299 | 0.8692 | 0.8043 | 0.9315 | ||
| Std. Deviation | 0.1532 | 0.0613 | 0.0313 | 0.0673 | 0.0184 | 0.0324 | |||
| Inferential Statistics | F-statistic | 0.042 | 0 | 0.080 | 0.006 | 0.654 | 0.307 | ||
| p-value | 0.839 | 0.995 | 0.779 | 0.941 | 0.424 | 0.583 | |||
| η | 0.035 | 0.001 | 0.048 | 0.013 | 0.137 | 0.095 | |||
| η2 | 0.001 | 0 | 0.002 | 0 | 0.019 | 0.009 |
Notes: (1) The F-statistics and their corresponding p-values and the measures of association are obtained from ANOVA test on means applied to verify if there are significant differences in the performance metrics means (the fixed factor being the tile size, the overlap, and the trained CNN architecture), at a significance level of 0.05. (2) The levels of the independent variables with the best performance and their statistically significant ANOVA results on the mean performance metrics are represented in bold.
Table 6.
Analysis of the main and interaction effect of the size, overlap and model as fixed factors and loss, F1 and ROC-AUC scores as dependent variables (by means of the “between-subjects table”).
Table 6.
Analysis of the main and interaction effect of the size, overlap and model as fixed factors and loss, F1 and ROC-AUC scores as dependent variables (by means of the “between-subjects table”).
| ID | Source | Dependent Variable | Type III Sum of Squares | df | Mean Square | F | p-value |
| 1 | Corrected Model | F1 score | 0.0273a | 11 | 0.0025 | 60.94 | <0.001 |
| ROC-AUC score | 0.0294b | 11 | 0.0027 | 130.65 | <0.001 | ||
| Loss | 0.6706c | 11 | 0.0610 | 130.34 | <0.001 | ||
| 2 | Intercept | F1 score | 24.7158 | 1 | 24.7158 | 606,928.45 | <0.001 |
| ROC-AUC score | 31.0576 | 1 | 31.0576 | 1,519,926.45 | <0.001 | ||
| Loss | 3.4838 | 1 | 3.4838 | 7,448.61 | <0.001 | ||
| 3 | Model | F1 score | 6.615-5 | 1 | 6.6151-5 | 1.62 | 0.2147 |
| ROC-AUC score | 0.0003 | 1 | 0.0003 | 13.06 | 0.0014 | ||
| Loss | 0.0008 | 1 | 0.0008 | 1.80 | 0.1920 | ||
| 4 | Size | F1 score | 0.0265 | 2 | 0.0133 | 325.37 | <0.001 |
| ROC-AUC score | 0.0273 | 2 | 0.0136 | 667.29 | <0.001 | ||
| Loss | 0.6555 | 2 | 0.3278 | 700.78 | <0.001 | ||
| 5 | Overlap | F1 score | 0.0004 | 1 | 0.0004 | 10.25 | 0.0038 |
| ROC-AUC score | 0.0005 | 1 | 0.0005 | 25.29 | <0.001 | ||
| Loss | 0.0044 | 1 | 0.0044 | 9.32 | 0.0055 | ||
| 6 | Size * Overlap | F1 score | 4.1602-5 | 2 | 2.0801-5 | 0.51 | 0.6064 |
| ROC-AUC score | 0.0004 | 2 | 0.0002 | 9.74 | <0.001 | ||
| Loss | 0.0021 | 2 | 0.0011 | 2.25 | 0.1269 | ||
| 7 | Model * Size | F1 score | 0.0003 | 2 | 0.0001 | 3.07 | 0.0649 |
| ROC-AUC score | 0.0007 | 2 | 0.0003 | 16.30 | <0.001 | ||
| Loss | 0.0068 | 2 | 0.0034 | 7.29 | 0.0034 | ||
| 8 | Model * Overlap | F1 score | 9.8178-6 | 1 | 9.8178-6 | 0.24 | 0.6279 |
| ROC-AUC score | 0.0001 | 1 | 0.0001 | 5.78 | 0.0243 | ||
| Loss | 0.0009 | 1 | 0.0009 | 1.92 | 0.1786 | ||
| 9 | Model * Size * Overlap | F1 score | 1.1549-5 | 2 | 5.7744-6 | 0.14 | 0.8685 |
| ROC-AUC score | 0.0001 | 2 | 6.4747-5 | 3.17 | 0.0601 | ||
| Loss | 1.8477-5 | 2 | 9.2386-6 | 0.02 | 0.9805 | ||
| 10 | Error | F1 score | 0.0010 | 24 | 4.0723-5 | ||
| ROC-AUC score | 0.0005 | 24 | 2.0434-5 | ||||
| Loss | 0.0112 | 24 | 0.0005 | ||||
| 11 | Total | F1 score | 24.7441 | 36 | |||
| ROC-AUC score | 31.0874 | 36 | |||||
| Loss | 4.1656 | 36 | |||||
| 12 | Corrected Total | F1 score | 0.0283 | 35 | |||
| ROC-AUC score | 0.0299 | 35 | |||||
| Loss | 0.6818 | 35 |
Notes: (1) The “df” column indicates the degrees of freedom. (2) “Corrected Model” shows the variation explained by the model for each dependent variable; its adjusted R2 values are 0.950, 0.976 and 0.976 for the F1 and ROC-AUC score, and loss, respectively (corresponding to “a”, “b”, and “c” annotations of Table 6). (3) “Intercept” is the value of the dependent variable when all independent variables are zero. (4) “Model” represents the variation explained by the specific CNN architecture trained. (5) “Size”, “Overlap” and “Model” are the main factors. “Size * Overlap”, “Model * Size”, and “Model * Overlap” represent their two-way interaction effects. “Model * Size * Overlap” represents their three-way interaction. (6) In terms of statistical significance, a p-value < 0.05 is considered significant while a p-value > 0.05 indicates that there is not enough evidence of influence on the dependent variables beyond the main effects on the individual factors. The fixed factors and the interactions with a statistically significant effect on the performance are represented in bold.
Disclaimer/Publisher’s Note: The statements, opinions and data contained in all publications are solely those of the individual author(s) and contributor(s) and not of MDPI and/or the editor(s). MDPI and/or the editor(s) disclaim responsibility for any injury to people or property resulting from any ideas, methods, instructions or products referred to in the content. |
© 2024 by the authors. Licensee MDPI, Basel, Switzerland. This article is an open access article distributed under the terms and conditions of the Creative Commons Attribution (CC BY) license (http://creativecommons.org/licenses/by/4.0/).
Copyright: This open access article is published under a Creative Commons CC BY 4.0 license, which permit the free download, distribution, and reuse, provided that the author and preprint are cited in any reuse.


