
Submitted:
12 July 2024
Posted:
12 July 2024
You are already at the latest version
Abstract
The catastrophic twin earthquakes that struck southern Turkey and northern Syria on February 6 2023, caused massive casualties and extensive damage to infrastructure, with the province of Hatay bearing the brunt of the impact. To investigate the potential of nighttime light (NTL) data for earthquake disaster assessment, we performed an analysis of pre- and post-earthquake NPP-VIIRS and SDGSAT-1 NTL data. The NTL change ratio (NCR) was employed to identify the extent of damage in Hatay Province following the earthquake to assess the impact on affected buildings and populations. NPP-VIIRS daily NTL Time-series data was used to establish an economic recovery framework for earthquake disasters in Hatay Province, assessing regional economic recovery after earthquake. The results revealed a strong correlation between the total reduced NTLs of NPP-VIIRS and SDGSAT-1 and the presence of severely and moderately damaged buildings. Conversely, the correlation with slightly damaged buildings was relatively weaker. Furthermore, the reduced NTLs of NPP-VIIRS provide a more precise identification of all earthquake damage compared to the SDGSAT-1 data, achieving an overall accuracy of 86.21% in earthquake damage identification and a Kappa coefficient of 0.72. In accordance with the earthquake economic recovery framework, as of the end of March 2024, neither the provincial economy nor any of its districts have fully restored to their pre-earthquake levels. The findings offered new and valuable insights into earthquake disaster assessment, assisting decision-makers in accurately assessing the level of disaster risk following an earthquake and efficiently allocating post-earthquake relief funds.
Keywords:
rapid assessment method
; Turkey earthquake damage
; economic recovery assessment
; Hatay Province
; nighttime light
; NPP-VIIRS
; SDGSAT-1
1. Introduction
On February 6, 2023, at 01:17 Coordinated Universal Time (UTC), a catastrophic magnitude 7.8 earthquake (37.23°N, 37.01°E) struck southern and central Turkey as well as northern and western Syria. The epicenter was located 32 km northwest of Gaziantep, Turkey, and the earthquake reached a staggering maximum intensity of XI. This was followed at 10:24 UTC by a magnitude 7.5 earthquake (38.01°N, 37.20°E) with an epicenter in Kahramanmaras Province, Turkey, 96 km northeast of the first earthquake [1]. The rupture of the first event originated in the East Anatolian Fault Zone (EAFZ). The spatial distribution of the aftershocks depicted in Figure 1 reveals that the seismic rupture extended all the way to Antakya, Hatay Province in the south and ended in the Puturge segment in the north. The rupture velocity of this earthquake was estimated to be 3.2–3.3 km/s, with a surface displacement of 3–7 m [2]. The second event occurred along the Çardak fault, resulting in the rupture of the northern branch of the EAFZ for approximately 150 km along the Savrun, Çardak, and Doganşehir faults [3]. The velocity at which the event ruptured was estimated to be 2.5–2.8 km/s, causing a surface displacement of around 2–8 m. The impacts of this seismic event were devastating. The United Nations Development Programme (UNDP) estimated that approximately 3.3 million people were displaced by the earthquake, with more than 53,537 confirmed deaths, 313,000 destroyed buildings, and 650,000 new housing units to be built to accommodate affected populations [4]. Therefore, a statistical analysis of the population, damaged buildings, and economic losses in the earthquake-affected areas of Turkey is crucial for earthquake relief efforts, damage assessment, and post-disaster reconstruction.
Conducting an on-site survey of the entire affected area shortly after a major earthquake is a challenging and dangerous task. Strong earthquakes can cause extensive damage to critical infrastructure, including power systems, communications networks, and transportation routes. Additionally, these earthquakes can also trigger secondary disasters, which significantly complicate the process of conducting on-site surveys. Remote sensing technology has been widely employed in the aftermath of major disasters, especially in the early stages of post-disaster response [5]. The advantages of technology, namely low cost, high efficiency, and wide coverage address the shortcomings and inefficiencies of on-site surveys, thereby providing a more effective solution to disaster assessment.
Disaster damage assessment relies on the deployment of image change detection techniques that can observe objects at different times and identify any changes. The fundamental principle behind the use of satellite image data is that changes in land cover are reflected in changes in the radiometric values of the images [6]. These changes must be significant compared to radiometric variations caused by atmospheric conditions, soil moisture, and other environmental factors. Remote sensing technologies, including Unmanned Aerial Vehicles (UAVs), Light Detection and Ranging (LiDAR), optical imagery, and Synthetic Aperture Radar (SAR), have been utilized for the detection of natural disaster damage and related surface disturbances. Li et al. [7] utilized thermal infrared imaging from UAVs to accurately and quickly characterize underground coal fires. Hauptman et al. [8] utilized aerial imagery and LiDAR data to assess the amount and severity of structural damage resulting from Hurricane Ian in 2022, as well as to analyze alterations in beach morphology before and after storm. The differences in colors, spectra, textures, shapes, and morphological features in optical images can be utilized to differentiate between buildings that have been damaged by an earthquake and those that have not [9]. Traditional image enhancement and pixel-based classification methods had limitations in fully leveraging the multi-temporal features of images. The extraction of collapsed buildings from an image, for example, was not enough to accurately categorize building damage and assess the extent of the damage. Advancement of deep learning technology has accelerated the creation of various neural network models, specifically convolutional neural networks (CNNs) [10]. These models demonstrated tremendous potential in image classification and semantic segmentation, making them indispensable in studies related to building damage assessment. Xia et al. [11] designed two-stage CNNs that combine pre- and post-disaster image features to assess the extent of building damage and the distribution of affected populations in Islahiye, Turkey. Haciefendioglu et al. [12] demonstrated that the FPN and U-Net semantic segmentation models are more effective than other models in accurately identifying collapsed buildings caused by earthquakes. However, deep learning algorithms often suffer from a lack of adequate training samples to predict disaster losses. Furthermore, the effectiveness of high-resolution optical imagery in disaster applications was constrained by its vulnerability to cloudy, rainy, and snowy weather conditions. The Synthetic Aperture Radar (SAR) provides all-day and all-weather observation capabilities. Its sensors emit microwaves and record the amplitude and phase components of backscattered waves from the ground [13,14]. These data were then used to detect and analyze changes on the ground surface. An et al. [15] combined horizontal deformation data from optical images with range and azimuthal offsets from SAR images to develop a comprehensive 3D deformation field for the 2023 Turkey earthquake sequence. The results indicated that the deformation of the Turkish earthquakes was predominantly oriented in an east-west direction. Du et al. [16] employed the differential interferometry SAR (D-InSAR) technique to determine horizontal deformation in two cities during the 2023 Turkey earthquake. Wang et al. [17] proposed a method for assessing seismic building damage that combines SAR amplitude and phase coherence change detection. This innovative approach was used to evaluate the extent of disaster damage in five cities affected by the earthquake in Turkey. However, SAR images were susceptible to geometric distortions and speckle noise, which might result in a reduction in image quality. Furthermore, SAR images lacked color information, which could impede the interpretation of the images. Therefore, Yu et al. [18] utilized Amplitude Dispersion Index (ADI) and Damage Proxy (DP) maps derived from SAR images, as well as variations in the Normalized Difference Building Index (NDBI) from optical remote sensing images, and Peak Ground Acceleration (PGA) to assess the extent of building damage resulting from the 2023 Turkey earthquake. To achieve an accurate and timely assessment of disaster damage, it is essential to employ comprehensive extraction and analysis of disaster features derived from high temporal phase and multisource remote sensing data.
Nighttime light (NTL) remote sensing offers a unique perspective on the intensity and scope of human socioeconomic activities on the Earth's surface, owing to its high-frequency acquisition cycle, cost-effectiveness, and extensive coverage [19,20]. It is widely used in various fields, such as urban expansion [21], economic development [22], population distribution [23], conflict and war analysis [24], and monitoring of natural disasters [25]. Areas affected by major human and natural disasters typically suffer from power outages. Following a disaster, the affected area often appeared darker than before the disaster. Consequently, NTL satellites can observe sharp reductions in nighttime illumination, which could serve as indicators of disaster damage [26]. Based on the theory of post-earthquake recovery model, Gao et al. [27] conducted a study to explore the post-earthquake nighttime light piecewise (PNLP) pattern using the National Polar-Orbiting Partnership Satellite Visible Infrared Imaging Radiometer Suite (NPP-VIIRS) monthly NTL data and analyzed the main socioeconomic factors. The annual NTL data were also adopted to develop a resilience model for disaster recovery after the 2008 Wenchuan earthquake and to analyze potential factors that influence the economic recovery process [28,29]. Li et al. [30] used monthly NTL data to estimate the quarterly gross domestic product (GDP) at the prefecture and county levels in Hebei Province, China. In addition, they designed an economic recovery intensity model to assess the extent of economic recovery in Hebei Province during the pandemic. The impact of disaster shocks on human settlements is highly dynamic in time dimension. The annual and monthly composites of the NTL data are inadequate for accurately measuring this process. Therefore, researchers investigated the potential of daily NTL products obtained from NPP-VIIRS to detect natural disasters. Lan et al. [31] analyzed the connections between human activities and the intensity of pandemic prevention and control measures using daily NTL data in mainland China. Wang et al. [32] used NPP-VIIRS Day/Night Band (DNB) and point-of-interest (POI) data to analyze the relationship between dimming light, pandemic progression, and changes in human activities in four Chinese cities at different stages of the pandemic. Li et al. [33] created a daily GDP prediction model using daily and monthly NTL data to assess the economic resilience of the 2021 Zhengzhou flood disaster. Yuan et al. [34] employed NPP-VIIRS DNB data to map and quantify areas affected by earthquakes at varying distances and directions. Li et al. [35] developed a relative radiometric calibration model to accurately correct the radiance of the pre-earthquake sustainable development goals satellite-1 (SDGSAT-1) images to match the radiance of the Yangwang-1 images after the earthquake. They also utilized this model to assess light loss rates in three cities affected by the 2023 Turkey earthquake.
Previous research on earthquake disaster monitoring using NTL data has focused primarily on the assessment of NTL intensity reduction. There is a lack of knowledge regarding the relationship between the impact of reduced NTL intensity and the severity of earthquake damage. Furthermore, research on the status of post-disaster economic recovery, which is the focus of our analysis, is rarely implemented. The study aimed to assess the extent and impact of post-disaster losses in Hatay Province after the 2023 Turkey earthquake, analyze the correlation between reduced NTL and affected populations and settlements, and assess the economic recovery of Hatay Province after the earthquake. The findings of this study could greatly benefit local government departments in developing emergency responses and carrying out reconstruction efforts after a seismic event.
2. Study Site and Data Sources
2.1. Study Sites
Hatay Province (Figure 2), situated at the eastern extremity of the Mediterranean Sea, constitutes the southernmost province of Turkey. The province is bordered to the south and east by Syria, to the northwest by Adana Province, to the north by Osmaniye Province, and to the northeast by Gaziantep Province. The province is notable for its mountainous terrain, with mountains comprising 46% of the province's land area, plains accounting for 33%, and plateaus and hillsides making up the remaining 21%. The Nur Mountains, a north-south trending mountain range, are situated in the western part of the province. The highest peak is Migirtepe, which reaches an elevation of 2,240 m. The province comprises 12 districts, with a total area of 5,524 km2 and a population of 1,686,043 in 2022. The capital city of Hatay Province is Antakya and the second-largest city is the port city of Iskenderun [36]. The Hatay Province is subject to a Mediterranean climate, characterized by hot, dry summers and warm, rainy winters. The province experiences a range of precipitation levels, with an average annual rainfall of between 570 mm and 1,160 mm. The coastal areas tend to receive less rainfall. One of the most notable characteristics of this climate is the prevalence of southwesterly winds.
The earthquake struck the seismically active zone known as the EAFZ, which is bordered by numerous cities in Hatay Province, as shown in Figure 2. Of the 11 provinces in Turkey that were impacted by the earthquake, Hatay Province endured the most devastating consequences. The number of casualties in Hatay Province reached 54,909 representing 34% of the total number of casualties in all provinces. Direct economic losses amounted to approximately $12.448 billion, accounting for 36% of the total direct economic losses across all provinces [37,38].
2.2. Data Sources
NPP-VIIRS DNB data record daily images of visible and near-infrared (NIR) light emitted from the Earth's surface at night and provided by the Level-1 and Atmosphere Archive & Distribution System Distributed Active Archive Center (LAADS DAAC). With a 500-m spatial resolution and 16-bit radiometric resolution, NPP-VIIRS DNB captures a wide range of wavelengths, from 500 to 900 nm. This enhanced capability enables better detection of light originating from human activities and other anthropogenic phenomena [39]. The VNP46A1 data, a product of the NPP-VIIRS DNB data, records the daily measurement of surface radiation at-sensor top of atmosphere (TOA). This data captures not only light intensity in urban areas, but also various background noises such as fires, gas flares, lightning flashes, volcanoes, and auroras [40]. In this study, we used pre- and post-earthquake VNP46A1 data on August 25, 2022, and February 8, 2023, to assess the potential damage from earthquake damage. A total of 36 cloud-free VAN46A1 images, covering the period from January 2021 to May 2024, had been carefully selected for the crucial task of assessing post-earthquake economic recovery. The "vcm" version of the monthly cloud-free NTL data excludes the effect of stray light [41]. Therefore, by averaging the monthly cloud-free NTL data for October, November, and December 2022, we could derive the cloud-free NTL data for the 4th quarter of 2022. This would serve as a valuable reference for the daily analysis of NTL data.
Sustainable Development Goals Science Satellite-1 (SDGSAT-1) is the world's first scientific satellite customized specifically for the United Nations 2030 Agenda and provided by the International Research Center of Big Data for Sustainable Development Goals (CBAS). To meet the requirements of monitoring the global sustainable development goals (SDGs) and conducting scientific research, SDGSAT-1 is equipped with thermal infrared, glimmer, and multispectral imagers. Among them, the glimmer imager adopts a 10-meter panchromatic band design, which is divided into low-gain, high-gain, and high-low-gain fusions [42]. Furthermore, it is designed with red, green, and blue bands (RGB) with a 40-m resolution [43,44]. Although the glimmer imager for urbanization (GIU) image has a high spatial resolution, it still contains a considerable amount of linear and isolated noise, as depicted in Figure 3. In this study, we used pre-earthquake and post-earthquake B2 (green) band from GIU data captured on August 22, 2022, and February 12, 2023, to assess the potential damage caused by the earthquake disaster.
Figure 3 illustrates numerous red anomalous lights in the city center and main thoroughfares of Hatay Province following the earthquake. To facilitate the determination of the specific characteristics of the red anomalous lights, we chose the GIU images from the Chinese region for analysis. As shown in Figure 4 (a), the on-site investigation confirmed that the five red anomalous lights in Sanhe, Hebei Province, China, were actually neon lights. As shown in Figure 4 (b), the investigation confirmed that all three red anomalous luminous spots in Tangshan, Hebei Province, China originated from the heat source of the steel mill. This conclusion was supported by the data provided by the MODIS MOD14A1 fire mask product and the reliable information obtained from Baidu Maps. As depicted in Figure 4 (c), two anomalous red lights in Hechi, Guangxi Autonomous Region, China, were confirmed as mountain fires by the MODIS MOD14A1 fire mask product and relevant Chinese news reports [45,46]. Additionally, media reports highlighted the severe hardships faced by earthquake survivors in the aftermath of the earthquake, including power outages and fuel shortages. Many of them spend the night huddled in their cars or gather around bonfires made from debris to protect themselves from aftershocks [47,48,49]. The above analysis indicates that the anomalous red light observed after the earthquake in Hatay Province does not correspond to normal light originating from human socioeconomic activities in the affected area. Instead, it was generated by bonfires that people use for warmth and rescue lights. Consequently, the B2 (green) band of the GIU data was selected to filter the anomalous red light.
The MOD13 A1 V6 product, collected at 16-day intervals, provides an Enhanced Vegetation Index (EVI) with a resolution of 500 m that reduces canopy background variability and preserves sensitivity to dense vegetation [50]. The EVI product is used to calculate the annual average EVI from 2021 to 2023, which effectively reduces the saturation and blooming problems in the NTL. Microsoft Corporation has successfully identified a staggering 13 billion vectorized building footprints utilizing cutting-edge deep learning algorithms, which were developed leveraging Bing Maps imagery. The data used for this groundbreaking project not only encompass Microsoft's own sources but also incorporate imagery provided by renowned entities such as Maxar, Airbus, and IGN France between 2014 and 2022 [51]. The extensive coverage spans across major regions such as North America, South America, Africa, Europe, Asia, and Australia. The purpose behind this remarkable achievement is to make the information available as OpenStreetMap and open data for humanitarian efforts. WorldPop developed global demographic data at an approximate 100-m resolution spanning from 2000 to 2020 [52]. The latest demographic data for Turkey in 2020 was employed to determine the number of affected populations by the earthquake. The administrative divisions for Hatay Province, Turkey are sourced from Global Administrative Areas (GADM) [53]. The earthquake damage reference map was based on the building damage map in Hatay Province, Turkey, which was created by the NASA Jet Propulsion Laboratory ARIA team and Dr. Sang-ho Yun of the Earth Observatory of Singapore (EOS) [54]. However, the earthquake damage reference data in the Yayladagi District of Hatay Province are incomplete. A detailed description of the data sources is shown in Table 1.
3. Methodology
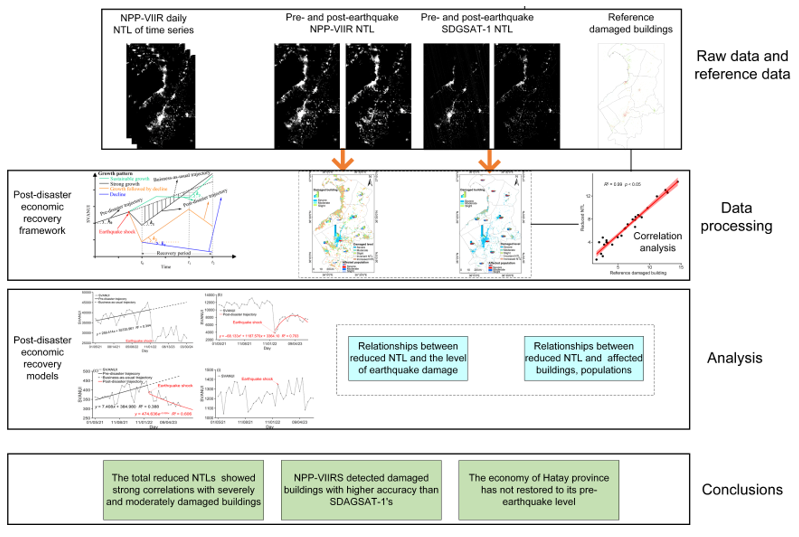
As shown in Figure 5, the research methodology and content of this study consist of three main parts: (1) NTL variation maps were generated based on NPP-VIIRS and SDGSAT-1 NTL data, respectively. Raw NTLs were subjected to cloud removal and denoising, and the NTL variation map was plotted based on the NTL change ratio (NCR) between before and after earthquake. The areas of severe, moderate, and slight damage were identified using the Natural Breaks (Jenks) classification. Furthermore, the damaged areas were overlayed with Microsoft building footprints and WorldPop demographics to determine the number of buildings and affected populations. The results were validated using the reference building damage map and official statistics. (2) A correlation analysis was conducted to determine the validity of the different results of the earthquake damage. The total reduced NTLs and earthquake damage classification maps were both used in correlation analysis with the reference building damage map. Furthermore, the NPP-VIIRS and SDGSAT-1 NTL identification results were evaluated for their potential to identify earthquake damage. (3) A framework for economic recovery following an earthquake disaster was constructed using NTLs of pre- and post-earthquake time series. The framework was employed to assess the economic recovery of Turkey's Hatay Province and its 12 districts following the earthquake.
3.1. Assessment Methods of Earthquake Damage for Two NTL Sensors
3.1.1. Assessment Method of Earthquake Damage for NPP-VIIRS NTL
The "QF_Cloud_Mask" band in the VNP46A1 dataset served the purpose of producing a cloud mask to effectively eliminate the influence of clouds. Subsequently, by applying a predetermined threshold, the background noise of the image was eliminated, as illustrated by the following equation:
where NTL and NTLd denote the raw NTLs and NTLs after removing the background noise, respectively; T denotes the predetermined threshold.
The dramatic decline in NTL brightness following a powerful earthquake provides compelling evidence of the extensive earthquake-induced damage to the city, particularly in regard to the severity of power outages. The change ratio in NTL before and after the earthquake could be expressed by the following equation:
where NCR denotes the NTL change ratio; and denote the pre-earthquake NTLs and the post-earthquake NTLs, respectively.
The Natural Breaks (Jenks) tool of ArcGIS software was used to classify NCRs in the study area into five categories: severe damage, moderate damage, slight damage, invariant NTL, and increased NTL. The categories of severe damage, moderate damage, and slight damage suggest the potential presence of severely damaged, moderately damaged, and slightly damaged buildings. The increased NTLs imply enhanced illumination for everyday human activities, production, and rescue operations following an earthquake. The Reclassify tool of ArcGIS software was employed to reclassify the category values for the aforementioned three damage categories. The reclassified raster was converted into vector format using the Conversion Tools of the ArcGIS software. Subsequently, the Intersect tool in ArcGIS software was used to perform intersection operations between the three aforementioned damage categories and the Microsoft building footprint data. This was done to calculate the intersecting geometric features and to count the damaged buildings. To determine the number of affected populations, we utilized the Raster Calculator tool in ArcGIS software to intersect the WorldPop population data with the three damage categories of the negative NCRs. Subsequently, we used ArcGIS software's Zonal Statistics tool to calculate the affected populations by region.
3.1.2. Assessment Method of Earthquake Damage for SDGSAT-1 NTL
Radiometric calibration of SDGSAT-1 satellite imagery is essential to mitigate or minimize radiometric distortions caused by various factors, including the atmosphere, surface characteristics, and the sensor. The radiometric calibration equation for the B2 band of SDGSAT-1 is as follows:
where DN denotes the raw digital number of the B2 band; L denotes the radiometric calibration value.
The threshold value is determined by selecting the mean value of a diverse range of waters on the image, and the background noise is subsequently eliminated using the following equation:
where Lc and Lwater denote the pixel value after removing the background noise and the average of the water surface pixels, respectively.
The employment of an object-oriented image segmentation approach was utilized to address the potential for isolated and linear noise in SDGSAT-1 images. This involves the Contrast Split Segmentation algorithm, which was designed to identify bright and dark regions using a maximum contrast threshold [55]. Next, the standard deviation (STD) and number of pixels (NOP) were employed to identify the isolated noise. Furthermore, linear noise was identified based on its main distribution direction (MDD), the number of neighboring pixels (NON), and the number of pixels. Finally, the isolated noise and linear noise were removed and assigned a value of 0. The remaining pixels were used as valid NTLs for the SDGSAT-1 image. The equations for the identification of isolated noise and linear noise are as follows:
where Le denotes the effective NTLs after the removal of isolated and linear noise; Ts and T1 denote the thresholds for the STD of the NTL pixel values and the POP, respectively; Td and T2 denote the thresholds for the MDD and POP, respectively; Tn denotes the threshold of the NON.
Based on the pre- and post-earthquake denoised Le data, Equation (2) was used to calculate the NCRs for the SDGSAT-1 NTLs. Following the methodology outlined in Section 3.1.1, the Natural Break (Jenks), Reclassify, Conversion Tools, Intersect, Raster Calculator, and Zonal Statistics tools in ArcGIS software were combined to calculate the number of damaged buildings and affected populations.
3.2. Assessment Method of Eonomic Recovery from Affected Area
The daily data of NPP-VIIRS DNB are commonly contaminated with background noise, which negatively impacts the normal NTL intensity. Radiometric normalization is used to minimize the radiometric divergence caused by the multi-temporal image environment and sensor radiometric differences. Its primary objective is to ensure that the same feature maintains consistent or similar reflectance across multiple images captured at different times. Given the internal correlation of the images, those with the same gray-level probability distribution also exhibit similar radiometric features. Therefore, radiation-normalized matching can be conducted based on the statistics of the gray-level probability distributions between images [56]. The radiation normalization equation for the NTL data is expressed as follows:
where go and gn denote the pixel gray values of the raw NTLs and radiation-normalized, respectively; μo and μr denote the average of the raw NTLs and reference image pixels, respectively; σo and σr denote the standard deviation of the raw NTLs and reference image pixels, respectively. In this study, stabilized composite NTL images from the fourth quarter of 2022 were used as a reference image.
Equation (4) was applied to eliminate background noise from the radiation-normalized NTLs, with the pixel values represented by. Subsequently, was combined with the MODIS EVI product to construct the Vegetation-Adjusted NTL Urban Index (VANUI), which is designed to alleviate the saturation and overflow issues associated with the NPP-VIIRS NTL. The equation of VANUI is expressed as follows:
Recent research has revealed a positive correlation between NTL intensity and GDP as a crucial proxy of economic activity. This implies that the higher the NTL intensity, the greater the economic volume, indicating that the city is more economically prosperous. [57,58,59]. Therefore, the sum of the VANUI (SVANUI) pixel values was employed to represent the total economic volume of the district in this study. Subsequently, economic recovery in earthquake-affected regions could be assessed by comparing the actual economic trajectories with the corresponding counterfactual trajectory. A variety of regression models, such as linear, quadratic polynomial, exponential, and logarithmic models, were utilized to conduct comprehensive analyzes and comparisons to determine the most suitable development model for the regional economy. Rigorous statistical tests, such as F-tests, p-values, and coefficients of determination (R2), were used to determine the most effective regression model that accurately represented the economic trajectory before and after the earthquake. For the districts that could not be modeled, visual interpretation was employed to determine the trend of their economic development.
The assessment framework for regional economic recovery from an earthquake is illustrated in Figure 6. The solid black line before time t0 represents the pre-earthquake SVANUI trajectory, while the dashed black line after time t0 represents the business-as-usual SVANUI trajectory assuming no earthquake took place. The solid black, brown, green, and blue solid lines after time t0 represent the post-earthquake SVANUI trajectories. If the slopes of the post-earthquake SVANUI trajectories (k1 and k3) are greater than the slope of the pre-earthquake SVANUI trajectory (k0), it is reasonable to assume that the regional economy will experience a rebound; If the slope of the post-earthquake SVANUI trajectory (k2) is first greater than k0 and then less than or equal to k0, it can be concluded that the regional economy will not recover within a specified period. Similarly, if the slope of the post-earthquake SVANUI trajectory (k4) is less than 0, it can be inferred that the regional economy is in recession and is not expected to recover in the short term [60].
4. Results
4.1. Accuracy Assessment of Earthquake Damage
The confusion matrix, also known as the error matrix, is a crucial measurement that assesses the classification performance in machine learning. It achieves this by precisely comparing the predicted values against the actual values within a given dataset. The performance metrics in the confusion matrix, including commission error (CE), omission error (OE), overall accuracy (OA), and Kappa coefficient (KC), were utilized to assess the accuracy of the earthquake damage results. The CE is the probability that a category in the image is incorrectly classified into the actual category, whereas OE refers to the probability that a category of the reference image is misclassified into other categories. OA reflects the proportion of correctly classified results, while KC is the metric used to assess the consistency of classification results. A total of 388 sample points from the Damage class and 333 sample points from the No damage class were chosen from the reference building damage map to accurately evaluate the earthquake damage results from NPP-VIIRS and SDGSAT-1 using the confusion matrix. The accuracy assessment of earthquake damage from NPP-VIIRS and SDGSAT-1 data is shown in Table 2. The CE and OE for the "damage" and "no damage" classes of earthquake damage obtained from the NPP-VIIRS data ranged between 11.58% and 16.23%. In addition, the OA and KC values were even higher, which indicated a greater accuracy in detecting earthquake damage using this data source. However, the OE of the "damage" class and the CE of the "no damage" class in the earthquake damage data from SDGSAT-1 were relatively larger. These two types of error SDGSAT-1 were caused by cloud contamination depicted in Figure 3 (a) and rescue illumination in Kirikhan District. The NTL data obtained from the NPP-VIIRS satellite were considerably weaker compared to the SDGSAT-1 data at the same location in the Kirikhan District after the earthquake. This difference could probably be attributed to the remarkable sensitivity and imaging resolution of the GIU sensor on the SDGSAT-1 satellite.
The level and extent of earthquake damage were assessed based on the reduced NTLs. This information was then combined with Microsoft building footprint data to identify buildings with varying levels of damage. Subsequently, linear correlations were subsequently established between the building damage determined by the NPP-VIIRS NTL, the SDGSAT-1 NTL, and the reference building damage map, as illustrated in Table 3. Buildings exhibiting severe and moderate damage, as determined by the NPP-VIIRS NTL, exhibited strong linear correlations with the corresponding reference data, whereas buildings with slight damage showed a weaker linear correlation with the corresponding reference data. Buildings with severe damage, as determined by the SDGSAT-1 NTL, exhibited a robust linear correlation with the corresponding reference data. In contrast, buildings with moderate damage did not show a significant correlation, while those with slight damage had a weak linear relationship with the reference data.
4.2. Earthquake Damage Map from NTLs
As illustrated in Figure 7 (a), the districts most significantly impacted by the earthquake in Hatay Province, including Antakya, Iskenderun, Kirikhan, Dortyol, Altinozu, and Samandag, accounted for 3.31% of the total area of the province, based on the damaged level estimated by the NPP-VIIRS NTL. Severely damaged districts were primarily concentrated in downtown areas such as Antakya, Kirikhan, Samandag, Iskenderun, Altinozu, and Hassa, while the remaining moderately and slightly damaged districts displayed varying degrees of increased illumination owing to undamaged electrical facilities, especially in the coastal districts of Iskenderun and Dortyol. The NPP-VIIRS NTL identified 62,975 severely damaged buildings in Hatay Province, whereas the official statistics reported 89,025 [37], leading to a relative error of 29.26%. However, compared to the reference earthquake damage data, the relative error was a mere 1.83%. The relative error in the number of moderately and slightly damaged buildings was 43.00% and 24.48%, respectively. In conclusion, the relationship between reduced NTLs and the extent of building damage supports the reliability of the NPP-VIIRS NTL in identifying severely damaged buildings. The main districts with a high proportion of affected populations were Antakya, Kirikhan, Samandag, and Belen. The NPP-VIIRS NTL identified a total of 847,435 affected populations in Hatay Province, whereas the International Organization for Migration (IOM) reported 774,483 affected and displaced populations [61]. The 9.42% relative error for affected populations highlights the remarkable reliability of the NPP-VIIRS NTL data to accurately estimate population impact.
As illustrated in Figure 7 (b), the districts most significantly impacted by the earthquake in Hatay Province, including Antakya, Iskenderun, Kirikhan, Samandag, Altinozu, and Reyhanli, account for 3.74% of the total area of the province, based on the damaged level estimated by the SDGSAT-1 NTL. In contrast to the NPP-VIIRS NTL, the SDGSAT-1 NTL identified a larger area of severe damage and a comparatively smaller area of moderate and minor damage. The districts exhibiting increased illumination were primarily situated in Iskenderun, Dortyol, Erzin, Hassa, Kumlu, Reyhanli, and Samandag. The SDGSAT-1 NTL identified 142,346 buildings with severe damage in Hatay Province, with a relative error of up to 59.89% compared to the official statistics. Furthermore, the identified buildings with severe, moderate, and slight damage exhibited relative errors of 121.43%, 37.54%, and 77.18%, respectively, compared to the reference earthquake damage data. The aforementioned data suggest that the accuracy of damaged buildings identified by the SDGSAT-1 NTL is inadequate. The main districts with a high proportion of affected populations were Antakya, Kirikhan, Samandag, Dortyol, Hassa, Erzin, and Altinozu. The SDGSAT-1 NTL identified a total affected population of 783,372 in Hatay Province, with a low relative error of just 1.15% compared to the IOM data.
4.3. Assessment of Post-Earthquake Economic Recovery
As illustrated in Figure 8, the pre-earthquake economic development model of Hatay Province exhibits a weakly correlated linear regression with an R2 value of 0.344, an F value of 10.509, and a p-value of 0.004. Before the earthquake, the economy of Hatay Province exhibited a consistent growth pattern. Following the earthquake, the province experienced a period of rapid economic growth. Nevertheless, the province's economic performance began to decline in late 2023. As of March 30, 2024, the economy had not yet restored to its pre-earthquake level.
Figure 9 depicts the economic recovery framework for the 12 districts of Hatay Province. The R2, F-value, and p-value of the models for pre-earthquake economic recovery varied from 0.303 to 0.632, 8.688 to 34.328, and 0.000 to 0.008, respectively. The R2, F-value, and p-value of post-earthquake economic recovery models from Altinozu, Belen, Hassa, Iskenderun, Kirikhan, Reyhanli, and Yayladagi varied from 0.428 to 0.703, 7.746 to 18.455, and 0.001 to 0.011, respectively. Except for the linear model of Altinozu District before the earthquake, all established models demonstrated a weak correlation. The p-values for all the models were found to be below 0.05, indicating the rejection of the null hypothesis and confirming the statistical significance of the results. Unmodeled Antakya, Dortyol, Erzin, Kumlu, and Samandag showed a steady growth pattern before the earthquake. On the other hand, the economies of the other seven districts experienced consistent and rapid growth trajectories. The economic recovery patterns of the districts in Hatay Province after the earthquake can be classified into two patterns: a phase of rapid growth followed by a decline, and a phase of sustained decline. Altinozu, Antakya, Dortyol, Hassa, Kirikhan, Kumlu, Reyhanli, and Samandag were among the districts that exhibited the former pattern of development, while the latter pattern was observed in Belen, Erzin, Iskenderun, and Yayladagi. Except for Kumlu District, where the post-earthquake economy showed a slight increase above the pre-earthquake level, the economies of other districts of former types demonstrated a growth rate lower than the pre-earthquake level in the post-earthquake period. The economies of all districts of the former type had shown gradual and successive economic recovery over the past 10 months following the earthquake. However, a sudden and pronounced decline was observed at the end of 2023. As of March 30, 2024, the economies of the 12 districts in Hatay Province had not yet fully restored to their pre-earthquake levels.
5. Discussion
5.1. Relationship between Reduced NTLs and Damaged Buildings
The reference building damage map in Hatay Province revealed incomplete data for the damaged buildings in Yayladagi district. Therefore, the sum of the reduced NPP-VIIRS NTL (SRNPPNTL) (Figure 10) and the SDGSAT-1 NTL (SRSDGSATNTL) (Figure 11) in the remaining 11 districts of Hatay Province were used to establish linear relationships with the total number of damaged buildings, total area of damaged buildings, area of collapsed damaged buildings, area of severely damaged buildings, area of moderately damaged buildings, and area of slightly damaged buildings, respectively. Figure 10 demonstrated strong linear correlations between the SRNPPNTL and the aforementioned five indicators of the building damage, except for the area of the slightly damaged building. Remarkably, the R2 for SRNPPNTL and the area of severely damaged buildings stood out as the highest, reaching an impressive value of 0.977. Similarly, Figure 11 also demonstrated strong linear correlations between SRSDGSATNTL and aforementioned five indicators of the building damage, except for the area of slightly damaged building. Remarkably, the R2 for SRSDGSATNTL and the area of severely damaged buildings stood out as the highest, reaching an impressive value of 0.966.
Both NTL sensors showed a strong correlation between the total reduced NTLs and severely, moderately damaged building, while showing a weak correlation with the slightly damaged building. This was because slightly damaged buildings could still supply electricity normally and even be inhabited after an earthquake without causing a significant reduction in illumination. Table 3 illustrates that severely damaged buildings resulted in significant reductions in NPP-VIIRS and SDGSAT-1 NTLs, while moderately damaged buildings resulted in moderate reductions in NPP-VIIRS NTLs. However, both slightly damaged and undamaged buildings might result in minor reductions in NTL. Consequently, the significant decrease in NPP-VIIRS NTL serves as an accurate indicator of a severely damaged building, whereas the moderate decrease in NPP-VIIRS NTL can be used as an indication of a moderately damaged building. However, the SDGSAT-1 NTL does not exhibit this capability. Moreover, the observation of minor reductions in NTLs cannot be fully used to indicate the presence of slightly damaged buildings.
When establishing the correlation between the magnitude of the reduction in NTL observed in the NPP-VIIRS sensor and the number of damaged buildings, the large and slight reductions in NTL proved to be more accurate in quantifying the number of severely and slightly damaged buildings, respectively. The accuracy of assessing the number of moderately damaged buildings based on moderately reduced NTL was lower because the decrease in NTL might result from slightly damaged and undamaged buildings. There was a statistically significant correlation between the decrease in SDGSAT-1 NTL and the presence of severely damaged buildings, whereas the correlation with moderately damaged and slightly damaged buildings was not significant. Furthermore, the reduced NTLs from both NPP-VIIRS and SDGSAT-1 provided a more accurate count of affected populations, since the decrease in NTLs after the earthquake was usually linked to various types of damaged buildings.
5.2. A Comparative Analysis of the Performance of NPP-VIIRS and SDGSAT-1 NTL in Identifying Earthquake Damage
Based on the findings presented in Table 2 and Table 3, as well as Figure 10 and Figure 11, it was evident that the NPP-VIIRS NTL showed superior accuracy in identifying building damage compared to the SDGSAT-1 data. Furthermore, it exhibited significantly higher precision in determining the total number of buildings at all levels of damage. However, the accuracy in identifying the affected populations was slightly lower than that of SDGSAT-1. The persistent urban isolated noise in the SDGSAT-1 imagery, apparent cloud interference, and the challenge of rescue-light sensitivity contribute to degrading the accuracy of earthquake damage identification for this data source. The high spatial resolution of SDGSAT-1 imagery enables the identification of more detailed areas of earthquake damage. Nevertheless, the utilization of this imagery is susceptible to a significant number of issues related to double counting during the overlay analysis with the Microsoft building footprint data. These issues greatly undermine the accuracy of building damage counts. On the contrary, the NPP-VIIRS daily data is equipped with cloud mask products and utilizes a well-developed noise removal method, which greatly enhances the accuracy of earthquake damage identification compared to SDGSAT-1. Although the NPP-VIIRS NTL offers distinct advantages in identifying severe earthquake damage, it lacks essential information such as spectra and textures, posing significant challenges in identifying moderate and slight earthquake damage. Future research should integrate multi-source data, such as NTL, the multispectral, InSAR data, and ground motion parameters, to significantly improve the accuracy of identifying earthquake damage.
5.3. Coherence Analysis of Post-Earthquake Economic Recovery
To determine the recovery of the post-earthquake economy of Hatay Province and its districts, a combination of economic development modeling and visual observation was employed through pre- and post-earthquake time-series NTL data. Except for Kumlu District, the remaining 11 districts in the first 10 months exhibited a notable decline in economic activities following the earthquake shock. The economic recovery pattern in the districts of Hatay Province after the earthquake was characterized by a phase of rapid growth, followed by a decline, and a phase of sustained decline. Most districts in the former pattern experienced a consistent economic recovery in the past 10 months, due to reconstruction efforts. However, by the end of 2023, the pace of reconstruction and economic recovery had slowed down even more, primarily because of the substantial financial burden of over $ 50 billion in reconstruction expenses along with the sharp surge in construction costs [62]. Futhermore, the local government estimated that the population of Hatay Province had decreased from 1.7 million to 250,000 since the earthquake, and by November 2023, approximately 190,000 people were housed in containers instead of houses. A large number of skilled workers had been compelled to relocate from quake-hit cities to seek new job opportunities in other parts of the country [63,64]. As of March 30, 2024, the economies of 12 districts in Hatay Province had not yet restored to pre-earthquake levels. Indeed, the economic situation had deteriorated to a greater extent than before the earthquake.
6. Conclusions
This study presents a methodology for generating the earthquake damage map based on the NPP-VIIRS and SDGSAT-1 NTL data before and after the earthquake, respectively. The number of affected buildings and affected populations was counted, and the validity of the results were assessed. Furthermore, the economic recovery of the province after the earthquake was assessed. Finally, the following conclusions were drawn:
(1) The total reduced NTLs for NPP-VIIRS and SDGSAT-1 showed strong correlations with severely and moderately damaged buildings and a weak correlation with slightly damaged buildings. In other words, slightly damaged buildings were unlikely to cause significant NTL reductions. Furthermore, the reduced NTLs of NPP-VIIRS showed greater accuracy in identifying severely and moderately damaged buildings, while the reduced NTLs of SDGSAT-1 merely demonstrated high accuracy specifically in identifying severely damaged buildings.
(2) The reduced NTLs of NPP-VIIRS were suitable to count the number of severely and slightly damaged buildings, whereas the reduced NTL of SDGSAT-1 was not suitable for this purpose. The reduced NTL of SDGSAT-1 showed a slight improvement in accurately identifying the number of affected populations by the earthquake compared to the NPP-VIIRS data. Additionally, the Kappa coefficient for earthquake damage identified by the NPP-VIIRS NTL (0.72) was significantly higher than that of SDGSAT-1 (0.34).
(3) A comprehensive assessment conducted by NPP-VIIRS and SDGSAT-1 identified Antakya, Kirikhan, Samandag, Iskenderun, and Altinozu in Hatay Province as the districts most severely impacted by the earthquake disaster. NPP-VIIRS NTL had identified a total of 62,975 severely damaged buildings, with a relative error of less than 29.26%. The number of affected populations identified was 847,435, with a relative error of 9.42%.
(4) The economic development of the 12 districts of Hatay Province following the earthquake can be described as showing two distinct patterns. The first is characterized by a period of rapid growth, followed by a decline. The second is characterized by a sustained decline. As of the end of March 2024, neither the province nor any of its constituent districts had yet restored their economies to pre-earthquake levels.
Author Contributions
Feng Li and Shunbao Liao designed this experiment and arranged the structure of this manuscript; Xiaobo Zhang and Tianxuan Liu processed the NPP-VIIRS and SDGSAT-1 NTL data, generated the earthquake damage map, and validated the results; Shunbao Liao and Feng Li analyzed and assessed the results of earthquake damage; Feng Li wrote this manuscript based on these findings.
Funding
This research was funded by the Hebei Key Laboratory of Earthquake Disaster Prevention and Risk Assessment, grant number FZ247105, the Fundamental Research Funds for the Central Universities of China, grant number ZY20180101, the Scientific Research and Development Programme of Langfang Science and Technology Bureau, grant number 2021013097, and the National Key Research and Development Program of China, grant number 2017YFD0300403.
Acknowledgments
It is acknowledged that the NPP-VIIRS VNP46A1 and SDGSAT-1 data were kindly provided by LAADS DAAC and CBAS for a free study. We would like to thank the editor and anonymous reviewers for their valuable comments and suggestions on this manuscript.
Conflicts of Interest
The authors declare no conflicts of interest.
References
- The M7.8 and M7.5 Kahramanmaraş Earthquake Sequence struck near Nurdağı, Turkey (Türkiye) on February 6, 2023. Available online: https://www.usgs.gov/news/featured-story/m78-and-m75-kahramanmaras-earthquake-sequence-near-nurdagi-turkey-turkiye (accessed on 3 July 2024).
- Taftsoglou, M.; Valkaniotis, S.; Papathanassiou, G.; Karantanellis, E. Satellite Imagery for Rapid Detection of Liquefaction Surface Manifestations: The Case Study of Türkiye–Syria 2023 Earthquakes. Remote Sens. 2023, 15, 4190. [Google Scholar] [CrossRef]
- Ezgi Güvercin, S. 2023 Earthquake Doublet in Türkiye Reveals the Complexities of the East Anatolian Fault Zone: Insights from Aftershock Patterns and Moment Tensor Solutions. Seismol. Res. Lett. 2024, 95, 664–679. [Google Scholar] [CrossRef]
- One year after Türkiye’s Earthquakes, Recovery Takes Many Forms. Available online: https://www.undp.org/eurasia/stories/one-year-after-turkiyes-earthquakes-recovery-takes-many-forms (accessed on 3 July 2024).
- Gu, J.; Xie, Z.; Zhang, J.; He, X. Advances in Rapid Damage Identification Methods for Post-Disaster Regional Buildings Based on Remote Sensing Images: A Survey. Buildings 2024, 14, 898. [Google Scholar] [CrossRef]
- Romaniello, V.; Piscini, A.; Bignami, C.; Anniballe, R.; Stramondo, S. Earthquake Damage Mapping by Using Remotely Sensed Data: the Haiti Case Study. J. Appl. Remote Sens. 2017, 11, 016042. [Google Scholar] [CrossRef]
- Li, F.; Yang, W.; Liu, X.; Sun, G.; Liu, J. Using High-Resolution UAV-borne Thermal Infrared Imagery to Detect Coal Fires in Majiliang Mine, Datong Coalfield, Northern China. Remote Sen. Lett. 2018, 9, 71–80. [Google Scholar] [CrossRef]
- Hauptman, L.; Mitsova, D.; Briggs, T.R. Hurricane Ian Damage Assessment Using Aerial Imagery and LiDAR: A Case Study of Estero Island, Florida. J. Mar. Sci. Eng. 2024, 12, 668. [Google Scholar] [CrossRef]
- Dong, L.; Shan, J. A Comprehensive Review of Earthquake-Induced Building Damage Detection with Remote Sensing Techniques. ISPRS J. Photogrmm. 2013, 84, 85–99. [Google Scholar] [CrossRef]
- Liu, J.; Luo, Y.; Chen, S.; Wu, J.; Wang, Y. BDHE-Net: A Novel Building Damage Heterogeneity Enhancement Network for Accurate and Efficient Post-Earthquake Assessment Using Aerial and Remote Sensing Data. Appl. Sci. 2024, 14, 3964. [Google Scholar] [CrossRef]
- Xia, H.; Wu, J.; Yao, J.; Zhu, H.; Gong, A.; Yang, J.; Hu, L.; Mo, F. A Deep Learning Application for Building Damage Assessment Using Ultra-High-Resolution Remote Sensing Imagery in Turkey Earthquake. Int. J. Disast. Risk Sc. 2023, 14, 947–962. [Google Scholar] [CrossRef]
- Haciefendioglu, K.; Başaga, H.B.; Kahya, V.; Ozgan, K.; Altunişik, A.C. Automatic Detection of Collapsed Buildings after the 6 February 2023 Türkiye Earthquakes Using Post-Disaster Satellite Images with Deep Learning-Based Semantic Segmentation Models. Buildings 2024, 14, 582. [Google Scholar] [CrossRef]
- Cho, S.; Xiu, H.; Matsuoka, M. Backscattering Characteristics of SAR Images in Damaged Buildings Due to the 2016 Kumamoto Earthquake. Remote Sens. 2023, 15, 2181. [Google Scholar] [CrossRef]
- Kim, M.; Park, S.-E.; Lee, S.-J. Detection of Damaged Buildings Using Temporal SAR Data with Different Observation Modes. Remote Sens. 2023, 15, 308. [Google Scholar] [CrossRef]
- An, Q.; Feng, G.; He, L.; Xiong, Z.; Lu, H.; Wang, X.; Wei, J. Three-Dimensional Deformation of the 2023 Turkey Mw 7.8 and Mw 7.7 Earthquake Sequence Obtained by Fusing Optical and SAR Images. Remote Sens. 2023, 15, 2656. [Google Scholar] [CrossRef]
- Du, Y.; Feng, D.; Wu, G. InSAR-Based Rapid Damage Assessment of Urban Building Portfolios Following the 2023 Turkey Earthquake. Int. J. Disast. Risk Re. 2024, 103, 104317. [Google Scholar] [CrossRef]
- Wang, X.; Feng, G.; He, L.; An, Q.; Xiong, Z.; Lu, H.; Wang, W.; Li, N.; Zhao, Y.; Wang, Y.; et al. Evaluating Urban Building Damage of 2023 Kahramanmaras, Turkey Earthquake Sequence Using SAR Change Detection. Sensors 2023, 23, 6342. [Google Scholar] [CrossRef] [PubMed]
- Yu, X.; Hu, X.; Song, Y.; Xu, S.; Song, X.; Fan, X.; Wang, F. Intelligent Assessment of Building Damage of 2023 Turkey-Syria Earthquake by Multiple Remote Sensing Approaches. npj Nat. Hazards 2024, 1, 3. [Google Scholar] [CrossRef]
- Zheng, Q.; Seto, K.C.; Zhou, Y.; You, S.; Weng, Q. Nighttime Light Remote Sensing for Urban Applications: Progress, Challenges, and Prospects. ISPRS J. Photogramm. 2023, 202, 125–141. [Google Scholar] [CrossRef]
- Liu, C.; Tang, Q.; Xu, Y.; Wang, C.; Wang, S.; Wang, H.; Li, W.; Cui, H.; Zhang, Q.; Li, Q. High-Spatial-Resolution Nighttime Light Dataset Acquisition Based on Volunteered Passenger Aircraft Remote Sensing. IEEE T. Geosci. Remote, 2022, 60, 1–17. [Google Scholar]
- Li, F.; Liu, X.; Liao, S.; Jia, P. The Modified Normalized Urban Area Composite Index: A Satelliate-Derived High-Resolution Index for Extracting Urban Areas. Remote Sens. 2021, 13, 2350. [Google Scholar] [CrossRef]
- Zhang, H.; Yu, Q.; Liu, Y.; Jiang, J.; Chen, J.; Liu, R. The Spatio-Temporal Patterns of Regional Development in Shandong Province of China from 2012 to 2021 Based on Nighttime Light Remote Sensing. Sensors 2023, 23, 8728. [Google Scholar] [CrossRef] [PubMed]
- Chen, L.; Yu, L.; Yin, J.; Xi, M. Impact of Population Density on Spatial Differences in the Economic Growth of Urban Agglomerations: The Case of Guanzhong Plain Urban Agglomeration, China. Sustainability 2023, 15, 14601. [Google Scholar] [CrossRef]
- Li, L.-L.; Liang, P.; Jiang, S.; Chen, Z.-Q. Multi-Scale Dynamic Analysis of the Russian–Ukrainian Conflict from the Perspective of Night-Time Lights. Appl. Sci. 2022, 12, 12998. [Google Scholar] [CrossRef]
- Wang, L.; Li, Z.; Han, J.; Fan, K.; Chen, Y.; Wang, J.; Fu, J. A Cost-Effective Earthquake Disaster Assessment Model for Power Systems Based on Nighttime Light Information. Appl. Sci. 2024, 14, 2325. [Google Scholar] [CrossRef]
- Jia, M.; Li, X.; Gong, Y.; Belabbes, S.; Dell'oro, L. Estimating Natural Disaster Loss Using Improved Daily Night-Time Light Data. Int. J. Appl. Earth Obs. Geoinformation 2023, 120, 103359. [Google Scholar] [CrossRef]
- Gao, S.; Chen, Y.; Liang, L.; Gong, A. Post-Earthquake Night-Time Light Piecewise (PNLP) Pattern Based on NPP/VIIRS Night-Time Light Data: A Case Study of the 2015 Nepal Earthquake. Remote Sens. 2020, 12, 2009. [Google Scholar] [CrossRef]
- Liu, Z.; Zhang, J.; Li, X.; Chen, X. Long-Term Resilience Curve Analysis of Wenchuan Earthquake-Affected Counties Using DMSP-OLS Nighttime Light Images. IEEE J-Stars. 2021, 14, 10854–10874. [Google Scholar] [CrossRef]
- Chen, X.; Li, X.; Liu, Z. Evaluation of Earthquake Disaster Recovery Patterns and Influencing Factors: a Case Study of the 2008 Wenchuan Earthquake. All Earth, 2023, 35, 132–148. [Google Scholar] [CrossRef]
- Li, F.; Liu, J.; Zhang, M.; Liao, S.; Hu, W. Assessment of Economic Recovery in Hebei Province, China, under the COVID-19 Pandemic Using Nighttime Light Data. Remote Sens. 2023, 15, 22. [Google Scholar] [CrossRef]
- Lan, T.; Shao, G.; Tang, L.; Xu, Z.; Zhu, W.; Liu, L. Quantifying Spatiotemporal Changes in Human Activities Induced by COVID-19 Pandemic Using Daily Nighttime Light Data. IEEE J-Stars, 2021, 14, 2740–2753. [Google Scholar] [CrossRef]
- Wang, X.; Yan, G.; Mu, X.; Xie, D.; Xu, J.; Zhang, Z.; Zhang, D. Human Activity Changes During COVID-19 Lockdown in China—A View from Nighttime Light. GeoHealth, 2022, 6, e2021GH000555. [Google Scholar] [CrossRef]
- Li, F.; Wang, Q.; Hu, W.; Liu, J.; Zhang, X. Rapid Assessment of Disaster Damage and Economic Resilience in Relation to the Flooding in Zhengzhou, China in 2021. Remote Sens. Lett. 2022, 13, 651–662. [Google Scholar] [CrossRef]
- Yuan, Y.; Wang, C.; Liu, S.; Chen, Z.; Ma, X.; Li, W.; Zhang, L.; Yu, B. The Changes in Nighttime Lights Caused by the Turkey-Syria Earthquake Using NOAA-20 VIIRS Day/Night Band Data. Remote. Sens. 3438; 15. [Google Scholar]
- Li, X.; Cao, H.; Gong, Y. Turkey-Syria Earthquake Assessment Using High-Resolution Night-time Light Images. Geomatics and Information Science of Wuhan University, 2023, 48, 1697–1705. [Google Scholar]
- Hatay Province. Available online: https://en.wikipedia.org/wiki/Hatay_Province#Geography (accessed on 20 May 2024).
- 2023 Turkey–Syria Earthquakes. Available online: https://en.wikipedia.org/wiki/2023_Turkey%E2%80%93Syria_earthquakes#cite_note-TRToll9FEB-104 (accessed on 3 July 2024).
- Global Rapid Post-Disaster Damage Estimation (GRADE) Report: February 6, 2023 Kahramanmaraş Earthquakes–Türkiye Report (English). Available online: https://documents1.worldbank.org/curated/en/099022723021250141/pdf/P1788430aeb62f08009b2302bd4074030fb.pdf (accessed on 3 July 2024).
- Alahmadi, M.; Mansour, S.; Dasgupta, N.; Abulibdeh, A.; Atkinson, P.M.; Martin, D.J. Using Daily Nighttime Lights to Monitor Spatiotemporal Patterns of Human Lifestyle under COVID-19: The Case of Saudi Arabia. Remote Sens. 2021, 13, 4633. [Google Scholar] [CrossRef]
- Level-1 and Atmosphere Archive & Distribution System Distributed Active Archive Center. Available online: https://ladsweb.modaps.eosdis.nasa.gov/search/j (accessed on 3 July 2024).
- EOG Nighttime Light. Available online: https://eogdata.mines.edu/nighttime_light/monthly/v10/ (accessed on 4 June 2024).
- SDGSAT-1 Open Science Program. Available online: https://www.sdgsat.ac.cn/ (accessed on 3 July 2024).
- Zhao, Z.; Qiu, S.; Chen, F.; Chen, Y.; Qian, Y.; Cui, H.; Zhang, Y.; Khoramshahi, E.; Qiu, Y. Vessel Detection with SDGSAT-1 Nighttime Light Images. Remote Sens. 2023, 15, 4354. [Google Scholar] [CrossRef]
- Guo, H.; Dou, C.; Chen, H.; Liu, J.; Fu, B.; Li, X.; Zou, Z.; Liang, D. SDGSAT-1: The World's First Scientific Satellite for Sustainable Development Goals. Sci. Bull. 2022, 68, 34–38. [Google Scholar] [CrossRef]
- After Three Days and Two nights of Rescue, Hechi, Guangxi mountain fire has been completely extinguished (in Chinese). Available online: http://news.cnhubei.com/content/2024-02/23/content_17454359.html (accessed on 3 July 2024).
- Firefighters are Trying Their Best to Extinguish a Mountain Fire in Jinchengjiang District, Hechi, Guangxi (in Chinese). Available online: https://news.sina.com.cn/c/2023-02-28/doc-imyiepni8106015.shtml (accessed on 3 July 2024).
- What We Know About the Earthquake in Turkey and Syria. Available online: https://www.nytimes.com/2023/02/10/world/middleeast/earthquake-turkey-syria-toll-aid.html (accessed on 3 July 2024).
- A Month Since the Devastating Earthquake in Turkey. Available online: https://www.theatlantic.com/photo/2023/03/photos-month-devastating-earthquake-turkey/673317 (accessed on 3 July 2024).
- ’People are terrified’: Despair and Fear among Ruins of Göksun. Available online: https://www.theguardian.com/world/2023/feb/07/goksun-residents-struggle-to-survive-after-turkish-earthquake (accessed on 3 July 2024).
- MODIS Vegetation Index User’s Guide. Available online: https://measures.arizona.edu/documents/MODIS/MODIS_VI_UsersGuide_09_18_2019_C61.pdf (accessed on 3 July 2024).
- Microsoft Global ML Building Footprints. Available online: https://github.com/microsoft/GlobalMLBuildingFootprints?tab=readme-ov-file#readme (accessed on 3 July 2024).
- WorldPop Population Counts. Available online: https://github.com/microsoft/GlobalMLBuildingFootprints?tab=readme-ov-file#readme (accessed on 3 July 2024).
- Download GADM Data (Version 4.1). Available online: https://gadm.org/download_country.html (accessed on 4 June 2024).
- M7.8 2023 Turkey EQ Building Damage (last updated Mar. 9, 2023). Available online: https://www.arcgis.com/home/item.html?id=86941dbff14e450bbe3f89897373c59a (accessed on 3 July 2024).
- El-naggar, A.M. Determination of Optimum Segmentation Parameter Values for Extracting Building from Remote Sensing Images. Alex. Eng. J. 2018, 57, 3089–3097. [Google Scholar] [CrossRef]
- Zheng, Y.; Shao, G.; Tang, L.; He, Y.; Wang, X.; Wang, Y.; Wang, H. Rapid Assessment of a Typhoon Disaster Based on NPP-VIIRS DNB Daily Data: The Case of an Urban Agglomeration along Western Taiwan Straits, China. Remote Sens. 2019, 11, 1709. [Google Scholar] [CrossRef]
- Duerler, R.; Cao, C.; Xie, B.; Huang, Z.; Chen, Y.; Wang, K.; Xu, M.; Lu, Y. Cross Reference of GDP Decrease with Nighttime Light Data via Remote Sensing Diagnosis. Sustainability 2023, 15, 6900. [Google Scholar] [CrossRef]
- Liu, H.; Luo, N.; Hu, C. Detection of County Economic Development Using LJ1-01 Nighttime Light Imagery: A Comparison with NPP-VIIRS Data. Sensors 2020, 20, 6633. [Google Scholar] [CrossRef]
- Chen, Z.; Yu, S.; You, X.; Yang, C.; Wang, C.; Lin, J.; Wu, W.; Yu, B. New Nighttime Light Landscape Metrics for Analyzing Urban-Rural Differentiation in Economic Development at Township: A Case Study of Fujian Province, China. Appl. Geogr. 2023, 150, 102841. [Google Scholar] [CrossRef]
- Li, F.; Liao, S.; Liu, W. Assessment of Post-Pandemic Economic Recovery in Beijing, China, Using Night-Time Light Data. Remote Sen. Lett. 2024, 15, 603–613. [Google Scholar] [CrossRef]
- IOM: 2023 Earthquakes Displacement Overview - Türkiye (March 2023). Available online: https://reliefweb.int/attachments/a064c286-3a66-4520-8848-08d988b3fbc0/2023%20Earthquakes%20Displacement%20Overview.pdf (accessed on 3 July 2024).
- Turkey earthquake: Why Reconstruction Could Miss Erdogan's Goal. Available online: https://www.reuters.com/world/middle-east/turkey-earthquake-why-reconstruction-could-miss-erdogans-goal-2023-10-13/ (accessed on 3 July 2024).
- Earthquakes Hit Manufacturing in Southern Provinces: Report. https://www.hurriyetdailynews.com/earthquakes-hit-manufacturing-in-southern-provinces-report-190884. (accessed on 28 June 2024).
- Before and After: Devastation Caused by Turkey Earthquake in Hatay- in Pictures. Available online: https://www.thenationalnews.com/mena/2024/02/06/before-and-after-devastation-caused-by-turkey-earthquake-in-hatay-in-pictures/#:~:text=On%20February%206%20last%20year,thousands%20of%20residents%20and%20refugees (accessed on 3 July 2024).
Figure 1.
The tectonic setting and aftershock distribution of the 2023 Turkey earthquake.
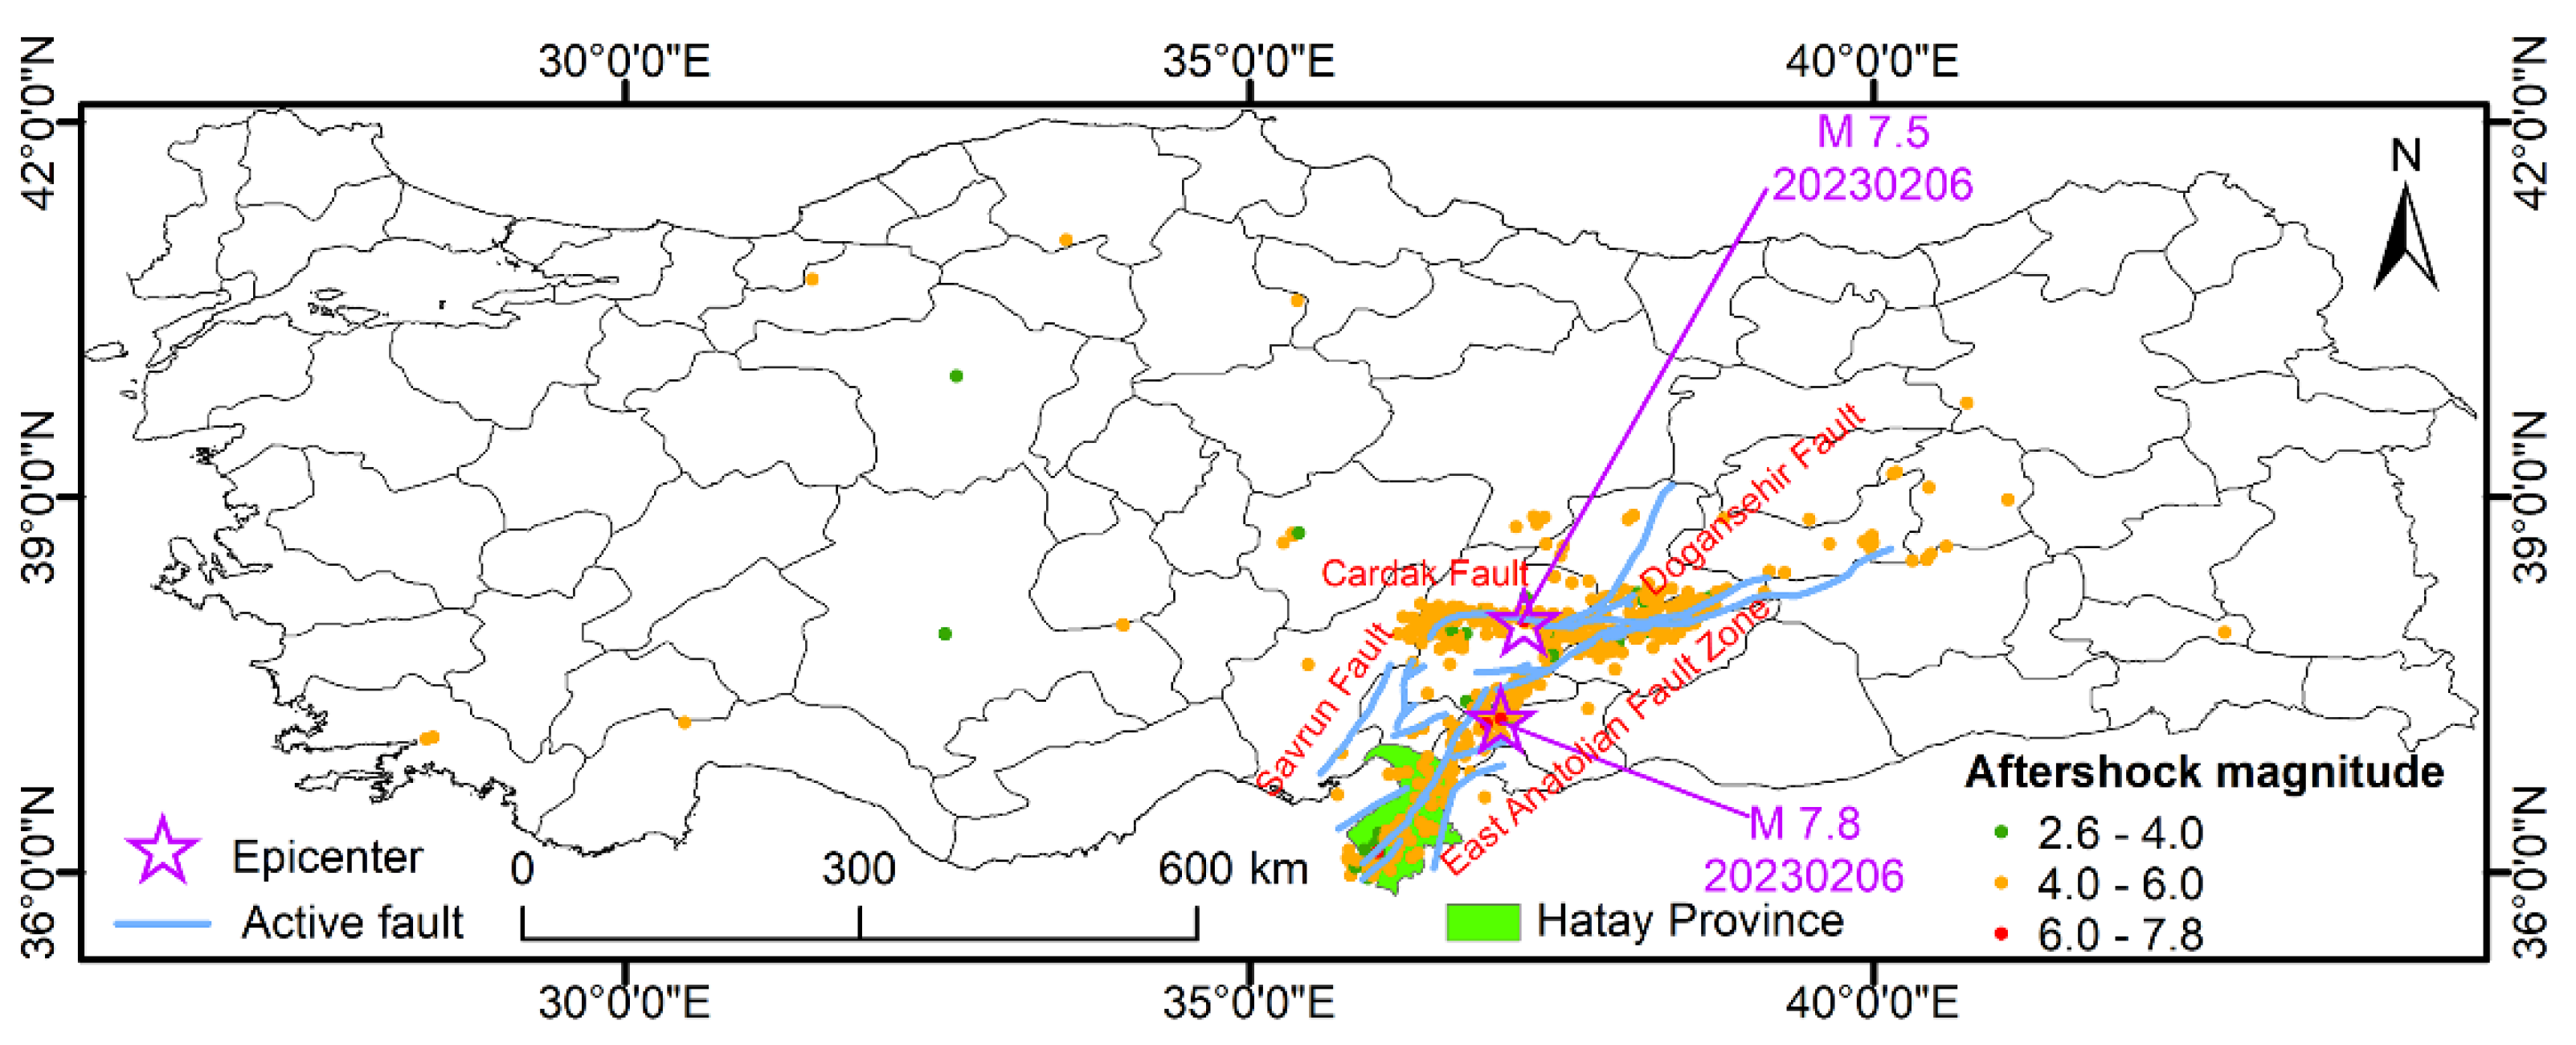
Figure 2.
Location map of the study site.
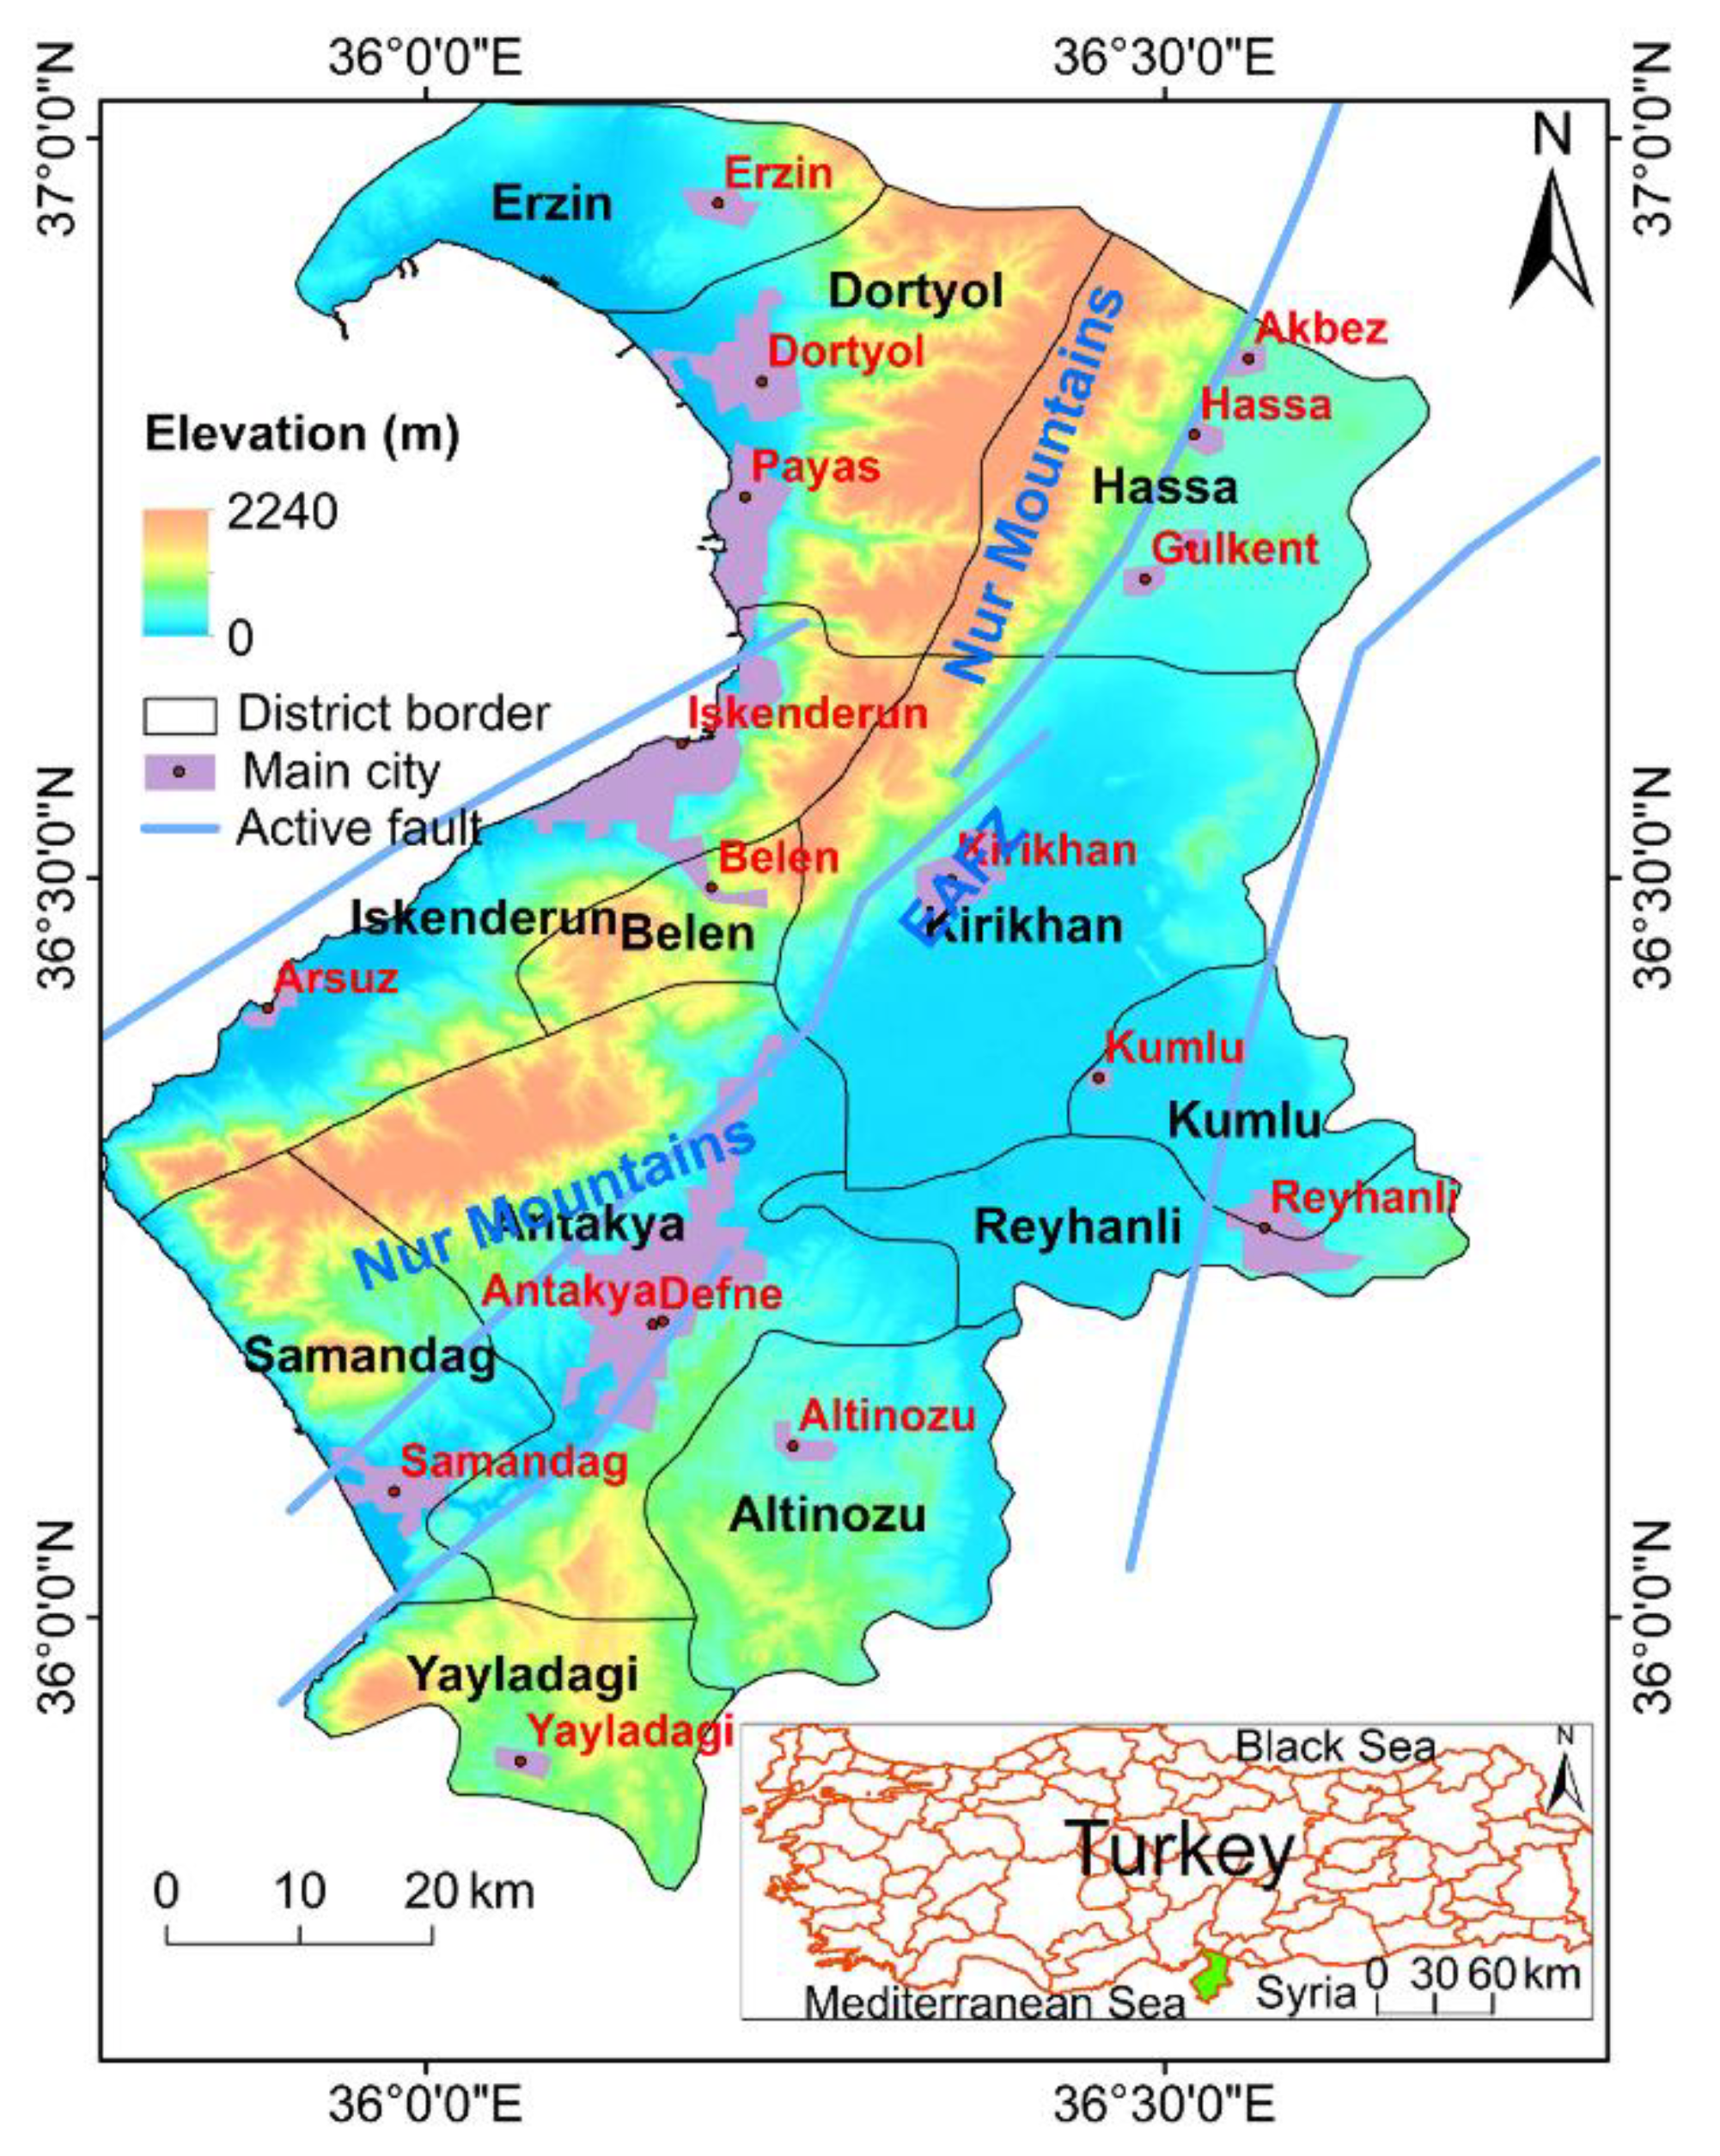
Figure 3.
Raw GIU RGB images from (a) August 22, 2022 (pre-earthquake) and (b) February 12, 2023 (post-earthquake).
Figure 3.
Raw GIU RGB images from (a) August 22, 2022 (pre-earthquake) and (b) February 12, 2023 (post-earthquake).
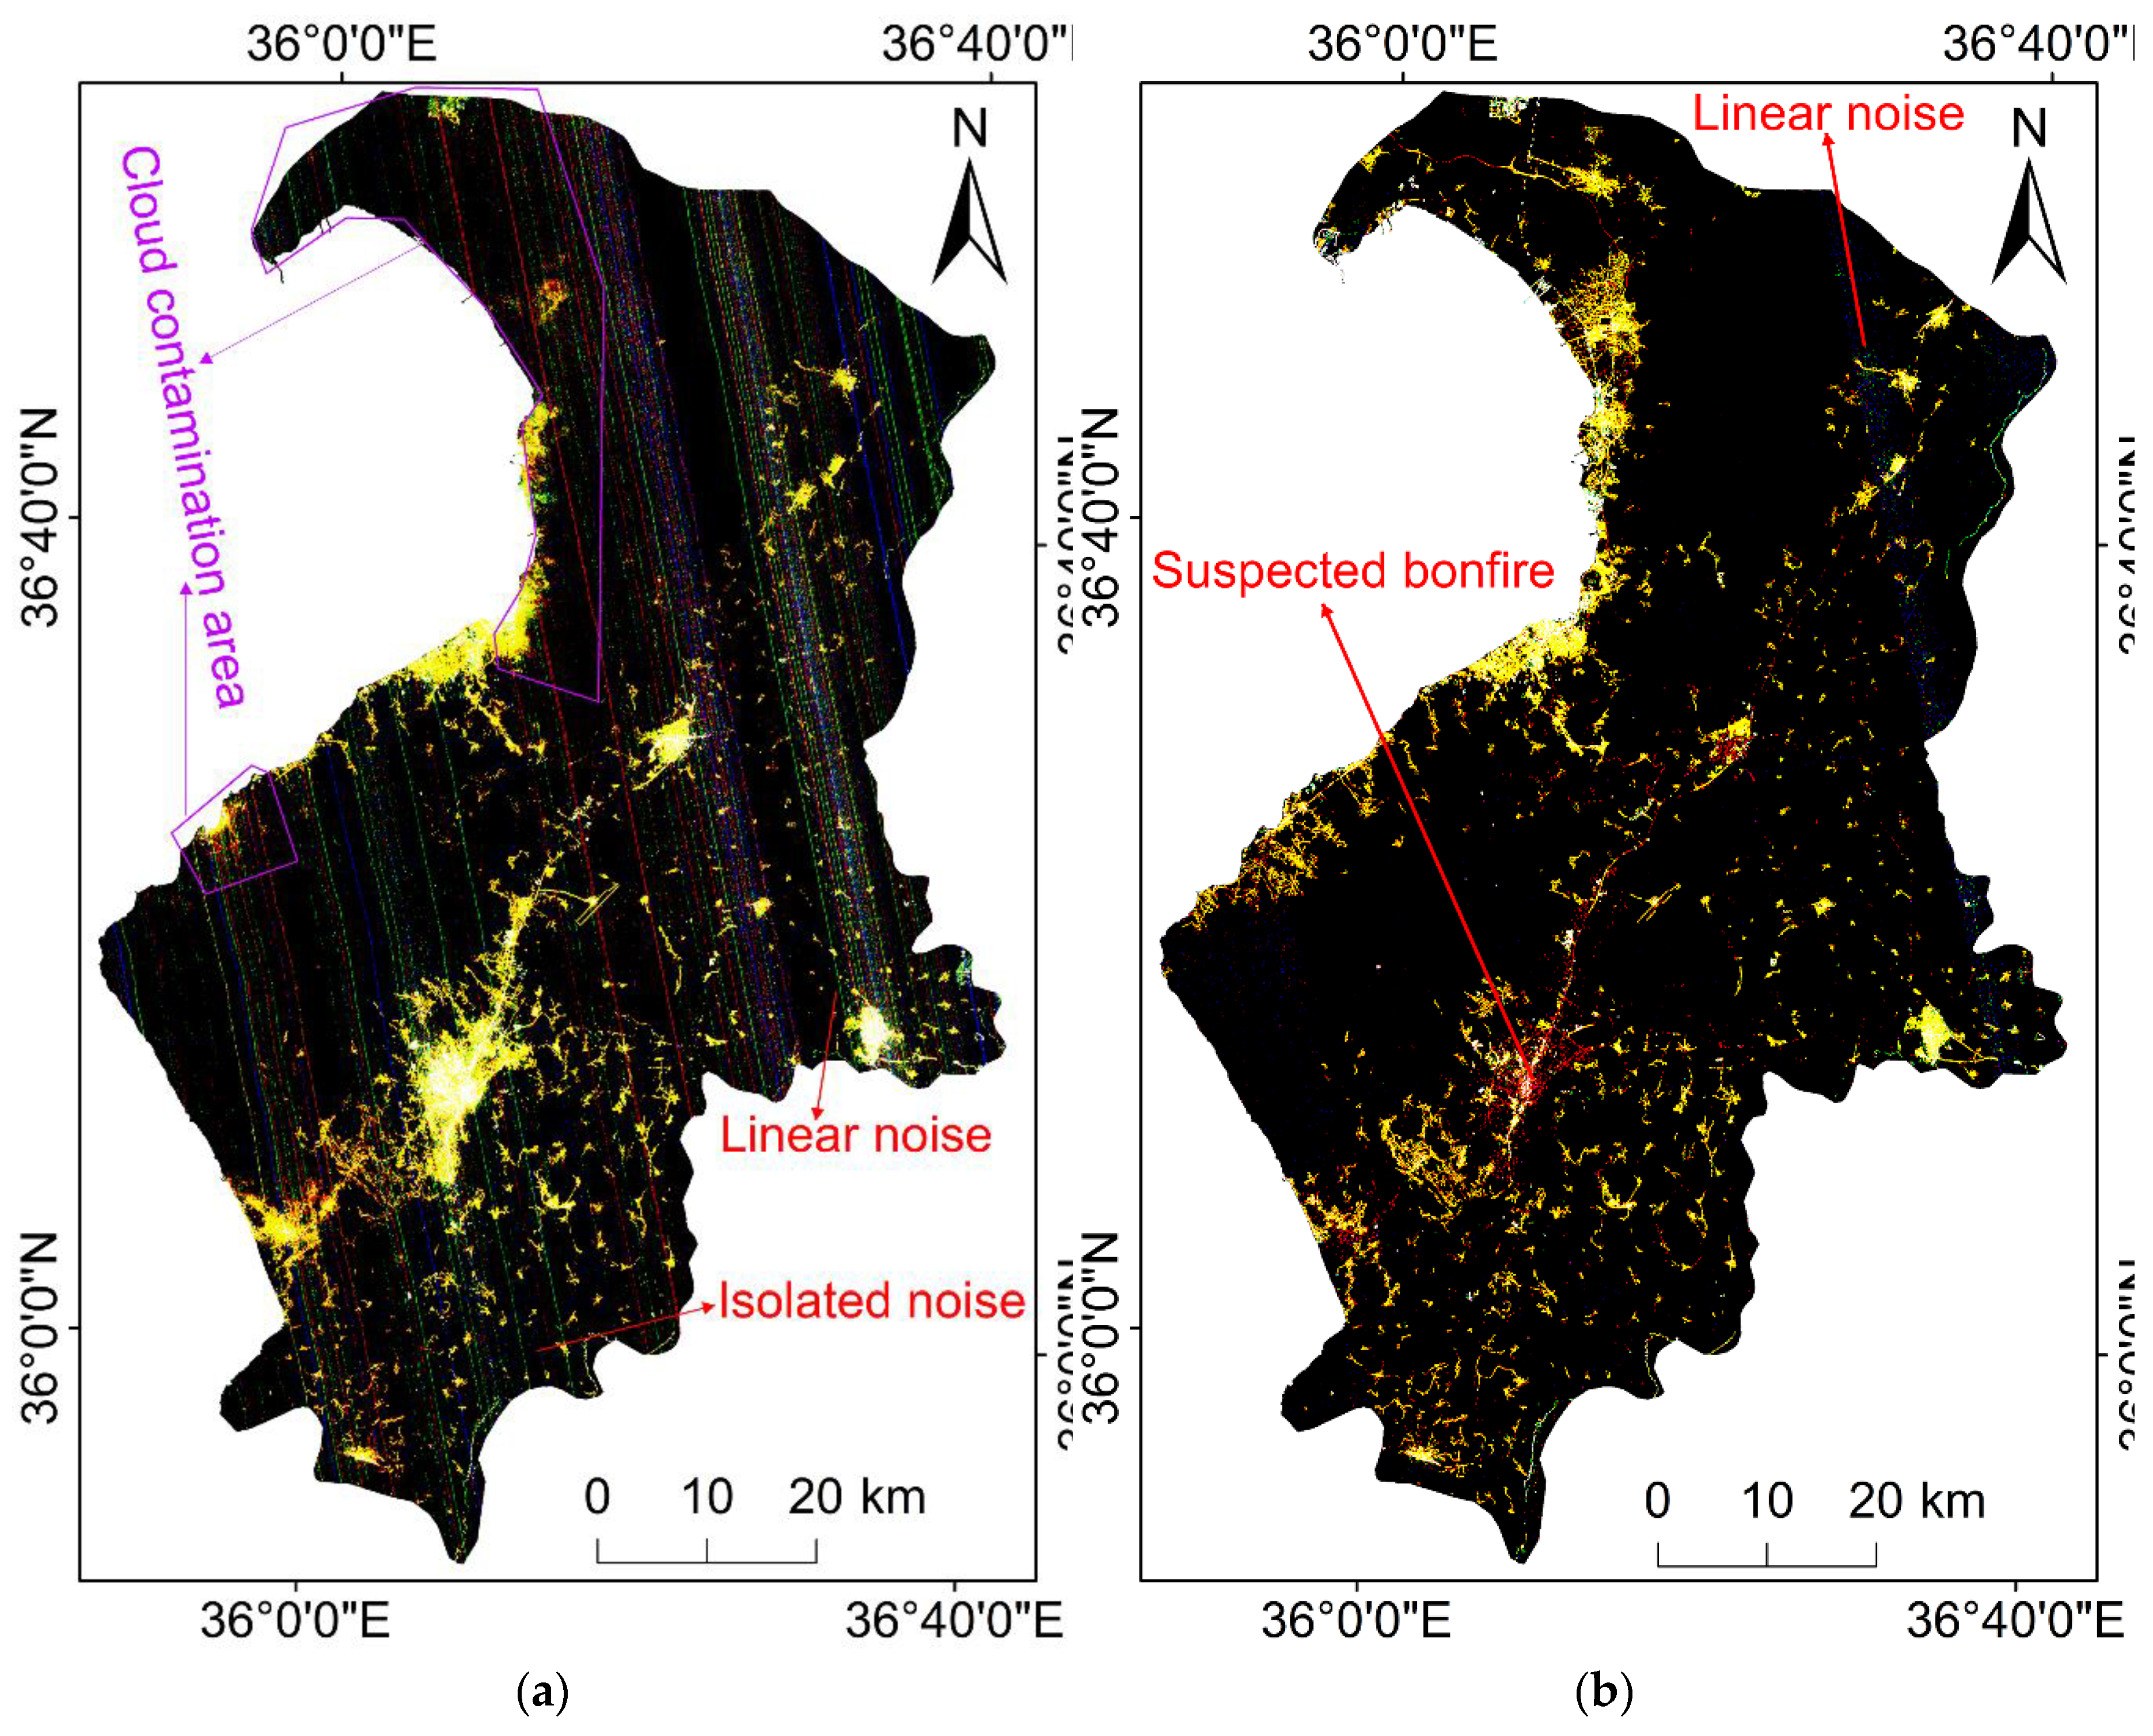
Figure 4.
Red anomalous lights in GIU RGB images of (a) Sanhe, (b) Tangshan, Hebei Province, and (c) Hechi, Guangxi Autonomous Region, China.
Figure 4.
Red anomalous lights in GIU RGB images of (a) Sanhe, (b) Tangshan, Hebei Province, and (c) Hechi, Guangxi Autonomous Region, China.
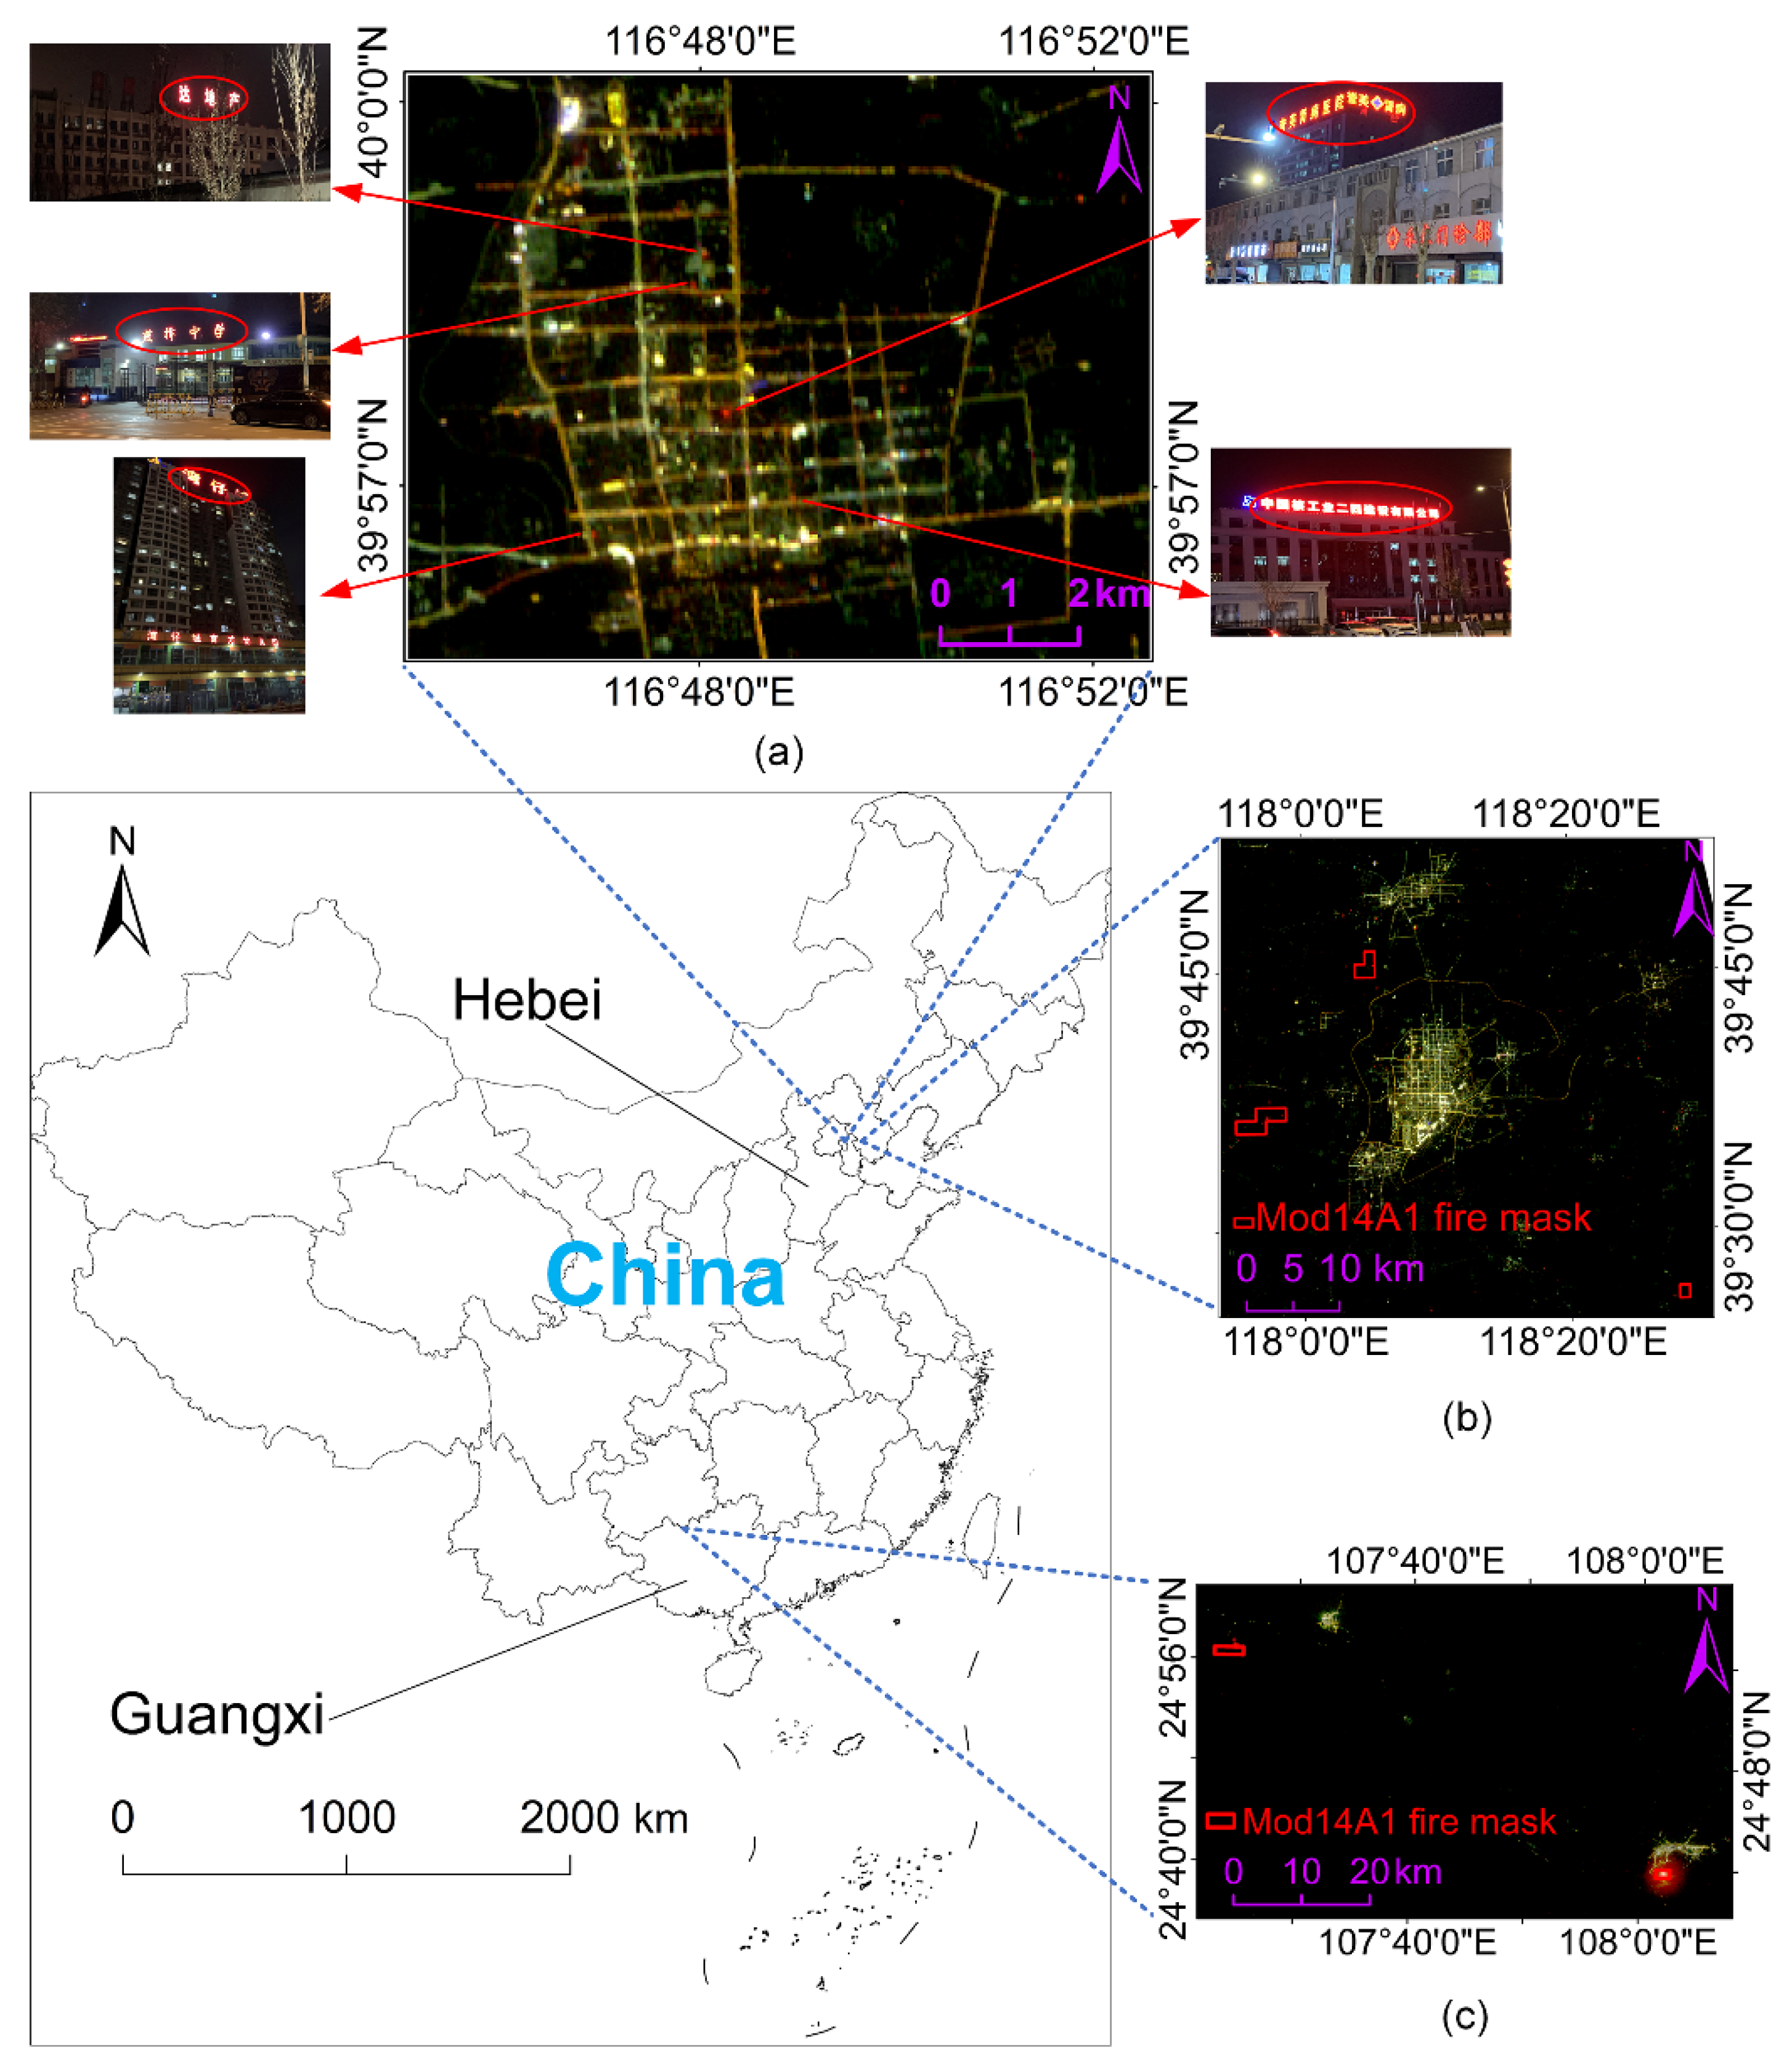
Figure 5.
The flowchart of this study.
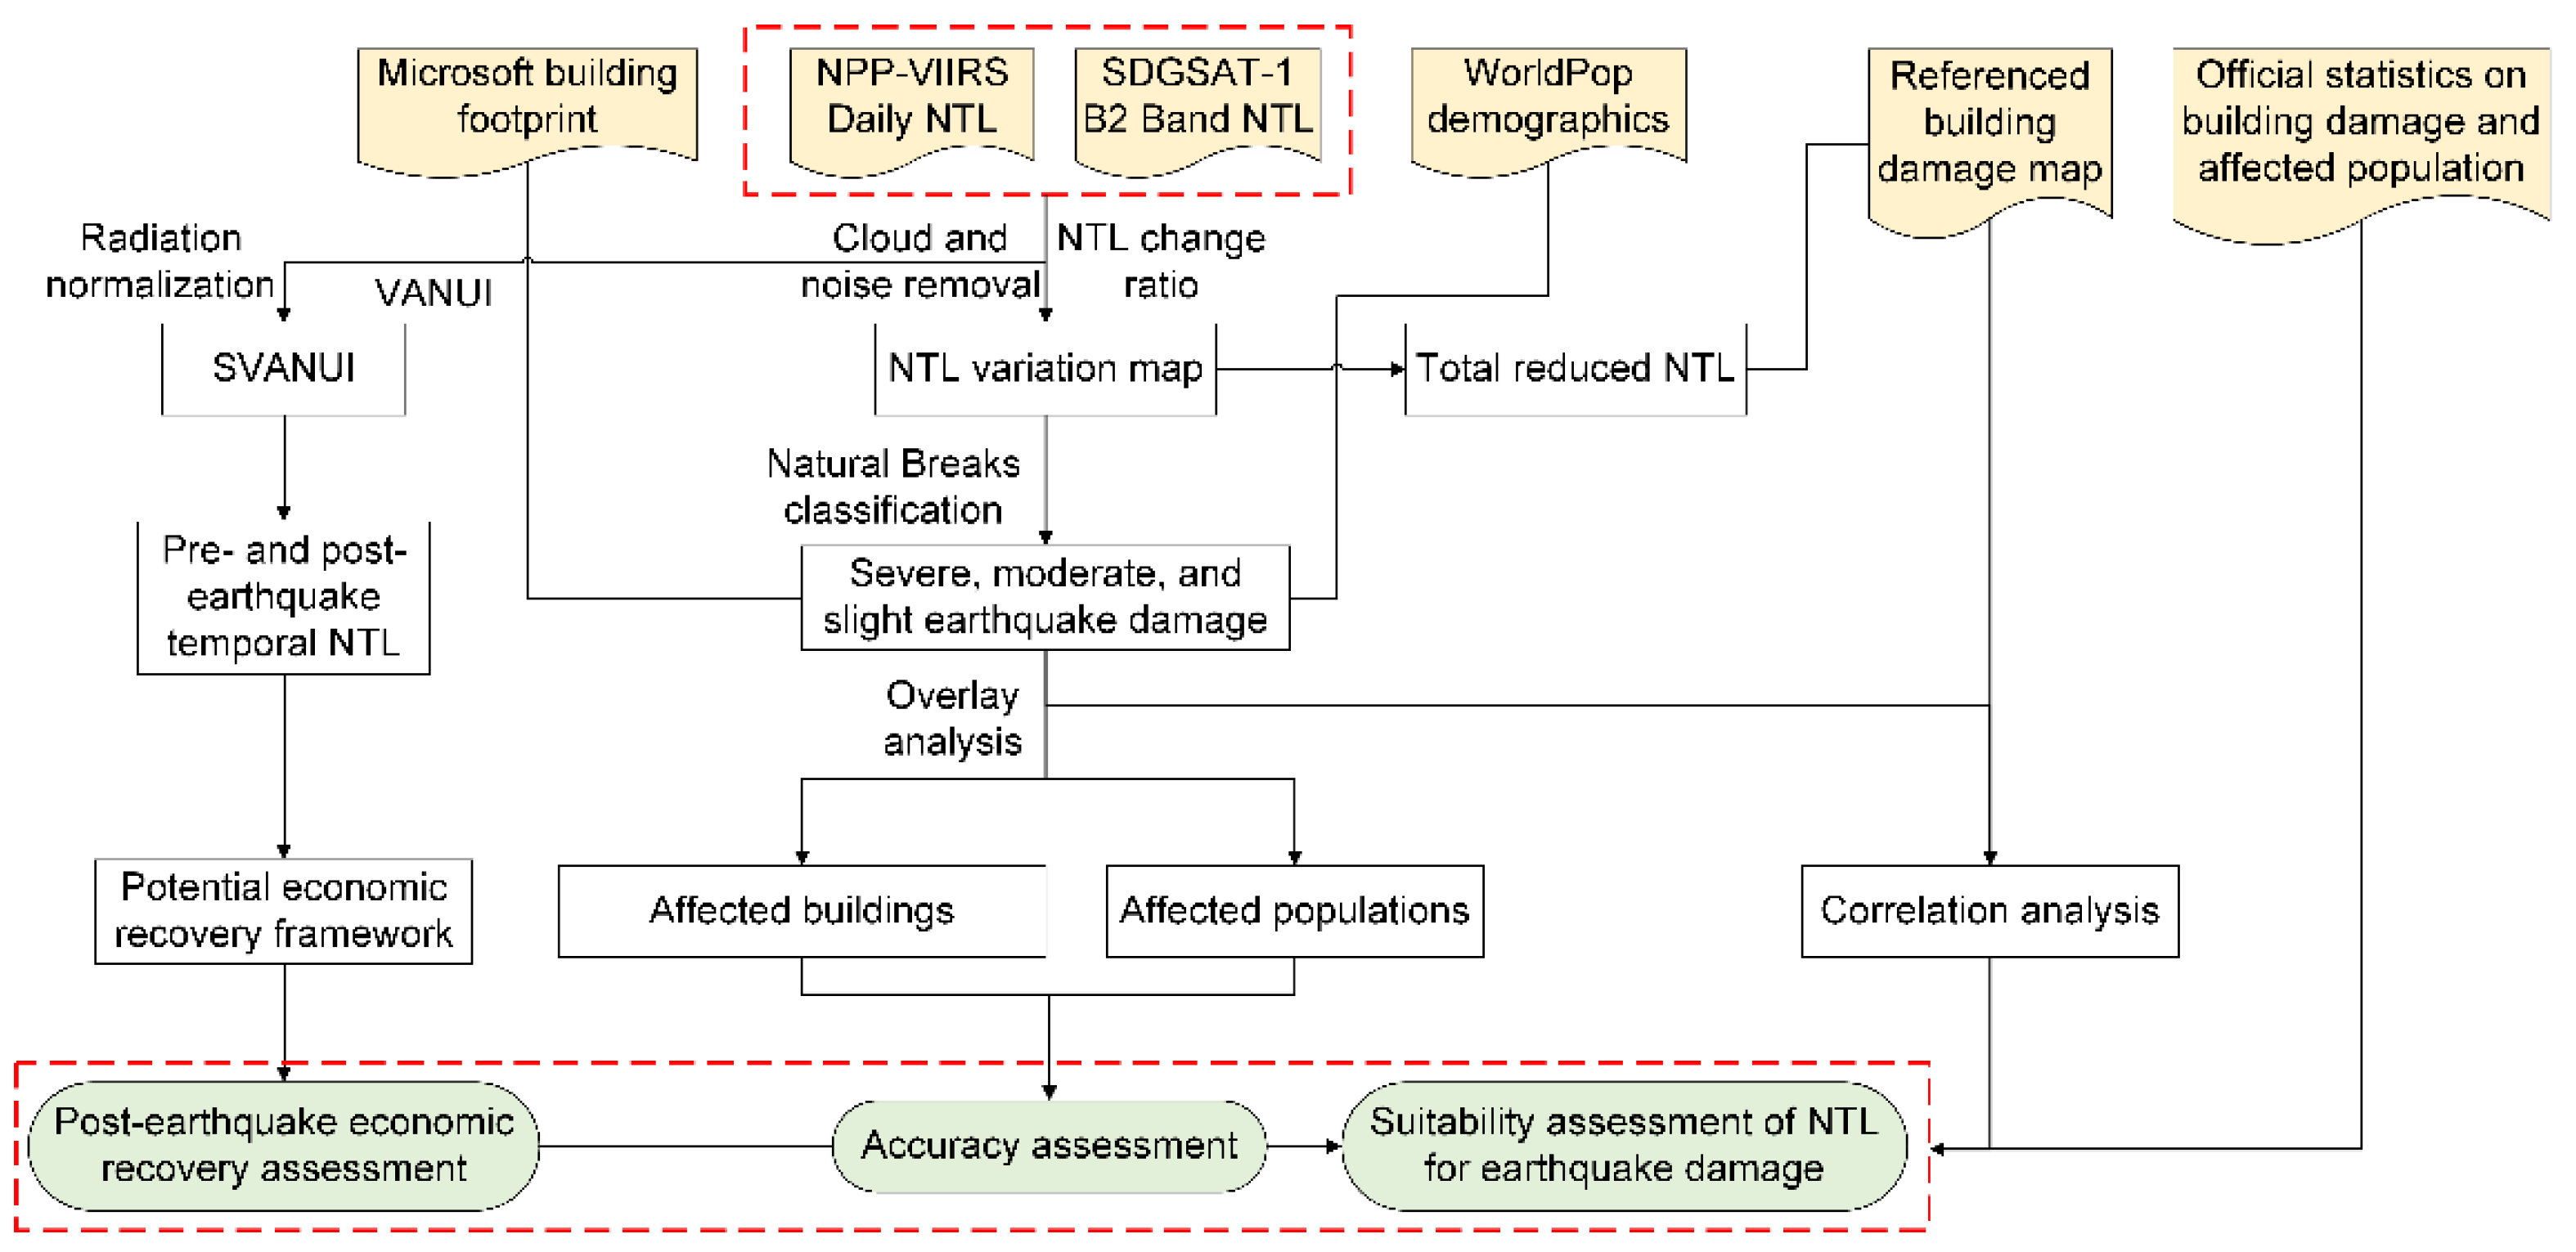
Figure 6.
A potential framework for economic recovery following a seismic event.
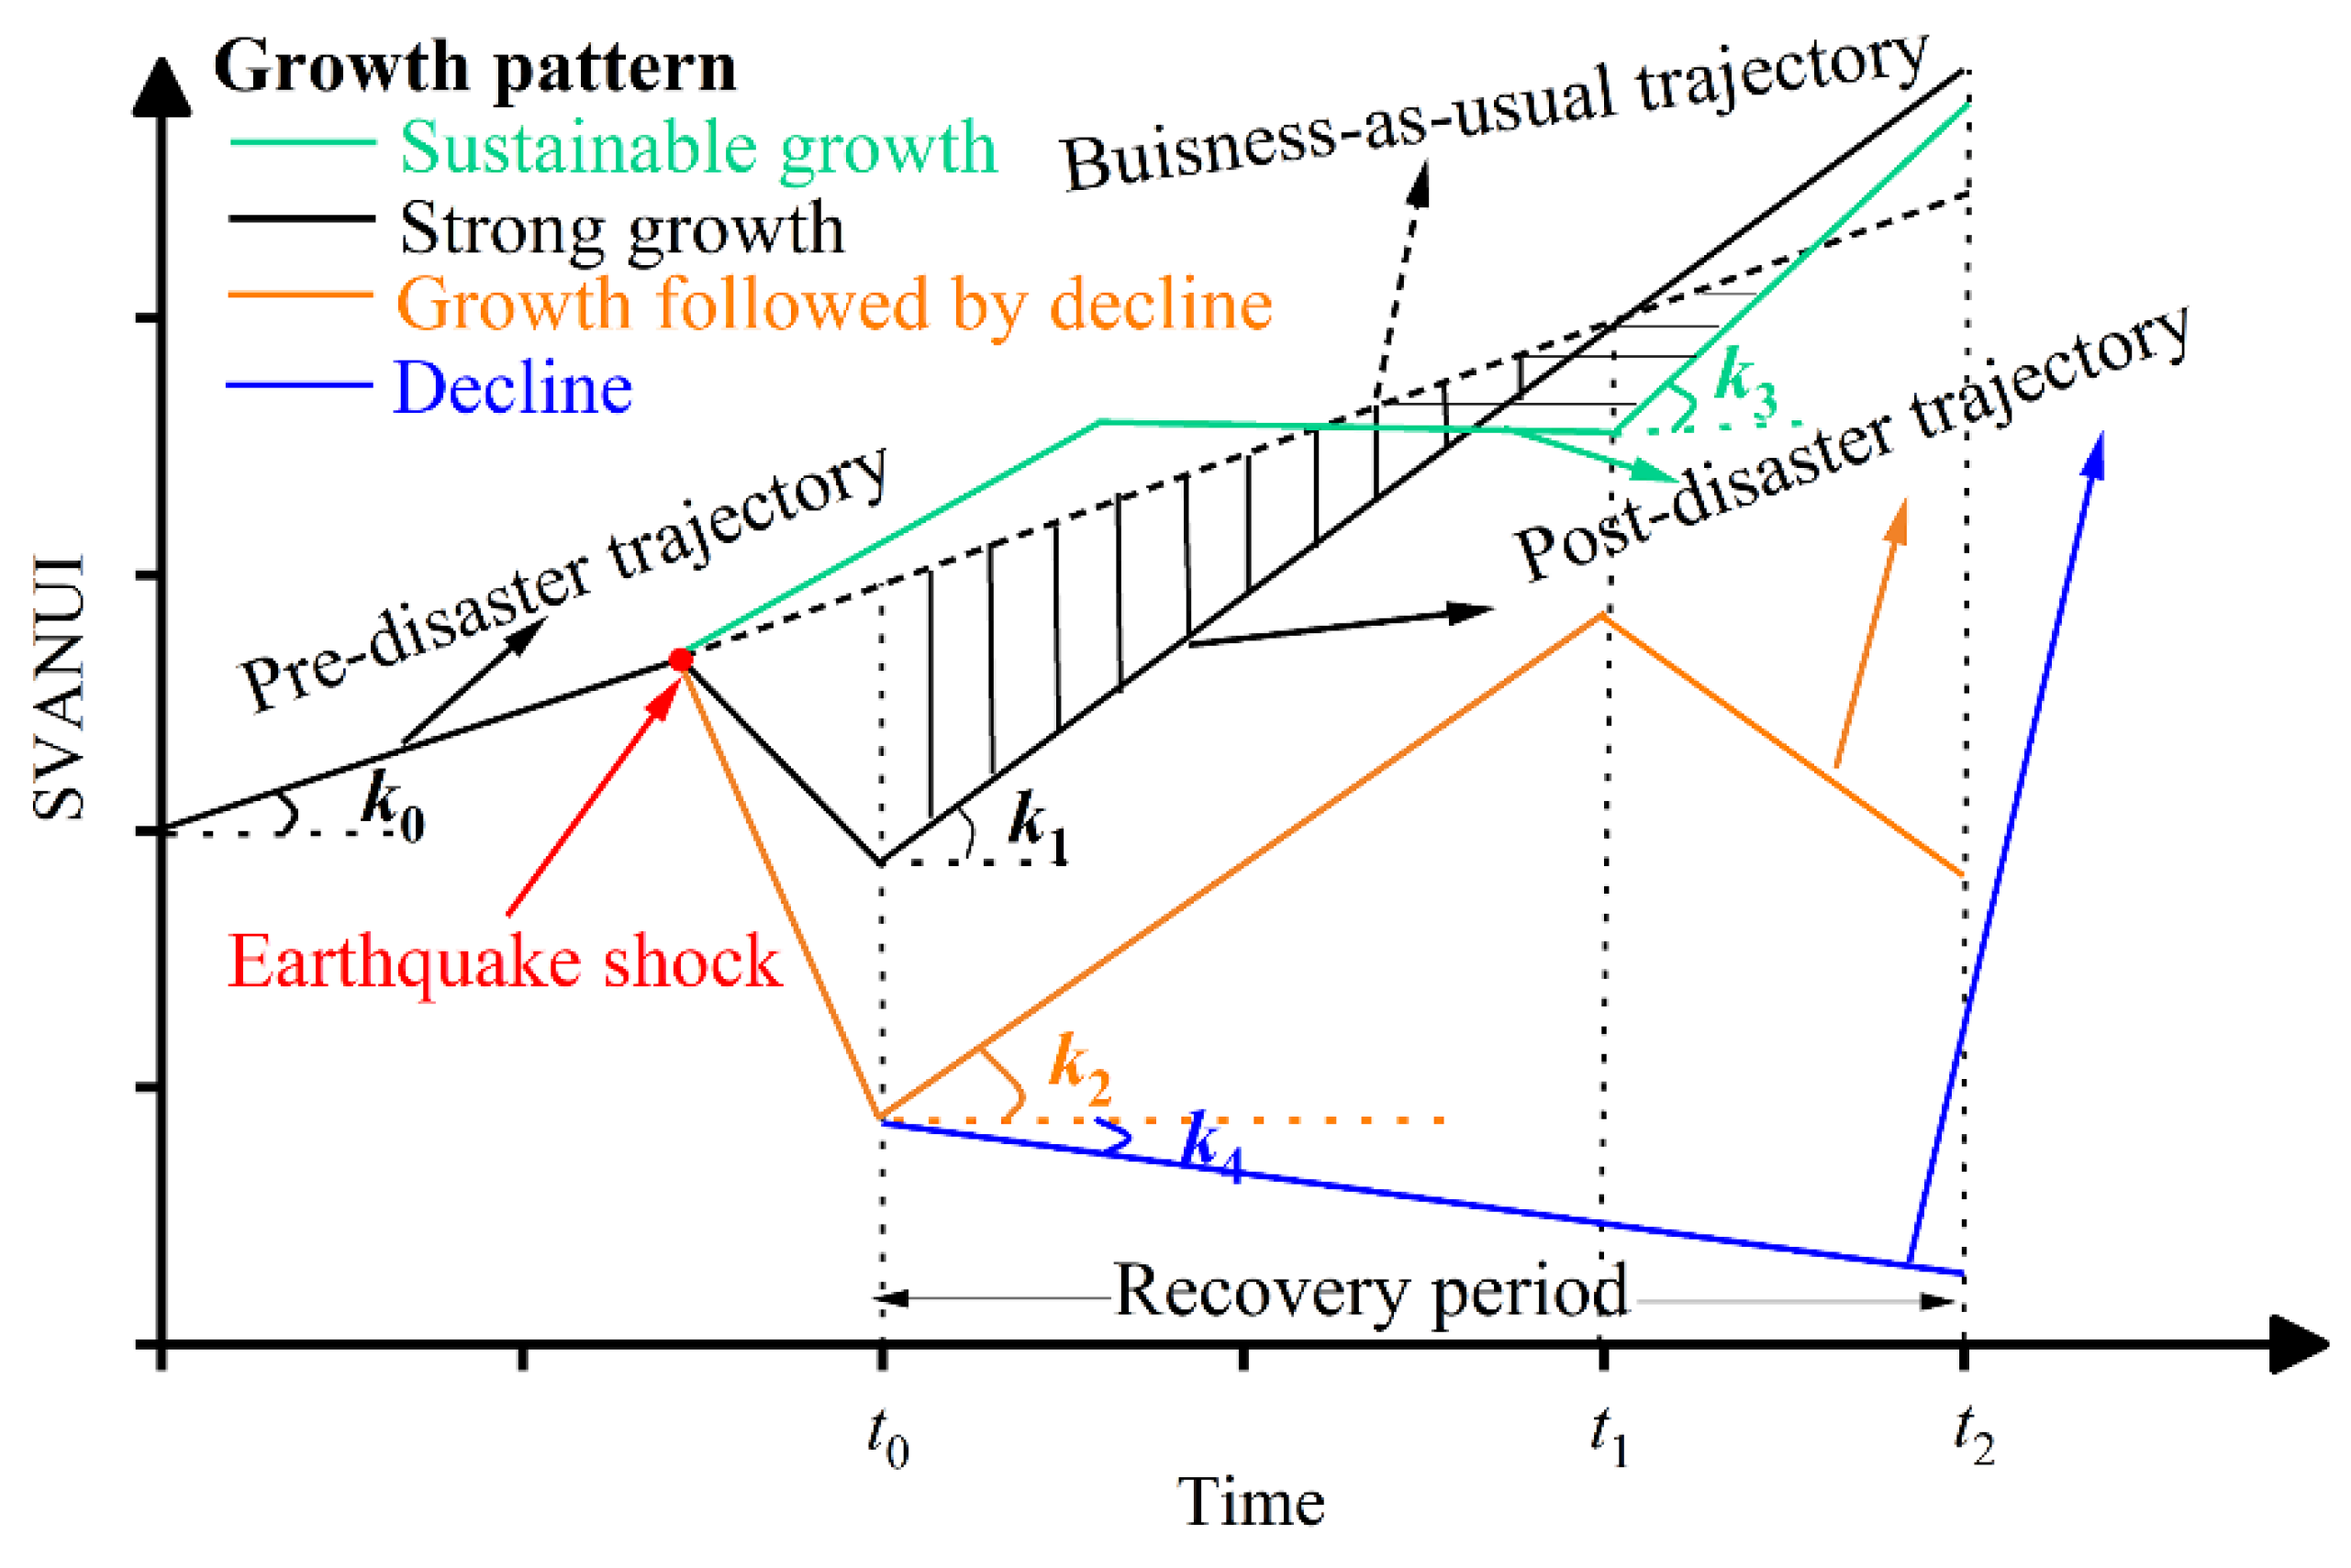
Figure 7.
Maps of damaged level, the number of damaged buildings and affected populations after the earthquake using (a) NPP-VIIRS NTL and (b) SDGSAT-1 NTL data, respectively.
Figure 7.
Maps of damaged level, the number of damaged buildings and affected populations after the earthquake using (a) NPP-VIIRS NTL and (b) SDGSAT-1 NTL data, respectively.
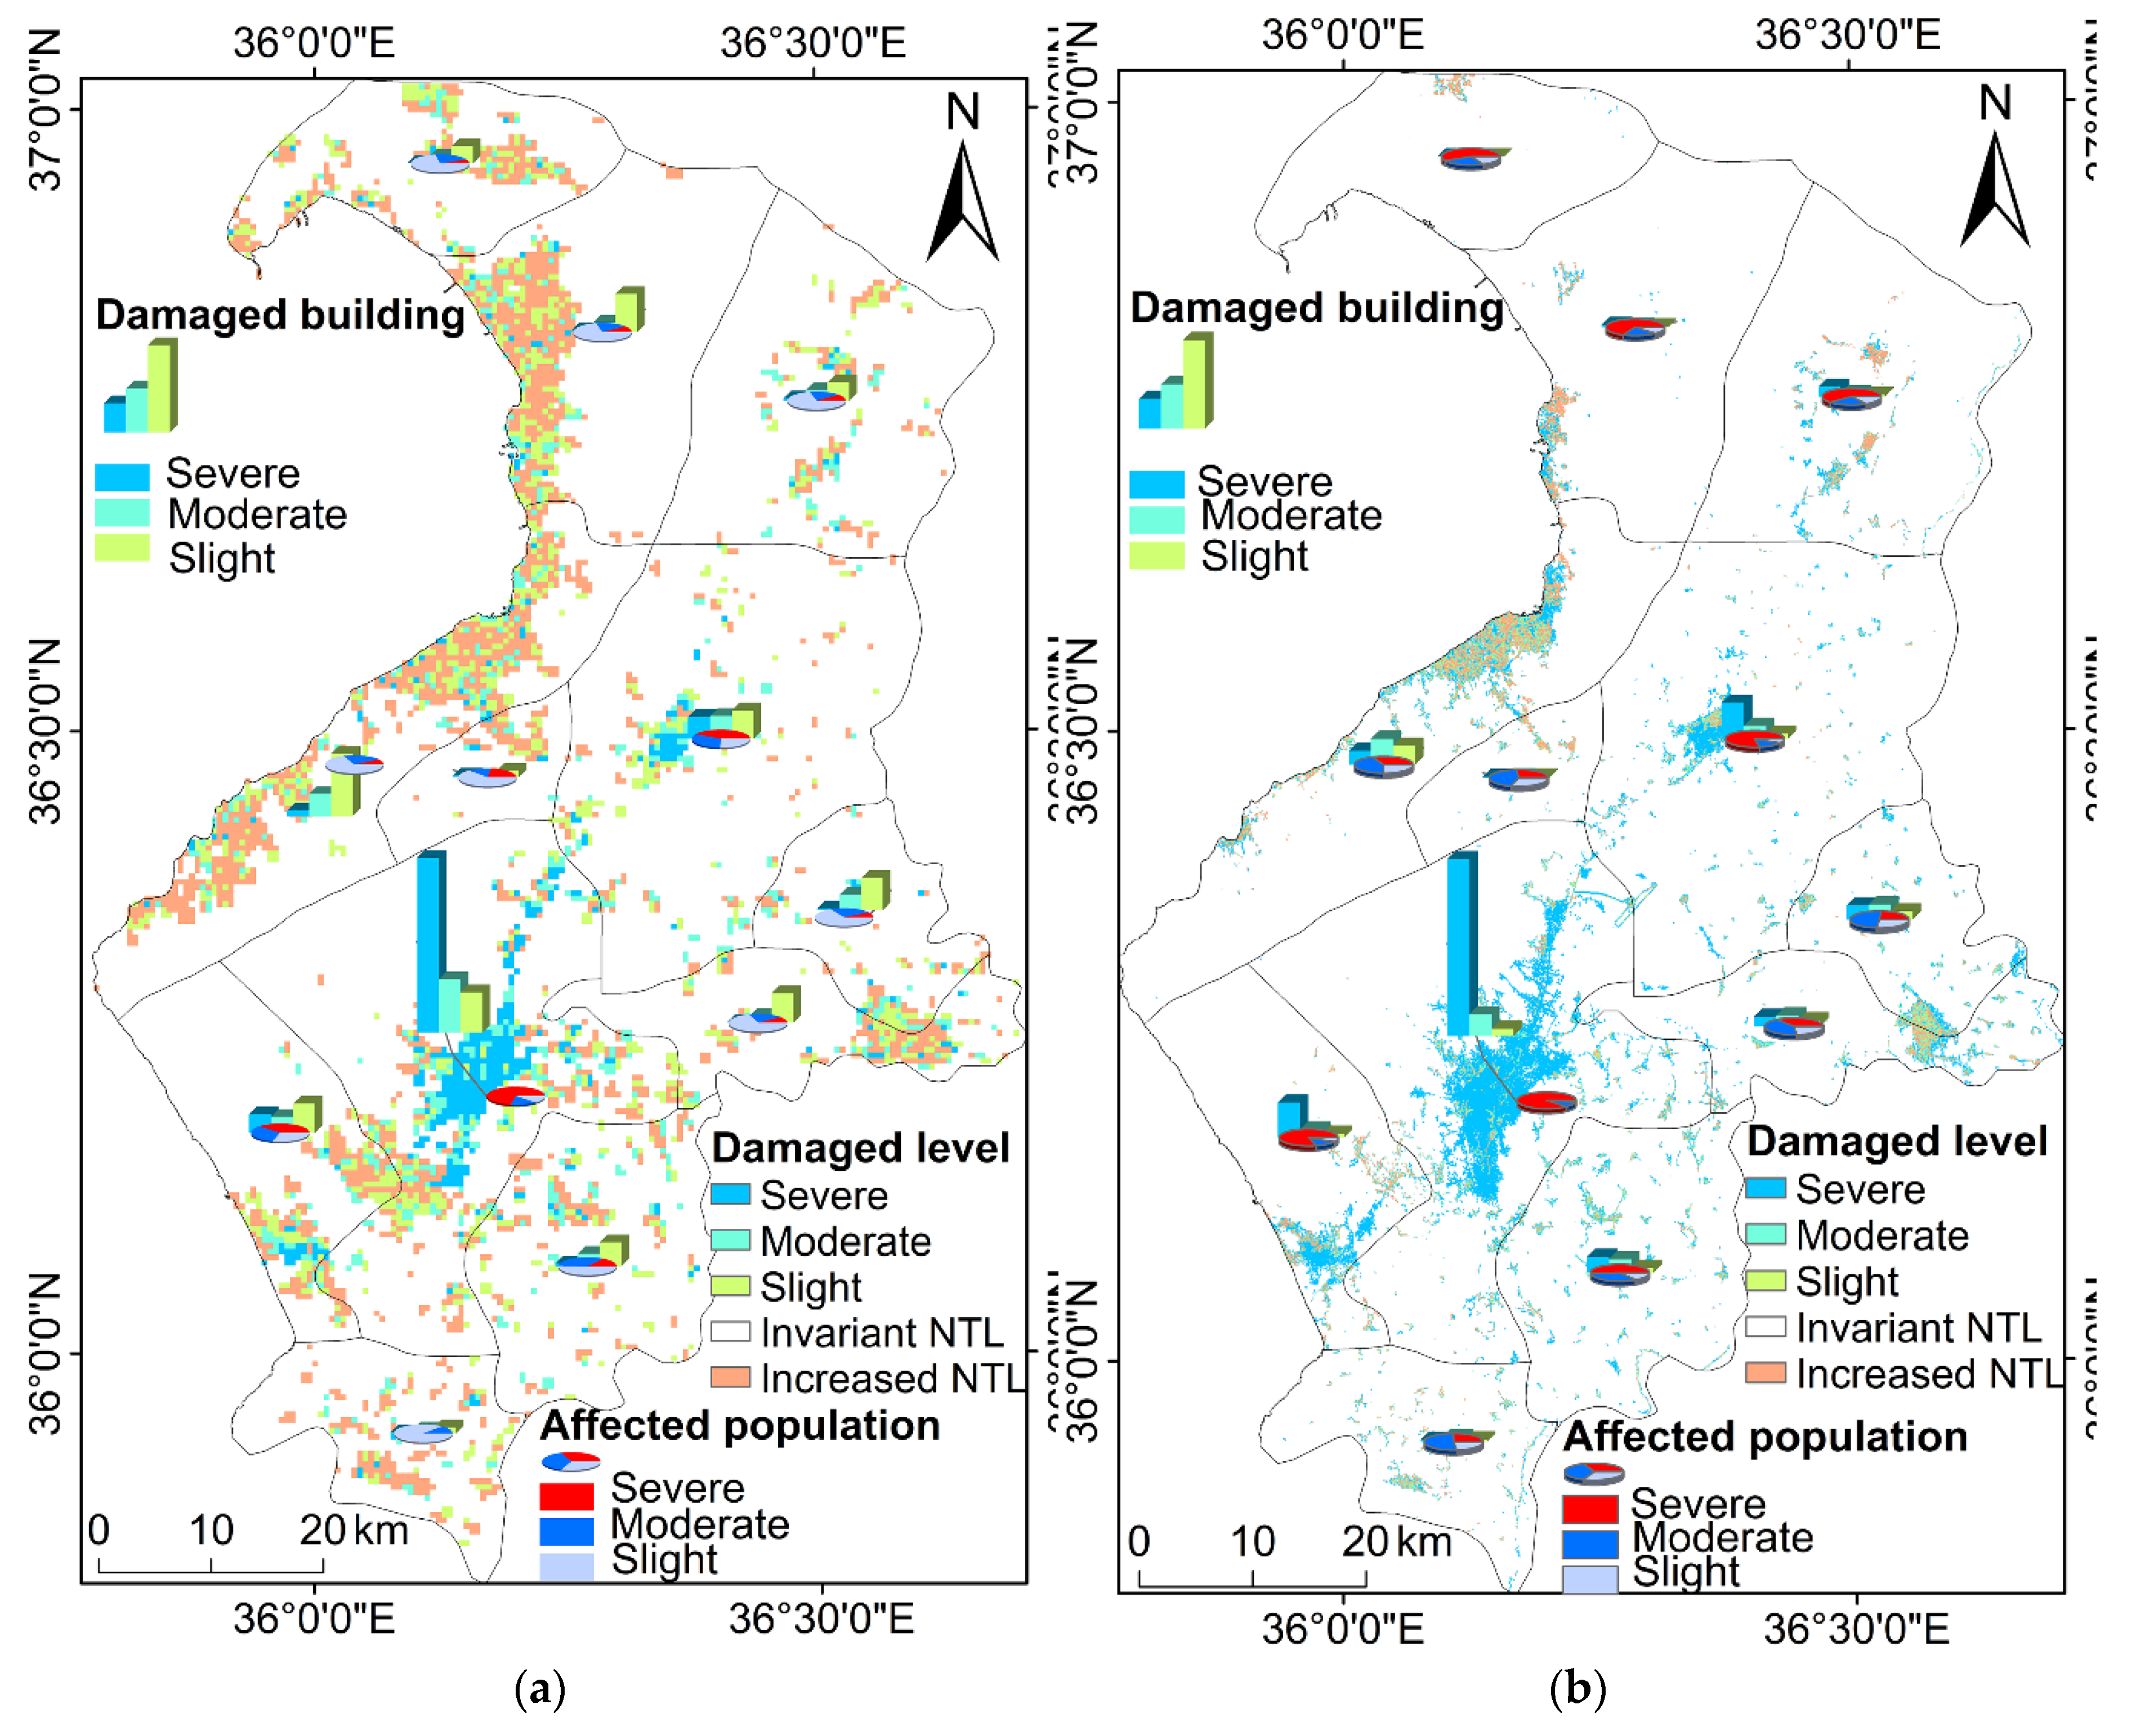
Figure 8.
Post-earthquake economic recovery framework in Hatay Province.
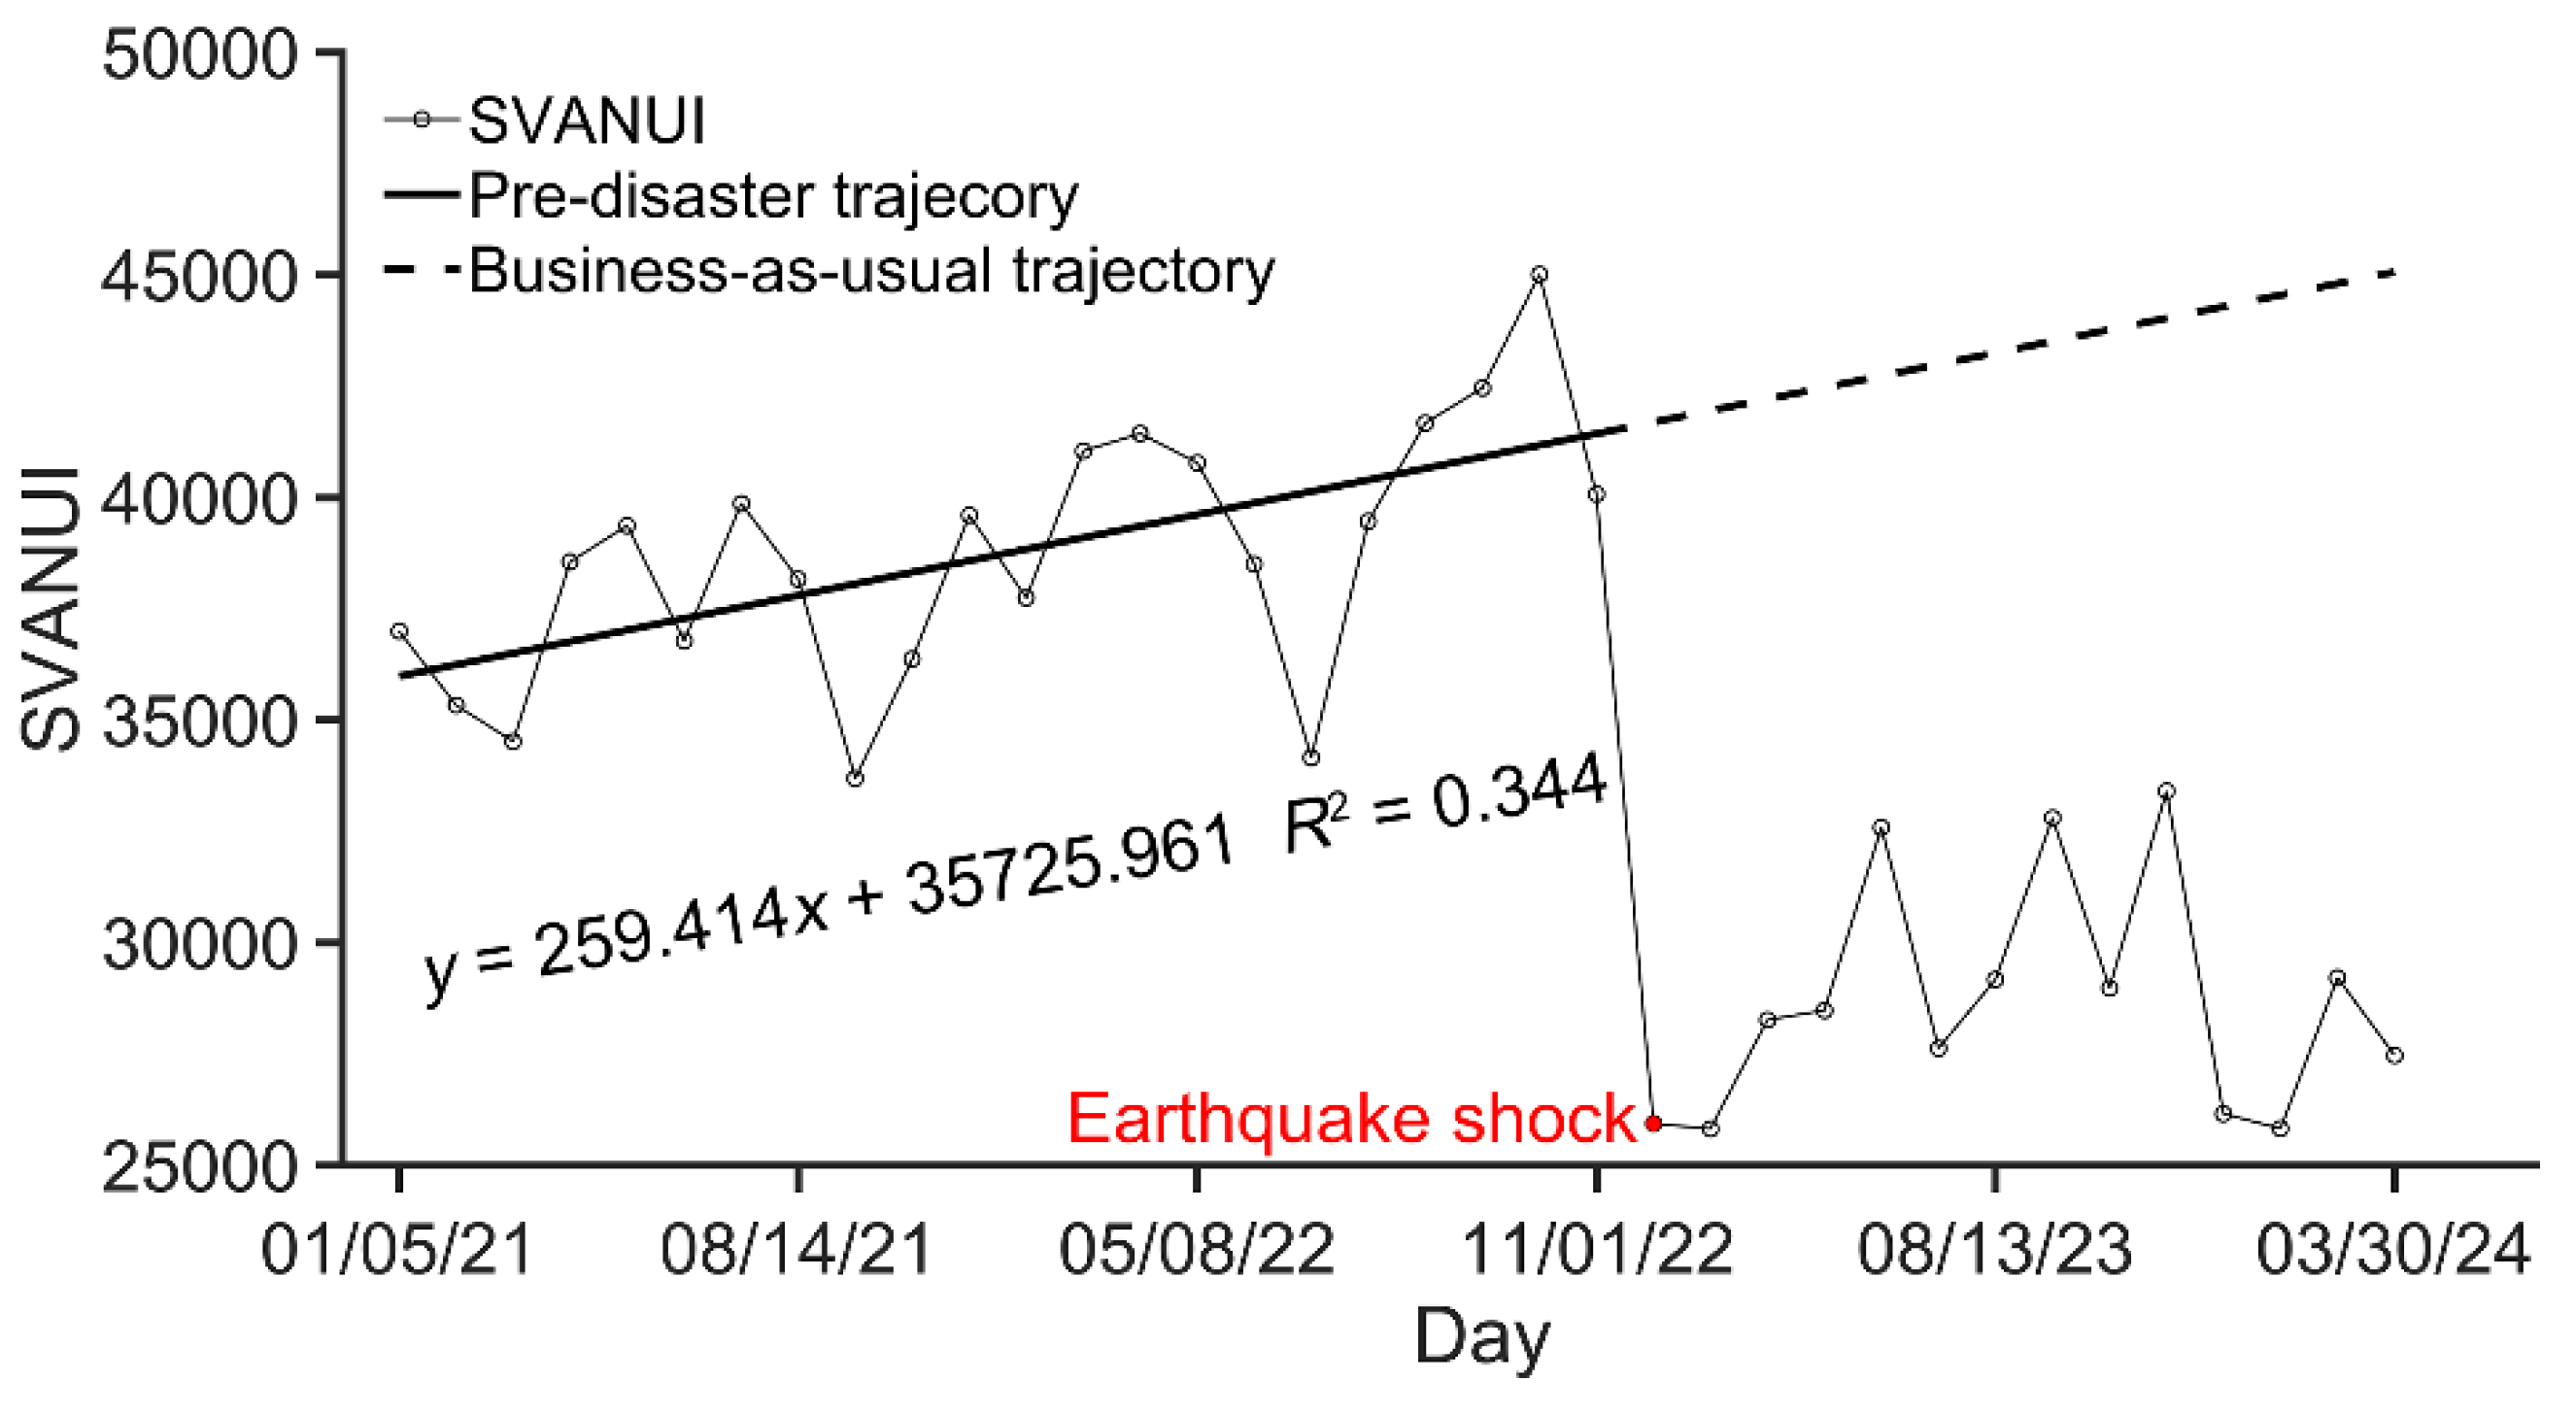
Figure 9.
Post-earthquake economic recovery framework in (a) Altinozu, (b) Antakya, (c) Belen, (d) Dortyol, (e) Erzin, (f) Hassa, (g) Iskenderun, (h) Kirikhan, (i) Kumlu, (j) Reyhanli, (k) Samandag, (l) Yayladagi.
Figure 9.
Post-earthquake economic recovery framework in (a) Altinozu, (b) Antakya, (c) Belen, (d) Dortyol, (e) Erzin, (f) Hassa, (g) Iskenderun, (h) Kirikhan, (i) Kumlu, (j) Reyhanli, (k) Samandag, (l) Yayladagi.
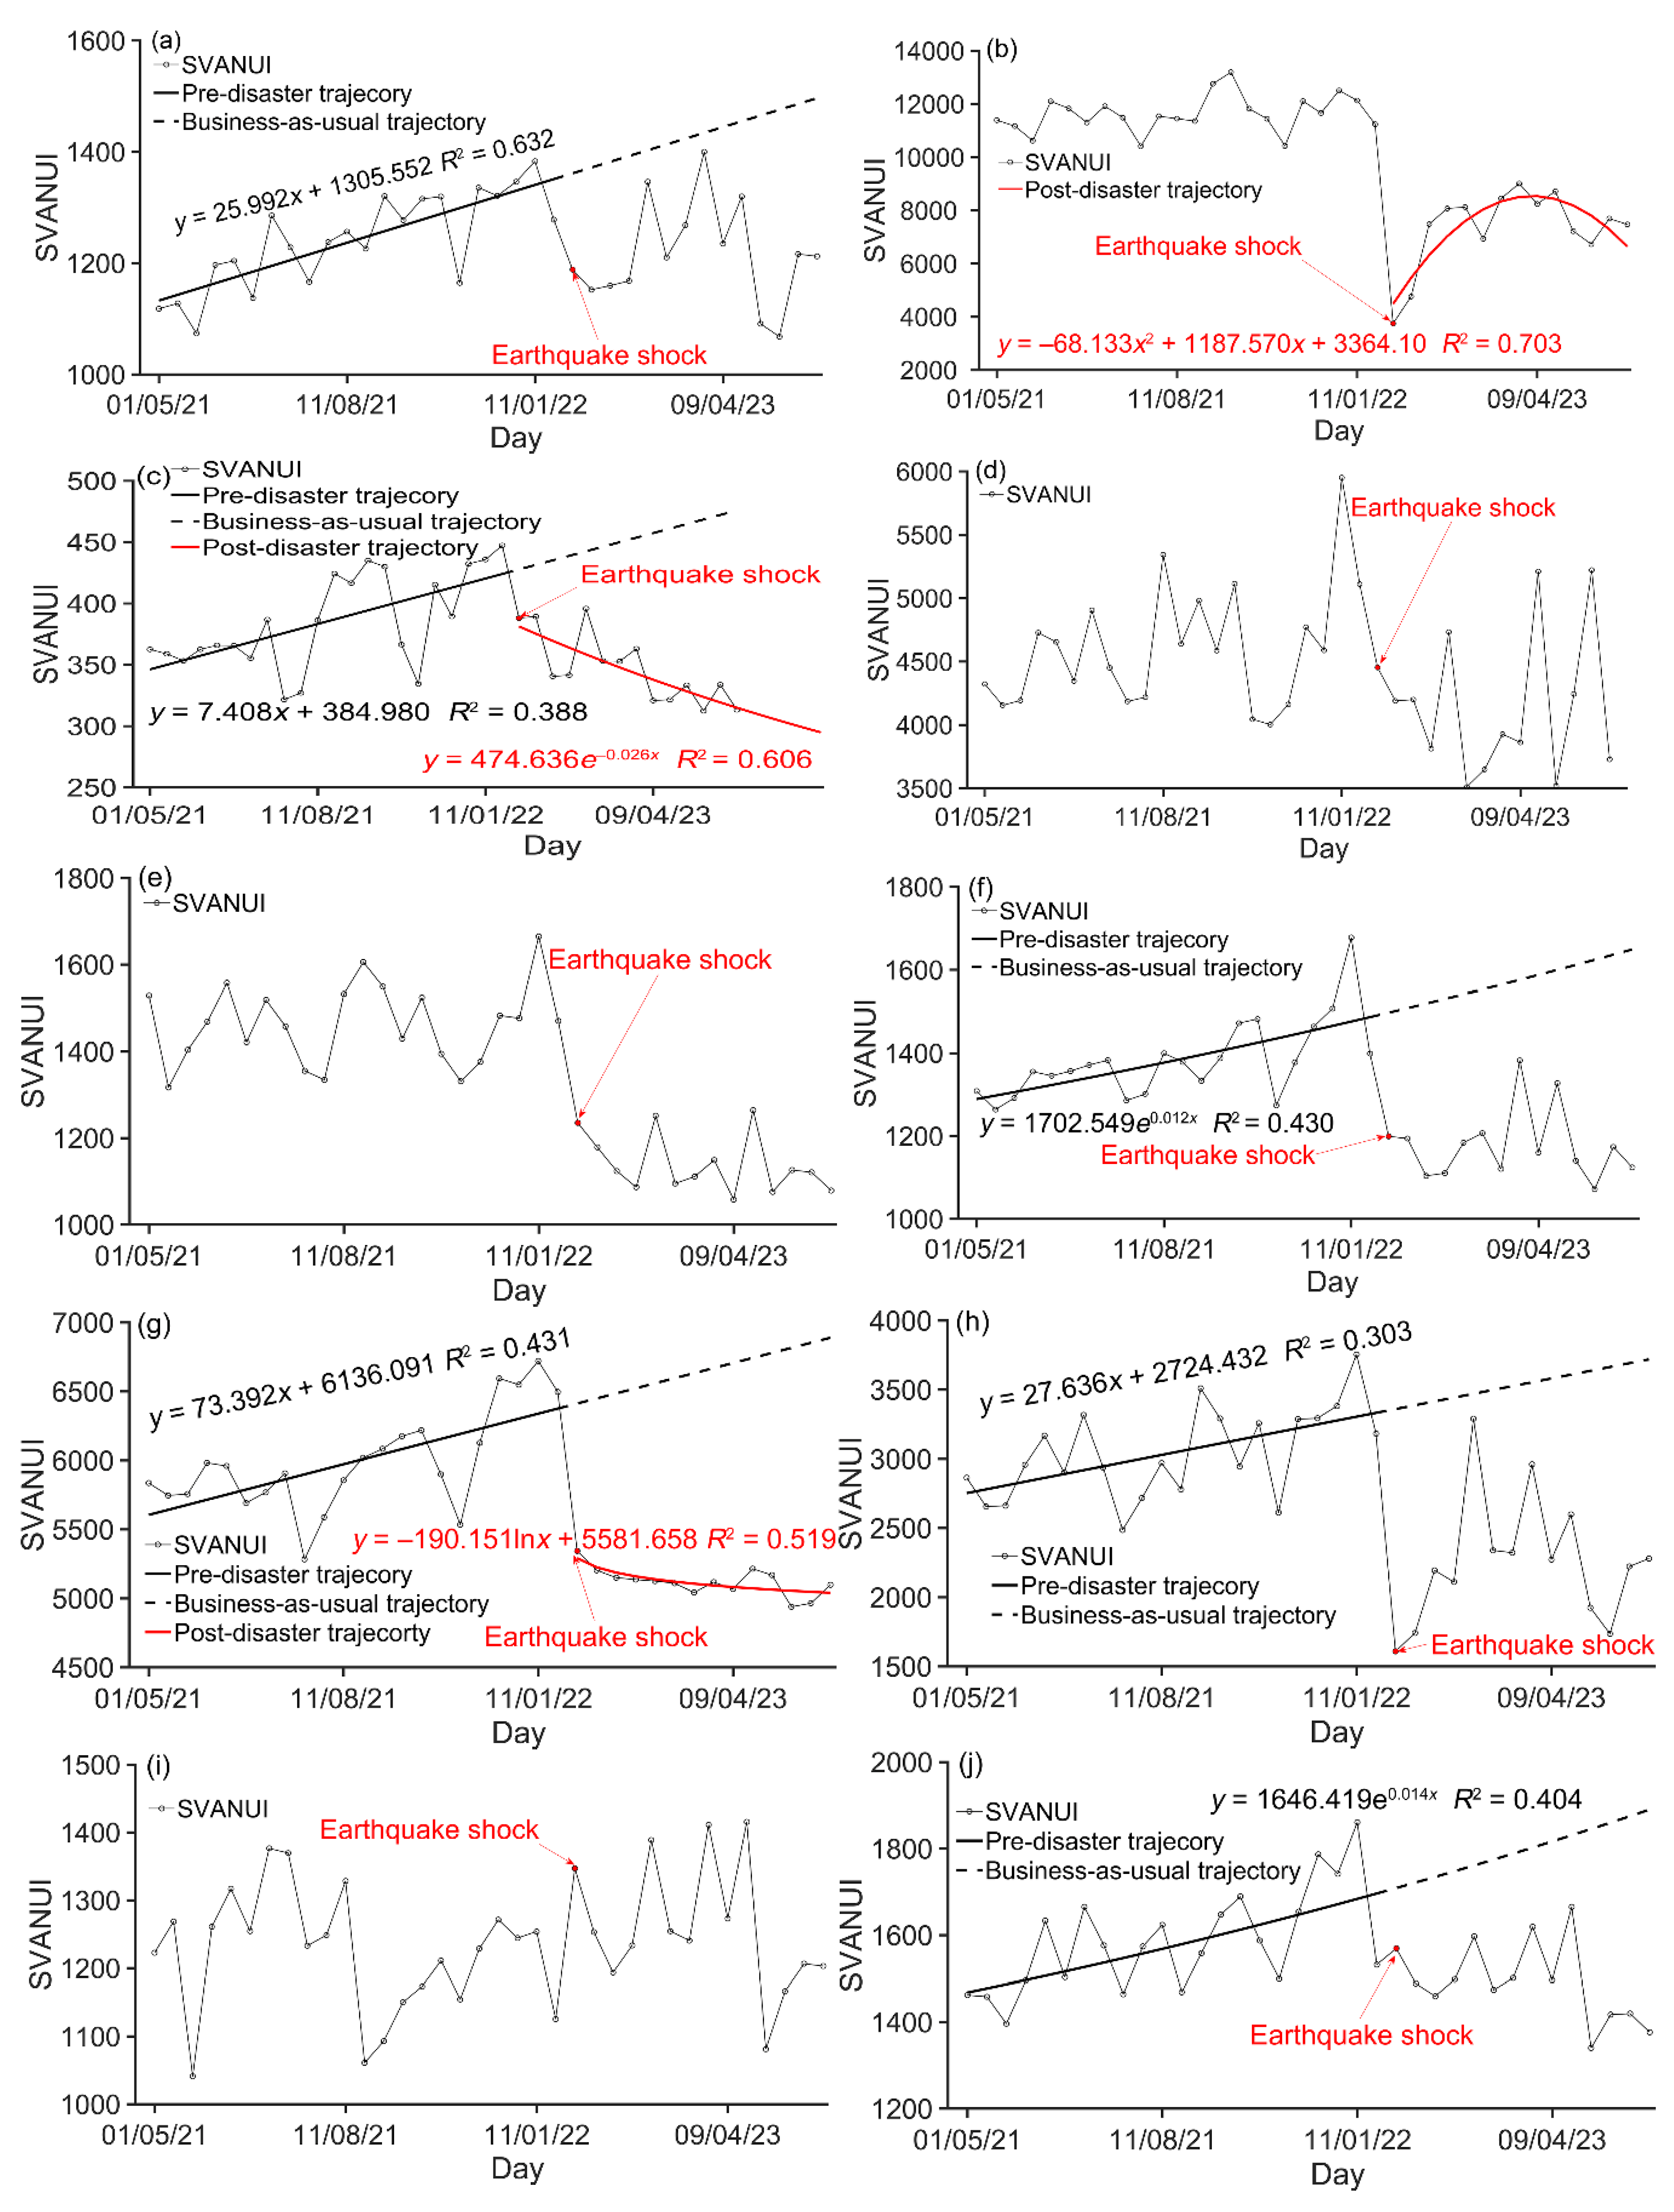
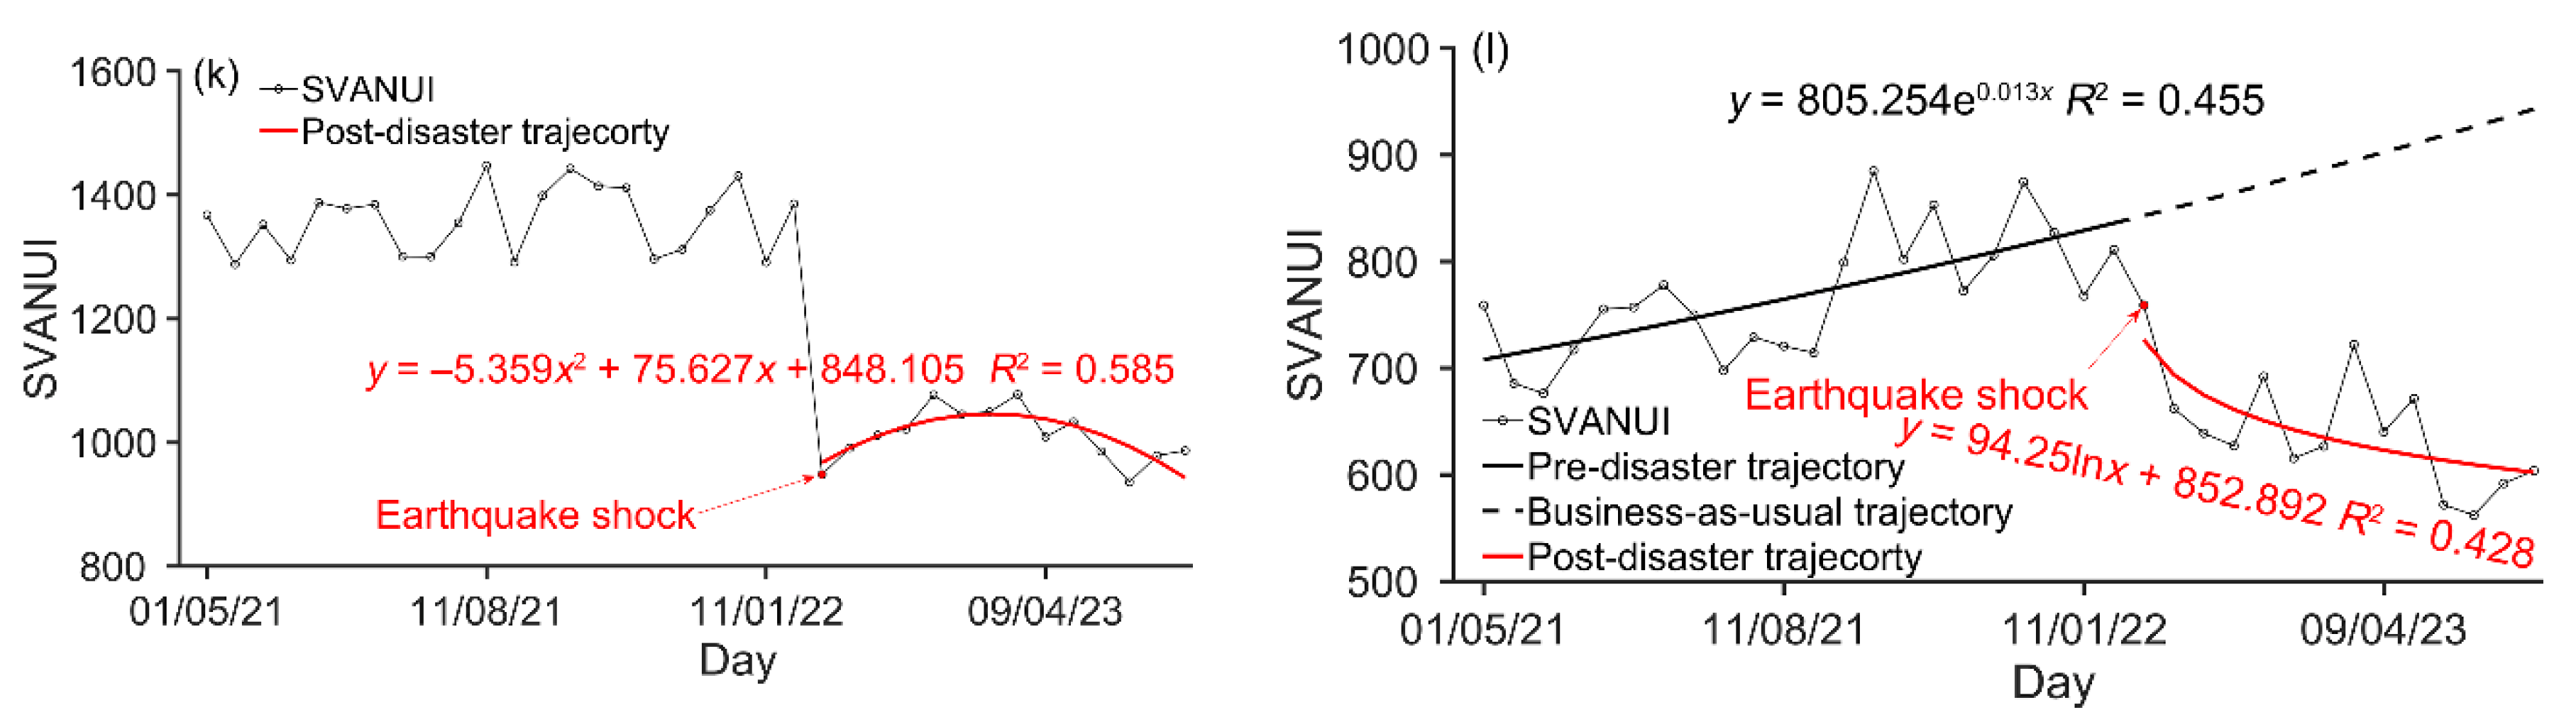
Figure 10.
Linear correlations between the SRNPPNTL and (a) total number of damaged buildings, (b) total area of damaged buildings, (c) area of collapsed damaged buildings, (d) area of severely damaged buildings, (e) area of moderately damaged buildings, and (f) area of slightly damaged buildings.
Figure 10.
Linear correlations between the SRNPPNTL and (a) total number of damaged buildings, (b) total area of damaged buildings, (c) area of collapsed damaged buildings, (d) area of severely damaged buildings, (e) area of moderately damaged buildings, and (f) area of slightly damaged buildings.
Figure 11.
Linear correlations between the SRSDGSATNTL and (a) total number of damaged buildings, (b) total area of damaged buildings, (c) area of collapsed damaged buildings, (d) area of severely damaged buildings, (e) area of moderately damaged buildings, and (f) area of slightly damaged buildings.
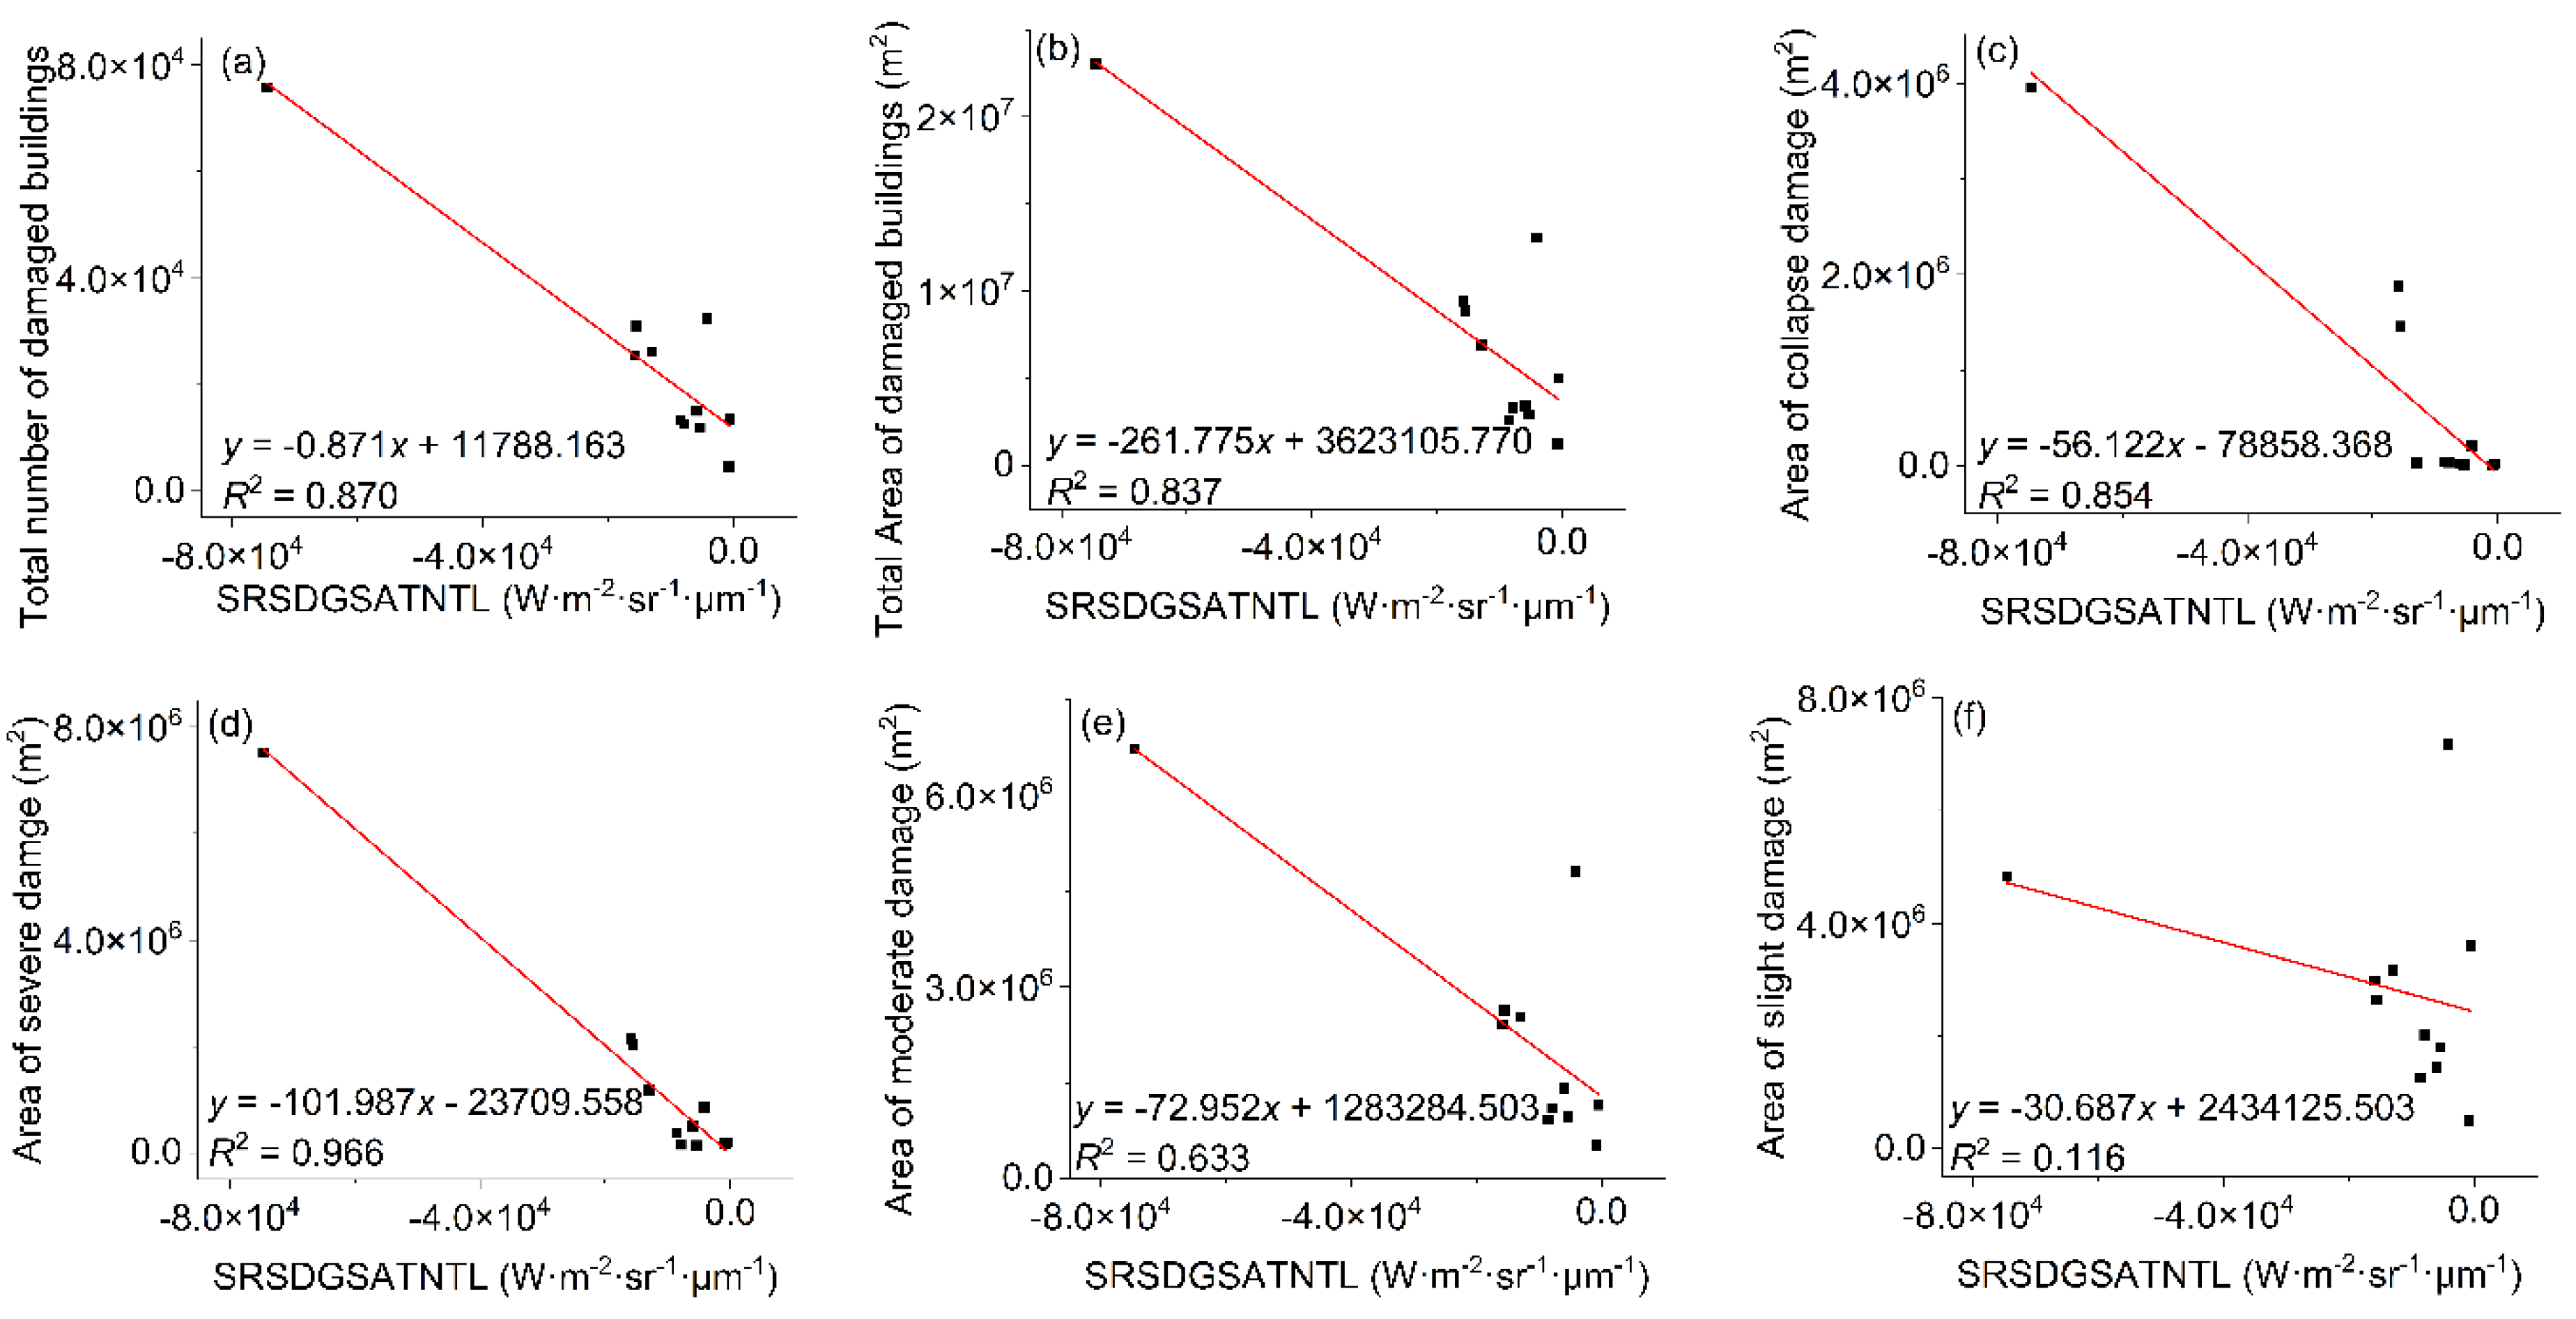

Table 1.
Introduction of data sources.
| Data type | Data Description | Period | Purpose |
|---|---|---|---|
| NPP-VIIRS VNP46A1 DNB NTL |
Pre- and post-earthquake daily NTL data | August 25, 2022, and February 12, 2023 | Assessment of potential damage from earthquake disaster |
| Cloud-free DNB NTL data | January 2021 – March 2024 | Assessment of post-earthquake economic recovery | |
| SDGSAT-1 GIU NTL | Daily NTL data for the B2 band | August 22, 2022, and February 12, 2023 | Assessment of potential damage from earthquake disaster |
| MOD13A1 | Version 6 16-day EVI | 2021 – 2023 | Calibration of daily NTL data |
| Microsoft building footprint | Vectorized building outline | 2014 – 2022 | Statistics on earthquake-damaged buildings |
| WorldPop demographics | Demographics in GeoTIFF format | 2020 | Statistics on earthquake-affected populations |
| Building Damage Map | Building damage map in Hatay Province, Turkey derived from damage proxy maps | Last updated on May 9, 2023 | Validation of NTL-identified building damage |
| Administrative divisions | Administrative boundaries for 12 districts in Hatay Province, Turkey | 2022 | Assessment of post-earthquake economic recovery over the districts |
Table 2.
Accuracy assessment of earthquake damage from NPP-VIIRS and SDGSAT-1 data.
| Data type | Class | CE | OE | OA | KC |
|---|---|---|---|---|---|
| NPP-VIIRS | Damage | 11.58% | 14.29% | 86.21% | 0.72 |
| No damage | 16.23% | 13.21% | |||
| SDGSAT-1 | Damage | 8.67% | 59.69% | 65.66% | 0.34 |
| No damage | 42.39% | 4.50% |
Table 3.
Linear correlations between building damages determined by the NPP-VIIRS NTL, the SDGSAT-1 NTL, and reference building damages.
Table 3.
Linear correlations between building damages determined by the NPP-VIIRS NTL, the SDGSAT-1 NTL, and reference building damages.
| Data type | Damaged level | Linear correlation equation | R2 |
|---|---|---|---|
| NPP-VIIRS | Severe | y = –40716.75x – 352264.96 | 0.99 |
| Moderate | y = –7417.52x – 23663.28 | 0.74 | |
| Slight | y = –15922.43x + 447060.95 | 0.13 | |
| SDGSAT-1 | Severe | y = –159.51x – 538358.85 | 0.98 |
| Moderate | y = 115.80x + 835291.70 | 0.02 | |
| Slight | y = –695.06x + 162020.71 | 0.37 |
Disclaimer/Publisher’s Note: The statements, opinions and data contained in all publications are solely those of the individual author(s) and contributor(s) and not of MDPI and/or the editor(s). MDPI and/or the editor(s) disclaim responsibility for any injury to people or property resulting from any ideas, methods, instructions or products referred to in the content. |
© 2024 by the authors. Licensee MDPI, Basel, Switzerland. This article is an open access article distributed under the terms and conditions of the Creative Commons Attribution (CC BY) license (http://creativecommons.org/licenses/by/4.0/).
Copyright: This open access article is published under a Creative Commons CC BY 4.0 license, which permit the free download, distribution, and reuse, provided that the author and preprint are cited in any reuse.


