Submitted:
11 July 2024
Posted:
12 July 2024
You are already at the latest version
Abstract
Inflammation is implicated in the etiology of obesity-related diseases. Thromboxane-prostanoid receptor (TPR) is known to play a role in mediating an inflammatory response in a variety of cells. Gut-derived lipopolysaccharide (LPS), a TLR4 agonist, is elevated in obesity. Moreover, free fatty acids (FFAs) are important mediators of obesity-related inflammation. However, the role and mechanisms by which TPR regulates the inflammatory response in human immune cells remain unclear. We sought to determine the link between TPR and obesity and the role/mechanisms by which TPR alters LPS or stearic acid (SA)-induced inflammatory response in PBMCs. Cells were pre-treated with agents blocking TPR signaling, followed by treatment with LPS or stearic acid (SA). Our findings showed that TPR mRNA levels are higher in PBMCs from individuals with obesity. Blockade of TPR as well as ROCK which acts downstream of TPR, attenuated LPS and/or SA-induced pro-inflammatory response. On the other hand, TPR activation using its agonist enhanced the pro-inflammatory effects of LPS and/or SA. Of note, TPR agonist by itself elicits an inflammatory response which was attenuated by blocking TPR or ROCK. Our data suggest that TPR plays a key role in promoting an inflammatory response in human PBMCs and this effect is mediated via TLR4 and/or ROCK signaling.
Keywords:
thromboxane A2
; inflammation
; lipopolysaccharide
; stearic acid
; PBMC
; ROCK
1. Introduction
Worldwide, 537 million adults have been diagnosed with diabetes. This alarming number is expected to rise to 700 million by 2045 [1]. The obesity epidemic has increased the prevalence of diabetes, making diabetes one of the leading causes of death in the U.S. The excess adipose tissue (AT) seen in obesity disturbs cellular homeostasis and upregulates the production of inflammatory markers, including tumor necrosis factor α (TNF-α), monocyte chemoattractant protein-1 (MCP-1), and interleukin 6 (IL-6). Along with the increased production of cytokines, AT promotes the production of hormones and non-esterified fatty acids [2]. These mediators facilitate oxidative stress and a pro-inflammatory state impairing beta cell function, and insulin resistance [3]. Targeting the initiation steps of the inflammation cascade presents a therapeutic target for obesity-induced insulin resistance and hyperglycemia.
Thromboxane A2 (TXA2) is a lipid mediator in the arachidonic acid signaling system [4]. In an inflammatory state, the enzymes phospholipase A2 and cyclooxygenase (COX-1/COX-2) facilitate the cleavage of arachidonic acid and the conversion to prostaglandin H2 (PGH2). PGH2 is further metabolized into TXA2 by the enzyme thromboxane A synthase (THAS) [4]. TXA2 exerts its biological activity via the transmembrane G-protein-coupled receptor, the thromboxane-prostanoid receptor (TPR) aka TXA2 receptor. Although platelet activation and vasoconstriction are two major physiological functions of TPR, it has received a significant attention in the past two decades for its pathophysiological role in many diseases. It has been extensively studied for its role in altering the inflammatory processes in endothelial cells [5,6,7]. However, little is known regarding the role of TPR in mediating the inflammatory response in immune cells. Of note, immune cells like macrophages are the significant source of TXA2 [8,9] and express TPR [10]. A study by Hartney et al. has shown that TPR signaling is required for fibronectin-induced matrix metalloproteinase 9 production by macrophages [11]. TPR antagonism inhibited LPS-induced inflammatory response in rat peritoneal macrophages [12]. Moreover, TPR exerts a pro-inflammatory effect in microglial cells [13,14]. However, the link between immune cell TPR and obesity remains unknown. Moreover, the role and mechanisms by which immune cell TPR exerts an inflammatory response upon treatment with obesity-related factors, in particular LPS and FFA remains unclear.
Human peripheral blood mononuclear cells (PBMCs) are comprised of monocytes, macrophages, and lymphocytes. PBMCs represent the clinically relevant model system to study the role of immune system in the development of many diseases. LPS is an endotoxin found on the membrane of gram-negative bacteria. The circulating levels of gut-derived LPS is increased in obesity [15]. Moreover, obesity is characterized by an increase in AT lipolysis and release of FFA from the AT. LPS-induced inflammatory response is initiated by the activation of toll-like receptor 4 and the NFκB pathway, which induce the release of inflammatory cytokines from macrophages and lymphocytes [16]. Similarly, saturated fatty acids are reported to promote an inflammatory response via TLR4/NFκB axis [17]. However, the role and mechanisms by which TPR mediates the pro-inflammatory effects of these obesity-related factors, in particular LPS and FFAs, in human immune cells are still unclear.
The objectives of this study are to assess the link between PBMC TPR and human obesity and determine the role and mechanisms by which TPR mediates the pro-inflammatory effects in human immune cells, in particular, PBMCs.
2. Materials and Methods
2.1. Chemicals
SQ29548 (SQ) (Cat, 19025) a TPR antagonist, Ozagrel (OZA) (Cat, 70515), a selective inhibitor of THAS, BM567 (BM) (Cat, 10155), a dual-acting agent, inhibiting both TPR and THAS, were used to block TXA2 signaling and were obtained from Cayman Chemical (Ann Arbor, Michigan 48108 USA). [1S-[1α,2α(Z),3β(1E,3S*),4α]]-7-[3-[3-hydroxy-4-(4-iodophenoxy)-1-butenyl]-7-oxabicyclo [2.2.1] hept-2-yl]-5-heptenoic acid (IBOP) (Cat, 19600), a TXR agonist was also obtained from Cayman Chemical (Ann Arbor, MI, USA). Y-27632 2HCl, a selective ROCK1 and ROCK2 inhibitor (Cat, 1293823), was obtained from biogems (Westlake village, CA, USA). Thromboxane B2 ELISA Kit (Cat, 501020) and LDH Cytotoxicity Assay kit (Cat, 601170) were obtained from Cayman Chemical. Lipopolysaccharide and stearic acid were purchased from Sigma-Aldrich (Louis, MO, USA) and Nuchek Prep (Elysian, MN, USA), respectively.
2.2. Human Subjects
Study 1. Study Design and Patient Population. Blood samples were collected from normal subjects (BMI<30) and individuals with obesity (BMI>30). Peripheral blood mononuclear cells (PBMCs) were collected to detect the mRNA levels of TPR. This study was approved by the institutional review board of the VA Nebraska-Western Iowa Health Care System. Informed consent was obtained from all subjects involved in the study. The characteristics of the study subjects are shown in Table 1.
The following inclusion and exclusion criteria were applied while choosing the subjects for the study. Inclusion criteria. 1) Age 19 to 75; 2) Lean/Over-weight group: BMI between 20-29.9 kg/m2; Obesity group: BMI 30-55 kg/m2; 3) Subjects should be on stable dose of any medications for at least two months. Exclusion Criteria. 1) Patients currently taking NSAIDs more than 3/week on a prescription basis or taking a daily dose of NSAID; 2) History of diabetes and patients taking diabetes medications as these drugs may alter AT metabolic functions; 3) History of uncontrolled hypertension defined as >160 systolic and 95 diastolic on medication. 4) History of renal disease with GFR<60; 5) History of hepatic failure or AST/ALT > three times the normal range; 6) Patients with active cancer within the last 2 years except for skin cancers; 7) Patients with acute illness needing hospitalization within the last 2 months; 8) patients with acute inflammation; 9) Patients with cardiovascular events such as myocardial infarction, stroke, amputation, unstable angina within the last six months; 10) Pregnancy; 11) Presence of psychosis, suicidal ideations, untreated major depression, dementia and history of stimulant dependence/substance abuse. The study was approved by the institutional review board at the VA Nebraska-Western Iowa Health Care System (NWIHCS). All participants gave informed consent.
Study 2. Blood samples collected from this study were used to isolate PBMCs to perform ex vivo mechanistic studies. This study was approved by the institutional review board of the VA Nebraska-Western Iowa Health Care System and the University of Nebraska Medical Center. Informed consent was obtained from all subjects involved in the study.
2.3. PBMC Isolation and Culture
Heparinized peripheral blood was collected from all study subjects. PBMCs were isolated from whole blood by Ficoll-Hypaque1 density gradient centrifugation at 400 g for 35 minutes at 20°C. Isolated cells were treated with RBC lysis buffer and then washed with PBS and then resuspended at 1x10⁶ cells/ml in RPMI 1640 medium containing 5% fetal bovine serum (R&D system, USA). After an overnight incubation, PBMCs were treated with various agents. Media supernatants were collected at 6 h and 24 h for further analyses.
2.4. Real-Time Quantitative Polymerase Chain Reaction
For gene expression analysis, total RNA was isolated from human PBMCs using Trizol (Life Technologies, USA) and cDNA was synthesized using 5X iScript reverse transcription supermix (Bio-Rad, USA). We conducted real-time polymerase chain reaction (PCR) to identify the mRNA level of Txa2r (encoding for TPR). To quantify gene expression, we used the ΔΔCT method and normalized the values to 18s ribosomal RNA.
2.5. Enzyme-Linked Immunosorbent Assay (ELISA)
Cell culture supernatants collected at 6 h and 24 h were centrifuged at 1200 rpm at 4°C for 3 min to remove cell debris. The protein levels of tumor necrosis factor-alpha (TNFα, Cat, 555212), interleukin-1β, (IL-1β, Cat, 55753), monocyte chemoattractant protein-1 (MCP-1, Cat, 555179) and macrophage inflammatory protein-1 alpha (MIP-1α, Cat, DY270) were analyzed using ELISA kits (BD bioscience and R&D system, USA). Briefly, microplates were coated with a diluted capture antibody and incubated at 4°C overnight. Then, plates were washed 3 times using a wash buffer. Plates were blocked by adding 200 µl of assay diluent for 1 h. Then diluted samples and standards were added, sealed, and incubated for 2 h at room temperature. After 3 washes, plates were incubated with detection antibodies for 1 h. After washing, plates were incubated with TMB substrate solution for 30 min. After color development, 50 µl of stop solution was added to each well, and absorbance was measured at 450 nm according to the manufacturer’s instructions using the Molecular Devices, SpectraMax M5 Microplate Readers (CA, USA).
2.6. Thromboxane B2 Assay
The levels of thromboxane B2 were determined in the media collected from PBMCs using thromboxane B2 ELISA kit (Cayman Chemical, Ann Arbor, MI, USA).
2.7. LDH Cytotoxicity Assay
The levels of LDH activity in the cell culture supernatants were determined using the LDH cytotoxicity assay kit (Cayman Chemical, Ann Arbor, MI, USA).
2.8. Statistical Analysis
All of the quantitative variables are presented as the mean ± SEM. Differences among various groups were analyzed using the Student’s t-test to compare two groups. A one-way analysis of variance followed by Tukey’s post-hoc analysis was used for multiple comparison. Statistical analysis was performed by Graph-pad Prism software. A p-value < 0.05 was considered significant.
3. Results
3.1. TPR Expression is Increased in PBMCs from Individuals with Obesity
We analyzed the mRNA levels of TPR in PBMCs from normal subjects and individuals with obesity (Figure 1A). The TPR mRNA level was significantly higher in PBMCs collected from subjects with obesity and positively correlated with body weight and fat mass (Figure 1B-D). These data suggest that a positive relationship exists between PBMC TPR and obesity.
3.2. Blockade of TPR Signaling Reduces Lipopolysaccharide (LPS)-Induced Pro-Inflammatory Response in Human PBMCs
As mentioned, obesity is associated with an increase in circulating endotoxin levels [15]. Therefore, we sought to determine the impact of inhibiting TPR signaling in altering LPS-induced pro-inflammatory response in PBMCs. As shown in Figure 2, our data show that LPS significantly increased the levels of TNFα, MCP-1, IL1β and MIP-1α upon LPS stimulation at 6 h (Figure 2A-D) and 24 h (Figure 2E-H). On the other hand, pretreatment with agents inhibiting TxA2 signaling including SQ29548 (a TPR antagonist), Ozagrel (a TxA2 synthase inhibitor), and BM567 (a dual-acting agent inhibiting TxA2 synthase and TPR), attenuated the secretion of these inflammatory mediators upon LPS treatment (Figure 2A-H). Next, we measured the levels of LDH, a marker of cytotoxicity and we noted that the LDH levels did not alter among different groups, indicating that these agents did not induce cytotoxicity (Supplemental Figure 1). These findings indicate that TPR inhibitors effectively decreased the LPS-induced pro-inflammatory response in PBMCs.
3.3. Inhibition of TPR Attenuates LPS- Induced TXB2 Secretion
Next, we wanted to check if LPS can actually increases the formation of TXB2 in PBMCs. We analyzed the media supernatants for TXB2 levels and noted an increase in TXB2 release upon treatment with LPS. Interestingly, pre-treatment with TPR antagonist, TXAS inhibitor, the dual-acting agent inhibiting both TPR and TXAS, inhibited LPS-induced TXB2 secretion into the media (Supplemental Figure 2).
3.4. Blockade of TPR Signaling Reduces Stearic Acid-Induced Pro-Inflammatory Response in Human PBMCs
Circulating plasma FFAs are increased in obesity and obesity-related comorbidities [18] and saturated fatty acids are known to exert an inflammatory response in obesity [19]. Therefore, we next studied the effects of TPR antagonism on SA-induced inflammatory response in PBMCs. Our data clearly show that SA by itself led to a significant increase in the level of TNFα, IL1β and MCP-1 at both 6 h (Figure 3A-C) and 24 h (Figure 3D-F) time points. BM567, the dual-acting agent, and SQ, a TPR antagonist, significantly reduced SA-induced increase in TNFα, IL1β and MCP-1, respectively. Inhibiting THAS alone using OZA showed a trend towards a decrease in these inflammatory mediators. Overall, these data suggest that SA-induced inflammatory response can be attenuated by blocking TPR signaling. Further, we measured the levels of LDH, a marker of cytotoxicity, and noted that the LDH level did not change in any of the groups at 6 h. Although SA treatment led to an increase in LDH at 24 h, the inhibitors did not alter the LDH levels, indicating that the inhibitors block the SA-induced inflammatory response without altering cell viability (Supplementary Figure 3).
3.5. Activation of TPR Potentiates LPS and SA-Induced Pro-Inflammatory Response in PBMCs
PBMCs were pre-treated with IBOP, a TPR agonist, for 2 h and then stimulated with LPS or SA. We noticed that LPS or SA alone significantly increased the level of and TNFα and IL1β in cultured PBMCs (Figure 4A&B). Interestingly, IBOP enhanced the pro-inflammatory effect of LPS and SA in PBMCs as evident from the greater increase in IL1β (Figure 4B), further providing evidence that TPR activation promotes an inflammatory response in PBMCs.
3.6. BM567, a Dual-Inhibitor Attenuates TPR Agonist-Mediated Inflammatory Response in PBMCs
Next, we stimulated PBMCs with IBOP alone in the presence or absence of BM567, a dual-acting agent, to determine the specific effect of TPR activation on PBMC inflammatory response. We noted that IBOP by itself significantly increased the levels of TNFα and IL1β in the media and this effect was attenuated by BM567 (Figure 5 A-D). These data show that the direct activation of TPR using its agonist can induce an inflammatory response which can be blocked by inhibiting TPR signaling.
3.7. Inhibition of ROCK Activity Blocks IBOP-Induced Pro-Inflammatory Response in PBMCs
Regarding potential mechanisms, a link exists between ROCK and TPR signaling and ROCK1 is involved in promoting an inflammatory response. Therefore, we next treated PBMCs with IBOP, a TPR agonist, in the presence or absence of Y27632, a ROCK inhibitor. As shown in Figure 6, IBOP alone increased the release of TNFα and IL1β and this effect is blocked by the ROCK inhibitor (Figure 6 A-D). These data suggest that TPR promotes inflammatory response via ROCK.
4. Discussion
In the present study, we have demonstrated that a positive association exists between PBMC TPR and human obesity. Ex vivo studies in human PBMCs showed that LPS, a TLR4 agonist and SA, a FFA, exerted a pro-inflammatory effect in PBMCs. Both LPS- and FFA-induced inflammatory response is attenuated by blocking TPR signaling. Our studies show that IBOP, a TPR agonist, enhanced LPS or FFA-induced inflammatory response in PBMCs. Moreover, IBOP by itself induces a pro-inflammatory effect in PBMCs, which was attenuated by inhibiting TPR signaling. Interestingly, LPS, FFA, and IBOP-induced pro-inflammatory effects were also attenuated by inhibiting ROCK activity. Together, these data suggest that a link exists between PBMC TPR and human obesity and TPR exerts pro-inflammatory effects in PBMCs via TLR4 and/or ROCK signaling.
Although hemostasis and vasoconstriction are the important processes regulated by TPR, several lines of evidence suggests that it plays a role in promoting inflammation in endothelial cells and macrophages. Several lines of evidence support the concept that obesity-induced inflammation plays an important role in the development of insulin resistance [20,21,22]. Macrophages are the predominant immune cell population in human AT. The percentage of macrophages in human AT is estimated to range from 10% in lean subjects to 40% in individuals with obesity [23]. A strong link exists between obesity and inflammation [3,24,25]. Of note, an elevated TXA2 to PGI2 (an anti-inflammatory lipid mediator) ratio in urine and blood plasma has been reported in animal and human subjects exhibiting metabolic syndrome [26,27]. However, evidence for the link between PBMC TPR signaling and obesity in humans is still lacking. We provide evidence that TPR expression is increased in the PBMCs collected from individuals with obesity, compared to normal subjects. In addition, PBMC TPR expression is positively correlated to body weight, body mass index, and fat mass.
The direct effects of altering TPR signaling on the inflammatory response in human PBMCs remains unknown. A great deal of emphasis has been placed on elucidating the pro-inflammatory effect of TPR in endothelial cells [5,6,7]. This is consistent with the well-known effects of TPR in mediating vasoconstriction. Although TPR is widely recognized as an inflammatory gene, limited studies are available on the role of TPR in altering macrophage inflammatory response. Altavilla et al. reported that G619, a dual TXAS inhibitor and TPR antagonist, inhibits LPS-induced TNFα release in rats in vivo as well as isolated rat peritoneal macrophages [12]. In addition, TPR has been shown to promote a pro-inflammatory effect in microglia which are resident macrophages in brain, upon LPS treatment via activation of MAPK and/or NFκB [13,14]. Our data are in line with these studies and provide evidence that in addition to LPS, SA-induced pro-inflammatory response is attenuated by blocking TPR. These data suggest that TPR plays an important role in mediating the pro-inflammatory effects of obesity-related factors, in particular, LPS and SA, in human PBMCs.
Regarding potential mechanisms, the fact that LPS is a TLR4 agonist and TPR antagonism attenuates LPS-induced inflammatory response, suggests that there may be a coordination between TLR4 and TPR signaling in mediating macrophage inflammatory response. In fact, the crosstalk between TPR and TLR4 signaling in canine platelets has been reported where inhibition of TLR4 signaling attenuated LPS-induced TXA2 production and platelet activation [28]. Our data show that the pro-inflammatory effects invoked by LPS, a well-known TLR4 agonist, is attenuated by various agents blocking TPR signaling including the TPR antagonist, THAS inhibitor, and a dual-acting agent blocking both the enzyme and the receptor, indicating the interaction between TLR4 and TPR in mediating an inflammatory response in PBMCs.
It should also be noted that LPS and SA-induced pro-inflammatory effect is enhanced by TPR agonist, further supporting the notion that a coordination exists between TLR4 and TPR signaling in mediating the inflammatory response. However, the involvement of other mechanisms in mediating the pro-inflammatoy effects of TPR cannot be ruled out. Evidence suggests that ROCK is a key mediator of TPR, leading to endothelial cell dysfunction [29,30,31]. ROCK plays a role in regulating the migratory properties of bone marrow-derived macrophages [32]. However, the role of ROCK in altering PBMC inflammatory response remains unclear. Our data provide compelling evidence that inhibition of ROCK signaling using Y-27632 attenuates LPS and SA-induced inflammatory response. Moreover, Y-27932 inhibits IBOP-induced inflammatory response, providing direct evidence for the role of ROCK in mediating the pro-inflammatory effect elicited by TPR activation.
Our study has some limitations. For example, PBMCs are a mixed population of cells which not only contain monocytes but also other cells including T lymphocytes, B lymphocytes, and neutrophils. Although the contribution of individual cells in mediating the pro-inflammatory effects is unclear, PBMCs are most commonly used immune cells which serve as a relevant model to study the mechanisms involved in the inflammatory response in humans. Further studies are warranted to determine the role of TPR specifically in monocytes in mediating the inflammatory response. Next, PBMCs from normal subjects and individuals with obesity and/or insulin resistance were used in the ex vivo experiments. The inter-individual variability and genetic influence on cytokine responses of PBMCs to inflammatory stimuli is possible [33]. However, our data from individual experiments are derived from PBMCs collected from at least 3 subjects.
Taken together, our data suggest that an association exists between PBMC TPR and human obesity and blocking TPR signaling attenuates LPS and/or FFA-induced inflammatory response in PBMCs. Further, our data indicate that TLR4 and ROCK1 signaling plays a role in mediating the effects of TPR on inflammatory processes. Blocking TPR activity may be a therapeutic option to attenuate obesity-related inflammation and metabolic disorders. Further studies are required to determine the exact molecular mechanisms by which TPR antagonism attenuates the inflammatory effects in immune cells.
Supplementary Materials
The following supporting information can be downloaded: Supplementary Figure 1: LDH cytotoxicity assay; Supplementary Figure 2: Thromboxane B2 (TXB2) assay; Supplementary Figure 3: LDH cytotoxicity assay.
Author Contributions
Conceptualization, R.V., V.S., and C.V.D.; methodology, R.V., and R.C.; formal analysis, R.V., R.C., and V.S.; investigation, R.V., R.C., and V.S.; writing-original draft preparation, R.V., R.C., and V.S.; writing-review and editing, R.V., and V.S.; supervision, C.V.D., and V.S.; project administration, C.V.D., and V.S.; funding acquisition, C.V.D., and V.S. All authors have read and agreed to the published version of the manuscript.
Funding
This work was supported by a VA-CSRD Merit Award from the Department of Veterans Affairs [1I01CX002084 to V.S and C.V.D] and a pilot award from the NIH-Great Plains IDeA-Clinical and Translational Research Network (U54 GM115458). VS is also supported by an NIH-NIAAA P50 award-Alcohol Center of Research-Nebraska (P50AA030407-5130).
Institutional Review Board Statement
The study was conducted in accordance with the Declaration of Helsinki and approved by the VA Nebraska-Western Iowa Health Care System and the University of Nebraska Medical Center.
Informed Consent Statement
Informed consent was obtained from all subjects involved in the study.
Data Availability Statement
The raw data supporting the conclusions of this article will be made available by the authors upon request.
Acknowledgments
This paper is the result of work conducted with the resources and the facilities at the VA Nebraska-Western Iowa Health Care System, Omaha.
Conflicts of Interest
The authors declare no conflicts of interest.
References
- Saeedi, P.; Petersohn, I.; Salpea, P.; Malanda, B.; Karuranga, S.; Unwin, N.; Colagiuri, S.; Guariguata, L.; Motala, A.A.; Ogurtsova, K.; et al. Global and regional diabetes prevalence estimates for 2019 and projections for 2030 and 2045: Results from the International Diabetes Federation Diabetes Atlas, 9(th) edition. Diabetes Res Clin Pract 2019, 157, 107843. [Google Scholar] [CrossRef] [PubMed]
- Al-Goblan, A.S.; Al-Alfi, M.A.; Khan, M.Z. Mechanism linking diabetes mellitus and obesity. Diabetes Metab Syndr Obes 2014, 7, 587–591. [Google Scholar] [CrossRef]
- Ellulu, M.S.; Patimah, I.; Khaza’ai, H.; Rahmat, A.; Abed, Y. Obesity and inflammation: the linking mechanism and the complications. Arch Med Sci 2017, 13, 851–863. [Google Scholar] [CrossRef]
- Rucker, D.; Dhamoon, A.S. Physiology, Thromboxane A2. In StatPearls; Treasure Island (FL) ineligible companies. Disclosure: Amit Dhamoon declares no relevant financial relationships with ineligible companies, 2024. [Google Scholar]
- Cherdon, C.; Rolin, S.; Hanson, J.; Ooms, A.; de Leval, L.; Drion, P.; Michiels, C.; Pirotte, B.; Masereel, B.; Sakalihassan, N.; et al. BM-573 inhibits the development of early atherosclerotic lesions in Apo E deficient mice by blocking TP receptors and thromboxane synthase. Prostaglandins Other Lipid Mediat 2011, 94, 124–132. [Google Scholar] [CrossRef] [PubMed]
- Petri, M.H.; Tellier, C.; Michiels, C.; Ellertsen, I.; Dogne, J.M.; Back, M. Effects of the dual TP receptor antagonist and thromboxane synthase inhibitor EV-077 on human endothelial and vascular smooth muscle cells. Biochem Biophys Res Commun 2013, 441, 393–398. [Google Scholar] [CrossRef]
- Huang, S.W.; Lien, J.C.; Kuo, S.C.; Huang, T.F. Inhibitory Effects of an Orally Active Thromboxane A2 Receptor Antagonist, nstpbp5185, on Atherosclerosis in ApoE-Deficient Mice. Thromb Haemost 2018, 118, 401–414. [Google Scholar] [CrossRef]
- Xu, H.; Korneszczuk, K.; Karaa, A.; Lin, T.; Clemens, M.G.; Zhang, J.X. Thromboxane A2 from Kupffer cells contributes to the hyperresponsiveness of hepatic portal circulation to endothelin-1 in endotoxemic rats. Am J Physiol Gastrointest Liver Physiol 2005, 288, G277–283. [Google Scholar] [CrossRef] [PubMed]
- Collins, B.J.; Blum, M.G.; Parker, R.E.; Chang, A.C.; Blair, K.S.; Zorn, G.L., 3rd; Christman, B.W.; Pierson, R.N. , 3rd. Thromboxane mediates pulmonary hypertension and lung inflammation during hyperacute lung rejection. J Appl Physiol (1985) 2001, 90, 2257–2268. [Google Scholar] [CrossRef]
- Matsuda, H.; Ito, Y.; Hosono, K.; Tsuru, S.; Inoue, T.; Nakamoto, S.; Kurashige, C.; Hirashima, M.; Narumiya, S.; Okamoto, H.; et al. Roles of Thromboxane Receptor Signaling in Enhancement of Lipopolysaccharide-Induced Lymphangiogenesis and Lymphatic Drainage Function in Diaphragm. Arterioscler Thromb Vasc Biol 2021, 41, 1390–1407. [Google Scholar] [CrossRef] [PubMed]
- Hartney, J.M.; Gustafson, C.E.; Bowler, R.P.; Pelanda, R.; Torres, R.M. Thromboxane receptor signaling is required for fibronectin-induced matrix metalloproteinase 9 production by human and murine macrophages and is attenuated by the Arhgef1 molecule. J Biol Chem 2011, 286, 44521–44531. [Google Scholar] [CrossRef]
- Altavilla, D.; Squadrito, F.; Canale, P.; Ioculano, M.; Squadrito, G.; Campo, G.M.; Serrano, M.; Sardella, A.; Urna, G.; Spignoli, G.; et al. G 619, a dual thromboxane synthase inhibitor and thromboxane A2 receptor antagonist, inhibits tumor necrosis factor-alpha biosynthesis. Eur J Pharmacol 1995, 286, 31–39. [Google Scholar] [CrossRef]
- Yan, A.; Cai, G.; Xia, W.; Fu, Y. Thromboxane A2 receptor antagonist SQ29548 suppresses the LPS--induced release of inflammatory cytokines in BV2 microglia cells via suppressing MAPK and NF--kappaB signaling pathways. Mol Med Rep 2017, 16, 2491–2496. [Google Scholar] [CrossRef] [PubMed]
- Yang, W.; Yan, A.; Zhang, T.; Shao, J.; Liu, T.; Yang, X.; Xia, W.; Fu, Y. Thromboxane A2 Receptor Stimulation Enhances Microglial Interleukin-1beta and NO Biosynthesis Mediated by the Activation of ERK Pathway. Front Aging Neurosci 2016, 8, 8. [Google Scholar] [CrossRef]
- Hersoug, L.G.; Moller, P.; Loft, S. Role of microbiota-derived lipopolysaccharide in adipose tissue inflammation, adipocyte size and pyroptosis during obesity. Nutr Res Rev 2018, 31, 153–163. [Google Scholar] [CrossRef]
- Ngkelo, A.; Meja, K.; Yeadon, M.; Adcock, I.; Kirkham, P.A. LPS induced inflammatory responses in human peripheral blood mononuclear cells is mediated through NOX4 and Gialpha dependent PI-3kinase signalling. J Inflamm (Lond) 2012, 9, 1. [Google Scholar] [CrossRef] [PubMed]
- Rocha, D.M.; Caldas, A.P.; Oliveira, L.L.; Bressan, J.; Hermsdorff, H.H. Saturated fatty acids trigger TLR4-mediated inflammatory response. Atherosclerosis 2016, 244, 211–215. [Google Scholar] [CrossRef] [PubMed]
- Henderson, G.C. Plasma Free Fatty Acid Concentration as a Modifiable Risk Factor for Metabolic Disease. Nutrients 2021, 13. [Google Scholar] [CrossRef]
- Zhou, H.; Urso, C.J.; Jadeja, V. Saturated Fatty Acids in Obesity-Associated Inflammation. J Inflamm Res 2020, 13, 1–14. [Google Scholar] [CrossRef]
- Ueki, K.; Kondo, T.; Kahn, C.R. Suppressor of cytokine signaling 1 (SOCS-1) and SOCS-3 cause insulin resistance through inhibition of tyrosine phosphorylation of insulin receptor substrate proteins by discrete mechanisms. Mol Cell Biol 2004, 24, 5434–5446. [Google Scholar] [CrossRef]
- Shi, H.; Kokoeva, M.V.; Inouye, K.; Tzameli, I.; Yin, H.; Flier, J.S. TLR4 links innate immunity and fatty acid-induced insulin resistance. J Clin Invest 2006, 116, 3015–3025. [Google Scholar] [CrossRef]
- Xu, H.; Barnes, G.T.; Yang, Q.; Tan, G.; Yang, D.; Chou, C.J.; Sole, J.; Nichols, A.; Ross, J.S.; Tartaglia, L.A.; et al. Chronic inflammation in fat plays a crucial role in the development of obesity-related insulin resistance. J Clin Invest 2003, 112, 1821–1830. [Google Scholar] [CrossRef] [PubMed]
- Weisberg, S.P.; McCann, D.; Desai, M.; Rosenbaum, M.; Leibel, R.L.; Ferrante, A.W., Jr. Obesity is associated with macrophage accumulation in adipose tissue. J Clin Invest 2003, 112, 1796–1808. [Google Scholar] [CrossRef] [PubMed]
- Petersen, M.C.; Smith, G.I.; Palacios, H.H.; Farabi, S.S.; Yoshino, M.; Yoshino, J.; Cho, K.; Davila-Roman, V.G.; Shankaran, M.; Barve, R.A.; et al. Cardiometabolic characteristics of people with metabolically healthy and unhealthy obesity. Cell Metab 2024, 36, 745–761. [Google Scholar] [CrossRef] [PubMed]
- Stepien, M.; Stepien, A.; Wlazel, R.N.; Paradowski, M.; Banach, M.; Rysz, J. Obesity indices and inflammatory markers in obese non-diabetic normo- and hypertensive patients: a comparative pilot study. Lipids Health Dis 2014, 13, 29. [Google Scholar] [CrossRef] [PubMed]
- Hishinuma, T.; Tsukamoto, H.; Suzuki, K.; Mizugaki, M. Relationship between thromboxane/prostacyclin ratio and diabetic vascular complications. Prostaglandins Leukot Essent Fatty Acids 2001, 65, 191–196. [Google Scholar] [CrossRef] [PubMed]
- Lasserre, B.; Navarro-Delmasure, C.; Pham Huu Chanh, A.; Catala, J.; Hollande, E. Modifications in the TXA(2) and PGI(2) plasma levels and some other biochemical parameters during the initiation and development of non-insulin-dependent diabetes mellitus (NIDDM) syndrome in the rabbit. Prostaglandins Leukot Essent Fatty Acids 2000, 62, 285–291. [Google Scholar] [CrossRef] [PubMed]
- Li, R.H.L.; Nguyen, N.; Tablin, F. Canine platelets express functional Toll-like receptor-4: lipopolysaccharide-triggered platelet activation is dependent on adenosine diphosphate and thromboxane A2 in dogs. BMC Vet Res 2019, 15, 245. [Google Scholar] [CrossRef]
- Xie, X.; Sun, W.; Wang, J.; Li, X.; Liu, X.; Liu, N. Activation of thromboxane A2 receptors mediates endothelial dysfunction in diabetic mice. Clin Exp Hypertens 2017, 39, 312–318. [Google Scholar] [CrossRef] [PubMed]
- Zhao, Z.; Hu, J.; Gao, X.; Liang, H.; Yu, H.; Liu, S.; Liu, Z. Hyperglycemia via activation of thromboxane A2 receptor impairs the integrity and function of blood-brain barrier in microvascular endothelial cells. Oncotarget 2017, 8, 30030–30038. [Google Scholar] [CrossRef]
- He, J.; Zhou, Y.; Xing, J.; Wang, Q.; Zhu, H.; Zhu, Y.; Zou, M.H. Liver kinase B1 is required for thromboxane receptor-dependent nuclear factor-kappaB activation and inflammatory responses. Arterioscler Thromb Vasc Biol 2013, 33, 1297–1305. [Google Scholar] [CrossRef]
- Stinson, M.W.; Liu, S.; Laurenson, A.J.; Rotty, J.D. Macrophage migration is differentially regulated by fibronectin and laminin through altered adhesion and myosin II localization. Mol Biol Cell 2024, 35, ar22. [Google Scholar] [CrossRef] [PubMed]
- Li, Y.; Oosting, M.; Deelen, P.; Ricano-Ponce, I.; Smeekens, S.; Jaeger, M.; Matzaraki, V.; Swertz, M.A.; Xavier, R.J.; Franke, L.; et al. Inter-individual variability and genetic influences on cytokine responses to bacteria and fungi. Nat Med 2016, 22, 952–960. [Google Scholar] [CrossRef] [PubMed]
Figure 1.
TPR expression levels in PBMCs from normal and obese subjects: (A) TP-R mRNA expression in human PBMCs. Values are mean ± SEM. *P<0.05 vs Normal. Correlative analysis performed on normal and obese subjects (n=29) comparing TP-R gene expression with (B) body weight, (C) body mass index, and (D) fat mass.
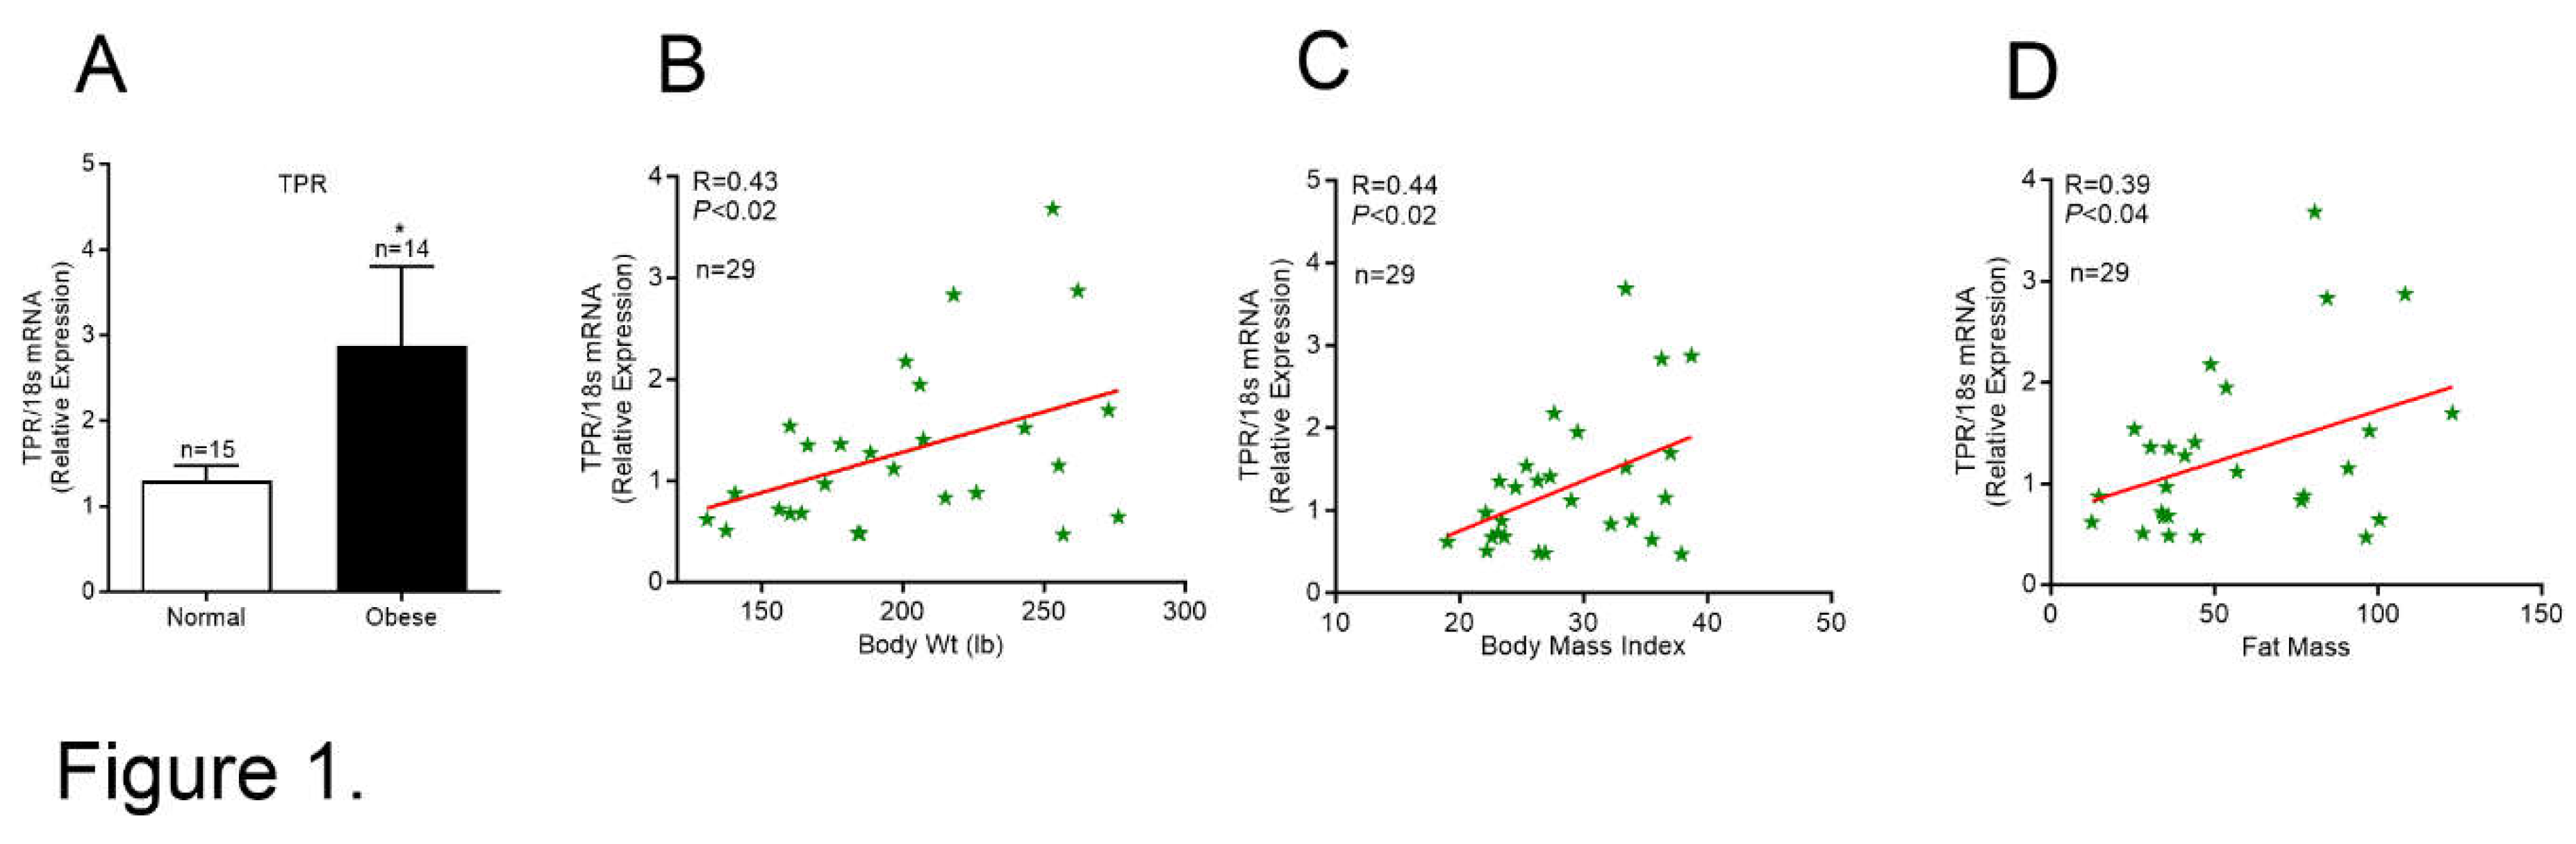
Figure 2.
Inhibitors of TPR signaling reduced LPS--induced secretion of inflammatory mediators by human PBMCs: PBMCs were pre-treated with different agents inhibiting TPR signaling (10 µM) for 2 h followed by co-incubation with LPS (10 ng/mL) for 6 h and 24 h. (A-D) Bar graphs show the amount of TNFα, IL-1β, MCP-1 and MIP-1α in cell culture supernatants at 6 h. (E-H) The levels of TNFα, IL-1β, MCP-1 and MIP-1α in cell culture supernatants after 24 h of treatment. Values are expressed as mean ± SEM of 5 sets of experiment in duplicate. *P<0.05, **P<0.01, and ***P<0.001.
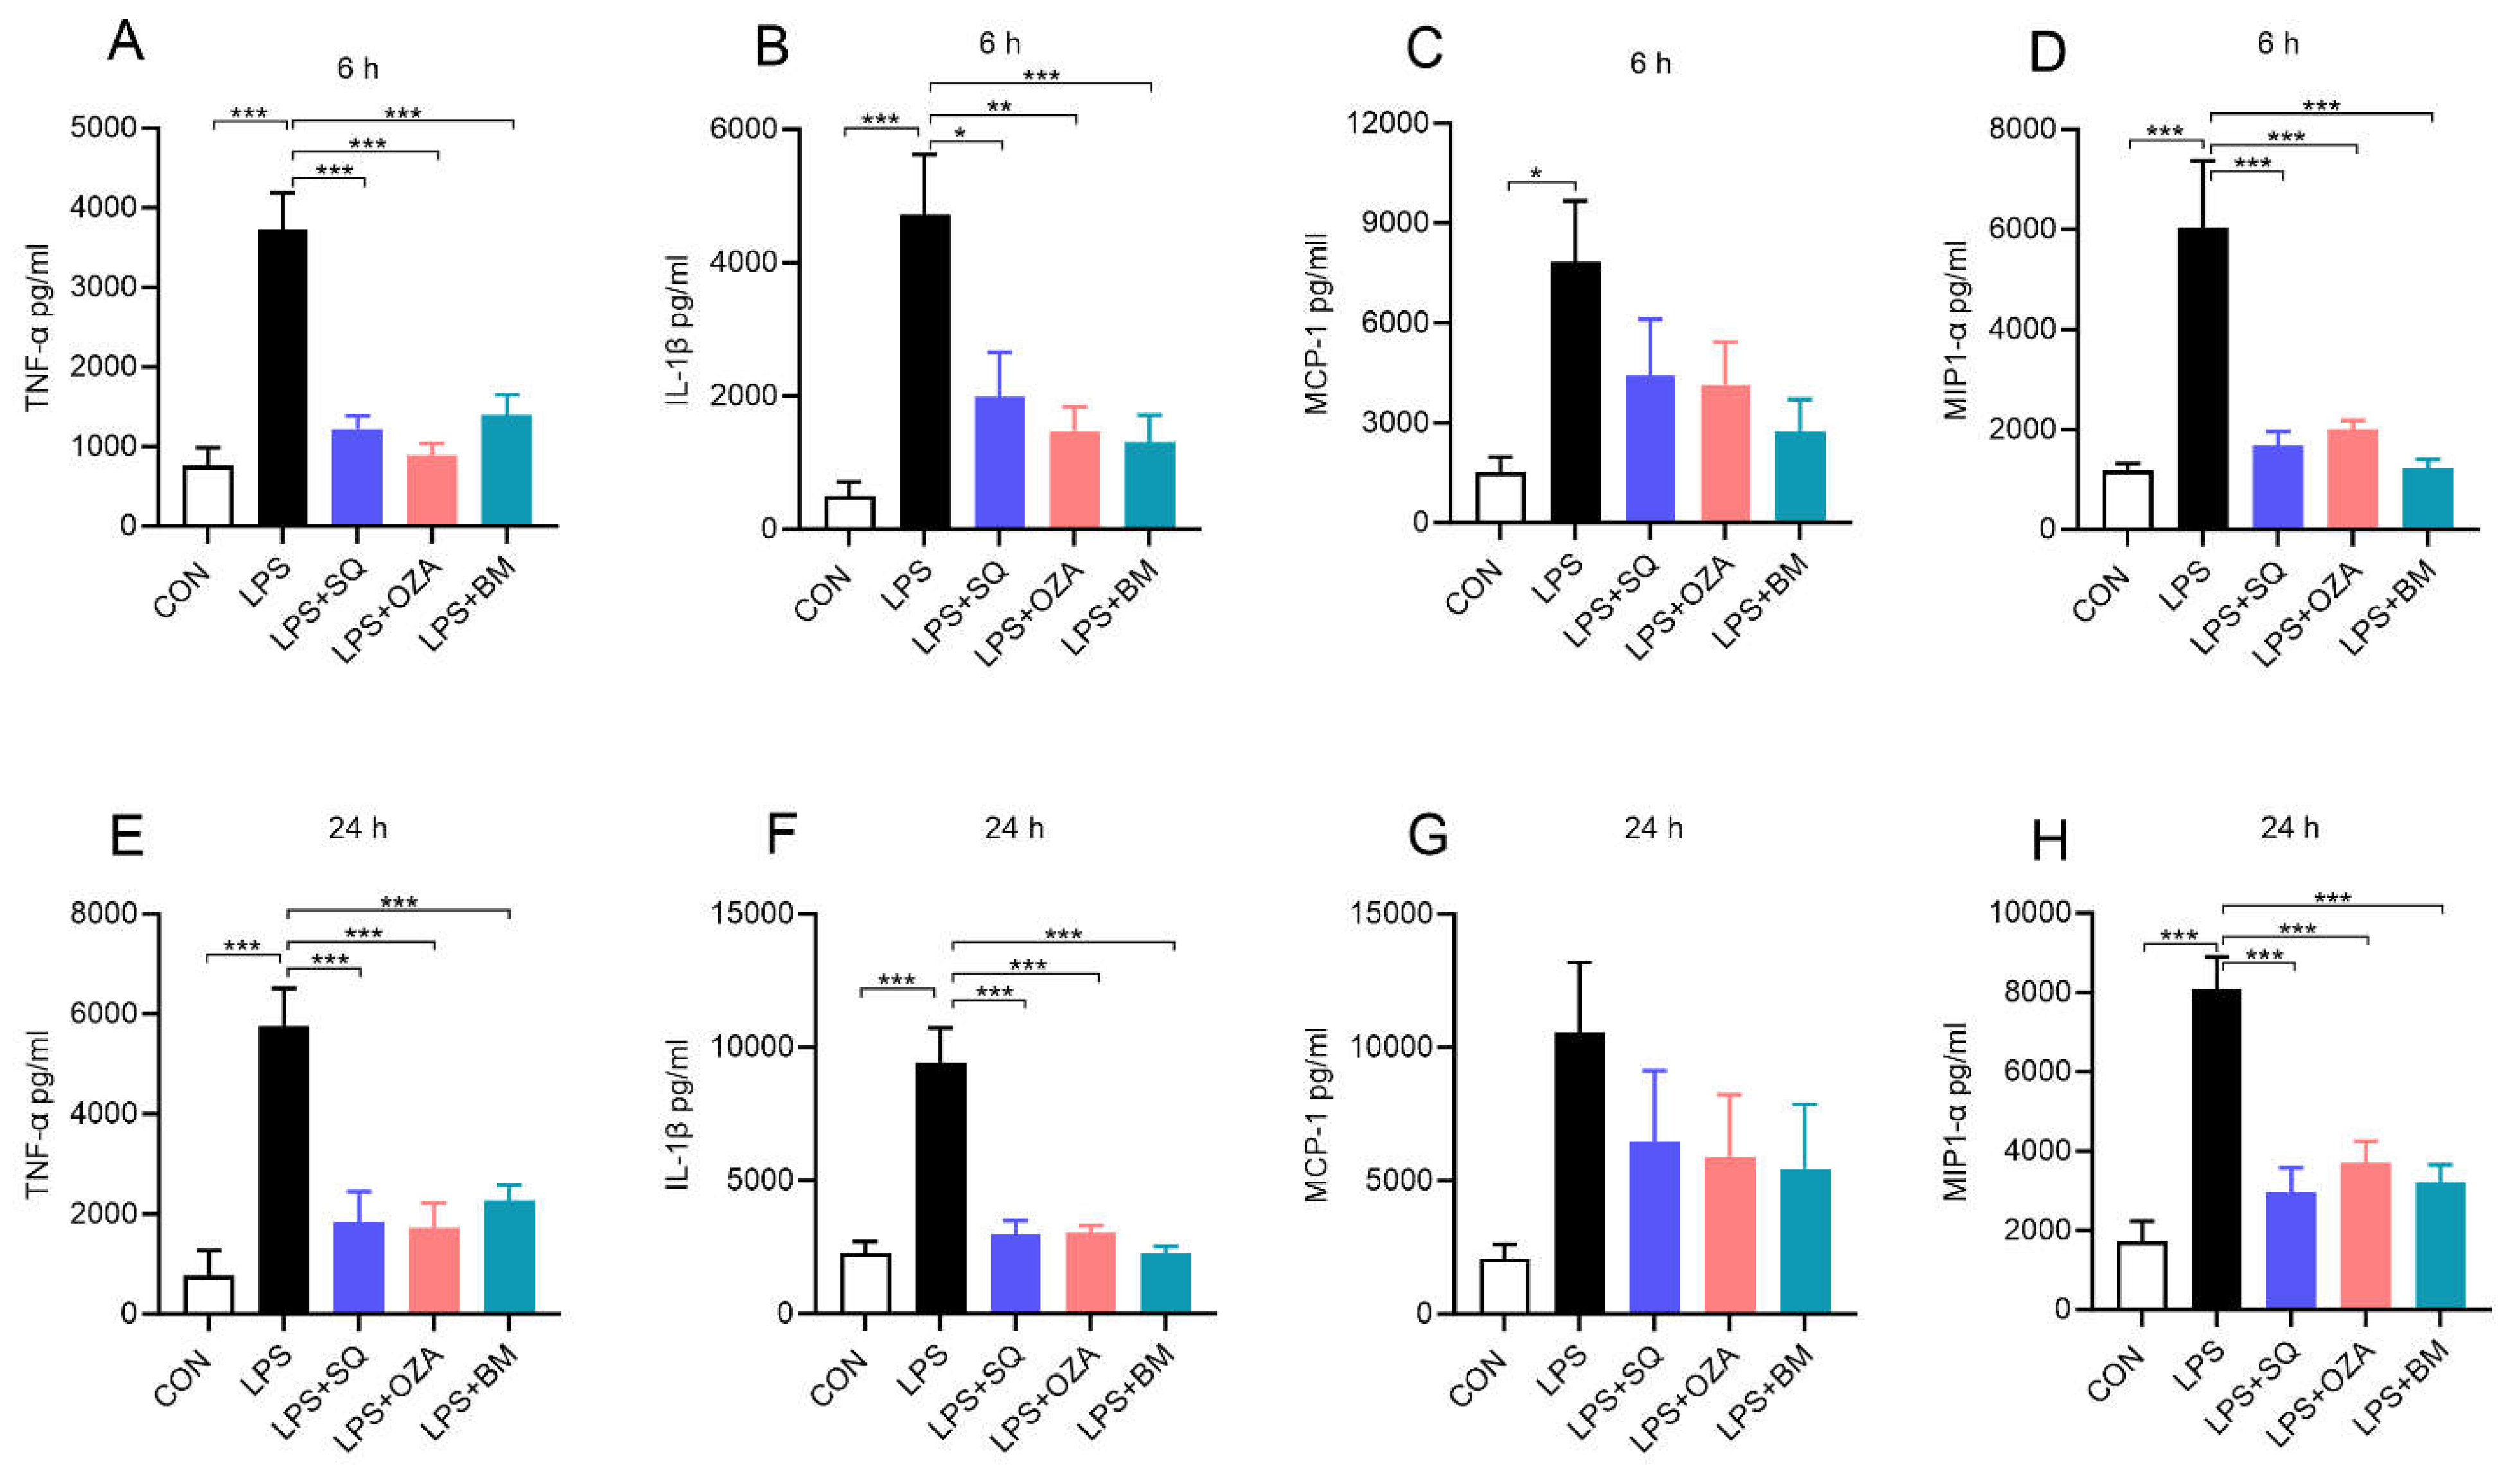
Figure 3.
Inhibitors of TPR signaling reduced stearic acid (SA)--induced secretion of inflammatory mediators by human PBMCs: PBMCs were pre-treated with different agents inhibiting TPR signaling (10 µM) for 2 h followed by co-incubation with SA (90 µM) for 6 h or 24 h. (A-C) Bar graphs show the amount of TNFα, IL-1β and MCP-1 in cell culture supernatants at 6 h. (D-F) The levels of TNF-α, IL-1β and MCP-1 in cell culture supernatants after 24 h of treatment. Values are expressed as mean ± SEM of 3 sets of experiment in duplicate. *P<0.05, **P<0.01, and ***P<0.001.
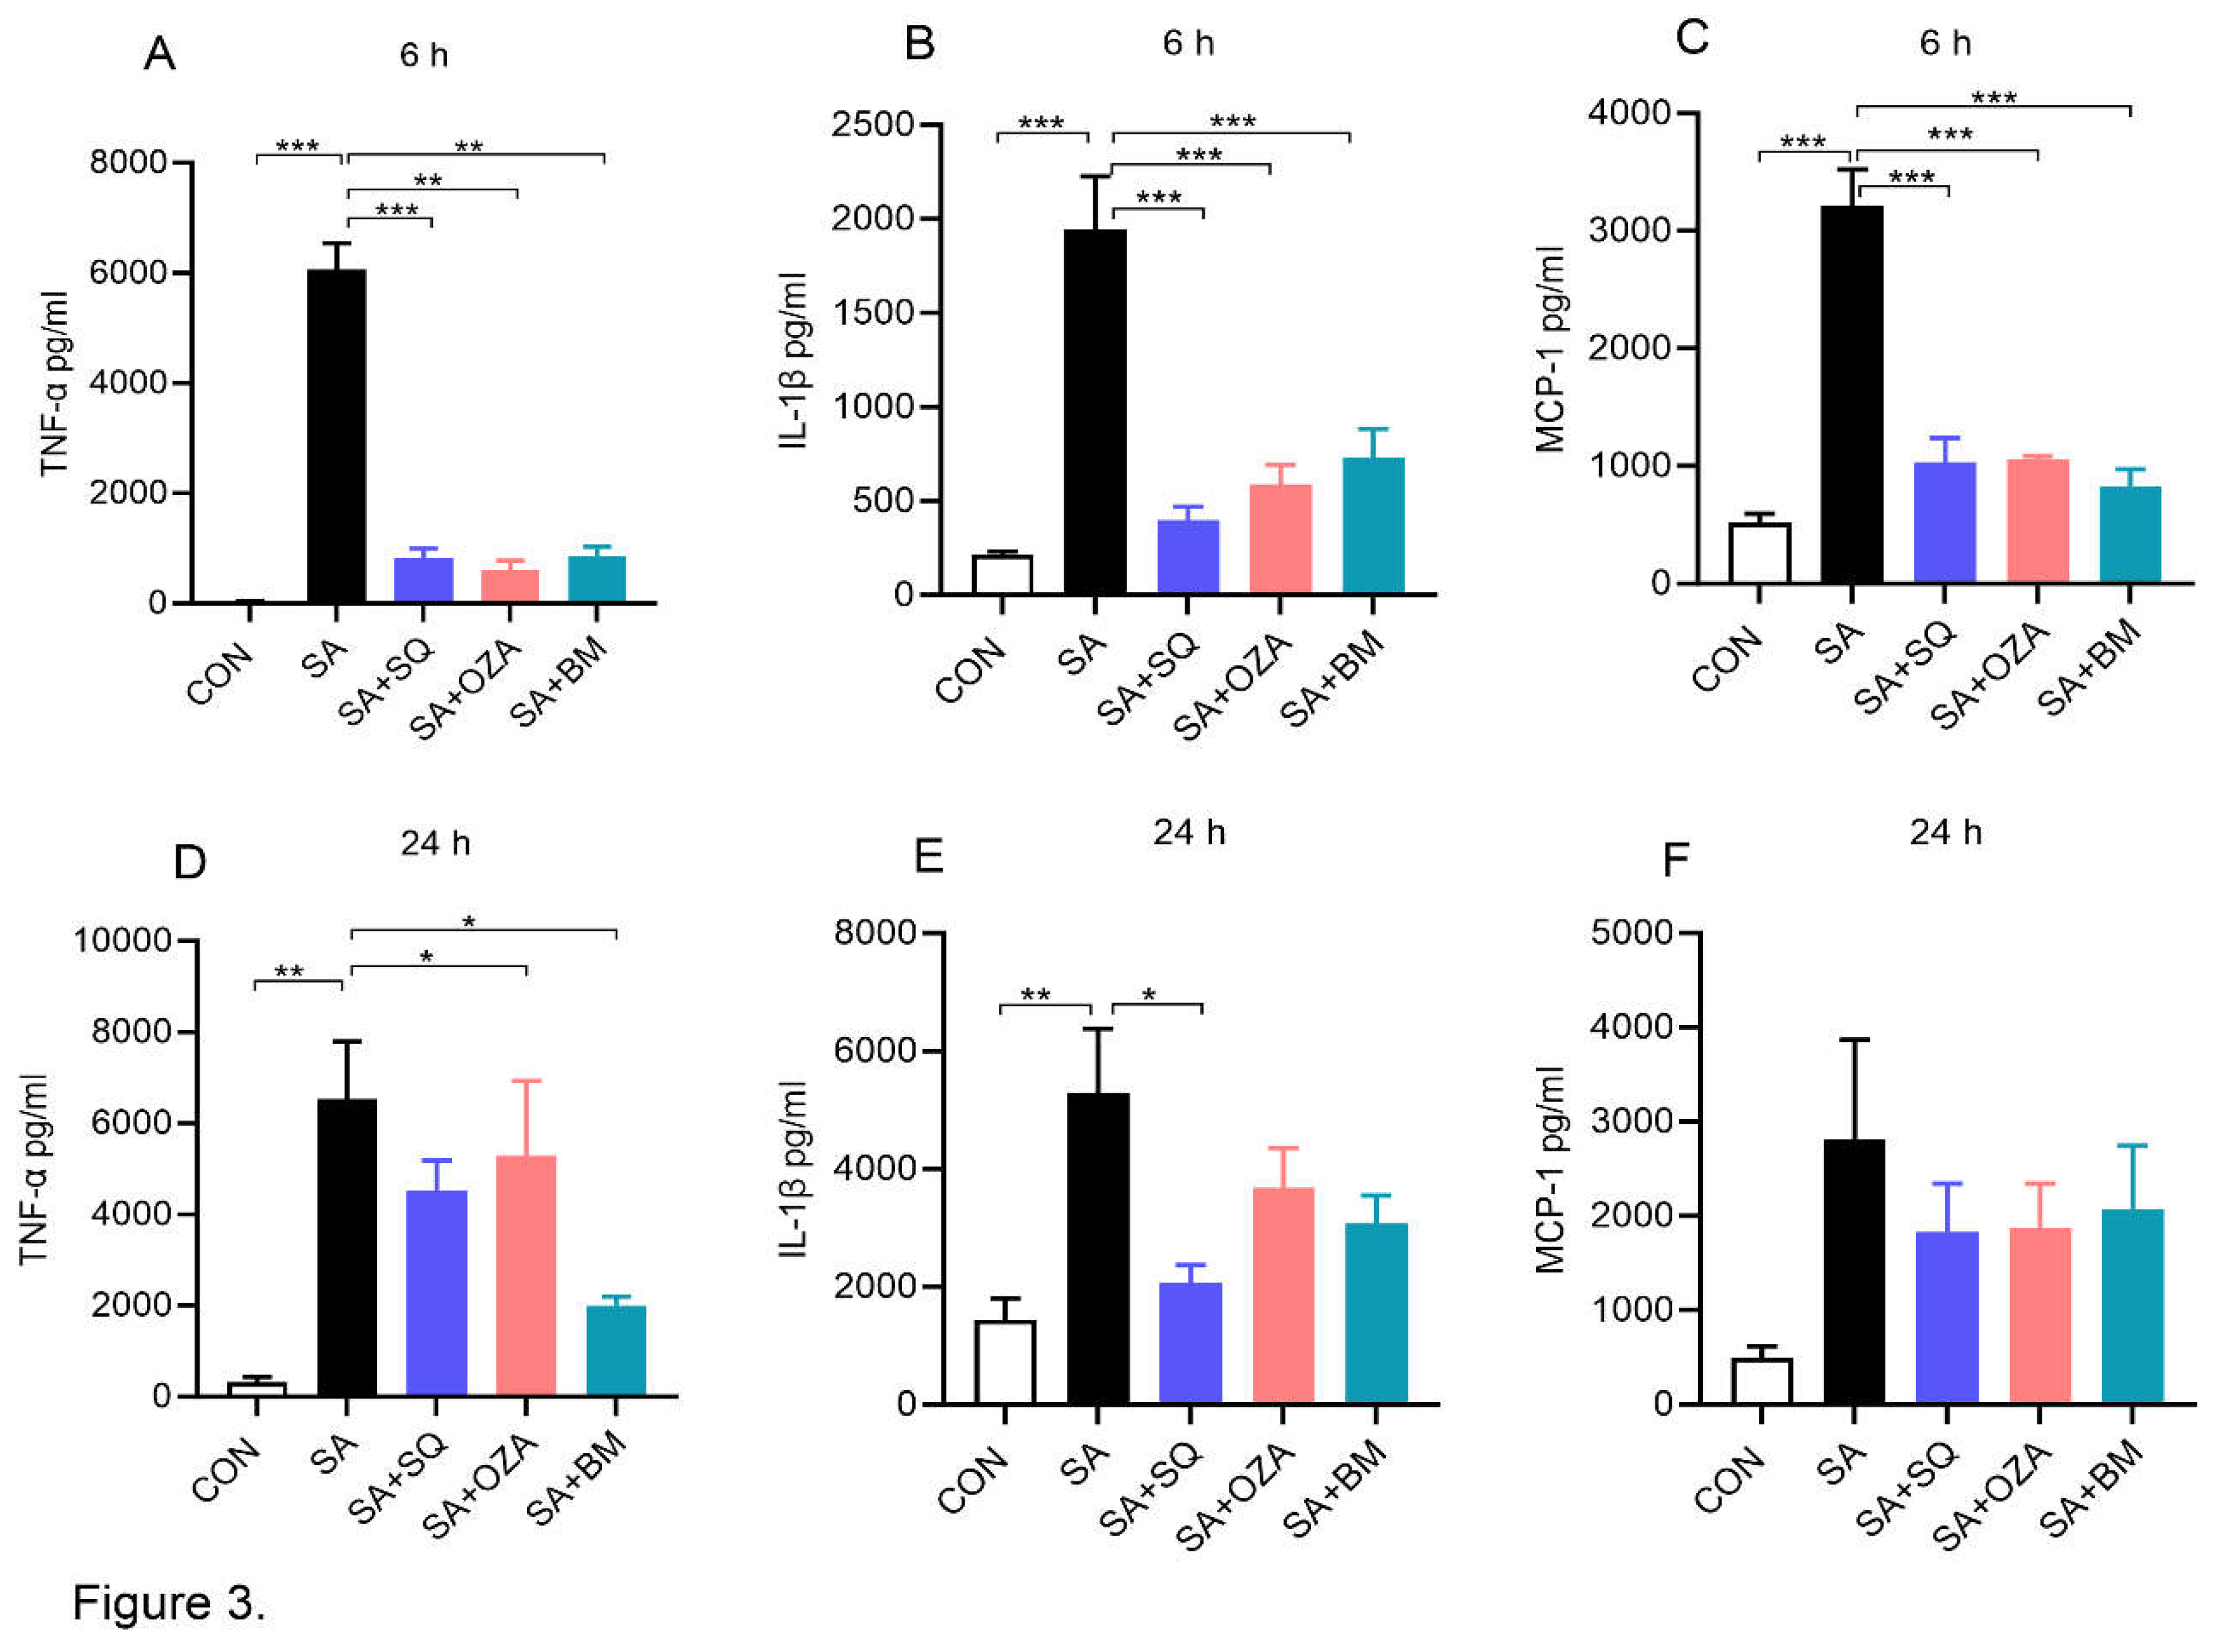
Figure 4.
Thromboxane A2 receptor activation aggravates LPS and SA-induced secretion of pro-inflammatory mediators by human PBMCs: PBMCs were pre-treated with IBOP (10 µM), a TPR agonist, for 2 h followed by co-incubation with LPS or SA for 24 h. (A) Bar graphs show the level of TNFα in cell culture supernatants at 24 h. (B) The level of IL-1β in cell culture supernatants after 24 h of treatment. Values are expressed as mean ± SEM of 3 sets of experiment in duplicate. *P<0.05, and ***P<0.001.
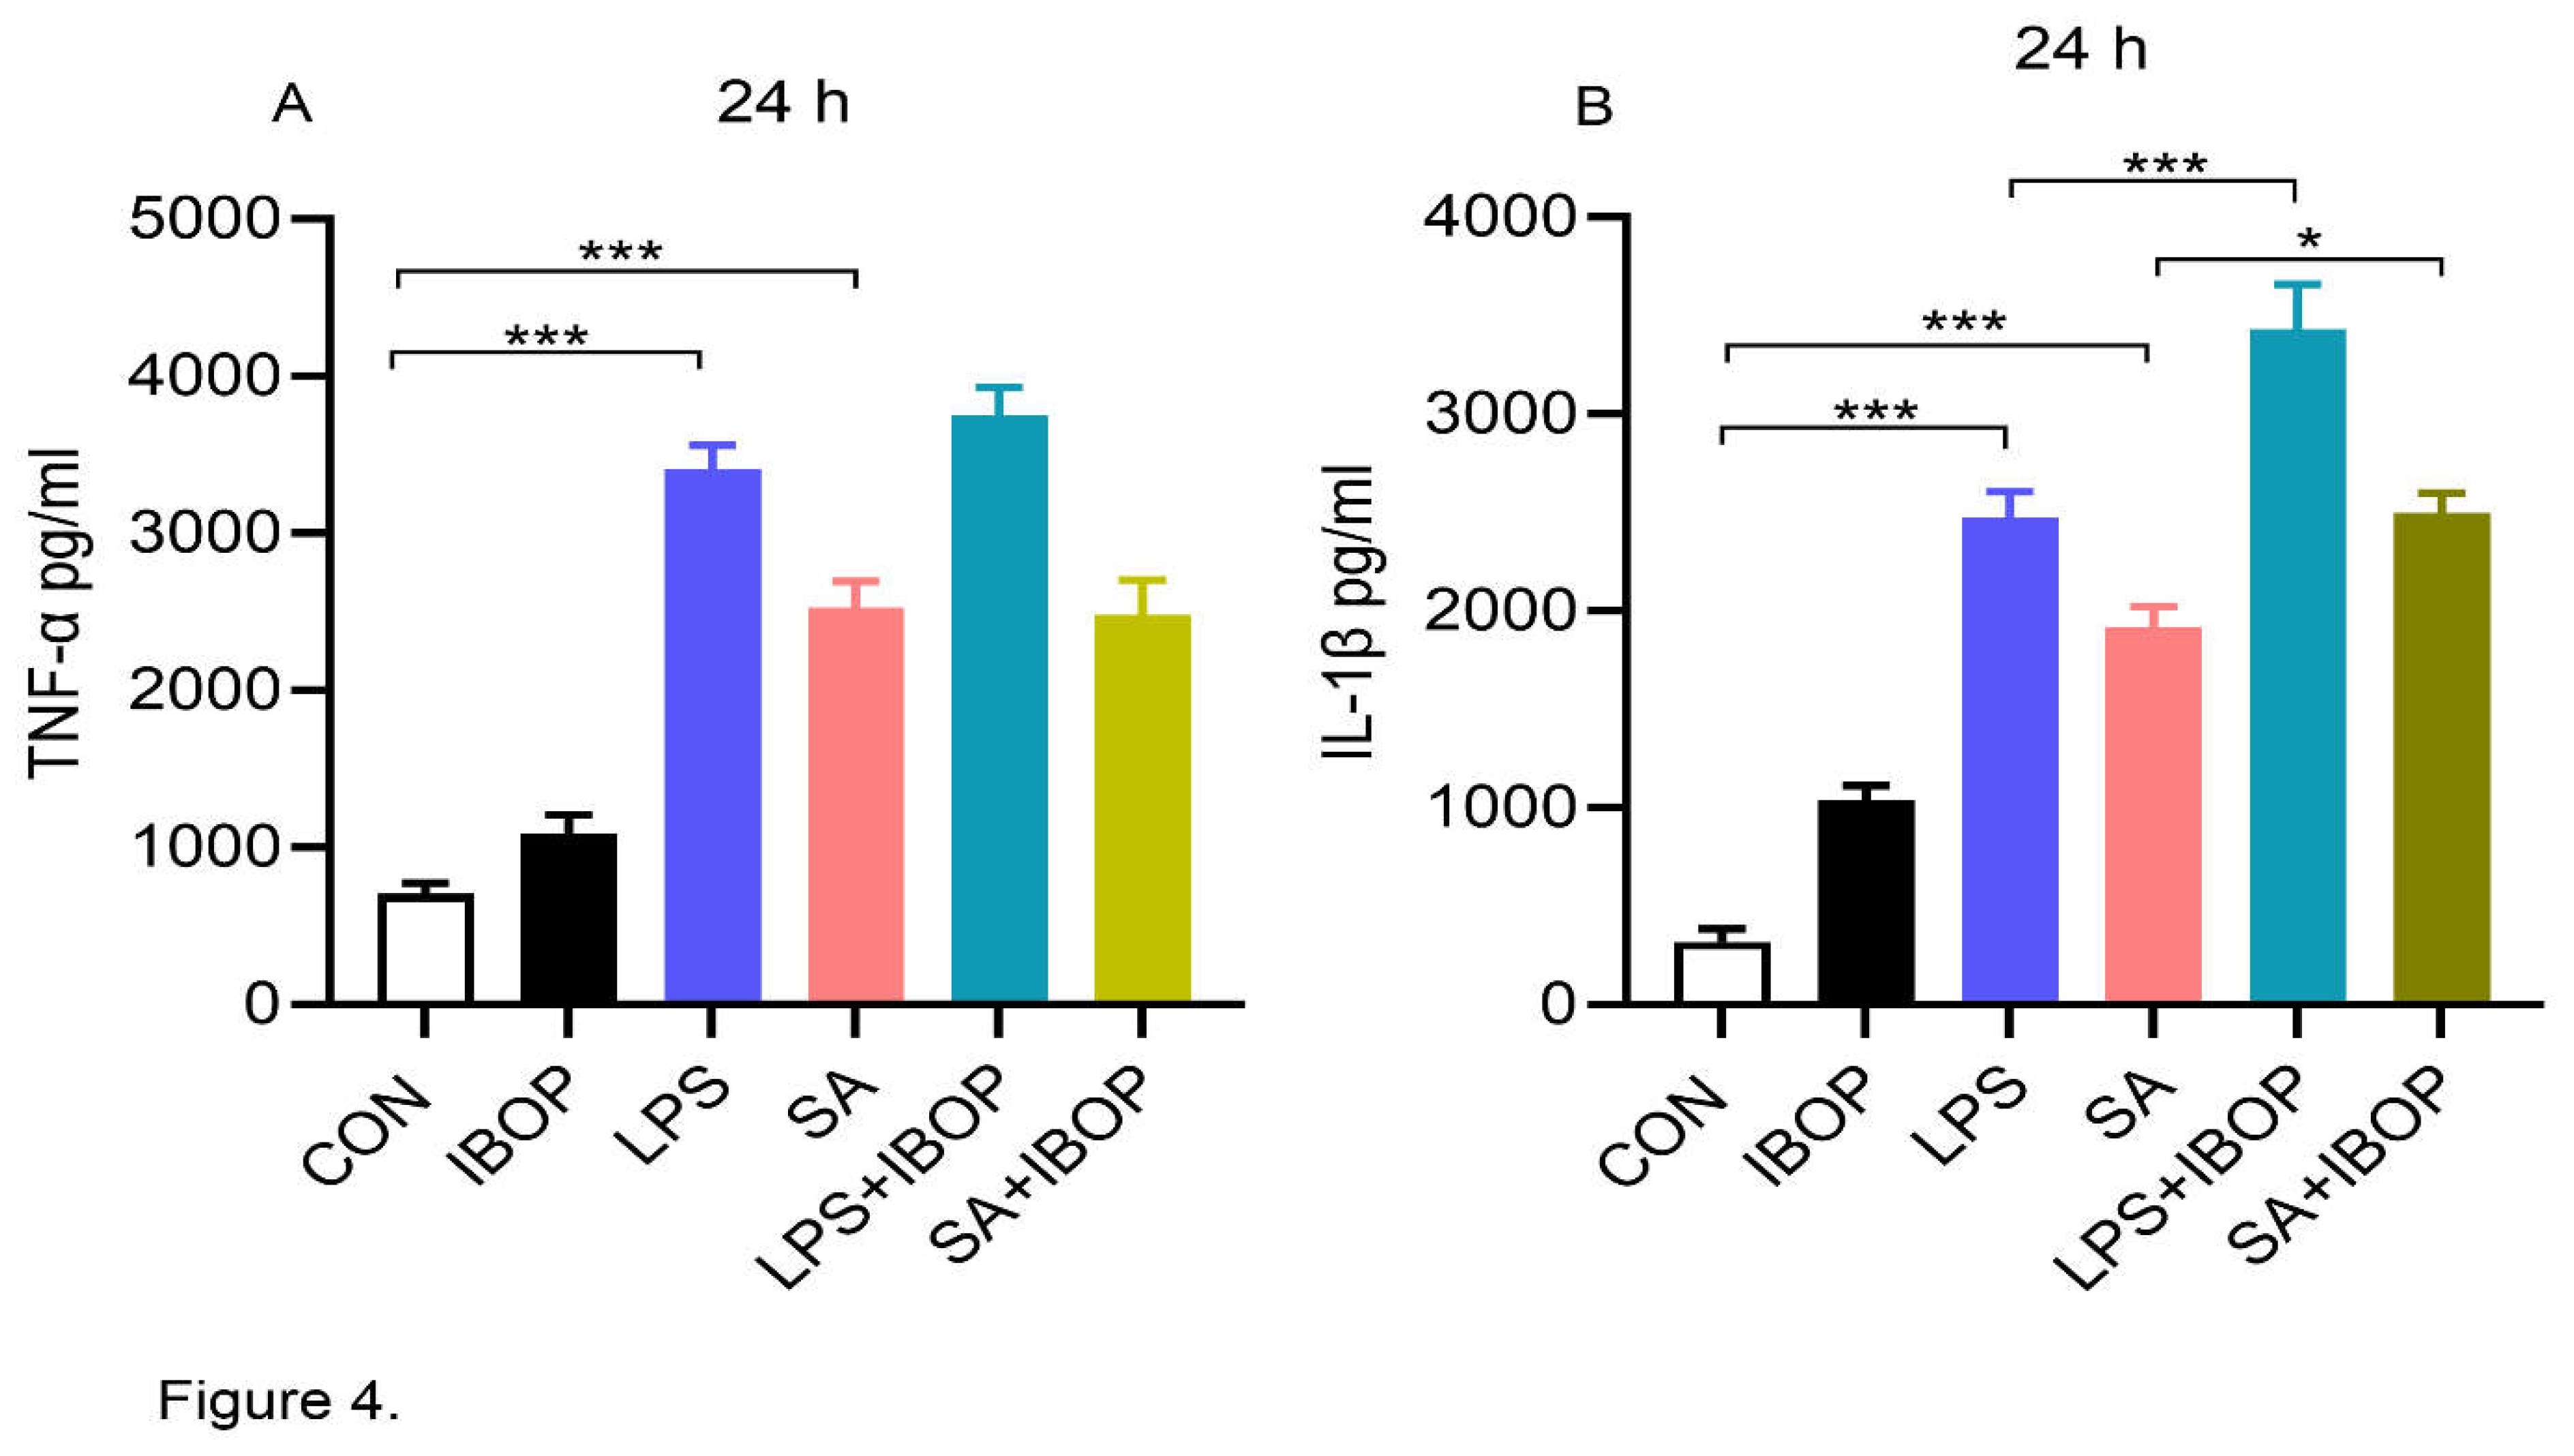
Figure 5.
A dual-acting agent inhibiting TPR and TXA2 synthase inhibits IBOP-induced secretion of pro-inflammatory mediators by human PBMCs: PBMCs were pre-treated with BM567 (10 µM) for 2 h followed by co-incubation with IBOP (10 µM) for 6 h and 24 h. (A&B) Bar graphs show the level of TNFα and IL-1β in cell culture supernatants at 6 h. (C&D) The level of TNFα and IL-1β in cell culture supernatants after 24 h of treatment. Values are expressed as mean ± SEM of 3 sets of experiment in duplicate. *P<0.05, **P<0.01, and ***P<0.001.
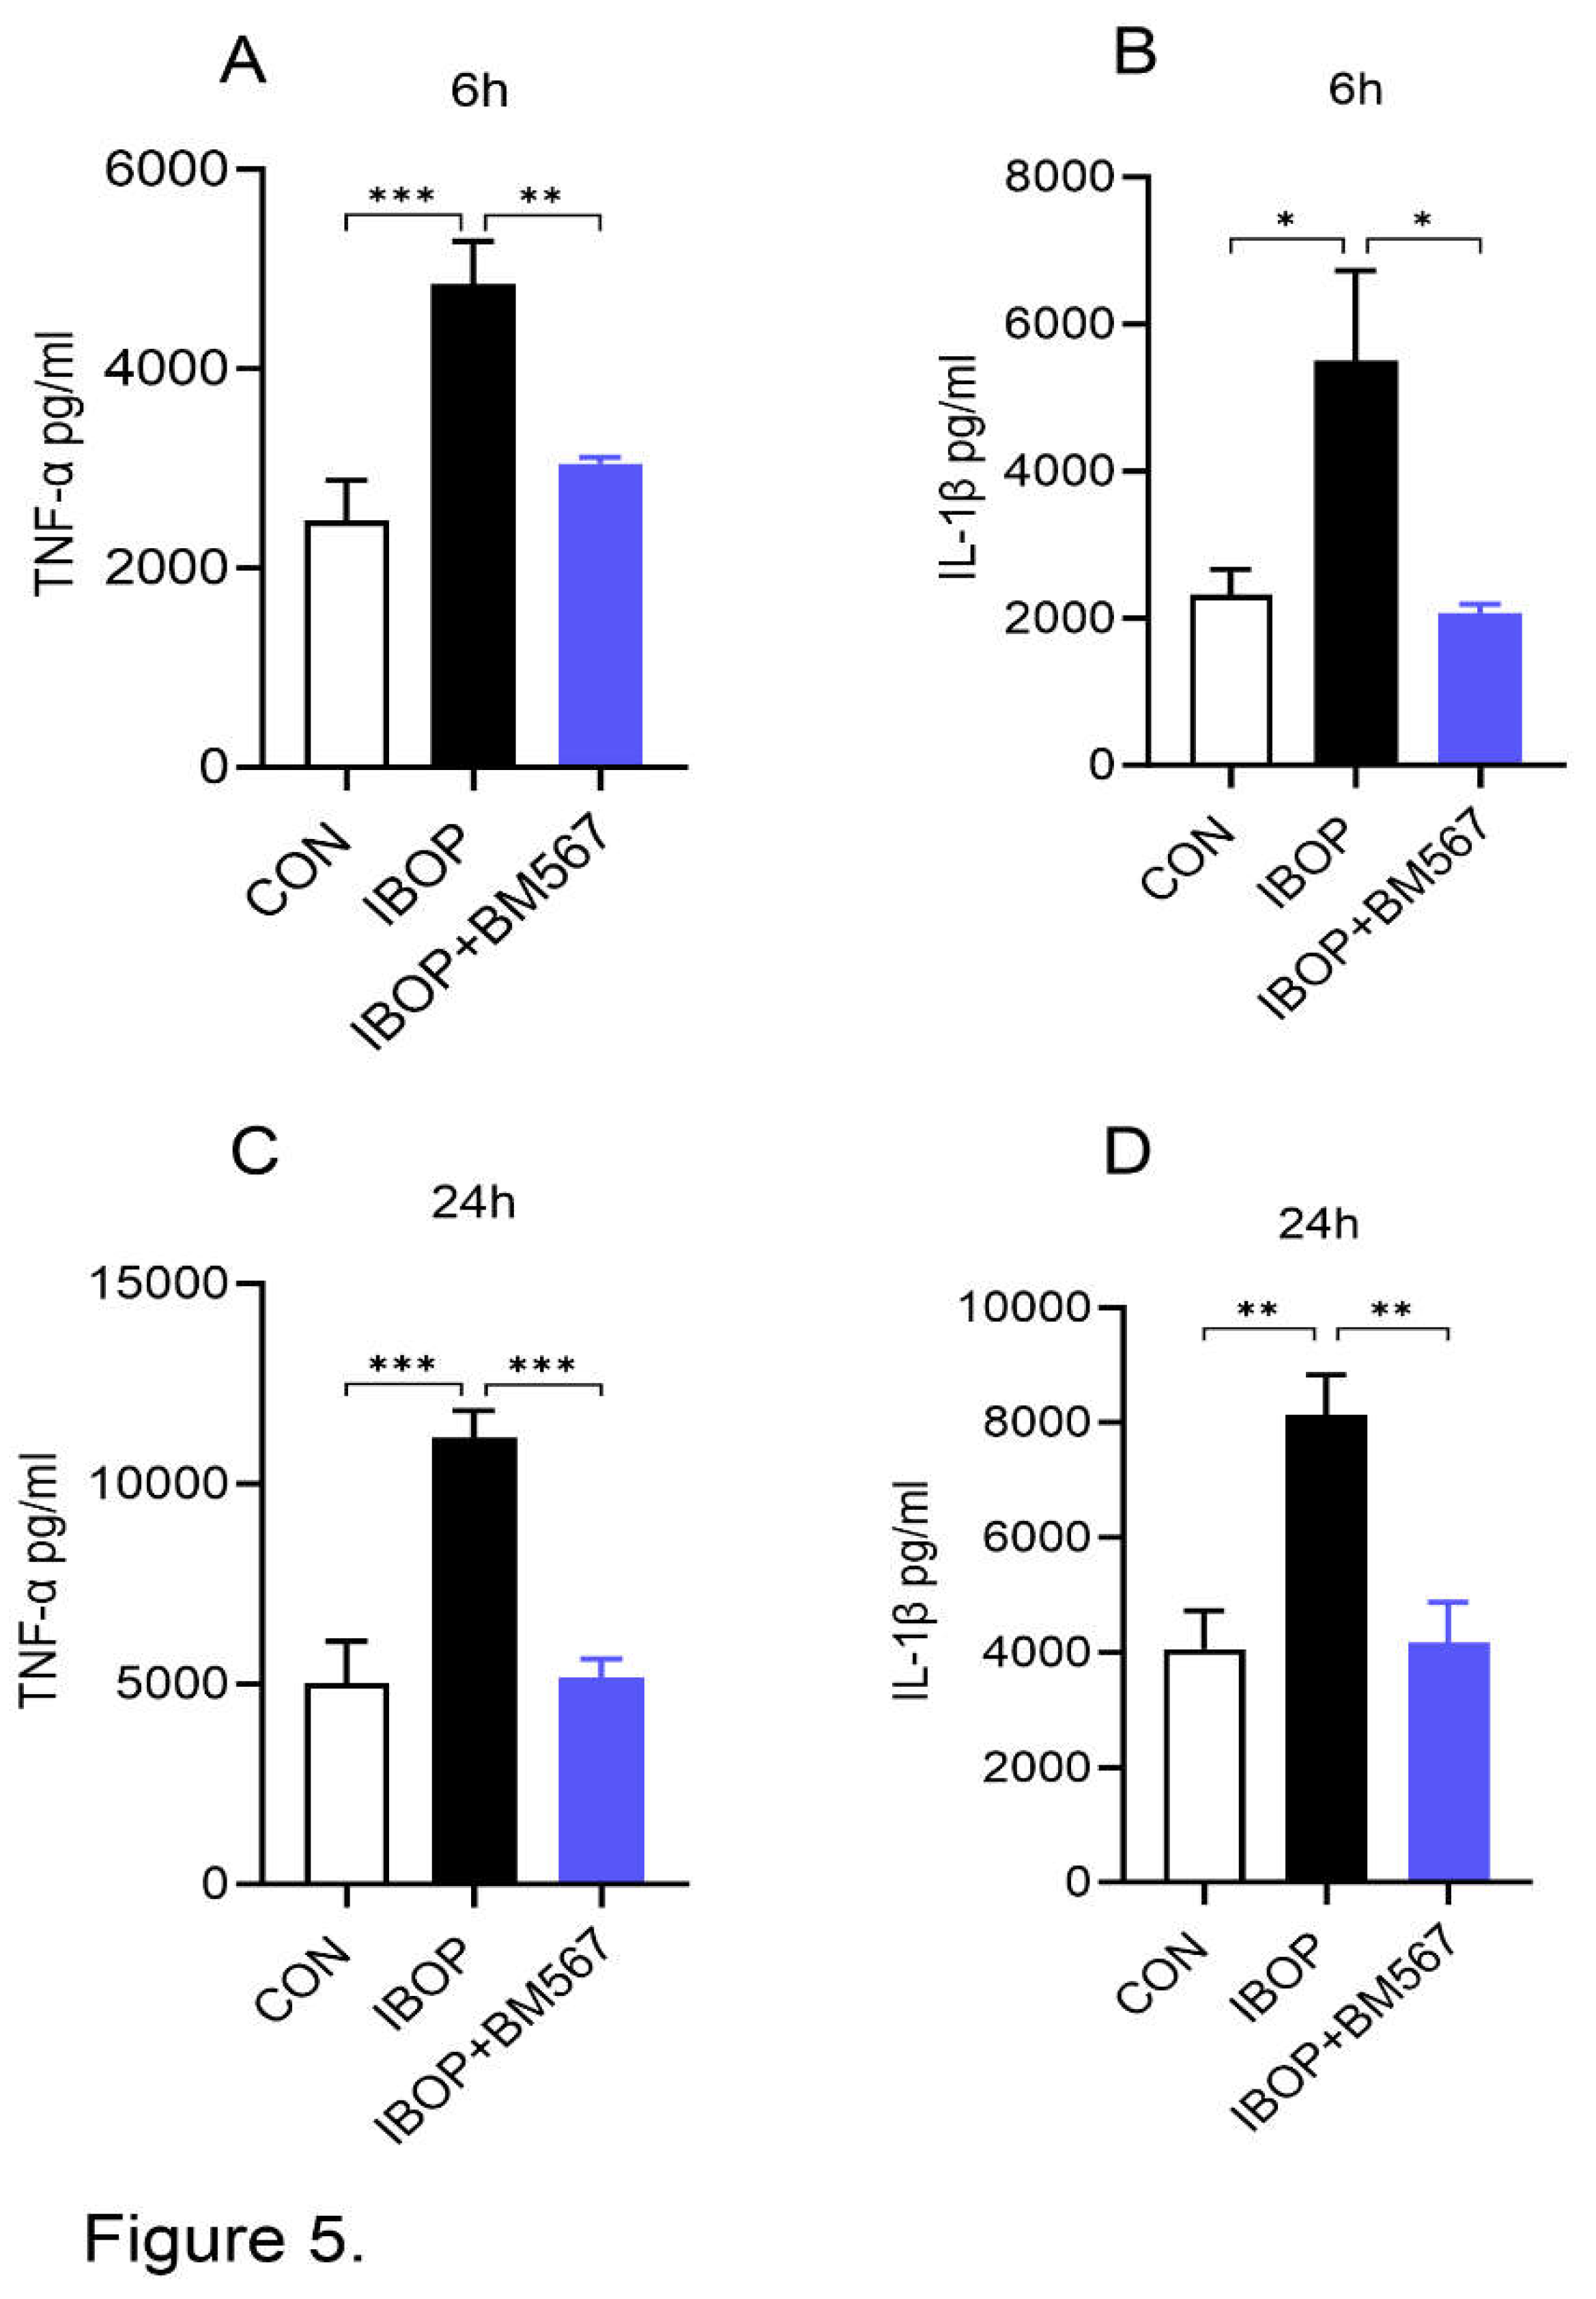
Figure 6.
ROCK inhibition attenuates IBOP induced secretion of pro-inflammatory mediators by human PBMCs. PBMCs were pre-treated with Y-27632, a ROCK inhibitor, for 2 h followed by co-incubation with IBOP (10 µM) for 6 h and 24 h. (A&B) Bar graphs show the level of TNFα and IL-1β in cell culture supernatants at 6 h. (C&D) The level of TNFα and IL-1β in cell culture supernatants after 24 h of treatment. Values are expressed as mean ± SEM of 4 sets of experiment in duplicate. **P<0.01, and ***P<0.001, con vs IBOP and IBOP vs treatment groups.
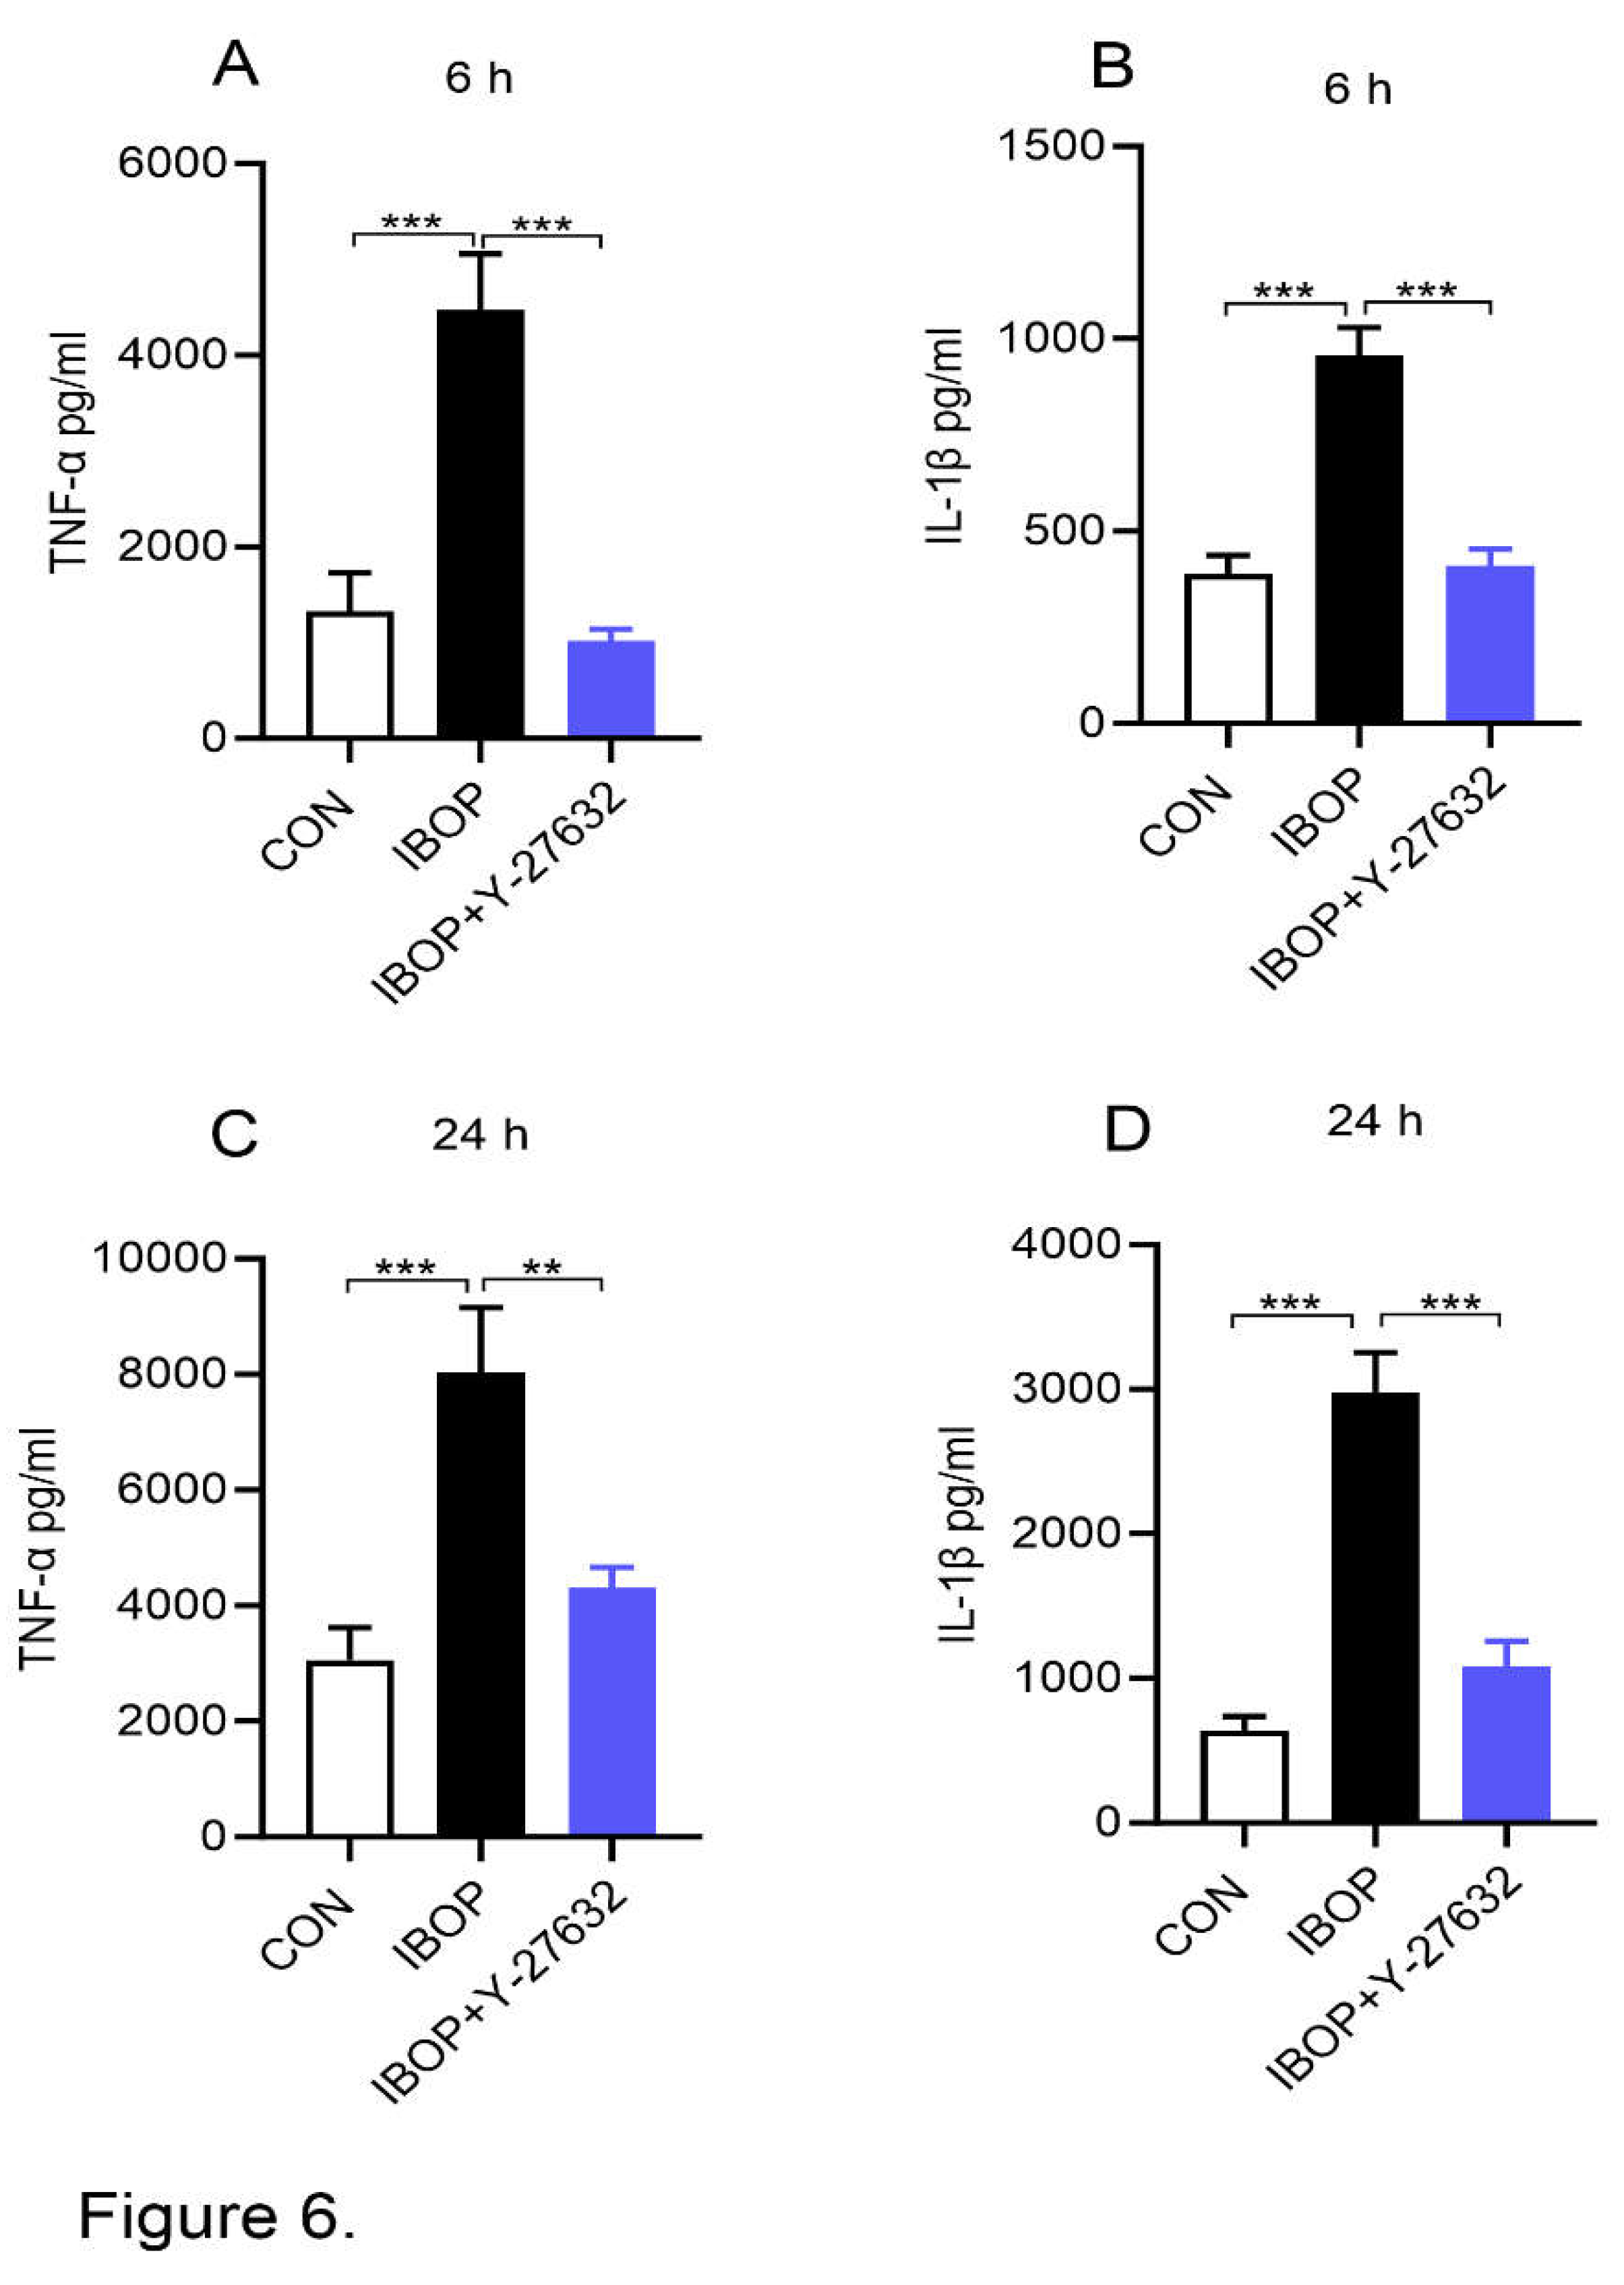

Table 1.
Base line characteristics.
| Measurement | Normal (n=4) | Obese- IR (n=4) | P value |
|---|---|---|---|
| Age (years) | 40.20 ± 4.27 | 47.43 ± 2.22 | 0.1537 |
| Weight (kg) | 168.7 ± 4.80 | 241.1 ± 7.15 | <0.0001 |
| Body mass index (kg/m^2) | 24.24 ± 0.61 | 34.79 ± 0.96 | <0.0001 |
| Insulin (µIU/mL) | 4.53 ± 1.02 | 12.85 ± 3.64 | 0.0275 |
| Glucose (mg/dl) | 90.00 ± 1.60 | 92.00 ± 2.67 | 0.5206 |
| HOMA-IR | 2.77 ± 0.61 | 7.86 ± 2.07 | 0.0156 |
| Total cholesterol (mg/dL) | 197.4 ± 6.66 | 208.3 ± 14.54 | 0.4922 |
| Triglycerides (mg/dL) | 114.8 ± 18.23 | 168.8 ± 42.18 | 0.2394 |
| LDL cholesterol (mg/dL) | 121.3 ± 6.92 | 140.5 ± 13.21 | 0.1941 |
| HDL cholesterol (mg/dL) | 53.13 ± 3.65 | 41.07 ± 2.67 | 0.0140 |
| Creatinine (mg/dL) | 2.79 ± 0.59 | 6.71 ± 2.07 | 0.0623 |
| ALT (U/L) | 11.17 ± 1.94 | 25.93 ± 7.40 | 0.0484 |
| AST (U/L) | 17.77 ± 2.71 | 24.15 ± 3.57 | 0.1562 |
| HA1C (%) | 4.98 ± 0.51 | 9.18 ± 1.85 | 0.0262 |
| GFR (mL/min) | 43.70 ± 7.56 | 48.89 ± 7.47 | 0.6287 |
| CRP (mg/L) | 3.61 ± 0.73 | 7.71 ± 2.00 | 0.0507 |
| Fat mass (%) | 12.03 ± 1.58 | 24.60 ± 2.88 | 0.0002 |
| Values are mean ± SEM. HOMA-IR, Homeostatic Model Assessment for Insulin Resistance; ALT, alkaline phosphatase; AST, acid phosphatase. | |||
Disclaimer/Publisher’s Note: The statements, opinions and data contained in all publications are solely those of the individual author(s) and contributor(s) and not of MDPI and/or the editor(s). MDPI and/or the editor(s) disclaim responsibility for any injury to people or property resulting from any ideas, methods, instructions or products referred to in the content. |
© 2024 by the authors. Licensee MDPI, Basel, Switzerland. This article is an open access article distributed under the terms and conditions of the Creative Commons Attribution (CC BY) license (https://creativecommons.org/licenses/by/4.0/).
Copyright: This open access article is published under a Creative Commons CC BY 4.0 license, which permit the free download, distribution, and reuse, provided that the author and preprint are cited in any reuse.


