Submitted:
10 July 2024
Posted:
11 July 2024
You are already at the latest version
Abstract
Medulloblastoma (MB) is one of the most common malignant pediatric brain tumors. Current therapy results in poor prognosis for high-risk SHH/p53-mutated MB, emphasizing the importance of more effective therapeutic strategies. Here, we investigated potential radiosensitizing effects of checkpoint kinase inhibitors (Chk-i) prexasertib (Chk1/2) and SAR-020106 (Chk1) in human SHH/p53-mutated MB in vitro and in vivo. UW228 and DAOY cells were treated with Chk-i and irradiation (RT). Metabolic activity, proliferation, and apoptosis was determined at d3, long-term clonogenicity at d14. DNA damage was assessed after 1, 24, and 72 h. Patient-derived SHH/p53-mutated, luciferase-transfected MB cells were implanted orthotopically into NSG mice (d0). Fractionated therapy (daily, d7-11) was applied. Body weight (BW) was documented daily, tumor growth weekly, and proliferation at d42. In vitro, Chk-i exhibited dose-dependent reduction of metabolic activity, proliferation, and clonogenicity, and enhancement of apoptosis. Combination with RT showed additive antitumor effects and enhanced residual DNA damage. In vivo, tumor growth was delayed by Chk-i alone. Low-dose prexasertib enhanced RT-induced tumor growth inhibition (37-fold) and reduced proliferating cells, high-dose prexasertib and SAR-020106 showed opposite effects (n=3, n.s.). BW assessments revealed that the treatment was well tolerated. Our data indicate a benefit of Chk-i in combination with RT in SHH/p53-mutated MB. However, high-dose Chk-i may compromise the RT effect, possibly by its anti-proliferative activity. Furthermore, we demonstrate for the first time the antitumor activity of the Chk1-specific inhibitor SAR-020106 in the murine brain.
Keywords:
Cell cycle checkpoint inhibition
; checkpoint kinase 1
; medulloblastoma
; radiation therapy
; orthotopic mouse model
; prexasertib
; SAR-020106
; DNA damage
1. Introduction
Medulloblastoma (MB) is one of the most common malignant brain tumors in children with median age between five and nine years [1]. According to the 2021 WHO classification of CNS tumors, four molecular MB subgroups are defined differing in prognosis and theron adapted therapy regimes [2].
Sonic hedgehog-activated and TP53-mutant (SHH/p53-mut) MB is a high-risk subgroup showing enhanced therapy resistance and has one of the worst prognosis among the MB subgroups [3,4].
Current treatment for SHH/p53-mut MB patients consists of maximum safe surgical resection, TP53 mutation-dependent (somatic or germline) radiation therapy (RT) and chemotherapy (ChT) according to the SIOP-PNET5-MB-SHH-TP53 trial protocol [5]. High-dose-intensity regimes, RT as well as ChT, cause devastating (long-term) adverse effects, which might decrease the quality of life. Disruption of white matter developement and reduced hippocampal neurogenesis after high-intensity therapy are known biological causes for the neurological and sensory impairments, and endocrine deficits in adolescent patients (reviewed in [6]); [7].
Therefore, there is a urgent clinical need to identify new approaches for the treatment of high-risk MB improving patient outcome while minimizing adverse therapy effects. An appropriate strategy is to increase (tumor cell-specific) RT efficiency by inhibiting repair of RT-induced DNA damage (DD). As consequence, lower RT doses and/or prolonged OS could be achieved.
The unrestricted G1/S transition in TP53-mutated cells circumvents DNA repair in G1 and enforces it at later cell cycle stages [8]. Therefore the SHH/p53-mut MB subgroup is particularly vulnerable for DD repair blockade by G2/M checkpoint abrogation leading to DD accumulation and enhanced cell death. The checkpoint kinases Chk1 and Chk2 are responsible for DD-induced cell cycle arrest/prolongation allowing DNA repair [9]. Notably, Chk1 plays a crucial role in activating the G2/M checkpoint after phosphorylation by ATR (ataxia telangiectasia and Rad3-related protein), a DD sensor protein. When inhibited, the cell enters mitosis with fragmented chromosomes resulting in cell death. Additionaly, Chk1 inhibition leads to unscheduled increase of DNA replication forks, generating more DD and resulting in replication catastrophe [10,11]. Several Chk-i were examined preclincally but did not enter clinical trials mainly due to off-target activity/toxicity issues. Here we compare the in vitro and in vivo characteristics of two Chk-i with emphasis on Chk1 inhibition.
Prexasertib (PRX) is an ATP-competitive inhibitor of Chk1 and to a lesser extent of Chk2 [10]. PRX monotherapy induces DD and tumor cell death in vitro and tumor growth delay in vivo [10,12]. Combination of PRX with RT and cisplatin in head and neck squamous cell carcinoma (HNSCC) showes enhanced antitumor effects [11,13]. In MB, PRX sensitizes tumor cells to genotoxic drugs like cyclophosphamide, cisplatin, or gemcitabine in vitro and in vivo. The strong chemosensitizing activity of PRX has been shown in high-risk MB-bearing mice reducing tumor burden and increasing mouse survival [14]. However, the effect of PRX combined with RT in MB is still unknown. In clinical trials, PRX is already under investigation administered as monotherapy or in combination with cytotoxic agents. Also, in advanced MB patients, SHH subgroup included, the efficiency of PRX in combination with gemcitabine or cyclophosphamide is currently evaluated [15].
In contrast to PRX, SAR-020106 (SAR) is highly selective for Chk1 inhibition [16]. In colon carcinoma xenografts, it is able to enhance the efficiency of genotoxic drugs like irinotecan and gemcitabine [16,17]. Furthermore, in HNSCC and colorectal cancer, SAR sensitizes tumor cells to IR-induced damage in vitro and in vivo [16,17,18,19]. In glioblastoma cells, we have already shown a chemo-and radiosenzitizing effect of SAR prolonging genotoxic-induced DD repair and reducing clonogenic long-term survival [20].
In this study, we investigated for the first time the combinatory effects of RT with the Chk-i PRX and SAR in human SHH/p53-mut MB. In vitro, the influence on DNA damage repair, long-term clonogenic tumor cell survival, apoptosis, proliferation, and metabolic activity was analyzed in two SHH/p53-mut cell lines. In vivo, we used an orthotopic patient-derived SHH/p53-mut MB xenograft mouse model and assessed tumor growth by bioluminiscence imaging (BLI) and proliferation index by Ki-67 staining of tumor tissue.
Our studies will outline a possible clinicial opportunity for the therapy of high-risk SHH/p53-mut MB patients with adjuvant Chk1 inhibition.
2. Materials and Methods
2.1. Cell Lines
UW228 (SHH/p53-mut MB) cells were kindly provided by Dr. Hendrik Witt (DKFZ Heidelberg/Germany) and maintained in DMEM with 4.5 g/l glucose and L-glutamine (Biozym). DAOY (SHH/p53-mut MB) cells were purchased from ATCC cell biology collection (Manassas VA/USA) and maintained in MEM and 2 mM L-glutamine (Sigma-Aldrich). Cell culture media were supplemented with 10 % fetal calf serum (Sigma-Aldrich), 100 U/ml penicillin, and 100 U/ml streptomycin (Biozym).
2.2. Drugs
For in vitro use, stock solutions of 10 mM prexasertib HCl (LY2606368; Selleckchem) and 20 mM SAR-020106 (SYNkinase) were prepared in DMSO and stored at -20°C. Working solutions were diluted freshly in cell culture medium with a final DMSO concentration of 0.01 % (PRX) or 0.005 % (SAR).
2.3. Cell Culture Treatment and Assays
Cells were seeded and allowed to attach for 24 h, PRX or SAR was added 1 h prior to RT (single-dose). For fractionation experiments examining clonogenicity, half of medium complemented with drugs was renewed daily. An X-ray machine (X-Strahl 200, Xstrahl GmbH, Ratingen) with dose rates of 1.3 - 1.9 Gy/min was used at 150 kV. Appropriate DMSO-treated and sham-irradiated controls were implemented.
Metabolic activity was detected using WST-1 reagent (Roche). Cell proliferation was measured using colorimetric BrdU cell proliferation ELISA (Sigma-Aldrich). Cell death induced by apoptosis was detected by Annexin-V-FLUOS Staining Kit (Sigma-Aldrich) and analyzed by fluorescence cytometry as previously described [20]. To determine long-term survival of clonogenic cells, cells were seeded in 6-well plates and treated (daily; 4x) 24 h later. At d14, colonies were stained and surviving fraction (SF) was determined according to [21].
2.4. Fluorescence-Microscopic Analyses of DNA Damage in S Phase Cells
To determine DD in cell cycle S phase, double-staining of gH2AX protein and EdU-incorporation were examined by immunofluorescence. Prior to cell fixation at 1, 24, and 72 h, cells were exposed to 10 µM EdU (Click iT Plus EdU Flow Cytometry Assay Kit, Invitrogen #C10632) for 5 h. Staining of gH2AX protein was performed as previously described [20] with following amendments: Prior to DAPI counterstaining, gH2AX-stained cells were fixed with EdU Click-iT Fixation solution for 15 min and washed once with PBS + 1% BSA + 0.5% Tween20 (wash buffer). Permabilization with EdU Click-iT- Permeabilisation and Wash solution for 15 min and one washing step with wash buffer followed. The EdU Click-iT Reaction cocktail was mixed and cells incubated according to manufacturers’ instructions. Cells were washed three times, DAPI-counterstained and mounted according to [22].
Microscopic imaging (BZ-9000; BZ-II Viewer; Keyence) of at least 50 non-peripheral nuclei (DAPI) were taken for Alexa Fluor 488 (EdU) and Alexa Fluor 568 (gH2AX) using identical exposure parameters. Overlay pictures were analyzed using hybrid cell count – fluorescence – double extraction application (BZ-II analyzer) and identical conditions (Table 1).
2.5. Western Blot of DNA Damage Proteins
Western blot (WB) analysis of gH2AX, phospho-RPA, Histone H3, and GAPDH was adapted from [20,23]. In detail, cells suspension in assay buffer was treated with protease inhibitor (cOmpleteTM; Roche), sonicated 3 times (HTU SONI-130 MiniFIER, G. Heinemann, Schwäbisch Gmünd; 10 s on - 20 s off; amplitude 30 %), and 25 µg protein loaded onto a 15 % polyacrylamide gel together with ScanLaterTM Protein Ladder (Molecular Devices). Following antibodies were used: mouse anti-phospho-Histone H2A.X (Ser139), clone JBW301, Millipore, 1:500; rabbit phospho-RPA32/RPA2 (Ser8) clone E5A2F, Cell Signaling Technology, 1:1000; mouse Anti-GAPDH Loading Control Monoclonal Antibody (GA1R), Invitrogen Antibodies,1:1000; rabbit anti-histone H3 clone D1H2, XP® ChIP formulated, Cell Signaling Technology, 1:1000; secondary antibodies IRDye 680RD goat anti-mouse, 1:15000; and IRDye 800CW goat anti-rabbit, 1:8000; Li-COR Biosciences.
2.6. Mouse Model, Treatment, and Imaging
Female NSGTM mice (NOD.Cg-PrkdcscidIl2rgtm1Wjl/SzJ mice) were bred and housed as previously described [24]. All experiments had been approved in advance by the local authorities (Landesdirektion Sachsen TVV36/19). Orthotopic patient-derived xenograft (PDX) SHH/p53-mutated, MYCN-amplified (BT084), and luciferase-transfected MB mouse models were created as already described [24].
Mice were treated daily at d7-11 after tumor cell transplantation (Figure 4D). Drug solutions were prepared daily using 40 % DMSO in sterile water (PRX) or 10 % DMSO + 5 % Tween20 in 0.9 % NaCl (SAR). 2 ml/kg body weight were given s.c. (PRX 1 or 5 mg/kg) or i.p. (SAR 40 mg/kg) 2 h prior to RT. Whole-brain irradiation (daily, 5x) and bioluminescence imaging (BLI) (weekly) were performed using antagonizable narcosis as described [24]. For BLI, total flux (photons/second) was measured 13 min after luciferin injection with automatic exposure time. Relative total flux was calculated to mean of all animals at d4.
2.7. Tissue Preparation and Staining
Mice were euthanized 4 weeks after treatment. Tissue preparation, freezing, histological staining (H/E) and Ki-67 (tumor proliferative index; purified Mouse Anti-Ki-67, BD Pharmingen, CloneB56, 250 µg/mL, 1:150) were performed as described [24]. Number of Ki-67 positive cell nuclei per field of view (800×800 µm, ocular counting grid) was manually counted in the three most proliferative tumor areas (Axiolab, Zeiss).
2.8. Statistics
Statistical analysis between two treatment groups was conducted by one-sided Student’s t-test using Microsoft Excel 2016 software. P-values ≤ 0.05 (*; #) and ≤ 0.01 (**; ##) were considered as statistically significant; p-values ≤ 0.001 (***; ###) as highly statistically significant.
3. Results and Discussion
To determine in vitro effects of Chk inhibition by PRX (Chk1/2) or SAR (Chk1) combined with RT in SHH/p53-mut MB cells, we measured metabolic changes, proliferation, and short-term cell death 72 h, and clonogenic long-term survival 14 d after treatment.
Both, PRX and SAR, lead to a concentration-dependent decrease of metabolic activity and proliferation in UW228 and DAOY cells. Combination of Chk-i with RT led to a stronger decrease than single treatments (Figure 1A, B).
In accordance with the known high therapy-resistance of SHH MB [25], only minor RT-induced short-term cell death induction was found. Chk-i enhanced the apoptotic cell fraction in UW228/DAOY cells by 24/32 % at 10 nM PRX and 11/10 % at 1 µM SAR versus control (16/27 % apoptotic cells). Combinatorial treatment resulted in strongest effects. Thereby, PRX and SAR enhanced apoptotic fraction versus 15 Gy RT (21/50 % in UW228/DAOY) by 42/19 and 34/16 %, respectively (Figure 1C, D, E).
Our data, showing for the first time radioadditive antitumor effects of Chk-i in SHH/p53-mut MB cells, are in line with recent in vitro and preclinical findings demonstrating single-agent as well as sensitizing effectivity of PRX and SAR when combined with genotoxic treatment [10,11,12,13,16,18,26,27,28,29,30,31] including DNA-damaging ChT in MB [14]. Thereby genotoxic replication stress combined with simultaneous Chk1 inhibition often leads to enhanced cell death especially in p53-deficient cells where the ATM–Chk2–p53 signaling pathway is already disabled impeding DNA repair by non-homologous end-joining [10,18,32,33,34]. Furthermore, in p53-deficient cells, p53-independent apoptosis can be induced via Caspase-2, which is enhanced by Chk1 inhibition [35,36]. Accordingly, we previously demonstrate that the Chk1-i SAR enhance cytotoxic effects of genotoxic drugs and/or radiation stronger in p53-deficient than in p53-wildtype glioblastoma cells [20].
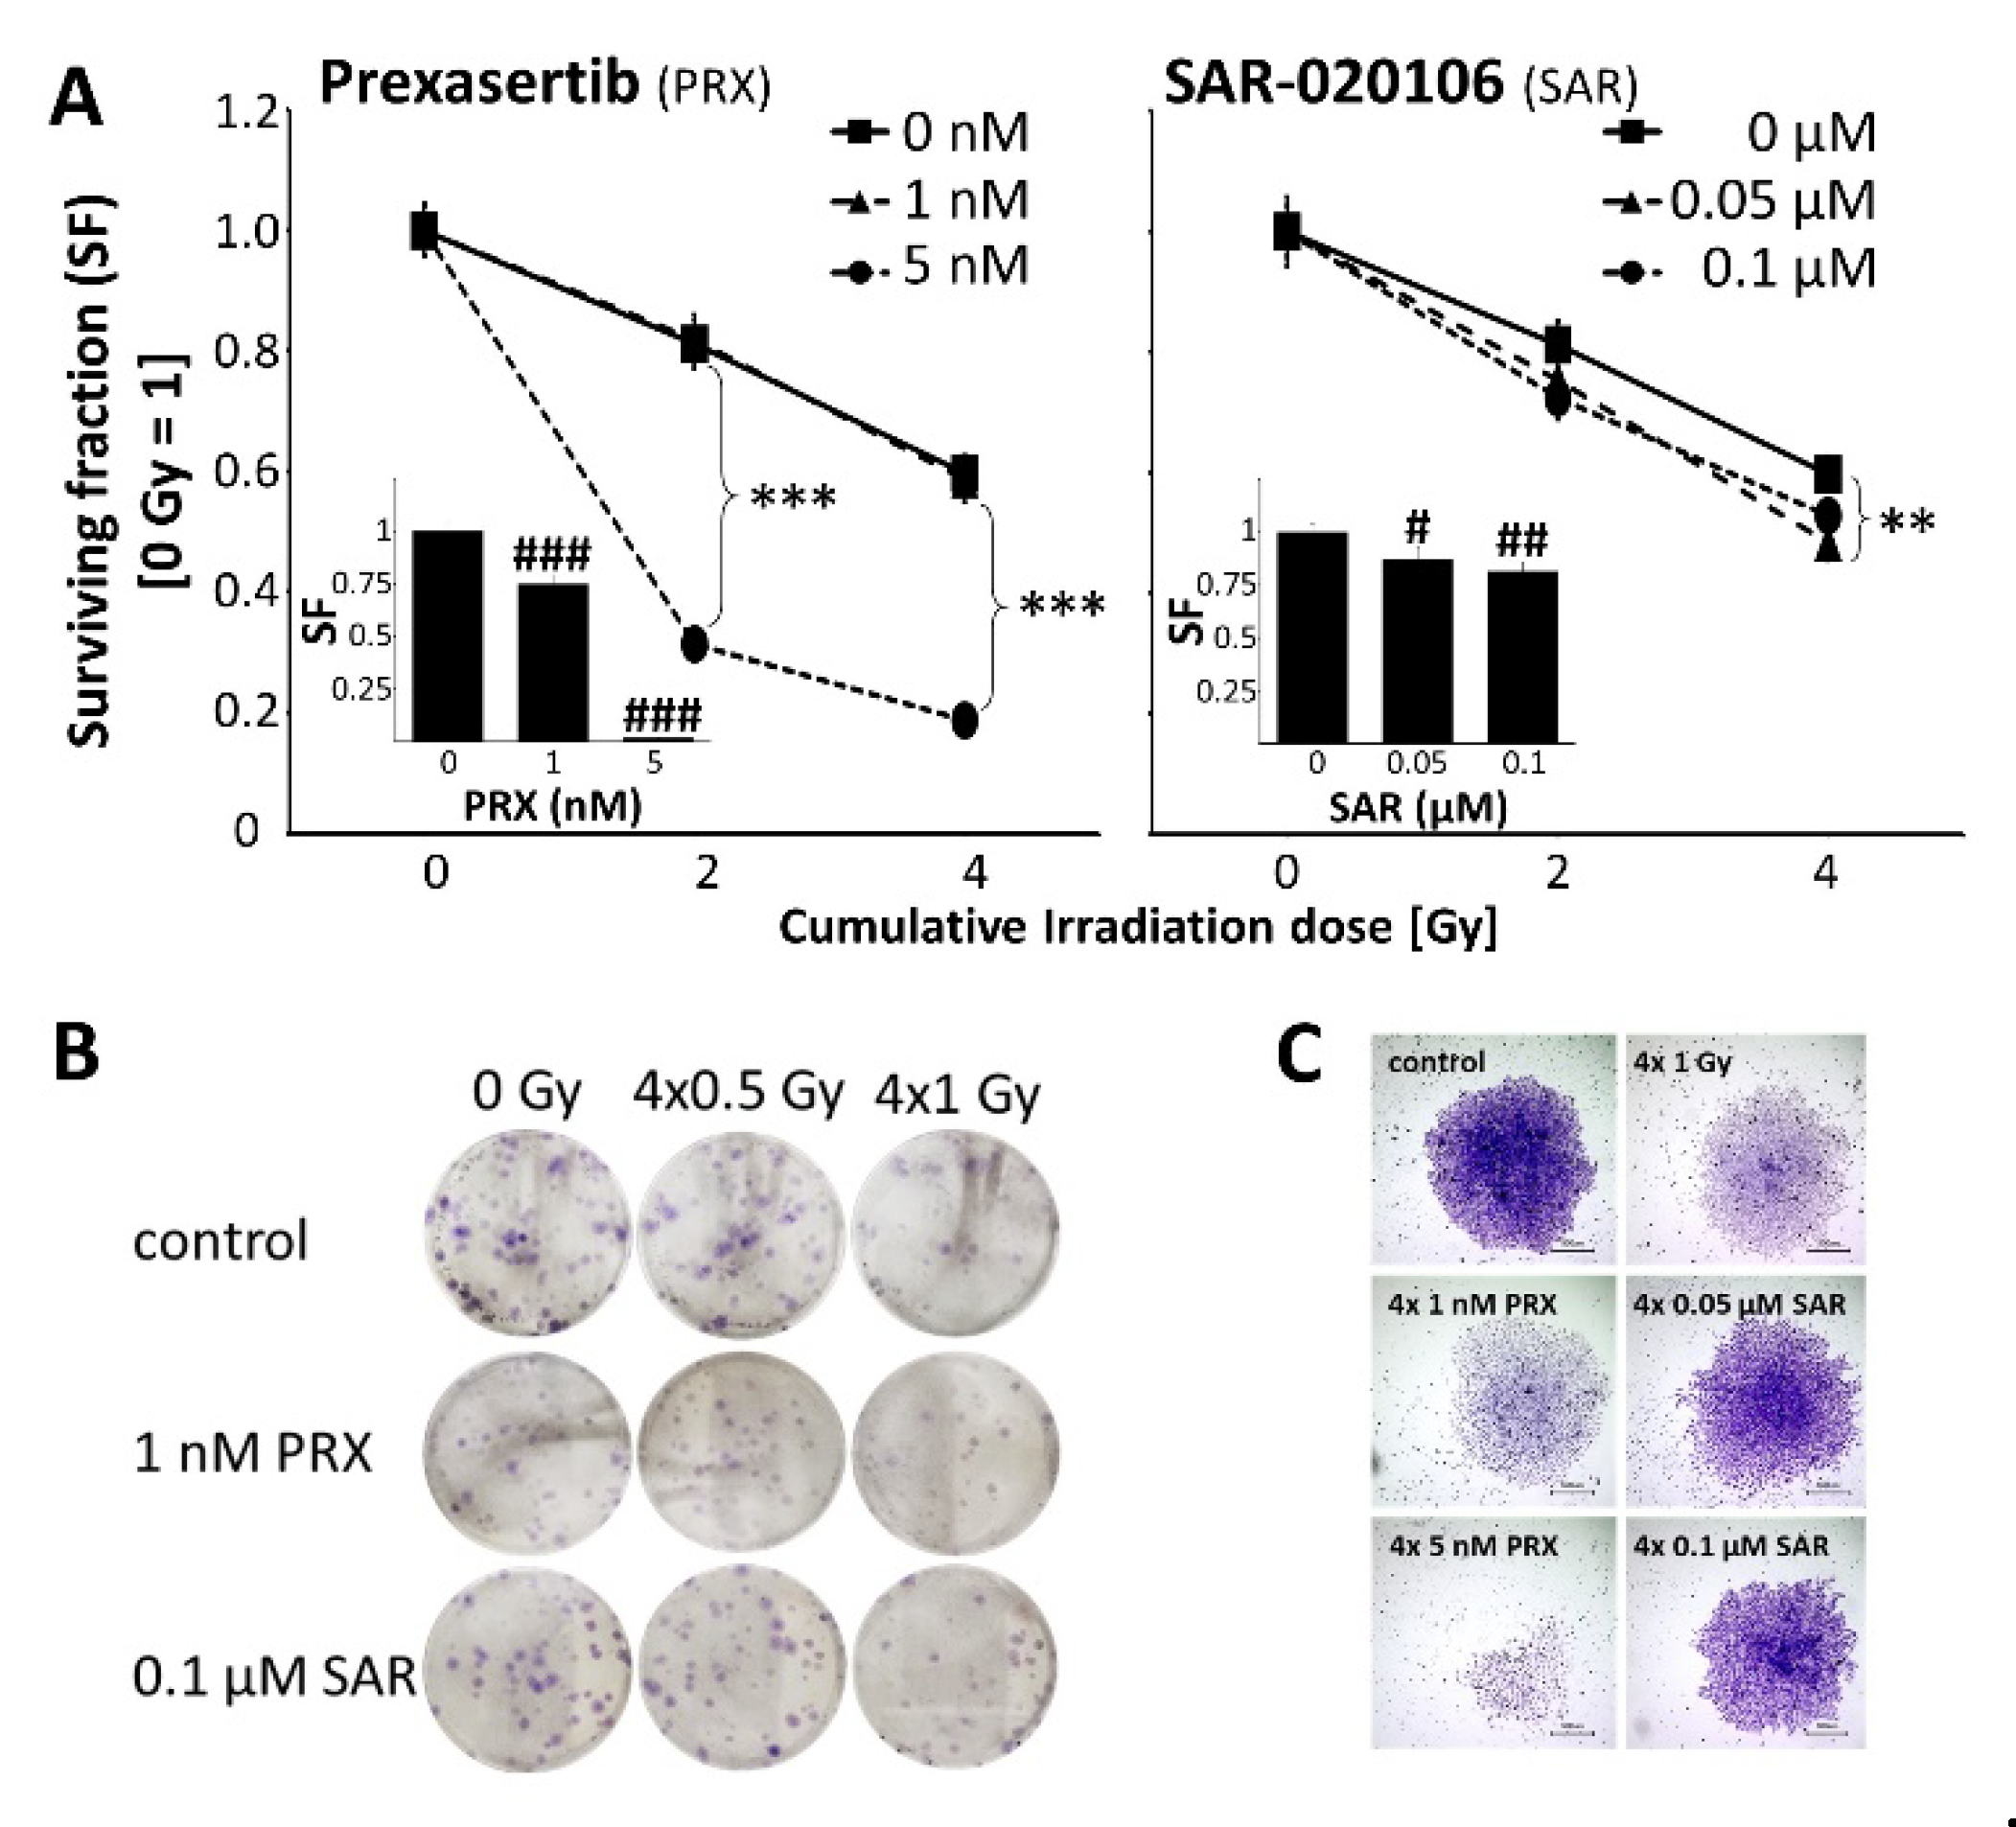
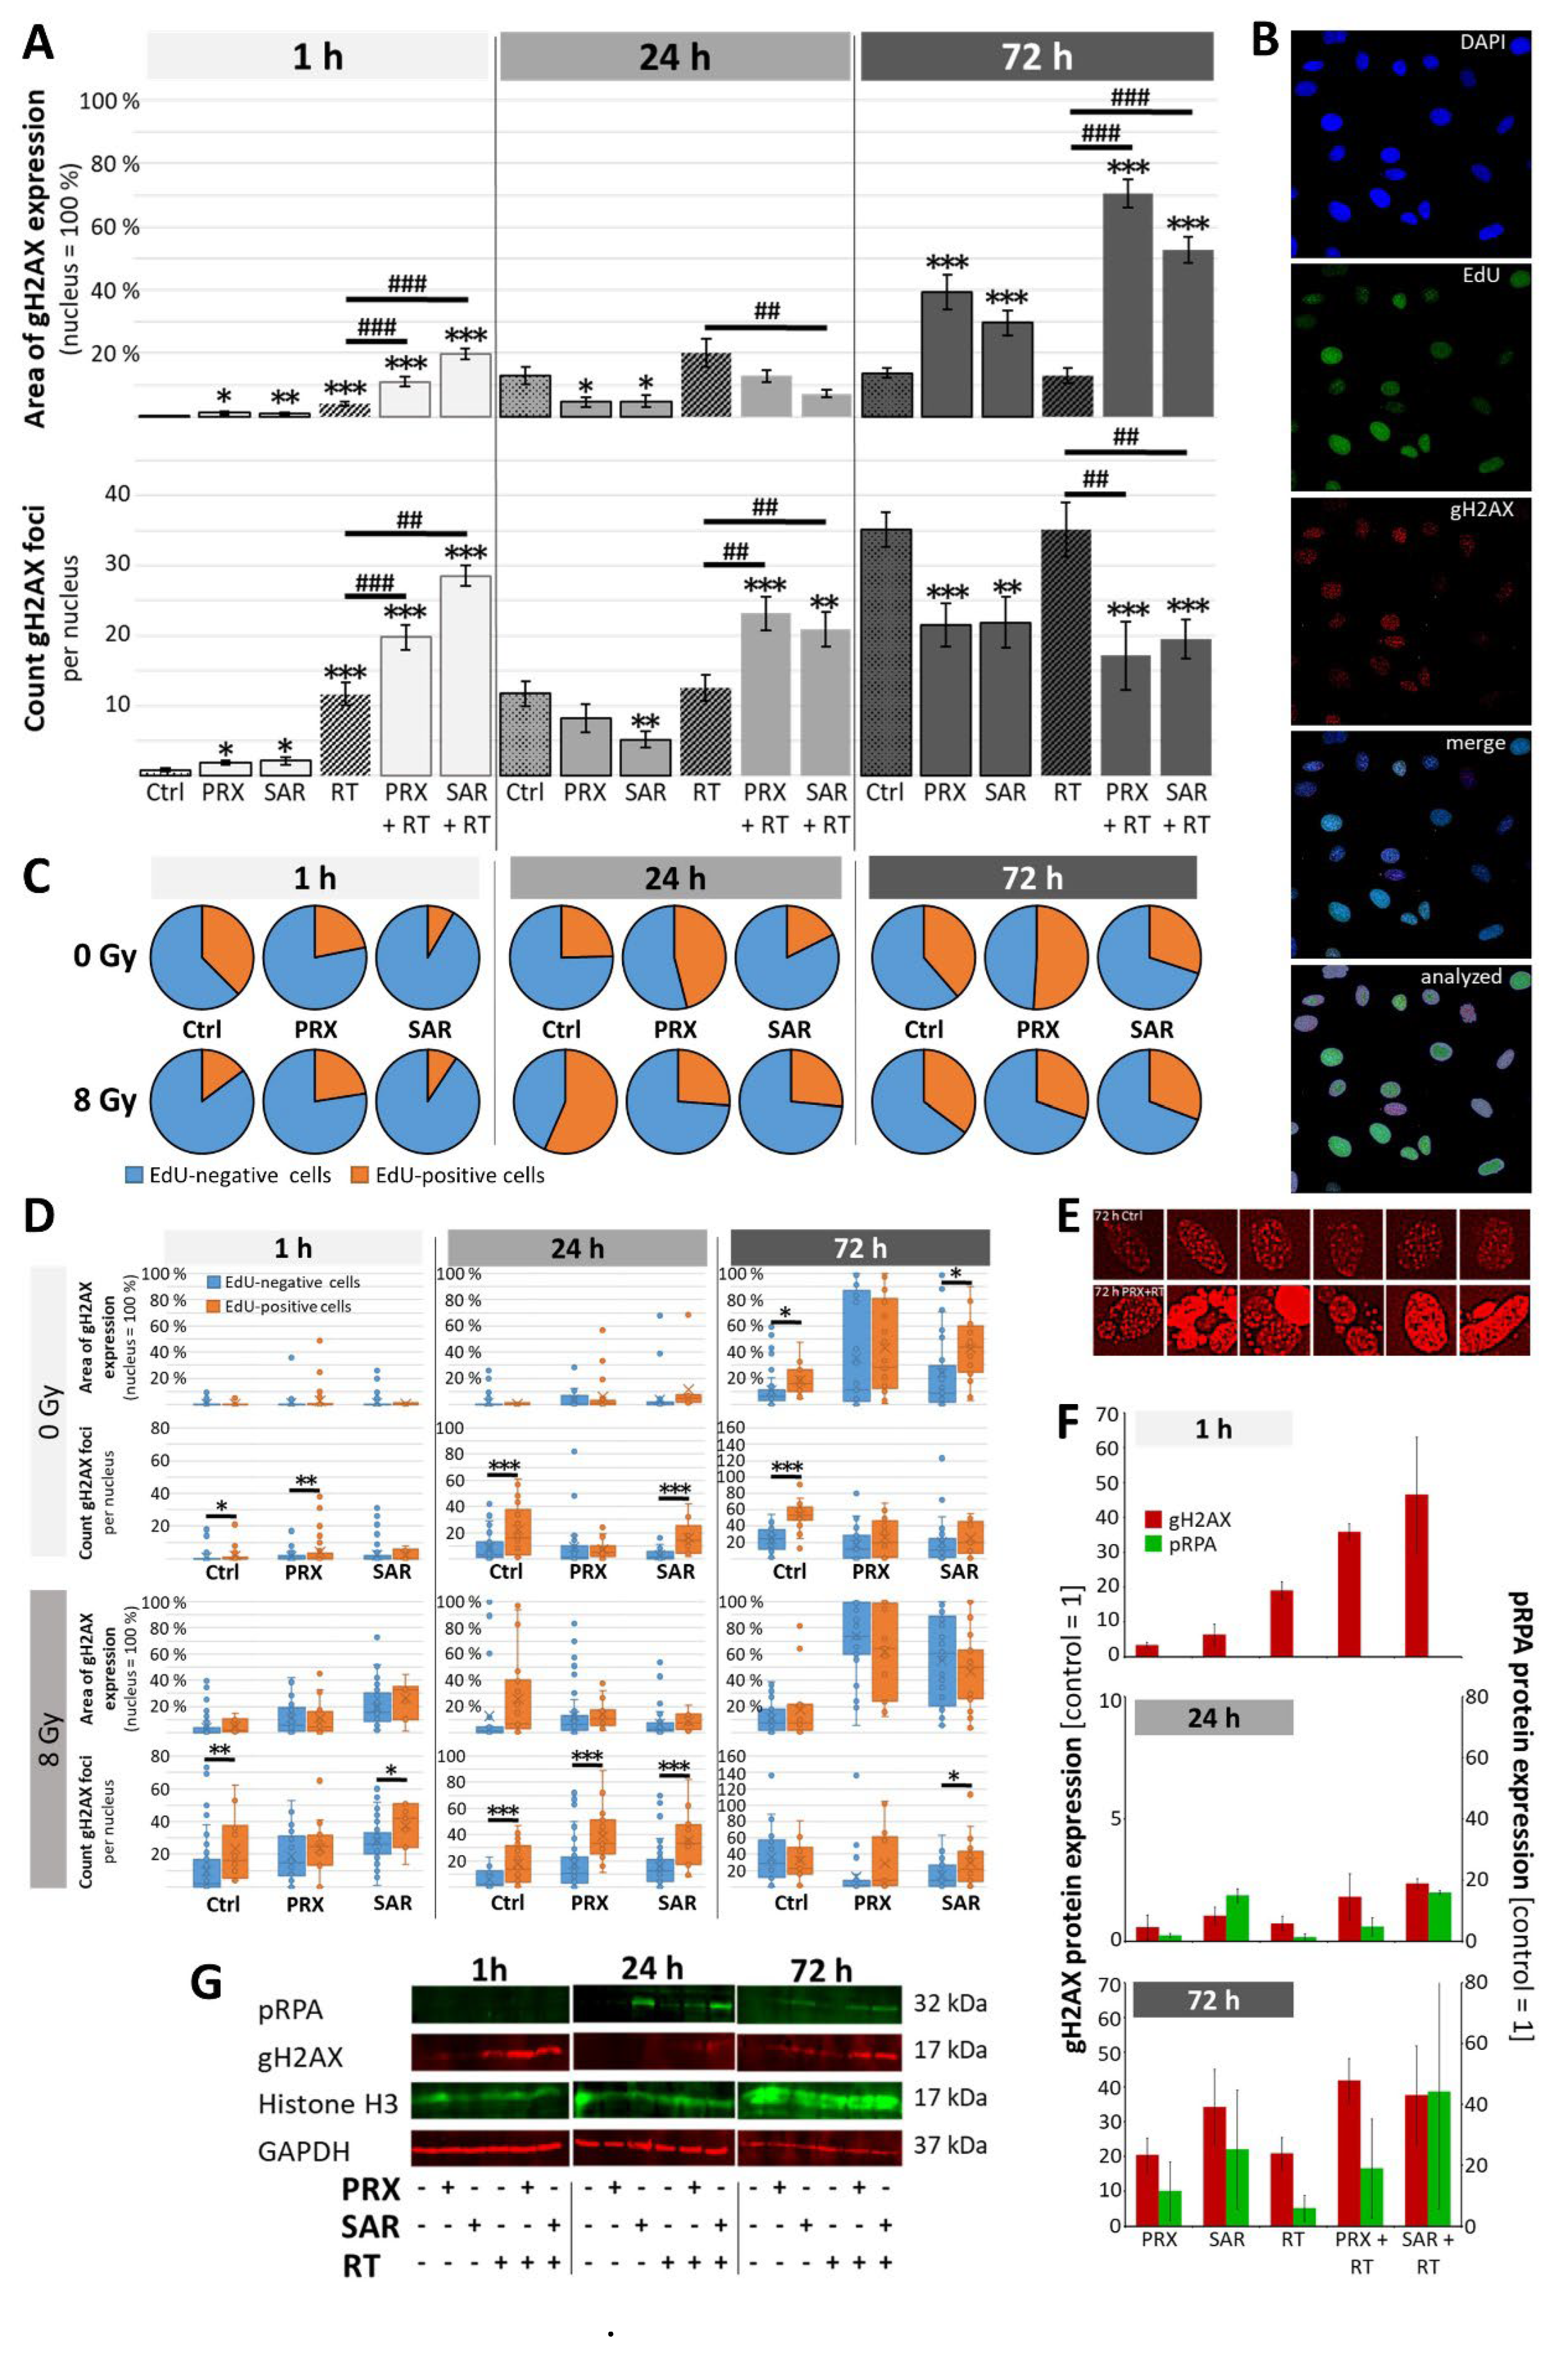
In UW228 MB cells, we could demonstrate radiosensitizing activity of PRX (5nM) and SAR (0.05 µM) on clonogenicity. Repeated PRX/SAR alone was effective to strongly induce clonogenic tumor cell death (Figure 2), most likely by accumulation of unrepaired, sublethal DD during ongoing cell cycles as shown in Figure 3A. Here, after Chk-i treatment, enhanced area of gH2AX expression/nucleus (PRX 39 ± 5 %; SAR 30 ± 4 %) coexisted with decreased foci number (PRX 21.6 ± 3.1; SAR 21.9 ± 3.6) compared to control (area 14 ± 2 %; foci 35.1 ± 2.4) at 72 h indicating large areas of condensed DD foci after 1-2 cell cycles (doubling time approx. 35 h); (Figure 3E). Similarly, combinatorial treatment with RT further enhanced DD (area gH2AX expression/nucleus PRX 70 ± 4 %; SAR 53 ± 4 %) compared to RT alone (13 ± 2 %) at 72 h and decreased foci numbers (Figure 3A).
By comparison of EdU-positive to non-labeled cells, we observed a slight shortening of S/G2M phase by SAR and PRX at 1 h, as already described for UW228 cells after lovastatin treatment [37]. At later time points, PRX (5 nM) induced S/G2M phase arrest at 24 and 72 h possibly as a result of cyclin-dependent kinase (CDK) inhibition, described for high-dose Chk1-i [38] (Figure 3C). Others described a Chk1-i-dependent enhancement of DD mainly in S phase [10,16,18], which was seen here only for SAR (Figure 3D).
Figure 1.
Metabolic activity (A), proliferation (B), and apoptosis (C, D, E) of UW228 and DAOY cells 72 h after combined Chk inbibition (PRX or SAR) and RT. Data in line charts (A, B) present mean ± standard error of mean (SEM) of three independent experiments performed in triplicates. Apoptotic fraction (C) is presented as mean ± SEM measured in three independent experiments. Statistical significance compared to RT-only (also sham-RT) is indicated by hashtag (#, p ≤ 0.05; ##, p ≤ 0.01; ###, p ≤ 0.001) and compared to drug-only (also placebo) by asterisks (*, p ≤ 0.05; **, p ≤ 0.01; ***, p ≤ 0.001. (D) Representative dot blots from Annexin-V assay. (E) Representative photographs of cell growth and detached dead cells, 20-fold magnification.
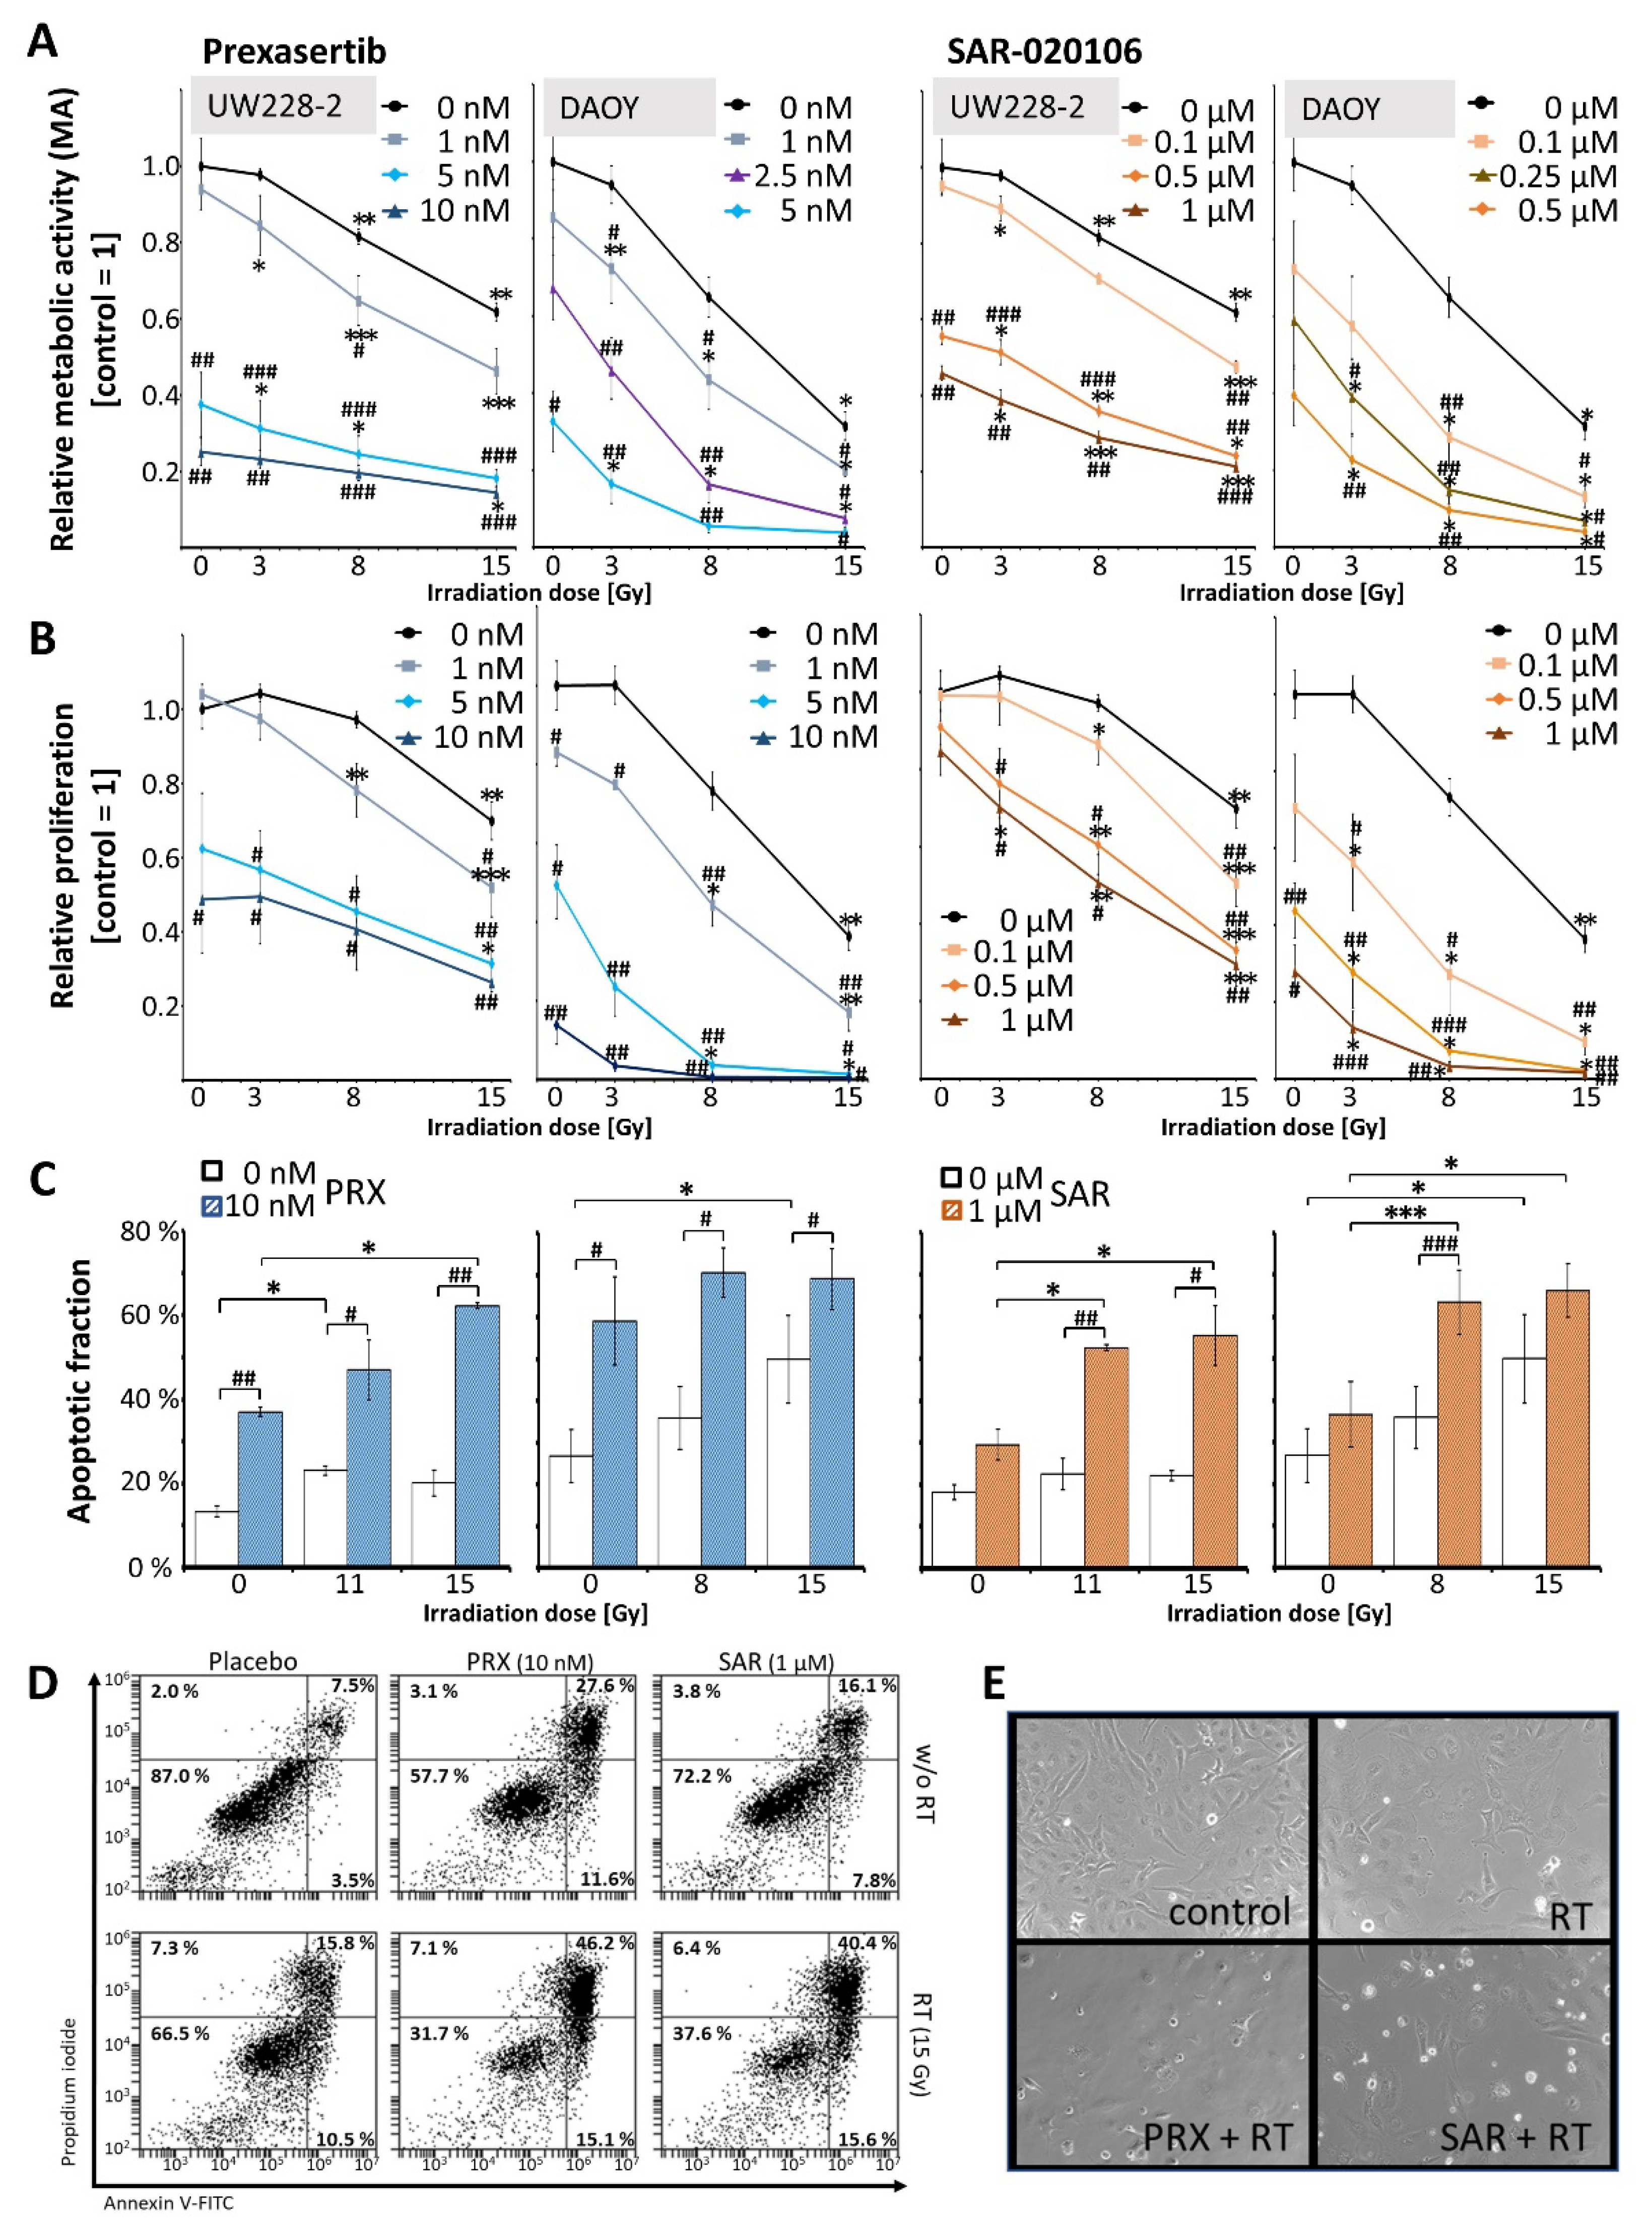
Figure 2.
Clonogenic survival of UW228 cells 14 d after combined Chk inbibition (PRX or SAR) and RT. (A) Long-term clonogenicity of UW228 cells decreased after fractionated RT (SF = 0.81 ± 0.04 at 4 × 0.5 Gy and 0.60 ± 0.03 at 4 × 1 Gy). PRX reduced SF to 0.75 ± 0.04 (1 nM) and 0.018 ± 0.004 (5 nM). SAR diminished SF to 0.87 ± 0.06 (0.05 µM) and 0.82 ± 0.04 (0.1 µM). Strongest radioadditive effects were found at 4 × 0.5 Gy for 5 nM PRX (SF = 0.006 ± 0.001; 135-fold) and for 0.1 µM SAR (SF = 0.59 ± 0.04; 1.4-fold) versus RT. Data present mean ± SEM of three independent experiments performed in sextuplicates. Statistical significance compared to RT-only group is indicated by asterisks (*, p ≤ 0.05; **, p ≤ 0.01; ***, p ≤ 0.001). Bars shows SF of drug-only treated groups. Significance compared to untreated control is indicated by hashtag (#, p ≤ 0.05; ##, p ≤ 0.01; ###, p ≤ 0.001) (B, C) Representative photographs of grown colonies, 100 cells were initially seeded. (C) 4-fold magnification, bar = 500 µM.
RT-induced DD are known to activate Chk1 initiating S/G2M cell cycle arrest and DD repair [39]. Accordingly, cells accumulated in S/G2M phase during 24 h after IR and normalize to cell cycle distribution of control levels at 72 h. Chk-i pretreatment reduced the number of S/G2M phase cells versus RT alone (Figure 3C) after 24 h. RT and to a higher degree Chk-i/RT-treated cells showed largely unrepaired DD mainly in S/G2M phase nuclei (Figure 3 D). Despite normalized cell cycle distribution in the Chk-i treated cells after 72 h, DD was still present. WB of gH2AX and pRPA proteins (Figure 3E, F) and previous studies in glioblastoma cells treated with SAR and RT [20] are in line with these findings.
We conclude that induction of Chk1 by RT can be efficiently inhibited by PRX and SAR resulting in abrogation of S/G2M arrest and DD repair and enhanced tumor cell death.
To validate the promising in vitro data in vivo, we performed a proof-of-principle study with at least three mice per treatment group using an orthotopic SHH/p53-mut MB PDX model (Figure 4D).
Estimated in vivo doses were a maximal brain concentration of 13.7 nM for PRX (1 mg/kg; i.v.) [40] and a plasma concentration of about 50 µM for SAR (40 mg/kg; i.p.) [16]. For PRX, we also tested 5 and 10 mg/kg s.c. to compensate the possibly lower bioavailibility of s.c. versus i.v. application. For SAR, brain barrier penetration capability is still unknown, this is the first assessment of its potential intracranial antitumor activity.
Figure 3.
DNA damage in UW228 cells after combined Chk inbibition (5 nM PRX or 0.5 µM SAR) and RT (8 Gy). (A) Area of gH2AX expression/nucleus and number of gH2AX foci 1, 24, and 72 h after treatment. Data present mean ± SEM of one experiment with at least 50 analyzed cell nuclei. Statistical significance compared to untreated/sham-irradiated control is indicated by asterisks (*, p ≤ 0.05; **, p ≤ 0.01; ***, p ≤ 0.001) and compared to RT-only group by hashtag (##, p ≤ 0.01; ###, p ≤ 0.001). (B) Representative photographs of immunofluorescence-stained nuclei (blue), EdU (green), and gH2AX protein (red). Lowest picture shows nuclei/EdU/gH2AX detected by BZ-II analyzer software (see method section). (C) Distribution of EdU-positive S/G2 phase cells and EdU-negative cells 1, 24, and 72 h after treatment. Mean of one experiment with at least 50 analyzed cell nuclei is shown. (D) Area of gH2AX expression/nucleus and number of gH2AX foci in EdU-positive S/G2 phase and and EdU-negative cells 1, 24, and 72 h after treatment. Data are presented as box-and-whisker plots, including minimum/maximum, lower/higher quartile, and median/mean of one experiment with at least 50 analyzed cell nuclei. Statistical significance between S/G2 and EdU-negative cells is indicated by asterisks (*, p ≤ 0.05; **, p ≤ 0.01; ***, p ≤ 0.001). (E) Representative photographs of gH2AX foci in control and PRX+RT-treated cells at 72 h. (F) Quantitative Western blot analyses of pRPA and gH2AX fluorescence intensities. Data present mean ± SEM of two blotting membranes of one experiment. Data are corrected to appropriate loading controls (Histone H3 and GAPDH) and normalized to untreated control. (G) Representative Western blots of pRPA, gH2AX, and loading controls (Histone H3, GAPDH).
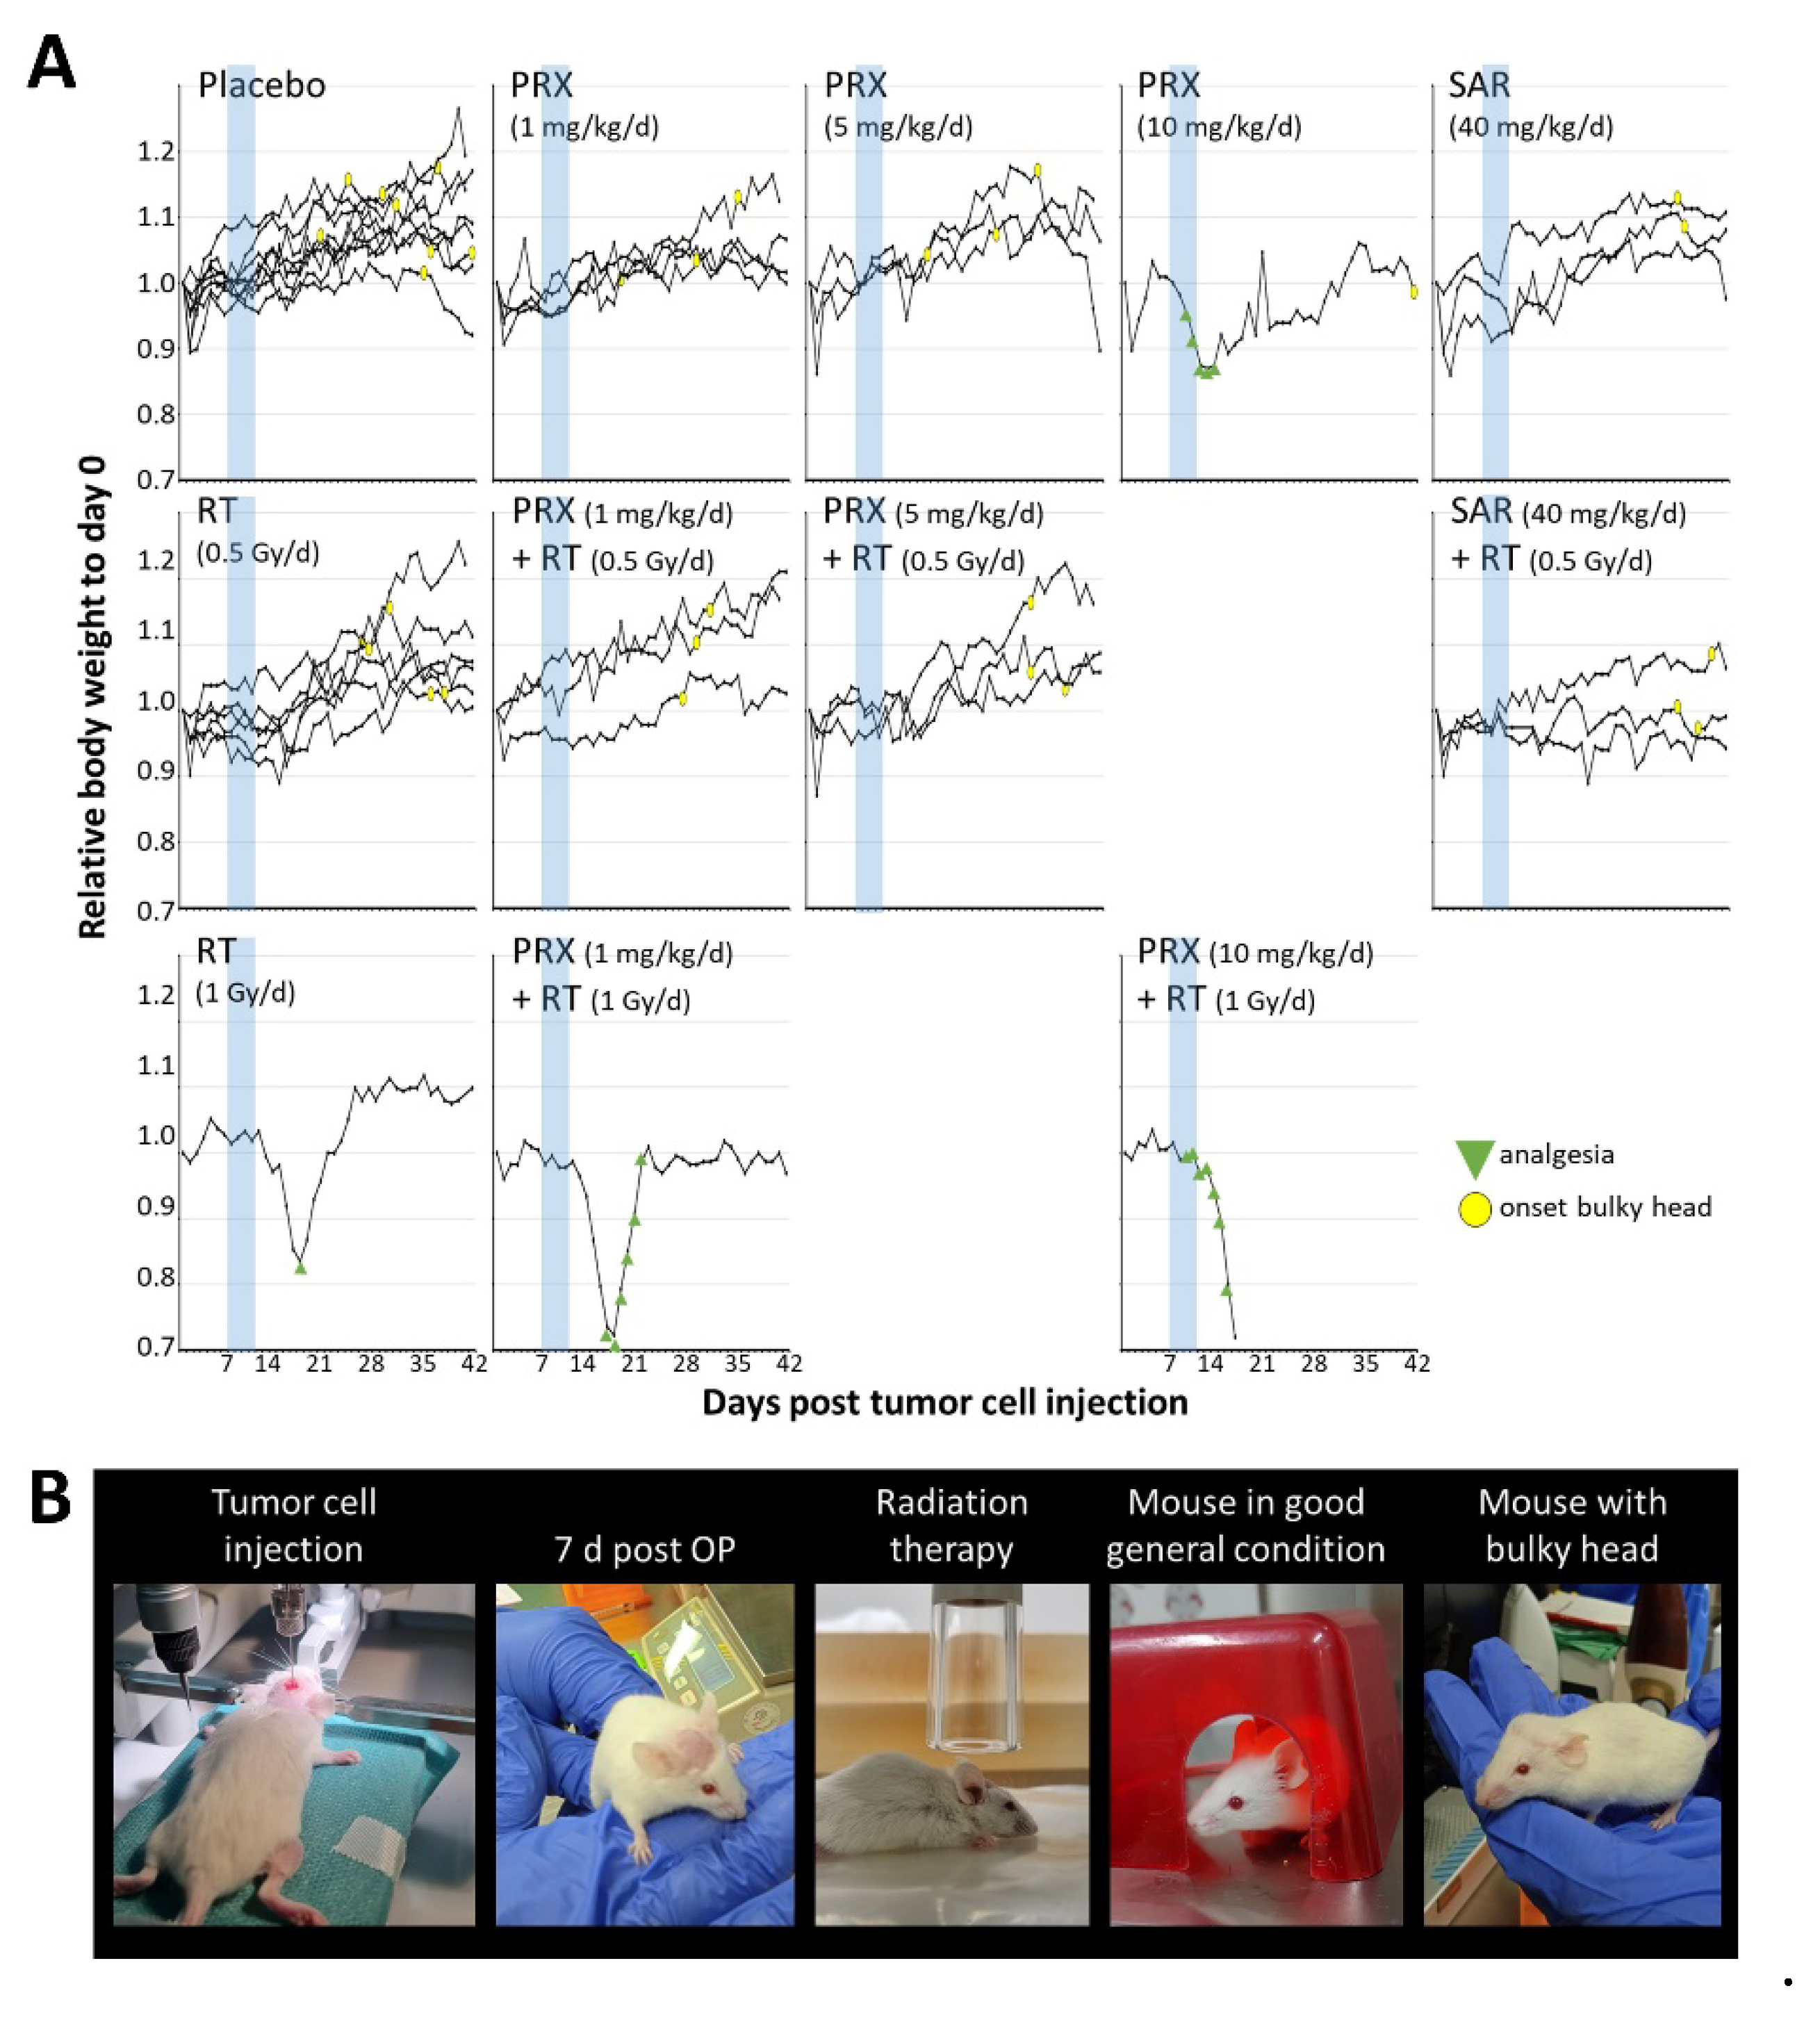
Tumor mass of placebo-treated animals grew continually over time and was enhanced 301-fold at d42 (euthanasia) versus d4 (Figure 4A, B, C). SAR monotherapy initially enhanced tumor growth at d14 (12.4-fold; p ≤ 0.05) presumably due to cell cycle acceleration by S/G2M checkpoint abrogation. This was followed by growth inhibition, compared to control (d28-42; n = 3; n.s.), assumingly due to DD accumulation as shown in vitro. PRX alone induced similar effects albeit to a lesser extent (n = 3; n.s.). Fractionated RT inhibited the tumor growth leading to reduced tumor mass until end of experiment (>d28; n = 6; p ≤ 0.05), which is also reflected by the reduction of proliferative cells (225 ± 9 to 185 ± 6 cells/FOV; n = 9; p ≤ 0.001), (Figure 5). Nevertheless, RT alone did not cure the animals as BLI evaluation revealed progression of tumor growth on d35 (Figure 4C). Combination of SAR/PRX and RT showed additive effects and further reduced tumor mass compared to monotherapy, except of SAR at d35/42 and high-dose PRX at d42 where Chk-i therapy apparently induces radioresistance. Accordingly, combination of RT and PRX reduced proliferation index by 24 % (n = 3; p ≤ 0.05) only at low concentration (1 mg/kg), (Figure 5), indicating a persistent effect. Onset of bulky head was monitored as a marker of growing tumor but was found to be too insensitive to reveal any differences between treatment groups (Figure 6).
Toxicity of therapy was assessed by mouse body weight (BW). After tumor inoculation, BW decreased by 5 % at d1-2 due to anesthesia and intracranial surgery but stabilized at d3-4 (Figure 6). Preliminary dose-testing experiments revealed that intense treatment regime with PRX (5 × 10 mg/kg) and/or RT (5 × 1 Gy) leads to a strong decrease (10 – 20 %) of BW, requiring analgesia and was therefore abandoned. Lower PRX doses (5 × 1 or 5 x 5 mg/kg), SAR, and/or RT (5 × 0.5 Gy) were well tolerated. Our data show for the first time intracranial antitumor activity suggesting brain barrier penetration of SAR although, combinations of SAR with RT/ChT have already been shown to delay tumor growth in HNSCC and colorectal cancer mouse models [16,18]. For PRX, CNS penetration is already proven [14,40] and is hereby supported in NSG mice. Several recently published clinical trials confirm PRX tolerability and efficiency [41,42,43,44,45,46,47,48,49] and one phase 1 trial examining the combination of PRX and chemotherapy in MB is currently active [15]. Also in pediatric patients, PRX was under clinical examination [50]. Our study is limited by the number of animals used in the experiments and possibly a suboptimal dosing of SAR. Further investigations combining Chk-i not only with genotoxic therapies but also with DD repair-affecting drugs, like PARP inhibitors [51], are warranted.
Figure 4.
Tumor growth of SHH/p53-mut MB after fractionated therapy (5x, daily) with PRX (1 or 5 mg/kg/d) or SAR (40 mg/kg/d) and RT (0.5 Gy/d). (A) Representative bioluminescence images. (B) Relative total flux at d14, 28, 35, and 42 after tumor inoculation. Raw values were normalized to d4 of all evaluated mice (n = 20). Data presented as box-and-whisker plots, including minimum/maximum, lower/higher quartile, and median/mean. Number of analyzed animals/treatment group: control, RT n =6; other groups n = 3. Statistical significance compared to appropriate sham-RT group is indicated by asterisks (*, p ≤ 0.05), compared to RT-only by hashtag (#, p ≤ 0.05), and compared to placebo-treated/sham-irradiated control by rhomb (◊, p ≤ 0.05). (C) Absolute total flux of single mouse BLI measurements and mean of all (red line). Treatment window is indicated by a black bar at x-axis. (D) Workflow of in vivo procedures. Treatment comprised PRX (1 or 5mg/kg/d, s.c.) or SAR (40 mg/kg/d, i.p.) and RT (0.5 Gy/d) 2 h later. Created with BioRender.com.
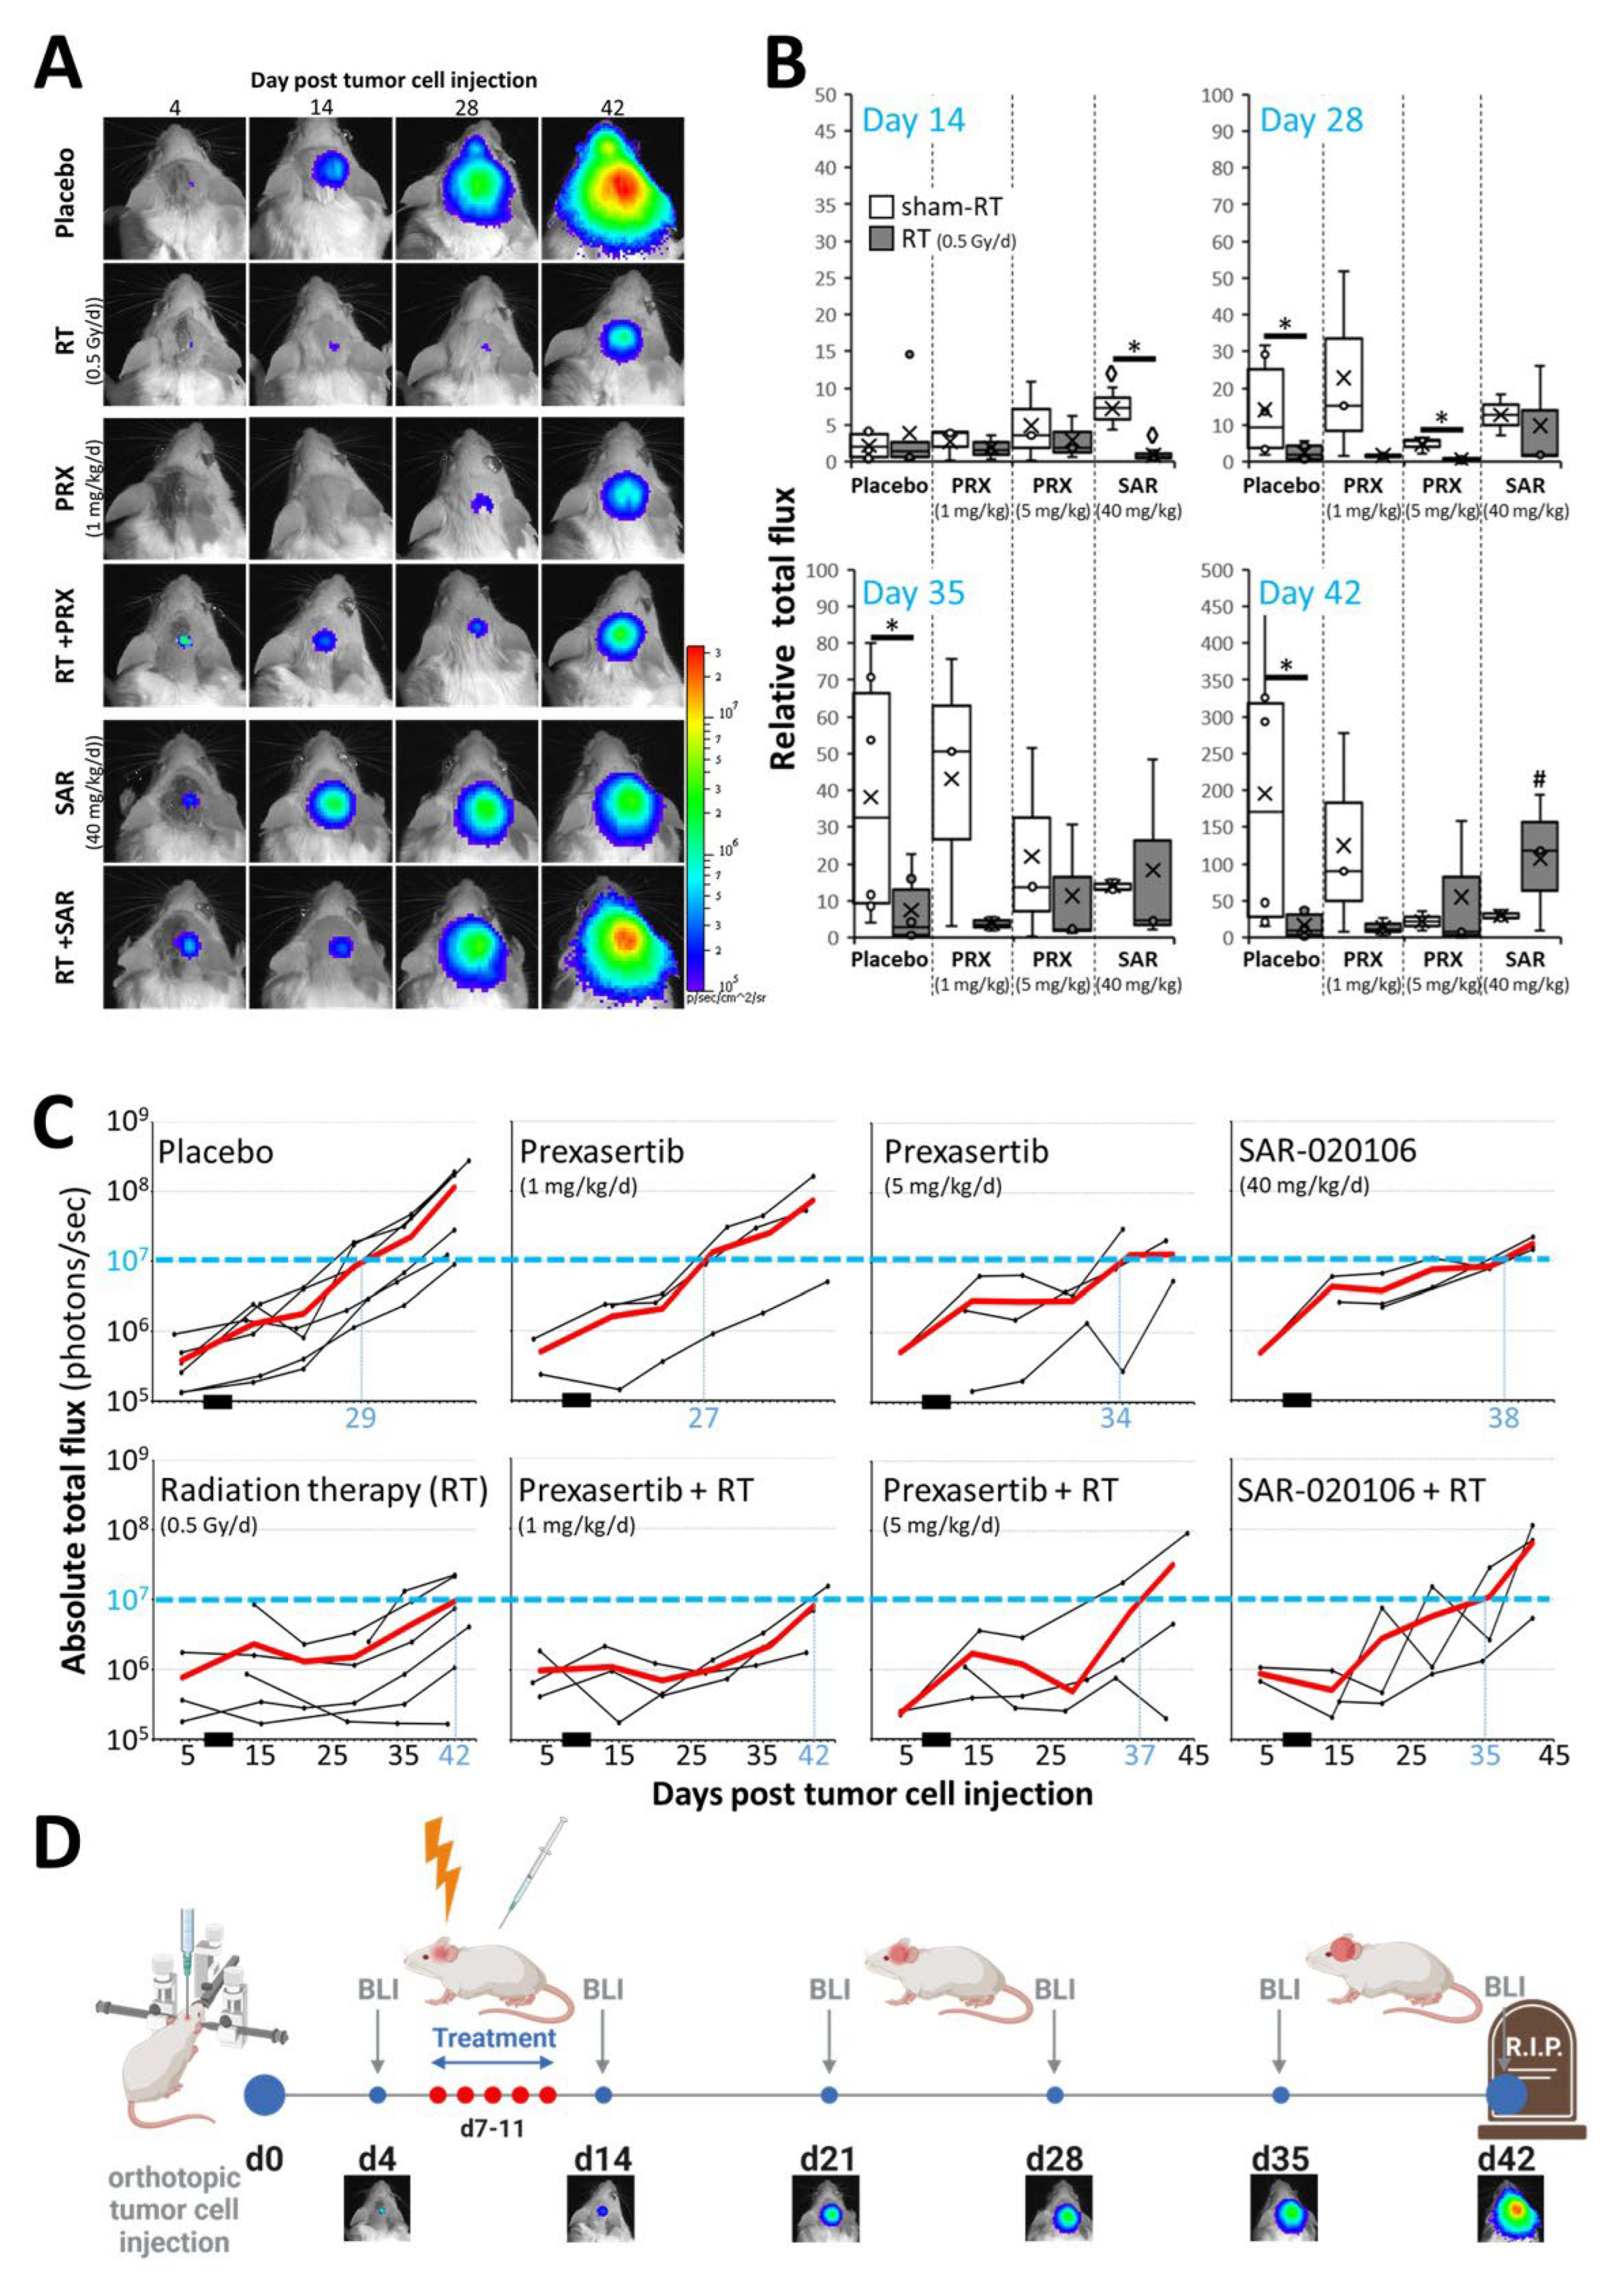
Figure 5.
Proliferation index of SHH/p53-mut MB four weeks after fractionated therapy (5x, daily) with PRX and RT (0.5 Gy/d). (A) Mean number of Ki-67-positive cells per field of view (FOV) in the most proliferative tumor area. Data present mean ± SEM from three mice with three analyzed FOVs. Statistical significance of RT over all groups is indicated by asterisks (*, p ≤ 0.05), statistical significance of single groups to placebo-treated group is indicated by hashtag (#, p ≤ 0.05). (B) Representative photographs of Ki-67-stained cells, 400-fold magnification, scale bars = 50 µm.
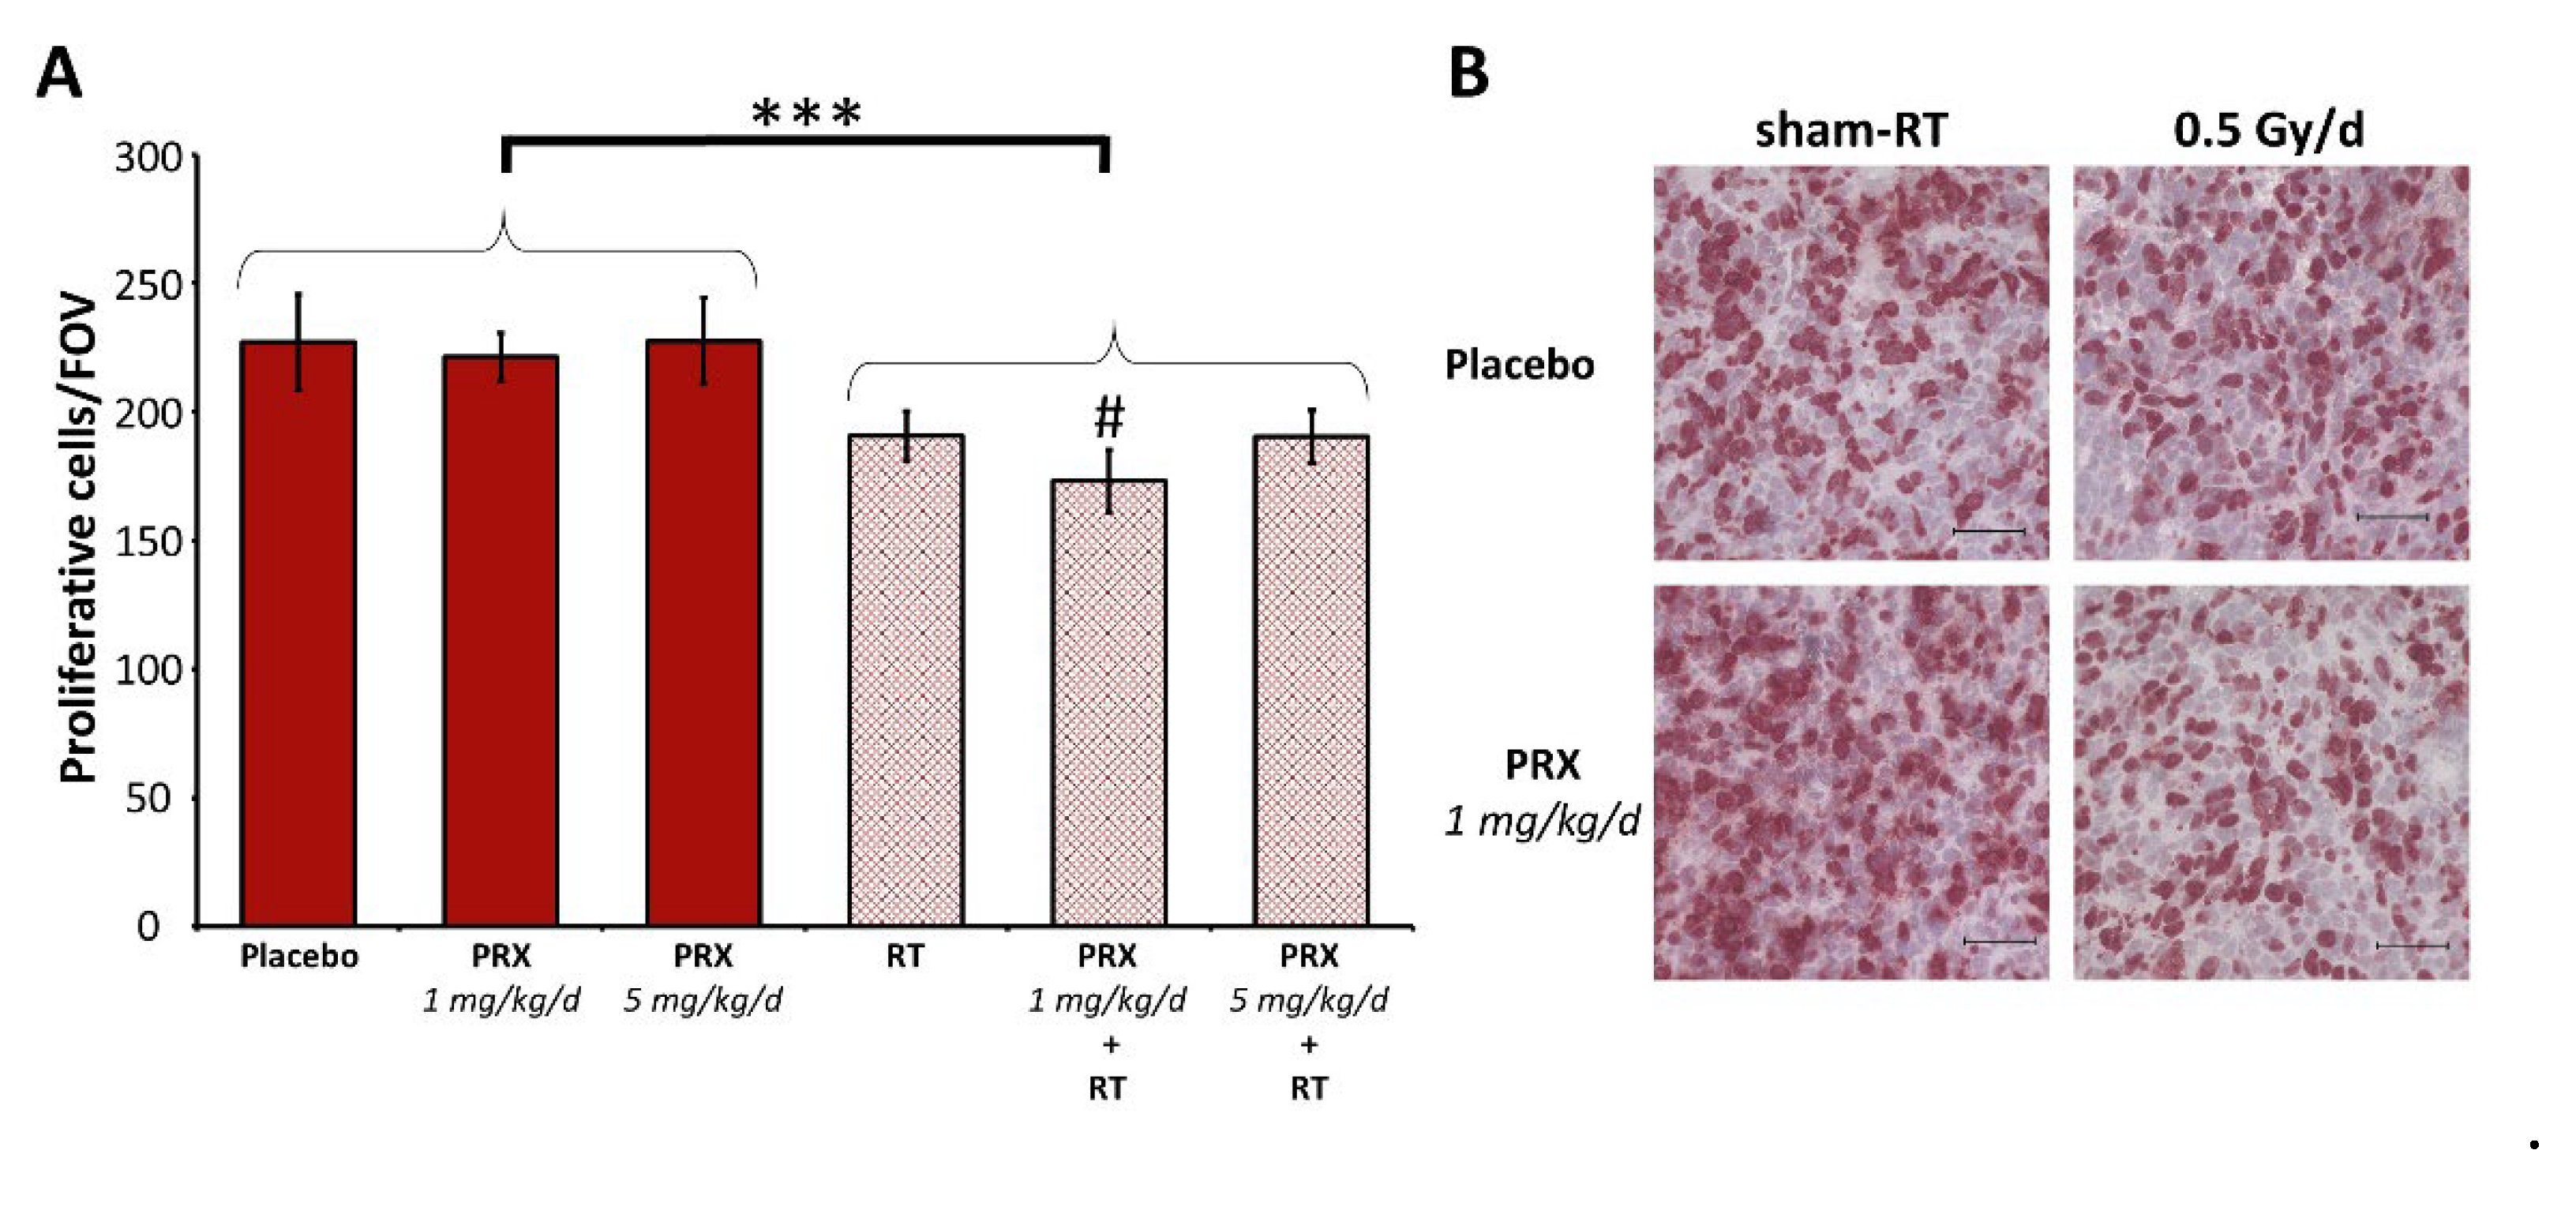
Figure 6.
Body weight and health condition of SHH/p53-mut MB-bearing mice before/during/after fractionated therapy (5x, daily) with PRX or SAR and RT. (A) Daily BW of single mice over time normalized to d0. Onset of bulky head is marked by yellow circle, necessity of analgesia is marked by green triangle. Treatment window is shaded in blue. (B) Photographs of MB-bearing mice over experimental period.
4. Conclusions
Our data emphasize the clinical benefit of integration of Chk-i in SHH/p53-mut MB therapy regimes including RT. This might hold true also in MYC-driven Group 3 MB, as MYC is a highly predictive marker for PRX sensitivity [14,51]. However, a great deal of attention should be taken on dosing regimens as high-dose Chk-i may compromise the RT effect on tumor growth possibly by inhibition of proliferation. We demonstrate for the first time the intracranial antitumor activity of the Chk1-specific inhibitor SAR in mouse.
Author Contributions
Conceptualization, A.G. and I.P.; validation, I.P.; formal analysis, Z.K. and I.P.; investigation, Z.K. and I.P.; writing—original draft preparation, Z.K. and I.P.; writing—review and editing, A.G. and RD.K.; visualization, Z.K. and I.P.; supervision, A.G. and RD.K.; project administration, I.P.; funding acquisition, I.P. All authors have read and agreed to the published version of the manuscript.
Funding
The project was funded by the Mitteldeutsche Kinderkrebsforschung.
Data Availability Statement
Dataset available on request from the authors.
Acknowledgments
We express our gratitude to Prof. Nicolay (Department of Radiation Oncology, University of Leipzig) for proof-reading the manuscript, Dr. Noreikat and all animal keepers (Animal facility of the Faculty of Medicine, University of Leipzig) for assistance with animal health monitoring, Dr. Witt and Dr. Kool (DKFZ Heidelberg/Germany) for providing the UW228 cell line and PDX cells, and PD Dr. Polte (Helmholtz Centre for Environmental Research Leipzig/Germany) for sharing BLI unit.
Conflicts of Interest
The authors declare no conflicts of interest.
References
- Ostrom QT, Price M, Ryan K, Edelson J, Neff C, Cioffi G et al. CBTRUS Statistical Report: Pediatric Brain Tumor Foundation Childhood and Adolescent Primary Brain and Other Central Nervous System Tumors Diagnosed in the United States in 2014-2018. Neuro Oncol 2022;24(Suppl 3):iii1-iii38. [CrossRef]
- Louis DN, Perry A, Wesseling P, Brat DJ, Cree IA, Figarella-Branger D et al. The 2021 WHO Classification of Tumors of the Central Nervous System: a summary. Neuro Oncol 2021;23(8):1231–51. [CrossRef]
- Zhukova N, Ramaswamy V, Remke M, Pfaff E, Shih DJH, Martin DC et al. Subgroup-specific prognostic implications of TP53 mutation in medulloblastoma. J Clin Oncol 2013;31(23):2927–35. [CrossRef]
- Waszak SM, Northcott PA, Buchhalter I, Robinson GW, Sutter C, Groebner S et al. Spectrum and prevalence of genetic predisposition in medulloblastoma: a retrospective genetic study and prospective validation in a clinical trial cohort. Lancet Oncol 2018;19(6):785–98. [CrossRef]
- Doz F, Milde T. AN INTERNATIONAL PROSPECTIVE TRIAL ON MEDULLOBLASTOMA (MB) IN CHILDREN OLDER THAN 3 TO 5 YEARS WITH WNT BIOLOGICAL PROFILE (PNET 5 MB - LR and PNET 5 MB - WNT-HR), AVERAGE-RISK BIOLOGICAL PROFILE (PNET 5 MB -SR), OR TP53 MUTATION, AND REGISTRY FOR MB OCCURRING IN THE CONTEXT OF GENETIC PREDISPOSITION: NCT02066220, SIOP PNET 5 MB. [June 14, 2023]; Available from: https://clinicaltrials.gov/ct2/show/NCT02066220.
- Chevignard M, Câmara-Costa H, Doz F, Dellatolas G. Core deficits and quality of survival after childhood medulloblastoma: a review. Neurooncol Pract 2017;4(2):82–97. [CrossRef]
- Castellino SM, Ullrich NJ, Whelen MJ, Lange BJ. Developing interventions for cancer-related cognitive dysfunction in childhood cancer survivors. J Natl Cancer Inst 2014;106(8). [CrossRef]
- Bucher N, Britten CD. G2 checkpoint abrogation and checkpoint kinase-1 targeting in the treatment of cancer. Br J Cancer 2008;98(3):523–8. [CrossRef]
- Tse AN, Carvajal R, Schwartz GK. Targeting checkpoint kinase 1 in cancer therapeutics. Clin Cancer Res 2007;13(7):1955–60. [CrossRef]
- King C, Diaz HB, McNeely S, Barnard D, Dempsey J, Blosser W et al. LY2606368 Causes Replication Catastrophe and Antitumor Effects through CHK1-Dependent Mechanisms. Mol Cancer Ther 2015;14(9):2004–13. [CrossRef]
- Zeng L, Beggs RR, Cooper TS, Weaver AN, Yang ES. Combining Chk1/2 Inhibition with Cetuximab and Radiation Enhances In Vitro and In Vivo Cytotoxicity in Head and Neck Squamous Cell Carcinoma. Mol Cancer Ther 2017;16(4):591–600. [CrossRef]
- Lowery CD, VanWye AB, Dowless M, Blosser W, Falcon BL, Stewart J et al. The Checkpoint Kinase 1 Inhibitor Prexasertib Induces Regression of Preclinical Models of Human Neuroblastoma. Clin Cancer Res 2017;23(15):4354–63. [CrossRef]
- Zeng L, Nikolaev A, Xing C, Della Manna DL, Yang ES. CHK1/2 Inhibitor Prexasertib Suppresses NOTCH Signaling and Enhances Cytotoxicity of Cisplatin and Radiation in Head and Neck Squamous Cell Carcinoma. Mol Cancer Ther 2020;19(6):1279–88. [CrossRef]
- Endersby R, Whitehouse J, Pribnow A, Kuchibhotla M, Hii H, Carline B et al. Small-molecule screen reveals synergy of cell cycle checkpoint kinase inhibitors with DNA-damaging chemotherapies in medulloblastoma. Sci Transl Med 2021;13(577). [CrossRef]
- Robinson GW. Evaluation of LY2606368 Therapy in Combination With Cyclophosphamide or Gemcitabine for Children and Adolescents With Refractory or Recurrent Group 3/Group 4 or SHH Medulloblastoma Brain Tumors: NCT04023669.
- Walton MI, Eve PD, Hayes A, Valenti M, Haven Brandon A de, Box G et al. The preclinical pharmacology and therapeutic activity of the novel CHK1 inhibitor SAR-020106. Mol Cancer Ther 2010;9(1):89–100. [CrossRef]
- Reader JC, Matthews TP, Klair S, Cheung K-MJ, Scanlon J, Proisy N et al. Structure-guided evolution of potent and selective CHK1 inhibitors through scaffold morphing. J Med Chem 2011;54(24):8328–42. [CrossRef]
- Borst GR, McLaughlin M, Kyula JN, Neijenhuis S, Khan A, Good J et al. Targeted radiosensitization by the Chk1 inhibitor SAR-020106. Int J Radiat Oncol Biol Phys 2013;85(4):1110–8. [CrossRef]
- Touchefeu Y, Khan AA, Borst G, Zaidi SH, McLaughlin M, Roulstone V et al. Optimising measles virus-guided radiovirotherapy with external beam radiotherapy and specific checkpoint kinase 1 inhibition. Radiother Oncol 2013;108(1):24–31. [CrossRef]
- Patties I, Kallendrusch S, Böhme L, Kendzia E, Oppermann H, Gaunitz F et al. The Chk1 inhibitor SAR-020106 sensitizes human glioblastoma cells to irradiation, to temozolomide, and to decitabine treatment. J Exp Clin Cancer Res 2019;38(1):420. [CrossRef]
- Patties I, Kortmann R-D, Glasow A. Inhibitory effects of epigenetic modulators and differentiation inducers on human medulloblastoma cell lines. J Exp Clin Cancer Res 2013;32(1):27. [CrossRef]
- Patties I, Kortmann R-D, Menzel F, Glasow A. Enhanced inhibition of clonogenic survival of human medulloblastoma cells by multimodal treatment with ionizing irradiation, epigenetic modifiers, and differentiation-inducing drugs. J Exp Clin Cancer Res 2016;35(1):94. [CrossRef]
- Oppermann H, Purcz K, Birkemeyer C, Baran-Schmidt R, Meixensberger J, Gaunitz F. Carnosine’s inhibitory effect on glioblastoma cell growth is independent of its cleavage. Amino Acids 2019;51(5):761–72. [CrossRef]
- Gringmuth M, Walther J, Greiser S, Toussaint M, Schwalm B, Kool M et al. Enhanced Survival of High-Risk Medulloblastoma-Bearing Mice after Multimodal Treatment with Radiotherapy, Decitabine, and Abacavir. Int J Mol Sci 2022;23(7). [CrossRef]
- Ramaswamy V, Remke M, Bouffet E, Faria CC, Perreault S, Cho Y-J et al. Recurrence patterns across medulloblastoma subgroups: an integrated clinical and molecular analysis. Lancet Oncol 2013;14(12):1200–7. [CrossRef]
- Lowery CD, Dowless M, Renschler M, Blosser W, VanWye AB, Stephens JR et al. Broad Spectrum Activity of the Checkpoint Kinase 1 Inhibitor Prexasertib as a Single Agent or Chemopotentiator Across a Range of Preclinical Pediatric Tumor Models. Clin Cancer Res 2019;25(7):2278–89. [CrossRef]
- Chaudhary R, Slebos RJC, Song F, McCleary-Sharpe KP, Masannat J, Tan AC et al. Effects of checkpoint kinase 1 inhibition by prexasertib on the tumor immune microenvironment of head and neck squamous cell carcinoma. Mol Carcinog 2021;60(2):138–50. [CrossRef]
- Manic G, Signore M, Sistigu A, Russo G, Corradi F, Siteni S et al. CHK1-targeted therapy to deplete DNA replication-stressed, p53-deficient, hyperdiploid colorectal cancer stem cells. Gut 2018;67(5):903–17. [CrossRef]
- Parmar K, Kochupurakkal BS, Lazaro J-B, Wang ZC, Palakurthi S, Kirschmeier PT et al. The CHK1 Inhibitor Prexasertib Exhibits Monotherapy Activity in High-Grade Serous Ovarian Cancer Models and Sensitizes to PARP Inhibition. Clin Cancer Res 2019;25(20):6127–40. [CrossRef]
- Nair J, Huang T-T, Murai J, Haynes B, Steeg PS, Pommier Y et al. Resistance to the CHK1 inhibitor prexasertib involves functionally distinct CHK1 activities in BRCA wild-type ovarian cancer. Oncogene 2020;39(33):5520–35. [CrossRef]
- Nie S, Wan Y, Wang H, Liu J, Yang J, Sun R et al. CXCL2-mediated ATR/CHK1 signaling pathway and platinum resistance in epithelial ovarian cancer. J Ovarian Res 2021;14(1):115. [CrossRef]
- Moureau S, Luessing J, Harte EC, Voisin M, Lowndes NF. A role for the p53 tumour suppressor in regulating the balance between homologous recombination and non-homologous end joining. Open Biol 2016;6(9). [CrossRef]
- Ma CX, Janetka JW, Piwnica-Worms H. Death by releasing the breaks: CHK1 inhibitors as cancer therapeutics. Trends Mol Med 2011;17(2):88–96. [CrossRef]
- Syljuåsen RG, Sørensen CS, Hansen LT, Fugger K, Lundin C, Johansson F et al. Inhibition of human Chk1 causes increased initiation of DNA replication, phosphorylation of ATR targets, and DNA breakage. Mol Cell Biol 2005;25(9):3553–62. [CrossRef]
- Sidi S, Sanda T, Kennedy RD, Hagen AT, Jette CA, Hoffmans R et al. Chk1 suppresses a caspase-2 apoptotic response to DNA damage that bypasses p53, Bcl-2, and caspase-3. Cell 2008;133(5):864–77. [CrossRef]
- Manzl C, Fava LL, Krumschnabel G, Peintner L, Tanzer MC, Soratroi C et al. Death of p53-defective cells triggered by forced mitotic entry in the presence of DNA damage is not uniquely dependent on Caspase-2 or the PIDDosome. Cell Death Dis 2013;4(12):e942. [CrossRef]
- Wang W, Macaulay RJB. Cell-cycle gene expression in lovastatin-induced medulloblastoma apoptosis. Can J Neurol Sci 2003;30(4):349–57. [CrossRef]
- Ditano JP, Eastman A. Comparative Activity and Off-Target Effects in Cells of the CHK1 Inhibitors MK-8776, SRA737, and LY2606368. ACS Pharmacol Transl Sci 2021;4(2):730–43. [CrossRef]
- Zhao H, Watkins JL, Piwnica-Worms H. Disruption of the checkpoint kinase 1/cell division cycle 25A pathway abrogates ionizing radiation-induced S and G2 checkpoints. Proc Natl Acad Sci U S A 2002;99(23):14795–800. [CrossRef]
- Campagne O, Davis A, Maharaj AR, Zhong B, Stripay J, Farmer D et al. CNS penetration and pharmacodynamics of the CHK1 inhibitor prexasertib in a mouse Group 3 medulloblastoma model. Eur J Pharm Sci 2020;142:105106. [CrossRef]
- Yang ES, Deutsch E, Mehmet A, Fayette J, Tao Y, Nabell L et al. A Phase 1b trial of prexasertib in combination with chemoradiation in patients with locally advanced head and neck squamous cell carcinoma. Radiother Oncol 2021;157:203–9. [CrossRef]
- Moore KN, Hong DS, Patel MR, Pant S, Ulahannan SV, Jones S et al. A Phase 1b Trial of Prexasertib in Combination with Standard-of-Care Agents in Advanced or Metastatic Cancer. Target Oncol 2021;16(5):569–89. [CrossRef]
- Lampert EJ, Cimino-Mathews A, Lee JS, Nair J, Lee M-J, Yuno A et al. Clinical outcomes of prexasertib monotherapy in recurrent BRCA wild-type high-grade serous ovarian cancer involve innate and adaptive immune responses. J Immunother Cancer 2020;8(2). [CrossRef]
- Iwasa S, Yamamoto N, Shitara K, Tamura K, Matsubara N, Tajimi M et al. Dose-finding study of the checkpoint kinase 1 inhibitor, prexasertib, in Japanese patients with advanced solid tumors. Cancer Sci 2018;109(10):3216–23. [CrossRef]
- Hong DS, Moore K, Patel M, Grant SC, Burris HA, William WN et al. Evaluation of Prexasertib, a Checkpoint Kinase 1 Inhibitor, in a Phase Ib Study of Patients with Squamous Cell Carcinoma. Clin Cancer Res 2018;24(14):3263–72. [CrossRef]
- Hong D, Infante J, Janku F, Jones S, Nguyen LM, Burris H et al. Phase I Study of LY2606368, a Checkpoint Kinase 1 Inhibitor, in Patients With Advanced Cancer. J Clin Oncol 2016;34(15):1764–71. [CrossRef]
- Lee J-M, Nair J, Zimmer A, Lipkowitz S, Annunziata CM, Merino MJ et al. Prexasertib, a cell cycle checkpoint kinase 1 and 2 inhibitor, in BRCA wild-type recurrent high-grade serous ovarian cancer: a first-in-class proof-of-concept phase 2 study. Lancet Oncol 2018;19(2):207–15. [CrossRef]
- Gatti-Mays ME, Karzai FH, Soltani SN, Zimmer A, Green JE, Lee M-J et al. A Phase II Single Arm Pilot Study of the CHK1 Inhibitor Prexasertib (LY2606368) in BRCA Wild-Type, Advanced Triple-Negative Breast Cancer. Oncologist 2020;25(12):1013-e1824. [CrossRef]
- Konstantinopoulos PA, Lee J-M, Gao B, Miller R, Lee J-Y, Colombo N et al. A Phase 2 study of prexasertib (LY2606368) in platinum resistant or refractory recurrent ovarian cancer. Gynecol Oncol 2022. [CrossRef]
- Cash T, Fox E, Liu X, Minard CG, Reid JM, Scheck AC et al. A phase 1 study of prexasertib (LY2606368), a CHK1/2 inhibitor, in pediatric patients with recurrent or refractory solid tumors, including CNS tumors: A report from the Children’s Oncology Group Pediatric Early Phase Clinical Trials Network (ADVL1515). Pediatr Blood Cancer 2021;68(9):e29065. [CrossRef]
- Di Giulio S, Colicchia V, Pastorino F, Pedretti F, Fabretti F, Di Nicolis Robilant V et al. A combination of PARP and CHK1 inhibitors efficiently antagonizes MYCN-driven tumors. Oncogene 2021;40(43):6143–52. References must be numbered in order of appearance in the text (including citations in tables and legends) and listed individually at the end of the manuscript. We recommend preparing the references with a bibliography software package, such as EndNote, ReferenceManager or Zotero to avoid typing mistakes and duplicated references. Include the digital object identifier (DOI) for all references where available. [CrossRef]

Table 1.
Analysis parameters (BZ-II analyzer, Keyence) for fluorescent double-staining of EdU/gH2AX.
Table 1.
Analysis parameters (BZ-II analyzer, Keyence) for fluorescent double-staining of EdU/gH2AX.
| Nuclei | EdU | gH2AX | |
| Fluorochrome | DAPI | Alexa Fluor 488 | Alexa Fluor 568 |
| Area description | Target area 200-500 µm² |
Extraction area 1 EdU-positive/negative nuclei |
Extraction area 2 0.1-2 µm² |
| Selected color | Blue | Green | Red |
| Extraction settings | |||
| Threshold | 10 Smoothed edges |
30 Smoothed edges |
40 |
| Adjust/Correct area | Separate areas Value = 100 |
Fill cracks Value = 10 |
Separate areas Value = 100 |
Disclaimer/Publisher’s Note: The statements, opinions and data contained in all publications are solely those of the individual author(s) and contributor(s) and not of MDPI and/or the editor(s). MDPI and/or the editor(s) disclaim responsibility for any injury to people or property resulting from any ideas, methods, instructions or products referred to in the content. |
© 2024 by the authors. Licensee MDPI, Basel, Switzerland. This article is an open access article distributed under the terms and conditions of the Creative Commons Attribution (CC BY) license (http://creativecommons.org/licenses/by/4.0/).
Copyright: This open access article is published under a Creative Commons CC BY 4.0 license, which permit the free download, distribution, and reuse, provided that the author and preprint are cited in any reuse.


