Submitted:
10 July 2024
Posted:
11 July 2024
You are already at the latest version
Abstract
This paper explores the application of machine learning in financial time series analysis, focusing on predicting trends in financial enterprise stocks and economic data. It begins by distinguishing stocks from stocks and elucidates risk management strategies in the stock market. Traditional statistical methods such as ARIMA and exponential smoothing are discussed in terms of their advantages and limitations in economic forecasting. Subsequently, the effectiveness of machine learning techniques, particularly LSTM and CNN-BiLSTM hybrid models, in financial market prediction is detailed, highlighting their capability to capture nonlinear patterns in dynamic markets. The study demonstrates the advancements in predictive accuracy and robustness achieved by deep learning methods through empirical analysis and model validation. The findings contribute significantly to academic discourse and offer practical insights for investors, financial analysts, and policymakers navigating market volatility and optimizing investment strategies. Finally, the paper outlines prospects for machine learning in financial forecasting, laying a theoretical foundation and methodological framework for achieving more precise and reliable economic predictions.
Keywords:
Machine learning
; Financial time series analysis
; LSTM
; CNN-BiLSTM hybrid models
; Stock market prediction
1. Introduction
Stocks represent ownership stakes in corporations issued to raise capital, entitling holders to residual profits and assets after debt obligations are fulfilled, alongside voting rights proportional to their shareholdings. Unlike stocks with fixed maturity dates, stocks do not expire as long as the issuing company remains solvent. Stocks guarantee fixed returns specified in the contract, whereas stock returns are variable and contingent upon corporate profitability and asset value. [1] This distinction underscores the inherent risk associated with stocks, where investors face uncertainty regarding dividends and capital gains contingent upon the company’s financial performance. In contrast to risk-free stocks, which promise predictable returns albeit with default risk, there are no risk-free stocks. Stockholders assume greater risk due to fluctuating dividends and market prices, contingent upon broader economic conditions and company-specific factors. Thus, managing stock market risks involves strategies to mitigate volatility and uncertainty, aligning investment goals with risk tolerance and market dynamics.
Therefore, this paper is based on machine learning time series forecasting in artificial intelligence, focusing on predicting trends in financial enterprise stocks and economic data. By leveraging advanced algorithms such as recurrent neural networks [2] (RNNs) and long short-term memory networks [3] (LSTMs), this study aims to enhance predictive accuracy and robustness in forecasting stock market movements and economic indicators. Integrating AI into time series analysis offers unprecedented opportunities to capture complex patterns and dependencies in financial data., enabling more informed decision-making and risk management strategies.
Through empirical analysis and model validation, this research explores the effectiveness of machine learning techniques in capturing the nonlinear and dynamic nature of financial markets. Insights gained from this study contribute to academic discourse and have practical implications for investors, financial analysts, and policymakers seeking to navigate volatile market conditions and optimize investment strategies. By harnessing AI’s predictive capabilities, this paper aims to advance the understanding and application of machine learning in financial forecasting, paving the way for more accurate and reliable predictions in real-world economic scenarios.
2. Related Work
2.1. Traditional Time Series Analysis Method
Traditional statistical methods have long been employed to forecast financial stocks and economic data because of their interpretability and historical reliability. Techniques such as the Autoregressive Integrated Moving Average (ARIMA) [4] model and exponential smoothing methods are notable examples. ARIMA models are adept at capturing linear trends and seasonality in time series data, making them suitable for predicting economic indicators with clear patterns over time. However, they may struggle with non-linear relationships and not fully capture sudden changes or irregular data trends.
Exponential smoothing methods, on the other hand, are effective in capturing short-term fluctuations and smoothing out noise in time series data [5]. They excel in scenarios where recent observations are more critical for forecasting than distant historical data points. Despite their strengths, these methods can be limited by their assumption of stationary data and may not adequately handle complex, non-stationary economic data.
2.1.1. Advantages and Limitations:
The strengths of traditional statistical methods lie in their interpretability and well-established theoretical foundations. They provide insights into economic variables’ underlying trends and patterns, aiding decision-making processes. However, these methods may struggle with adapting to sudden changes or outliers in data, which are common in dynamic economic environments. Moreover, the assumption of linearity and stationarity can limit their effectiveness in capturing the full complexity of real-world financial data.
2.1.2. Visual Aids
Visual aids such as time series plots, trendlines, and seasonal decomposition charts can be included to enhance understanding. Time series plots visually represent how a variable changes over time, highlighting trends, seasonality, and anomalies [6]. Trendlines help illustrate long-term patterns, while seasonal decomposition charts break down the time series into trend, seasonal, and residual components, aiding in identifying cyclical patterns.
In summary, while traditional statistical methods have been foundational in economic forecasting, their limitations in handling non-linear and dynamic relationships have prompted the exploration of more advanced techniques, including machine learning models. The following sections will delve into how machine learning, particularly multivariate time series models, addresses these challenges and offers new opportunities for improving the accuracy and robustness of economic and financial predictions.
2.2. Application of Machine Learning to Financial Forecasting
Time series model: For multidimensional time series data, time series models in machine learning such as ARIMA, LSTM, GRU, etc. can be used for modeling and prediction. These models capture temporal relationships between data to make predictions about future trends.
- (1)
- LSTM (Long Short-Term Memory)
LSTM is a special type of recurrent neural network (RNN). Unlike traditional neural networks, RNNS have a cyclic structure that allows information to flow continuously through the network. This allows RNNS to retain information over a long period theoretically. In practice, however, standard RNNS have trouble capturing long-term dependencies. LSTM was designed to solve this problem.
The core idea of LSTM is the "cell state" - a line of information that continually flows through a network. This cellular state is like a conveyor belt, from the beginning of the network to the end [7,8]. The LSTM can add or remove information on the conveyor belt, ensuring that only relevant information is retained, and irrelevant information is forgotten.
To achieve this, LSTM uses three important "gate" structures: forget gate, input gate, and output gate. These gates determine what information should be forgotten, what information should be stored in the cell state, and what information should be displayed in the output.
LSTM Architecture
The LSTM architecture consists of a single unit, the memory unit (also known as the LSTM unit). The LSTM unit includes four feedforward neural networks. Each network has input and output layers, with connections from input neurons to all output neurons.
Figure 1.
The basic network architecture of RNN.

Three of the four feedforward neural networks are responsible for selecting information. They are the forgotten door, the input door, and the output door [9]. These three gates are used to perform three typical memory management operations: deleting information from memory (forgetting gate), inserting new information into memory (input gate), and using information stored in memory (output gate).
Excellent performance in handling nonlinear relationships and large-scale data. LSTM, through its unique memory unit structure, can efficiently capture long-term dependencies and is not susceptible to gradient disappearance or gradient explosion, which gives it an advantage when dealing with long sequence data and complex time dependencies. In financial market forecasting, LSTM can automatically learn and adapt to nonlinear patterns and complex market behavior in the data, thereby improving the accuracy and robustness of the forecast. [10] By learning time dependencies and volatility patterns in data, LSTM can capture long-term trends in stock prices and market indices while also being able to identify and respond to short-term fluctuations and unexpected events.
In predicting financial market fluctuations and trends, the effect of LSTM is mainly reflected in its ability to deal with complex non-linear relationships and dynamic market environments. Compared to traditional linear models or simple time series methods, LSTM can better adapt to changing patterns and behaviors in financial markets. Its ability lies in efficiently using historical data and external influences through multi-level feature learning and memory mechanisms to provide more accurate and dynamic prediction results. [11] This capability makes LSTM a powerful tool in financial forecasting, helping investors and analysts better understand market dynamics and make more informed investment decisions.
- (2)
- ARIMA model
ARIMA is a statistical analysis model that predicts future values based on past values, a time series method. It is a combination of AR models (Autoregressive Model) and MA models (Moving Average model), in addition to the differential part (I, Integrated), Therefore, ARIMA is a three-part Model, which can be translated as the Autoregressive Integrated Moving Average Model (ARIMA).
The model contains three parameters, denoted as p,d, and q respectively, where p is the order of the autoregressive model (time lag),d is the degree of difference (the number of times the data subtracted from past values), and q is the order of the moving average model, all of which are subjective and non-negative. This is mostly used for non-seasonal ARIMA models, so it is usually expressed as ARIMA (p,d,q).
The ARIMA model consists of three basic components:
- AR (autoregressive): This component uses a linear combination of observations from past time steps to predict the value of the current time step. The degree of AR determines the number of time steps we can retrace.
- I (integral): This component smooths the data by capturing differences in the series. This smooths out the trend of the data series and makes the model a better fit.
- MA (Moving average): This component uses a linear combination of error terms for past time steps to estimate the value of the current time step. The degree of MA determines the degree of backtracking of past error terms.
Among them, the calculation formula of the MA model shows that it focuses on the difference between the current and past values to capture the change in the time series. In contrast, the AR model only describes the correlation between the time series and the past observed value, it does not capture the fluctuation over time like the MA model [12].
The AR model recognizes that history and the future are similar. The past law of history continues to the future and appears in its historical characteristics. Still, this model does not reflect the sudden accident well on the historical data; the noisy data generated cannot consider the factors brought by the sudden accident in the past and use it in the prediction.
On the other hand, MA models can capture the unexpected factors that cause the fluctuations, but they cannot replicate the historical trends as AR models can.
The combination of the two is to overcome each other’s shortcomings so that the characteristics of history will continue to be reflected in future forecasts. At the same time, the accidental factors received in the past will also bring certain fluctuations in the future. However, they are first combined into an ARMA model, and compared with the ARIMA model, the difference is missing. It is easy to use ARMA if the data is stable, but it often shows that the data is not. [13] The ARIMA model is suitable for relatively stable and trended time series data and can capture seasonal and cyclical changes to a certain extent. However, due to its assumption of linear data relationships and stable variance, ARIMA’s performance in handling complex nonlinear fluctuations and unexpected events in financial markets may be limited, especially when dynamically adapting to market-changed nonlinear relationships is significant.
- (3)
- Neural network(CNN)
The neural network model is a powerful machine learning model that can effectively deal with complex nonlinear relationships and large-scale data. Through multi-level neuronal structures and nonlinear activation functions, neural networks can learn and express complex patterns and higher-order features in data to adapt to various data distributions and complex relationships. In financial market forecasting, neural network models such as multi-layer perceptrons (MLPS) [14] , convolutional neural networks (CNNS), and recurrent neural networks (RNNS) can improve the accuracy and generalization of predictions by learning nonlinear patterns and market dynamics in historical data. The ability of neural networks lies in their flexible structure and strong learning ability, which can automatically extract and utilize important features in the data, thus achieving remarkable results in predicting financial market fluctuations and trends.
Although neural network models perform well in handling nonlinear relationships and large-scale data, they also face challenges and limitations. For example, neural networks require a large amount of data to train and have high requirements for data quality and pre-processing to avoid overfitting or underfitting problems. In addition, the training process of neural networks can be time-consuming, especially when dealing with large data sets that require high-performance computing resources. In the financial market prediction, the application of a neural network model also needs to consider the market’s complexity and the data’s uncertainty, as well as the generalization ability and stability of the model. In summary, neural network models provide new perspectives and tools for financial market prediction through their powerful nonlinear modeling capabilities and data-driven methods and provide more accurate and comprehensive analytical support for investment decision-making and risk management.
2.3. Time Series and Financial Forecasting
With the continuous development of machine learning technology, the application of machine learning in the financial field has also made remarkable progress. These applications improve the prediction accuracy and simplify the application process of traditional models. In this paper, we will list some effective applications of machine learning technology in the financial field from the aspects of factor extraction, missing value filling, fusion input, noise reduction, and non-independent co-distributed adaptation to help readers better understand the current situation of machine learning in the financial field [15]. Although the optimization of stock portfolios based on machine learning has been improved, because of the complexity and uncertainty of the stock market, improving prediction accuracy further and optimizing portfolio strategy are still the focus of current and future research.
In asset pricing, researchers face the challenge of too many factors. These factors are variables used to predict asset returns, which can sometimes number in the hundreds, complicating models and raising concerns about overfitting and explainability. To solve this problem, dimensionality reduction techniques become very important. The main goal of dimensionality reduction is to distill many factors into a more manageable and representative set.
In recent years, autoencoder-based models have attracted much attention in the dimensionality reduction of financial data. The researchers used autoencoders to learn the underlying asset pricing factors and simultaneously model asset pricing characteristics and excess returns. Variational autoencoders (VAEs) can extract meaningful factors from noisy market data by introducing probabilistic distortions in the coding process. [16] FactorVAE addresses the challenge of low signal-to-noise ratios in financial data by combining dynamic factor models (DFM) with the VAE framework, thereby leveraging factors as potential variables to enhance asset pricing models. In addition, Diffusional (D-Va) combines a hierarchical VAE structure and diffusion technology to efficiently process random stock data to ensure accurate and noise-free forecasts. The development of these dimensionality reduction techniques has allowed researchers to manage better and utilize factors, thereby improving the accuracy and interpretability of asset pricing models.
With the development of machine learning technology, new methods are provided to deal with the problem of missing values in financial data. A coupled matrix decomposition method is proposed to populate the missing analyst earnings forecast data, which enhances the missing analyst data with company characteristic data and uses the populated values to make company return forecasts. Other jobs use Transformer models to fill in missing company characteristics. In addition, tensor-filling methods have been applied in finance to fill in patio-temporal data and show obvious potential. Although some efforts have been made in this area, research is still relatively limited. Advanced deep learning methods can introduce nonlinear and patio-temporal interactions to fill in missing values in financial data.
2.4. Stock Forecasting-Related Tasks
Before delving into the details of deep learning models, we will first define four key stock market prediction tasks and outline the concepts associated with each task [17]. These tasks include stock price forecasting, stock trend forecasting, portfolio management, and trading strategies, and these categories summarise most existing stock market forecasting tasks.
- Stock price forecasting uses time series data to predict the future value of stocks and financial assets traded on exchanges. The goal of this forecast is to achieve a healthy profit. In addition, various factors also affect the forecasting process, including psychological factors and rational and irrational behavior, all of which work together to make stock prices dynamic and volatile.
- Portfolio management involves the strategic selection and oversight of a collection of investments aimed at achieving financial objectives, which aims to allocate resources in a way that maximizes returns while minimizing risk [20].
- A trading strategy is a set of pre-established guidelines and standards used to make trading decisions, and it is a systematic approach to buying and selling stocks. Trading strategies can range from simple to complex, with factors such as investment style (e.g., value vs growth), market cap, technical indicators, fundamental analysis, level of portfolio diversification, risk tolerance, and leverage all considered.
In the stock market prediction task using deep learning, common trading strategies include event-driven, data-driven, and strategy optimization, and the above tasks revolve around the stock market prediction process [21]. Figure 2 illustrates the prediction process to understand the deep learning-based approach fully. The first step involves processing input data, including stock data, charts, and text, and then selecting and collecting relevant stock features. The next step is to input extracted features into the deep learning model for training, and finally, the experimental results of the model are analyzed.
3. Methodology
In recent years, applying advanced machine learning techniques to financial time series analysis has garnered significant attention due to their potential to uncover intricate patterns and improve prediction accuracy. Among these techniques, the combination of Convolutional Neural Networks (CNNs) and Long Short-Term Memory networks (LSTMs), known as CNN-LSTM models, has proven particularly effective. This approach leverages CNNs to extract spatial features from input data and LSTMs to capture temporal dependencies. It is well-suited for analyzing multivariate time series data such as stock prices and economics.
3.1. Model Discussion
The CNN- BiLSTM LSTM model integrates two powerful neural network architectures:
-
Convolutional Neural Networks (CNNs):
- -
- CNNs are adept at learning spatial hierarchies of features through convolutional layers.
- -
- In the context of multivariate time series, CNNs can be applied to extract spatial patterns across different variables (e.g., multiple stock prices, economic indicators) at each time step.
-
Long Short-Term Memory networks (LSTMs):
- -
- LSTMs are well-suited for modeling temporal dependencies by maintaining long-term memory of sequential data.
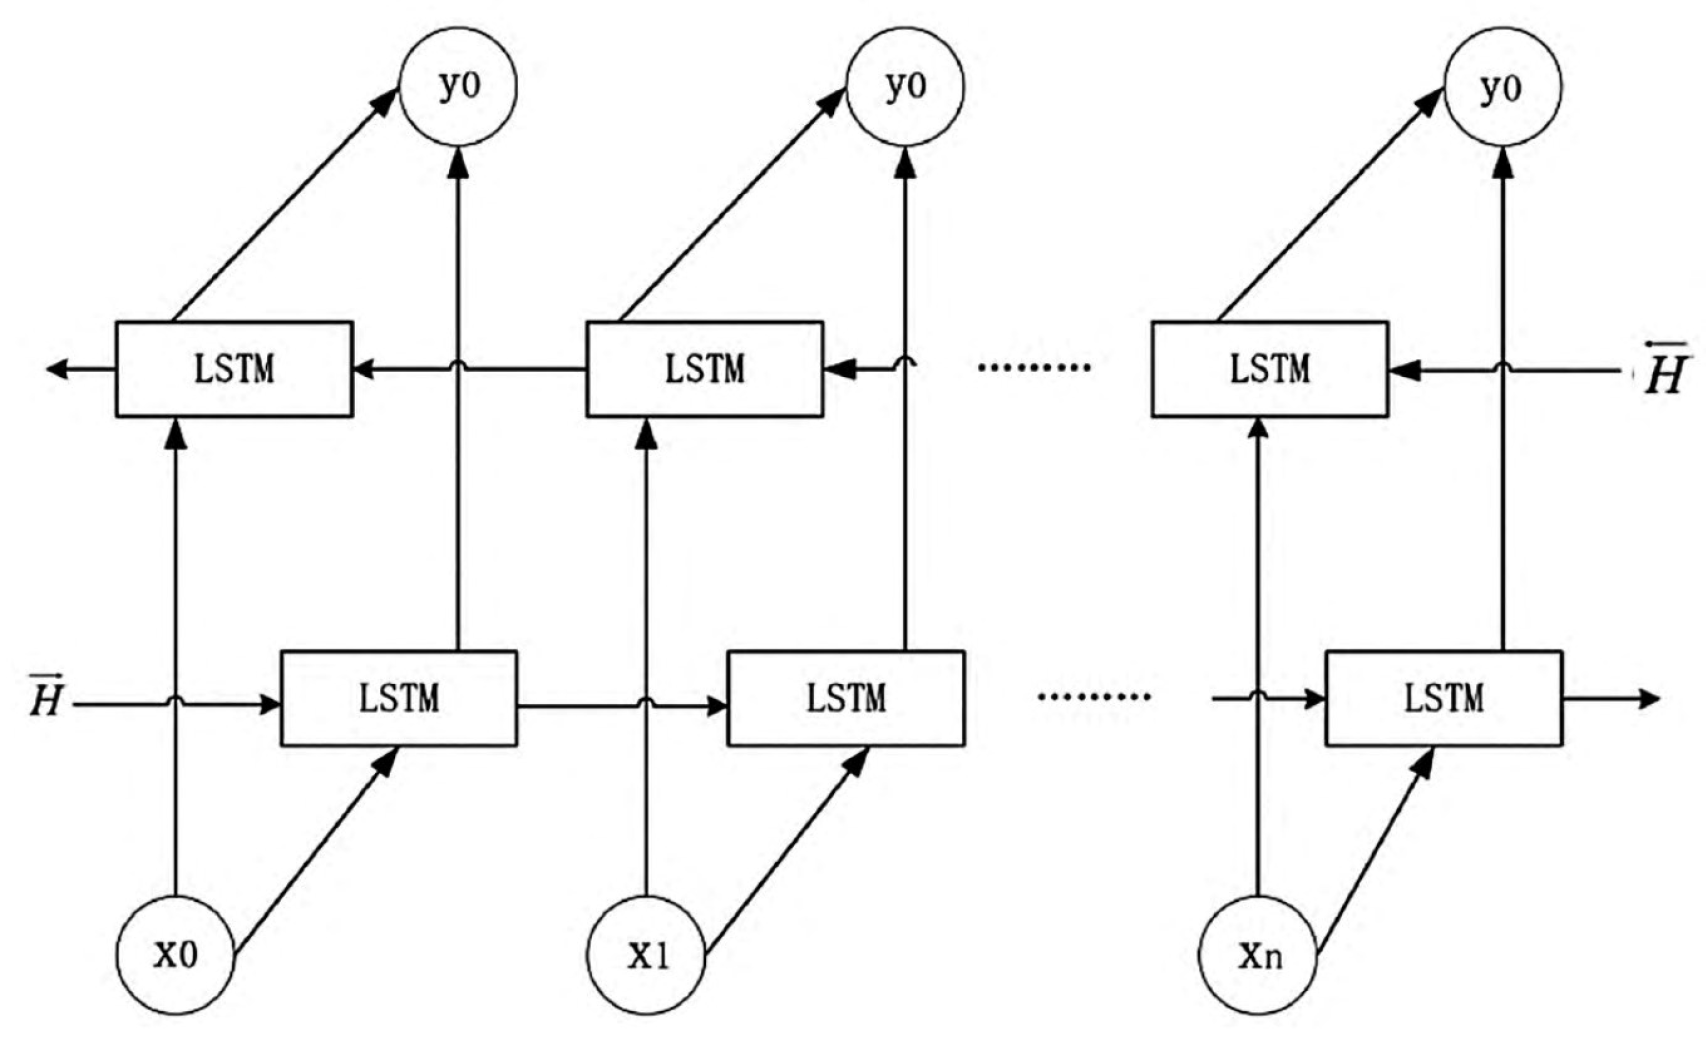
- BiLSTM: Based on the cell structure of LSTM, the LSTM historical model has stronger historical information screening ability and chronological order learning ability, and can rationally use the input historical data information to form long-term memory of historical data information in the past period, thus avoiding the problem that effective historical information cannot be stored permanently due to the influence of continuous input historical data. Since data processing depends on the direction of network connection, Bi-directional Long Short-Term Memory (BiLSTM) is introduced for events that need to consider the impact of future data on historical data. The model can reference the influence of both historical and future data on the predicted results.
Figure 3.
BiLSTM expansion structure based on LSTM.
The First Step is Data Preprocessing
The data is preprocessed first, including the processing of missing and duplicate values, and then normalized. After the processing is completed, the data is divided into a test set and a training set. In the second step, model construction inputs the training set data into the CNN model through the construction of the convolution layer and pooling layer of CNN for feature extraction and then through the BiLSTM model for sequence prediction, during which the number of layers, batch size and other model parameters of the neural network are adjusted. Step three: update the weights. The attention mechanism is used to increase the weight value of the extracted features and update the weight. Finally, the CNN-BiLSTM-Attention model was constructed, and the test set data was input to verify the model’s accuracy.
3.2. Data Processing
In this experiment, the stock data of the People’s Bank of China were studied, and the research results were compared with the LSTM model (LSTM-ATTENTION), the convolutional neural network, and the bidirectional long and short memory neural network mixed model (CNN-BiLSTM), and the single long and short memory neural network model (LSTM). It is concluded that the CNN-BiLSTM-Attention model has a good effect.
Due to the problems of data missing and data duplication in the obtained data, please
The data needs to be preprocessed. The method of averaging adjacent data is adopted to process the missing data, and the duplicate data is deleted. Due to the large difference in the results of the stock data, the data needs to be normalized before being input into the neural network model using 0-1 normalization. The calculation method is as follows:
x is the original sample data value; min is the minimum value in the sample data.max indicates the maximum value in the sample data.
3.3. Test Data and Methods
The input of the neural network is the data closely related to the trading of the stock, and the output is the closing price, which predicts the close of the next trading day’s price. This paper downloads experimental data from Tushara’s official website. It selects the data of People’s Bank of America Stock (stock code 000001) from January 1, 2005, to October 4, 2021, of which 80% is used as the training set and 20% is used as the test set. The data set includes the opening price (open), closing price (close), highest price (high), lowest price (low), yesterday’s closing price (pre-close), rise and fall (amount), rise and fall (change), turnover rate (rate), volume (volume), transaction amount (business) s), volume weighted average price (price) these basic trading data.
Since the stock data has the characteristics of time series, how many windows should be selected
In this paper, the window size is n, and roll is selected. The window size is 1, and MAE comparisons of different window lengths are selected 5 times. See Table 1.
Table 1 shows that when the window size is 5, the MAE value is larger than the step size. When the selection is 15, the MAE value is also relatively large, and when the selection step is 10, the average absolute error value is the smallest, so the optimal window size is selected Select 10.
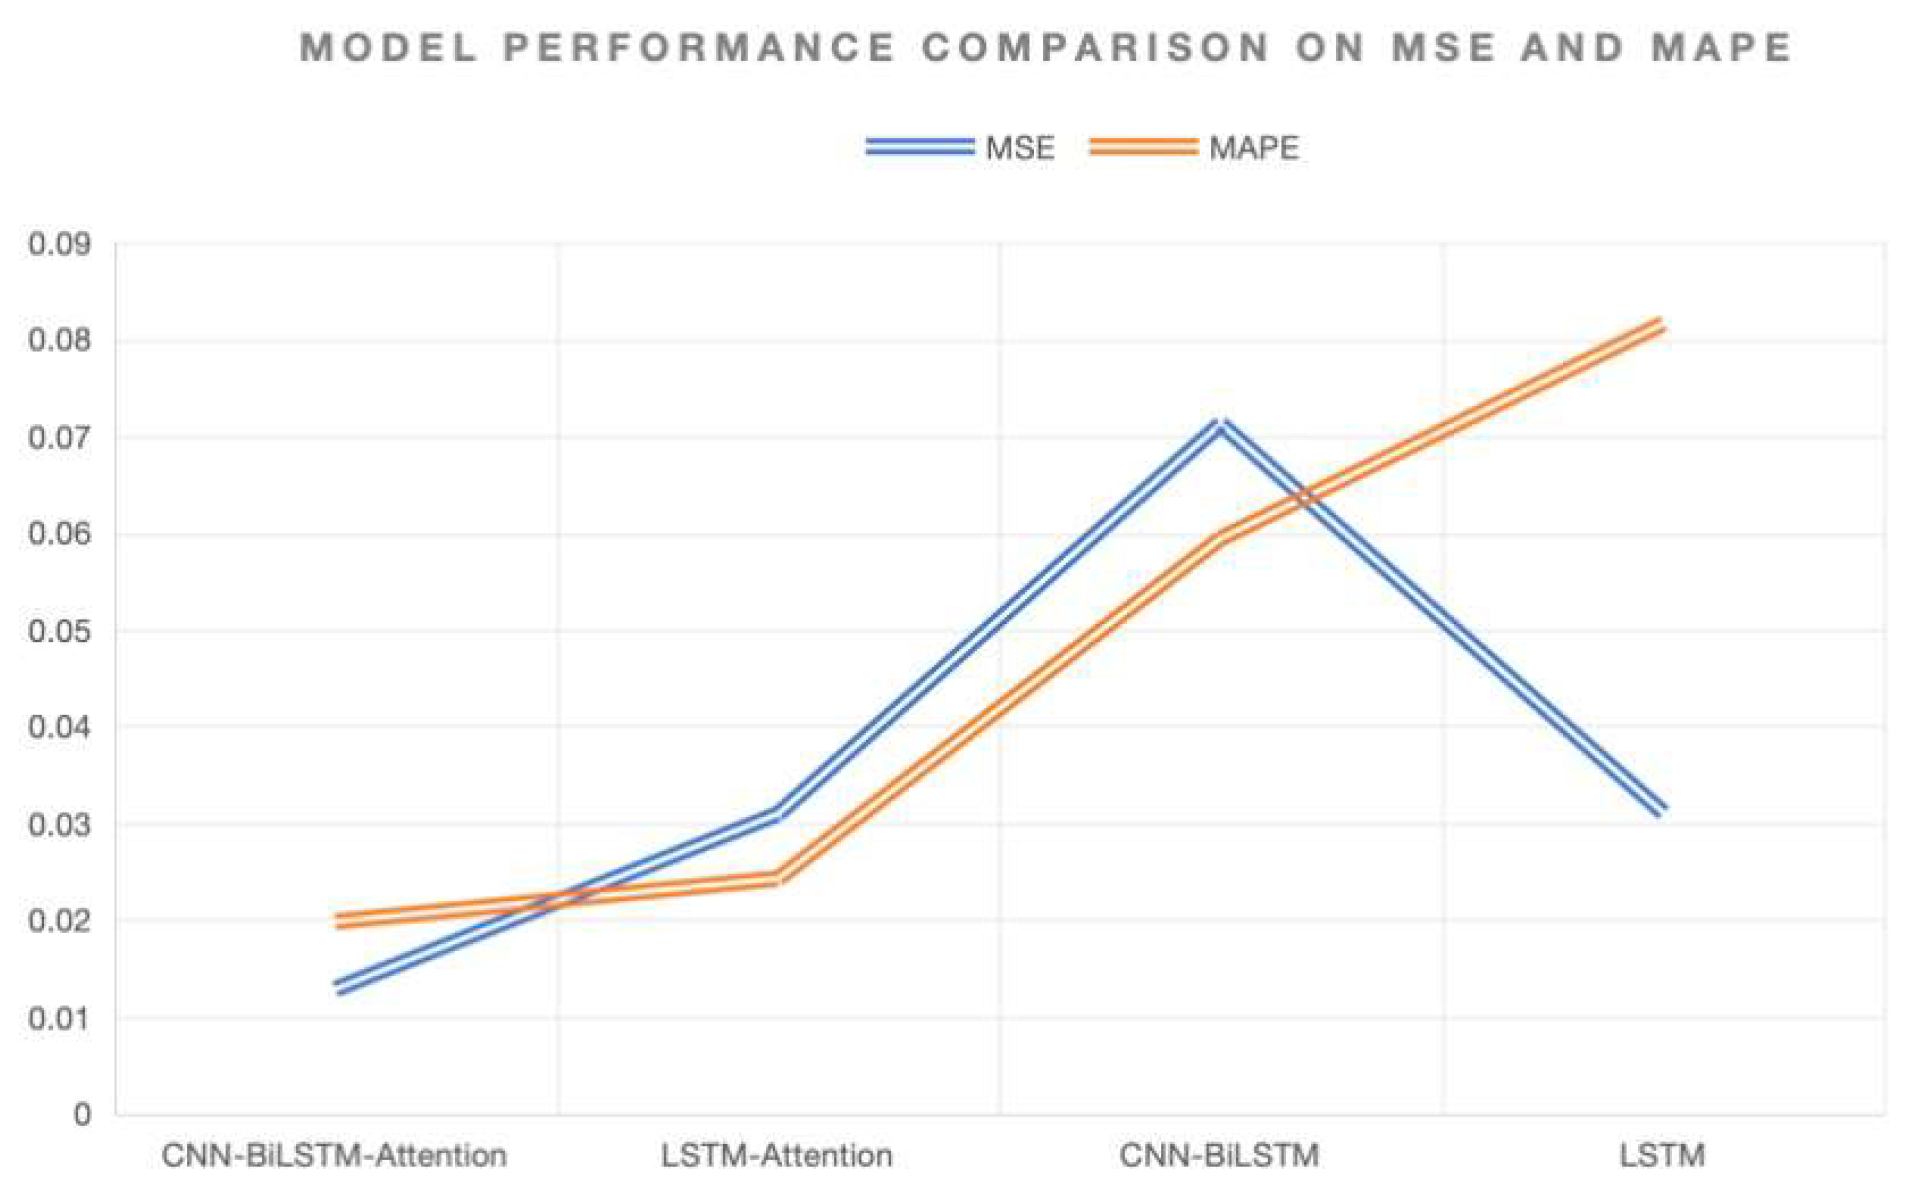
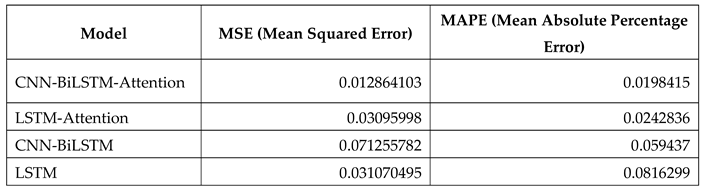
To verify the high accuracy of the model, different algorithms are used for comparison, and the comparison results are shown in Table 2.
As can be seen from Table 2, compared with the LSTM hybrid model, the overall trend is better, while the new hybrid model CNNBiLSTM-Attention model MSE is 0.012864103, MAPE is 0.01984150. It has higher reliability than previous models.
Figure 4.
Evaluation of Model Accuracy: MSE vs MAPE.
3.4. Experimental Design
By comparing the performance of the attention-based convolutional neural network and bidirectional long and short-memory neural network mixed models with traditional statistical methods, we draw the following conclusions:
- Improved prediction accuracy: Experimental results show that the new hybrid model significantly improves the accuracy of predicting changes in stock prices. Compared with traditional statistical methods, the model performs better on several evaluation indicators, such as mean square and absolute percentage errors.
- Effectiveness of feature extraction: Using convolutional neural networks (CNNs) for feature extraction can effectively capture spatial information in the input data, which is particularly important for analyzing multivariate time series. These extracted features help improve the subsequent model’s predictive power (BiLSTM).
- Timing modeling of BiLSTM models: Bidirectional Long and short memory neural networks (BiLSTM) perform well in processing time series data, effectively capturing long and short-term timing dependencies, thereby improving the robustness and accuracy of predictions.
- Addition of attention mechanisms: The introduction of attention mechanisms further improves the model’s performance. The attention mechanism can make the model pay more attention to essential time steps or features in the learning and prediction process, thus effectively improving the accuracy and stability of prediction.
- Technical support for quantitative trading: This improved hybrid model not only significantly improves the prediction accuracy but also has the feasibility of practical application and can provide more reliable technical support for financial applications such as quantitative trading.
The hybrid CNN-BiLSTM-Attention model demonstrates clear advantages in processing financial time series data and predicting quantitative transactions.
4. Conclusions
Based on the considerations for long-term stability and reliable forecasting in stock markets, it is evident that short-term stock price predictions can inadvertently promote short-sighted investor behavior. This tendency undermines the market’s long-term stability and hampers its sustainable growth. Developing robust long-term forecasting models that incorporate multiple influencing factors is crucial to counteract this. These models should transcend the immediate fluctuations and provide insights contributing to a more stable and predictable market environment.
Furthermore, as China’s capital markets continue to undergo reforms and development, a significant imperative remains to refine market institutions through ongoing exploration. This includes comprehensive advancements in the registration system reform to enhance marketization levels effectively. The aim is to stabilize long-term expectations and foster a healthy and steady trajectory for capital market development. Achieving high-quality development in China’s distinctive modern capital market requires a sustained commitment to these principles, ensuring a balanced approach that supports long-term investor confidence and economic resilience.
References
- Colladon, Andrea Fronzetti, and Giacomo Scettri. "Look inside. Predicting stock prices by analyzing an enterprise intranet social network and using word co-occurrence networks." International Journal of Entrepreneurship and Small Business36.4 (2019): 378-391. [CrossRef]
- Choudhury, M.; Li, G.; Li, J.; Zhao, K.; Dong, M.; Harfoush, K. (2021, September). Power Efficiency in Communication Networks with Power-Proportional Devices. 2021 IEEE Symposium on Computers and Communications (ISCC); pp. 1–6. IEEE. [CrossRef]
- Yang, T.; Xin, Q.; Zhan, X.; Zhuang, S.; Li, H. ENHANCING FINANCIAL SERVICES THROUGH BIG DATA AND AI-DRIVEN CUSTOMER INSIGHTS AND RISK ANALYSIS. J. Knowl. Learn. Sci. Technol. Issn: 2959-6386 2024, 3, 53–62. [CrossRef]
- Shi, Y.; Li, L.; Li, H.; Li, A.; Lin, Y. Aspect-Level Sentiment Analysis of Customer Reviews Based on Neural Multi-task Learning. J. Theory Pr. Eng. Sci. 2024, 4, 1–8. [CrossRef]
- Yuan, J., Lin, Y., Shi, Y., Yang, T., & Li, A. (2024). Applications of Artificial Intelligence Generative Adversarial Techniques in the Financial Sector. Academic Journal of Sociology and Management, 2(3), 59-66. [CrossRef]
- Jiang, W.; Qian, K.; Fan, C.; Ding, W.; Li, Z. Applications of generative AI-based financial robot advisors as investment consultants. Appl. Comput. Eng. 2024, 67, 28–33. [CrossRef]
- Ding, W., Zhou, H., Tan, H., Li, Z., & Fan, C. (2024). Automated Compatibility Testing Method for Distributed Software Systems in Cloud Computing.
- Fan, C.; Li, Z.; Ding, W.; Zhou, H.; Qian, K. Integrating artificial intelligence with SLAM technology for robotic navigation and localization in unknown environments. Appl. Comput. Eng. 2024, 67, 22–27. [CrossRef]
- Guo, L., Li, Z., Qian, K., Ding, W., & Chen, Z. (2024). Bank Credit Risk Early Warning Model Based on Machine Learning Decision Trees. Journal of Economic Theory and Business Management, 1(3), 24-30. [CrossRef]
- Li, Z.; Fan, C.; Ding, W.; Qian, K. Robot Navigation and Map Construction Based on SLAM Technology. World J. Innov. Mod. Technol. 2024, 7, 8–14. [CrossRef]
- Fan, C.; Ding, W.; Qian, K.; Tan, H.; Li, Z. Cueing Flight Object Trajectory and Safety Prediction Based on SLAM Technology. J. Theory Pr. Eng. Sci. 2024, 4, 1–8. [CrossRef]
- Ding, W.; Tan, H.; Zhou, H.; Li, Z.; Fan, C. Immediate traffic flow monitoring and management based on multimodal data in cloud computing. Appl. Comput. Eng. 2024, 71, 1–6. [CrossRef]
- Qian, K., Fan, C., Li, Z., Zhou, H., & Ding, W. (2024). Implementation of Artificial Intelligence in Investment Decision-making in the Chinese A-share Market. Journal of Economic Theory and Business Management, 1(2), 36-42. [CrossRef]
- Lin, Y.; Li, A.; Li, H.; Shi, Y.; Zhan, X. GPU-Optimized Image Processing and Generation Based on Deep Learning and Computer Vision. J. Artif. Intell. Gen. Sci. (JAIGS) ISSN:3006-4023 2024, 5, 39–49. [CrossRef]
- Shi, Y.; Yuan, J.; Yang, P.; Wang, Y.; Chen, Z. Implementing intelligent predictive models for patient disease risk in cloud data warehousing. Appl. Comput. Eng. 2024, 67, 34–40. [CrossRef]
- Cui, Z.; Lin, L.; Zong, Y.; Chen, Y.; Wang, S. Precision gene editing using deep learning: A case study of the CRISPR-Cas9 editor. Appl. Comput. Eng. 2024, 64, 134–141. [CrossRef]
- Haowei, M.; Ebrahimi, S.; Mansouri, S.; Abdullaev, S.S.; Alsaab, H.O.; Hassan, Z.F. CRISPR/Cas-based nanobiosensors: A reinforced approach for specific and sensitive recognition of mycotoxins. Food Biosci. 2023, 56. [CrossRef]
- Xu, Q., Xu, L., Jiang, G., & He, Y. (2024, June). Artificial Intelligence In Risk Protection For Financial Payment Systems. In The 24th International scientific and practical conference “Technologies of scientists and implementation of modern methods”(June 18–21, 2024) Copenhagen, Denmark. International Science Group. 2024. 431 p. (p. 344). [CrossRef]
- Huang, S., Diao, S., Zhao, H., & Xu, L. (2024, June). The Contribution Of Federated Learning To Ai Development. In The 24th International scientific and practical conference “Technologies of scientists and implementation of modern methods”(June 18–21, 2024) Copenhagen, Denmark. International Science Group. 2024. 431 p. (p. 358). [CrossRef]
- Zhan, X., Ling, Z., Xu, Z., Guo, L., & Zhuang, S. (2024). Driving Efficiency and Risk Management in Finance through AI and RPA. Unique Endeavor in Business & Social Sciences, 3(1), 189-197.
- Bao, W.; Xiao, J.; Deng, T.; Bi, S.; Wang, J. The Challenges and Opportunities of Financial Technology Innovation to Bank Financing Business and Risk Management. Financial Eng. Risk Manag. 2024, 7, 82–88. [CrossRef]
- Xu, L., Gong, C., Jiang, G., & Yang, H. (2024, June). A Study On Personalized Web Page Recommendation Based On Natural Language Processing And Its Impact On User Browsing Behavior. In The 24th International scientific and practical conference “Technologies of scientists and implementation of modern methods”(June 18–21, 2024) Copenhagen, Denmark. International Science Group. 2024. 431 p. (p. 317).
- Wang, B.; He, Y.; Shui, Z.; Xin, Q.; Lei, H. Predictive optimization of DDoS attack mitigation in distributed systems using machine learning. Appl. Comput. Eng. 2024, 64, 95–100. [CrossRef]
- Dhand, A.; Lang, C.E.; Luke, D.A.; Kim, A.; Li, K.; McCafferty, L.; Mu, Y.; Rosner, B.; Feske, S.K.; Lee, J.-M. Social Network Mapping and Functional Recovery Within 6 Months of Ischemic Stroke. Neurorehabilit. Neural Repair 2019, 33, 922–932. [CrossRef]
- Allman, R.; Mu, Y.; Dite, G.S.; Spaeth, E.; Hopper, J.L.; Rosner, B.A. Validation of a breast cancer risk prediction model based on the key risk factors: family history, mammographic density and polygenic risk. Breast Cancer Res. Treat. 2023, 198, 335–347. [CrossRef]
Figure 2.
The Processing Framework.
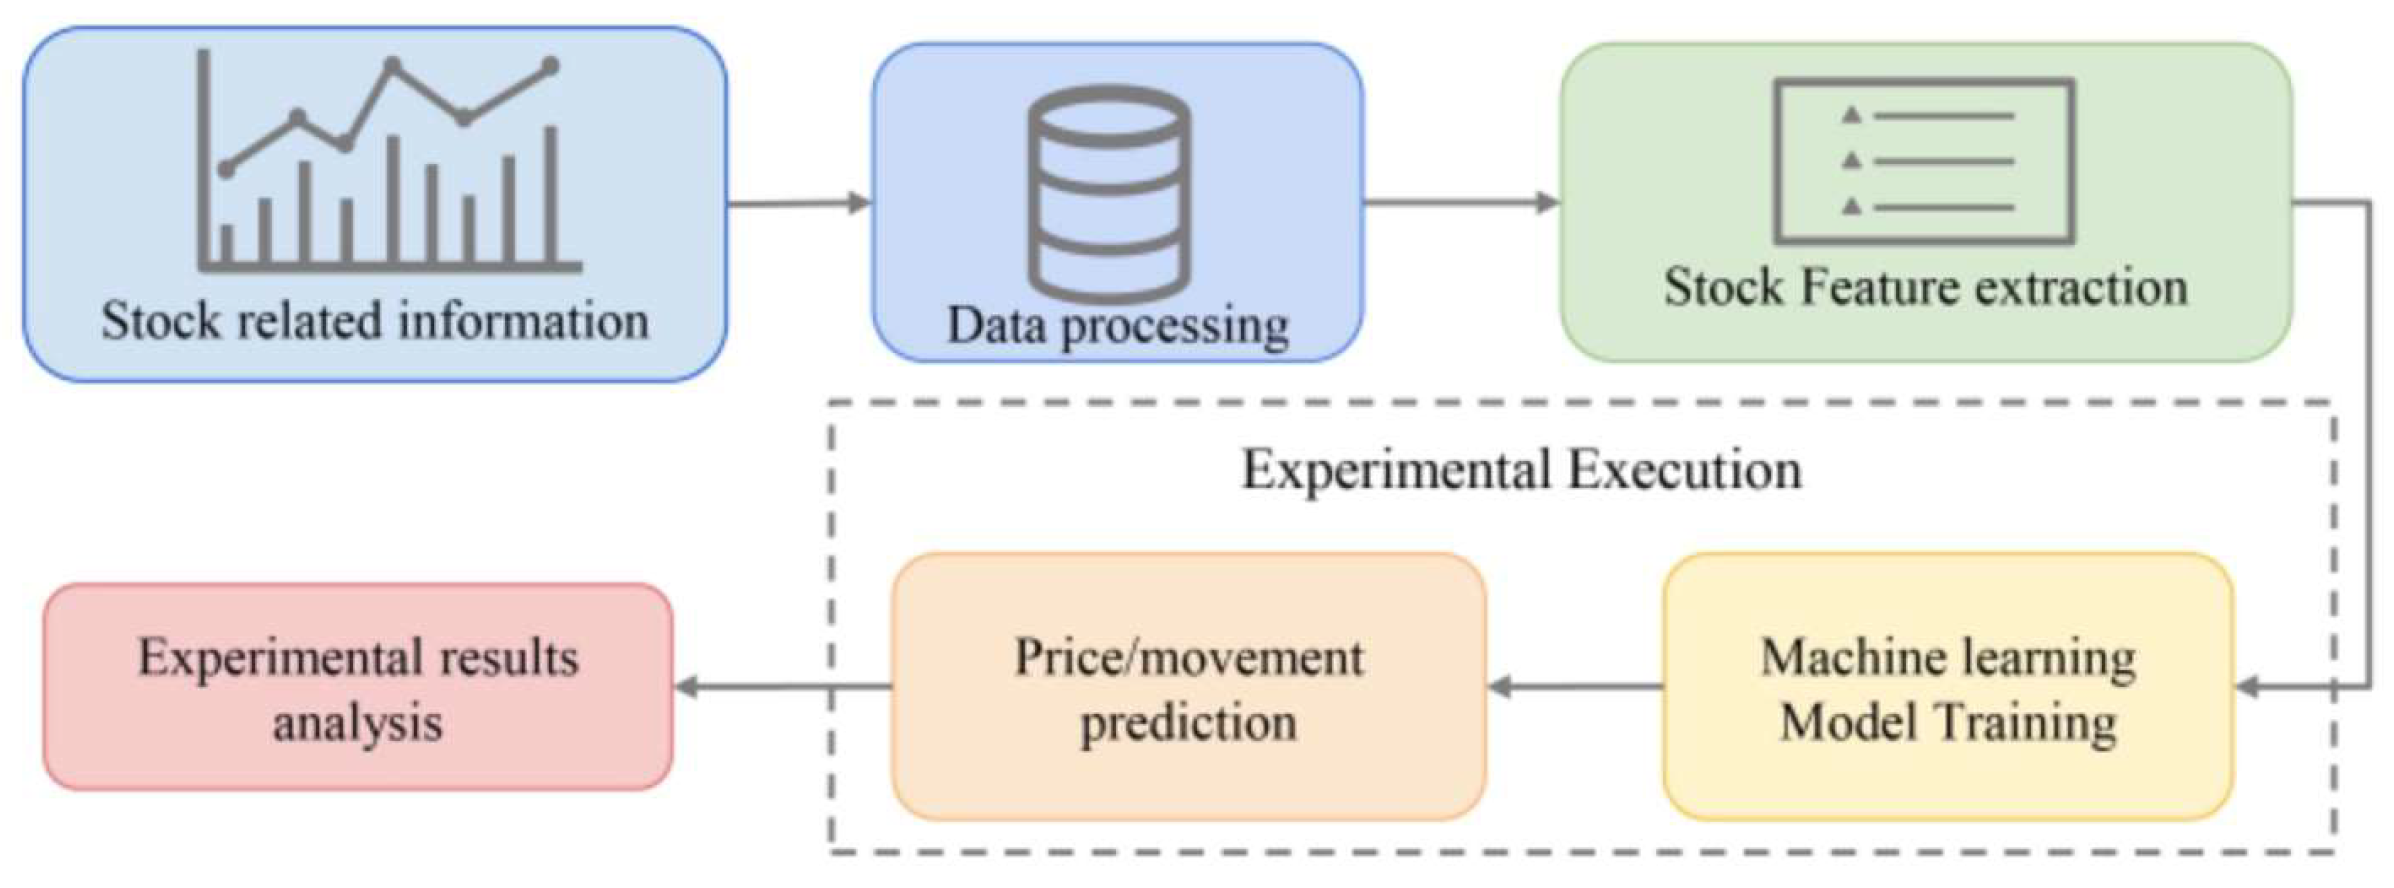

Table 1.
Comparison of results of different sliding window sizes.
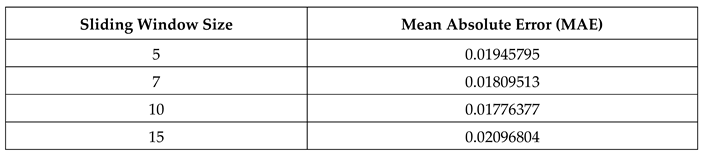
Table 2.
Comparison of predictions from different models.
Disclaimer/Publisher’s Note: The statements, opinions and data contained in all publications are solely those of the individual author(s) and contributor(s) and not of MDPI and/or the editor(s). MDPI and/or the editor(s) disclaim responsibility for any injury to people or property resulting from any ideas, methods, instructions or products referred to in the content. |
© 2024 by the authors. Licensee MDPI, Basel, Switzerland. This article is an open access article distributed under the terms and conditions of the Creative Commons Attribution (CC BY) license (http://creativecommons.org/licenses/by/4.0/).
Copyright: This open access article is published under a Creative Commons CC BY 4.0 license, which permit the free download, distribution, and reuse, provided that the author and preprint are cited in any reuse.


