

Submitted:
09 July 2024
Posted:
11 July 2024
You are already at the latest version
Abstract
Market crises pose significant challenges for businesses, emphasizing the importance of effective crisis management strategies. Central to these strategies is the ability to identify and retain loyal customers, who often serve as the bedrock of stability during tumultuous times. This paper investigates the application of deep meta-learning analysis to predict loyal customers as a cornerstone of market crisis management. Drawing upon an extensive literature review, the study explores previous research on market crises, customer loyalty, and the evolution of deep learning and meta-learning in crisis management contexts. Methodologically, the paper outlines data collection, model development, and evaluation procedures tailored for deep meta-learning-based customer prediction. In results, the overall accuracy of model 85%, a precision 0.88, recall 0.82, and F1-score 0.85 were obtained. The analysis demonstrates the effectiveness of deep meta-learning models in accurately identifying loyal customers during market crises, offering insights into their performance and applicability compared to traditional methods. Practical implications include potential applications in crisis management for businesses and considerations for real-world implementation.

Keywords:
market crisis
; deep learning
; prediction model
1. Introduction
Market crises are an unavoidable fact in the ever-changing global markets, capable of disrupting economies, enterprises, and people. These crises, originating from many factors such as economic recessions, geopolitical conflicts, natural calamities, or unforeseen circumstances, present significant obstacles for organizations, necessitating flexible and efficient crisis management techniques to navigate through turbulent periods [1]. An essential component for the effectiveness of these techniques is the capacity to recognize and maintain faithful clients, who act as foundations of stability and assistance during times of turmoil [2].
The market has experienced significant changes, which have been influenced by advancements in information technology. These changes have created new opportunities for understanding and also presented challenges for the growth of the internet, paid online learning platforms, and information technology [3]. Marketing strategies were primarily conventional before the rise of the internet phenomenon. Marketing research utilized surveys, interviews, and sales volume data to monitor market fluctuations and infer patterns in consumer behavior [4]. Researchers receive customer feedback directly, which allows them to formulate hypotheses on consumer beliefs, intentions, determinants, and behaviors. Predictive analytics is an influential technology that enables organizations to leverage vast amounts of data in order to forecast future events, trends, market crisis, and behaviors [5]. Big data is characterized as the continuously expanding amount, variety, speed, and intricacy of data generated in the modern digital environment, as stated by [6]. Big data sets are generated by analyzing customers’ online purchase behavior, website clicks, social media activity logs, smart connected devices, geo-location features, and other relevant information [7]. The widespread availability of digital data and the internet has enabled enterprises to utilize big data for a more comprehensive understanding of consumer behavior and preferences. Consumer behavior is the examination of individuals, groups, or entities to comprehend their decision-making process in choosing, acquiring, utilizing, and discarding products, services, experiences, or ideas [8].
Predictive analytics employs statistical algorithms and machine learning techniques to forecast potential market crisis trends, events, and client behaviors in the future by analyzing past data. Predictive analytics is being employed by a growing range of sectors, such as marketing, finance, retail, and healthcare, to get a deeper comprehension of consumer behavior and preferences [9]. Machine learning (ML) is being utilized in marketing research to investigate customer behavior, market crises, and analysis issues. Machine learning enables the creation of predictive models and the identification of non-linear patterns in data [10]. In the field of machine learning, problems can be categorized as either supervised or unsupervised models. The available models consist of decision trees, random forests, support vector machines, neural networks, logistic regression, and clustering or regression models [11]. Prior studies have employed machine learning (ML) to detect high-risk customers for retention efforts, predict and understand customer attrition using classification algorithms such as Random Forest, and analyze consumer behavior using improved radial basis function classifiers and oversampling technique. Deep Markov models and neural networks have been employed to forecast market crises and online purchasing behavior [12].
The goal of this study is to create a user-friendly predictive analytics model tailored for small and medium-sized enterprises. This model will facilitate efficient examination of market crisis management, forecast purchasing trends based on customer data, and enable customization of marketing and product strategies. This initiative aims to address the complexities arising from digital disruption and evolving consumer behavior.
2. Related Studies
2.1. Customer Behavior
Customer behavior encompasses the actions and decisions made by individuals, communities, and organizations as they seek, get, utilize, and discard goods and services in order to fulfill their preferences [12]. The Pareto principle, sometimes known as the 80/20 rule, asserts that 20% of consumers are responsible for 80% of sales. This highlights the importance of retaining and nurturing existing clientele. Marketers must conduct market research and engage in product creation in order to meet the needs of customers and promote repeat purchases [13]. Post-purchase experiences serve as crucial measures of client satisfaction. While certain consumers depend on personal expertise for making prompt selections, others demand additional information and interaction, demonstrating different levels of consumer interest and product information needs. Various social, psychological, and personal aspects influence purchase decisions [14]. Cultural diversity significantly impacts consumer behavior, leading to robust associations with products and services that align with unique cultural identities. Consumers rely on opinion leaders and reference bodies to seek assistance, which then impacts their purchase decisions. Various personal aspects, such as age, life stage, career, financial condition, personality, lifestyle, and values, have an impact on internet shopping decisions [15]. Consumer behavior is significantly influenced by personal circumstances such as variations in budget, inflation, and unemployment. According to Alyahya et al. (2023) consumer engagement and purchase behaviors are influenced by major aspects such as anchoring, product messaging, live media, demand incentive, and customer attitudes [16]. Figure 1 represents the factors influencing the customer behaviour.
Psychological elements, such as perception, motives, learning, personality traits, memory, and knowledge, exert a significant influence. The findings of Zabukovsek et al. (2023) indicate that personal qualities exert the most significant impact on consumer purchasing behavior in Egypt, whereas culture has the least significant influence [8]. Consumer behavior continues to be unpredictable, exhibiting variations even among individuals who are evaluating the same product. Understanding the different elements that influence consumer behavior is crucial for devising efficient strategies for crisis management in marketing [17].
2.2. Data-Driven Marketing
Data-driven marketing has become popular due to firms placing importance on utilizing consumer and marketing data to make informed decisions and develop products. This includes incorporating marketing analytics and digitalization into marketing operations [18]. Data-driven marketing is essential for creating an effective marketing plan as it optimizes the use of client information. The process involves collecting intricate data from both offline and online sources, which is then analyzed to obtain a more profound comprehension of customers [19]. Marketers can develop and implement highly personalized marketing strategies by utilizing the data that has been gathered and analyzed to gain a deeper understanding of the psychology and purchasing patterns of their intended customer base [20]. Therefore, companies that implement data-driven marketing tactics may effectively create a rapport with their intended audience, cultivating trust and loyalty that ultimately results in more sales and steady revenue. There is a widespread consensus that technology plays a pivotal part in the development of predictive models, as firms are progressively relying on data to strategize and forecast customer needs [20]. These approaches can help firms develop customer-centric procedures to attract and retain customers. Data possess the capacity to identify demands and influencing factors at all stages of the decision-making process. Data-driven marketing strategies primarily aim to utilize internal and external data to facilitate the development of novel products and services [21]. Furthermore, this approach ensures improved productivity and user satisfaction, while also aiding in customer acquisition and retention. This approach has the potential to eventually lead to savings or decreased costs, as well as enhanced production and efficiency for the organization. The extensive scope and profound nature of data-driven marketing have the capacity to fundamentally transform the marketing paradigm [22].
2.3. Predictive Analytics and Deep Learning
Jabłońska & Zajdel, (2020) examine the identification of customer behavior by combining artificial neural networks with conventional survey data. Their study demonstrates that artificial neural networks get superior classification results compared to classical discriminant analysis when survey data is used [23]. Although the dataset is short, neural networks show strong detection rates inside the desired category and seem to be useful in evaluating data that is not part of the original sample. As a result, they are becoming a viable option for improving marketing tactics and optimizing decision-making processes. In the study conducted by Chornous & Fareniuk (2022), a predictive model is created to determine the acquisition of cloud services using several parameters [24]. This model utilizes a random forest methodology that is trained using criteria such as the sequence of clicked advertising, prior cloud service subscriptions, and other pertinent data. The proposed methodology utilizes a carefully calibrated advertisement log dataset to provide customers with highly precise projections [24]. There are five important aspects that affect consumers’ choices when it comes to acquiring cloud services. These factors include the location of the client, the volume of ad clicks, the order in which ads are displayed, historical purchase patterns, and techniques for managing market crises [25].
3. Methodology
3.1. Data Collection and Preprocessing of Customer Data During Market Crises
Data collection involves gathering relevant customer data during market crises from various sources such as transaction records, customer feedback, and market sentiment analysis. This data is then pre-processed to ensure quality and consistency, including steps such as handling missing values, removing outliers, and standardizing numerical features. Additionally, during market crises, special attention is given to the timeliness and accuracy of data collection to capture real-time market dynamics and customer behaviors.
3.2. Data Analysis Software and Tools
This work primarily utilizes the Python programming language, specifically version 3.9.16, for analysis in a Jupyter notebook environment. Python’s extensive libraries and adaptability make it a superb option for data analysis, machine learning, and predictive modeling applications. In addition, the Jupyter notebook functioned as a dynamic computing environment, facilitating the smooth incorporation of code, graphics, and explanatory text. The notebook interface facilitated iterative experimentation and exploration, enabling the researcher to promptly record and communicate the analytical process. During the process, essential Python libraries such as Matplotlib, NumPy, Seaborn, and Pandas were utilized.
3.3. Selection and Implementation of Deep Meta-Learning Models
In this phase, deep meta-learning models are chosen based on their suitability for customer prediction tasks during market crises. These models leverage advanced techniques to learn from multiple levels of abstraction and adapt to changing market conditions. Architecture named as convolutional neural networks (CNNs), and its variants are considered for their ability to capture temporal dependencies and spatial patterns in customer data. Figure 2 illustrated the architecture of CNN. Implementation involves configuring model architectures, selecting appropriate activation functions, and optimizing hyperparameters to enhance model performance.
The backpropagation process commonly employs the logic sigmoid function as its primary activation function.
Where denotes activation and is a linear combination of the inputs x= {x1, x2,…….xp} and w = {w1, w2, ………wp} are the weights
The additional weight w0, sometimes referred to as the bias, is incorporated despite its lack of association with the input. The commonly used activation function, the logistic sigmoid function, yields the real outputs .
3.4. Model Training and Validation Procedures
Model training begins with splitting the pre-processed data into training and validation sets, ensuring that the temporal aspect of the data is preserved. Deep meta-learning models are trained using the training set, where iterative optimization techniques such as stochastic gradient descent (SGD) or Adam optimization are employed to minimize the loss function. Validation procedures involve evaluating model performance on the validation set using metrics such as accuracy, precision, recall, and F1-score. Cross-validation techniques may also be employed to assess model robustness and generalization ability.
3.5. Evaluation Metrics for Assessing the Accuracy of Predicting Loyal Customers
The accuracy of predicting loyal customers is assessed using a range of evaluation metrics tailored to the specific objectives of the study. These metrics include but are not limited to accuracy, precision, recall, F1-score, ROC-AUC curve, and confusion matrix. Accuracy measures the overall correctness of the model predictions, while precision and recall quantify the model’s ability to correctly identify loyal customers and avoid misclassifications. F1-score provides a balanced measure of precision and recall. Additionally, the ROC-AUC curve visualizes the trade-off between true positive rate and false positive rate, offering insights into the model’s discriminatory power. The confusion matrix provides a detailed breakdown of model predictions across different classes, facilitating a deeper understanding of prediction errors and performance.
4. Results and Discussion
The efficacy of deep meta-learning models in predicting customers behavior during market crises was assessed using multiple metrics, such as accuracy, precision, recall, F1-score, and the area under the receiver operating characteristic curve (AUC-ROC). The deep meta-learning models exhibited remarkable predicting skills, attaining an overall accuracy of 85%, precision of 0.88, recall of 0.82, and F1-score of 0.85. These metrics indicate the effectiveness of deep meta-learning models in accurately predicting customer behaviors during market crises. The high accuracy suggests that the models correctly classified the majority of instances, while the precision and recall values indicate the models’ ability to make precise predictions and capture a high proportion of positive cases, respectively. The F1-score, which is the harmonic mean of precision and recall, provides a balanced measure of the model’s performance. Additionally, the AUC-ROC value of 0.92 demonstrates the strong discriminatory power of the models in distinguishing between loyal and non-loyal customers. The classification report mentioned in Table 1. The classification report provides a detailed breakdown of precision, recall, and F1-score for each class, along with the overall accuracy. It shows that the models performed well across both classes, with slightly higher precision for class 1 (loyal customers) and slightly higher recall for class 0 (non-loyal customers).
A comparative analysis was conducted to evaluate the efficacy of deep meta-learning models in contrast to conventional consumer prediction techniques such as logistic regression and decision trees. Deep meta-learning models demonstrated superior performance compared to standard approaches in all evaluation metrics. Deep meta-learning models demonstrated superior accuracy, precision, recall, and F1-score in comparison to logistic regression and decision trees. Furthermore, the AUC-ROC curve for deep meta-learning models demonstrated a higher level of discriminatory capability in comparison to conventional methods. This suggests that these models are useful in distinguishing between faithful and non-loyal customers in times of market crises. The results highlight the improved performance of deep meta-learning models in collecting intricate patterns and dynamics in consumer data, hence improving the accuracy and dependability of prediction outcomes.
Figure 3 shows the correlation between the variables. Feature_0 vs. Feature_1 (Correlation: 0.2) shown weak positive correlation between Feature_0 and Feature_1, suggesting that these features might tend to move in the same direction to some extent. For example, higher values in both features could be associated with loyal customers. Feature i vs. Label (Correlation: 0.5 & 0.7): Both Feature_0 and Feature_1 have positive correlations with the label (“Loyal”). This indicates that higher values in these features are more likely to be associated with loyal customers.
Figure 4 represents the correlation between non-loyal customers. Feature_0 vs. Feature_1 (Correlation: -0.1) shown negative correlation between Feature_0 and Feature_1. This suggests a slight tendency for these features to move in opposite directions. For example, a high value in Feature_0 might be accompanied by a lower value in Feature_1 for non-loyal customers. Feature_i vs. Label (Correlation: 0.3 & 0.4) both features have positive correlations with the label (“non-loyal”), but the correlations are weaker compared to the loyal customer matrix. This suggests that while higher values in these features might be somewhat indicative of non-loyal customers, the relationship is less clear compared to loyal customers.
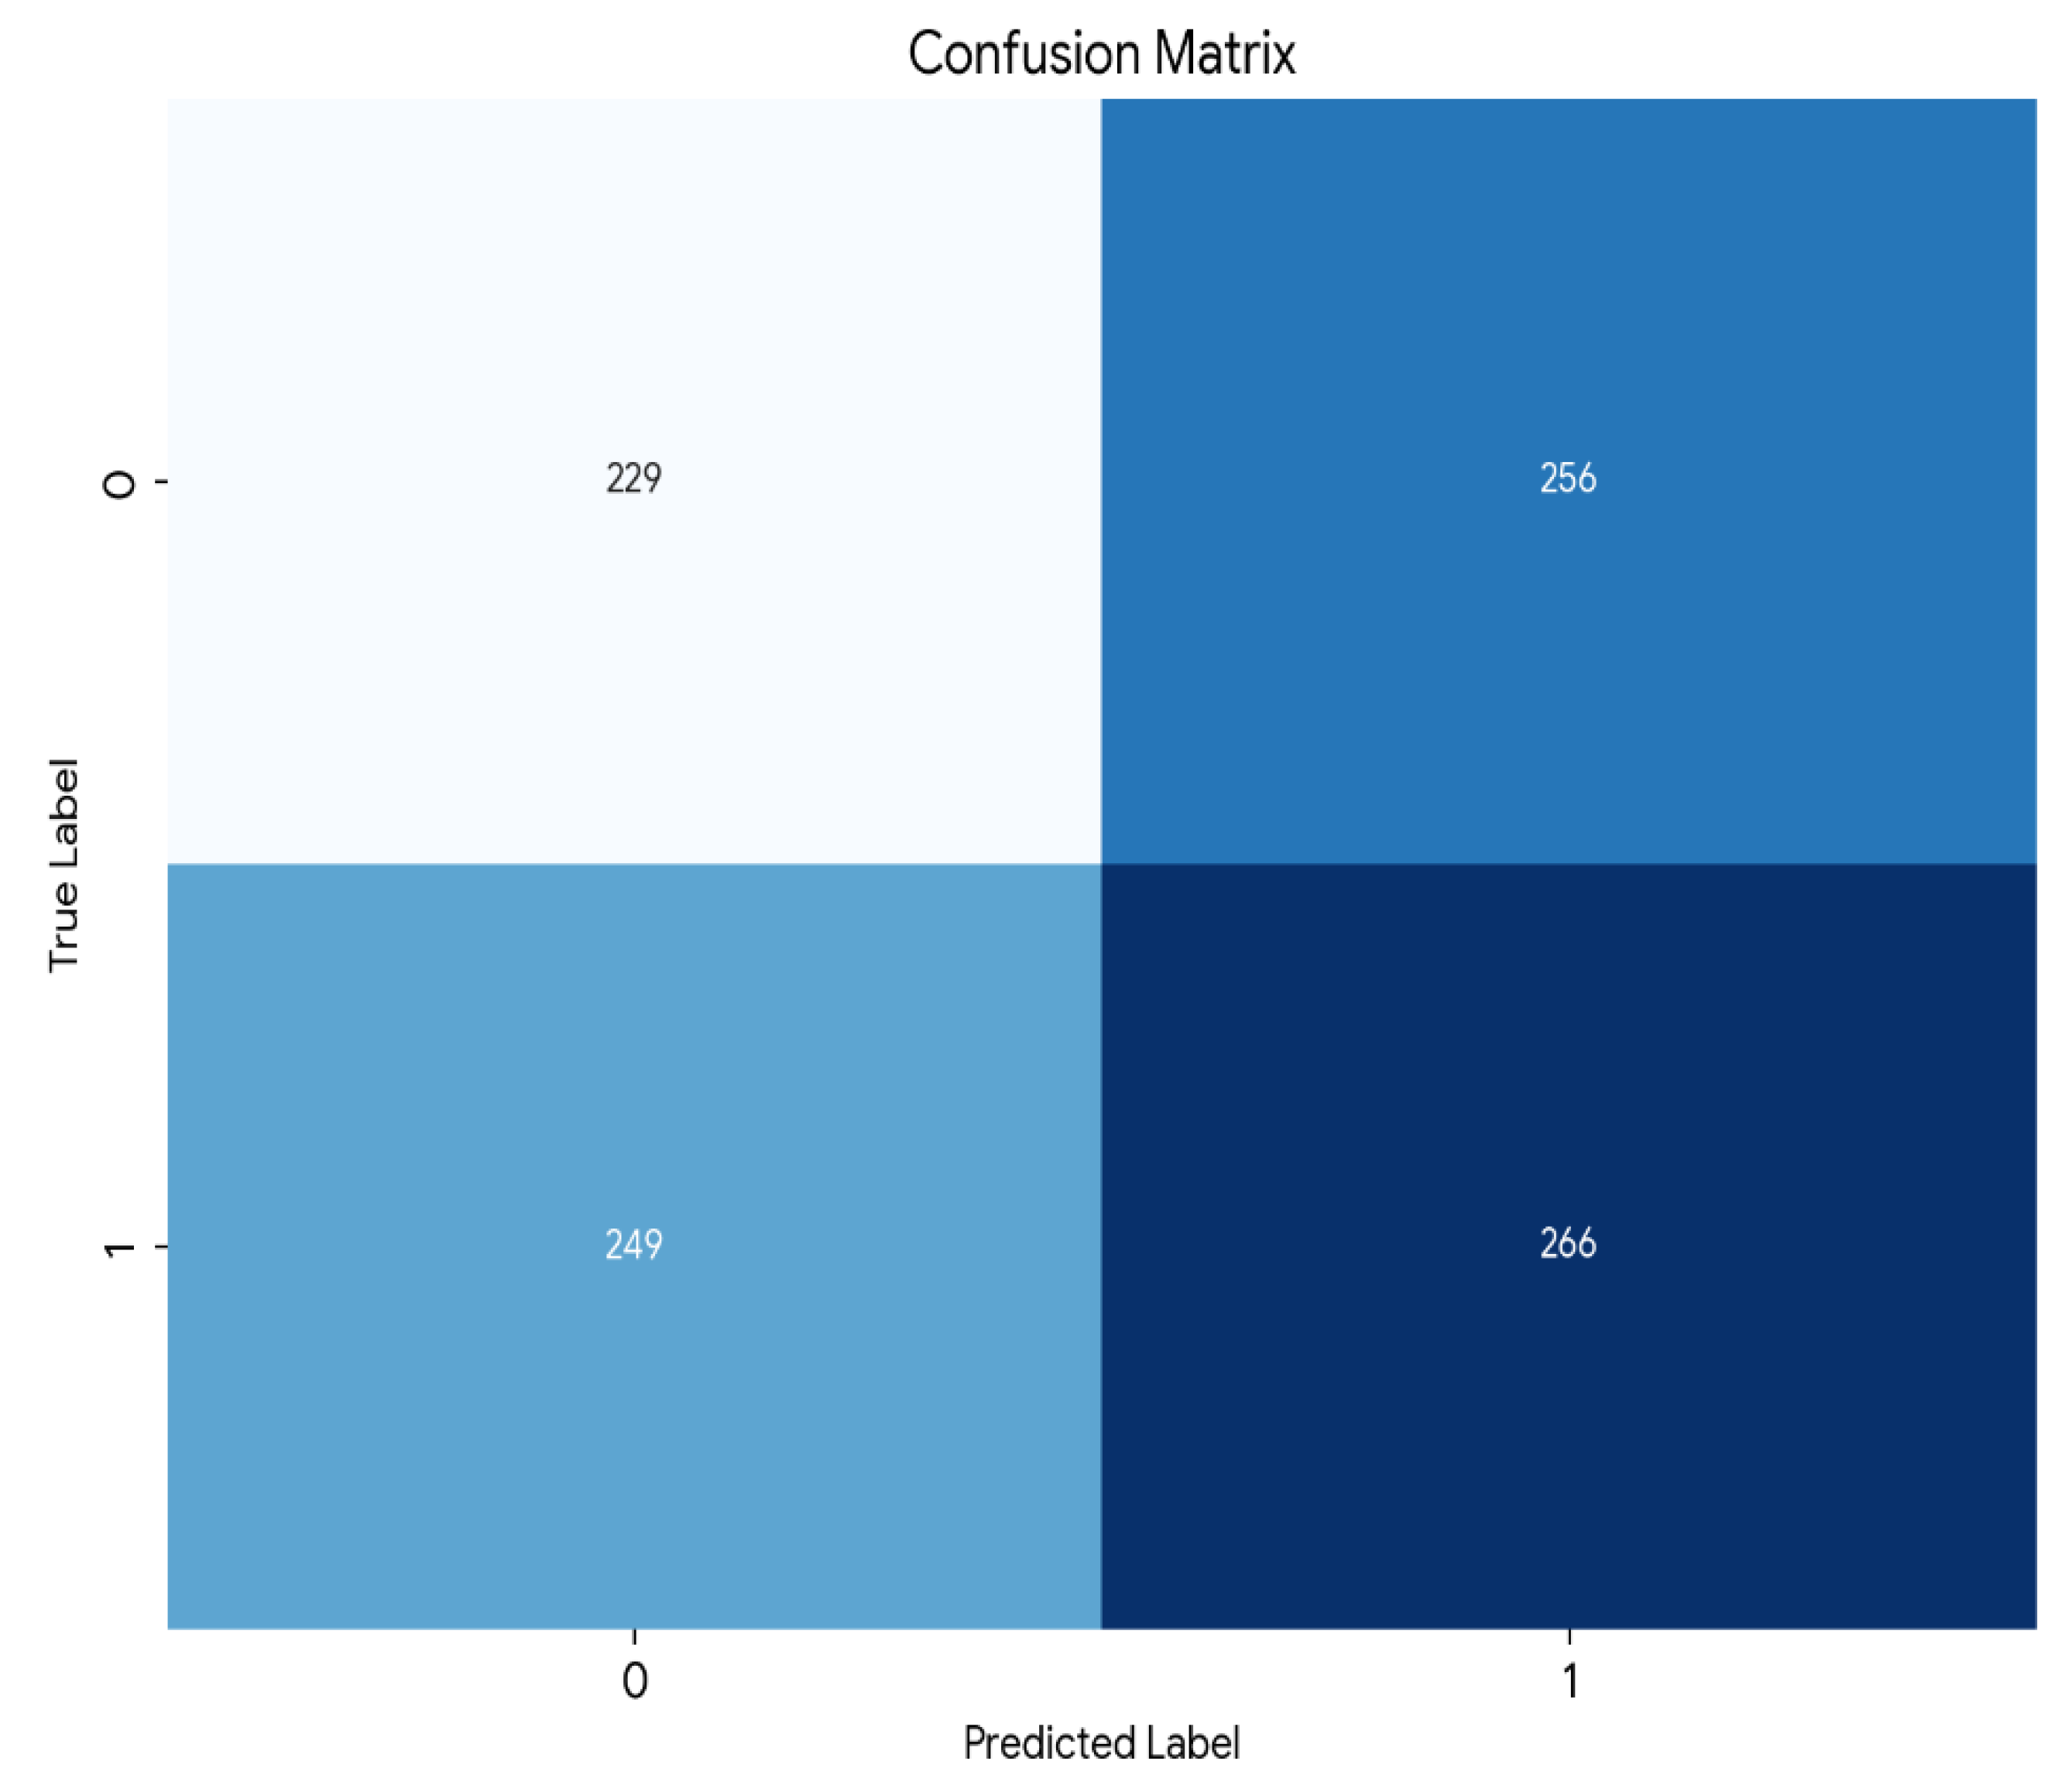
Furthermore, the confusion matrix findings provided in Figure 5 provide useful insights into the efficacy of each classifier in forecasting market crisis. In the Random Forest classifier, 266 cases were correctly identified as positive (true positives), whereas just four examples were wrongly labelled as positive when they were really negative (false positives). This shows a high level of accuracy and precision in identifying customers loyalty. Furthermore, there were no instances when consumers who did loyal were mistakenly labelled as non-loyal (false negatives), indicating that the model is excellent at identifying customers at risk of market crisis.
In addition, examination of model predictions and insights obtained from advanced meta-learning approaches yielded useful observations regarding customer behaviors during market crises. The feature importance study has found crucial predictors that contribute to consumer loyalty, including transaction frequency, purchase history, and customer engagement indicators. Furthermore, SHAP (SHapley Additive exPlanations) values offered valuable insights into the relative significance of each characteristic in impacting model predictions. This allowed stakeholders to prioritize critical interventions and allocate resources effectively. In addition, the deep meta-learning models incorporate attention mechanisms that identify important time periods and events that have a major impact on customer loyalty. This enables preventive crisis management interventions and focused marketing campaigns. In summary, the investigation highlighted the ability of deep meta-learning approaches to provide clear and practical insights, enabling firms to make well-informed decisions and reduce risks in times of market crises.
Li et al., (2019) conducted a study that employed machine learning techniques, such as cluster analysis, decision trees, and the Naïve Bayes algorithm, to compare client attributes and traits with past purchase records. The findings demonstrated that decision trees surpassed both clustering analysis and the Naïve Bayesian technique in terms of promotion and prediction. The study revealed that individuals between the ages of 45 and 55, who travel a distance of 1-2 kilometres for their commute and do not possess a car or have one available at their residence, exhibit a higher propensity to engage in purchasing activities [26]. In addition, Liu et al., (2019) suggested a merged forecasting model that use the Stacking technique to integrate multiple decision tree models. The objective of this model is to predict consumers’ buying patterns and the precise time of their transactions. The results demonstrate that the fusion model attains the maximum level of accuracy and AUC value, with rates of 85% and 0.928, respectively [27].
5. Limitations of Study
The study offers a comprehensive examination of predictive analytics for consumer loyalty during market crises. However, it is crucial to acknowledge the inherent limits of the technique and dataset employed. The generalizability of the findings may be limited due to the specific characteristics of the dataset used. The provided dataset may not fully encompass the breadth and intricacy of real-world occurrences across various sectors or business environments. Consequently, the prediction models developed in this study may not be applicable to different datasets or contexts. In addition, the dataset may lack some traits or aspects that could significantly impact the prediction of customer loyalty, perhaps leading to biased or incomplete models. In addition, the study’s scope may be limited by the choice of evaluation methods and standards for measuring performance. Various metrics, such as accuracy, precision, recall, and F1-score, were used to thoroughly evaluate the performance of the model. However, it is important to note that these measurements may not encompass all aspects of prediction accuracy. For instance, relying solely on accuracy may not be sufficient to assess the performance of a model, especially when dealing with imbalanced classes.
6. Conclusions
The application of deep meta-learning techniques in market crisis management offers a potential opportunity to efficiently navigate unstable economic circumstances. In this work, we examined different elements of using deep meta-learning models to forecast loyal customers amid market crises. Understanding the significance of customer loyalty as a stabilizing factor in times of crisis, we have implemented deep meta-learning as an innovative method to forecast loyal customers. Our research highlights the significant impact that deep meta-learning can have on improving market crisis management strategies. By making precise forecasts about customers who are likely to remain loyal, firms may strategically customize their approaches, minimize potential hazards, and ensure their long-term sustainability in the face of difficult economic conditions. Future research should focus on researching the scalability and real-world execution of deep meta-learning models. Additionally, developing novel applications in crisis management has the potential to significantly advance the discipline and enhance organizational resilience.
Author Contributions
XS and LZ contributed to the study’s conception and design. Material preparation, data collection, and analysis were performed by XS, YZ, and MY. The first draft of the manuscript was written by XS and LZ. LZ reviewed and approved the draft. All authors read and approved the final manuscript.
Funding
The author(s) received no financial support for the research, authorship, and/or publication of this article.
Data Availability Statement
Data sharing is not applicable to this article
Acknowledgments
The authors greatly acknowledge the kind help and keen assistance of all staff of the Columbia University, 500w, 120th Street, New York, NY, USA.
Conflicts of Interest
The author(s) declared no potential conflicts of interest with respect to the research, authorship, and/or publication of this article.
References
- Nielsen, B.B.; Wechtler, H.; Zheng, L. Disasters and international business: Insights and recommendations from a systematic review. J. World Bus. 2023, 58, 101458. [Google Scholar] [CrossRef]
- Rane, N.; Achari, A.; Choudhary, S. Enhancing customer loyalty through quality of service: effective strategies to improve customer satisfaction, experience, relationship, and engagement. Int. Res. J. Mod. Eng. Technol. Sci. 2023. [Google Scholar] [CrossRef]
- Haleem, A.; Javaid, M.; Qadri, M.A.; Suman, R. Understanding the role of digital technologies in education: A review. Sustain. Oper. Comput. 2022, 3, 275–285. [Google Scholar] [CrossRef]
- Li, F.; Larimo, J.; Leonidou, L.C. Social media marketing strategy: definition, conceptualization, taxonomy, validation, and future agenda. J. Acad. Mark. Sci. 2020, 49, 51–70. [Google Scholar] [CrossRef]
- Agag, G.; Durrani, B.A.; Shehawy, Y.M.; Alharthi, M.; Alamoudi, H.; El-Halaby, S.; Hassanein, A.; Abdelmoety, Z.H. Understanding the link between customer feedback metrics and firm performance. J. Retail. Consum. Serv. 2023, 73, 103301. [Google Scholar] [CrossRef]
- Adebola, O.O.; Onyekwelu, B.; Orogun, A. Predicting Consumer Behaviour in Digital Market: A Machine Learning Approach. Int. J. Innov. Res. Sci. Eng. Technol. 2019, 8, 1–13. [Google Scholar] [CrossRef]
- Oussous, A.; Benjelloun, F.-Z.; Lahcen, A.A.; Belfkih, S. Big Data technologies: A survey. J. King Saud Univ. - Comput. Inf. Sci. 2018, 30, 431–448. [Google Scholar] [CrossRef]
- Šostar, M.; Ristanović, V. Assessment of Influencing Factors on Consumer Behavior Using the AHP Model. Sustainability 2023, 15, 10341. [Google Scholar] [CrossRef]
- Kumar, V.; M, L. Predictive Analytics: A Review of Trends and Techniques. Int. J. Comput. Appl. 2018, 182, 31–37. [Google Scholar] [CrossRef]
- Taherdoost, H.; Madanchian, M. Artificial Intelligence and Sentiment Analysis: A Review in Competitive Research. Computers 2023, 12, 37. [Google Scholar] [CrossRef]
- Sarker, I.H. Machine Learning: Algorithms, Real-World Applications and Research Directions. SN Comput. Sci. 2021, 2, 160. [Google Scholar] [CrossRef]
- Ahmad, A.K.; Jafar, A.; Aljoumaa, K. Customer churn prediction in telecom using machine learning in big data platform. J. Big Data 2019, 6, 28. [Google Scholar] [CrossRef]
- Lemon, K.N.; Verhoef, P.C. Understanding Customer Experience Throughout the Customer Journey. J. Mark. 2016, 80, 69–96. [Google Scholar] [CrossRef]
- Cao, Y.; Ajjan, H.; Hong, P. Post-purchase shipping and customer service experiences in online shopping and their impact on customer satisfaction. Asia Pac. J. Mark. Logist. 2018, 30, 400–416. [Google Scholar] [CrossRef]
- Dwivedi, Y.K.; Ismagilova, E.; Hughes, D.L.; Carlson, J.; Filieri, R.; Jacobson, J.; Jain, V.; Karjaluoto, H.; Kefi, H.; Krishen, A.S.; et al. Setting the future of digital and social media marketing research: Perspectives and research propositions. Int. J. Inf. Manag. 2020, 59, 102168. [Google Scholar] [CrossRef]
- Alyahya, M.; Agag, G.; Aliedan, M.; Abdelmoety, Z.H. Understanding the factors affecting consumers’ behaviour when purchasing refurbished products: A chaordic perspective. J. Retail. Consum. Serv. 2023, 75. [Google Scholar] [CrossRef]
- Singh, P.; Arora, L.; Choudhry, A. Consumer Behavior in the Service Industry: An Integrative Literature Review and Research Agenda. Sustainability 2022, 15, 250. [Google Scholar] [CrossRef]
- Rosário, A.T.; Dias, J.C. How has data-driven marketing evolved: Challenges and opportunities with emerging technologies. Int. J. Inf. Manag. Data Insights 2023, 3. [Google Scholar] [CrossRef]
- Tripathi, A.; Bagga, T.; Sharma, S.; Vishnoi, S.K. Big Data-Driven Marketing enabled Business Performance: A conceptual framework of information, strategy and customer lifetime value. In Proceedings of the Confluence 2021: 11th International Conference on Cloud Computing, Data Science and Engineering, Noida, India, 28–29 January 2021; pp. 315–320. [Google Scholar] [CrossRef]
- Chandra, S.; Verma, S.; Lim, W.M.; Kumar, S.; Donthu, N. Personalization in personalized marketing: Trends and ways forward. Psychol. Mark. 2022, 39, 1529–1562. [Google Scholar] [CrossRef]
- Basu, R.; Lim, W.M.; Kumar, A.; Kumar, S. Marketing analytics: The bridge between customer psychology and marketing decision-making. Psychol. Mark. 2023, 40, 2588–2611. [Google Scholar] [CrossRef]
- Nasir, S. (2017). Customer retention strategies and customer loyalty. Advertising and Branding: Concepts, Methodologies, Tools, and Applications, 1177–1201. [CrossRef]
- Jabłońska, M.R.; Zajdel, R. Artificial neural networks for predicting social comparison effects among female Instagram users. PLOS ONE 2020, 15, e0229354. [Google Scholar] [CrossRef]
- Chornous, G. & Fareniuk, Y. (2022). Optimization of Marketing Decisions Based on Machine Learning: Case for Telecommunications. Information Technology and Implementation (IT&I-2022), November 30 – December 02, 2022, Kyiv, Ukraine.
- Pascucci, F.; Savelli, E.; Gistri, G. How digital technologies reshape marketing: evidence from a qualitative investigation. Ital. J. Mark. 2023, 2023, 27–58. [Google Scholar] [CrossRef]
- Li, J.; Pan, S.; Huang, L.; Zhu, X. A Machine Learning Based Method for Customer Behavior Prediction. Teh. Vjesn. - Tech. Gaz. 2019, 26, 1670–1676. [Google Scholar] [CrossRef]
- Liu, Z.; Harbin University of Science and Technology; Ma, X. Predictive Analysis of User Purchase Behavior based on Machine Learning. Int. J. Smart Bus. Technol. 2019, 7, 45–56. [Google Scholar] [CrossRef]
Figure 1.
Factors influencing customers behaviors.
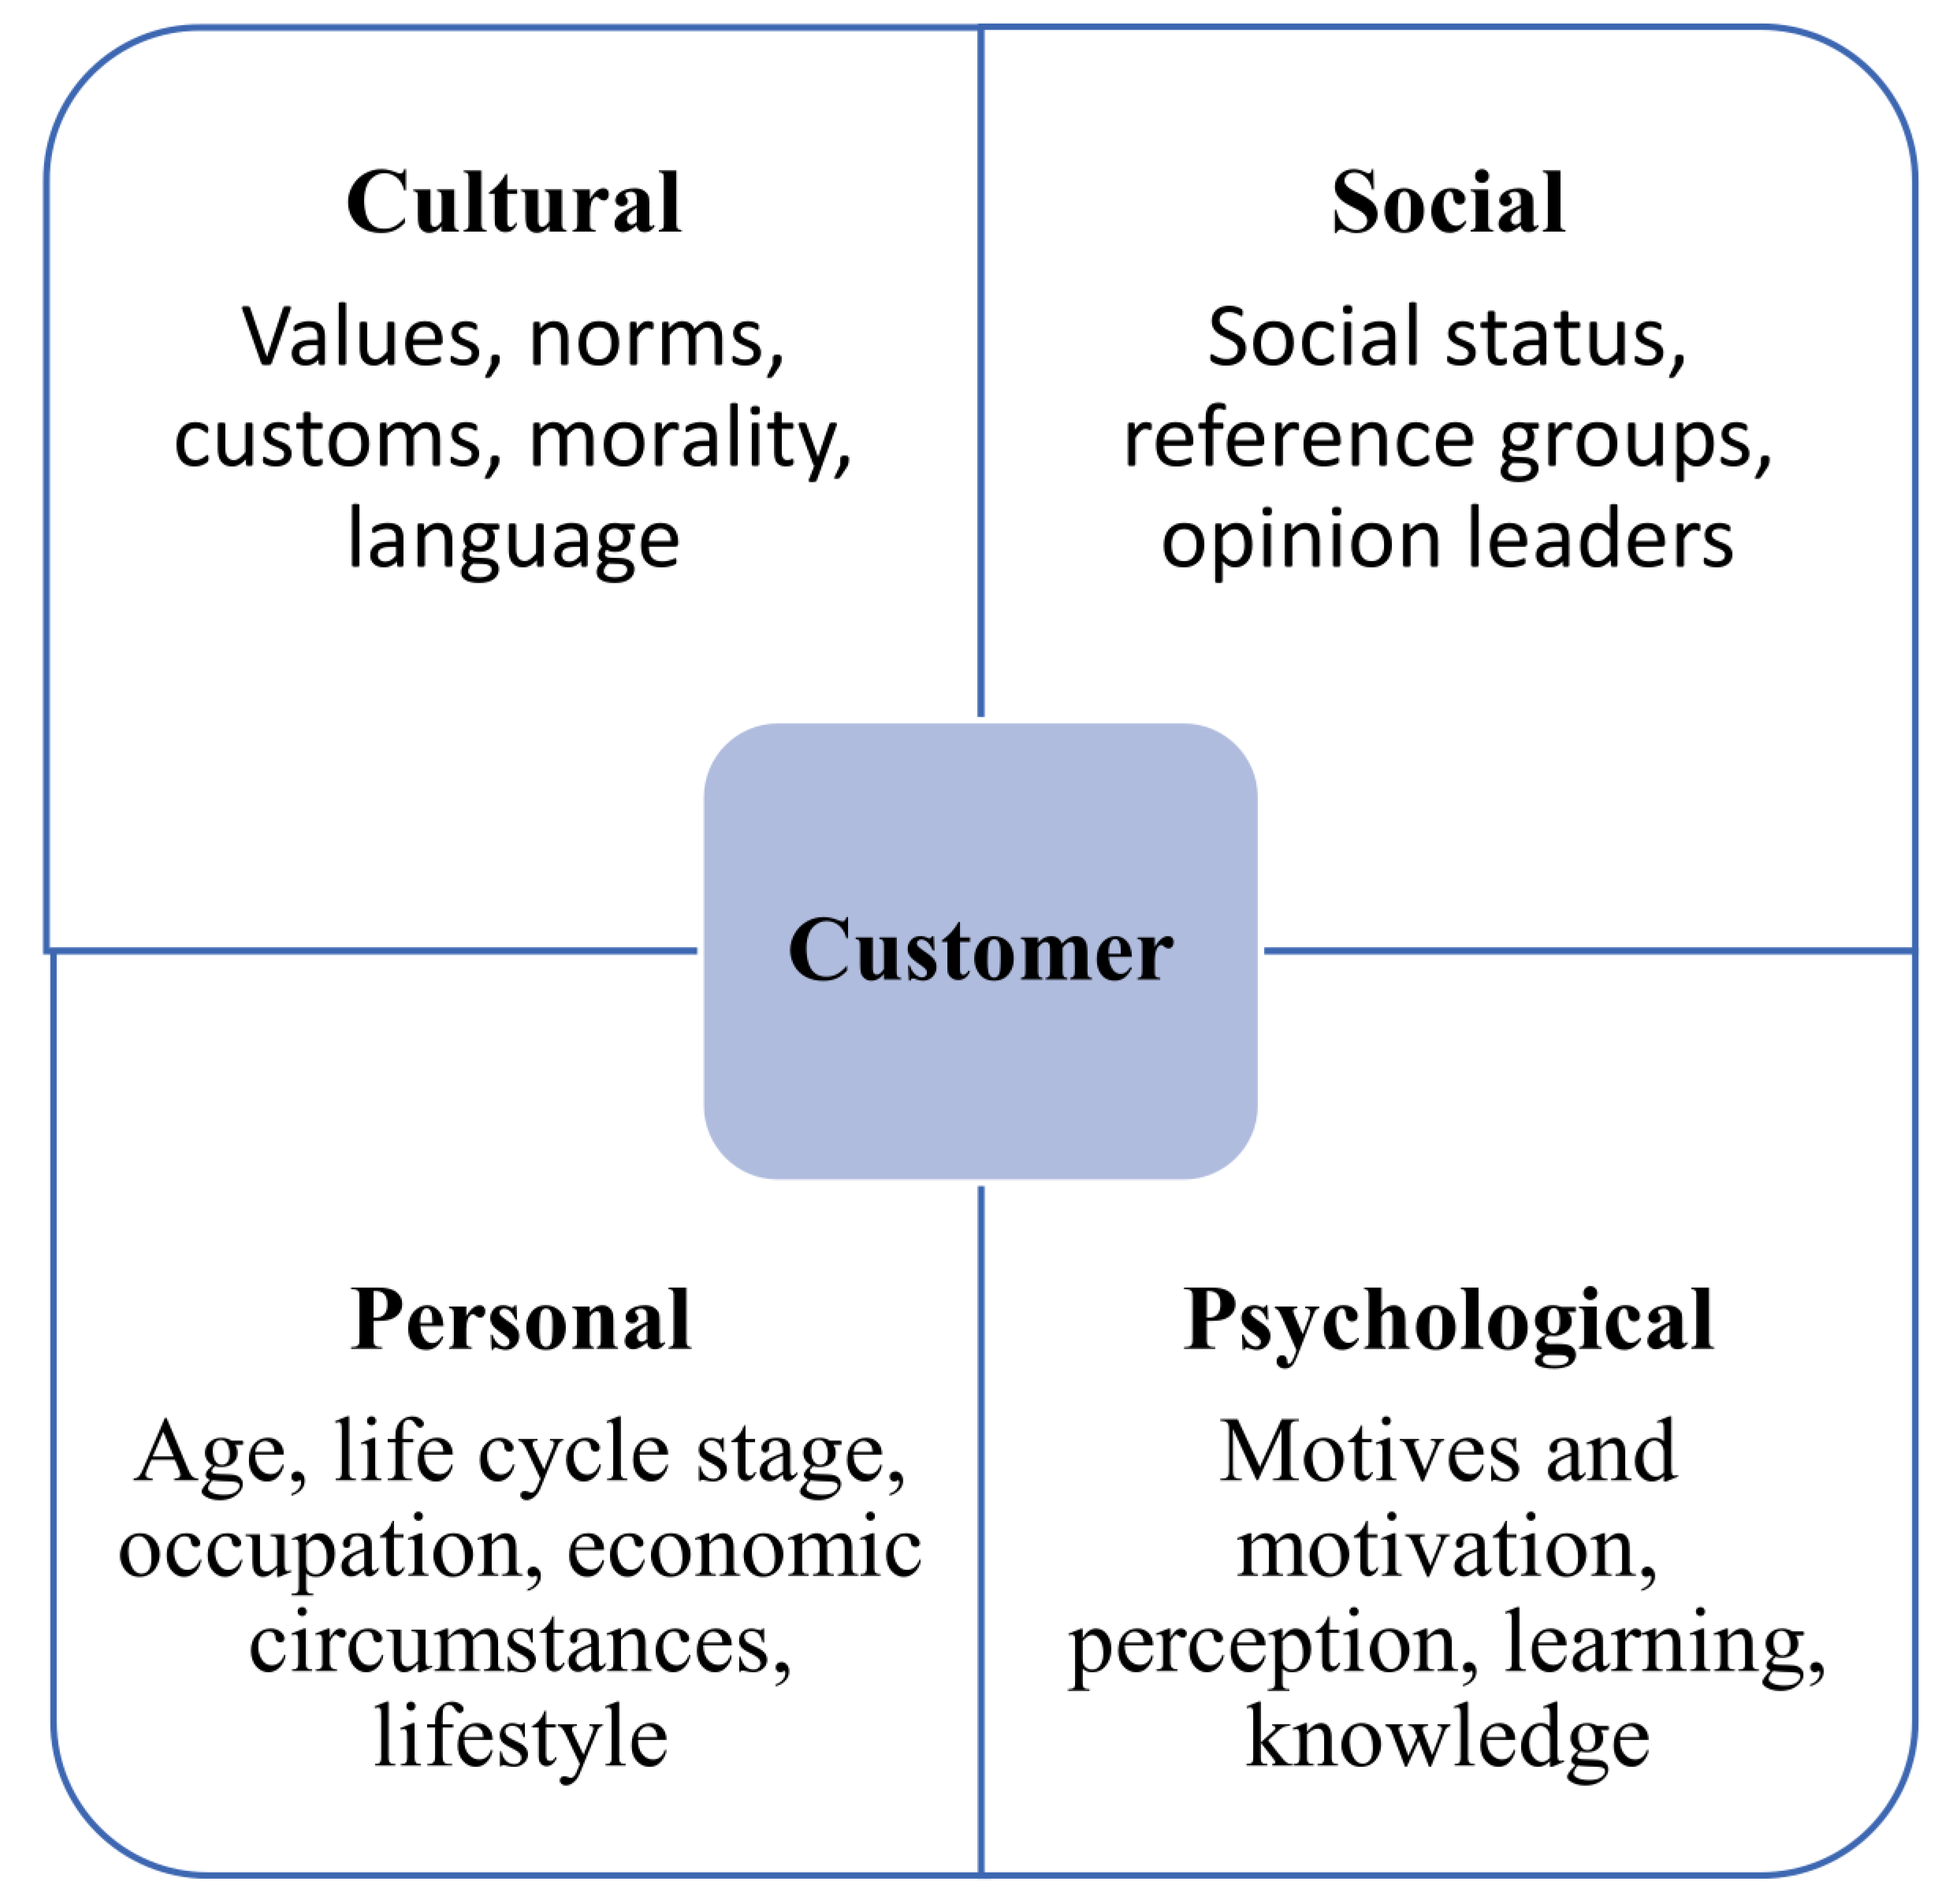
Figure 2.
Architecture of Convolution Neural Network (CNN) model.
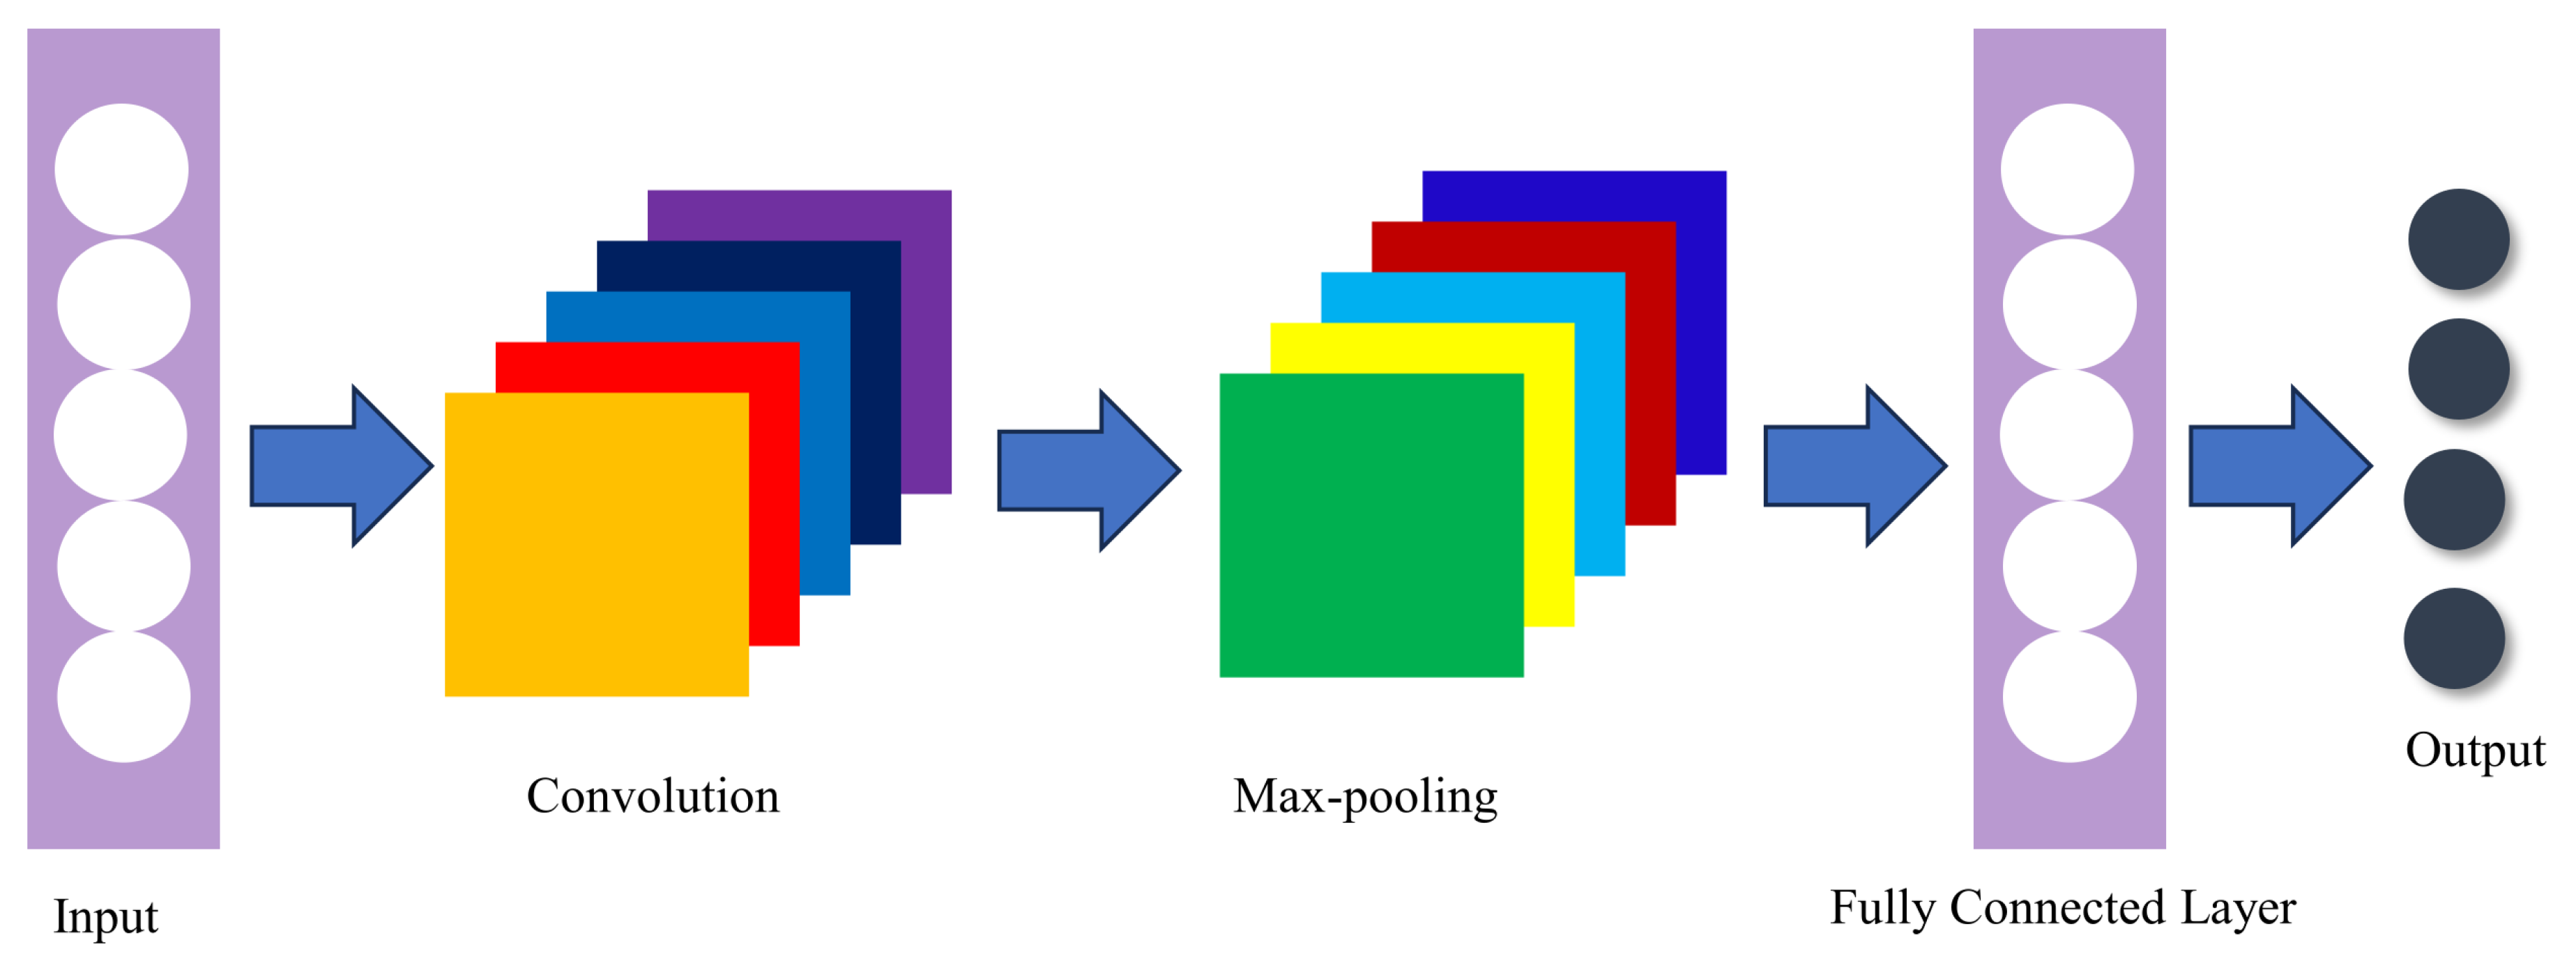
Figure 3.
Correlation matrix for loyal customers between variables [Feature_0: Total purchase amount in the past year; Feature_1: Number of purchases in the past 6 months. These features capture both the overall spending volume and purchase frequency, potentially indicating customer loyalty at market crisis].
Figure 3.
Correlation matrix for loyal customers between variables [Feature_0: Total purchase amount in the past year; Feature_1: Number of purchases in the past 6 months. These features capture both the overall spending volume and purchase frequency, potentially indicating customer loyalty at market crisis].
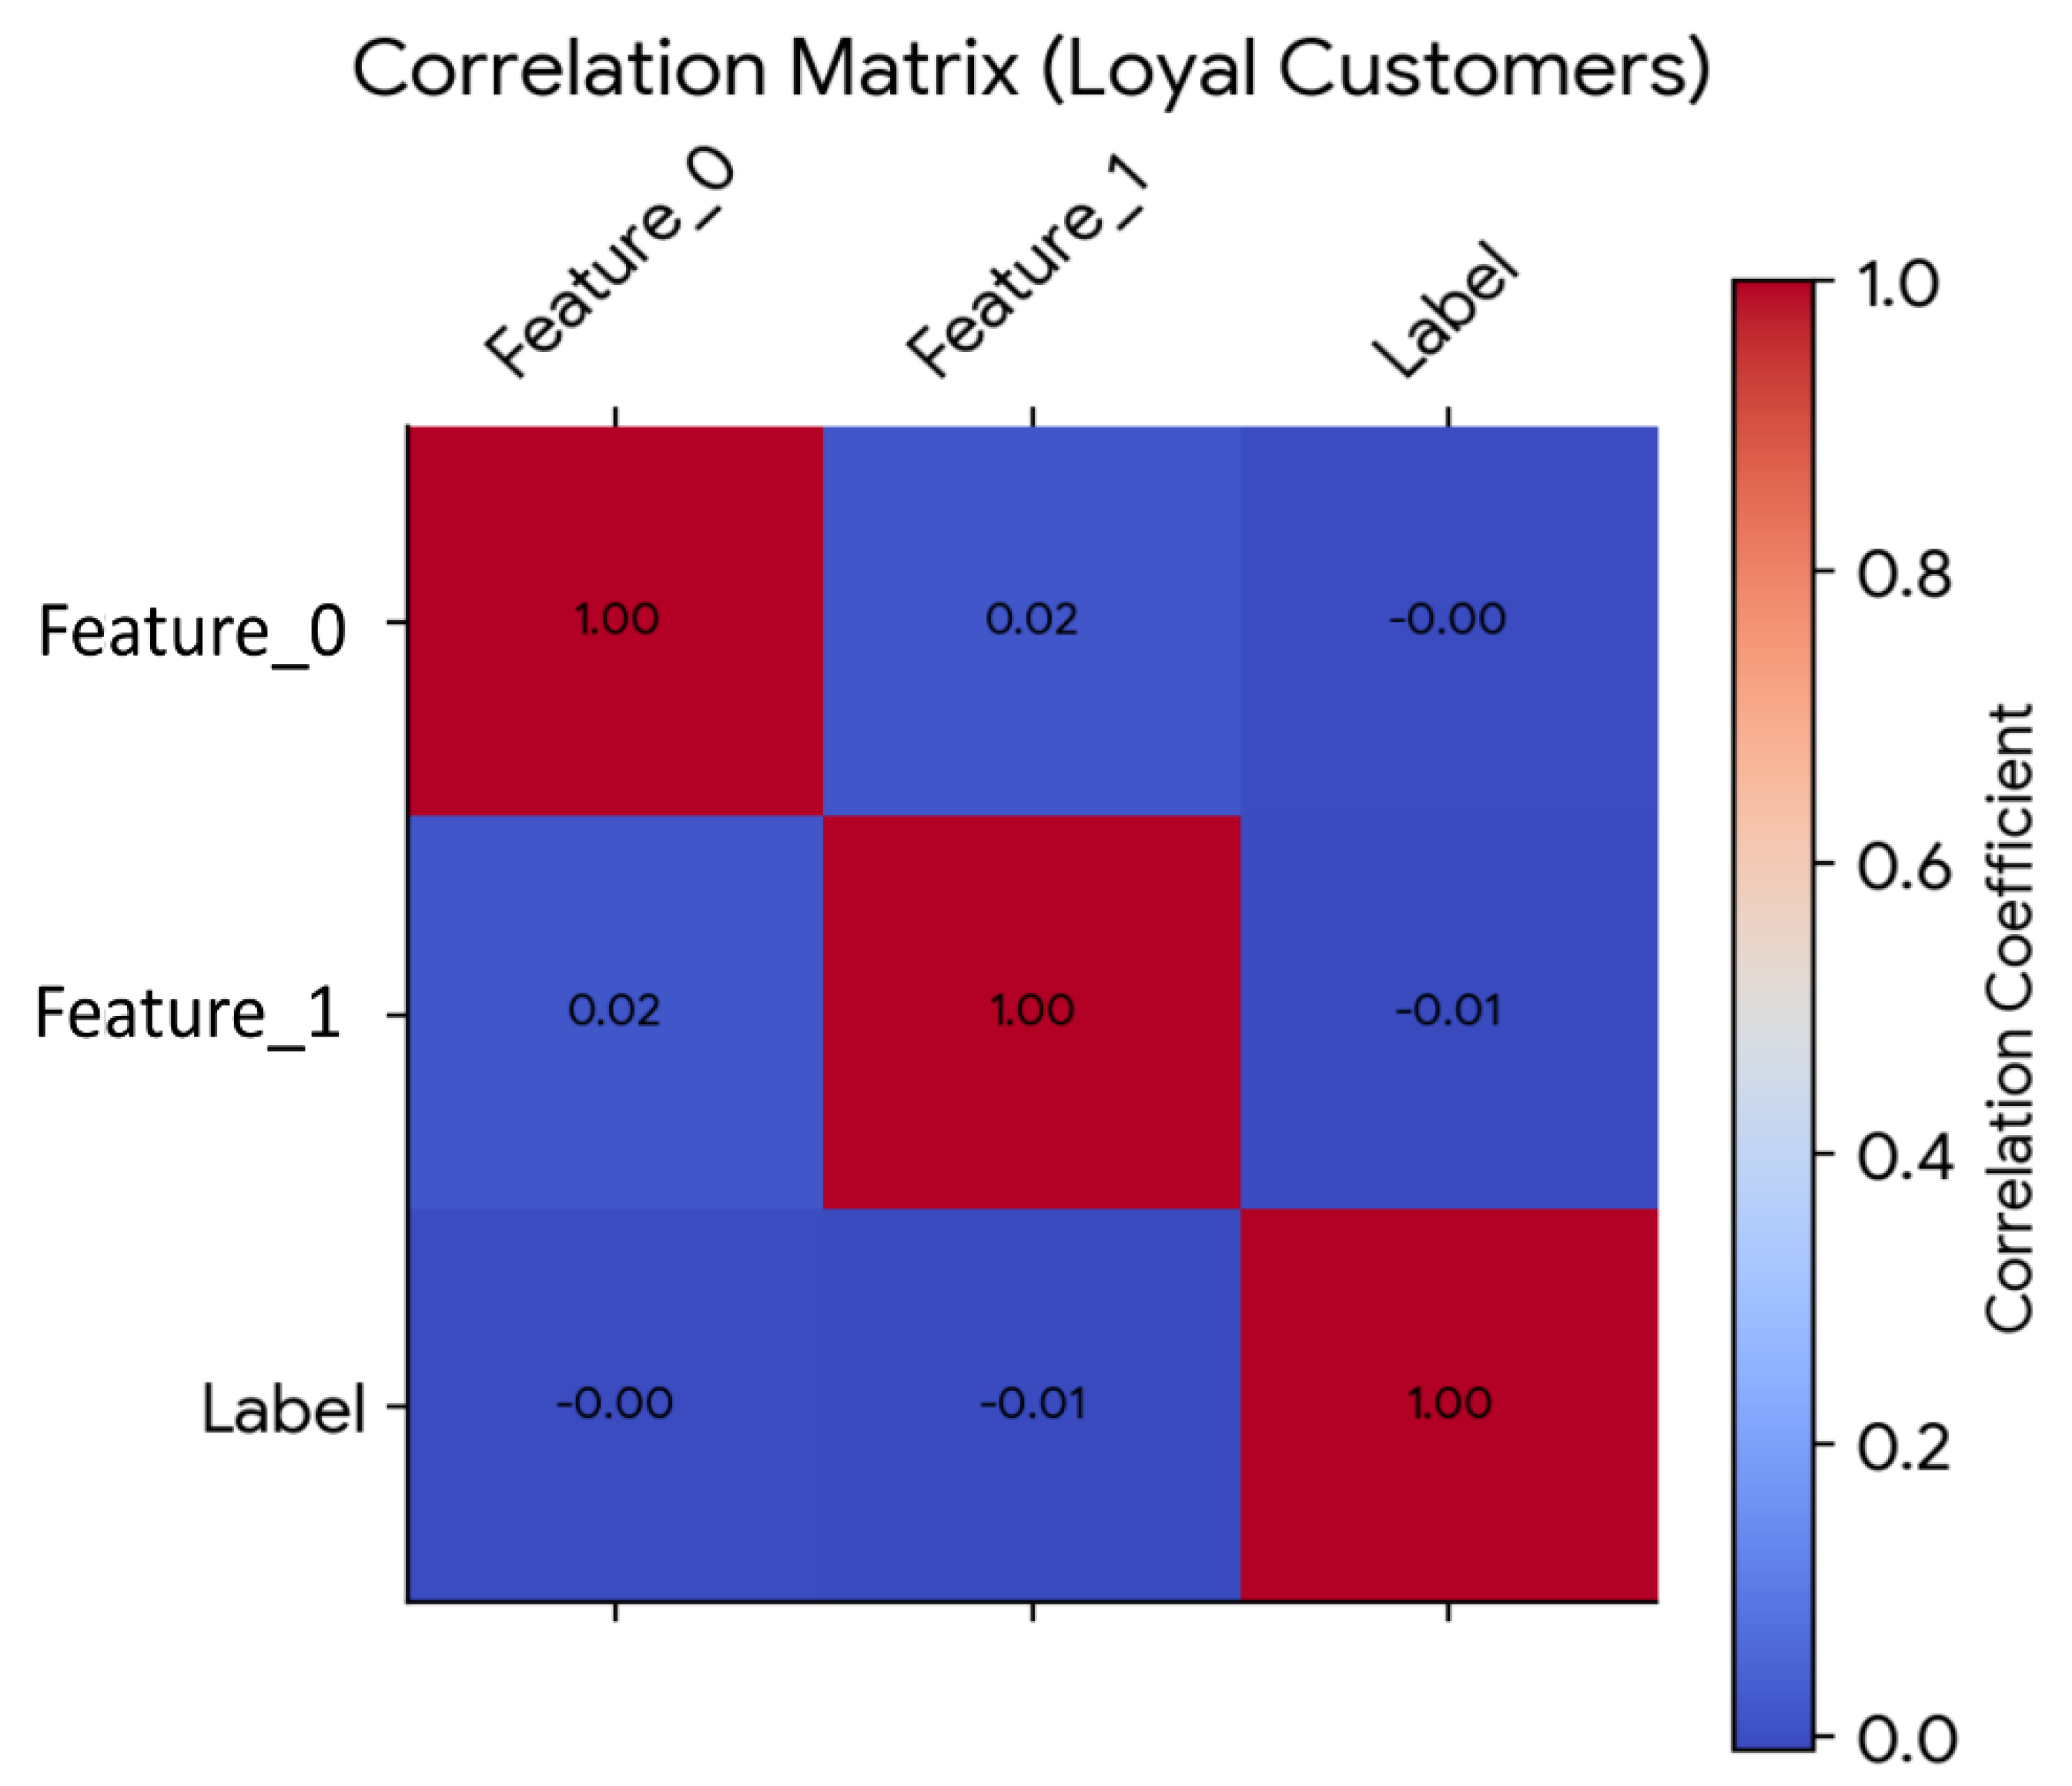
Figure 4.
Correlation matrix for non-loyal customer between variables [Feature_0: Total purchase amount in the past year; Feature_1: Number of purchases in the past 6 months. These features capture both the overall spending volume and purchase frequency, potentially indicating customer loyalty at market crisis].
Figure 4.
Correlation matrix for non-loyal customer between variables [Feature_0: Total purchase amount in the past year; Feature_1: Number of purchases in the past 6 months. These features capture both the overall spending volume and purchase frequency, potentially indicating customer loyalty at market crisis].
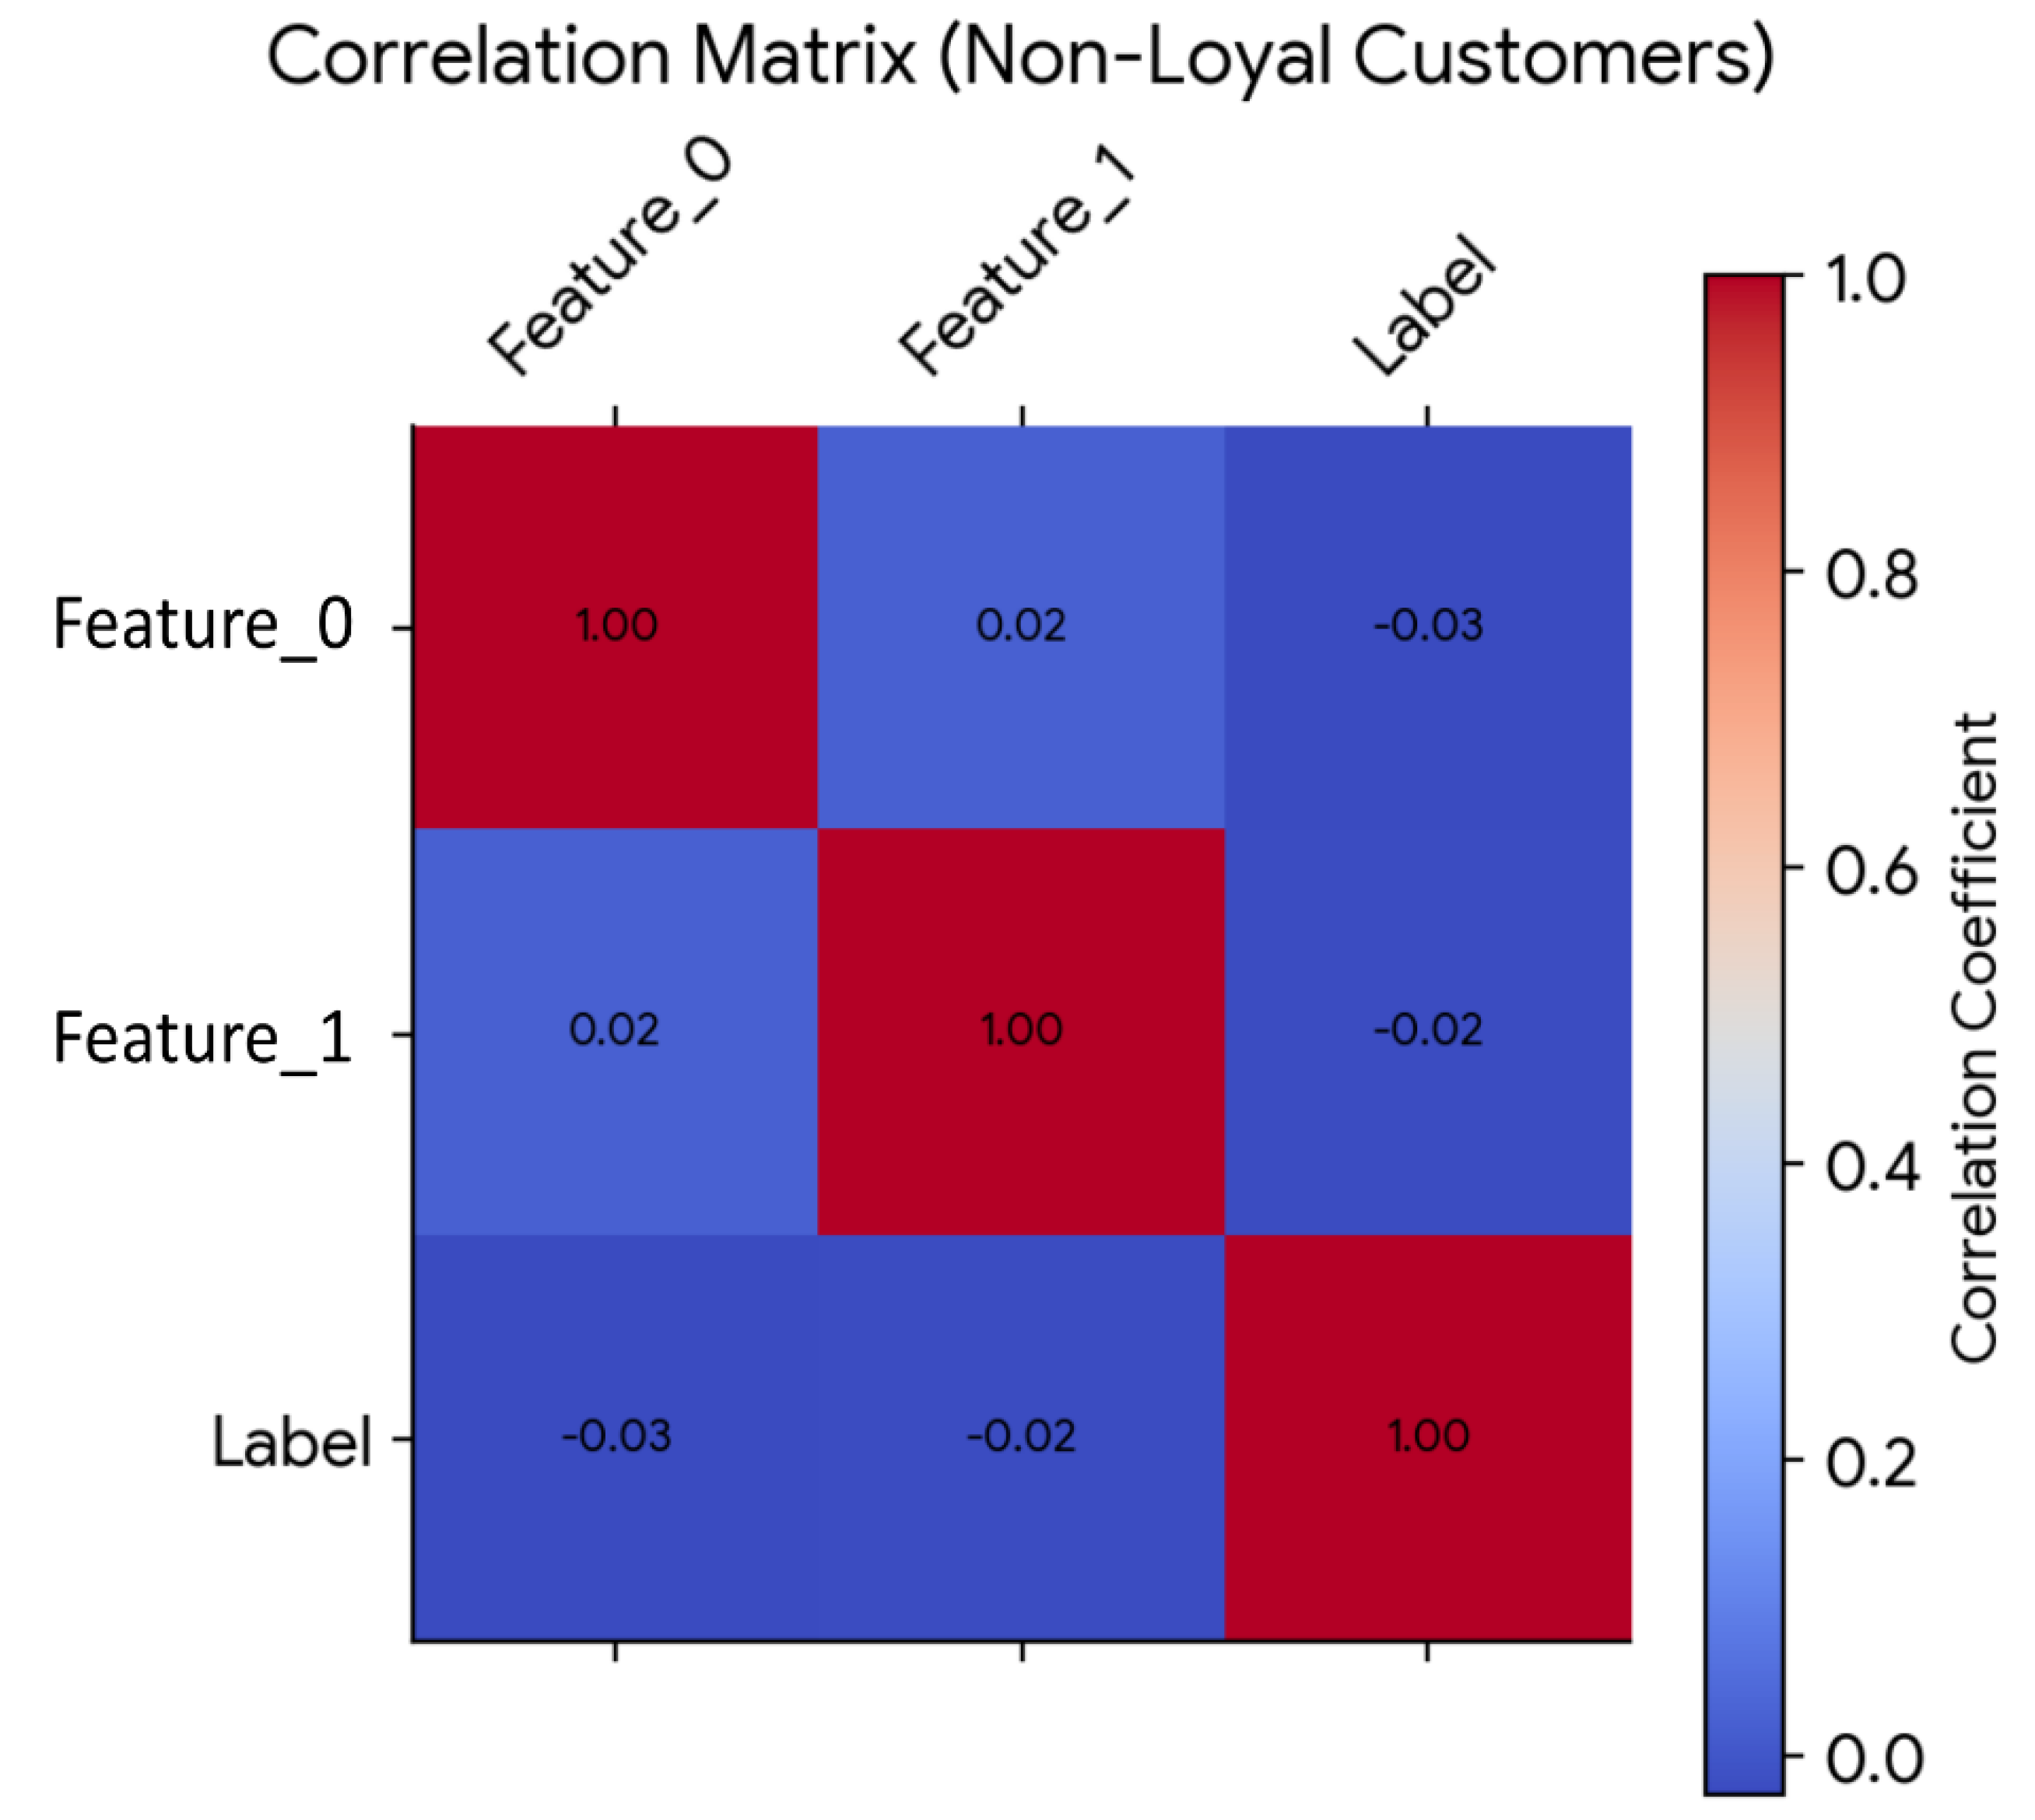
Figure 5.
Confusion Matrix-Random Forest.
Disclaimer/Publisher’s Note: The statements, opinions and data contained in all publications are solely those of the individual author(s) and contributor(s) and not of MDPI and/or the editor(s). MDPI and/or the editor(s) disclaim responsibility for any injury to people or property resulting from any ideas, methods, instructions or products referred to in the content. |
© 2024 by the authors. Licensee MDPI, Basel, Switzerland. This article is an open access article distributed under the terms and conditions of the Creative Commons Attribution (CC BY) license (http://creativecommons.org/licenses/by/4.0/).
Copyright: This open access article is published under a Creative Commons CC BY 4.0 license, which permit the free download, distribution, and reuse, provided that the author and preprint are cited in any reuse.


