Submitted:
10 July 2024
Posted:
10 July 2024
You are already at the latest version
Abstract
Electric road systems (ERS) are a group of technologies that allow powering adequately-equipped road transport vehicles with electricity from the road infrastructure while in motorway traffic. They can be categorised in three technology groups: overhead catenary, ground conductive and ground inductive, depending on the used mode of power transfer. The supplied energy is used for propulsion and for charging the vehicle batteries to be used once the vehicle leaves the electrified road section. Also, another energy source, e.g. diesel, natural gas or hydrogen, can be used while away from ERS. This research investigates the potential impacts of implementing the different ERS technologies on the Rotterdam-Antwerp motorway corridor that links the two largest ports in Europe. The aim is to identify which of the routes between the ports is best suited for implementation of ERS, whether there are substantial differences in economic performance of the different ERS technologies, see what ERS vehicle traffic volumes are required and potentially available for successful implementation, what investment is required to build the system and whether the ERS operator can be profitable, and could transport operators operate their trucks on ERS profitability in this corridor setting. The research shows that that the route between Rotterdam and Antwerp that runs on motorway E19 is the best to be electrified from an economic standpoint. Our calculations show that the traffic on Rotterdam-Antwerp corridor is sufficient for economically justifying ERS infrastructure rollout and operation. For transport operators, that happen to have specific client base, e.g. where they usually serve clients from one of the ports along the electrified route, the construction of ERS on the route can prove to be very lucrative if they adopt the technology early.
Keywords:
road freight transport
; electric road systems
; catenary
; inductive
; conductive
; economic impacts
1. Introduction
This paper investigates the impacts of implementing Electric Road System (ERS) on the Rotterdam-Antwerp motorway corridor that links the two largest ports in Europe. The investigation of this corridor is useful to answer several important questions, which due to the scale of previous studies [1,2,3] were not asked, or for which the answers of previous studies cannot be transposed. The aim is to identify which of the alternative routes is best suited for implementation of ERS, whether there are substantial differences in economic performance of the different types of ERS, see what the potential and sufficient ERS vehicle traffic volumes are for successful implementation, what investment is required to build the system and whether the ERS operator can be profitable, and could transport operators operate their trucks on ERS profitability in this corridor setting.
A road that is equipped with ERS can supply electric power to the vehicles while in motion. This allows powering and charging adequately-equipped road freight vehicles with electricity from the infrastructure while driving on ERS-equipped motorways, and using onboard batteries or another energy source for the final leg between the electrified portion of the road and the port terminal or customer. The benefits of such an approach include lower investment costs for vehicle purchase, lower vehicle operation costs, reduction of resource intensity of vehicle electrification by allowing the use of smaller batteries, improved logistics performance for ERS users and a more even time distribution of electricity grid load.
In this research we focus on four competing ERS technologies: overhead catenary (eHighway from Siemens), ground conductive (from Elonroad and Alstom) and ground inductive (from Electreon), which differ in the way infrastructure is built and the power is transferred to the vehicle.
Providing power to electric road freight transport vehicles from the infrastructure while in motion has a distinct advantage. The battery size of the vehicles can be significantly reduced, from a range of 800-1200 kWh of usable energy to 100-400 kWh, while allowing to perform the same transport operations and having the benefit of not having to allow time for battery fast charging, because the battery of the truck is recharged while driving in motorway traffic. Having a lower battery size means lower investment in vehicle purchase and consequently improved return on investment. The flexibility of the operational pattern and suitability for different logistics uses of ERS vehicles that are used on the network approaches that of diesel vehicles.
In this article, Section 2 describes the research questions and the approach that is taken in this investigation. Section 3 details the modelling inputs. In particular, the characteristics of each of the four investigated ERS technologies, including their cost and energy performance assumptions, emissions performance and energy purchase cost to the infrastructure operator and price that road freight transport operators can buy it at. Also, this section describes the other inputs used and the alternative routes that are compared in the investigation. Section 4 presents the findings of the research concerning the level of required infrastructure investment for each technology, profitability of the infrastructure operator for each of the alternative routes, impacts on the road freight transport companies and assessment of the potential demand. And last, Section 6 presents the conclusions of this research.
2. Methodology
This section lists the research questions for the research , and then the approach that is taken to answer those questions is described.
2.1 Research Questions
This research defines the following four groups of research questions:
- First, on the potential demand: what are the potential ERS traffic volumes that could use the Antwerp-Rotterdam corridor if it were developed? Are those sufficient to justify ERS implementation?
- Second, on the infrastructure investment and operation: what is the required investment, and can break-even point for profitability to be reached for this corridor in isolation? Or is a wider electrified network required? Would this be a good investment at this scale?
- Third, on the best corridor route selection: with alternative road links available between Rotterdam and Antwerp, which route is best suited to be electrified from an economic perspective?
- And last, from the point of view of the users – road freight transport operators: how do the economics look like, and could trucks be operated on ERS profitably in this corridor setting? Is this similar for all ERS technologies or are there substantial differences due to which a specific ERS technology should be preferred?
2.2 Approach
To answer the research questions defined above the following steps are taken:
Step 1: Technology definition. There are several technology options available for developing ERS, each of those having a different technology readiness level. They can be categorised in three technology groups: overhead catenary, ground rail and ground induction. In this research we intend to remain unbiased towards preference of any of those, with the different technologies reflected as different cost structure sets to simulate the differences in performance of the different infrastructure and vehicles.
Step 2: Route identification. This step identifies the alternative Rotterdam – Antwerp routes , as well as scenarios for different pre- and post-haulage differences defined based on the geographical locations of industry in the proximity of the selected routes.
Step 3: Scenario definition. This step prepares and validates the scenarios for cost-benefit analysis, taking into account the economic characteristics of the technology alternatives from Step 1, identified route scenarios from Step 2, and parameters that relate to other inputs and will allow perform sensitivity analysis, like energy prices.
Step 4: Cost analysis. The last step is the cost analysis. Its results allow answering research questions that relate to the required road freight demand for profitable operation of ERS system for system operator and users. The calculation of the alternative routing scenarios allows selecting the corridor route with the best economic performance, and determine the involved costs and benefits from investment and operation of the system for both, the ERS operator and the system users.
For the analysis, we develop a model that allows quantifying the impacts of ERS implementation on the Rotterdam-Antwerp corridor to answer the above research questions.
First, as shown in Figure 1, the input data is collected. The input data, described in detail in Section 3, describes the geography of the investigated corridor and its roads, road freight traffic volumes on those roads, vehicle and technology performance characteristics, infrastructure cost assumptions, etc. Also, a number of technology adoption scenarios are developed to test the performance of each of the investigated ERS technologies and vehicle types separately and in a mix with other vehicle types.
Then, the segment-level calculation for the investigated corridor is done. A road segment is a section of the road network which the vehicles cannot enter or leave in the middle. Entering or leaving a segment is possible only at the ends of any segment. For every segment of the corridor, user costs and ERS operator costs and revenues are calculated.
The calculations for each road segment and scenario in the model are done based on several formulas, as listed further.
The total user energy cost Cuser,e,t,s with a technology on a specific segment in a scenario is calculated as the multiplication of the length of the segment ls, adoption rate at,s of the specific technology in the assessed scenario, volume of consumed energy venergy,s and the cost of that energy cuser,en per km, as shown in formula (1).
The total user operation and maintenance cost Cuser,o&m,t,s with technology on a specific segment is calculated as a multiplication of the length of the segment ls, adoption rate at,s of the specific technology in the assessed scenario, traffic volume vtraffic,s on that segment, and the cost of operation and maintenance co&m per km.
The total user investment cost Cuser,i,t,s in a technology on a specific segment in a scenario is calculated as a multiplication of the length of the segment ls, adoption rate at,s of the specific technology, traffic volume vtraffic,s on that segment, and the investment cost ci per km driven.
For the ERS operator, the variable energy costs Coperator,e,s per segment are calculated as a multiplication of energy purchase price per kWh on wholesale market cw.en and volume of consumed energy venergy,s on that segment, as shown in formula (4). Similarly, the revenue of the system operator Roperator,s is calculated as a multiplication of energy selling price (same as cost to the user) cuser,en by the energy consumption on venergy,s, see formula (5).
Next, along the second arrow in Figure 1, summarizing of the segment-level results is done. This allows translating the calculated local impacts into the results at corridor level. Similarly, the impacts on the off-motorway traffic, e.g. part of the trip from the electrified motorway section to the port terminal or a client warehouse, are also calculated.
Last, having the result summaries allows producing corridor-level outputs that describe the economic performance of ERS deployment on the investigated corridor – economic impacts for trucking sector and ERS network operator.
3. Modelling Inputs
This section provides a description of modelling inputs that are used in this research. In the following sub-sections we define the modelled technologies, describe the performance characteristics of the modelled vehicles and infrastructure, describe the modelled transport corridor and the alternative routes that could be electrified, and show how the technology adoption scenarios are defined.
3.1 Technology Definition
Electric Road System (ERS) is a road that can supply electric power to vehicles in motion. This allows powering and charging adequately-equipped road freight vehicles with electricity from the infrastructure while in motorway traffic, and using onboard batteries or another energy source (e.g. diesel, LNG, hydrogen) for the final leg between the electrified portion of the road and the customer. The implementation of ERS brings several benefits, including lower investment costs for vehicle purchase, reduction of resource intensity of vehicle electrification by allowing the use of smaller batteries, improved logistics performance for ERS users and a more even time distribution of electricity grid load.
Using ERS can provide a distinct advantage for battery electric trucks. The battery size can be significantly reduced, from a range of 800-1200 kWh of usable energy that would be required for a day’s work to 100-400 kWh, while allowing to perform the same transport operations. With ERS, there is also no need to plan time for battery fast charging, because the battery of the truck is recharged while driving in motorway traffic. The lower battery size allows significantly reducing the required investment in vehicles and improves the return on investment, while maintaining the flexibility in operational pattern and suitability for different logistics business models. For fuel-propelled ERS vehicles, this benefit does not exist, because the ERS network fuel is used for propulsion.
There are several technology options available for developing ERS. They can be categorised in three technology groups: overhead catenary [OC], ground conductive [GC] and ground inductive [GI], depending on the used mode of power transfer. In this subchapter those three technology groups are described in detail and their characteristics included in summary tables to be used in modelling. Additionally, for providing a baseline of comparison we are modelling some of the commonly used road freight vehicles, like diesel [D] and liquified natural gas [LNG], and those under consideration for wide adoption like hydrogen fuel cell [FCEV] and battery electric [BEV].
3.2 Vehicles
It is assumed that heavy goods transport can use diesel, LNG, hydrogen, electricity from batteries and electricity from each of the three types of ERS for propulsion or charging. Also, selected hybrid combinations of all the fuels with ERS can be used. In this section, we describe our assumptions on vehicle purchase price, energy consumption, operation and maintenance costs, and also emissions.
3.2.1 Cost and Energy Performance
Several vehicle types are introduced in the model. There are vehicles that are powered from a single power source, like diesel [D], LNG, hydrogen [FCEV] or battery electric [BEV]. Also hybrid vehicles that can use ERS while on adequately equipped infrastructure, and other power source while elsewhere have been added, e.g. eHighway catenary-diesel [CAT-D], Elonroad ground conductive-LNG [GCE-LNG], Alstom ground conductive-hydrogen [GCA-FCEV] and Electreon ground inductive battery electric vehicles [IND-B200]. The list included in the model is exhaustive and includes all possible powertrain combinations, even if those are not being produced or investigated as good implementation alternatives by the technology suppliers.
As summarised in Table 1, we use several parameters that describe the energy and economic performance characteristics of each vehicle type.
Forecasting of vehicle technology developments that relate to energy efficiency improvements for the different technologies falls out of the scope of this research. Therefore, the future performance of technologies is not assumed, estimated, or modelled.
3.2.2 Energy Cost and Price
The energy cost and price that are used in the model are shown in Table 2. The cost column contains the electricity price that the ERS network operator would have to pay, estimated based on Eurostat data [9], but omitting the impacts of the Russia-Ukraine war energy price peak. The sale price of electricity by the network operator is set with 0.14 €/kWh markup, which was calculated to balance the requirement to cover investment costs of the network operator with economic sustainability of the catenary users, as the operator would do. The price of diesel is estimated based on Global Petrol Prices [10] for the Netherlands and Belgium also taking into account the phase-out of excise return system for professional diesel users in Belgium, [11]. The hydrogen price was determined based on Carbu.com, [12].
3.3 Infrastructure Cost
The model uses estimated infrastructure cost per kilometre of constructed infrastructure. In practice, this cost is project-specific and will vary a lot depending on the expected ERS vehicle flow, road layout, existing electricity infrastructure and geographic features which the road crosses. To facilitate estimating the infrastructure costs, interviews were held with all ERS technology providers: Siemens, Alstom, Elonroad and Electreon. All of them have some infrastructure construction experience, but not at large scale.
ERS infrastructure costs can be split into two major categories. The costs that are similar for all ERS approaches relate to generation and transmission of electricity. The technology-specific costs relate to the ERS itself with its supply and metering equipment and road equipment, Figure 2. The former is included in the electricity purchase price as included in the model based on Eurostat [9], therefore for the infrastructure cost we focus on the latter.
Since the expected ERS vehicle flow is the characteristic that has the most impact on the infrastructure building cost due to the impact on power requirement, it is included in the model as a determinant of the infrastructure build cost for specific road segments. Also, since the different technologies have different optimal capability to supply power, which means that in practice to supply the same power some technologies require lower kilometre coverage, for purposes of comparability reduce the cost of building a kilometre to reflect this.
Table 3 provides a summary of the cost estimations depending on daily ERS freight transport volume and recalculated to reflect the optimal ERS coverage. The cost figures are in million € and per km of ERS lane in single direction.
3.4 Geography
The geographical layout of the road network that is used in this work is obtained from two sources. For Flanders the Web Web Map Service (WMS) of Vlaams Verkeerscentrum that provides georeferenced maps and data over the internet is used. A technical description of the used WMS is available from Stuyts, [15]. For the Netherlands we use road shapefiles from Rijkswaterstaat, [16]. In both datasets each road in the data is divided into segments – streches of road between two successive points where traffic can join or leave the road.
We also use use the outline shapes of the Netherlands and Belgium from GADM, [17], which provides maps and spatial data for countries and their sub-divisions.
All Dutch data is in EPSG:28992 and Belgian data is in EPSG:31370 spacial coordinate reference system. Recalculation is done to align those for working in the same reference system.
3.5 Traffic Data
The truck traffic data for Flemish roads are obtained from Vlaams Verkeerscentrum, [18], for each road segment, and for Dutch roads from Rijkswaterstaat’s INWEVA database, [16]. Both datasets are at segment level and for an average day, but for modelling purposes we convert those to yearly volume for each road segment.
The traffic data for Flanders is available in split by vehicle type in which heavy goods vehicles are defined as those vehicles longer than 6.9 m and include all rigid or articulated vehicles. Similarly, for the Netherlands, the data covers medium and heavy goods traffic.
Recorded heavy goods vehicle traffic volumes are shown in Figure 3. Darker blue show lower, yellow shows medium and red shows high recorded traffic volumes. Motorways with fine dark grey lines have no recorded data available.
3.6 Identification of Alternative Routes
On the Rotterdam-Antwerp corridor, the alternative road connections that could be equipped with ERS are identified for further assessment. Only the motorways that link both ports are selected, and junctions and complex intersections where building ERS might be challenging are excluded, because ERS use on these sections would be limited due to the lane changes that truck traffic may have to do. Also, motorways within the ports themselves, like the section of R2 between A12 and E34 near Antwerp including Liefkenshoektunnel, and A15 from A4 junction to Maasvlakte are excluded due to their complex nature, and the fact that those distances can easily be covered by ERS vehicles without connection to the network.
Road segments to which double off- and on-ramps are joining are not excluded and we don’t consider them complex. It has been demonstrated in German ELISA project that catenary can be built with supports four lanes across, which is linked with higher construction costs related to overspan of the arms and higher construction poles. Also, it is assumed that road segments that are on bridges can be electrified, as it is especially easy on small overpasses.
With this approach, three alternative routes on this corridor are selected. The first route is on the west and goes from Antwerp on the A12 north through Bergen op Zoom to Rotterdam. The second, the middle route, starts from Antwerp on the A12, but near Bergen op Zoom turns eastwards on the A58/A17, passing Roosendaal and near Moerdijk joins the A16/E19 to Rotterdam. And the third route, on the east, is the E19 between Antwerp and Rotterdam. The map in Figure 4 shows the selected routes in red and other motorways in dark grey. The western route consists of 104 segments with a total length of 174.2 km, the middle route has 149 segments with the length of 188.1 km, and the eastern route has 106 segments over 179.9 km. Some sections of the routes overlap, meaning that a segment could be part of two routes. Route lengths are measured per segment, and don’t include sections where it is assumed ERS cannot be built.
3.7 Scenario Definition
For testing what the impacts of introduction of the different road freight vehicle propulsion technologies would be on the Rotterdam-Antwerp corridor, several adoption scenarios were constructed. A base scenario is developed based on vehicle stock data from Statistics Netherlands [19] and Statistics Belgium [20] to reflect the shares of adoption of various propulsion technologies in 2022. Each new scenario is then developed by substituting the share of diesel vehicles with the share of the technology that is tested in the scenario.
In addition to the base scenario, two types of scenarios are introduced in the model, Table 4. The first type is “pure technology” scenario, which simulates an unrealistic situation where all vehicles on a road use one specific technology, e.g. LNG or inductive ERS. These scenarios are used for reference and assessing the performance of individual technology in an isolated environment. The second type of scenarios simulate introduction of a particular technology to replace currently dominant diesel powertrains at a certain level – 5, 10, 15, 20, 30, 40 and 50 percent.
4. Findings
In this research, the construction and operation of different types of ERS on three alternative routes on the Rotterdam-Antwerp corridor was modelled. This section presents the findings that relate to the investment and operation of the infrastructure from the point of view of an infrastructure operator, its users, and the society.
4.1 Infrastructure Investment
When considering the construction of an Electric Road System (ERS), there are several factors that significantly influence the investment per route. First, the number and length of segments within the considered ERS route are important. A longer route with more segments requires a larger upfront investment than a shorter one. Also, the cost of electrification infrastructure itself, like overhead wires or conductive rail and the power supply equipment, will influence cost. Moreover, the coverage percentage of the route that is optimal for the specific technology is essential, according to discussions held with the technology providers. A lower coverage percentage implies that vehicles will be charging at a greater speed, while a higher coverage allows the charging speed to be lower for the same amount of electricity to be transferred for propulsion and charging the batteries.
Estimation of the investment cost is shown in Table 5. It is provided for each alternative route and separately for each ERS technology. For the calculation of the investment cost range, the actual traffic volumes on each specific motorway segment and modelled adoption rates were considered.
The cost estimations for the first western route range from 117.4 to 177.0 m€, for the middle route from 126.8 to 191.1 m€ and for the eastern route from 121.3 to 183.0 m€. It must be mentioned that the inputs for this calculation are purely based on the inputs that were received during the interviews with technology providers. They currently don’t yet have experience with constructing of infrastructure at this scale, therefore some over- or underestimations are possible.
The investment cost comparison allows seeing approximate investment costs that one would have to account for when building ERS in this corridor. The purpose here is not to guide technology choice, because it cannot be claimed that lower investment costs make the technology better and it therefore should be opted for. Other ERS infrastructure performance characteristics, like longevity, power transfer capability, related vehicle equipment cost and performance characteristics, and other operational characteristics and issues should be considered when choosing the “best” technology for implementation. Evaluation of the full range of these criteria falls out of the scope of this research.
4.2 Profitability of Infrastructure Operator
As part of the analysis, we conducted ERS infrastructure operator profitability calculations by taking into account its revenues and costs under a wide range of scenarios and considering varying levels of technology adoption. This analysis allows gaining insights into the financial viability of the infrastructure operator.
The calculations were done for each route separately and compared. The third route, for which profitability heatmap is shown in Figure 5, provides the best return on investment for the ERS infrastructure operator. In the heatmap, each row represents the use of different ERS technology, and each column represents the adoption of that technology as a share of total traffic on the route. The table colours represent the level of profitability of the operator from red – unprofitable, to green – profitable. The values in the table show the profit or loss of the infrastructure operator for a specific technology adoption level. It can be seen that already at a modest level of adoption the operator can be profitable.
Based on the calculations for all three routes, it can be concluded that break-even of the investment and operation of ERS infrastructure depends on two factors: the electricity sale price and the technology adoption level. Those two determine the return that the initial investment is bringing. The operator has the incentive to keep the electricity sale price low, because other alternatives to ERS exist. The adoption level can expedite reaching the break-even point. The investment cost of the technology, although important, has lesser impact and is of secondary concern when choosing the technology for implementation.
From the economic perspective of the ERS operator, the eastern route, route 3, is clearly the best to be electrified. This is true even though concerning the investment cost, this is not the cheapest option. The profitability of the operator is the best because of the traffic volumes that allow wider use of the network and higher revenues for the operator.
Other routes can also be operated profitably, although this would probably be considered as an economically rational option only at higher levels of adoption of ERS technology and when the first-best option is already operational. This could, given certain policy goals, be also implemented as a suboptimal solution with government financial support, if for some reason it were considered that traffic should be shifted from route to route.
There seems to be potential for the ERS to achieve a flywheel effect, where, as the adoption of the technology grows, the infrastructure operator can reduce the electricity price charged to clients, leading to more road freight operators using the system. This has the potential to lead to a loop that reinforces itself.
We conclude that a wider electrified network is not a prerequisite for ensuring viability of ERS on Rotterdam-Antwerp corridor. Picking a route with high enough traffic levels and therefore adoption potential, like eastern route in this case, is sufficient. The existence of an interoperable ERS network in the vicinity, with which ERS traffic could connect with or without gap would significantly strengthen the business case of the infrastructure operator, as shown in [21].
4.3 Economic Performance of Road Freight Transport Operators
The economic performance of ERS for road freight transport is described in this section. By simulating the truck operation on each of the three routes the cost performance of each of the technologies, as compared to diesel vehicle total cost of operation, is determined. The comparison is based on the cost per km. This simulation includes both, the part of the driving that trucks drive on the ERS network, and also the distances that trucks drive off the network to reach terminals in the port or clients off the ERS network.
For route 3 – the best one to be electrififed – the total cost performance in percentage terms is shown in Figure 6.
Calculation for road freight transport operators show that from their cost perspective the route 3 is the best to be equipped with ERS. This is because it allows running of the vehicles with lowest cost for the road freight transport operator. This is true for all technologies, except those that involve use of LNG, because the relatively much lower LNG price as input to the model. Also, from the perspective of serving clients, due to the higher density of industry along the third route, choosing to electrify this route seems the most rational, as it would allow a larger number of companies to reduce their transportation costs.
What would use of ERS mean for road freight transport operators from the perspective of profitability? Road freight transport operations occur in a highly competitive market, and there are no trade secrets or marketing actions that would allow a company to distinguish themselves from the competition. The entry barriers in the market are low and operators are price takers.
A situation where a new technology, like ERS in this case, that allows changing the cost of providing the transport service appears is shown in Figure 7. Initially two (or more) competing firms are using the same technology (currently dominant diesel trucks) and basically have similar total cost curves ac10 and ac20. The firms produce transport service at quantities of q10 and q20. As the possibility to start using ERS arises, the firm 1 chooses to stick with the currently dominant technology, but the firm 2 chooses to invest in a different technology and shifting its average cost curve from ac20 to ac21. Having the opportunity to produce transport service at a lower cost, firm 2 as a rational actor produces and sells more transport service (q20 to q21) at a lower price than before p1 and gains additional profit which corresponds to the difference between its average cost curve and the sale price, marked with green rectangle in the chart. The new price for the transport service has now become p1. At this price the first firm, which did not adopt ERS, still has the previous cost curve ac10, while the price in the transport market is p1. The new price in the market is not sufficient to cover the first firm’s costs, therefore it starts making a loss, shown with yellow rectangle in the graph, while still producing quantity q11 of transport service. If no action is taken, firm 1 eventually goes bankrupt. As the market participants are forced to make technological upgrades or face bankruptcy, the cost curves of all transport operators equalise and the first mover profit from the new technology disappears.
4.4 Potential Demand
The heavy goods vehicle traffic volumes on the Rotterdam – Antwerp corridor vary greatly depending on the road segment and its location. This variance is best shown in Figure 8 showing a map with the traffic and the colour intensity bar for reference. The low traffic intensity is shown with blue, while medium with green and yellow, and high with red.
To understand the transport flows between the regions of Rotterdam and Antwerp, we use transport flow data [22] that provide road freight traffic flows between NUTS 3 regions (port of Rotterdam is in NUTS 3 region NL339 Groot-Rijnmond and the port of Antwerp is in regions BE211 Antwerpen and B236 Sint-Niklaas) and assign them to the E-road network. The data shows that 2.3% of the heavy goods vehicles that leave the port of Rotterdam region are heading to the port of Antwerp region. And in the opposite direction, 2.1% of the heavy goods vehicles from the port of Antwerp region are heading to the port of Rotterdam region. When looking at the total motorway truck traffic, the majority of the traffic that passes the Rotterdam-Antwerp corridor is either local or passes in transit, and only approximately 0.5% of the trucks that appear on the Rotterdam-Antwerp link are moving between the areas of the two ports.
Given the calculation results of the infrastructure operator, it is clear that there is no way the road freight traffic between the ports of Rotterdam and Antwerp alone can be sufficient to justify the construction of ERS on the road link, unless financial support is provided from the government for infrastructure investment. This could, of course, change if trade patterns were to change substantially, which seems unlikely.
The other traffic on the corridor, however, can be served in an economically sustainable manner that ensures the profitability of the ERS. Depending on the specific technology used, the profitability threshold of infrastructure operator starts at approximately 5% of the traffic flow. There the majority of traffic could be local freight traffic serving the ports and industrial locations along the electrified road section, and the traffic between ports could contribute up to a maximum of 0.5 percentage points.
The technology transition and as shown in Figure 6 related cost reduction by 4.6 to 10.2% for ERS “-B200” and “-B100” trucks, which would most probably be the ones most often chosen, allows shifting the transport operator cost curve substantially, as shown in Figure 7. For road freight transport where profitability of the transport operators is often reported in the range of 0.8 to 3.5% from sales, a cost reduction of several players on the scale that ERS enables would ensure price reductions in the market and undermine the non-adopters, as the price would fall under their average cost curve. This leads to believe that ERS, once proven by a few early adopters, would experience a rapid adoption by road freight operators with trucks driving sufficiently on the electrified stretches of the motorway, e.g. those that have important clients served by the electrified road.
5. Conclusions
This paper investigated the impacts implementation of ERS would have on the Rotterdam-Antwerp motorway corridor. This is a part of the road network that links two of the largest ports in Europe in the Netherlands and Belgium.
In the investigation, we noticed that that the advantages of ERS that have been demonstrated in previous research [21] remain in the corridor setting. For road freight operators the use of smaller batteries is still feasible and allows for substantial reduction in investment costs, which translates in overall cost savings per driven kilometre. There is also an external benefit of reduced resource intensity associated with vehicle electrification. The flexibility of the operational pattern of the vehicles, which is an important advantage of the currently dominant diesel vehicles, can to a degree be retained even in the corridor setting.
From modelling the alternative ERS routes, we conclude that the third route, on the east, which mostly runs on the E19 between Rotterdam and Antwerp, with modelled 106 ERS segments over 179.9 km, has the best potential for implementation from the point of view of both the road freight operators and the ERS operator. For the operators, it ensures a larger number of warehouses, industrial locations and terminals to serve along the motorway and a quicker ammortisation of vehicle investment cost. And for the infrastructure operator this is the route that ensures the highest potential usage of the network and therefore higher return on investment and lower adoption rates to reach break-even point and profitability.
For route 3, the best one to electrify, the investment cost for the 179.9 km of the electrifyable motorway depending on the technology and adoption rates ranges from 121.3 to 183 million €. The cheapest route to electrify, route 1, is counterintuitively not the best for doing that, because of lower traffic levels, less use cases and the higest adoption rates required to reach infrastructure operator profitiablity.
We also notice that the traffic between Rotterdam and Antwerp port regions alone is not sufficient for justifying ERS for that purpose even if all that traffic were to be forced to use it. The other traffic, however, seems sufficient to justify the investment, especially on route 3, where starting from approximately 5 % of the traffic using ERS ensures operator profitability.
Implementation of ERS at a small scale is sub-optimal because this means that it can serve only a small part of clients using that road – operators that use specifically that road stretch for a substantial part of their operations. Other market participants would be excluded, because for them the potential savings would not outweigh the additional cost of equipping their vehicles. The infrastructure operator will understand that building additional ERS on adjacent road sections improves the economic performance of existing electrified road sections. There is an optimum network size for an operator, as highlighted by Aronietis & Vanelslander [1], but at a much larger scale than Rotterdam-Antwerp corridor.
For some transport operators, that happen to have specific client base, for instance where they usually serve clients from one of the ports along the electrified route, the construction of ERS on the route can prove to be very lucrative for the early adopters. As the road freight operator would charge the market rate to his clients, its cost curve with the use of ERS would shift substantially lower, allowing for above average profit. This would only apply to early adopters, as market rates would adapt as more transport companies adopt the technology.
Author Contributions
Conceptualization, R.A. and T.V.; methodology, R.A.; software, R.A.; formal analysis, R.A.; investigation, R.A.; resources, R.A.; data curation, R.A.; writing—original draft preparation, R.A.; writing—review and editing, T.V.; visualization, R.A.; supervision, T.V.; project administration, T.V.; funding acquisition, T.V. and R.A. All authors have read and agreed to the published version of the manuscript.
Funding
This research was funded by Department of Mobility and Public Works, Flanders, Belgium.
Acknowledgments
The authors of this research extend their gratitude to Dan Zethraeus, CTO & Founder of Elonroad, Andreas Wendt, Regional Director at Electreon, Patrick Duprat, Competitiveness and R&D Director at Alstom, Patrik Akerman, Head of eHighway Business Development at Siemens Mobility and Toon Wassenberg, Mobility advisor at Siemens Mobility BeLux. They generously shared their knowledge and insights through interviews, greatly enriching the quality and depth of this report. Their willingness to contribute their expertise to our research has been invaluable.
Conflicts of Interest
The authors declare no conflicts of interest. The funders had no role in the design of the study; in the collection, analyses, or interpretation of data; in the writing of the manuscript; or in the decision to publish the results.
References
- Aronietis, R.; Vanelslander, T. Economic Impacts of the Catenary Electric Road System Implementation in Flanders, Logibat Project WP2 for VIL; Antwerp, Belgium. 2021. [Google Scholar]
- Movares Verkenning Electric Road Systems; Movares: The Netherlands, 2020.
- Decisio; EV Consult; Sweco Analyse Kosteneffectiviteit Electric Road Systems (ERS) Voor Nederland; Amsterdam. 2022.
- Gnann, T.; Plötz, P.; Kühn, A.; Wietschel, M. How to Decarbonise Heavy Road Transport? 2017.
- Advanced Propulsion Centre UK For Pack Level Battery Costs, OEMs Are Converging around $100/kWh in 2025 and $80/kWh in 2030. 2021.
- Transport & Environment Comparing Hydrogen and Battery Electric Trucks. 2020.
- Smajla, I.; Karasalihović Sedlar, D.; Drljača, B.; Jukić, L. Fuel Switch to LNG in Heavy Truck Traffic. Energies 2019, 12, 515. [Google Scholar] [CrossRef]
- Mottschall, M.; Kasten, P.; Rodríguez, F. Decarbonization of On-Road Freight Transport and the Role of LNG from a German Perspective; Berlin, 2020. [Google Scholar]
- Eurostat Electricity Prices for Non-Household Consumers. Available online: https://ec.europa.eu/eurostat/databrowser/view/nrg_pc_205/default/table?lang=en (accessed on 14 September 2023).
- GlobalPetrolPrices Diesel Prices around the World. Available online: https://www.globalpetrolprices.com/diesel_prices/ (accessed on 14 September 2023).
- UPTR Professionele Diesel. Available online: https://uptr.be/nl/informatie/professionele-diesel/ (accessed on 14 September 2023).
- Carbu.com Prix Des Carburants, Bornes de Recharge Pour Voitures Électriques, Additif Diesel AdBlue. Available online: https://carbu.com/belgique//liste-stations-service/HYDROG/Woluwe-Saint-Pierre/1150/BE_bx_50 (accessed on 14 September 2023).
- PitPoint Prijzen 2023.
- Strande, R.; Johnsson, T. Energy & Marine. 2013,.
- Stuyts, M. Verkeerscentrum WMS Service Info. Available online: https://wms.michelstuyts.be/service.php?id=346&lang=nl (accessed on 18 November 2021).
- Rijkswaterstaat INtensiteit WEgVAkken (INWEVA). Available online: https://nationaalgeoregister.nl/geonetwork/srv/dut/catalog.search#/metadata/f58eacc9-ca69-487a-a53b-11efad0bbba0 (accessed on 25 April 2023).
- GADM GADM. Available online: https://gadm.org/download_country_v2.html (accessed on 25 April 2023).
- Vlaams Verkeerscentrum Verkeerscentrum WMS Service. Available online: http://indicatoren.verkeerscentrum.be/geoserver/ows (accessed on 25 April 2023).
- Centraal Bureau voor de Statistiek Bedrijfsvoertuigen actief; voertuigkenmerken, regio’s, 1 januari. Available online: https://www.cbs.nl/nl-nl/cijfers/detail/85239NED (accessed on 9 July 2023).
- Statbel Voertuigenpark. Available online: https://statbel.fgov.be/nl/themas/mobiliteit/verkeer/voertuigenpark (accessed on 7 September 2023).
- Aronietis, R.; Vanelslander, T. Economic Impacts of the Catenary Electric Road System Implementation in Flanders. International Journal of Sustainable Transportation 2023, 0, 1–16. [Google Scholar] [CrossRef]
- Speth, D.; Sauter, V.; Plötz, P.; Signer, T. Synthetic European Road Freight Transport Flow Data. Data Brief 2022, 40, 107786. [Google Scholar] [CrossRef] [PubMed]
Figure 1.
Modelling approach
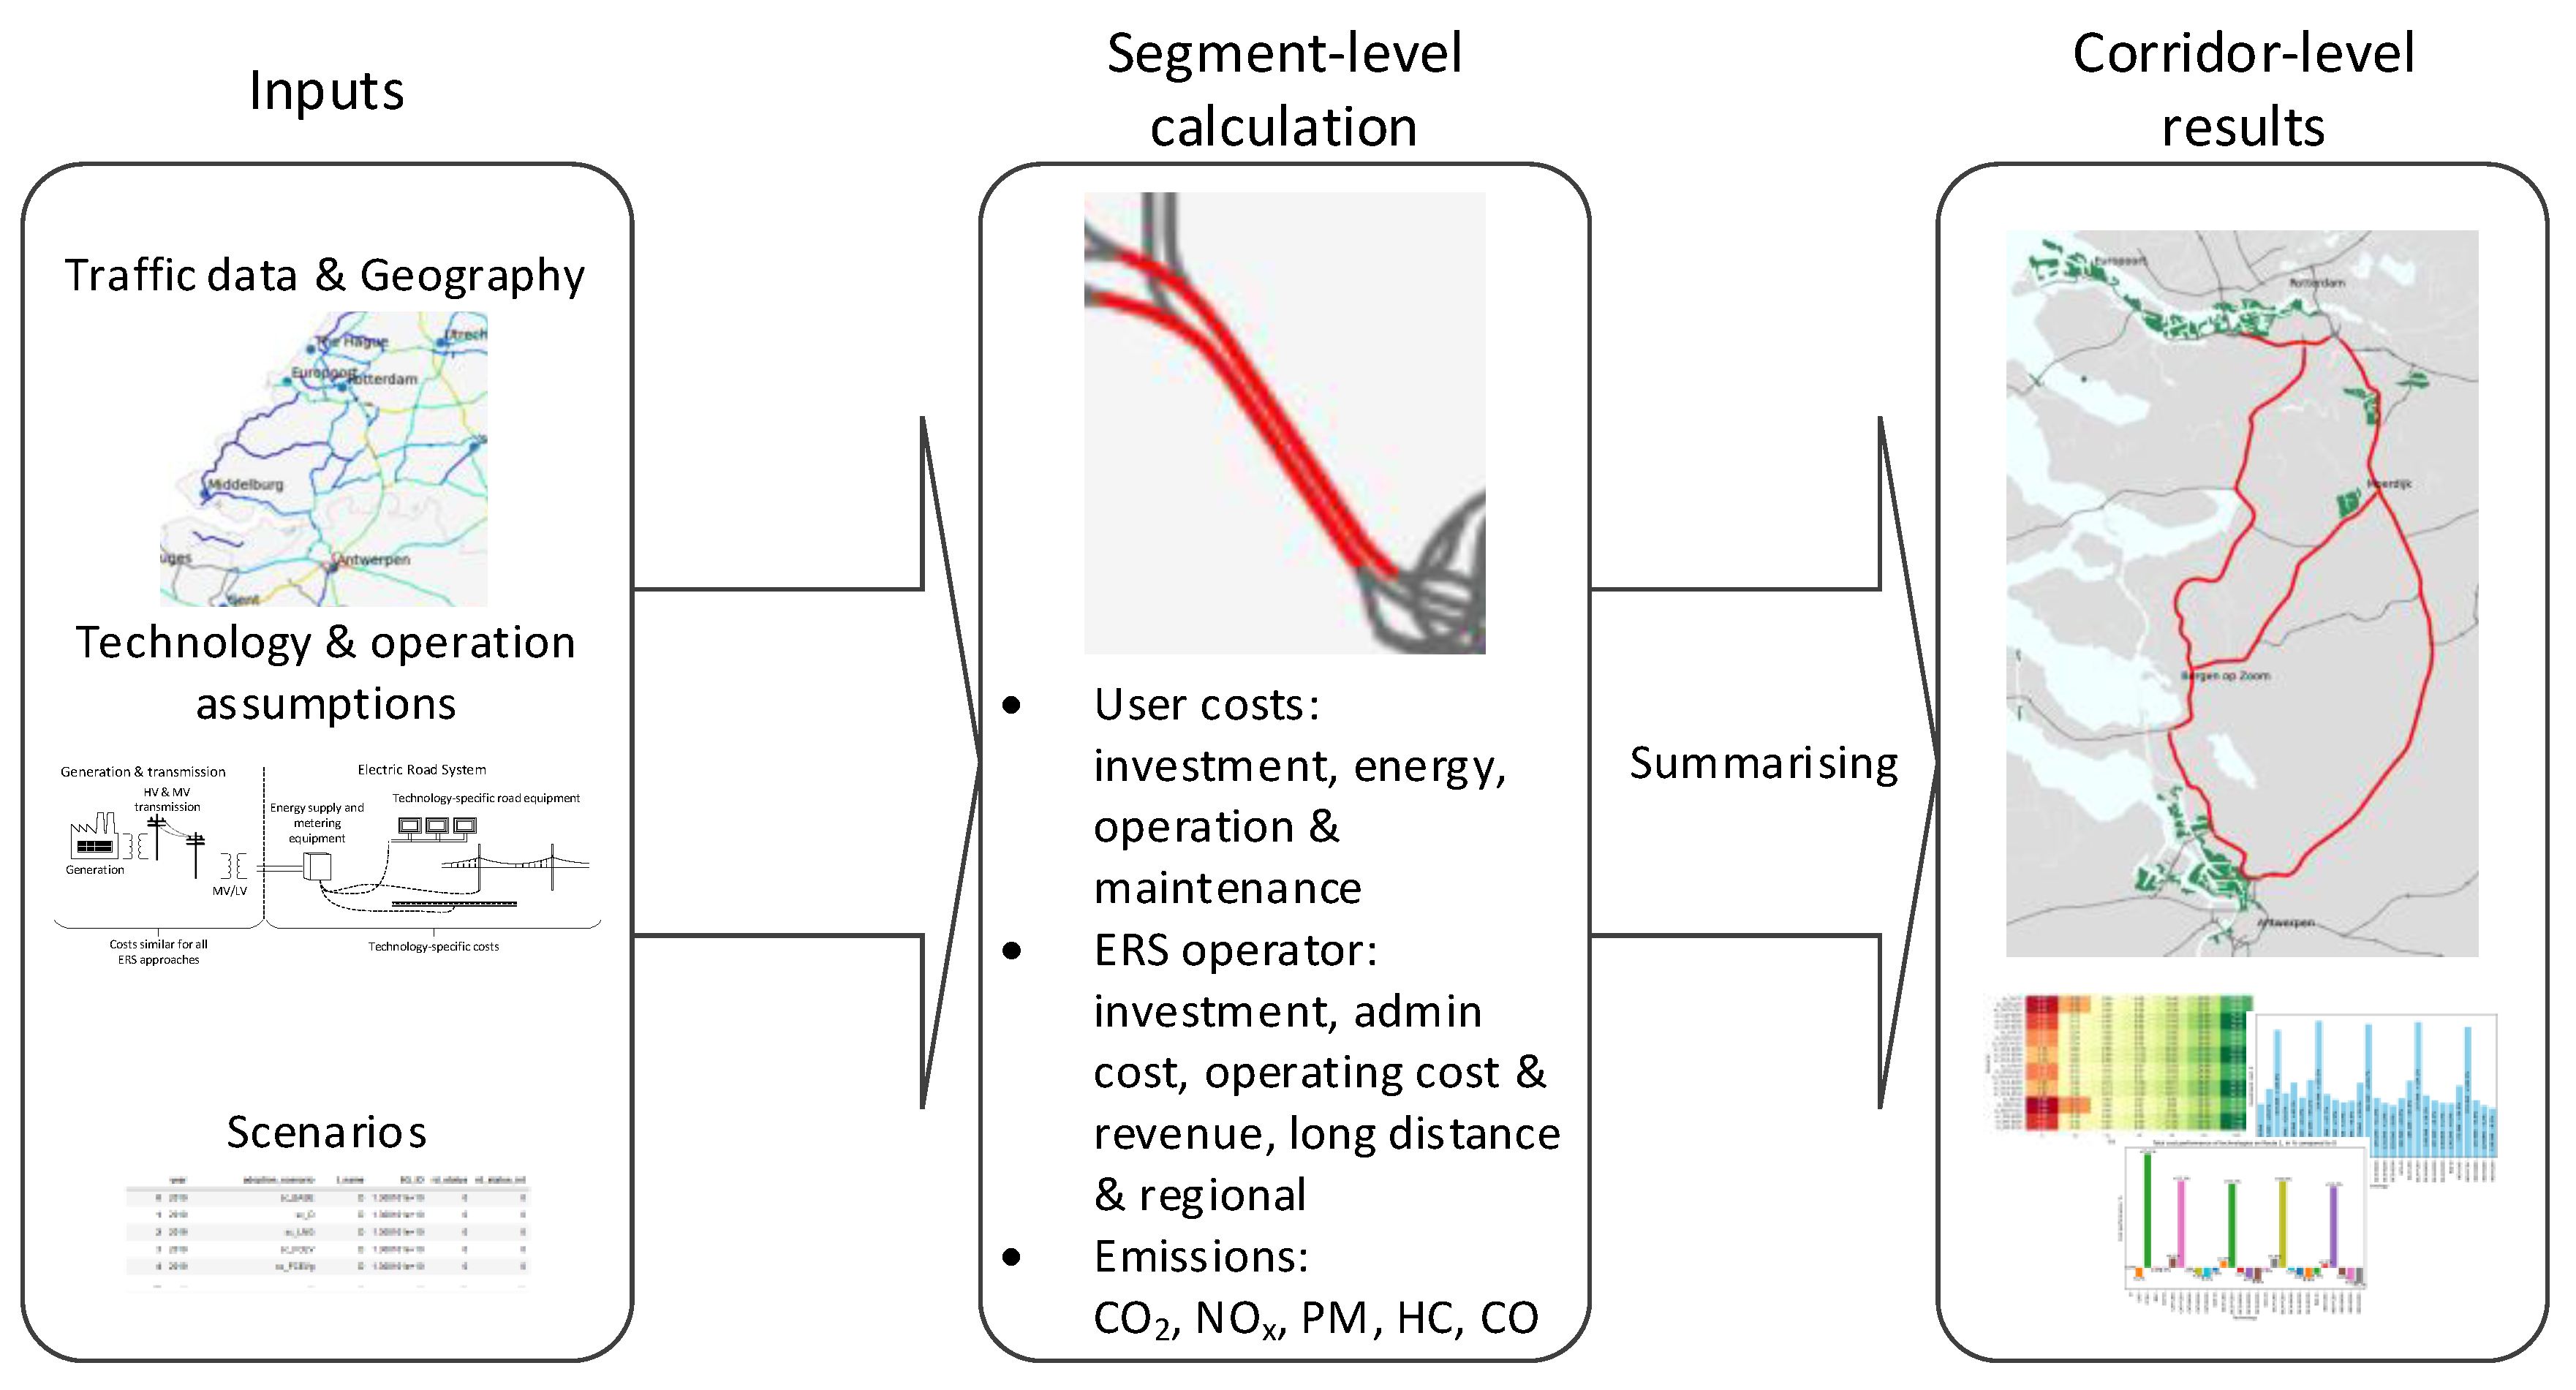
Figure 2.
ERS infrastructure costs
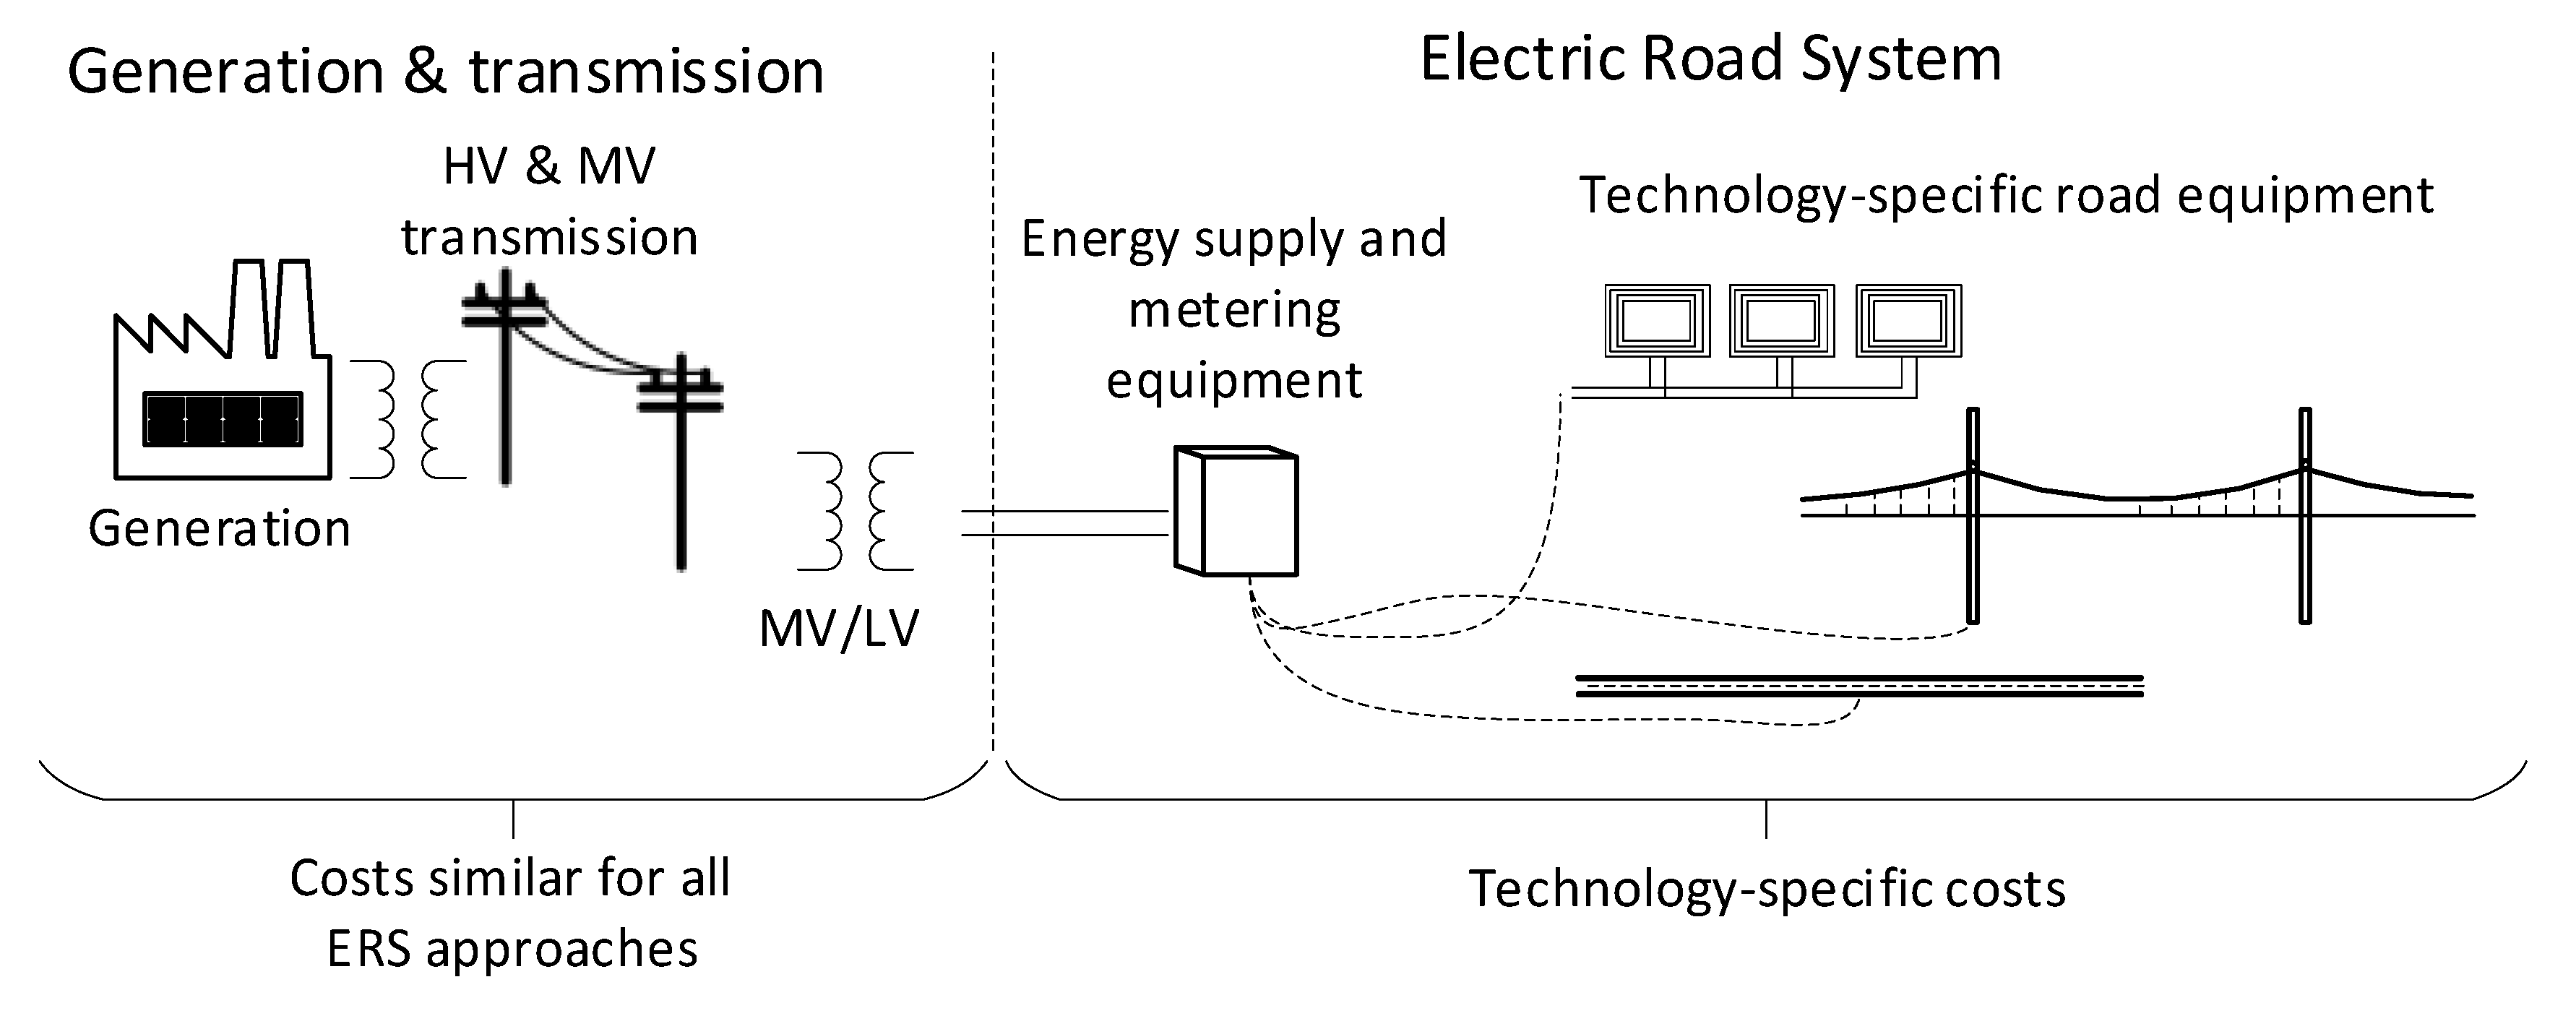
Figure 3.
HGV motorway traffic intensity in the Netherlands and Flanders Intensity shown with colours, from blue – low, yellow – medium, to dark red – very highData source: Rijkswaterstaat [16] and Vlaams Verkeerscentrum [18]
Figure 4.
Rotterdam - Antwerp corridor, selected routes
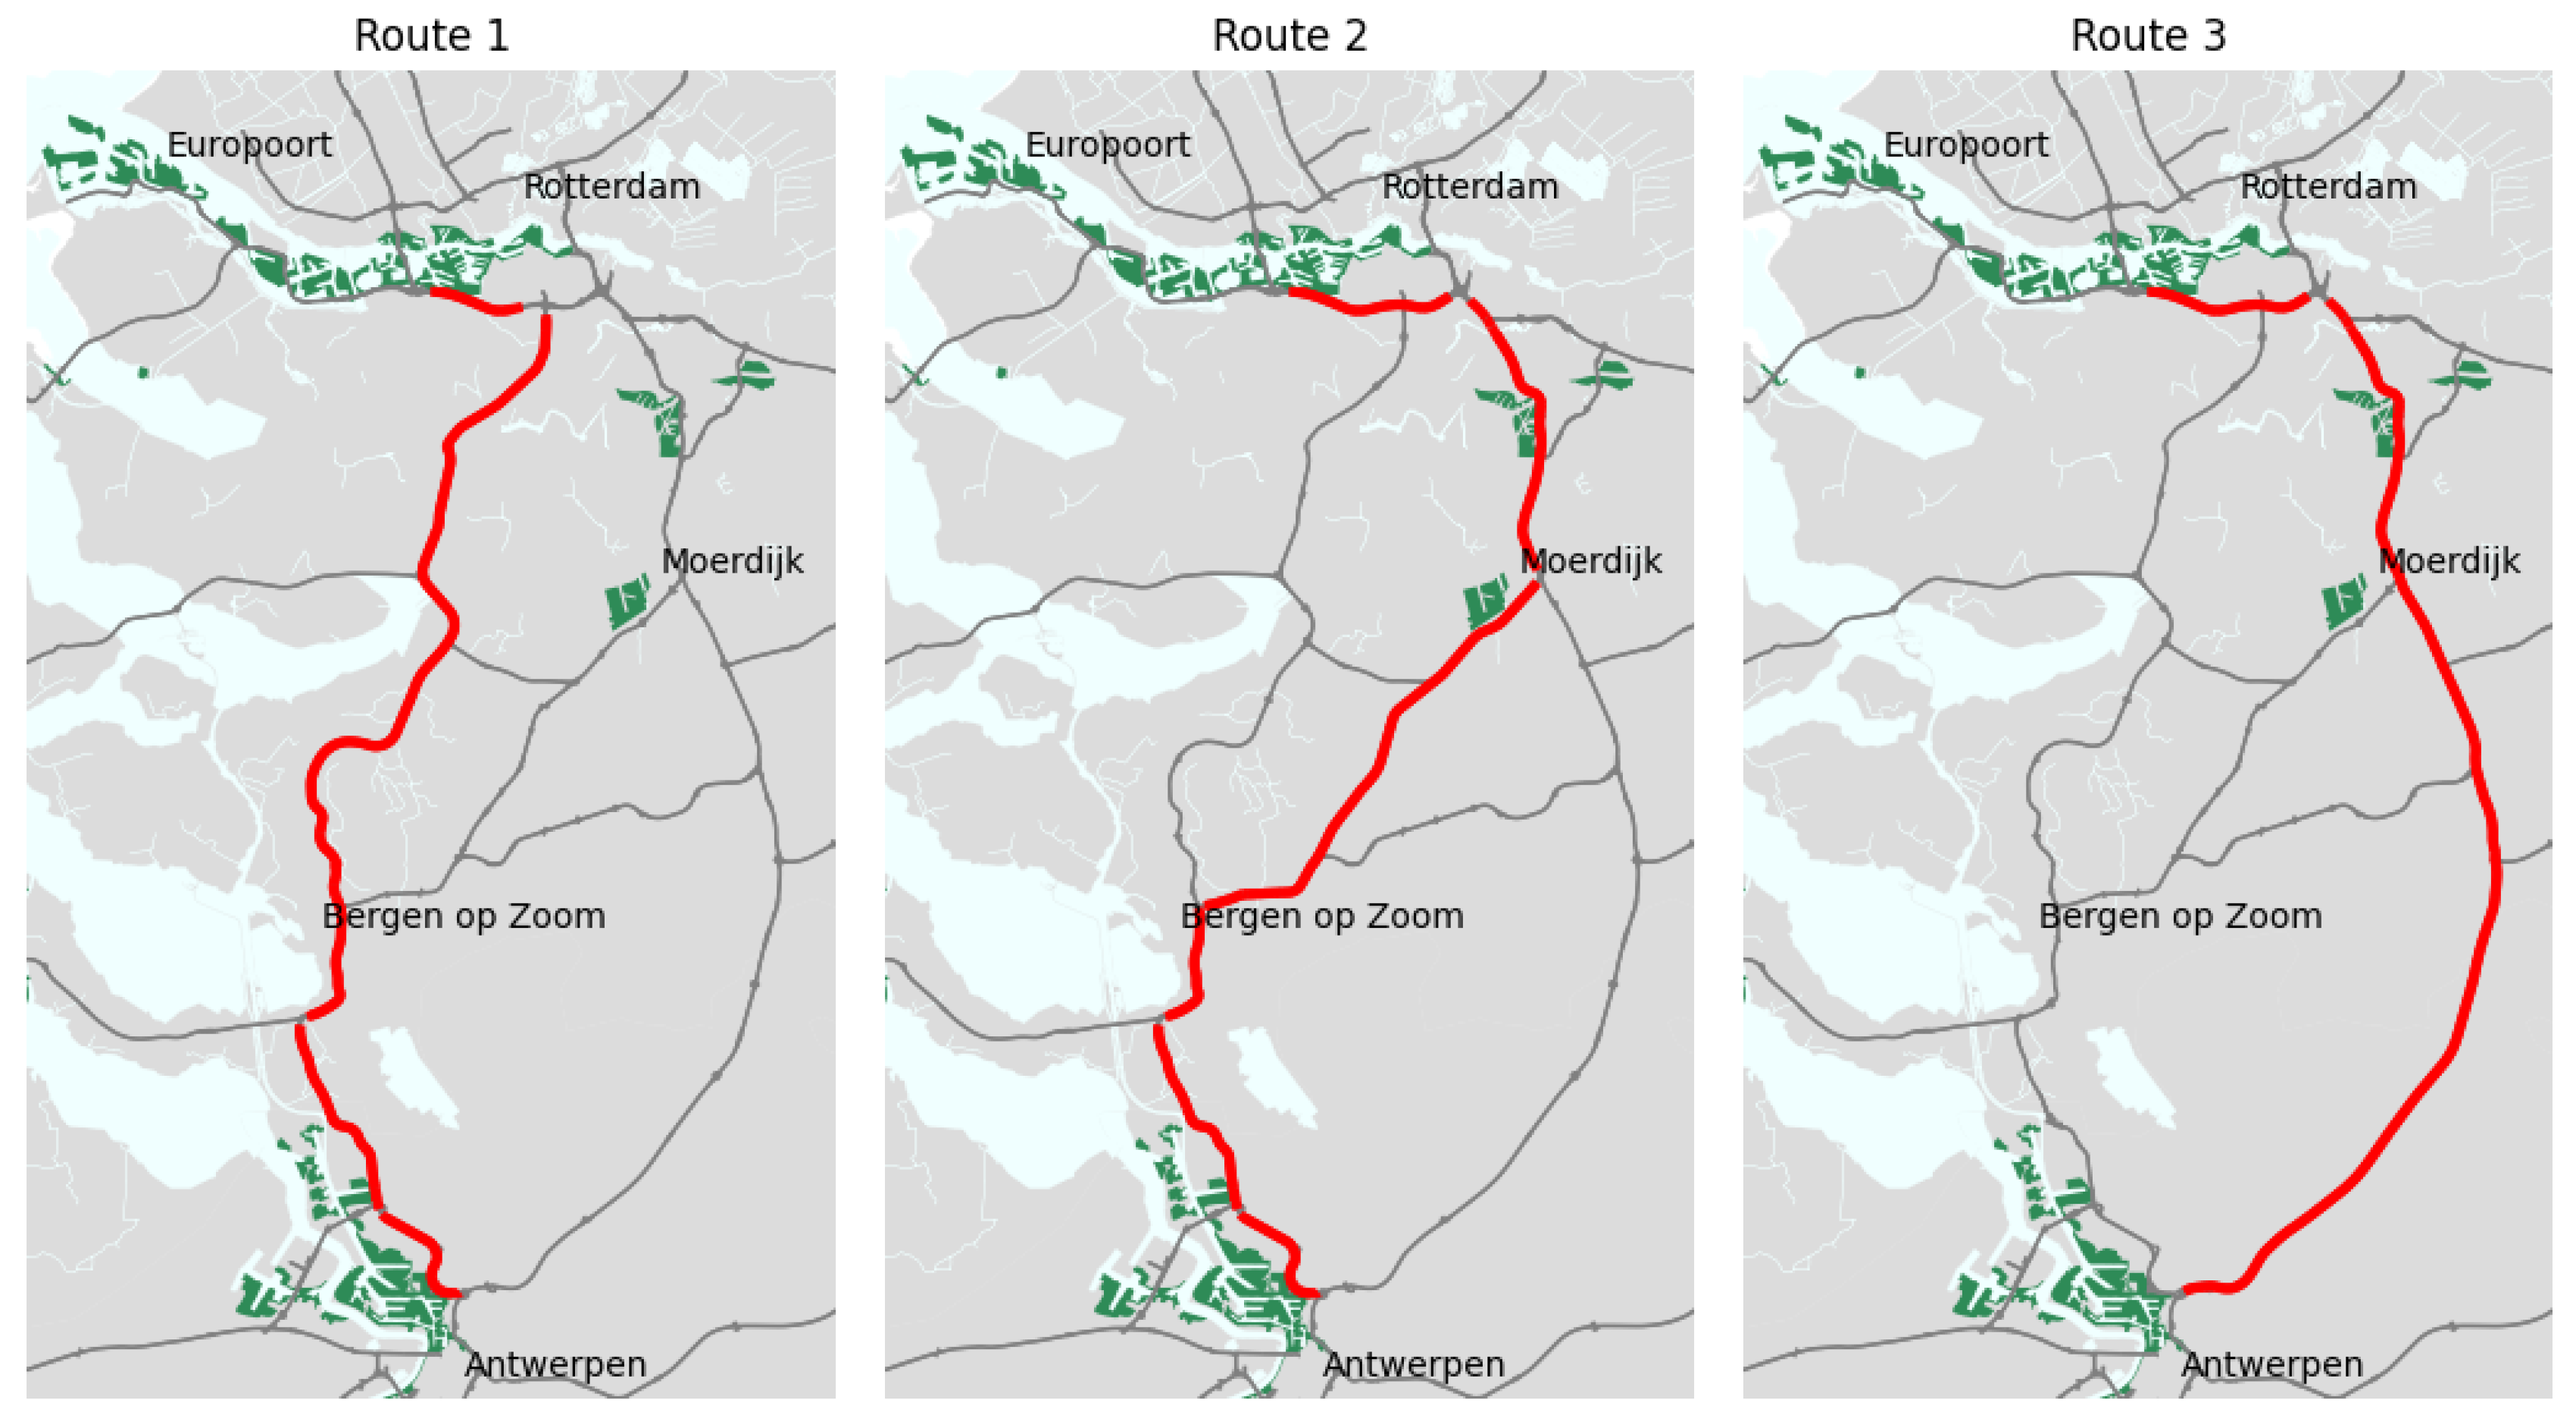
Figure 5.
Heatmap of ERS operator profitability per adoption scenario, Route 3, m€
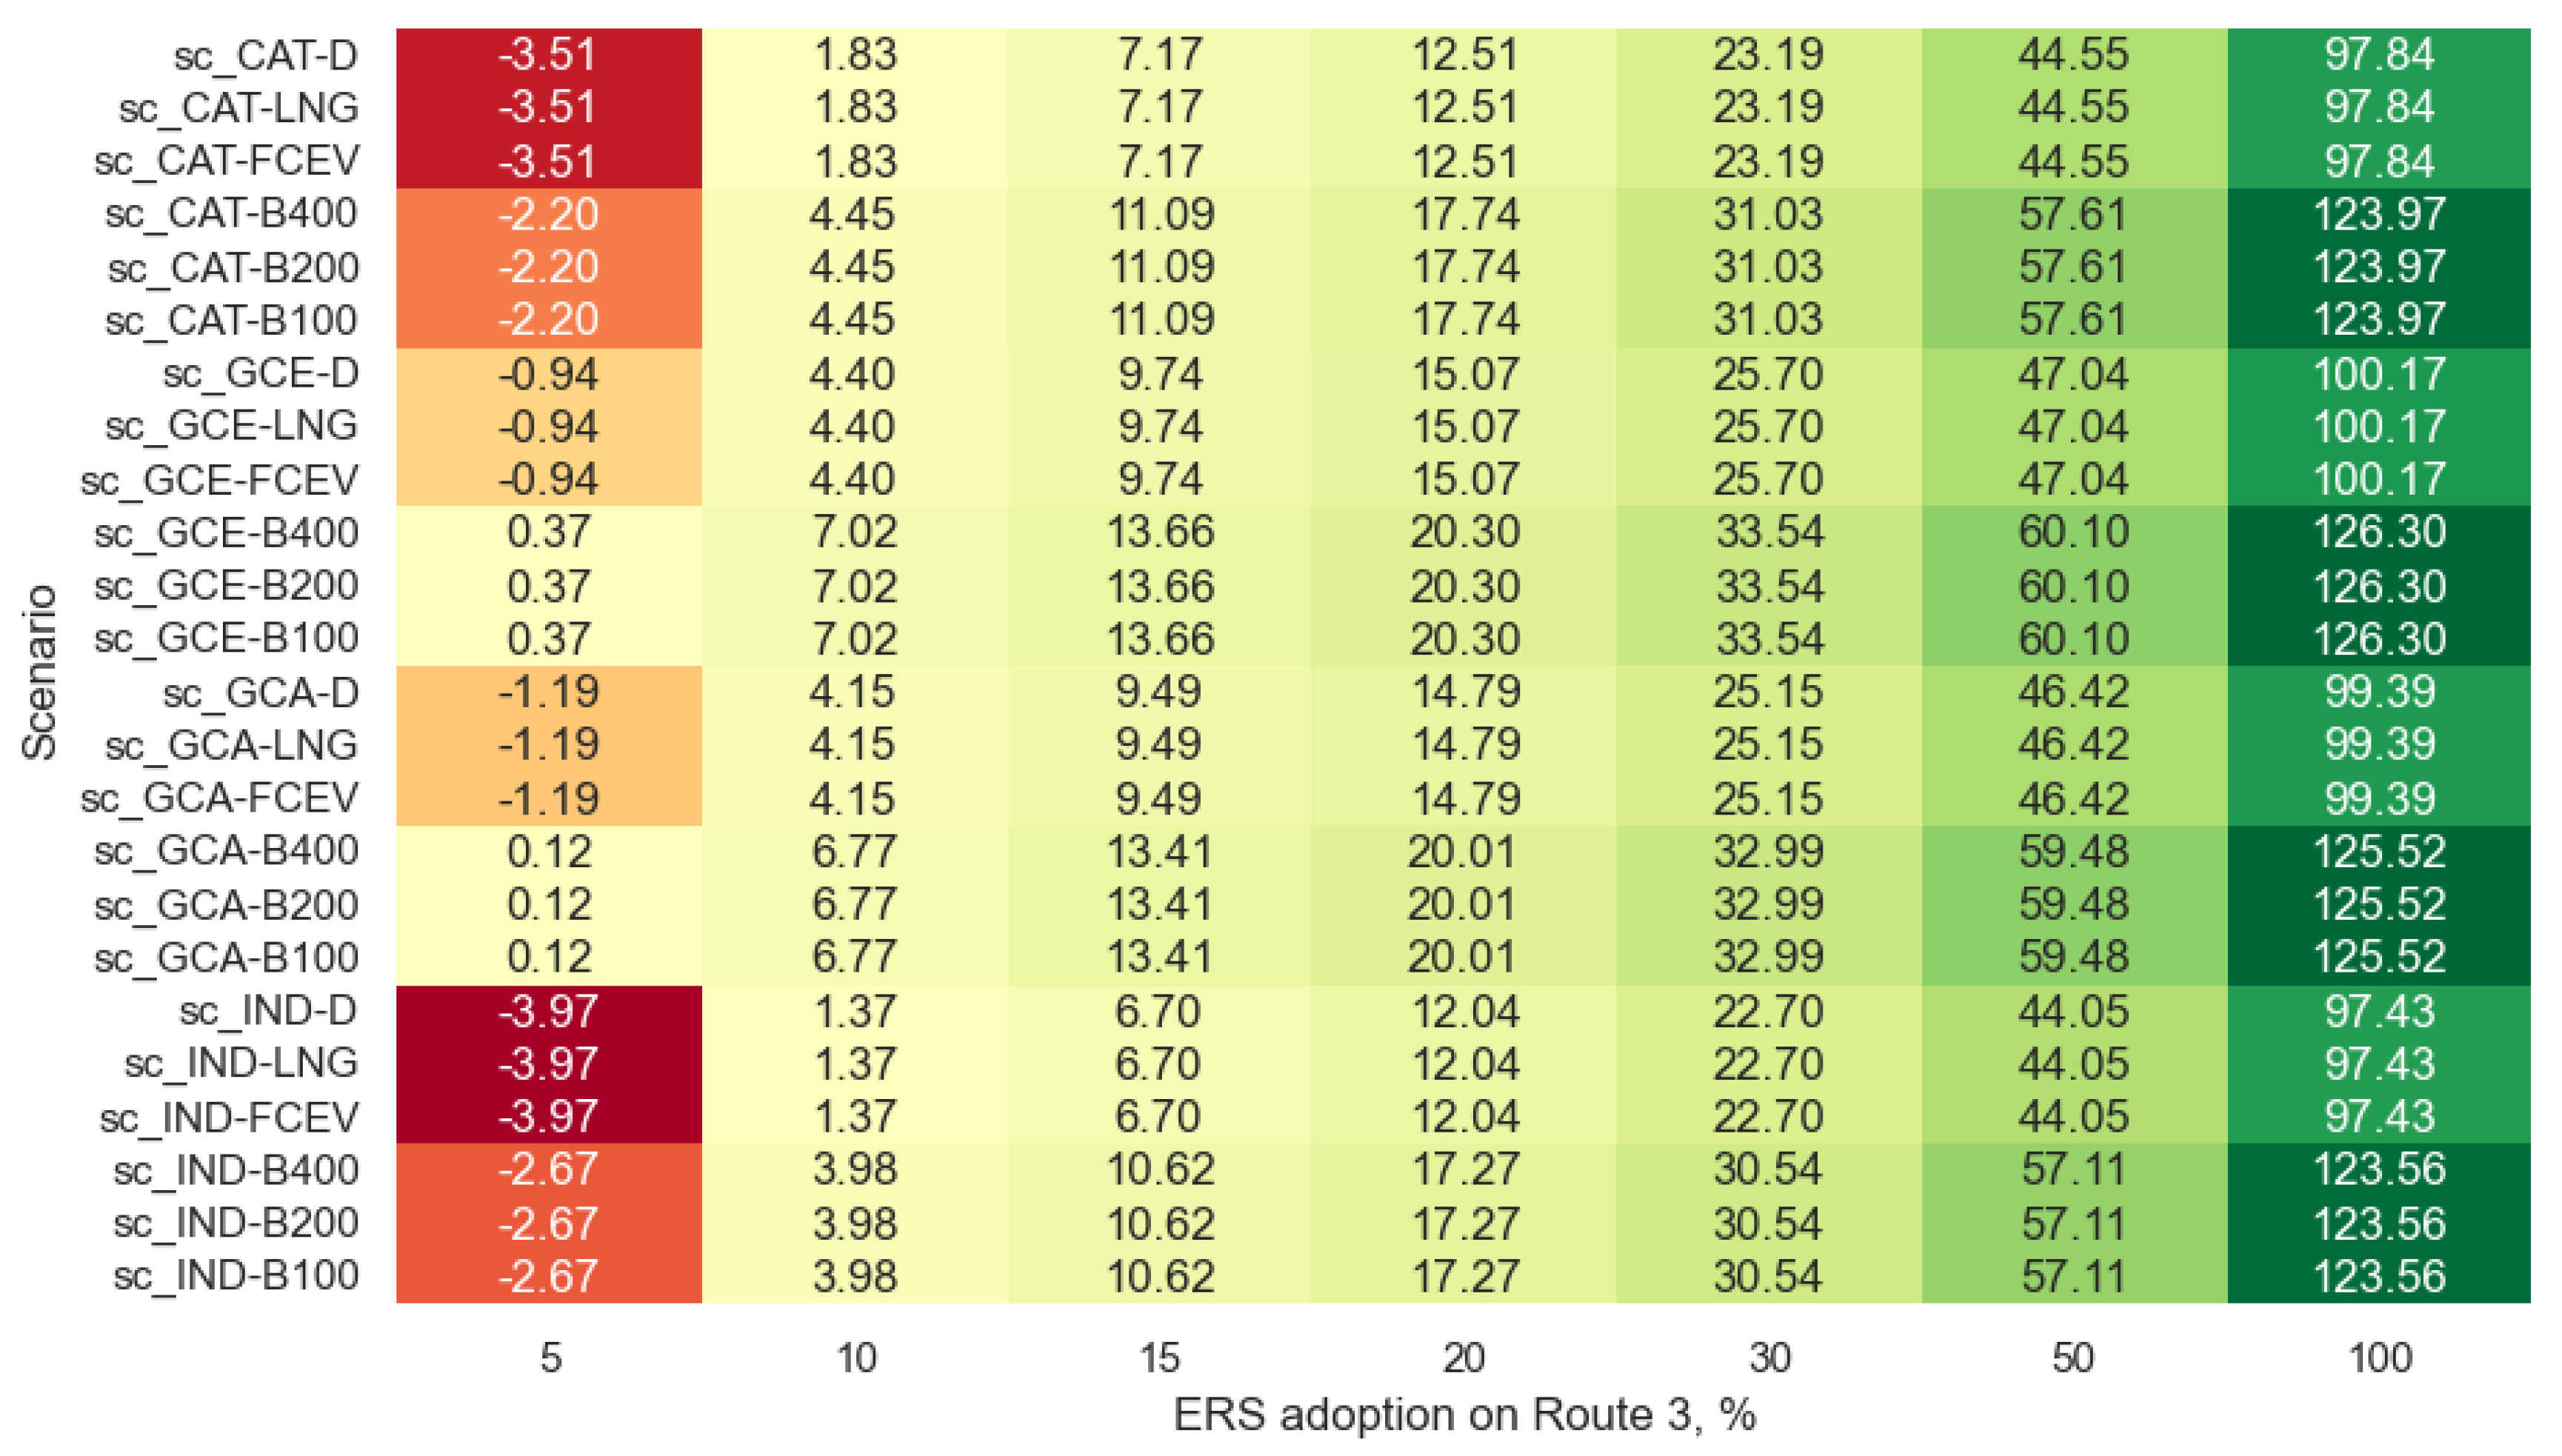
Figure 6.
Total cost performance of technologies on Route 3, in % compared to D
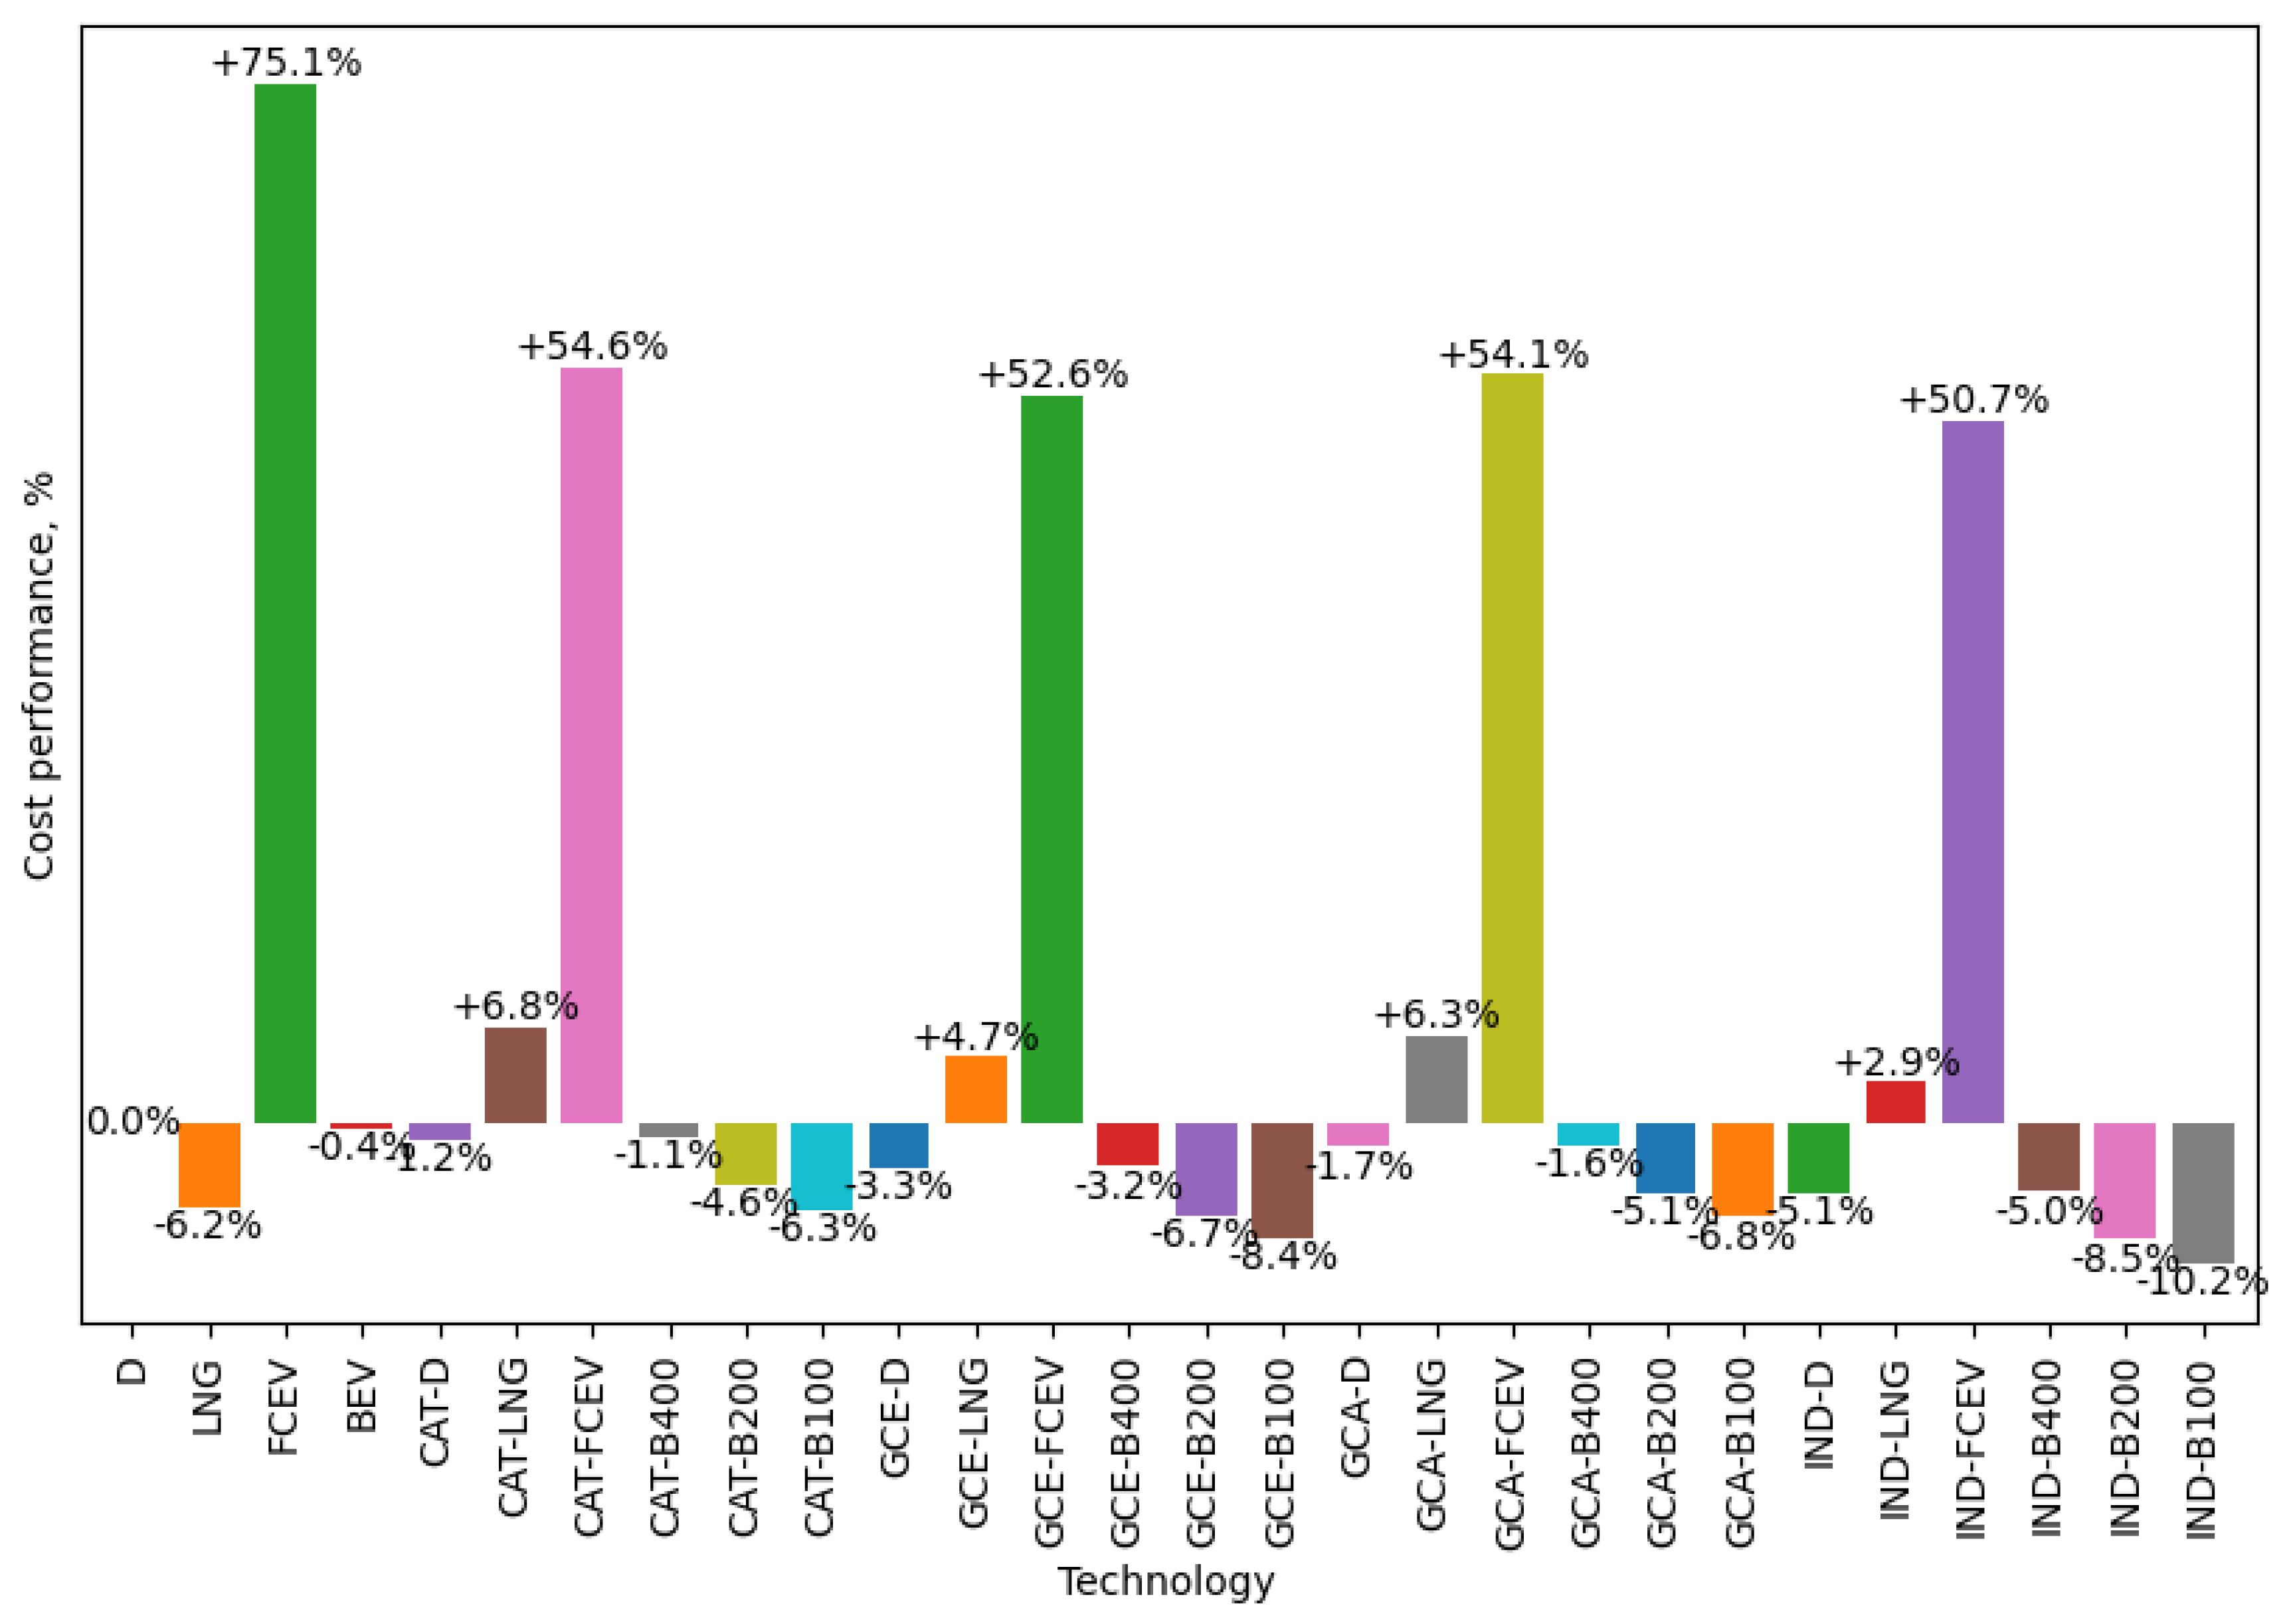
Figure 7.
Impacts of technological change on road hauliers p – price, q – quantity, mc – marginal cost curve, ac – average cost curve, 0 – equilibrium before technological change, 1 – equilibrium after technological change
Figure 7.
Impacts of technological change on road hauliers p – price, q – quantity, mc – marginal cost curve, ac – average cost curve, 0 – equilibrium before technological change, 1 – equilibrium after technological change
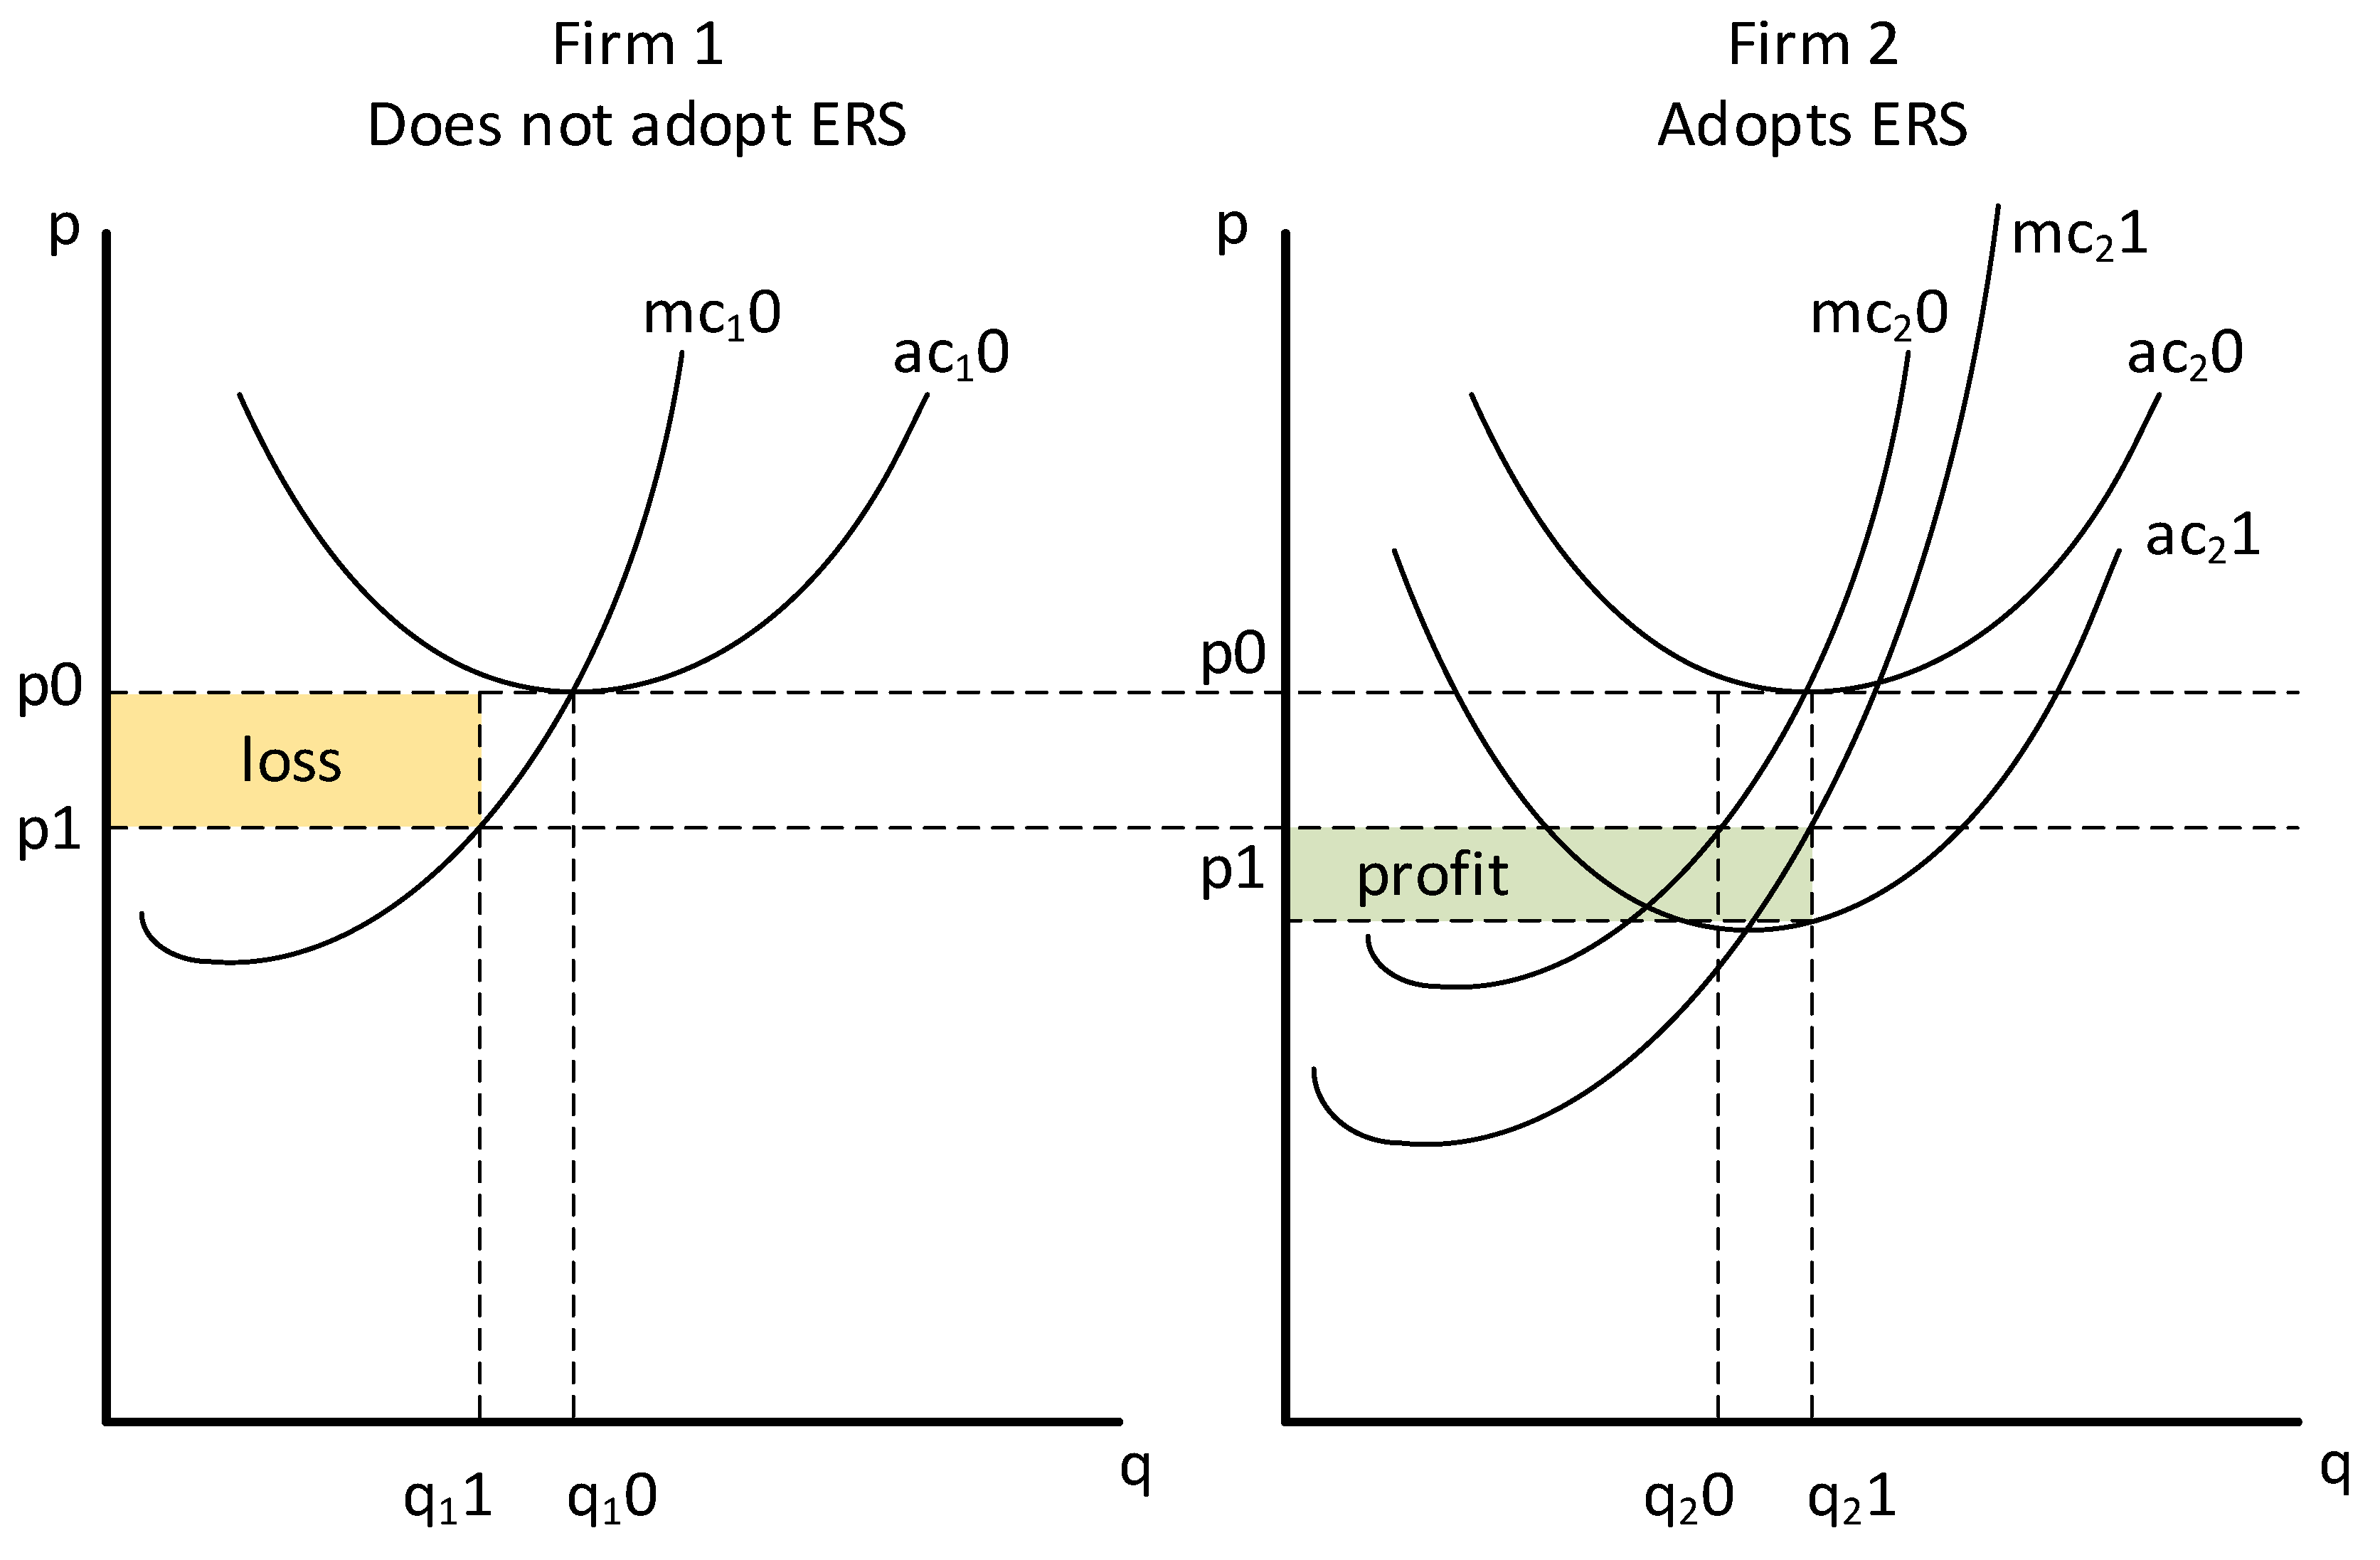
Figure 8.
Road freight traffic intensity in Rotterdam-Antwerp area, vehicles/day Data source: [16] and [18]
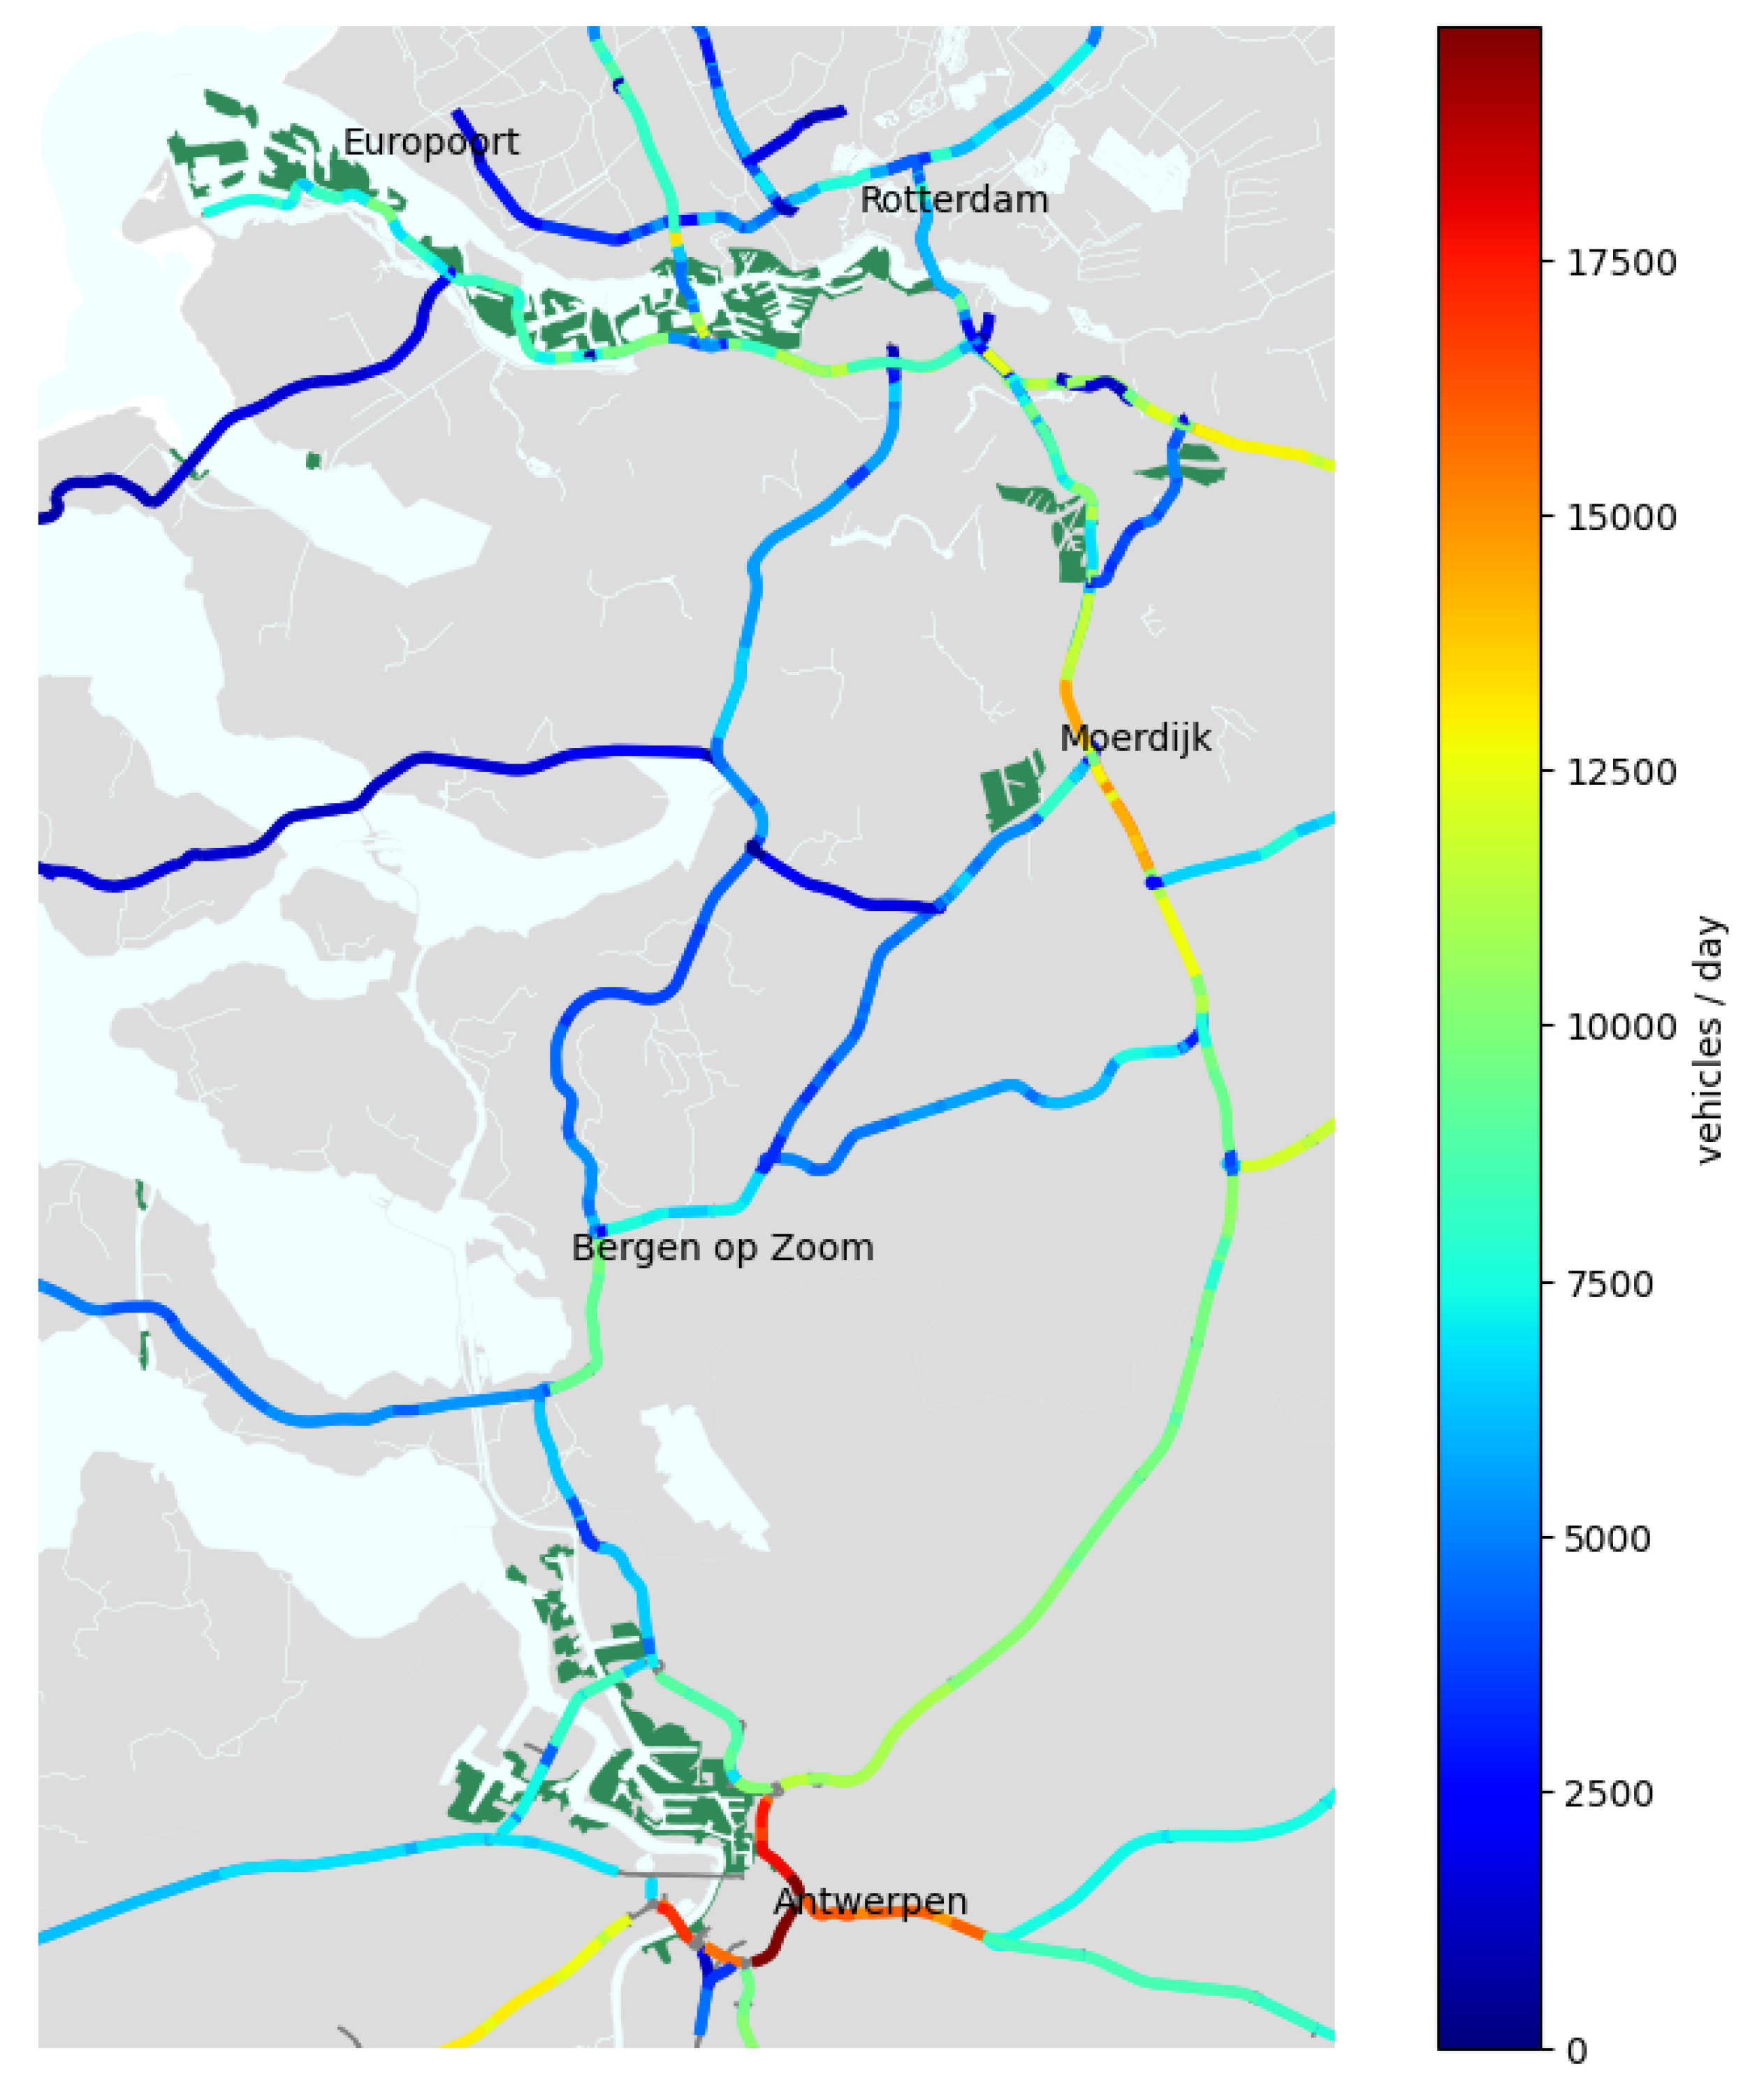

Table 1.
Energy and economic performance of modelled vehicle types
| Vehicle type | Energy | Investment, € | Energy consumption1 | Operation & maintenance1 | ||||
|---|---|---|---|---|---|---|---|---|
| long distance | regional | long distance, kWh/km | regional, kWh/km | long distance, €/km | regional, €/km | |||
| D | D | D | 1290001 | 2.461 | 2.461 | 0.143 | 0.143 | |
| LNG | LNG | LNG | 1740001,5,6 | 2.781 | 2.781 | 0.143 | 0.143 | |
| FCEV | H2 | H2 | 3240003 | 2.251 | 2.251 | 0.137 | 0.137 | |
| BEV800 | GEL | GEL | 1636002 | 1.424 | 1.424 | 0.126 | 0.126 | |
| BEV1200 | GEL | GEL | 1904002 | 1.424 | 1.424 | 0.126 | 0.126 | |
| CAT-D | CAT | D | 1520001,2 | 1.514 | 2.461 | 0.107 | 0.143 | |
| CAT-LNG | CAT | LNG | 1970001,2,5&6 | 1.514 | 2.781 | 0.107 | 0.143 | |
| CAT-FCEV | CAT | H2 | 3470001,2,3 | 1.514 | 2.251 | 0.107 | 0.137 | |
| CAT-B400 | CAT | CATEL | 1598002 | 1.514 | 1.424 | 0.107 | 0.126 | |
| CAT-B200 | CAT | CATEL | 1464002 | 1.514 | 1.424 | 0.107 | 0.126 | |
| CAT-B100 | CAT | CATEL | 1397002 | 1.514 | 1.424 | 0.107 | 0.126 | |
| GCE-D | GCE | D | 1440001,2 | 1.514 | 2.461 | 0.107 | 0.143 | |
| GCE-LNG | GCE | LNG | 1890001,2,5&6 | 1.514 | 2.781 | 0.107 | 0.143 | |
| GCE-FCEV | GCE | H2 | 3390001,2,3 | 1.514 | 2.251 | 0.107 | 0.137 | |
| GCE-B400 | GCE | GCEEL | 1518002 | 1.514 | 1.424 | 0.107 | 0.126 | |
| GCE-B200 | GCE | GCEEL | 1384002 | 1.514 | 1.424 | 0.107 | 0.126 | |
| GCE-B100 | GCE | GCEEL | 1317002 | 1.514 | 1.424 | 0.107 | 0.126 | |
| GCA-D | GCA | D | 1500001,2 | 1.514 | 2.461 | 0.107 | 0.143 | |
| GCA-LNG | GCA | LNG | 1950001,2,5&6 | 1.514 | 2.781 | 0.107 | 0.143 | |
| GCA-FCEV | GCA | H2 | 3450001,2,3 | 1.514 | 2.251 | 0.107 | 0.137 | |
| GCA-B400 | GCA | GCAEL | 1578002 | 1.514 | 1.424 | 0.107 | 0.126 | |
| GCA-B200 | GCA | GCAEL | 1444002 | 1.514 | 1.424 | 0.107 | 0.126 | |
| GCA-B100 | GCA | GCAEL | 1377002 | 1.514 | 1.424 | 0.107 | 0.126 | |
| IND-D | IND | D | 1370001,2 | 1.514 | 2.461 | 0.107 | 0.143 | |
| IND-LNG | IND | LNG | 1820001,2,5&6 | 1.514 | 2.781 | 0.107 | 0.143 | |
| IND-FCEV | IND | H2 | 3320001,2,3 | 1.514 | 2.251 | 0.107 | 0.137 | |
| IND-B400 | IND | INDEL | 1448002 | 1.514 | 1.424 | 0.107 | 0.126 | |
| IND-B200 | IND | INDEL | 1314002 | 1.514 | 1.424 | 0.107 | 0.126 | |
| IND-B100 | IND | INDEL | 1247002 | 1.514 | 1.424 | 0.107 | 0.126 | |
Sources: (1) Based on [4], operation and maintenance costs exclude driver wage and administrative overheads, (2) Estimation based on the following: 1) a hybrid truck without engine, battery and ERS equipment costs € 110 thousand; 2) eHighway pantograph system costs € 23 thousand, Elonroad mechanism system costs € 15 thousand, Alstom mechanism system costs € 21 thousand, and Electreon coils and electronics cost € 8 thousand; 3) battery costs 67 €/kWh in 2030 based on manufacturer and expert forecasts as summarised in [5], (3) [4] and [6], (4) [2], (5) [7], (6) [8].
Table 2.
Energy cost and price, €/kWh excluding VAT
| Energy | Cost | Price |
|---|---|---|
| D | - | 0.149 |
| LNG | - | 0.082 |
| H2 | - | 0.248 |
| GEL | - | 0.20 |
| [ERS] | 0.08 | 0.22 |
| [ERS]EL | 0.08 | 0.22 |
Sources: [9], [10], [12], [13], unit conversion based on [14]Energy type abbreviations: D – diesel, LNG – Liquified/compressed natural gas, H2 – hydrogen, [ERS]EL – electricity supplied by ERS operator (any technology) for use off the network, ERS – electricity supplied by ERS operator (any technology) for direct use on ERS network, GEL – grid electricity
Table 3.
ERS infrastructure cost depending on freight traffic volume and ERS coverage
| Daily ERS traffic volume | Power per electrified km, kW | ERS cost per km in one lane, million € | |||
|---|---|---|---|---|---|
| CAT | GCE | GCA | IND | ||
| < 2000 | 500 | 0.96 | 0.67 | 0.70 | 1.01 |
| < 6000 | 1250 | 0.96 | 0.72 | 1.00 | 1.03 |
| < 12,000 | 2500 | 1.04 | 0.92 | 1.33 | 1.04 |
| < 20,000 | 4000 | 1.12 | 1.19 | 1.42 | 1.06 |
| ERS coverage | 80% | 80% | 40% | 100% | |
CAT – eHighway catenary electric road system, GCE – Elonroad ground conductive, GCA – Alstom ground conductive, IND – Electreon ground inductive
Table 4.
Modelled technology adoption shares
| Scenarios | Technology adoption shares | ||||
|---|---|---|---|---|---|
| D | LNG | FCEV | BEV- | CAT-, GCE-, GCA-, IND- | |
| 800, 1200 | D, LNG, FCEV, B400, B200, B100 | ||||
| BASE | 99.76% | 0.22% | 0% | 0.03% | 0% |
| Single-technology scenarios | 100% for simulated technology | ||||
| Introduction mix scenarios | 99.76 - x% | 0.22% | 0% | 0.03% | x = 5%, 10%, 15%, 20%, 30%, 40%, 50% |
Abbreviations for heavy goods vehicle technologies: D – diesel, LNG – Liquefied/compressed natural gas, FCEV – fuel cell electric, BEV-xxxx – battery electric (index xxxx shows battery usable size in kWh), CAT-xxxx – eHighway catenary hybrid (xxxx shows the type of technology it is combined with), GCE-xxxx – Elonroad ground conductive hybrid, GCA-xxxx – Alstom ground conductive hybrid, IND-xxxx – Electreon ground inductive hybrid, index Bxxx for battery hybrid vehicles shows battery usable size in kWh.
Table 5.
Investment cost range per route, by ERS technology, m€
| Route | ERS technology | Optimal coverage | Investment cost range | |
|---|---|---|---|---|
| Route 1 | 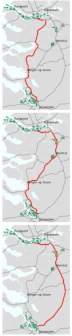 |
CAT | 80 % | 167.2 – 167.8 m€ |
| GCE | 80 % | 117.4 – 120.3 m€ | ||
| GCA | 40 % | 122.3 – 133.4 m€ | ||
| IND | 100 % | 176.3 – 177.0 m€ | ||
| Route 2 | CAT | 80 % | 180.5 - 181.6 m€ | |
| GCE | 80 % | 126.8 - 131.0 m€ | ||
| GCA | 40 % | 132.0 - 145.8 m€ | ||
| IND | 100 % | 190.3 - 191.1 m€ | ||
| Route 3 | CAT | 80 % | 172.7 - 174.8 m€ | |
| GCE | 80 % | 121.3 - 128.0 m€ | ||
| GCA | 40 % | 126.3 - 143.7 m€ | ||
| IND | 100 % | 182.0 - 183.0 m€ | ||
CAT – eHighway catenary electric road system, GCE – Elonroad ground conductive, GCA – Alstom ground conductive, IND – Electreon ground inductive
Disclaimer/Publisher’s Note: The statements, opinions and data contained in all publications are solely those of the individual author(s) and contributor(s) and not of MDPI and/or the editor(s). MDPI and/or the editor(s) disclaim responsibility for any injury to people or property resulting from any ideas, methods, instructions or products referred to in the content. |
© 2024 by the authors. Licensee MDPI, Basel, Switzerland. This article is an open access article distributed under the terms and conditions of the Creative Commons Attribution (CC BY) license (http://creativecommons.org/licenses/by/4.0/).
Copyright: This open access article is published under a Creative Commons CC BY 4.0 license, which permit the free download, distribution, and reuse, provided that the author and preprint are cited in any reuse.


