Submitted:
05 July 2024
Posted:
08 July 2024
You are already at the latest version
Abstract
Methylation in the estrogen receptor alpha (ESRα) promoter is an epigenetic abnormality in breast cancer (BCa) and hypermethylation results in the loss of ER expression. We used pyrosequencing to investigate if there is a direct link between P0/P1 promoters of ESRα aberrant methylation and risk of progression of benign tumors to BCa. Results showed a significant elevated level of DNA methylation in ESRα P1 promoter (p = 0.0001) in fibroadenoma than ER-negative BCa tissues, and a 2-fold increased ESRα expression in fibrocystic, and fibroadenoma. In addition, the methylation level of HIN-1 and RASSF1A promoters were elevated in ER-positive when compared to ER-negative BCa (p-value <0.5). ANOVA Mixed Model revealed a significant interaction between RASSF1A with fibroadenoma and ER-positive BCa (p = 0.004). Tumors with unclassified molecular subtype (ER-positive, PR-negative, HER2-negative) had elevated levels of methylation (p = 0.046) in the P0 promoter compared with luminal B (ER-positive, PR-positive, HER2-positive) tumors. Tumors with grade 3 showed a borderline association with ESRα P1 promoter methylation when compared with grade 2 tumors (p = 0.056). These results showed a highly methylated ESRα P0 promoter in the initial stages of breast carcinogenesis while the methylation in the P1 promoter occurs at later stages of BCa with poor prognosis. Therefore, methylation of ESRα promoter and tumor-related genes could serve as potential biomarker for prediction of fibroadenoma that are at elevated risk of progressing to BCa.
Keywords:
DNA methylation
; estrogen receptor alpha
; breast cancer
; fibroadenoma
1. Introduction
Breast cancer (BCa) is a typical hormone-dependent tumor and has been sub-categorized based upon the presence or absence of estrogen (ER), progesterone (PR), and the human epidermal growth factor receptor 2 (HER2) [1]. ER is a member of a large family of nuclear transcription regulators that function as a nuclear transcription factor and a co-regulator to enhance estrogen/non estrogen target genes. There are two isoforms of ER namely, alpha (α) and beta (β), and both are expressed in the normal mammary gland [2]. ESRβ is considered a putative tumor suppressor gene [3,4]. ESRα on the other hand is critical for normal mammary gland ductal development [5,6,7]. In the earliest stages of BCa progression, the expression of ESRα increases and the relationship between lack of ESRα expression and lack of proliferation of ESRα-positive cells changes [8]. ESRα expression increases in ductal hyperplasia (DH), progressing to atypical ductal hyperplasia (ADH) and low grade ductal carcinoma in situ (DCIS) [9,10]. However, as the lesions progress, they begin to lose their ESRα expression as carcinoma in situ progress to invasive carcinoma [11,12]. DNA methylation and chromatin remodeling are two epigenetic mechanisms that have been linked with the lack of ESRα expression in ESRα-negative BCa [13,14,15,16]. Methylation is catalyzed by enzymes called DNA methyltransferases (DNMTs) that transfer a methyl moiety from S-adenosylmethionine to the 5´ position of the cytidine ring to form 5-methyl-cytosine [17]. In mammals, cytidines normally followed by a guanosine (CpGs) are methylated. CpGs are locally enriched in short stretches of DNA called CpG islands and are found in approximately 40% of mammalian promoters [18,19,20].
The methylation of ESRα has been well studied and is focused on the 5’ regulatory region which encompasses the promoter and the first exon [21]. Methylation of CpG islands are correlated with transcription silencing of ESRα through direct gene silencing and formation of heterochromatin [22]. ESRα has two promoters, the distal (P0) and the proximal (P1). The P1 promoter is located upstream near the major transcription mRNA1 cap site and the P0 promoter is located upstream of nucleotide -3067 relative to P1 promoter [23]. The transcribed message from both promoters are almost identical isoforms due to alternative splicing. The only difference between the two transcripts is in the 5’ region which is unique for each transcript [24].
In cancerous tissues, silencing of genes through promoter methylation occur as frequently as mutations or deletions [25]. Lack of ESRα expression in ERα-negative BCa is associated with an increased in DNMTs and methylation of ESRα promoter [26,27]. Promoter hypermethylation is also a contributing factor in early stages of carcinogenesis and hypermethylation-mediated loss of gene expression could provide the cell with growth-promoting characteristics, such as insensitivity to antigrowth signals, limitless replicative potential, and evasion of apoptosis [25,28,29,30,31].
A high frequency of ESRα methylation has been reported in Indian and Chinese women [32,33]. Findings from another study reported a higher frequency of methylation in young African American women when compared to Caucasian and European women [34,35,36]. ESRα-negative phenotype and the mortality rate of BCa are higher in African American women [37], and ESRα-negative phenotype is correlated with promoter hypermethylation. Understanding the frequency of methylation in the promoter of ESRα and its effect on the clinicopathological characteristics and disease prognosis of BCa in women of other ethnic groups might aid in the diagnostics and treatment. Pollars and colleagues [38] reported that ESRα is expressed in a subset of luminal cells which corresponds to less than 10% of normal mammary epithelial cells and over 70% of breast tumors (ER+ tumors), but the basis for its selective expression in normal or cancer tissues remains incompletely understood.
Therefore, in this study we sought to determine if there is a direct link between P0/P1 promoters of ESRα aberrant methylation and the risk of progression of the fibroadenoma and fibrocystic benign tumors to BCa. We used pyrosequencing to measure the DNA methylation in the P0 and P1 promoters of ESRα in mammoplasty breast reduction (normal), fibrocystic and fibroadenoma (benign breast tumors), ER-positive (ER+ve), and ER-negative (ER-ve) BCa tissues, and human BCa cell lines.
2. Results
2.1. Tissues Characteristics
In this study, we assessed the methylation status of ESRα promoter region in 130 human FFPE breast tissues (Table 1). The mean age of the patients was 36 ± 14.5, 49 ± 10.9, 31± 14.6, 60.8 ±13, and 45.3±11.2 years for mammoplasties, fibrocystic, fibroadenoma, and ER+ve, and ER-ve tissues; respectively. The mean age indicating that patients at younger age (< 50 year) are more likely to be diagnosed with fibrocystic and fibroadenoma than patients with BCa (p = 0.003). However, there was no difference in the age of diagnosis between ER+ve and ER-ve BCa patients (p = 0.491).

Table 1.
Breast tissue types, sample number, and patient’s age of diagnosis.
| Types of breast tissues | Sample size (total 130) | Age (SD+) | Age range | < 50 years | > 50 years |
|---|---|---|---|---|---|
| Mammoplasty reduction | 28 | 36 (SD+14.5) | 19-69 | 23 | 5 |
| Fibrocystic | 31 | 49 (SD+10.9) | 29-83 | 18 | 13 |
| Fibroadenoma | 34 | 31 (SD+14.6) | 13-76 | 31 | 3 |
| ER-positive BCa | 15 | 60.8 (SD+13) | 39-82 | 4 | 11 |
| ER-negative BCa | 22 | 54.3 (SD+11.2) | 31-74 | 9 | 13 |
2.2. Methylation of P0 and P1 Promoters of ESRα in Human Breast Tissues
The DNA methylation level was measured in the P0 and the P1 promoters by pyrosequencing. The mean of methylation levels in the P0 promoter were 29%, 25%, 23%, 31%, 28%, and in P1 promoter 30%, 29%, 33%, 28%, 25%, in mammoplasty, fibrocystic, fibroadenoma, ER+ve, and ER-ve breast tissues; respectively. For each type of breast tissue, the mean level of methylation in the P0 promoter was compared to that of P1 using unpaired student’s t- test. There was a significant difference between the methylation levels in the P0 and P1 promoters (p = 0.0001) with a higher level of DNA methylation in P1 promoter in the fibroadenoma tissues (Figure 1).
No significant difference was observed in the level of DNA methylation in the P0 and P1 promotes of ESRα in mammoplasty (p = 0.150), fibrocystic (p = 0.073), ER+ve (p = 0.660), and ER-ve (p = 521) breast tissues. We further investigated the effect of P0 and P1 promoters’ methylation on ESRα expression using RT-PCR (Figure 2). The expression of ESRα increased by 2-fold in fibrocystic, fibroadenoma, and ER+ve BCa tissues. Conversely, expression of ESRα was down regulated in ER-ve BCa tissues.
2.3. Methylation in the P0 and P1 Promoters of ESRα in Breast Cancer Cell Lines
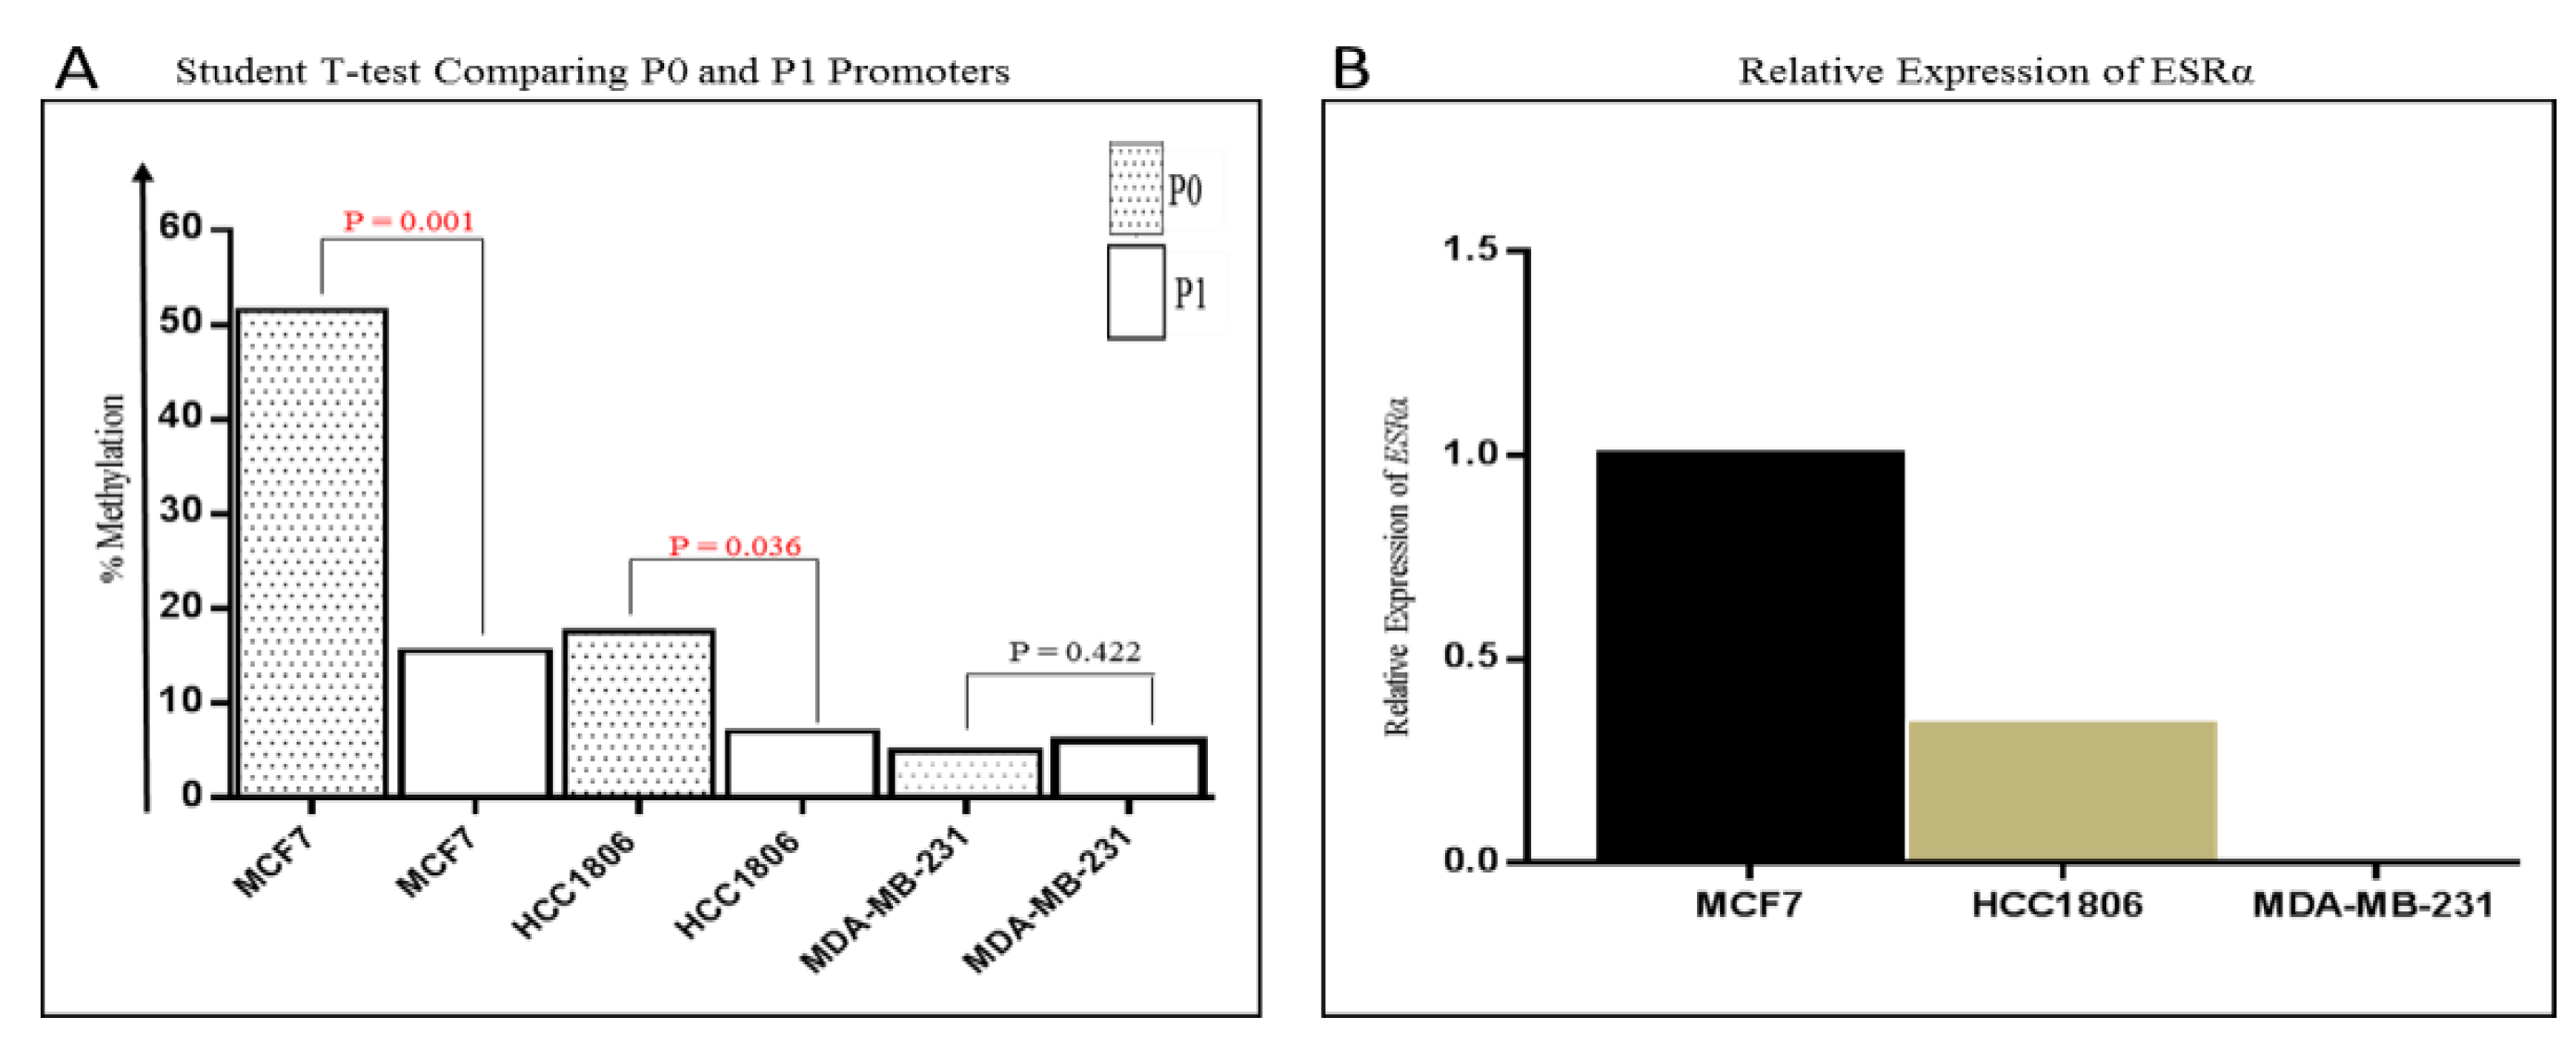
DNA methylation in ESRα promoters were also evaluated by pyrosequencing in human BCa cell lines. The mean of methylation levels in the P0 promoter region were 51.5%, 17.5%, and 5%, and in the P1 promoter region were 15.5%, 7%, and 6%, in the MCF7, HCC1806, and MDA-MB-231; respectively. For each cell line, Unpaired Student’s t-test was used to compare the percentage of methylation between the P0 and the P1 promoters (Figure 3A). Both MCF7 (p = 0.001) and HCC1806 (p = 0.036) cell lines showed elevated levels of methylation in the P0 promoter when compared to P1 in MDA-MB-231 cell line. There was no significant difference in the level of methylation between P0 and P1 promoters in MD-MB-231 cell line (p = 0.422). Further, RT- PCR was performed to measure the expression of ESRα in the BCa cell lines. The analysis showed that the expression of ESRα was down regulated in HCC1806 cell line relative to MCF7 cell line, while MDA-MB231 cell line showed no detectable ESRα expression (Figure 3B).
Figure 3.
Quantitative DNA methylation of ESRα and its expression in BCa cell lines. (A) The bar graph shows the percentage of methylated cytosines in the P0 and P1 promoters of ESRα in BCa cell lines as obtained by pyrosequencing (Y-axis). The X-axis represents the ER+ve (MCF) and ER-ve (HCC1806, MDA-MB231) BCa cell lines, depicts the mean + standard deviation of two independent experiments. P-value is indicated for ESRα gene (Mann-Whitney); (B) RT- PCR expression level of ESRα in breast cell lines was normalized to MCF. HCC1806 showed down regulation, while MDA-MB231 showed no expression of ESRα.
2.4. Correlation between ESRα Promoter Methylation and ESRα, RASSF1A and HIN-1 Expression
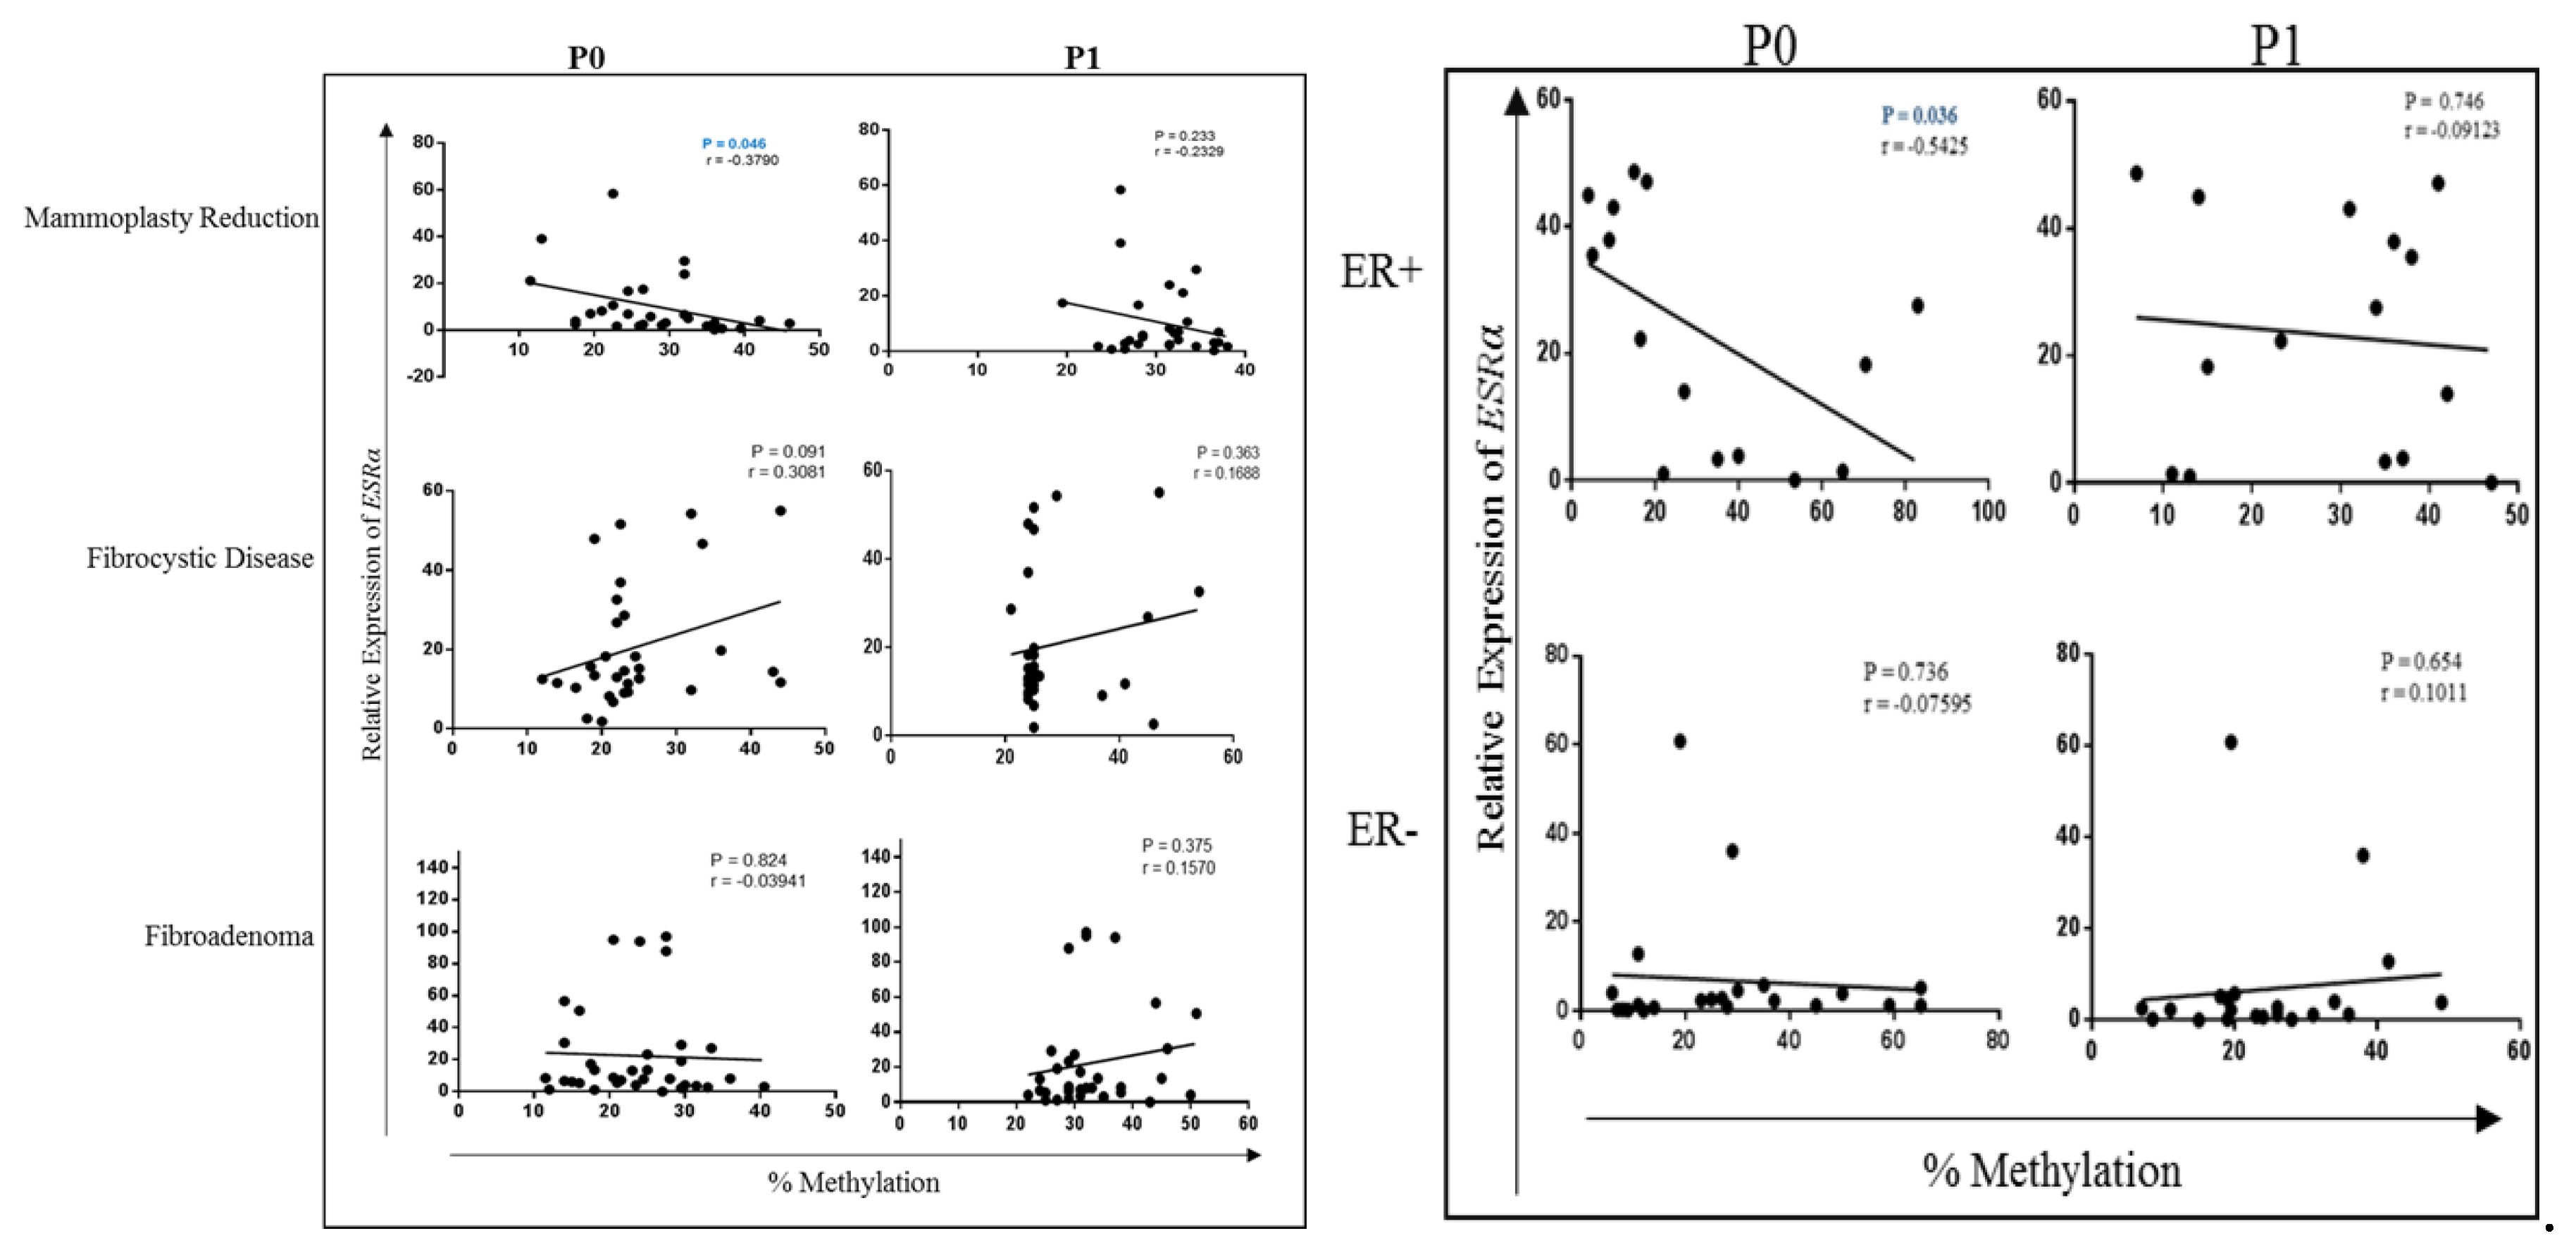
To assess the effect of ESRα promoter methylation in the five types of breast tissues, the percentage of methylation in the P0 and P1 promoter was correlated with the relative gene expression of ESRα. Pearson correlation revealed a negative correlation between methylation in the P0 promoter and gene expression in mammoplasty (r = -0.378; p = 0.046) and ER+ve (r = -05425; p = 0.036) tissues (Figure 4). No significant association was observed between ESRα methylation and gene expression in the P1 promoter in the above two breast tissue types; and in the P0 and P1 promoters in fibrocystic, fibroadenoma, and ER-ve breast tissues, which signifying other mechanisms could be involved in the loss of ESRα expression in ER-ve BCa tissues.
Figure 4.
Correlation between P0 and P1 ESRα promoter methylation and ESRα, RASSF1A and HIN-1 expression. Pearson correlation revealed a negative correlation between methylation in the P0 promoter and gene expression in mammoplasty and ER+ve tissues.
Figure 4.
Correlation between P0 and P1 ESRα promoter methylation and ESRα, RASSF1A and HIN-1 expression. Pearson correlation revealed a negative correlation between methylation in the P0 promoter and gene expression in mammoplasty and ER+ve tissues.
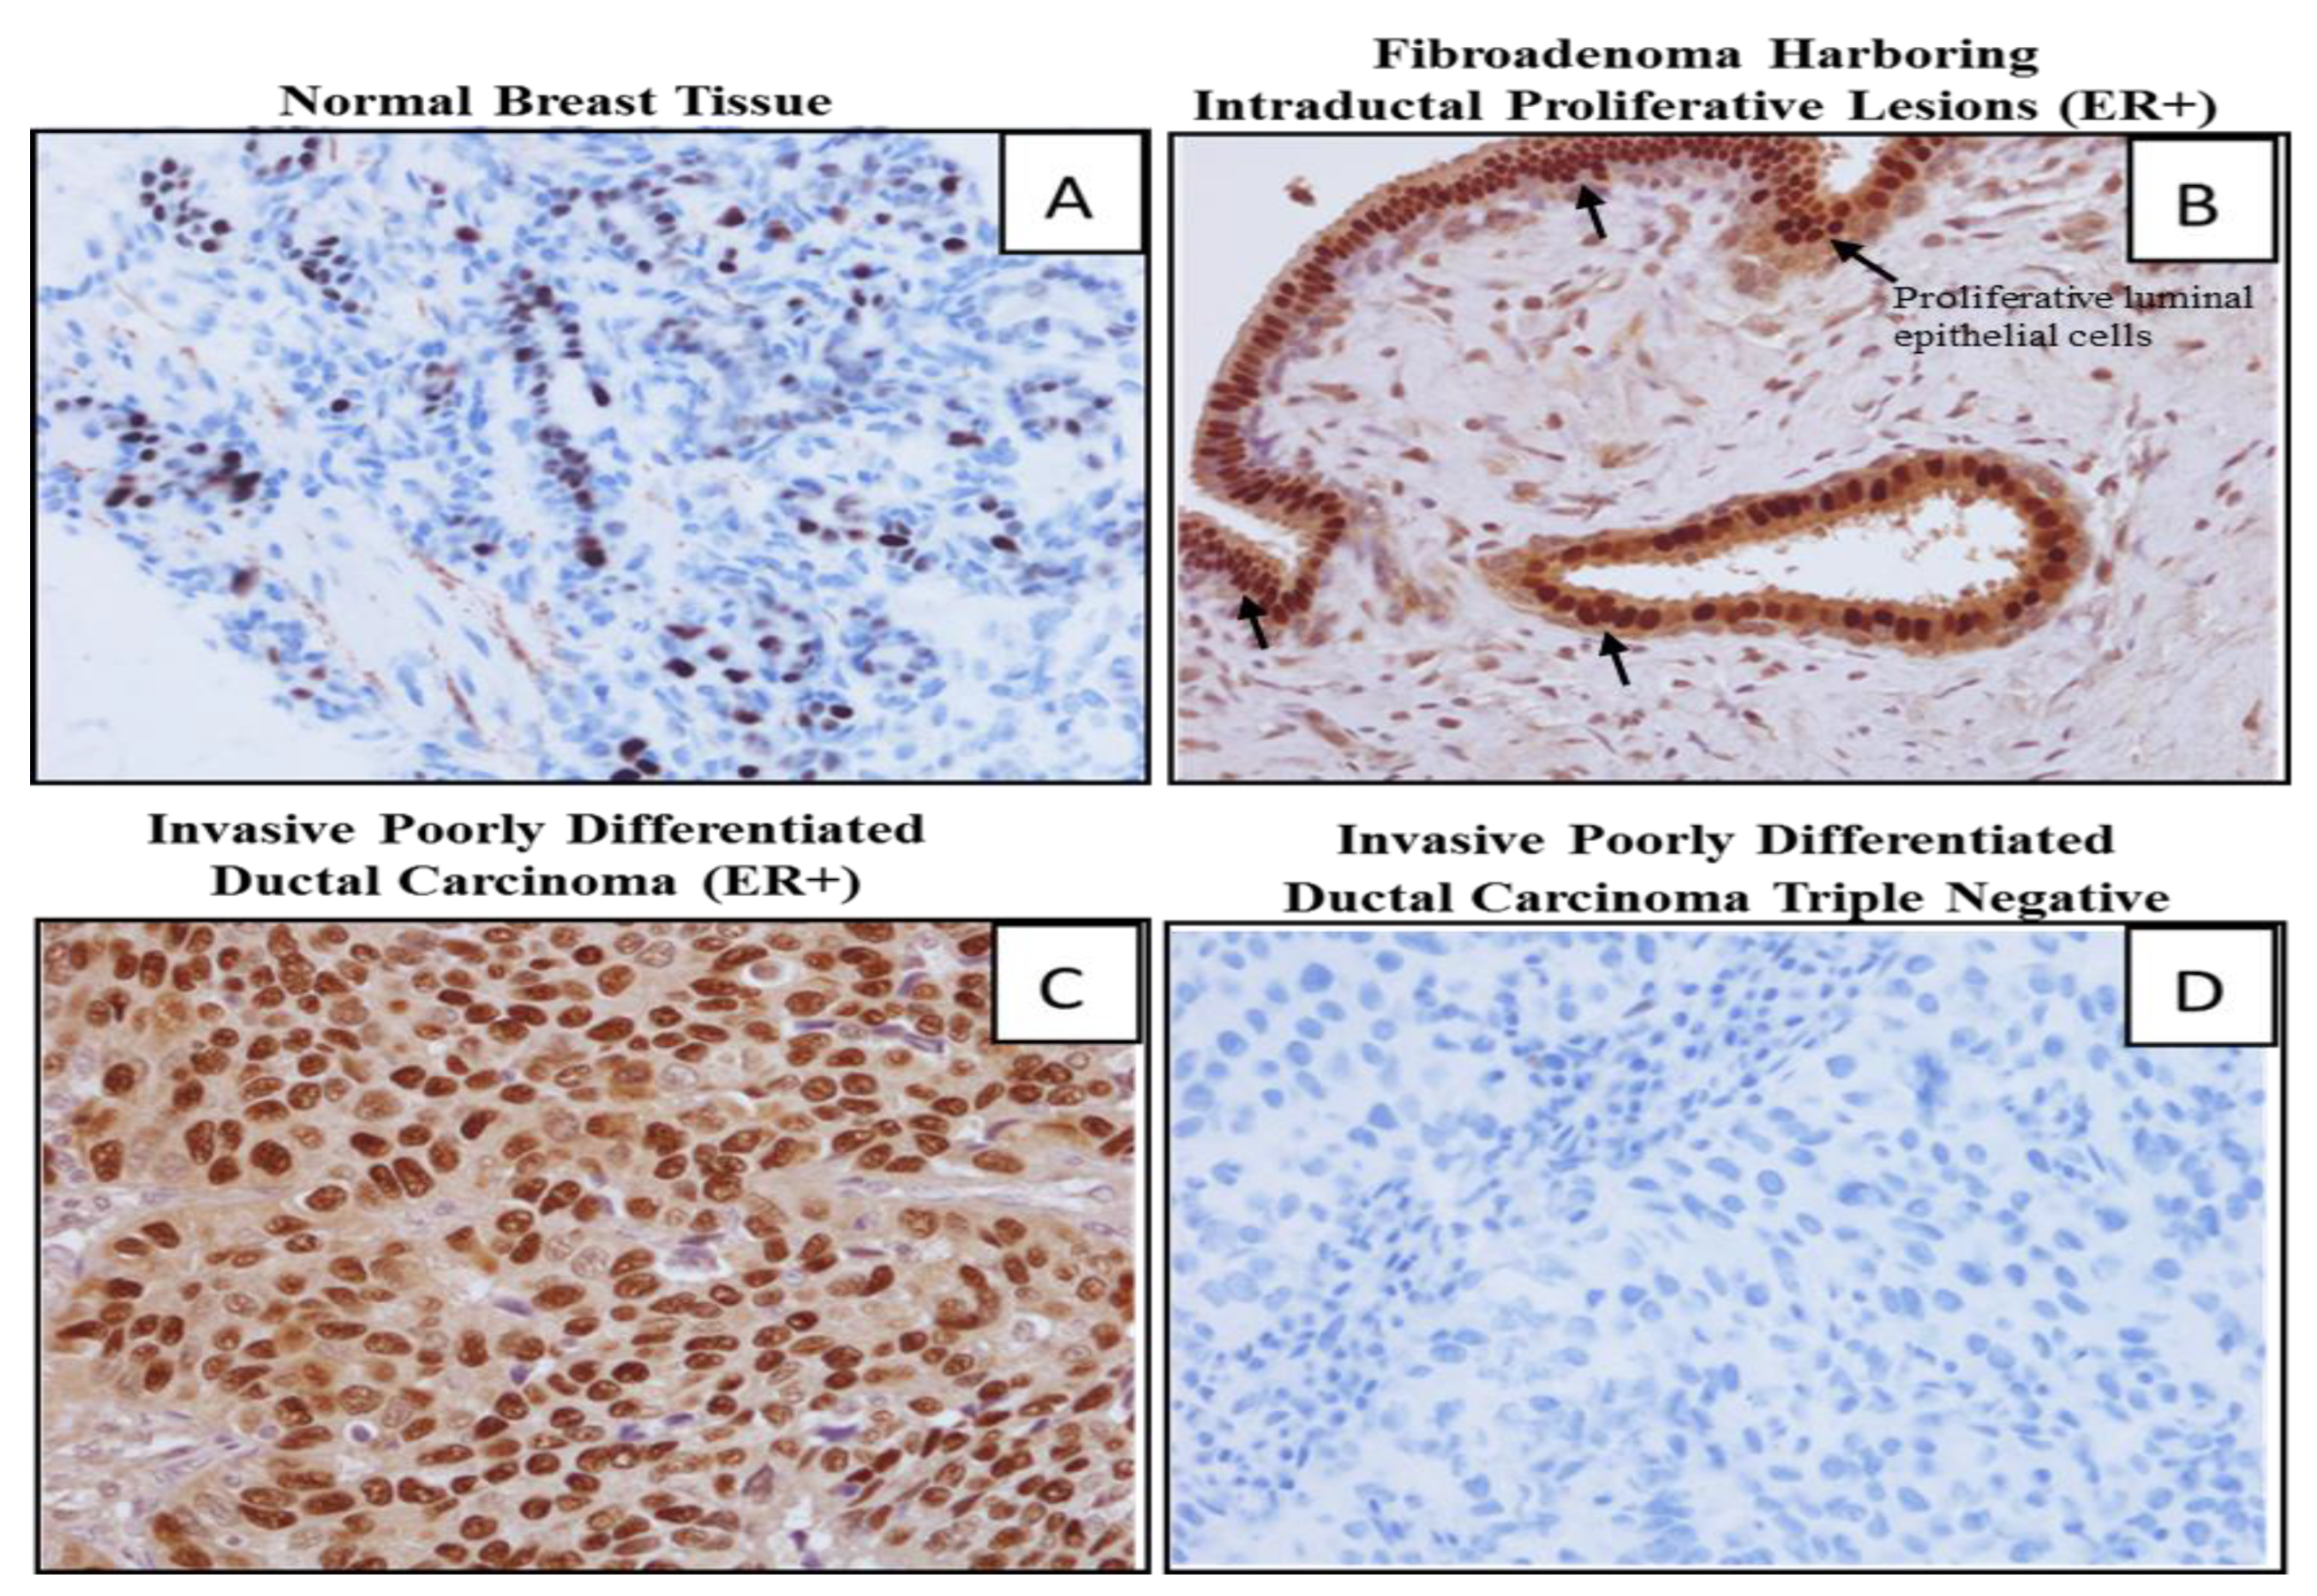
To examine whether increased methylation of the P1 promoter of ESRα correlates with the loss of ESRα protein expression as observed in the fibroadenoma tissues, sections of 22 FFPE subset of fibroadenoma tissues were assessed by IHC for ESRα expression. Positive nuclear staining for ER was observed in all the stained samples with differences in the percentage of reactive cells (1%-82%). The samples with 82% nuclear staining harbored an intraductal proliferative lesion (Figure 5). These differences in the intensity and distribution of the nuclear staining suggest that there is a heterogeneity in the expression of the ER in the fibroadenoma cells in each sample and methylation may precede loss of protein expression for ESRα. In addition, these data suggested that there are many biological pathways and alterations involved in ER and regulation during BCa evolution.
Figure 5.
Immunohistochemistry nuclear staining (brown) of ESRα expression in (A) normal mammoplasty breast tissue; (B) fibroadenoma breast tissue with ER+ve proliferative luminal epithelial cells; (C) invasive ductal carcinoma with ER+ve nuclear staining; (D) invasive ductal carcinoma triple negative BCa.
2.5. Comparing Methylation of P1 Promoters of ESRα in Fibroadenoma with ER+ve and ER-ve BCa
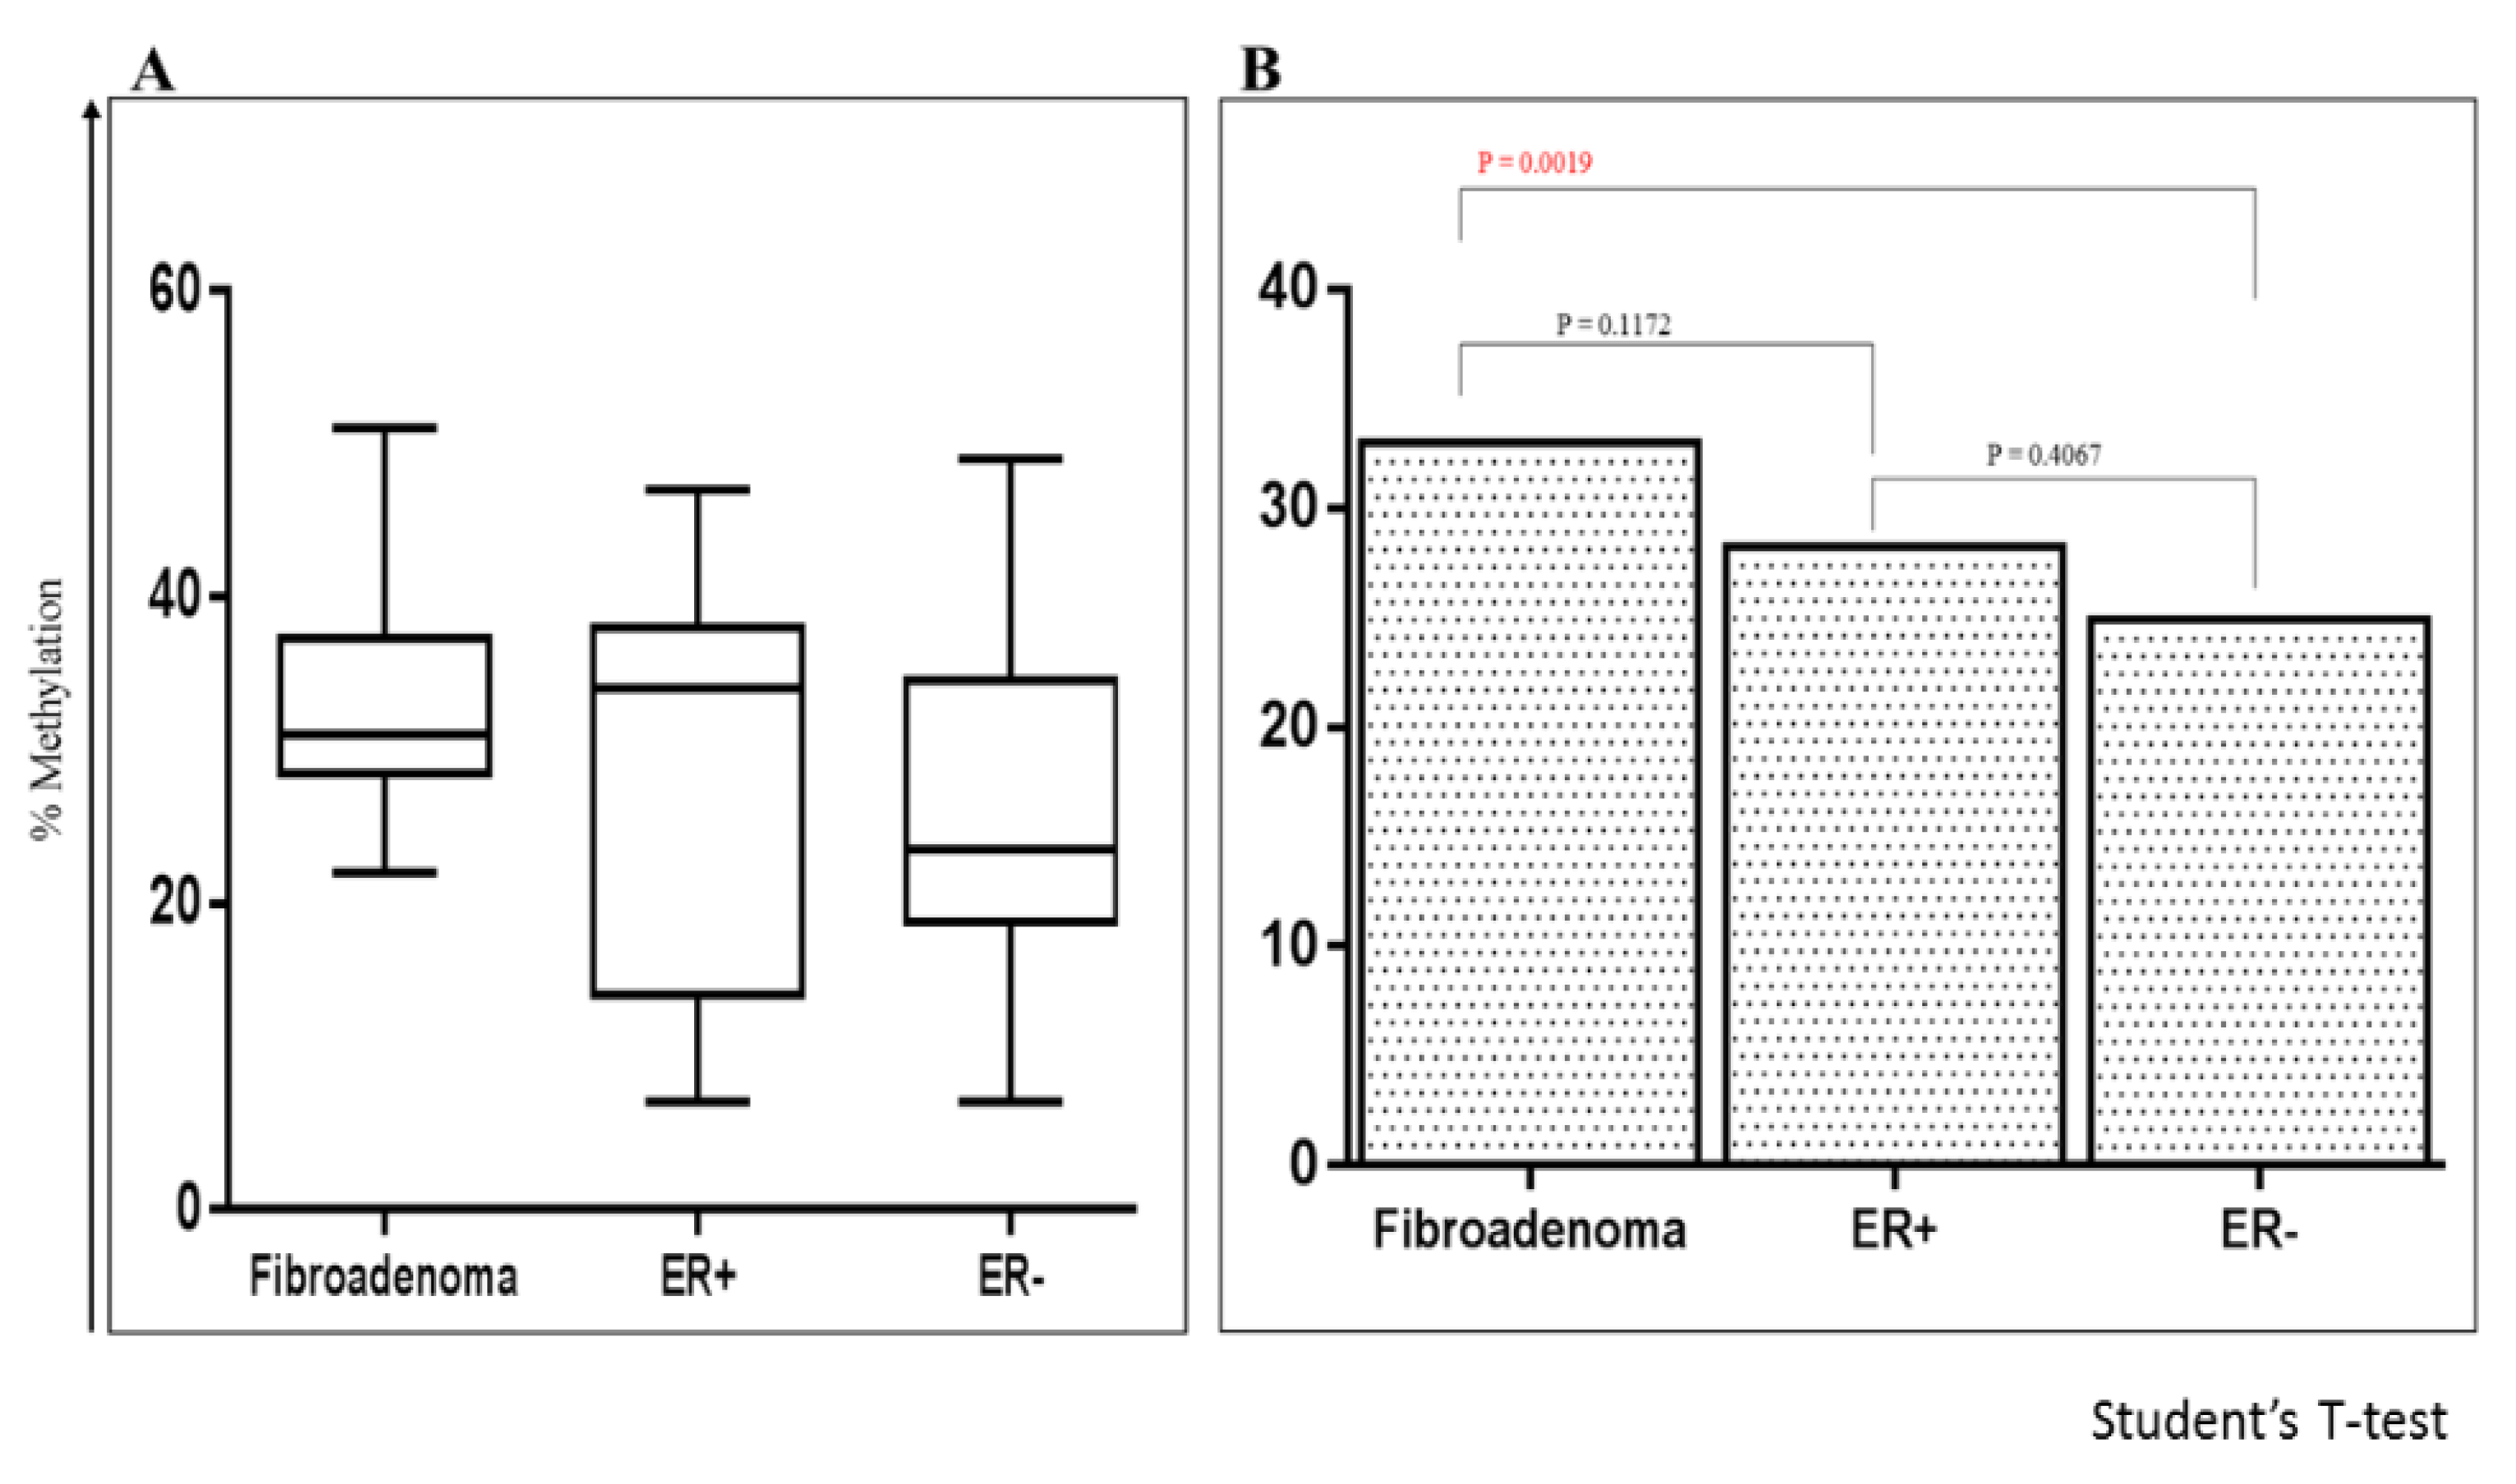
To examine aberrant DNA methylation patterns, the level of ESRα P0 and P1 promoters’ methylation in fibroadenoma tissues were compared with that of ER+ve and ER-ve BCa. A significant difference in the level of methylation was observed in the P1 promoter in fibroadenoma tissues when compared with ER-ve BCa (p = 0.001) with a higher level of methylation in the fibroadenoma tissues (Figure 6). No significant difference was observed between fibroadenoma and ER+ve BCa (p = 0.117). More so, ER+ve and ER-ve BCa showed no difference in methylation in the P1 promoter (p = 0.406). Ordinary one-way ANOVA also showed no significant difference in the level of methylation in the P0 promoter across the three-breast tissue types (p = 0.256).
Figure 6.
Methylation of ESRα P1 Promoter in fibroadenoma, ER+ve and ER-ve BCa tissues. (A) Quantitative DNA methylation analysis of 3 breast tissue types. Y-axis, percentage of methylated cytosines by pyrosequencing; X-axis, breast tissue types. Box and whisker plot showing the distribution of methylation in the P0 and P1 promoters in the breast tissue types. Boundary on the box represent values in the 25th and 75th percentile. Line within the box marks the median value. Whiskers (error bars) above indicates the maximum value while below indicates the minimum value; (B) Bar graph comparing the mean methylation levels.
2.6. Methylation of RASSF1A and HIN1 in the Benign Fibroadenoma and BCa Tissues
To define the genetic pathways that might clearly lead to fibroadenoma, we extended our analysis to include RASSFIA, and HIN-1 genes. The RASSFIA gene encodes for a tumor suppressor and a regulator of cellular proliferation, apoptosis and microtubules stability [39,40,41]. Inhibition of RASSFIA expression through epigenetic mechanisms in the promoter have been considered as a biomarker for early detection of various types of cancers including those originating from the breast [42,43]. A elevated level of RASSF1A methylation were reported in ER+ve DCIS and IDC tumors [44,45]. HIN-1 gene encodes for secretory protein which is a negative regulator of cell growth [46]. Also, HIN-1 is a putative breast tumor suppressor gene that is highly expressed in normal human epithelia breast cells but down regulated in invasive and metastatic BCa [47,48].
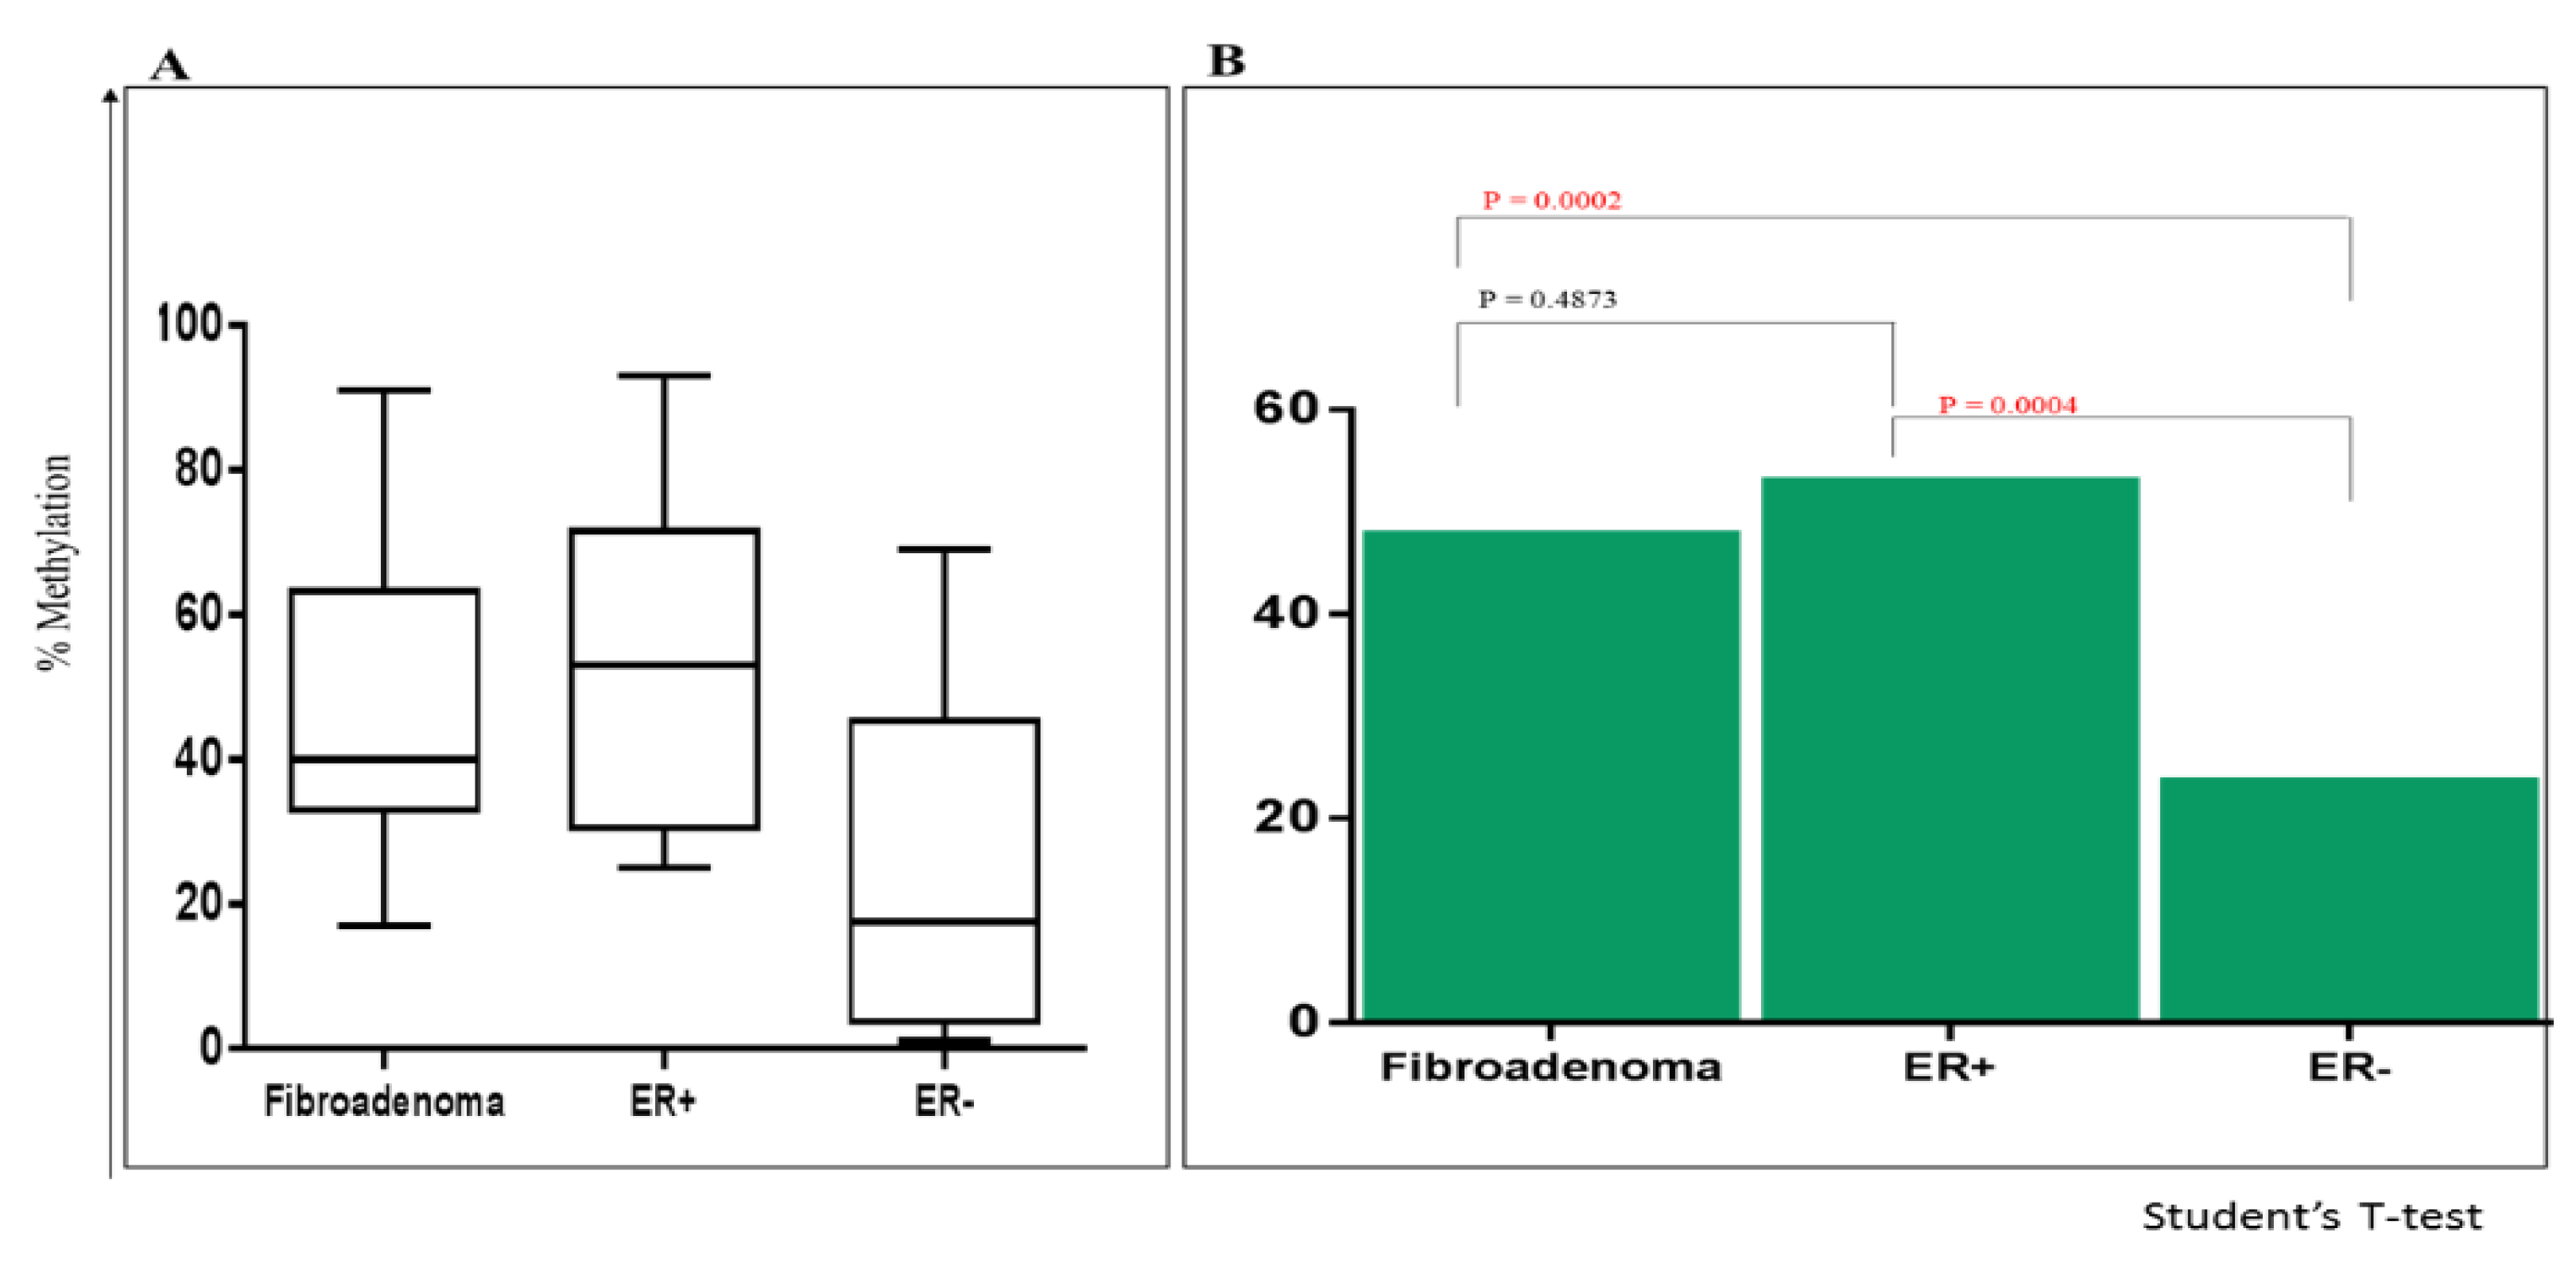
Therefore, after observing a pattern of DNA methylation in the P1 promoter of fibroadenoma, ER+ve, and ER-ve tissues, the methylation status of both tumor suppressor genes RASSF1A and HIN-1 was assessed in these three types of breast tissues. The mean methylation levels were 48% in fibroadenoma, 52% in ER+ve BCa, and 17% in ER-ve BCa tissues. The methylation level of RASSF1A (Figure 7) was higher in the fibroadenoma when compared with ER-ve BCa (p = 0.0002). Elevated level of methylation in RASSF1A was also observed in ER+ve when compared to ER-ve BCa (p = 0.0004). No significant difference was observed between fibroadenoma and ER+ve BCa (p = 0.487).
Figure 7.
Methylation of RASSFIA in fibroadenoma, ER+ve and ER-ve BCa tissues. (A) Quantitative DNA methylation analysis in breast tissues. Y-axis, percentage of methylated cytosines by pyrosequencing; X-axis breast tissue types. Box and whisker plot showing the distribution of RASSF1A methylation in fibroadenoma, ER+ve and ER-ve BCa. Boundary on the box represent values in the 25th and 75th percentile. Line within the box marks the median value. Whiskers (error bars) above indicates the maximum value while below indicates the minimum value; (B) Bar graph comparing the mean methylation levels.
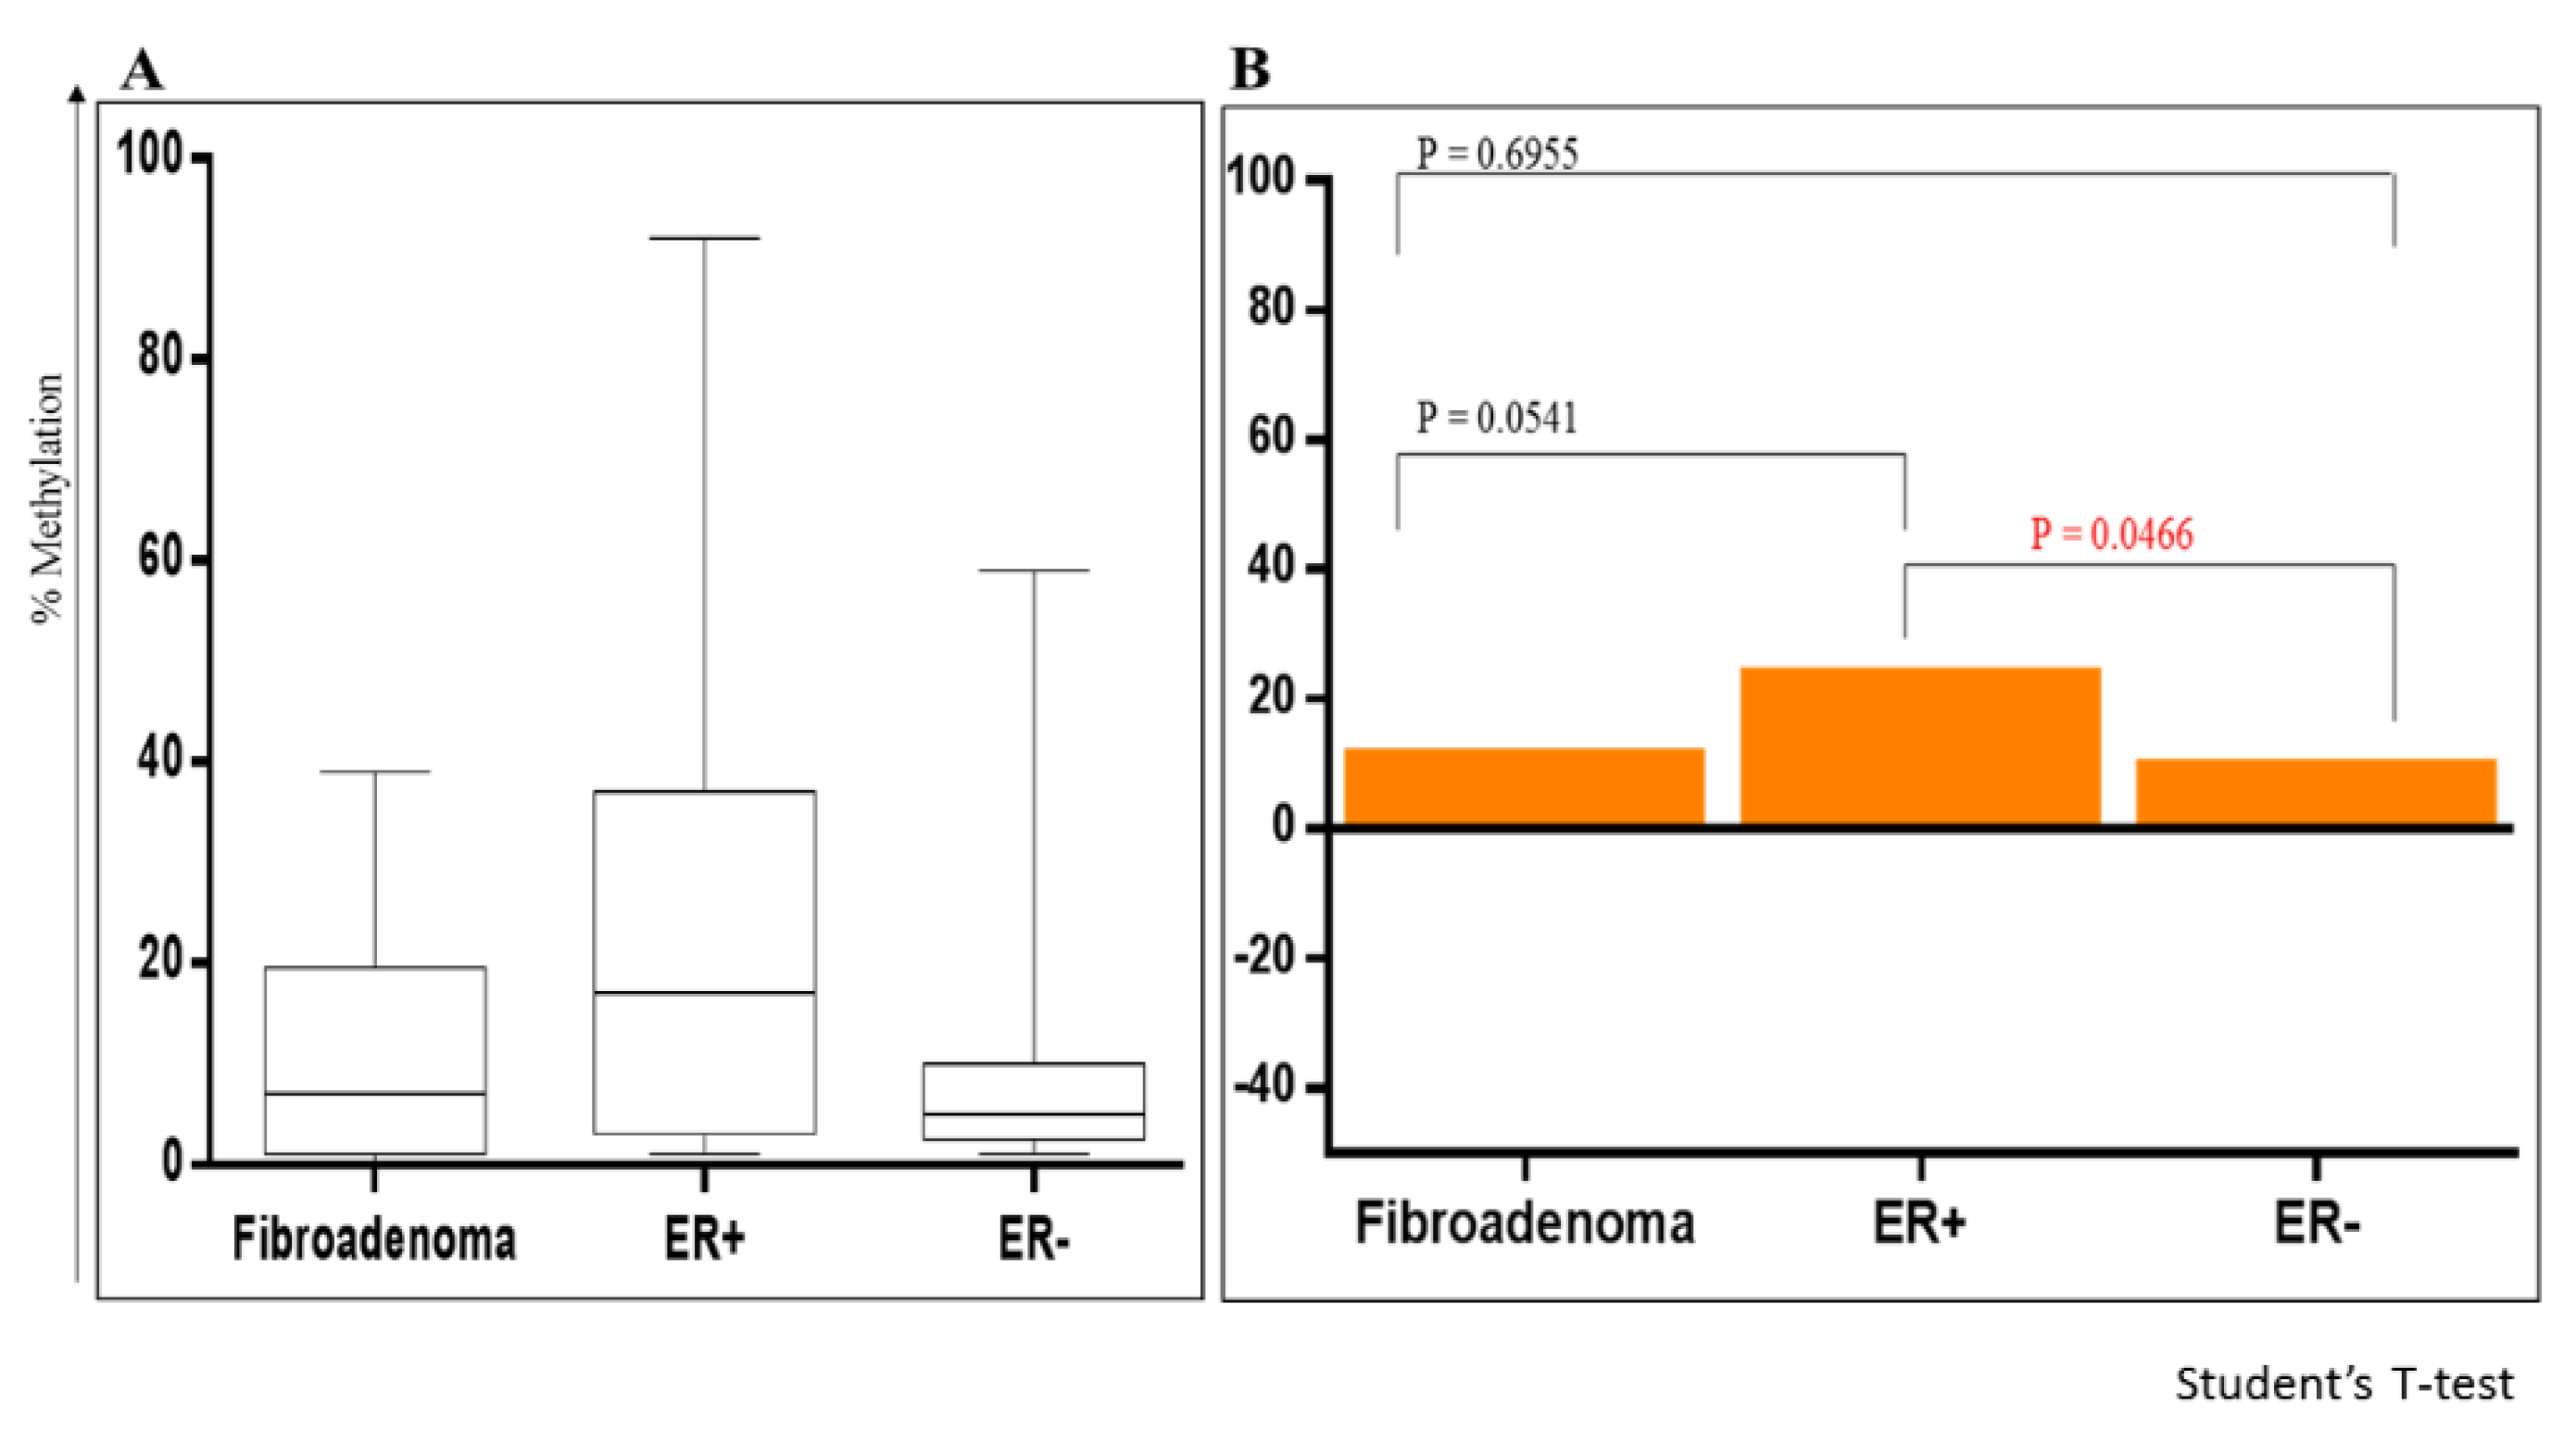
For HIN-1, the mean methylation level was 12% in fibroadenoma, 26% in ER+ve BCa, and 10% in ER-ve BCa. HIN-1 was highly methylated in ER+ve BCa when compared to ER-ve BCa (p = 0.046) while no significant difference was observed between fibroadenoma and ER+ve BCa (p = 0.054) and nor between fibroadenoma and ER-negative BCa (p = 0.595) (Figure 8).
Figure 8.
Methylation of HIN-1 in fibroadenoma, ER+ve and ER-ve BCa tissues. (A) Quantitative DNA methylation analysis in breast tissues. Y-axis, percentage of methylated cytosines by pyrosequencing; X-axis breast tissue types. Box and whisker plot showing the distribution of HIN1 methylation in fibroadenoma, ER+ve and ER-ve BCa. Boundary on the box represent values in the 25th and 75th percentile. Line within the box marks the median value. Whiskers (error bars) above indicates the maximum value while below indicates the minimum value; (B) Bar graph comparing the mean methylation levels.
2.7. Logistic Regression Analysis of Fibroadenoma with ER+ve and ER-ve BCa
Logistic regression analysis was performed to compare fibroadenoma with ER+ve and ER-ve BCa while adjusting for DNA methylation in ESRα, RASSF1A and HIN-1 genes. The response variables for the logistic regression were (0) not cancer and (1) for cancer. Fibroadenoma was set as (0) and ER+ve as (1) when compared fibroadenoma with ER+ve BCa, and fibroadenoma as (0) and ER-ve as (1) when compared fibroadenoma with ER-negative BCa. A total of seven models with all combinations were assessed. Only samples in each breast tissue subtype for which methylation data for three genes were available were included in the analysis. No significant difference was observed between the levels of DNA methylation in fibroadenoma and ER+ve BCa when the three genes were assessed as a single-panel model, two-panels model and in a three-panels model. However, when the three genes were assessed in the three-panels model, RASSF1A was significant when adjusting or controlling for ESRα and HIN-1 (Table 2). When comparing fibroadenoma with ER-ve BCa, two genes ESRα and RASSF1A showed significant difference in all tested models while HIN-1 showed no significant difference in all the tested models (Table 3). These findings suggest that promoter methylation changed significantly in benign tumors and methylation of tumor-related genes is an early event in BCa progression.
Table 2.
Logistic regression analysis comparing fibroadenoma with ER-positive BCa.
| Genes | ESRα | RASSF1A | HIN-1 | ESRα +HIN1 | RASSF1A + HIN1 | ESRα + RASSF1A | ESRα + RASSF1A + HIN1 |
|---|---|---|---|---|---|---|---|
| ESRα | 0.098 | –––– | –––– | 0.164 | –––– | 0.066 | 0.129 |
| RASSF1A | –––– | 0.114 | –––– | –––– | 0.052 | 0.078 | 0.044 |
| HIN-1 | –––– | 0.173 | 0.321 | 0.069 | –––– | 0.155 |
Table 3.
Logistic regression analysis comparing fibroadenoma with ER-negative BCa
| ESRα | 0.009 | –––– | –––– | 0.009 | –––– | 0.024 | 0.025 |
| RASSF1A | –––– | 0.022 | –––– | –––– | 0.005 | 0.015 | 0.016 |
| HIN-1 | –––– | –––– | .091 | 0.595 | 0.949 | –––– | 0.865 |
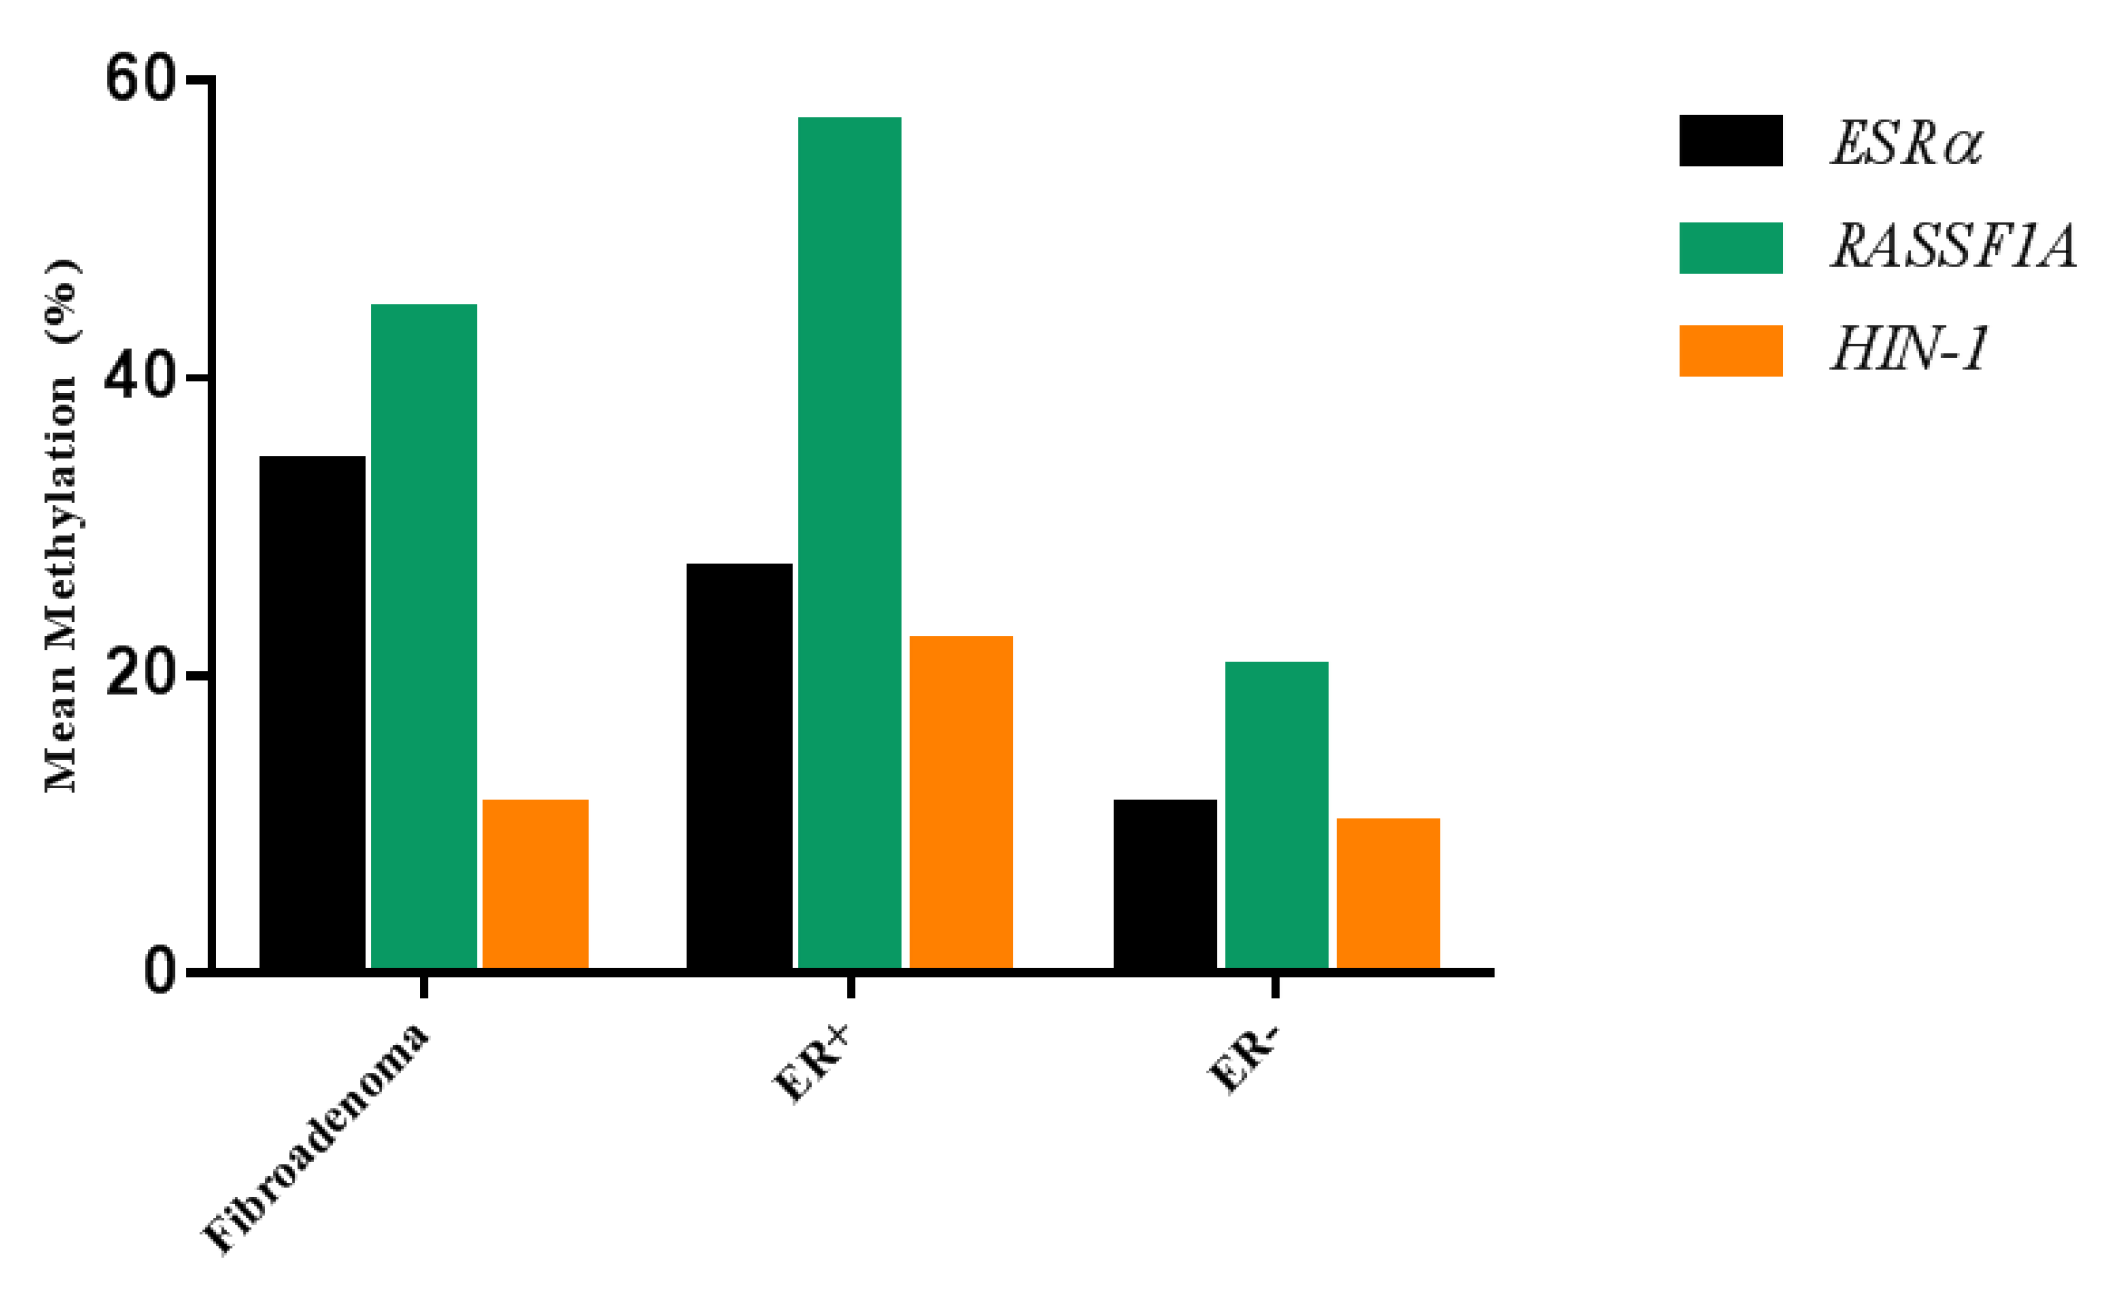
To check if DNA methylation influence multiple gene networks rather than a single gene, further analysis was performed to assess if there is an interaction between DNA methylation of different genes (ESRα, RASSF1A and HIN-1) within the different types of breast tissues (Fibroadenoma, and ER+ve and ER-negative BCa). Two-way ANOVA Univariate Analysis of Variance revealed a significant interaction between gene and breast tissue types (p = 0.001). ANOVA Mixed Model was further performed and revealed a significant interaction between the RASSF1A gene with fibroadenoma and ER+ve BCa (p = 0.004) (Figure 9).
Figure 9.
Interaction between DNA methylation of different genes (ESRα, RASSF1A and HIN-1) within the different types of breast tissues. Bar graph showing mean methylation levels of ESRα, RASSF1A and HIN-1 in fibroadenoma, ER+ve and ER-ve BCa. ANOVA Mixed Model showed a significant interaction between fibroadenoma and ER+ve BCa with RASSF1A. .
2.8. Correlation of DNA Methylation in the P0 and P1 Promoters of ESRα with the Clinicopathological Characteristics
Statistical analysis showed an association between methylation levels of P0 and P1 promoters and the clinical characteristics of the ER+ve and ER-ve tumors (Table 4). DNA methylation in ER+ve BCa was associated with molecular subtypes (p = 0.014) and grade (p = 0.022). Tumors with unclassified molecular subtype (ER+ve , PR-ve, HER2-ve) had elevated levels of methylation in the P0 promoter compared with luminal B (ER+ve, PR+ve, HER2+ve) tumors (p = 0.046). Tumors with grade 3 showed a borderline association with P1 promoter methylation when compared with tumors with grade 2 ( p = 0.056). No association was observed for histology of tumor, age, tumor size, stage, and lymph node status. For ER-ve BCa there was a significant association between methylation and tumor size (p = 0.018). Tumors ≤ 2cm had elevated levels of methylation in the P0 promoter compared to P1 promoter (p = 0.001). No association was observed with histology of tumor, age, molecular subtypes, grade, stage, and lymph node status. No unknowns were included in the data analysis. Overall, these results showed that ESRα P0 promoter is methylated in the initial stages of breast carcinogenesis while the methylation in the P1 promoter occurs at late stages of BCa with poor prognosis.
Table 4.
Association of methylation levels of ESRα P0 and P1 promoters with the clinicopathological characteristics of the ER+ve and ER-ve tumors (N: number of samples).
Table 4.
Association of methylation levels of ESRα P0 and P1 promoters with the clinicopathological characteristics of the ER+ve and ER-ve tumors (N: number of samples).
| Clinicopathological characteristics | ER-positive | ER-negative | ||
| N | p-value | N | p-value | |
| Histology of Tumor | 0.156 | 0.768 | ||
| Adenocarcinoma | 2 | |||
| Ductal carcinoma | 2 | |||
| Infiltrating ductal carcinoma | 11 | 19 | ||
| Medullary Adenocarcinoma | 1 | |||
| Medullary carcinoma | 1 | |||
| Metaplastic carcinoma | 1 | |||
| Age | 15 | 0.072 | 22 | 0.149 |
| Molecular Subtypes | 0.014 | 0.795 | ||
| Luminal A | 1 | |||
| Luminal B | 6 | |||
| Triple Negative | 15 | |||
| HER2 Type | 4 | |||
| ER+ve, PR-ve, HER2-ve | 5 | |||
| ER+ve, PR+ve, Unknown | 2 | |||
| ER+ve, PR-ve, Unknown | 1 | |||
| ER-ve, PR+ve, HER2-ve | 3 | |||
| Tumor Size | 0.922 | 0.018 | ||
| ≤ 2 cm | 5 | 8 | ||
| > 2 cm | 6 | 12 | ||
| Unknowns | 4 | 2 | ||
| Grade | 0.022 | 0.774 | ||
| Grade I | ||||
| Grade II | 5 | 1 | ||
| Grade III | 8 | 20 | ||
| Unknown | 1 | |||
| Stage | 0.186 | 0.77 | ||
| 0 | 1 | |||
| 1 | 2 | 6 | ||
| 2 | 4 | 5 | ||
| 3 | 4 | 7 | ||
| 4 | 1 | 1 | ||
| Unknowns | 3 | 3 | ||
| Lymph Node | 0.3 | 0.853 | ||
| Lymph Node positive | 8 | 6 | ||
| Lymph Node negative | 2 | 12 | ||
| Unknowns | 4 | 4 | ||
| Survival Status | ||||
| Dead | 3 | 12 | ||
| Alive | 11 | 10 | ||
| unknown | 1 | |||
2.9. Correlation of DNA Methylation in Promoters of RASSF1 and HIN-1 with the Clinicopathological Characteristics
There was an association between RASSF1A (p = 0.0003) and HIN1 (p = 0.317) promoters’ methylation with ER tumor status. No association was observed with histology of tumor, age, grade, stage, tumor size, and lymph node status (Table 5).
Table 5.
Relationship between RASSF1A and HIN-1 promoter methylation with the clinicopathological characteristics.
Table 5.
Relationship between RASSF1A and HIN-1 promoter methylation with the clinicopathological characteristics.
| Clinicopathological characteristics | RASSF1A | HIN-1 | ||
| N | p-value | N | p-value | |
| Histology of tumor | 0.713 | 0.203 | ||
| Infiltrating ductal carcinoma | 29 | 29 | ||
| Others | 4 | 6 | ||
| Age | 0.377 | 0.403 | ||
| ER-status | 0.0003 | 0.032 | ||
| ER-positive | 12 | 14 | ||
| ER-negative | 22 | 21 | ||
| Tumor size | 0.499 | 0.89 | ||
| < 2 cm | 12 | 15 | ||
| > 2 cm | 17 | 18 | ||
| Grade | 0.599 | 0.157 | ||
| Grade II | 4 | 5 | ||
| Grade III | 29 | 29 | ||
| Stage | 0.995 | 0.287 | ||
| 1 | 7 | 8 | ||
| 2 | 8 | 8 | ||
| 3 | 11 | 10 | ||
| 4 | 4 | 2 | ||
| Lymph node | 0.307 | 0.927 | ||
| Positive lymph node | 13 | 13 | ||
| Negative lymph node | 16 | 16 | ||
3. Discussion
Fibroadenoma is a benign breast disease that is commonly diagnosed in younger women [49]. The clinical and histopathological diagnoses of benign breast tumor includes developmental abnormalities, inflammatory lesions, epithelial and stromal proliferations as well as neoplasm [34,50]. ESRα promoter methylation is an epigenetic abnormality in cancer and hypermethylation-mediated loss of ER expression could provide the cell with growth-promoting characteristics such as insensitivity to antigrowth signals [51].
In this study we investigated if there is a direct link between P0 and P1 promoters of ESRα aberrant methylation and risk of progression of fibroadenoma and fibrocystic benign diseases to BCa. The percentage of DNA methylation levels in the P0 and P1 promoters of ESRα containing a CpG islands was quantified by using the high throughput pyrosequencing in human ER+ve (MCF7) and ER-ve (HCC1806 and MDA-MB-231) BCa cell lines; and in different types of human breast tissues (mammoplasty breast reduction, benign breast diseases and BCa). QRT- PCR was also performed to measure the expression of ESRα, RASSF1A and HIN1 in the BCa cell lines and breast tissues. The ER+ve (MCF7) and ER-ve (HCC1806) BCa cell lines had higher level of DNA of methylation in the P0 promoter but not in the P1. While MDA-MB-231 showed low levels of methylation both in the P0 and P1 promoters. When the expression of ESRα was measured in these cell lines, relative to MCF7 cell, HCC106 cells showed down regulation of ESRα while MDA-MB-231 showed no expression of ESRα. Such data reveals that expression of ESRα in MCF7 cell is transcribed from the P1 promoter. A study by Tanimoto, et al [52] reported that in MCF7 cells in which estrogen receptor is overexpressed, both the P0 and P1 promoters are transcribed, with transcript from the P0 promoter responsible for the enhanced expression. Treilleux and colleagues [53] findings suggest that the P1 transcript is the major transcript in MCF7 cells. Similar to the results of our study, partial DNA methylation in the P0 promoter in MCF7 cell has also been reported [54]. A possible mechanism of methylation in the P0 may be due to the presence of pyrimidine-rich sequence in the P0 promoter. Methylation of the 5th carbon position in the pyrimidine ring of a cytosine in a CpG island causes a change in chromatin structure abolishing the accessibility of transcription factors and promoting the formation of methyl-CpG binding domains. Mehtyl-CpG binding domains recruits additional silencing associated proteins which are all involved in gene silencing [55,56]. Another well-established mechanism reported by Yoshida et al [54] is the presence of a cis-element in the non-coding region which functions as an enhancer sequence and interacts with nuclear proteins called Estrogen Receptor Promoter B Associated Factor-1 (ERBF-1). The binding of ERBF-1 onto this element is essential for basal level expression of mRNA from the P0 promoter and it is the main determining factor for transcription and preferential usage of the P0 promoter. Deletion of this element or inhibition of the protein complex that binds to this element leads to the complete suppression of promoter activity. Other transcription factors that could be affected because of methylation in the P0 promoter are Sp-1 and AP-1. The HCC1806 cell line showed a low level of methylation in the P1 promoter while MDA-MB-231 cell line showed low levels of methylation in both the P0 and the P1 promoters. Both these BCa cell lines are ER-ve negative and the low level of methylation suggests that other mechanisms could be involved in the loss of estrogen receptor. Koster et al [57] reported high expression of Growth Hormone Releasing Hormone in HCC1806 cell lines leads to the activation of MAP-kinases ERK-1/2, and the hyperactivation of MAP-kinases is associated with loss of ER [58]. Contrary to a previous study [59] in which methylation in the ESRα was associated with the loss of ER expression in the MBA-MB-231 cell line and demethylating treatment with 5-aza-2’-deoxycytidine induced re-expression ER, in this report low levels of methylation was observed both in the P0 and P1 promoters revealing methylation is not the only mechanisms involved in the loss of ER in this cell line. Hayashi’s team, after treating MDA-MDA 231 cells with increased concentrations of 5-aza-2’-deoxycytidine, did not observe re-expression of ER. The team concluded that loss of the ER expression was not due to methylation in the gene but the loss of Estrogen Receptor Promoter B Associated Factor-1 (ERBF-1) which is critical for suppression of the ER gene for the P0 promoter. Another established mechanism is the loss of ERBF-1 proteins that binds to transcriptional regulatory elements in the P1 promoter, and essential for the transcription of the P1 promoter while it’s binding site is crucial for estrogen-independent activity of the P1 promoter [60]. More so, such inconsistency in these data on human BCa cell lines may be due to its dissimilar sources as well as change in the nature of the cells during wide distribution.
Comparing Methylation in the P0 and P1 Promoters of ESRα in Breast Tissues
After assessing the methylation in the human BCa cell lines, methylation in the P0 and P1 promoters were quantified by pyrosequencing. For each type of the breast tissues, the level of methylation was compared between the P0 and P1 promoters. Among the five types of breast tissues only fibroadenoma showed a significant higher level of methylation than in the P1 promoter. The expression of ESRα was measured and relative to mammoplasty reduction, fibrocystic, fibroadenoma, and ER+ve BCa showed an approximately 2-fold increase in ESRα expression and low expression in ER- negative BCa. When ESRα expression was correlated with levels of methylation in the P0 and P1 promoters, a negative correlation was observed between methylation in the P0 promoter with the mammoplasty reduction tissue and ER+ BCa. No correlation was observed in the P1 promoter in the five types of breast tissues. Similar results of week correlation between methylation in ESRα and estrogen expression has also been published [61,62,63]. Following this observation, the methylation in the P0 promoter was compared across the five types of breast tissues and no significant difference was observed.
The Influence of Menstrual Cycle on ESRα Transcription
In normal human endometrial tissue, it is well documented that there is an increase in expression of ER during the proliferative phase of the menstrual cycle but this expression decreases during the secretory phase [64] . Hori et al [65] reported similar findings with endometrial diseases and their conclusion was that the P0 promoter is frequently methylated during the secretory phase of the menstrual cycle while the P1 promoter is methylated during the proliferative phase, and the transcript of the P1 promoter is predominant in precancerous endometrial tissues. Studies conducted on breast tissues by Mohammad and Atalay [66] reported an increase in ER expression during the luteal phase of the menstrual cycle. Their results revealed that the translation of ER could be influenced during the distinct phases of a normal menstrual cycle due to the concentration of estrogen in the blood. There is convincing evidence that supports this claim in pre-menopausal women and post-menopausal women. In pre-menopausal women expression of ER is associated with transcript from the P1 promoter. Whereas, in post-menopausal women, ER is associated with transcripts from the P0 promoter in which low levels of estrogen in a milieu of tumor cells influences the transcription of the P0 promoter in ER+ve BCa [67]. Quintas-Granados reported that methylation levels at ESR1 were associated with menopausal status, and postmenopausal patients, the methylation levels were 1.5-fold higher than in premenopausal patients [68]. Therefore, the negative correlation observed in this study between P0 methylation and the expression of ER in mammoplasty reduction (23 patients <50 years) and ER+ve BCa (11 patients ≥ 50 years) could be explained by the deferential usage of the P0 and P1 promoter during menstrual cycle and low estrogen concentration in the blood.
Significance of P1 Promoter Methylation in Fibroadenoma and BCa
Fibroadenoma is a benign breast lump that is associated with women of younger age. Pathologically, fibroadenoma is a biphasic tumor that is composed of an epithelial and a stromal component [32]. Even though fibroadenoma is considered a benign breast disease, in the past years, there has been growing evidence of fibroadenoma harboring carcinomas [69,70,71,72,73]. Therefore, examining the methylation pattern of cancer-causing genes in fibroadenoma will elucidate possible epigenetic mechanisms involved in the development and progression of BCa. In this study, an elevated level of methylation was observed in the ESRα P1 promoter in fibroadenoma and then compared to the methylation levels of the P1 promoter in ER+ve and ER-ve BCa. Fibroadenoma and ER+ve BCa showed a similar but weak association of methylation patterns; but not with ER-ve BCa in which methylation in fibroadenoma was significantly higher. To further the investigation in fibroadenoma, ER+ve and ER-ve BCa, two additional genes (RASSF1A and HIN-1) were assessed for DNA methylation. RASSF1A a regulator of ER expression and function and HIN-1 a putative tumor suppressor, cytokine, and a regulator of apoptosis by inhibition of cell growth. Methylation in RASSF1A in fibroadenoma was found to be similar to ER+ve BCa but not with ER-ve BCa. Whereas low levels of methylation in HIN-1 in fibroadenoma did not show a significant difference with ER+ve and ER-ve BCa.
Logistic Regression Analysis
Logistic regression analysis was performed to compare fibroadenoma with ER+ve and ER-ve BCa adjusting for ESRα, RASSF1A and HIN-1 in a total of seven logistic panel models. When fibroadenoma was compared with ER+ve BCa, methylation of RASSF1A had a greater influence on the progression of fibroadenoma to ER+ve BCa when all three genes were placed in a single logistic model, suggesting that the progression of fibroadenoma to ER+ve BCa requires methylation in all three genes. When fibroadenoma was compared to ER+ve BCa, ESRα and RASSF1A had a greater influence on the progression of fibroadenoma to ER-ve BCa, while HIN-1 did not, suggesting that the progression of fibroadenoma toward ER-ve BCa requires methylation in ESRα and RASSF1A. This result also revealed the epistatic regulation of RASSF1A regulation of estrogen receptor expression and function. Similar to the results of this study, other groups have also reported high methylation of RASSF1A with ER+ve BCa [61,74,75,76,77,78] and methylation of ESRα, RASSF1A and HIN1 in fibroadenoma [79,80]. Another study suggested that ER-α promoter methylation is a biomarker for outcome prediction of cisplatin resistance in triple-negative breast cancer [81].
Gao et al [4] reported that ESRβ promoter methylation could be a potential indicator of malignant changes in breast cancer. Therefore, the future direction of our work is to perform a replicative study to assess methylation in the promoters of ESRα (P1), ESRβ, and RASSF1A on a larger sample size in fibroadenoma and to explore other mechanisms involved in the loss of ER expression in BCa.
4. Materials and Methods
4.1. Human Breast Tissues
With the Howard University Institutional Review Board approval (IRB-11-MED-75) and following HIPPA guidelines, we retrieved and coded a total of 130 formalin-fixed-paraffin-embedded (FFPE) breast tissues [28 normal mammoplasties, 31 fibrocystic, 34 fibroadenoma, 15 ER-positive (ER+ve) and 22 ER-negative (ER-ve) BCa] from the Howard University Hospital (HUH) Pathology Department archives with the clinicopathological data.
4.2. Immunohistochemistry (IHC) and Hematoxylin and Eosin (H&E) Staining
Five-μm sections were cut from the FFPE blocks and mounted on Superfrost Plus microscope slides (Thermo Fisher Scientific, MA, USA) for H&E and IHC staining with specific monoclonal antibodies for nuclear ESRα (clone EP1, Dako, Carpinteria, California, USA) as described previously [82]. Areas concentrated with at least 70% of cancer cells were marked by the pathologist and dissected for DNA and RNA extraction. Whereas the DNA and RNA were extracted from the whole tissue sections of fibrocystic and fibroadenoma tissues.
4.3. Breast Cancer Cell Lines
MCF-7 (ER+, PR+, HER2+), MDA-MB-231 (ER-, PR-, HER2-) and HCC1806 (ER-, PR-, HER2-) BCa cell lines were purchased from American Type Culture Collection (ATCC, Manassas, VA, USA). The cell lines were cultured in RPMI-1640 medium (Cellgro, Mediatech Inc., VA, USA) supplemented with 10% fetal bovine serum, and 1X HyClone antibiotics and incubated in 5% CO2/95% air at 37ºC.
4.4. DNA and RNA Isolation
Genomic DNA and RNA were isolated from the tissues/dissected BCa cells using E.Z.N.A FFPE DNA kit (Omega Bio-TEK Inc., GA, USA), and from BCa cell lines using the All-Prep DNA/RNA/ Protein Mini Kit (Qiagen Inc., CA, USA) following the manufacturers’ protocols. DNA and RNA concentrations were measured using Nanodrop Spectrophotometer (Nanodrop, Wilmington, DE, USA) and stored at -80°C.
4.5. Bisulfite Modification
Two hundred-500 ng/µl of the isolated genomic DNA from FPPE tissues was modified using sodium bisulfite treatment EZ Methylation Kit (Zymo Research Inc., Irvine, California, USA) and following manufacture’s protocol. Bisulfite modification was completed by DNA de-sulfonation in 0.3 mol/L NaOH at 37°C for 15 minutes, and the DNA was precipitated and washed in 70% ethanol, dried, and resuspended in 50 μL of TE buffer (100 mM Tris Cl, 1 mM EDTA, pH 8.3), and stored at -20ºC.
4.6. Designing Polymerase Chain Reaction (PCR) and Pyrosequencing Primers
Bioinformatics approach was employed to identify DNA sequences of P0 and P1 promoters of human ESRα from the National Center for Biotechnology Information (NCBI) data base. This process was accomplished by using PCR primers designed by Iwase et al [83].
Qiagen PyroMark Assay Design Software version 2.0.2 was used for designing PCR and pyrosequencing primers to assess the methylation status of CpG in P0 promoter with an overall score of 92%. Primers for P1 were purchased from Qiagen (PM PyroMark CpG Assay) (Table 5). The PCR primers were designed to assess the methylation status of CpGs within 2 kb from the transcription start site for ESRα and within 0.5kb from the transcription start site for RASSF1A and HIN-1. The reverse primer was substituted with a 5′ tailed unlabeled reverse primer and a biotinylated universal primer at a ratio of 1:9 in the PCR reaction to create a single strand DNA template for the pyrosequencing reaction. Either one-step or two-steps PCR reactions were carried out using 2 μL of bisulfite-converted genomic DNA and either one or two sets of different bisulfite PCR primers in a standard PCR reaction mix as previously described [84]. Amplification was conducted using Gene Amp PCR System 9700 (Applied Biosystems, Carlsbad, USA). For HIN-1 PCR reaction was performed in two-steps as previously described [75]. The integrity of the PCR product was verified on 2% agarose gel with ethidium bromide staining at 140 volts for 30 minutes.
Table 5.
Polymerase chain reaction (PCR) and pyrosequencing primers.
| PyroMark PCR and sequencing primers for ESRα P0 and P1 promoters | |
| P0 Promoter primers | Forward: 5' GGGAAGTAGTTAGTAGGTAGGGTATTTG 3' Reverse: 5' Biotin-TCACTCCCCACTACCATTCAT 3' Sequencing: 5' AGGGTATTTGGTAGTTTTT 3' Sequence analyzed: 5’TTYGGTAGATAYGTAGTTGGGTTATTGTAT AGYGTTGGATGAATGGTAGTGGGGAGTG 3’ |
| P1 Promoter primers | Qiagen Inc. Valencia, California Catalog Number: PM00024619 |
| PyroMark PCR and sequencing primers for RASSF1 | |
| RASSFIA | Forward: 5' GGGGGAGTTTGAGTTTATTGA 3' Reverse: 5' Biotin- CTACCCCTTAACTACCCCTTCC 3' Sequencing: 5' GGGTAGTATTAGGTTGGAG 3' |
| PyroMark PCR and sequencing primers for HIN1 | |
4.7. Quantitative Analysis of DNA Methylation by Pyrosequencing
Biotinylated PCR products were immobilized onto Streptavidin Sepharose High Performance beads (GE Healthcare Piscataway, New Jersey, USA), washed, denatured, and the biotinylated strands were released into annealing buffer containing the sequencing primer. Bisulfite converted methylated DNA and bisulfite converted unmethylated DNA were used as positive and negative controls; respectively. Pyrosequencing was performed using the Pyro Mark Gold Q96 Reagents (Qiagen Inc.) and the PyroMark Q 96 MD equipment (Qiagen Inc.). Each pyrosequencing reaction was repeated at least twice.
4.8. Gene Expression Analysis
Two-µg of isolated total RNA was converted to cDNA using the high-capacity cDNA reverse transcriptase kit (Applied Biosystems) following the manufacturer’s protocol. Reverse transcription was conducted in a Gene Amp PCR System 9700 thermo cycler. The running condition was set as follows: 37ºC for 60 minutes, 95ºC for 5 minutes and stored at 4ºC.
4.9. Statistical Analyses
Statistical analyses were performed using SPSS version 22 (IBM, SPSS, New York, USA) with p < 0.05 considered as statistically significant and test was two-tailed. Plotting of data were performed with GraphPad Prism (Graphpad Software Inc., San Diego, California, USA). Student’s t-test assuming unequal variance was used to compare mean methylation level between promoters. Two-way ANOVA mixed model was used to assess methylation changes in normal and BCa tissues. Fisher exact test was used for association between age and types of breast tissues. Correlation between methylation and gene expression was performed using Pearson’s correlation. We used a cutoff corresponding to average methylation in normal tissues +2 SD to call a cancer as methylation positive (above the cutoff). Association of methylation of P0 and P1 promoters and clinicopathological characteristics were calculated using Wald Chi-Square test. Linear regression was used to evaluate the association of methylation in genes as a risk factor of fibroadenoma progression to ER+ve and ER-ve BCa.
Author Contributions
“Conceptualization, Y.K., O.K.K., R.L.C., and R.L.D.; methodology, S.D., D.B., and T.J.N; validation, Y.K., B.K.A., S.D., and T.J.N.; statistical analyses, VA; formal analysis, Y.K., S.D., T.J.N., and B.K.A.; data curation, S.D., T.J.N.; writing—original draft preparation, Y.K., S.D., R.L.C and O.K.K; writing—review and editing, A.H.D., S.N., K.B., R.L.D., O.K.K., S.D., B.S., and B.K.A.; supervision, Y.K. All authors have read and agreed to the published version of the manuscript.
Funding
This research received no external funding.
Institutional Review Board Statement
The study was conducted in accordance with the Declaration of Helsinki and approved by the Institutional Review Board of Howard University (IRB-11-MED-75; approved in December 2011).
Informed Consent Statement
The study involved collection of existed pathological tissues and correlated clinical data. Therefore, the study was approved as under exempt category, and patient consent was not required and was waived.
Data Availability Statement
The raw data supporting the conclusions of this article will be made available by the authors on request.
Conflicts of Interest
The authors declare no conflict of interest.
References
- Zhang, Z., R. Zhang, and D. Li, Molecular Biology Mechanisms and Emerging Therapeutics of Triple-Negative Breast Cancer. Biologics, 2023. 17: p. 113-128. [CrossRef]
- Chen, P., B. Li, and L. Ou-Yang, Role of estrogen receptors in health and disease. Front Endocrinol (Lausanne), 2022. 13: p. 839005. [CrossRef]
- Jia, M., K. Dahlman-Wright, and J.A. Gustafsson, Estrogen receptor alpha and beta in health and disease. Best Pract Res Clin Endocrinol Metab, 2015. 29(4): p. 557-68. [CrossRef]
- Gao, L., et al., Estrogen receptor beta promoter methylation: a potential indicator of malignant changes in breast cancer. Arch Med Sci, 2016. 12(1): p. 129-36. [CrossRef]
- Paruthiyil, S., et al., Estrogen receptor beta causes a G2 cell cycle arrest by inhibiting CDK1 activity through the regulation of cyclin B1, GADD45A, and BTG2. Breast Cancer Res Treat, 2011. 129(3): p. 777-84. [CrossRef]
- Stingl, J., Estrogen and progesterone in normal mammary gland development and in cancer. Horm Cancer, 2011. 2(2): p. 85-90. [CrossRef]
- Saji, S., et al., Estrogen receptors alpha and beta in the rodent mammary gland. Proc Natl Acad Sci U S A, 2000. 97(1): p. 337-42. [CrossRef]
- Kerdivel, G., G. Flouriot, and F. Pakdel, Modulation of estrogen receptor alpha activity and expression during breast cancer progression. Vitam Horm, 2013. 93: p. 135-60. [CrossRef]
- Allred, D.C., S.K. Mohsin, and S.A. Fuqua, Histological and biological evolution of human premalignant breast disease. Endocr Relat Cancer, 2001. 8(1): p. 47-61. [CrossRef]
- Simpson, J.F., Update on atypical epithelial hyperplasia and ductal carcinoma in situ. Pathology, 2009. 41(1): p. 36-9. [CrossRef]
- Kurebayashi, J., et al., Expression levels of estrogen receptor-alpha, estrogen receptor-beta, coactivators, and corepressors in breast cancer. Clin Cancer Res, 2000. 6(2): p. 512-8.
- Brinkman, J.A. and D. El-Ashry, ER re-expression and re-sensitization to endocrine therapies in ER-negative breast cancers. J Mammary Gland Biol Neoplasia, 2009. 14(1): p. 67-78. [CrossRef]
- Lachner, M., R.J. O'Sullivan, and T. Jenuwein, An epigenetic road map for histone lysine methylation. J Cell Sci, 2003. 116(Pt 11): p. 2117-24. [CrossRef]
- Macaluso, M., et al., Epigenetic modulation of estrogen receptor-alpha by pRb family proteins: a novel mechanism in breast cancer. Cancer Res, 2007. 67(16): p. 7731-7. [CrossRef]
- Zhu, K., et al., Methyl-group dietary intake and risk of breast cancer among African-American women: a case-control study by methylation status of the estrogen receptor alpha genes. Cancer Causes Control, 2003. 14(9): p. 827-36. [CrossRef]
- Stirzaker, C., E. Zotenko, and S.J. Clark, Genome-wide DNA methylation profiling in triple-negative breast cancer reveals epigenetic signatures with important clinical value. Mol Cell Oncol, 2016. 3(1): p. e1038424. [CrossRef]
- Jovanovic, J., et al., The epigenetics of breast cancer. Mol Oncol, 2010. 4(3): p. 242-54. [CrossRef]
- Fatemi, M., et al., Footprinting of mammalian promoters: use of a CpG DNA methyltransferase revealing nucleosome positions at a single molecule level. Nucleic Acids Res, 2005. 33(20): p. e176. [CrossRef]
- Illingworth, R.S. and A.P. Bird, CpG islands--'a rough guide'. FEBS Lett, 2009. 583(11): p. 1713-20. [CrossRef]
- Takai, D. and P.A. Jones, Comprehensive analysis of CpG islands in human chromosomes 21 and 22. Proc Natl Acad Sci U S A, 2002. 99(6): p. 3740-5. [CrossRef]
- Lapidus, R.G., et al., Mapping of ER gene CpG island methylation-specific polymerase chain reaction. Cancer Res, 1998. 58(12): p. 2515-9.
- Lapidus, R.G., et al., Methylation of estrogen and progesterone receptor gene 5' CpG islands correlates with lack of estrogen and progesterone receptor gene expression in breast tumors. Clin Cancer Res, 1996. 2(5): p. 805-10.
- Weigel, R.J., et al., Quantitative analysis of the transcriptional start sites of estrogen receptor in breast carcinoma. Cell Growth Differ, 1995. 6(6): p. 707-11.
- Grandien, K., et al., Estrogen target tissue determines alternative promoter utilization of the human estrogen receptor gene in osteoblasts and tumor cell lines. Endocrinology, 1995. 136(5): p. 2223-9. [CrossRef]
- Herman, J.G. and S.B. Baylin, Gene silencing in cancer in association with promoter hypermethylation. N Engl J Med, 2003. 349(21): p. 2042-54. [CrossRef]
- O'Doherty, A.M., et al., Methylation status of oestrogen receptor-alpha gene promoter sequences in human ovarian epithelial cell lines. Br J Cancer, 2002. 86(2): p. 282-4. [CrossRef]
- Ottaviano, Y.L., et al., Methylation of the estrogen receptor gene CpG island marks loss of estrogen receptor expression in human breast cancer cells. Cancer Res, 1994. 54(10): p. 2552-5.
- Falette, N.S., et al., Estrogen receptor gene methylation in human breast tumors. Cancer Res, 1990. 50(13): p. 3974-8.
- Holst, C.R., et al., Methylation of p16(INK4a) promoters occurs in vivo in histologically normal human mammary epithelia. Cancer Res, 2003. 63(7): p. 1596-601.
- Laird, P.W., The power and the promise of DNA methylation markers. Nat Rev Cancer, 2003. 3(4): p. 253-66. [CrossRef]
- Wittenberger, T., et al., DNA methylation markers for early detection of women's cancer: promise and challenges. Epigenomics, 2014. 6(3): p. 311-27. [CrossRef]
- Sharma, G., et al., Clinical significance of promoter hypermethylation of DNA repair genes in tumor and serum DNA in invasive ductal breast carcinoma patients. Life Sci, 2010. 87(3-4): p. 83-91. [CrossRef]
- Jing, M.X., et al., Estrogen receptor-alpha promoter methylation in sporadic basal-like breast cancer of Chinese women. Tumour Biol, 2011. 32(4): p. 713-9. [CrossRef]
- Lee, J.S., et al., A comparative study of Korean with Caucasian breast cancer reveals frequency of methylation in multiple genes correlates with breast cancer in young, ER, PR-negative breast cancer in Korean women. Cancer Biol Ther, 2007. 6(7): p. 1114-20. [CrossRef]
- Mehrotra, J., et al., Estrogen receptor/progesterone receptor-negative breast cancers of young African-American women have a higher frequency of methylation of multiple genes than those of Caucasian women. Clin Cancer Res, 2004. 10(6): p. 2052-7. [CrossRef]
- Bulut, N., et al., Demographic and clinico-pathological characteristics in patients with triple-negative and non-triple-negative breast cancer. Med Oncol, 2011. 28 Suppl 1: p. S75-9. [CrossRef]
- Lee, J.S., et al., Basal-like breast cancer displays distinct patterns of promoter methylation. Cancer Biol Ther, 2010. 9(12): p. 1017-24. [CrossRef]
- Porras, L., H. Ismail, and S. Mader, Positive Regulation of Estrogen Receptor Alpha in Breast Tumorigenesis. Cells, 2021. 10(11). [CrossRef]
- Raos, D., et al., Epigenetically inactivated RASSF1A as a tumor biomarker. Bosn J Basic Med Sci, 2021. 21(4): p. 386-397. [CrossRef]
- Liu, L., et al., Frequent hypermethylation of the RASSF1A gene in prostate cancer. Oncogene, 2002. 21(44): p. 6835-40. [CrossRef]
- Yoon, J.H., R. Dammann, and G.P. Pfeifer, Hypermethylation of the CpG island of the RASSF1A gene in ovarian and renal cell carcinomas. Int J Cancer, 2001. 94(2): p. 212-7. [CrossRef]
- Trivers, K.F., et al., Oral contraceptives and survival in breast cancer patients aged 20 to 54 years. Cancer Epidemiol Biomarkers Prev, 2007. 16(9): p. 1822-7. [CrossRef]
- Moorman, P.G., R.C. Millikan, and B. Newman, Oral contraceptives and breast cancer among African-american women and white women. J Natl Med Assoc, 2001. 93(9): p. 329-34.
- Tisserand, P., et al., Lack of HIN-1 methylation defines specific breast tumor subtypes including medullary carcinoma of the breast and BRCA1-linked tumors. Cancer Biol Ther, 2003. 2(5): p. 559-63. [CrossRef]
- Pang, J.M., A. Dobrovic, and S.B. Fox, DNA methylation in ductal carcinoma in situ of the breast. Breast Cancer Res, 2013. 15(3): p. 206. [CrossRef]
- Krop, I., et al., HIN-1, an inhibitor of cell growth, invasion, and AKT activation. Cancer Res, 2005. 65(21): p. 9659-69. [CrossRef]
- Gupta, V., P. Agarwal, and P. Deshpande, Impact of RASSF1A gene methylation on clinico-pathological features of tumor and non-tumor tissue of breast cancer. Ann Diagn Pathol, 2021. 52: p. 151722. [CrossRef]
- Fackler, M.J., et al., DNA methylation of RASSF1A, HIN-1, RAR-beta, Cyclin D2 and Twist in in situ and invasive lobular breast carcinoma. Int J Cancer, 2003. 107(6): p. 970-5.
- Ajmal, M., M. Khan, and K. Van Fossen, Breast Fibroadenoma, in StatPearls. 2024: Treasure Island (FL).
- Xu, L., et al., Breast carcinoma arising in a fibroadenoma: A case series of 16 patients and review of the literature. Oncol Lett, 2024. 27(1): p. 39. [CrossRef]
- Kirn, V., et al., ESR1-promoter-methylation status in primary breast cancer and its corresponding metastases. Clin Exp Metastasis, 2018. 35(7): p. 707-712. [CrossRef]
- Tanimoto, K., et al., Regulation of estrogen receptor alpha gene mediated by promoter B responsible for its enhanced expressionin human breast cancer. Nucleic Acids Res, 1999. 27(3): p. 903-9.. [CrossRef]
- Treilleux, et al., Human estrogen receptor (ER) gene promoter-P1: estradiol-independent activity and estradiol inducibility in ER+ and ER- cells. Mol Endocrinol, 1997. 11(9): p. 1319-31. [CrossRef]
- Yoshida, T., et al., Distinct mechanisms of loss of estrogen receptor alpha gene expression in human breast cancer: methylation of the gene and alteration of trans-acting factors. Carcinogenesis, 2000. 21(12): p. 2193-201. [CrossRef]
- Jones, P.A. and G. Liang, Rethinking how DNA methylation patterns are maintained. Nat Rev Genet, 2009. 10(11): p. 805-11. [CrossRef]
- Kondo, Y., et al., Gene silencing in cancer by histone H3 lysine 27 trimethylation independent of promoter DNA methylation. Nat Genet, 2008. 40(6): p. 741-50. [CrossRef]
- Koster, F., et al., Triple-negative breast cancers express receptors for growth hormone-releasing hormone (GHRH) and respond to GHRH antagonists with growth inhibition. Breast Cancer Res Treat, 2009. 116(2): p. 273-9. [CrossRef]
- Oh, A.S., et al., Hyperactivation of MAPK induces loss of ERalpha expression in breast cancer cells. Mol Endocrinol, 2001. 15(8): p. 1344-59. [CrossRef]
- Ferguson, A.T., et al., Demethylation of the estrogen receptor gene in estrogen receptor-negative breast cancer cells can reactivate estrogen receptor gene expression. Cancer Res, 1995. 55(11): p. 2279-83.
- deConinck, E.C., L.A. McPherson, and R.J. Weigel, Transcriptional regulation of estrogen receptor in breast carcinomas. Mol Cell Biol, 1995. 15(4): p. 2191-6. [CrossRef]
- Kajabova, V., et al., RASSF1A Promoter Methylation Levels Positively Correlate with Estrogen Receptor Expression in Breast Cancer Patients. Transl Oncol, 2013. 6(3): p. 297-304. [CrossRef]
- Buhmeida, A., et al., RASSF1A methylation is predictive of poor prognosis in female breast cancer in a background of overall low methylation frequency. Anticancer Res, 2011. 31(9): p. 2975-81.
- Gaudet, M.M., et al., DNA hypermethylation of ESR1 and PGR in breast cancer: pathologic and epidemiologic associations. Cancer Epidemiol Biomarkers Prev, 2009. 18(11): p. 3036-43. [CrossRef]
- Marquardt, R.M., et al., Progesterone and Estrogen Signaling in the Endometrium: What Goes Wrong in Endometriosis? Int J Mol Sci, 2019. 20(15).. [CrossRef]
- Hori, M., et al., Assessment of hypermethylated DNA in two promoter regions of the estrogen receptor alpha gene in human endometrial diseases. Gynecol Oncol, 2000. 76(1): p. 89-96. [CrossRef]
- Atalay, C., M. Kanlioz, and M. Altinok, Menstrual cycle and hormone receptor status in breast cancer patients. Neoplasma, 2002. 49(4): p. 278.
- Hayashi, S., et al., Two promoters in expression of estrogen receptor messenger RNA in human breast cancer. Carcinogenesis, 1997. 18(3): p. 459-64. [CrossRef]
- Quintas-Granados, L.I., et al., The high methylation level of a novel 151-bp CpG island in the ESR1 gene promoter is associated with a poor breast cancer prognosis. Cancer Cell Int, 2021. 21(1): p. 649. [CrossRef]
- Chintamani, et al., Carcinoma developing in a fibroadenoma in a woman with a family history of breast cancer: a case report and review of literature. Cases J, 2009. 2: p. 9348.
- Hayes, B.D. and C.M. Quinn, Microinvasive lobular carcinoma arising in a fibroadenoma. Int J Surg Pathol, 2013. 21(4): p. 419-21. [CrossRef]
- Monsefi, N., et al., Mucinous subtype of invasive ductal carcinoma arising within a fibroadenoma. Arch Iran Med, 2013. 16(6): p. 366-8.
- Worsham, M.J., et al., Risk factors for breast cancer from benign breast disease in a diverse population. Breast Cancer Res Treat, 2009. 118(1): p. 1-7. [CrossRef]
- Kuijper, A., et al., Multiple fibroadenomas harbouring carcinoma in situ in a woman with a family history of breast/ovarian cancer. J Clin Pathol, 2002. 55(10): p. 795-7. [CrossRef]
- Zmetakova, I., et al., Evaluation of protein expression and DNA methylation profiles detected by pyrosequencing in invasive breast cancer. Neoplasma, 2013. 60(6): p. 635-46. [CrossRef]
- Wang, S., et al., Relationship between tumor DNA methylation status and patient characteristics in African-American and European-American women with breast cancer. PLoS One, 2012. 7(5): p. e37928. [CrossRef]
- Thaler, S., et al., RASSF1A inhibits estrogen receptor alpha expression and estrogen-independent signalling: implications for breast cancer development. Oncogene, 2012. 31(47): p. 4912-22. [CrossRef]
- Feng, W., et al., Correlation between CpG methylation profiles and hormone receptor status in breast cancers. Breast Cancer Res, 2007. 9(4): p. R57. [CrossRef]
- Cho, Y.H., et al., Prognostic significance of gene-specific promoter hypermethylation in breast cancer patients. Breast Cancer Res Treat, 2012. 131(1): p. 197-205. [CrossRef]
- Marzese, D.M., et al., Aberrant DNA methylation of cancer-related genes in giant breast fibroadenoma: a case report. J Med Case Rep, 2011. 5: p. 516. [CrossRef]
- Sturgeon, S.R., et al., Detection of promoter methylation of tumor suppressor genes in serum DNA of breast cancer cases and benign breast disease controls. Epigenetics, 2012. 7(11): p. 1258-67. [CrossRef]
- Xu, J., et al., Estrogen receptor-alpha promoter methylation is a biomarker for outcome prediction of cisplatin resistance in triple-negative breast cancer. Oncol Lett, 2018. 15(3): p. 2855-2862. [CrossRef]
- Beyene, D., et al., Cyclin A2 and Ki-67 proliferation markers could be used to identify tumors with poor prognosis in African American women with breast cancer. J Cancer Biol, 2023. 4(1): p. 3-16. [CrossRef]
- Iwase, H., et al., DNA methylation analysis at distal and proximal promoter regions of the oestrogen receptor gene in breast cancers. Br J Cancer, 1999. 80(12): p. 1982-6. [CrossRef]
- Kwabi-Addo, B., et al., Identification of differentially methylated genes in normal prostate tissues from African American and Caucasian men. Clin Cancer Res, 2010. 16(14): p. 3539-47. [CrossRef]
Figure 1.
Quantitative DNA Methylation of ESRα promoters in different types of breast tissue. Y-axis represents the percentage of cytosine methylation by pyrosequencing; X-axis represents the 5 breast tissue types. Box and whisker plot showing the distribution of methylation in the P0 and P1 promoters in the 5 breast tissue types. Boundaries on each box represent values in the 25th and 75th percentile. Line within the box marks the median value. Whiskers (error bars) indicates the maximum value, while below indicates the minimum value. Among the five breast tissue types, only fibroadenoma showed a significant difference in methylation in the P0 and P1 promoters with the P1 promoters showing high (red arrow) levels of methylation.
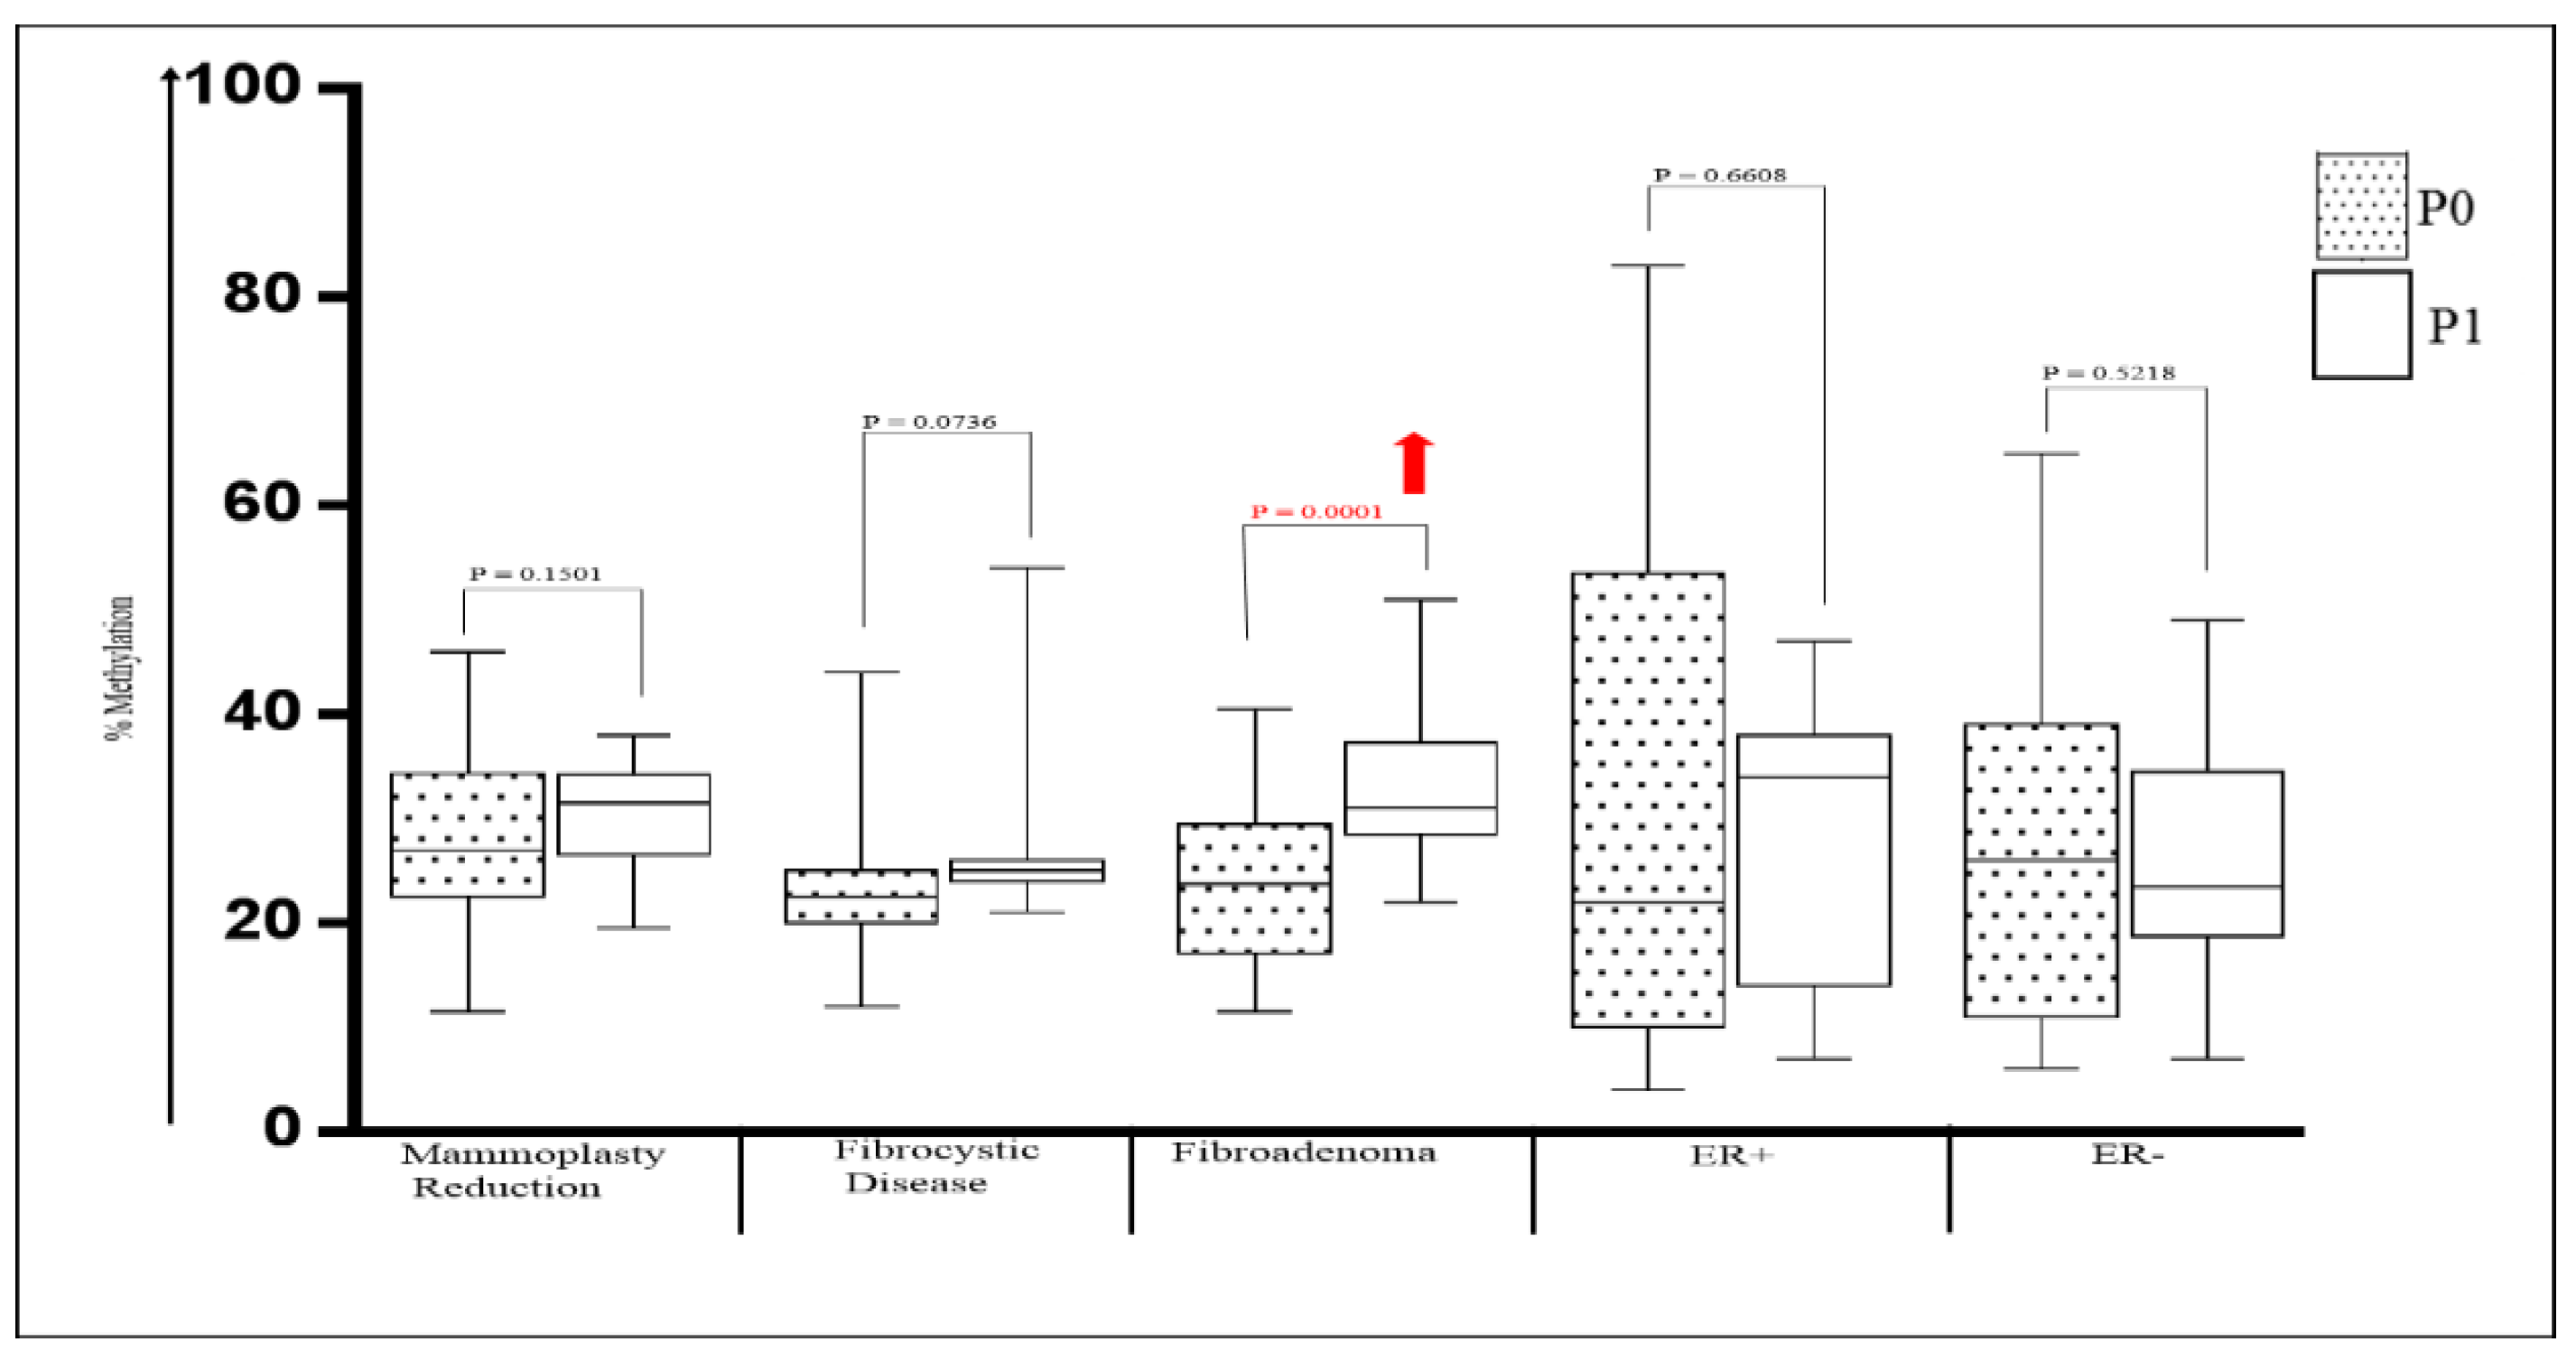
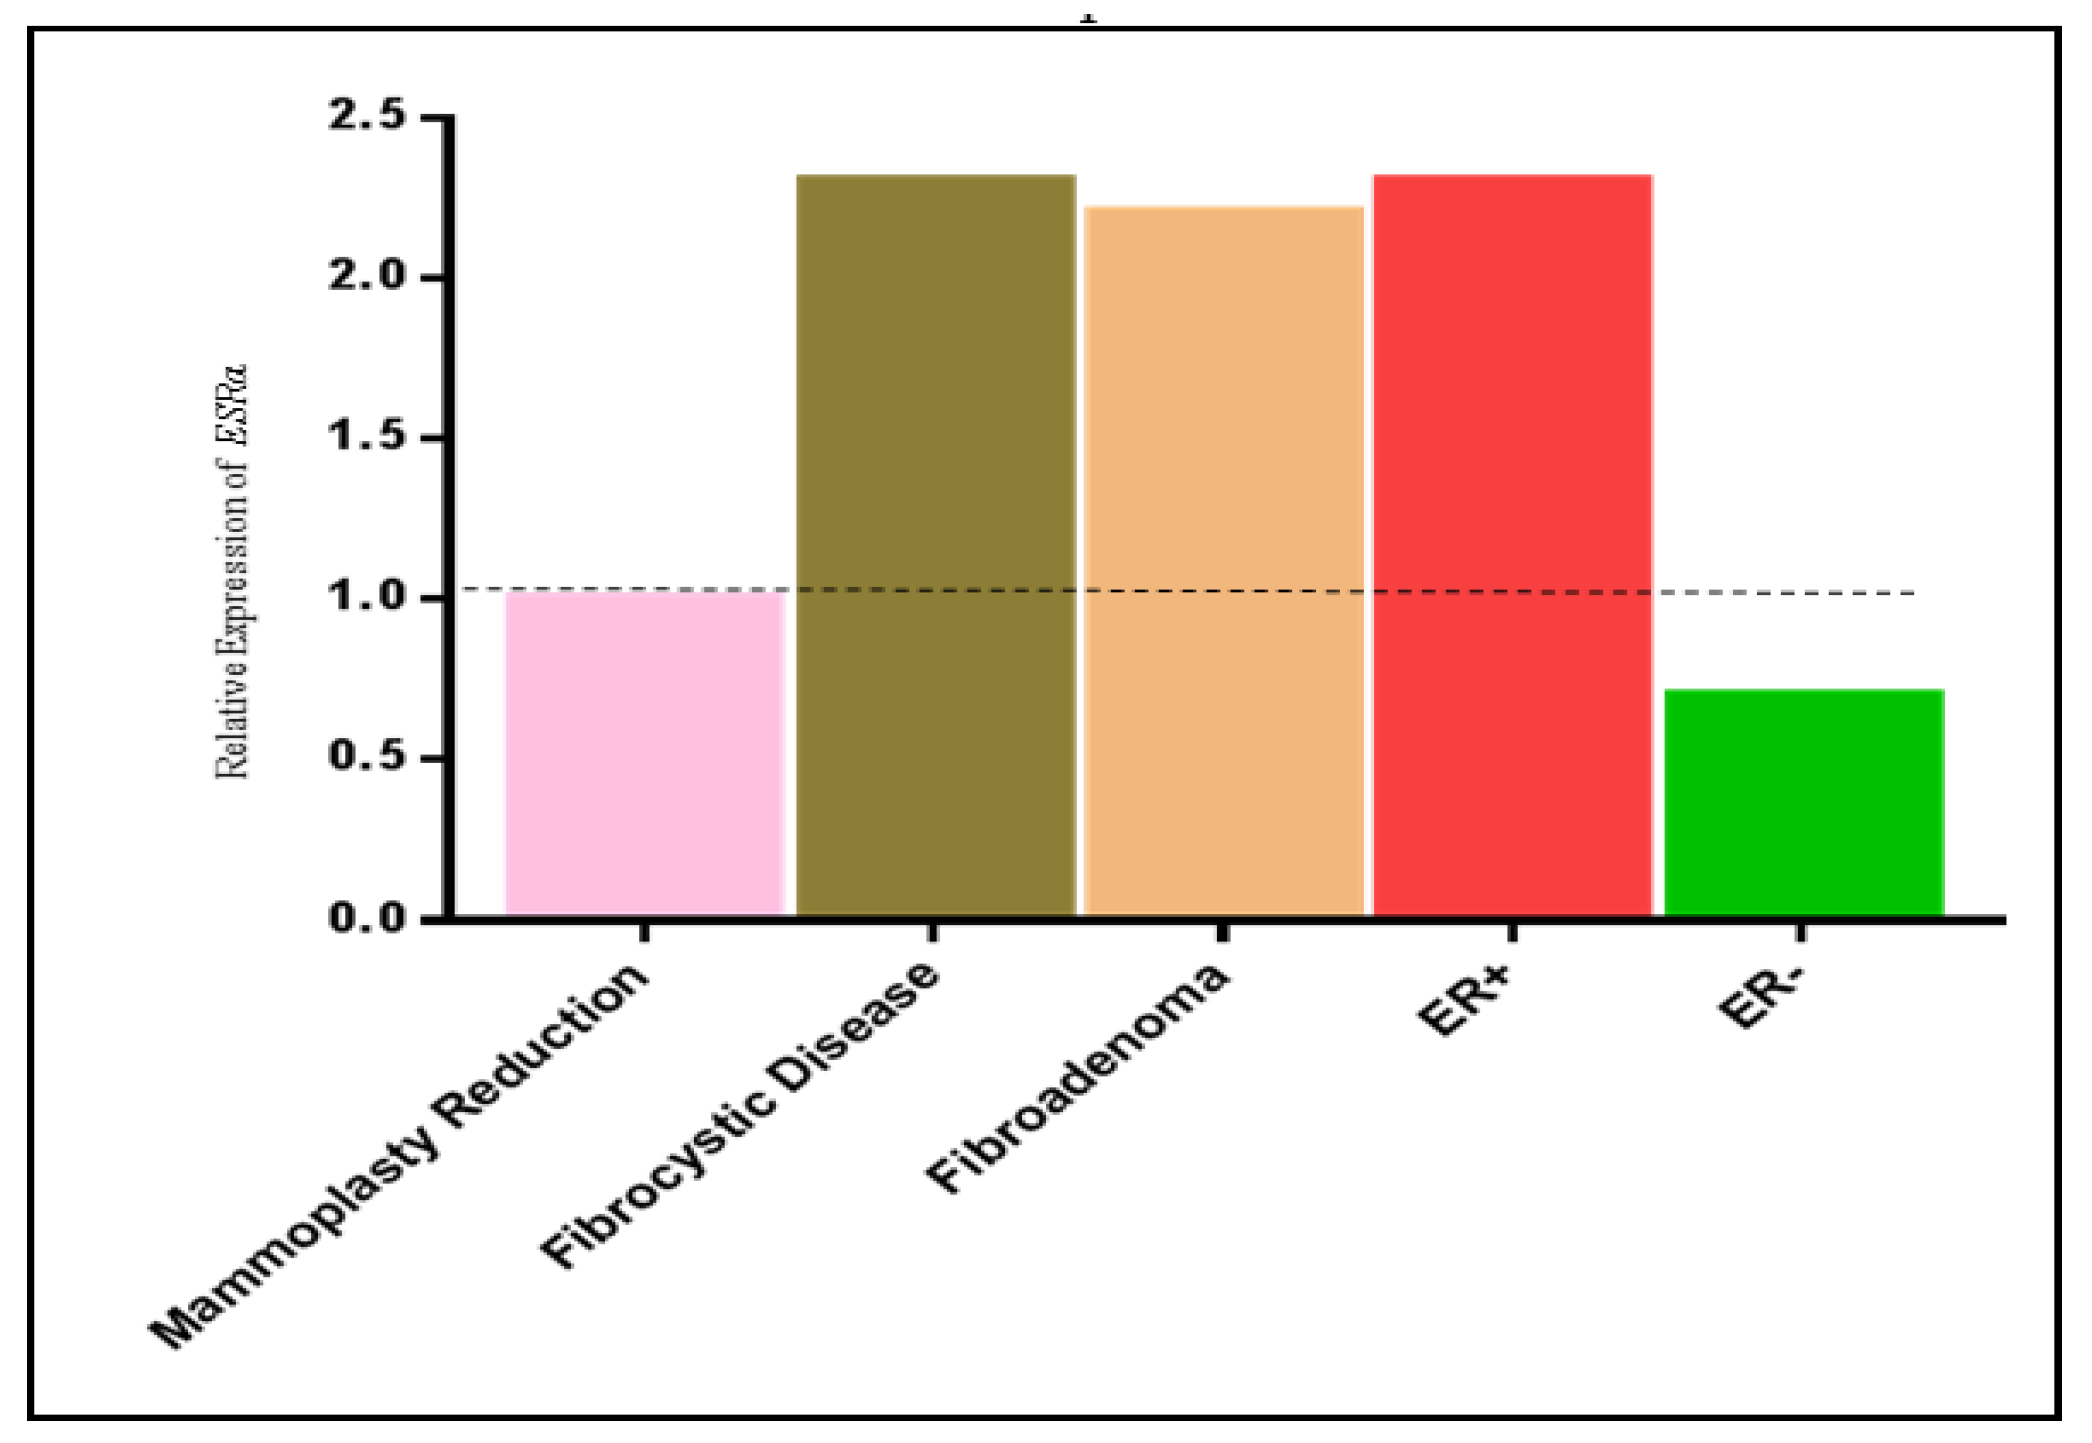
Figure 2.
Expression of ESRα in human breast tissues. RT-PCR expression of ESRα in breast tissues in relative to mammoplasty reduction (normal). Enhanced ESRα expression in benign breast tissues might cause an increase in ESRα expression and cell proliferation and important in early event in breast carcinogenesis.
Disclaimer/Publisher’s Note: The statements, opinions and data contained in all publications are solely those of the individual author(s) and contributor(s) and not of MDPI and/or the editor(s). MDPI and/or the editor(s) disclaim responsibility for any injury to people or property resulting from any ideas, methods, instructions or products referred to in the content. |
© 2024 by the authors. Licensee MDPI, Basel, Switzerland. This article is an open access article distributed under the terms and conditions of the Creative Commons Attribution (CC BY) license (http://creativecommons.org/licenses/by/4.0/).
Copyright: This open access article is published under a Creative Commons CC BY 4.0 license, which permit the free download, distribution, and reuse, provided that the author and preprint are cited in any reuse.


