Submitted:
06 July 2024
Posted:
09 July 2024
You are already at the latest version
Abstract
In this study the impact of climate change on drought conditions in Serbia is investigated trough the multifractal analysis of standardized precipitation evapotranspiration index (SPEI). The SPEI time series for accumulation time scale of 1, 3, 6 and 12 months were calculated using the high resolution meteorological gridded dataset E-OBS with a resolution of 0.10 in regular latitude/longitude coordinates and time span from 1961 to 2020. The multifractal analysis was performed for two standard climatic periods (1961−1990 and 1991−2020) using multifractal detrended fluctuation analysis method (MFDFA) which is suitable for nonstationary temporal series. In each of 1278 grid cells that cover Serbian territory we analyzed 4 SPEI time series for two 30 years periods (which totals 10224 MFDFA runs) and calculated multifractal spectrum parameters that describe persistence, degree of multifractality and the influence of small/large fluctuations. We found that all the analyzed SPEI series show multifractal properties with the dominance of small fluctuations. The short and medium drought conditions described by SPEI-1, SPEI-3 and SPEI-6 are persistent (the position of maximum of multifractal spectrum is in the range 0.5<α0<1), stronger persistence is found at higher accumulation time scales, while SPEI-12 time series are antipersistent (0<α0-1<0.5). The degree of multifractality (width of multifractal spectrum W) increases from SPEI-1 to SPEI-6 and decreases for SPEI-12. For all series multifractal spectrum is right skewed (skew parameter r>0) indicating that small SPEI temporal fluctuations contribute more to multifractality than large fluctuations. In the second period SPEI-1 SPEI-3 and SPEI-6 series become more persistent with weaker multifractality, indicating that short and medium drought conditions (which are related to soil moisture and crop stress) become easier to predict, while SPEI-12 changed toward random regime and stronger multifractality in eastern and central part of country, indicating that long term drought conditions (related to streamflow, reservoir levels, and groundwater levels) become more difficult for modeling and prediction.
Keywords:
MFDFA
; SPEI
; climate change
; sustainability
1. Introduction
Drought is a slow-onset natural phenomenon that can occur anywhere in the world as a prolonged dry period relative to local climate conditions. It can affect agriculture and energy production [1,2], ecosystem function [3,4] human livelihood and health [5,6]. Knowledge of drought variability on multiple temporal and spatial scales is crucial for drought monitoring and development of mitigation methods.
Various standardized indices were developed to quantify water deficit and surplus with respect to normal conditions, and can be used to evaluate the severity, duration, and spatial extent of drought [7]. Recently, Yildirim et al. [8] performed bibliometric analysis of publication data on drought and found that the most frequently used indices for meteorological drought are Standardized Precipitation Index – SPI [9] based only on precipitation data, Palmer Drought Severity Index – PDSI [10], and Standardized Precipitation Evapotranspiration index – SPEI [11] which are based on precipitation and temperature data.
The changes in drought conditions have been intensively studied for different regions of world, including the analysis of historical data [12,13,14,15] and future projections [16,17,18]. Ionita and Nagavciuc [14] analyzed trends in drought indices in Europe for the period of 120 years (1901-2019). They found that SPEI12 showed significant negative trend in the Central Europe (CEU) and the Mediterranean region (MED) indicating that these regions are becoming dryer due to an increase in the potential evapotranspiration and mean air temperature. North Europe (NEU) is becoming wetter (SPI12 showed significant positive trend), for MED and CEU drying trend based on SPEI was confirmed at various timescales, while the drought evaluated by the SPI (that considers only precipitation deficit) shows the opposite or no changes. Spinoni et al. [17] investigated changes in drought occurrence, frequency, and severity in Europe until 2100 by using regional climate model (RCM). They found that under the moderate emission scenario (which for the end of 21st century assumes CO2 equivalent of about 650 ppm and global temperature increase of approximately 1.8 °C) severity and frequency of droughts will increase in the Mediterranean area, western Europe, and Northern Scandinavia, while the most severe emission scenario (CO2 equivalent of about 1370 ppm and global temperature increase of approximately 4.0 °C) projects that whole European continent, with the exception of Iceland, will be affected by more frequent and severe extreme droughts, especially after 2070.
Serbia is a continental European country with southern and central part located in the Mediterranean region, and northern part in Central Europe. As other MED and CEU countries, over the last decades Serbia experienced increasing trend in drought frequency, severity and duration, causing a reduction in agricultural yield, especially in the northern province of Vojvodina, where more than half of arable land is used for maize, soybeans and sugar beets, and during the dry year the decrease of yield can reach more than 60% [19]. The concerns on evolution of drought conditions in Serbia resulted in increasing number of studies that analyze various aspects of this phenomenon on country level, such as spatial and temporal variability [20], drought regionalization [21] and trends [22]. In all these studies SPI was used to classify droughts categories. Recently Amiri and Gocic [23] compared the performance of five precipitation-based drought indices with SPI (as reference drought index) for drought analysis in Serbia on monthly, annual, and seasonal scale. Based on monthly precipitation data from 28 synoptic stations for the period 1946-2019, they found that rainfall anomaly index (RAI) has the most similar performance to the SPI index, while lowest similarity was found for China Z index (CZI) and modified China Z index (MCZI). Precipitation based indices such as SPI were extensively used to analyze drought spatial and temporal variability in different parts of the world [24,25,26,27]. However, the definition of SPI assumes that droughts are mainly controlled by the temporal variability in precipitation and do not consider other variables such as temperature, evapotranspiration, and soil water holding capacity, that can influence the development of drought conditions. Vicente-Serrano et al. [11] introduced standardized precipitation evapotranspiration index (SPEI) which is based on precipitation and temperature data, where temperature is used in calculation of potential evapotranspiration (PET). SPEI is simple for calculation and can be calculated for different timescales (same as SPI) but in addition it includes the effect of temperature and is considered more suitable for drought detection and monitoring, and for investigation of the consequences of global warming [28,29,30,31,32]. Bezdan et al. [33] developed SPEI based index for agricultural drought monitoring for different crops (AD-) in Vojvodina region in northern Serbia. The AD- is obtained by replacing potential evapotranspiration for potential crop evapotranspiration (based on local agro-climatic conditions) in SPEI calculation. They found that AD-SPEIcrop showed a higher degree of correlation with yields of the 11 significant crops in the region than original SPEI index and can successfully detect dry and wet periods like other drought indices (SPI, SPEI and PDSI).
As a complement to these classical approaches, in this work we investigated the complexity of dry/wet conditions in Serbia through the multifractal analysis of the Standardized precipitation evapotranspiration index (SPEI). Multifractality of climate phenomena is well known and has been identified for climate variables such as rainfall [34,35], temperature [36,37,38], wind [39,40], and humidity [41]. While multifractality of rainfall temporal series was extensively studied [34,35], much less is known about multifractal properties of rainfall-based drought indices. Recently Adarsh et al. [42] analyzed SPI time series at three aggregation timescales (3, 6, 12 months) from 30 meteorological subdivisions of India, for the period 1871-2016. By using multifractal detrended fluctuation analysis - MFDFA [43], they found that SPI time series exhibit multifractal properties that vary spatially throughout studied area, with stronger persistence and higher multifractality degree for larger time scales. Ogunho [44] applied MFDFA on SPI series (at 1, 6, 12, and 24-month temporal scale) for the period 1980-2010 over different locations across Nigeria. He found that all SPI series show multifractal properties that vary spatially but are unrelated to climatic delineation, and that the strength of multifractality (quantified by the width of the multifractal spectrum) increases with increasing temporal scale. Da Silva et al. [45] used MFDFA to analyze SPI (for 1, 3, 6, and 12-month accumulation periods) at 133 locations across the state of Pernambuco, Brazil, with climate varying from tropical humid in coastal area to semiarid in deep inland region. The results show that all SPI series display multifractal dynamics, with persistent long-term correlations, and multifractality that becomes stronger as accumulation time increases. For all temporal scales the SPI series display stronger persistence in the coastal region with tropical humid climate than in in dry semiarid inland region. For SPI-12, which describes long term dry/wet conditions, multifractality is strongest in the semiarid region. Recently Zhan et al. [46] investigated spatiotemporal characteristics of multiscale drought in the Yellow River Basin (YRB) by analyzing multifractal properties of SPEI (using MFDFA) at different timescales (1, 3, 6, and 12-month), derived for 80 meteorological stations from 1961 to 2017. They found that all SPEI series demonstrate multifractality with persistent long-term correlations and dominance of small fluctuations. With the increase of temporal scale drought persistence increases, being strongest in the mid-temperate semi-arid zone. The strength of multifractality measured by the width of multifractal spectrum also increased with the aggregation timescale.
In this work we investigate the complexity of temporal fluctuations of dry/wet conditions in Serbia by applying MFDFA method on multiscale SPEI (1, 3, 6 and 12-month), derived from the high-resolution gridded climate dataset. The time span is from 1961 to 2020 which permits to investigate the impact of climate change. We calculate multifractal parameters that describe following properties of SPEI temporal series: persistence (quantified by the position of the maximum of the multifractal spectrum), degree of multifractality (quantified by the spectrum width) and the contribution of small/large fluctuations (quantified by the spectrum asymmetry). By comparing the spatial distribution of these parameters over Serbia for two periods of 30 years (1961-1990 and 1991-2020) we investigate: i) the relation of multifractal parameters with accumulation timescale of SPEI; ii) the relation of multifractal parameters with terrain topology, and iii) the changes from first to second sub-period.
2. Materials and Methods
2.1. Study Area and Dataset
Serbia is a continental country in the southeast part of Europe on the Balkan peninsula. The geographical location of Serbia shown in Figure 1 is between latitudes 41°50′ and 46°10′ N which belongs to the temperate climate zone. The northern part of the country with flat and low elevation terrain is entirely located within Pannonian plane, the elevation increases towards central and southern part which are covered by hills and mountains intersected by river valleys. Its climate is shaped by the influence of Alps (Dinaric Mountain), Mediterranean Sea, Pannonian Plains, Morava River valley, Carpathian, Rhodope and Balkan Mountains. There are three climate types: moderate continental in the northern part, continental climate in the central part and modified Mediterranean climate in the southern and southwestern parts [47]. In the lowlands mean annual temperature is between 11 and 12 °C and mean annual precipitation is between 500 and 700 mm. In the mountains, the mean annual temperature is below 8 °C, while mean annual precipitation is above 1000 mm [48].
This study uses daily mean temperature and daily accumulated precipitation data from the E-OBS gridded dataset, version 27.0e with a horizontal resolution of 0.1 degrees (approximately 12 km x 12 km) in regular latitude/longitude coordinates during the period of 1950–2020 [49]. The dataset was created by interpolating the most comprehensive collection of station data available across Europe [50], including 31 stations with temperature observations, and 29 stations with precipitation observations from Serbia.
2.2. Standardized Precipitation Evapotranspiration Index
Standardized precipitation evapotranspiration index (SPEI) was introduced by Vincente Serrano et al. [11] as a multiscalar drought index that is based on precipitation (P) and potential evapotranspiration (PET). It is temperature sensitive and thus more suitable for drought studies, especially those related to observed climate change, future climate scenarios and global warming. The procedure for calculation of SPEI is described in [11]. It is based on the calculation of SPI (albeit with a different probability distribution), which uses monthly precipitation as an input variable. In SPEI input variable is the monthly difference between precipitation and PET
which quantifies water deficit or surplus (climate water balance) for month j. In this work PET is calculated using Thornthwaite method [51] which requires only monthly-mean temperature and geographical position of a certain point. The accumulated difference in a month j and year i on time scale k (k=3,6,12 month, etc.) is calculated as
The SPEI was obtained by standardizing D series utilizing the three-parameter Gamma distribution, with the use of the python library SPEI [52]. According to [11], in three-parameter distributions can assume negative values, which are common in series. We analyzed SPEI on accumulation time scales of 1 month (SPEI-1), 3 months (SPEI-3), 6 months (SPEI-6) and 12 months (SPEI-12), in order to access meteorological, agricultural and hydrological droughts. The drought classification based on SPEI which is the same as for SPI [9] is presented in Table 1.
2.3. Multifractal Detrended Fluctuation Analysis
Kantelhardt et al. [43] introduced the method Multifractal detrended fluctuation analysis (MFDFA) which was shown to produce reliable results for multifractal time series that require a hierarchy of scaling exponents for full description of long-term correlations [53]. Over the last two decades the MFDFA was widely used for data analysis in various fields, such as physiology [54], hydrology [55], geophysics [56], engineering [57], ecology [58] and finances [59].
The MFDFA algorithm is performed through the following steps [43]. It starts with the integration of original time series , to produce , where is the average of Next, the integrated series is divided into (here stands for the floor function) non-overlapping segments of length starting from , and another segments of size starting from , so that the last segment ends at and thus all values of the series are included in segments division. In each segment , where is the total number of segments, the local trend (linear or higher order polynomial least square fit) is estimated and subtracted from to calculate the detrended variance
The average over all segments is used to obtain the th order fluctuation function
where, can take on any real value except zero. For the special case q = 0 the fluctuation function is given by
Parameter serves as a “magnifying glass”, where positive values of emphasize large fluctuations, and negative values enhance small fluctuations.
This procedure is repeated for various box sizes, providing the relationship between fluctuation function and box size. If the long-term correlations are present, the fluctuation function increases with as a power law . The scaling exponent is obtained as the slope of linear regression of versus . It is called the generalized Hurst exponent (as for stationary time series is identical to the classical Hurst exponent . The exponents describe the scaling behavior of subsets of series with large fluctuations () and subsets with small fluctuations (). For multifractal series subsets with small and large fluctuations of the series scale differently and is a decreasing function of , while for monofractal time series, is constant. The series that generates larger range of values is considered to display a higher degree of multifractality.
Multifractality of time series can also be described by using the properties of multifractal spectrum which is obtained through the Legendre transform
where A monofractal process in this approach is represented by a single point in the plane, while a multifractal process generates a single humped function [43].
Multifractal spectrum contains the information about complexity of the underlying stochastic process, described by the following complexity parameters: the position of maximum , the width of the spectrum , and the skew parameter where for symmetric shapes, for right-skewed shapes, and for left-skewed shapes) [60,61,62]. If the underlying process is overall persistent (larger value of indicates stronger persistency), and if the process is overall antipersistent (smaller value of indicates stronger antipersistency). The width of the spectrum measures the degree of multifractality of the process (the larger value indicates the wider the range of the fractal exponents, and stronger multifractality). The skew parameter indicates which fractal exponents are dominant: if spectrum is right-skewed the process is characterized by “fine structure” (large scaling exponents describing small fluctuations), and if the spectrum is left-skewed the process is dominated by the scaling of large fluctuations (small scaling exponents). The signals that generate multifractal spectrum with a wide range of fractal exponents (higher degree of multifractality), and a right-skewed shape () may be considered more complex than those with opposite characteristics.
3. Results and Discussion
We applied MFDFA method on SPEI-1, SPEI-3, SPEI-6 and SPEI-12 temporal series for all the 1278 grid cells for the two periods (1961-1990 and 1991-2020), which totals 10224 MFDFA runs. The multifractal spectra for SPEI-1 for the two periods, for a sample grid point at latitude 43.15 and longitude 22.45, corresponding to the city of Pirot, are shown in Figure 2 together with the position of this grid point on the map of Serbia. The multifractal parameters , and are then extracted from these spectra, for all the grid points, and all the accumulation periods.
The spatial distribution of multifractal parameters over the Serbian territory for four SPEI accumulation time scales and for two analyzed periods, interpolated across the map of Serbia, is shown in Figure 3, Figure 4 and Figure 5, where we observed the following patterns. The values of (position of maximum of spectrum) shown in Figure 3 indicate that: i) SPEI-1, SPEI-3 and SPEI-6 series are persistent (, persistence becomes stronger as accumulation period increases), while SPEI-12 showed indicating that increments of SPEI-12 are anti-persistent (; ii) in the first period SPEI-1, SPEI-3 and SPEI-6 series are more persistent in northern lowland part of the country indicated by higher values, while SPEI-12 series are more anti-persistent in central and southern part with mountainous terrain, indicated by lower values; iii) in the second period the values of increased for all accumulation time scales, indicating that short term and medium term dry/wet conditions described by SPEI-1, SPEI-3 and SPEI-6, which are related to short and medium term soil moisture, become more persistent, which is relevant for agricultural planning, while SPEI-12 series which are related to streamflow, reservoir levels, and groundwater levels become less anti-persistent (approaching random regime).
As seen in Figure 4 the width of multifractal spectrum also varies spatially: i) for SPEI-1, SPEI-3 and SPEI-6 the width of the spectrum increases (indicating stronger multifractality) with accumulation time, and becomes smaller for SPEI-12 in the first period; ii) in the first period the clear north to south positive gradient in is observed for SPEI-1 and SPEI-3 indicating stronger multifractality in short and medium dry/wet conditions in mountainous regions; for SPEI-6 stronger multifractality is observed in southwestern Dinaric Mountain region, in eastern Carpathian Mountains, and for SPEI-12 in border southern region that encompass Rhodope Mountains, Balkan Mountains and southern part of Dinaric Mountains; iii) in the second period the width of the spectrum decreased for SPEI-1, SPEI-3 and SPEI-6 indicating that multifractality of the short-term and medium-term dry/wet conditions become weaker; for SPEI-12 multifractality becomes stronger ( increased) in northeast and central regions and weaker ( decreased) for northwest and southern region. For all SPEI series (all accumulation time scales and both sub-periods) the skew parameter indicating that small fluctuations are dominant in multifractality of the process leading to right-skewed spectrum. The spatial distribution of skewness parameter shown in Figure 5 reveals similar pattern for all accumulation time scales for the first sub-period: lower values in northern and southern than in central region of Serbia, indicating that in central part the dominance of small fluctuation is stronger. In the second period the value of increased in northern and southern part and decreased in central part for SPEI-1, SPEI-3, SPEI-6 while for SPEI-12 the increase of is observed in southern and south-western part while in other regions the value of decreased.
For northern part which is principal agricultural region the width of the spectrum decreased while the skewness parameter increased in the second period for SPEI-1, SPEI-3 and SPEI-6 indicating that the short-term and medium-term dry/wet conditions that are related to soil moisture evolved toward weaker multifractality with the increase of the right side of the spectrum (stronger influence of small fluctuations), thus the decrease of the spectrum width is the result of the decrease of the left side of the spectrum and loss of the influence of large fluctuations. This indicates that agricultural dry/wet conditions become more stable and more persistent (parameter increased) which can affect agricultural yield. SPEI-12, which is tied to streamflow, reservoirs, and groundwater level response to longer-term precipitation anomalies, presents changes in the second period towards larger width of multifractal spectrum and lower skewness parameter in eastern and central regions, indicating that the width of multifractal spectrum in these regions increased because of the stronger influence of large fluctuations. In the southern region the width of multifractal spectrum became smaller and skewness parameter became larger, indicating that the influence of small fluctuations increased. These results are relevant for the electricity production as most of Serbian hydroelectric plants and accumulation lakes are located in eastern, central, and southern part of country. These results are summarized in Table 2 which presents descriptive statistics for multifractal parameters for two considered periods. The mean values calculated from all the grid cells show clear patterns for SPEI-1, SPEI-3 and SPEI-6: i) the values of are greater than 0.5, increase with time scale, and become greater in the second period; ii) the width of the spectrum W also increases with the time scale and become smaller in the second period; iii) the skew parameter decreases with the time scale and increases in the second period. For SPEI-12, and increases in the second period, W also increases in the second period while and decreases in the second period. These results indicate that considering the entire Serbian territory, in the second period short term and medium-term dry/wet conditions evolve towards the regime with stronger persistence, weaker multifractality and stronger influence of small fluctuations, while long term dry/wet conditions shift towards more random regime, stronger multifractality and reduced dominance of small fluctuations.
Considering that for all analyzed series the spectrum is right skewed, the complexity of SPEI series in two sub-periods can be addressed by comparing the degree of multifractality (spectrum width ). For SPEI-1, SPEI-3 and SPEI-6 the width of the spectrum decreased in the second sub-period in most of the country, indicating the decrease of complexity in temporal dynamics of short and medium dry/wet conditions. The complexity of SPEI-12 series increased ( increased) in the northern and decreased ( decreased) in the southern part of Sebia. The joint information of changes in and indicates that SPEI-1, SPEI-3 and SPEI-6 time series become more persistent and less complex in the second sub-period and thus easier for development of predictive models. SPEI-12 series become less anti-persistent (approaching the random regime) and more complex in northern part of the country, indicating that long term dry/wet conditions become more difficult for modeling and prediction. Recently we investigated the changes in multifractality of air temperature across Serbia for the same sub-periods and using the same gridded dataset [63], and we found that in the second sub-period the persistence of temperature series increased across the whole country, the width of the spectrum increased in the northern and decreased in the central and southern parts of country, and that in both periods the multifractality is dominated by small fluctuations (right skewed spectrum), indicating the increase of complexity in the northern part of the country. The SPEI time series also showed increase in persistence in the second period for short term and medium-term dry/wet conditions (SPEI-1, SPEI-3 and SPEI-6), while long term dry/wet conditions described by SPEI-12 showed similar changes in the degree of multifractality as temperature series: an increase in the multifractality degree (increase of ) in the northern part, and decrease in multifractality degree (decrease of ) in the southern part of country. Ionita and Nagavciuc [16] found that negative trends in drought (based on SPEI-12) in the Central Europe (CEU) and the Mediterranean region (MED) where Serbia is located are due to an increase in the potential evapotranspiration and mean air temperature. Our results support these findings in the sense that changes in multifractal properties from the first to the second sub-period of SPEI temporal series coincide with changes of multifractal properties of temperature series as reported in [63]. The multifractal properties of drought indices were investigated only recently. All results obtained for SPI [42,44,45] and SPEI [46] are qualitatively in agreement with what was observed for Serbia. Temporal series of drought indices show multifractal properties with persistent long-term correlations and the dominance of small fluctuation. As accumulation temporal scale increases, the drought indices become more persistent and display stronger multifractality.
Adarsh et al. [42] used MFDFA to analyze SPI time series (at 3-,6-, and 12-months aggregation timescales) from 30 meteorological subdivisions of India, for the period 1871-2016. They found that SPI time series exhibit multifractal properties that vary spatially throughout the studied area, with stronger persistence and higher multifractality degree for larger time scales, which agrees with our results. By comparing two periods separated by the Pacific climatic shift in 1976/1977, they found that in the second period SPI series become more persistent with stronger multifractality for about 70% of subdivision for SPI-3 and SPI-6 and 80% of subdivision for SPI-12. Our results also indicated that multifractal properties of wet/dry conditions could be affected by climate change. In the recent climate period (1991-2020) short- and medium-term conditions (SPEI-, SPEI -3 and SPEI -6) become more persistent and with stronger multifractality, while long- term conditions (SPEI-12) become more random and with weaker multifractality. Climate change affects both rainfall and temperature which are included in SPEI definition, while SPI includes only monthly rainfall. Thus, the comparison of our results with other studies will be clearer when new studies addressing SPEI index changes with similar climate sub periods are published.
4. Conclusions
In this work we investigated the changes in multifractal properties of time series of Standardized precipitation evapotranspiration index (SPEI) in Serbia between two standard climate periods (1961-1990 and 1991-2020). The SPEI is calculated for 1, 3, 6, and 12-month accumulation time scales in order to assess agricultural and hydrological dry/wet conditions. By applying the method Multifractal detrended fluctuation analysis (MFDFA) we compared multifractal spectrum parameters for different accumulation time scales among the two considered periods. These parameters describe specific properties of SPEI time series: long term correlations (position of the spectrum maximum ), degree of multifractality (the spectrum width W) and the contribution of small and large fluctuations (the spectrum asymmetry ). We found that, for both periods and for all accumulation time scales SPEI series display multifractal properties with dominance of small fluctuations. Short and medium dry/wet conditions (SPEI-1, SPEI-3 and SPEI-6) showed persistent correlations that become stronger with increase of accumulation time scale, while long term dry/wet conditions (SPEI-12) are antipersistent. In the second period, in the northern agricultural region the multifractal properties of SPEI-1, SPEI-3 and SPEI-6 changed towards stronger persistency, weaker multifractality and stronger influence of small fluctuations, indicating that these series that describe short- and medium-term soil moisture become less complex and easier for development of predictive models, which is relevant for agricultural planning and production. SPEI-12 series on the other hand become less antipersistent (demonstrating an approach towards random regime) in the second period, and more complex (displaying stronger multifractality) in the eastern and central regions, indicating that these series that describe long term dry/wet conditions (related to streamflow, reservoir levels, and groundwater levels) become more difficult for modeling and prediction. These changes are relevant for the electricity production as most of Serbian hydroelectric plants and accumulation lakes are located in the eastern and central parts of country. The results of this study should be taken into account for agricultural planning, better planning of use of water resources for renewable energy, and to develop more efficient measures for the protection and mitigation of the impact from water related natural hazards (drought and floods).
Author Contributions
Conceptualization, T.S. and B.S.; methodology, T.S. and B.S.; software, B.S.; validation, T.S., B.S., I.T. and V.Dj.; formal analysis, B.S., I.L., M.T. and L.F.; investigation, T.S., I.T., V.Dj. and B.S.; data curation, B.S., I.L., M.T. and L.F.; writing—original draft preparation, T.S., I.T., M.T., I.L., L.F., V.Dj. and B.S.; writing—review and editing, T.S., I.T., V.Dj. and B.S.; visualization, B.S.; supervision, B.S.; project administration, B.S. and I.T. All authors have read and agreed to the published version of the manuscript.
Funding
This research received no external funding.
Institutional Review Board Statement
Not applicable.
Informed Consent Statement
Not applicable.
Data Availability Statement
The original data presented in the study are openly available in E-OBS dataset repository from the EU-FP6 project UERRA (https://www.uerra.eu), and ECA&D project (https://www.ecad.eu).
Acknowledgments
T.S and B.S acknowledge support of Brazilian agency CNPq (grants No 308782/2022-4 and 309499/2022-4). B.S. acknowledges support of Brazilian agency CAPES through grant No 88887.937789/2024-00. I.T., I.L., M.T., L.F. and V.Dj. acknowledge support of the Ministry of Education, Science and Technological Development of the Republic of Serbia, grant No. 451-03-47/2023-01/200162. We acknowledge the E-OBS dataset from the EU-FP6 project UERRA (https://www.uerra.eu) and the Copernicus Climate Change Service, and the data providers in the ECA&D project (https://www.ecad.eu).
Conflicts of Interest
The authors declare no conflicts of interest.
References
- Meza, I.; Siebert, S.; Döll, P.; Kusche, J.; Herbert, C.; Eyshi Rezaei, E.; ...; Hagenlocher, M. Global-scale drought risk assessment for agricultural systems. Natural Hazards and Earth System Sciences 2020, 20(2), 695-712. [CrossRef]
- Scanlon, B.R.; Duncan, I.; Reedy, R.C. Drought and the water–energy nexus in Texas. Environmental Research Letters 2013, 8(4), 045033. [CrossRef]
- Sun, S.; Sun, G.; Caldwell, P.; McNulty, S.; Cohen, E.; Xiao, J.; Zhang, Y. Drought impacts on ecosystem functions of the US National Forests and Grasslands: Part II assessment results and management implications. Forest Ecology and Management 2015, 353, 269-279. [CrossRef]
- Lozano, Y.M.; Aguilar-Trigueros, C.A.; Onandia, G.; Maaß, S.; Zhao, T.; Rillig, M.C. Effects of microplastics and drought on soil ecosystem functions and multifunctionality. Journal of Applied Ecology 2021, 58(5), 988-996. [CrossRef]
- Keshavarz, M.; Maleksaeidi, H.; Karami, E. Livelihood vulnerability to drought: A case of rural Iran. International Journal of Disaster Risk Reduction 2017, 21, 223-230. [CrossRef]
- Stanke, C.; Kerac, M.; Prudhomme, C.; Medlock, J.; Murray, V. Health effects of drought: a systematic review of the evidence. PLoS currents 2013, 5. [CrossRef]
- Mishra, A.K.; Singh, V.P. A review of drought concepts. Journal of Hydrology 2010, 391(1-2), 202-216. [CrossRef]
- Yildirim, G.; Rahman, A.; Singh, V.P. A Bibliometric analysis of drought indices, risk, and forecast as components of drought early warning systems. Water 2022, 14(2), 253. [CrossRef]
- McKee, T.B.; Doesken, N.J.; Kleist, J. The relationship of drought frequency and duration to time scales. In Proceedings of the 8th Conference on Applied Climatology, Vol. 17, No. 22, 179-183, 1993.
- Palmer, W.C. Keeping Track of Crop Moisture Conditions, Nationwide: The New Crop Moisture Index. Weatherwise 1968, 21, 156-161. [CrossRef]
- Vicente-Serrano, S.M.; Beguería, S.; López-Moreno, J.I. A multiscalar drought index sensitive to global warming: the standardized precipitation evapotranspiration index. Journal of Climate 2010, 23(7), 1696-1718. [CrossRef]
- Spinoni, J.; Naumann, G.; Carrao, H.; Barbosa, P.; Vogt, J. World drought frequency, duration, and severity for 1951–2010. International Journal of Climatology 2014, 34(8), 2792-2804. [CrossRef]
- Yao, N.; Li, Y.; Lei, T.; Peng, L. Drought evolution, severity and trends in mainland China over 1961–2013. Science of the Total Environment 2018, 616, 73-89. [CrossRef]
- Ionita, M.; Nagavciuc, V. Changes in drought features at the European level over the last 120 years. Natural Hazards and Earth System Sciences 2021, 21(5), 1685-1701. [CrossRef]
- Nooni, I.K.; Hagan, D.F.T.; Wang, G.; Ullah, W.; Li, S.; Lu, J.; ... Zhu, C. Spatiotemporal characteristics and trend analysis of two evapotranspiration-based drought products and their mechanisms in sub-Saharan Africa. Remote Sensing 2021, 13(3), 533. [CrossRef]
- Vicente-Serrano, S.M.; Peña-Angulo, D.; Beguería, S.; Domínguez-Castro, F.; Tomás-Burguera, M.; Noguera, I.; ...; El Kenawy, A. Global drought trends and future projections. Philosophical Transactions of the Royal Society A 2022, 380(2238), 20210285. [CrossRef]
- Spinoni, J.; Vogt, J.V.; Naumann, G.; Barbosa, P.; Dosio, A. Will drought events become more frequent and severe in Europe? International Journal of Climatology 2018, 38(4), 1718-1736. [CrossRef]
- Khan, M.I.; Liu, D.; Fu, Q.; Saddique, Q.; Faiz, M.A.; Li, T.; ...; Cheng, C. Projected changes of future extreme drought events under numerous drought indices in the Heilongjiang Province of China. Water Resources Management 2017, 31, 3921-3937. [CrossRef]
- Stricevic, R.; Djurovic, N.; Djurovic, Z. Drought classification in Northern Serbia based on SPI and statistical pattern recognition. Meteorological Applications 2011, 18(1), 60-69. [CrossRef]
- Tošić, I; Unkašević, M. Analysis of wet and dry periods in Serbia. International Journal of Climatology 2014, 34(5), 1357-1368. [CrossRef]
- Gocic, M.; Trajkovic, S. Spatiotemporal characteristics of drought in Serbia. Journal of Hydrology 2014, 510, 110-123. [CrossRef]
- Gocic, M.; Trajkovic, S. Analysis of precipitation and drought data in Serbia over the period 1980–2010. Journal of Hydrology 2013, 494, 32-42. [CrossRef]
- Amiri, M.A.; Gocic, M. Analysis of temporal and spatial variations of drought over Serbia by investigating the applicability of precipitation-based drought indices. Theoretical and Applied Climatology 2023, 1-14. [CrossRef]
- Caloiero, T.; Veltri, S.; Caloiero, P.; Frustaci, F. Drought analysis in Europe and in the Mediterranean basin using the standardized precipitation index. Water 2018, 10(8), 1043. [CrossRef]
- Yan, Z.; Zhang, Y.; Zhou, Z.; Han, N. The spatio-temporal variability of droughts using the standardized precipitation index in Yunnan, China. Natural Hazards 2017, 88, 1023-1042. [CrossRef]
- Santos, C.A.G.; Brasil Neto, R.M.; Passos, J.S.D.A.; da Silva, R.M. Drought assessment using a TRMM-derived standardized precipitation index for the upper São Francisco River basin, Brazil. Environmental Monitoring and Assessment 2017, 189, 1-19. [CrossRef]
- Kalisa, W.; Zhang, J.; Igbawua, T.; Ujoh, F.; Ebohon, O.J.; Namugize, J.N.; Yao, F. Spatio-temporal analysis of drought and return periods over the East African region using Standardized Precipitation Index from 1920 to 2016. Agricultural Water Management 2020, 237, 106195. [CrossRef]
- Gao, X.; Zhao, Q.; Zhao, X.; Wu, P.; Pan, W.; Gao, X.; Sun, M. Temporal and spatial evolution of the standardized precipitation evapotranspiration index (SPEI) in the Loess Plateau under climate change from 2001 to 2050. Science of the Total Environment 2017, 595, 191-200. [CrossRef]
- Das, P.K.; Dutta, D.; Sharma, J.R.; Dadhwal, V.K. Trends and behaviour of meteorological drought (1901–2008) over Indian region using standardized precipitation–evapotranspiration index. International Journal of Climatology 2016, 36(2), 909-916. [CrossRef]
- Hari, V.; Rakovec, O.; Markonis, Y.; Hanel, M.; Kumar, R. Increased future occurrences of the exceptional 2018–2019 Central European drought under global warming. Scientific Reports 2020, 10(1), 12207. [CrossRef]
- Meza, F.J. Recent trends and ENSO influence on droughts in Northern Chile: An application of the Standardized Precipitation Evapotranspiration Index. Weather and Climate Extremes 2013, 1, 51-58. [CrossRef]
- Manatsa, D.; Mushore, T.; Lenouo, A. Improved predictability of droughts over southern Africa using the standardized precipitation evapotranspiration index and ENSO. Theoretical and Applied Climatology 2017, 127, 259-274. [CrossRef]
- Bezdan, J.; Bezdan, A.; Blagojević, B.; Mesaroš, M.; Pejić, B.; Vranešević, M.; ...; Nikolić-Đorić, E.). SPEI-based approach to agricultural drought monitoring in Vojvodina region. Water 2019, 11(7), 1481. [CrossRef]
- Kantelhardt, J.W.; Koscielny-Bunde, E.; Rybski, D.; Braun, P.; Bunde, A.; Havlin, S. Long-term persistence and multifractality of precipitation and river runoff records. Journal of Geophysical Research: Atmospheres 2006, 111(D1), . [CrossRef]
- Lana, X.; Rodríguez-Solà, R.; Martínez, M.D.; Casas-Castillo, M.C.; Serra, C.; Kirchner, R. Multifractal structure of the monthly rainfall regime in Catalonia (NE Spain): Evaluation of the non-linear structural complexity. Chaos: An Interdisciplinary Journal of Nonlinear Science 2020, 30(7). [CrossRef]
- Kalamaras, N.; Tzanis, C.G.; Deligiorgi, D.; Philippopoulos, K.; Koutsogiannis, I. Distribution of air temperature multifractal characteristics over Greece. Atmosphere 2019, 10(2), 45. [CrossRef]
- Gomez-Gomez, J.; Carmona-Cabezas, R.; Ariza-Villaverde, A.B.; de Ravé, E.G.; Jiménez-Hornero, F.J. Multifractal detrended fluctuation analysis of temperature in Spain (1960–2019). Physica A: Statistical Mechanics and its Applications 2021, 578, 126118. [CrossRef]
- da Silva, H.S.; Silva, J.R.S.; Stosic, T. Multifractal analysis of air temperature in Brazil. Physica A: Statistical Mechanics and its Applications 2020, 549, 124333. [CrossRef]
- Schmitt, F.; Schertzer, D.; Lovejoy, S.; Brunet, Y. Estimation of universal multifractal indices for atmospheric turbulent velocity fields. Fractals in Natural Sciences 1994, 1, 274-281. [CrossRef]
- Laib, M.; Golay, J.; Telesca, L.; Kanevski, M. Multifractal analysis of the time series of daily means of wind speed in complex regions. Chaos, Solitons & Fractals 2018, 109, 118-127. [CrossRef]
- Li-Hao, G.; Zun-Tao, F. Multi-fractal behaviors of relative humidity over China. Atmospheric and Oceanic Science Letters 2013, 6(2), 74-78. [CrossRef]
- Adarsh, S.; Kumar, D.N.; Deepthi, B.; Gayathri, G.; Aswathy, S.S.; Bhagyasree, S. Multifractal characterization of meteorological drought in India using detrended fluctuation analysis. International Journal of Climatology 2019, 39(11), 4234-4255. [CrossRef]
- Kantelhardt, J.W.; Zschiegner, S.A.; Koscielny-Bunde, E.; Havlin, S.; Bunde, A.; Stanley, H.E. Multifractal detrended fluctuation analysis of nonstationary time series. Physica A: Statistical Mechanics and its Applications 2002, 316(1-4), 87-114. [CrossRef]
- Ogunjo, S.T. Multifractal properties of meteorological drought at different time scales in a tropical location. Fluctuation and Noise Letters 2021, 20(01), 2150007. [CrossRef]
- da Silva, A.S.A.; Stosic, T.; Arsenić, I.; Menezes, R.S.C.; Stosic, B. Multifractal analysis of standardized precipitation index in Northeast Brazil. Chaos, Solitons & Fractals 2023, 172, 113600. [CrossRef]
- Zhan, C.; Liang, C.; Zhao, L.; Jiang, S.; Niu, K.; Zhang, Y. Multifractal characteristics of multiscale drought in the Yellow River Basin, China. Physica A: Statistical Mechanics and its Applications 2023, 609, 128305. [CrossRef]
- Bajat, B.; Blagojević, D.; Kilibarda, M.; Luković, J.; Tošić, I. Spatial analysis of the temperature trends in Serbia during the period 1961–2010. Theoretical and Applied Climatology 2015, 121, 289-301. [CrossRef]
- Vujadinović Mandić, M.; Vuković Vimić, A.; Ranković-Vasić, Z.; Đurović, D.; Ćosić, M.; Sotonica, D.; ...; Đurđević, V. Observed Changes in Climate Conditions and Weather-Related Risks in Fruit and Grape Production in Serbia. Atmosphere 2022, 13(6), 948. [CrossRef]
- Cornes, R.C.; van der Schrier, G.; van den Besselaar, E.J.; Jones, P.D. An Ensemble Version of the E-OBS Temperature and Precipitation Datasets. Journal of Geophysical Research: Atmospheres 2018, 123, 9391–9409. [CrossRef]
- Klok, L.; Klein Tank, A.M.G. Updated and extended European dataset of daily climate observations. International Journal of Climatology 2008, 29, 1182–1191. [CrossRef]
- Thornthwaite, C.W. An approach toward a rational classification of climate. Geographical Review 1948, 38(1), 55-94. [CrossRef]
- Adams J. Climate_indices, an open source Python library providing reference implementations of commonly used climate indices. https://github.com/monocongo/climate_indices, 2017.
- Oswiecimka, P.; Kwapien, J.; Drozd, S. Wavelet versus detrended fluctuation analysis of multifractal structures. Physical Review E 2006, 74, 016103. [CrossRef]
- Matic, V.; Cherian, P.J.; Koolen, N.; Ansari, A.H.; Naulaers, G.; Govaert, P.; ...; Vanhatalo, S. Objective differentiation of neonatal EEG background grades using detrended fluctuation analysis. Frontiers in Human Neuroscience 2015, 9, 189. [CrossRef]
- Tan, X.; Gan, T.Y. Multifractality of Canadian precipitation and streamflow. International Journal of Climatology 2017, 37, 1221-1236. [CrossRef]
- Telesca, L.; Lovallo, M.; Mammadov, S.; Kadirov, F.; Babayev, G. Power spectrum analysis and multifractal detrended fluctuation analysis of Earth’s gravity time series. Physica A: Statistical Mechanics and its Applications 2015, 428, 426-434.
- Feng, J.; Men, Y.; Zhu, G.; Li, Y.; Luo, X. Cavitation detection in a Kaplan turbine based on multifractal detrended fluctuation analysis of vibration signals. Ocean Engineering 2022, 263, 112232. [CrossRef]
- Ba, R.; Lovallo, M.; Song, W.; Zhang, H.; Telesca, L. Multifractal Analysis of MODIS Aqua and Terra Satellite Time Series of Normalized Difference Vegetation Index and Enhanced Vegetation Index of Sites Affected by Wildfires. Entropy 2022, 24(12), 1748. [CrossRef]
- Tiwari, A.K.; Aye, G.C.; Gupta, R. Stock market efficiency analysis using long spans of data: A multifractal detrended fluctuation approach. Finance Research Letters 2019, 28, 398-411. [CrossRef]
- Shimizu, Y.U.; Thurner, S.; Ehrenberger, K. Multifractal spectra as a measure of complexity in human posture. Fractals 2002, 10(01), 103-116. [CrossRef]
- Drożdż, S.; Oświȩcimka, P. Detecting and interpreting distortions in hierarchical organization of complex time series. Physical Review E 2015, 91(3), 030902. [CrossRef]
- Stosic, T.; Nejad, S.A.; Stosic, B. Multifractal analysis of Brazilian agricultural market. Fractals 2020, 28(05), 2050076. [CrossRef]
- Stosic, T.; Stosic, B.; Tošić, M.; Lazić, I.; Djurdjević, V.; Tošić, I. Climate change effects through MFDFA study of temperature in Serbia. Atmosphere 2023, 14(10), 1532. [CrossRef]
Figure 1.
Position of Serbia in Europe and map of Serbia with orography and major rivers.
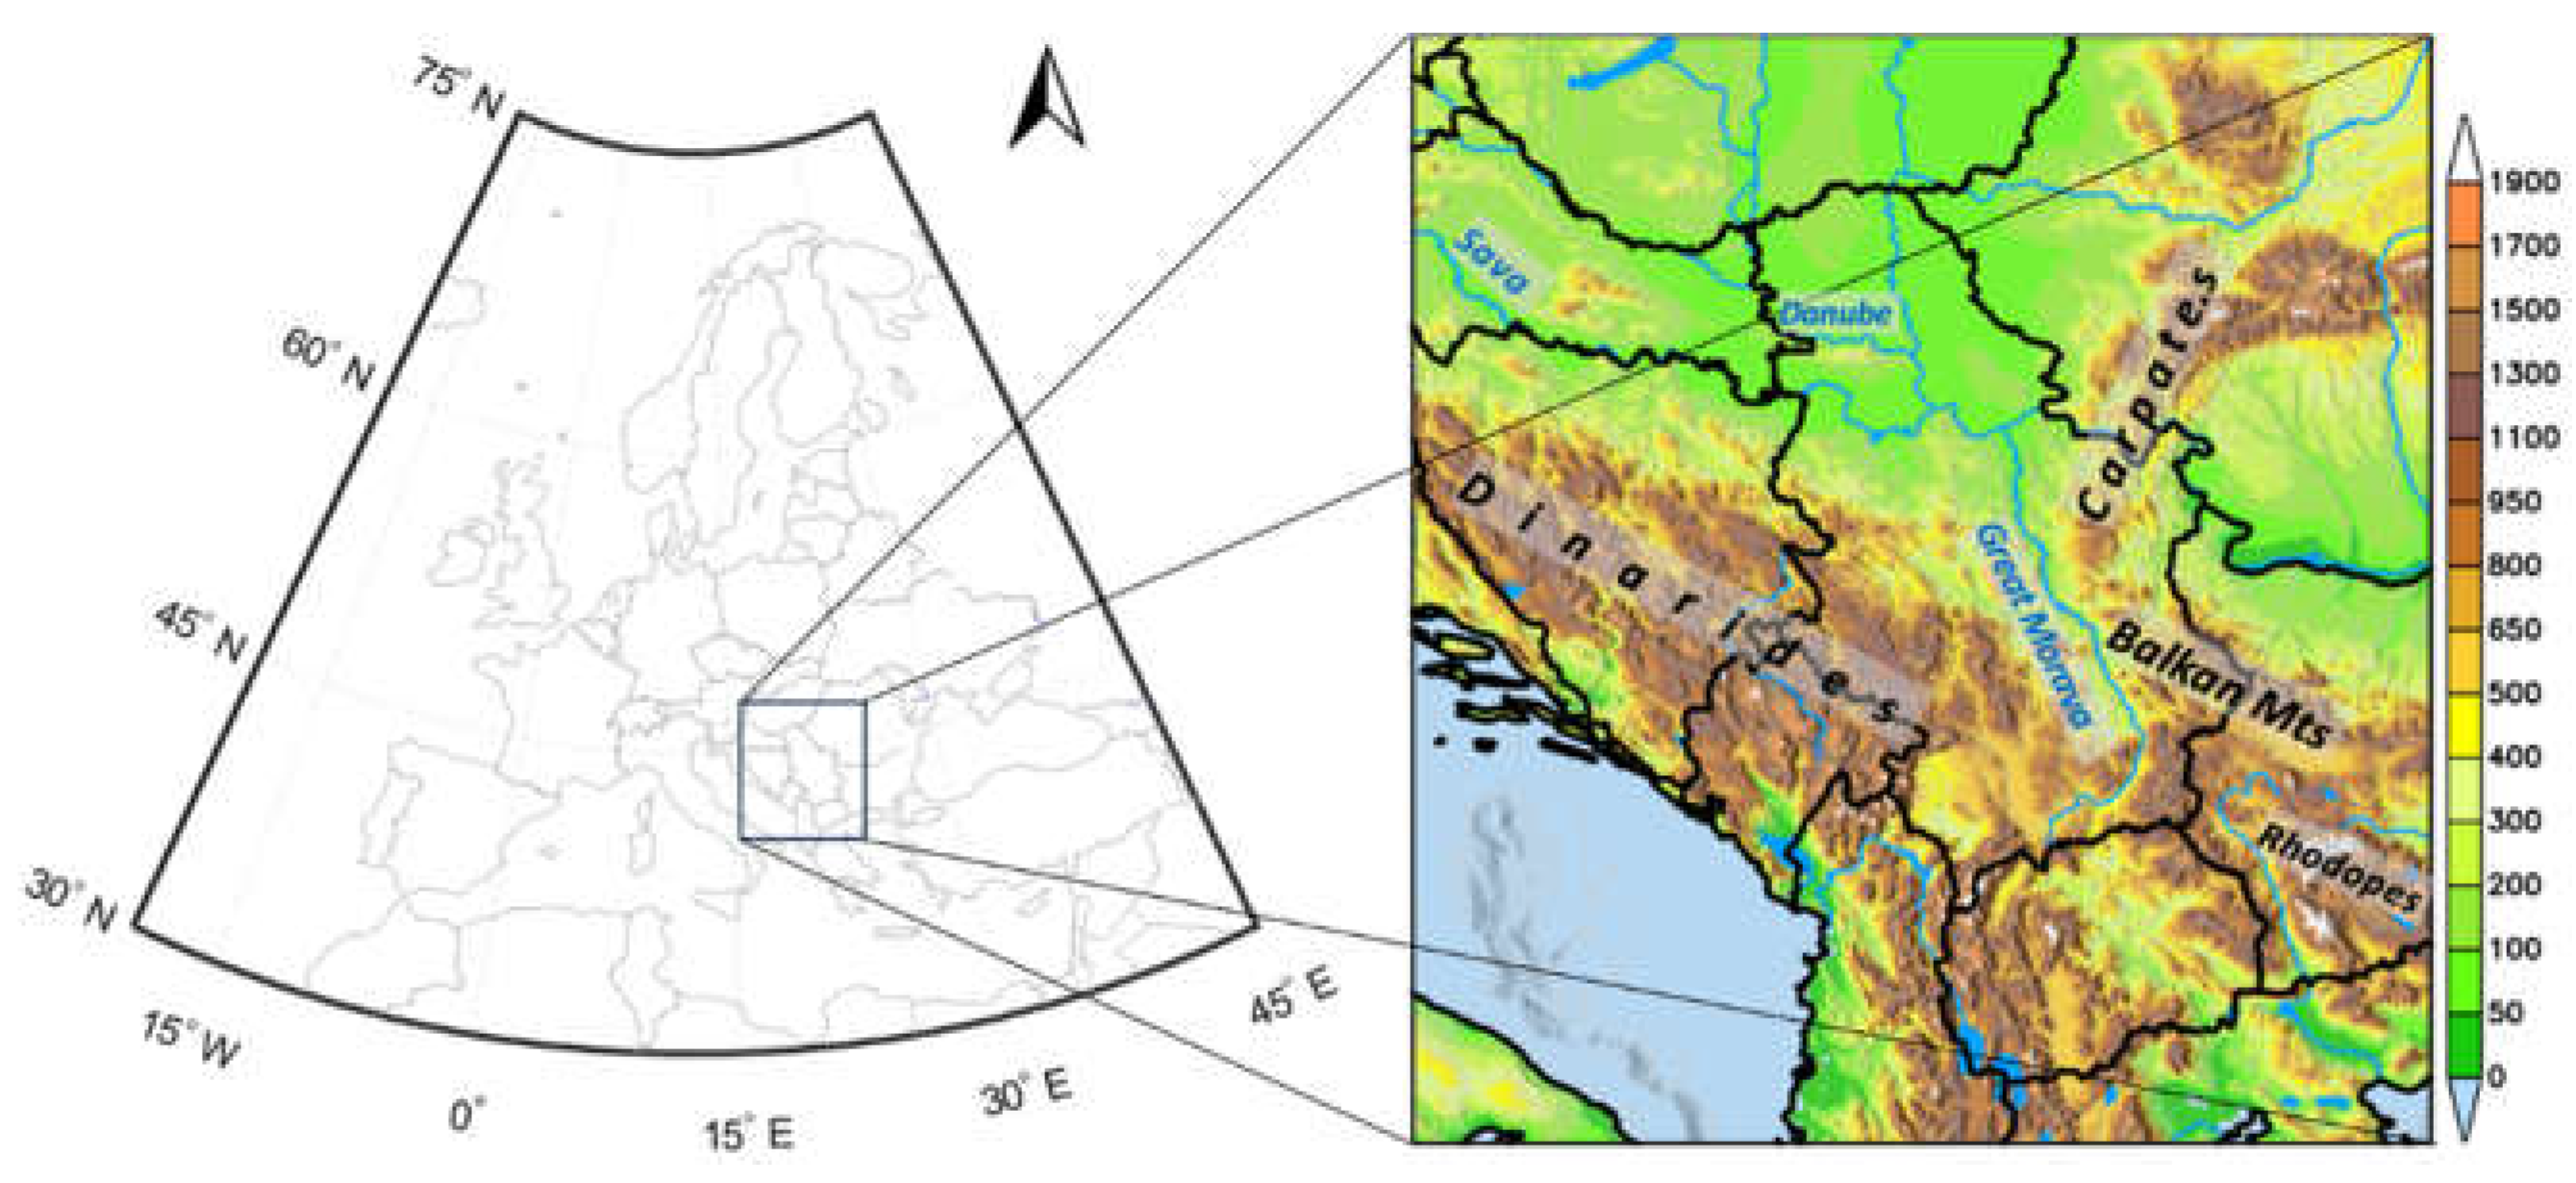
Figure 2.
Multifractal spectra for SPEI-1 for a sample grid point at latitude 43.15 and longitude 22.45 corresponding to the city of Pirot for the two accumulation periods (top panel), together with the maps of the parameter emphasizing the chosen sample grid point position (bold squares in the southeast) for the period 1961−1990 (bottom left) and 1991−2020 (bottom right).
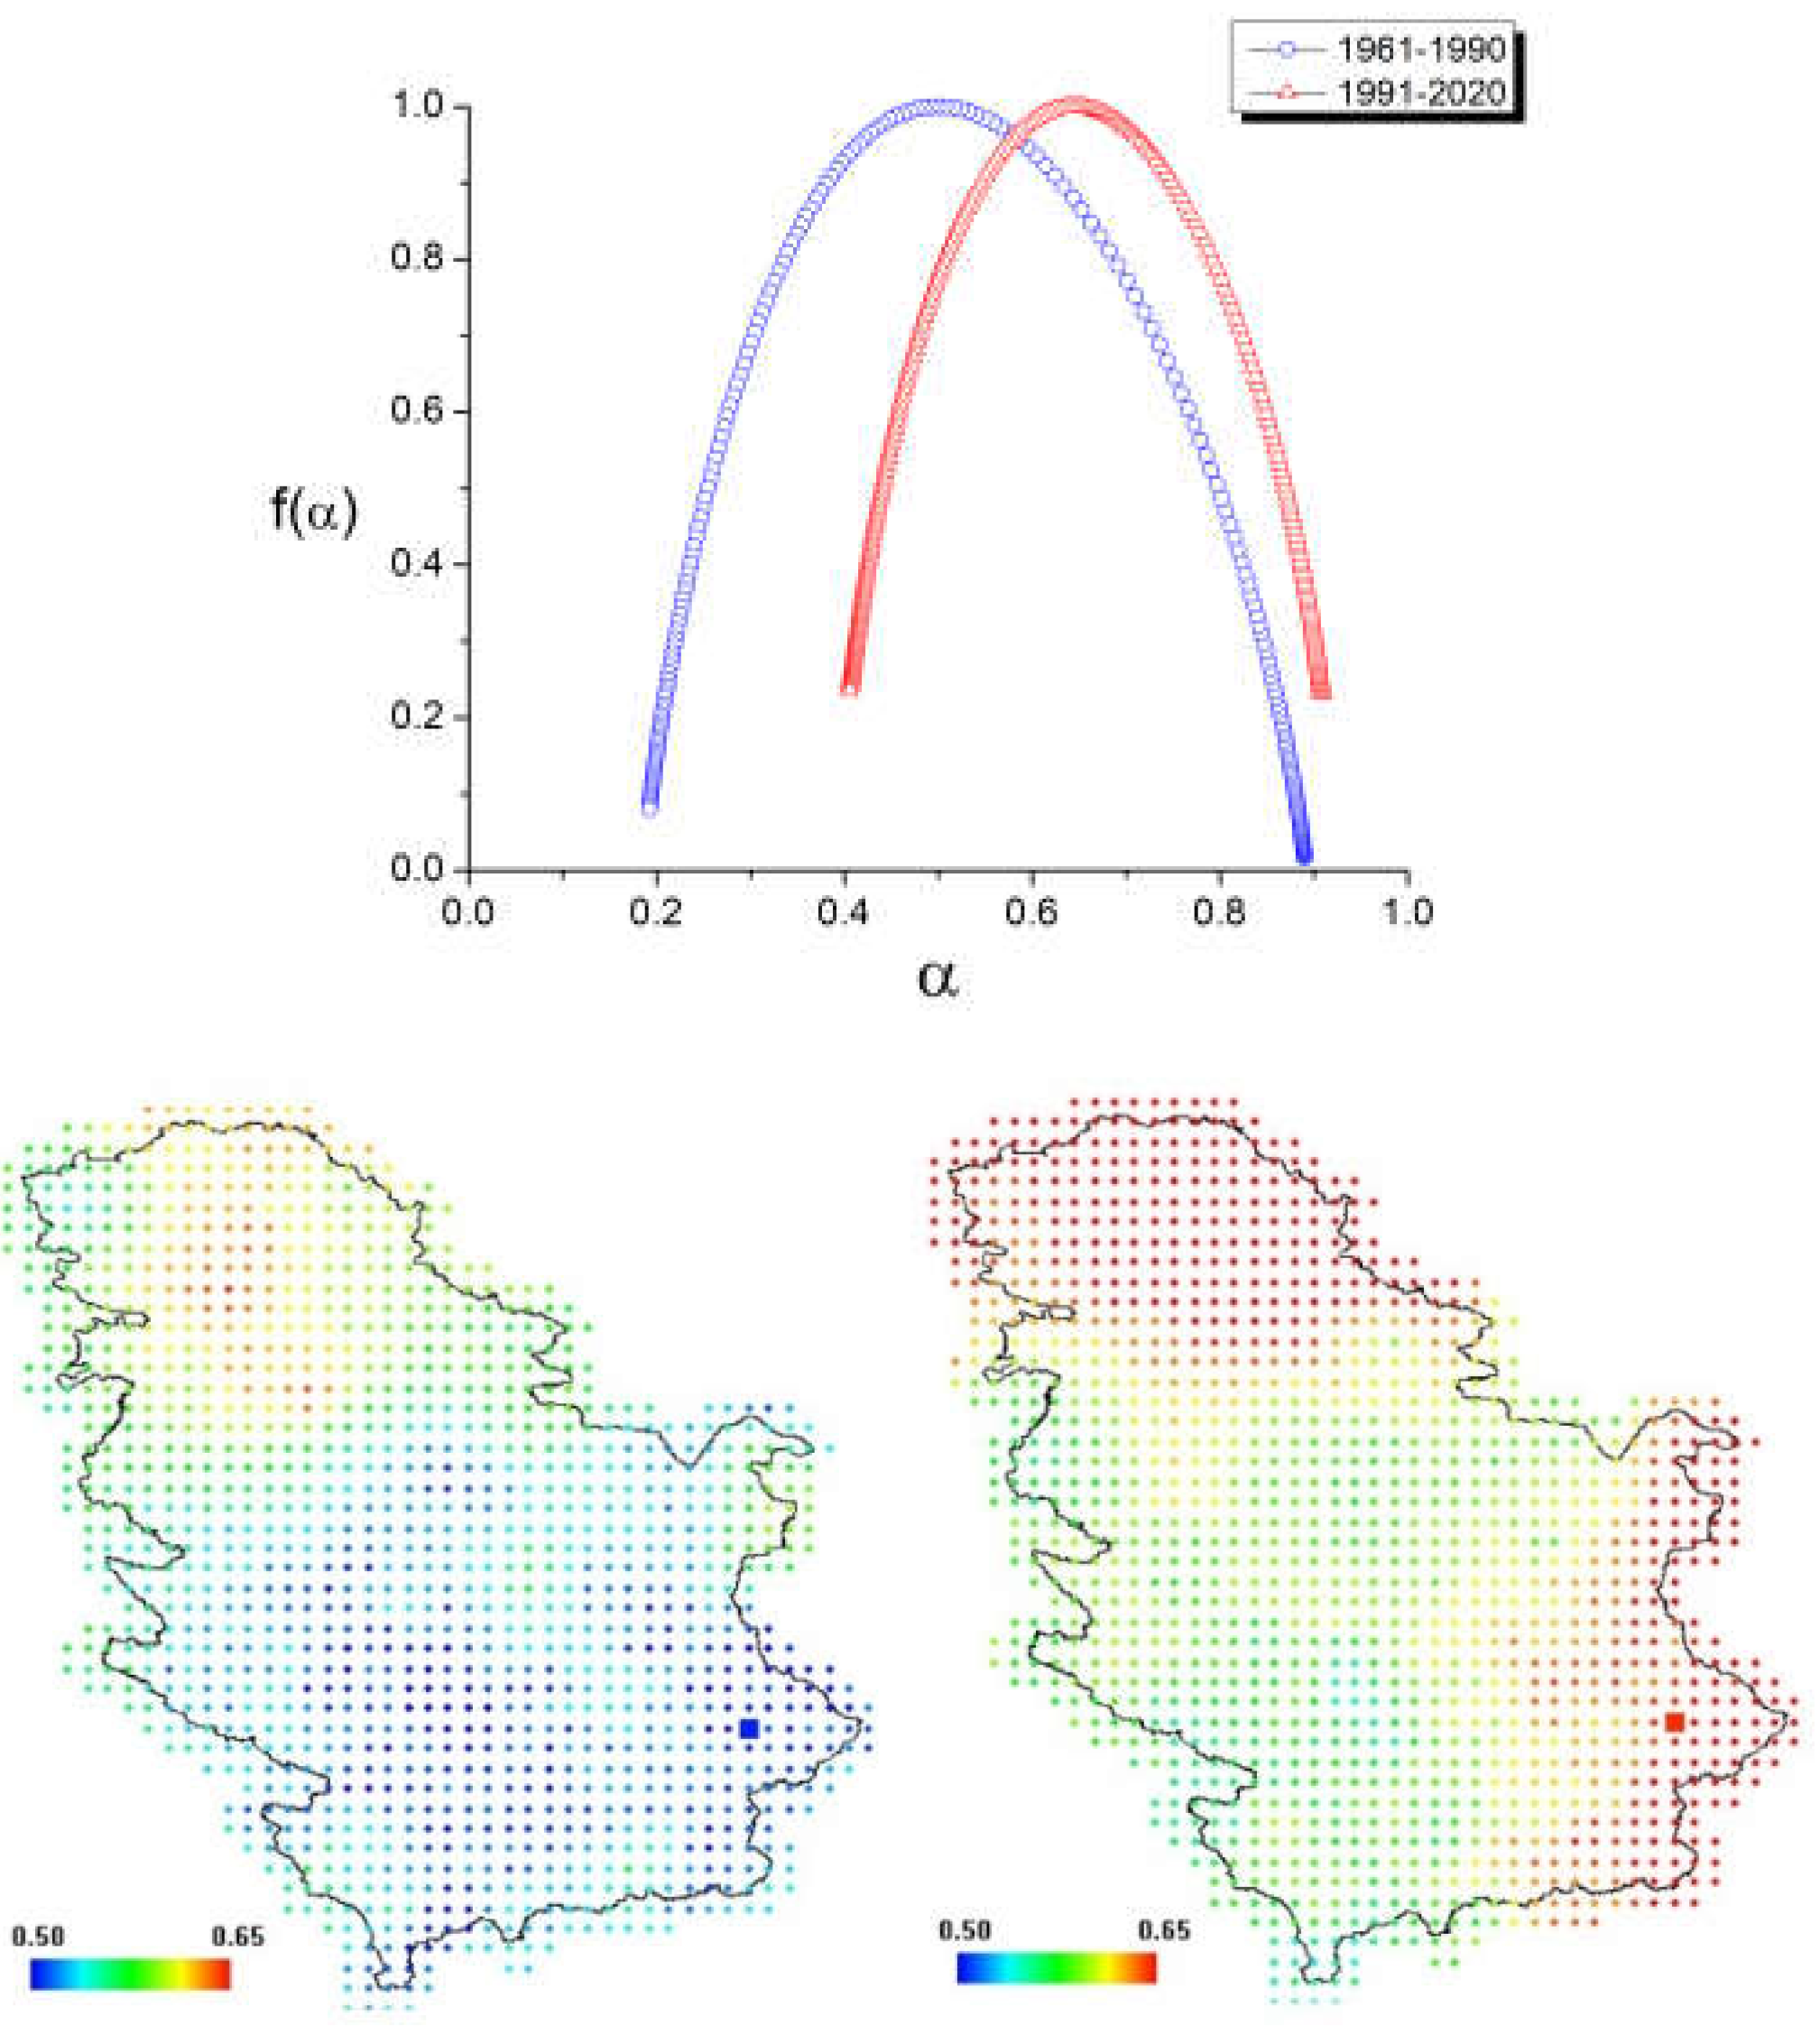
Figure 3.
Mutifractal parameter for SPEI-1, SPEI-3, SPEI-6 and SPEI-12 across Serbia, for the periods 1961−1990 and 1991−2020. To emphasize the difference between the parameters among the two periods, the range of the color bar is adjusted to cover (roughly) standard deviations about the mean of for each SPEI accumulation period.
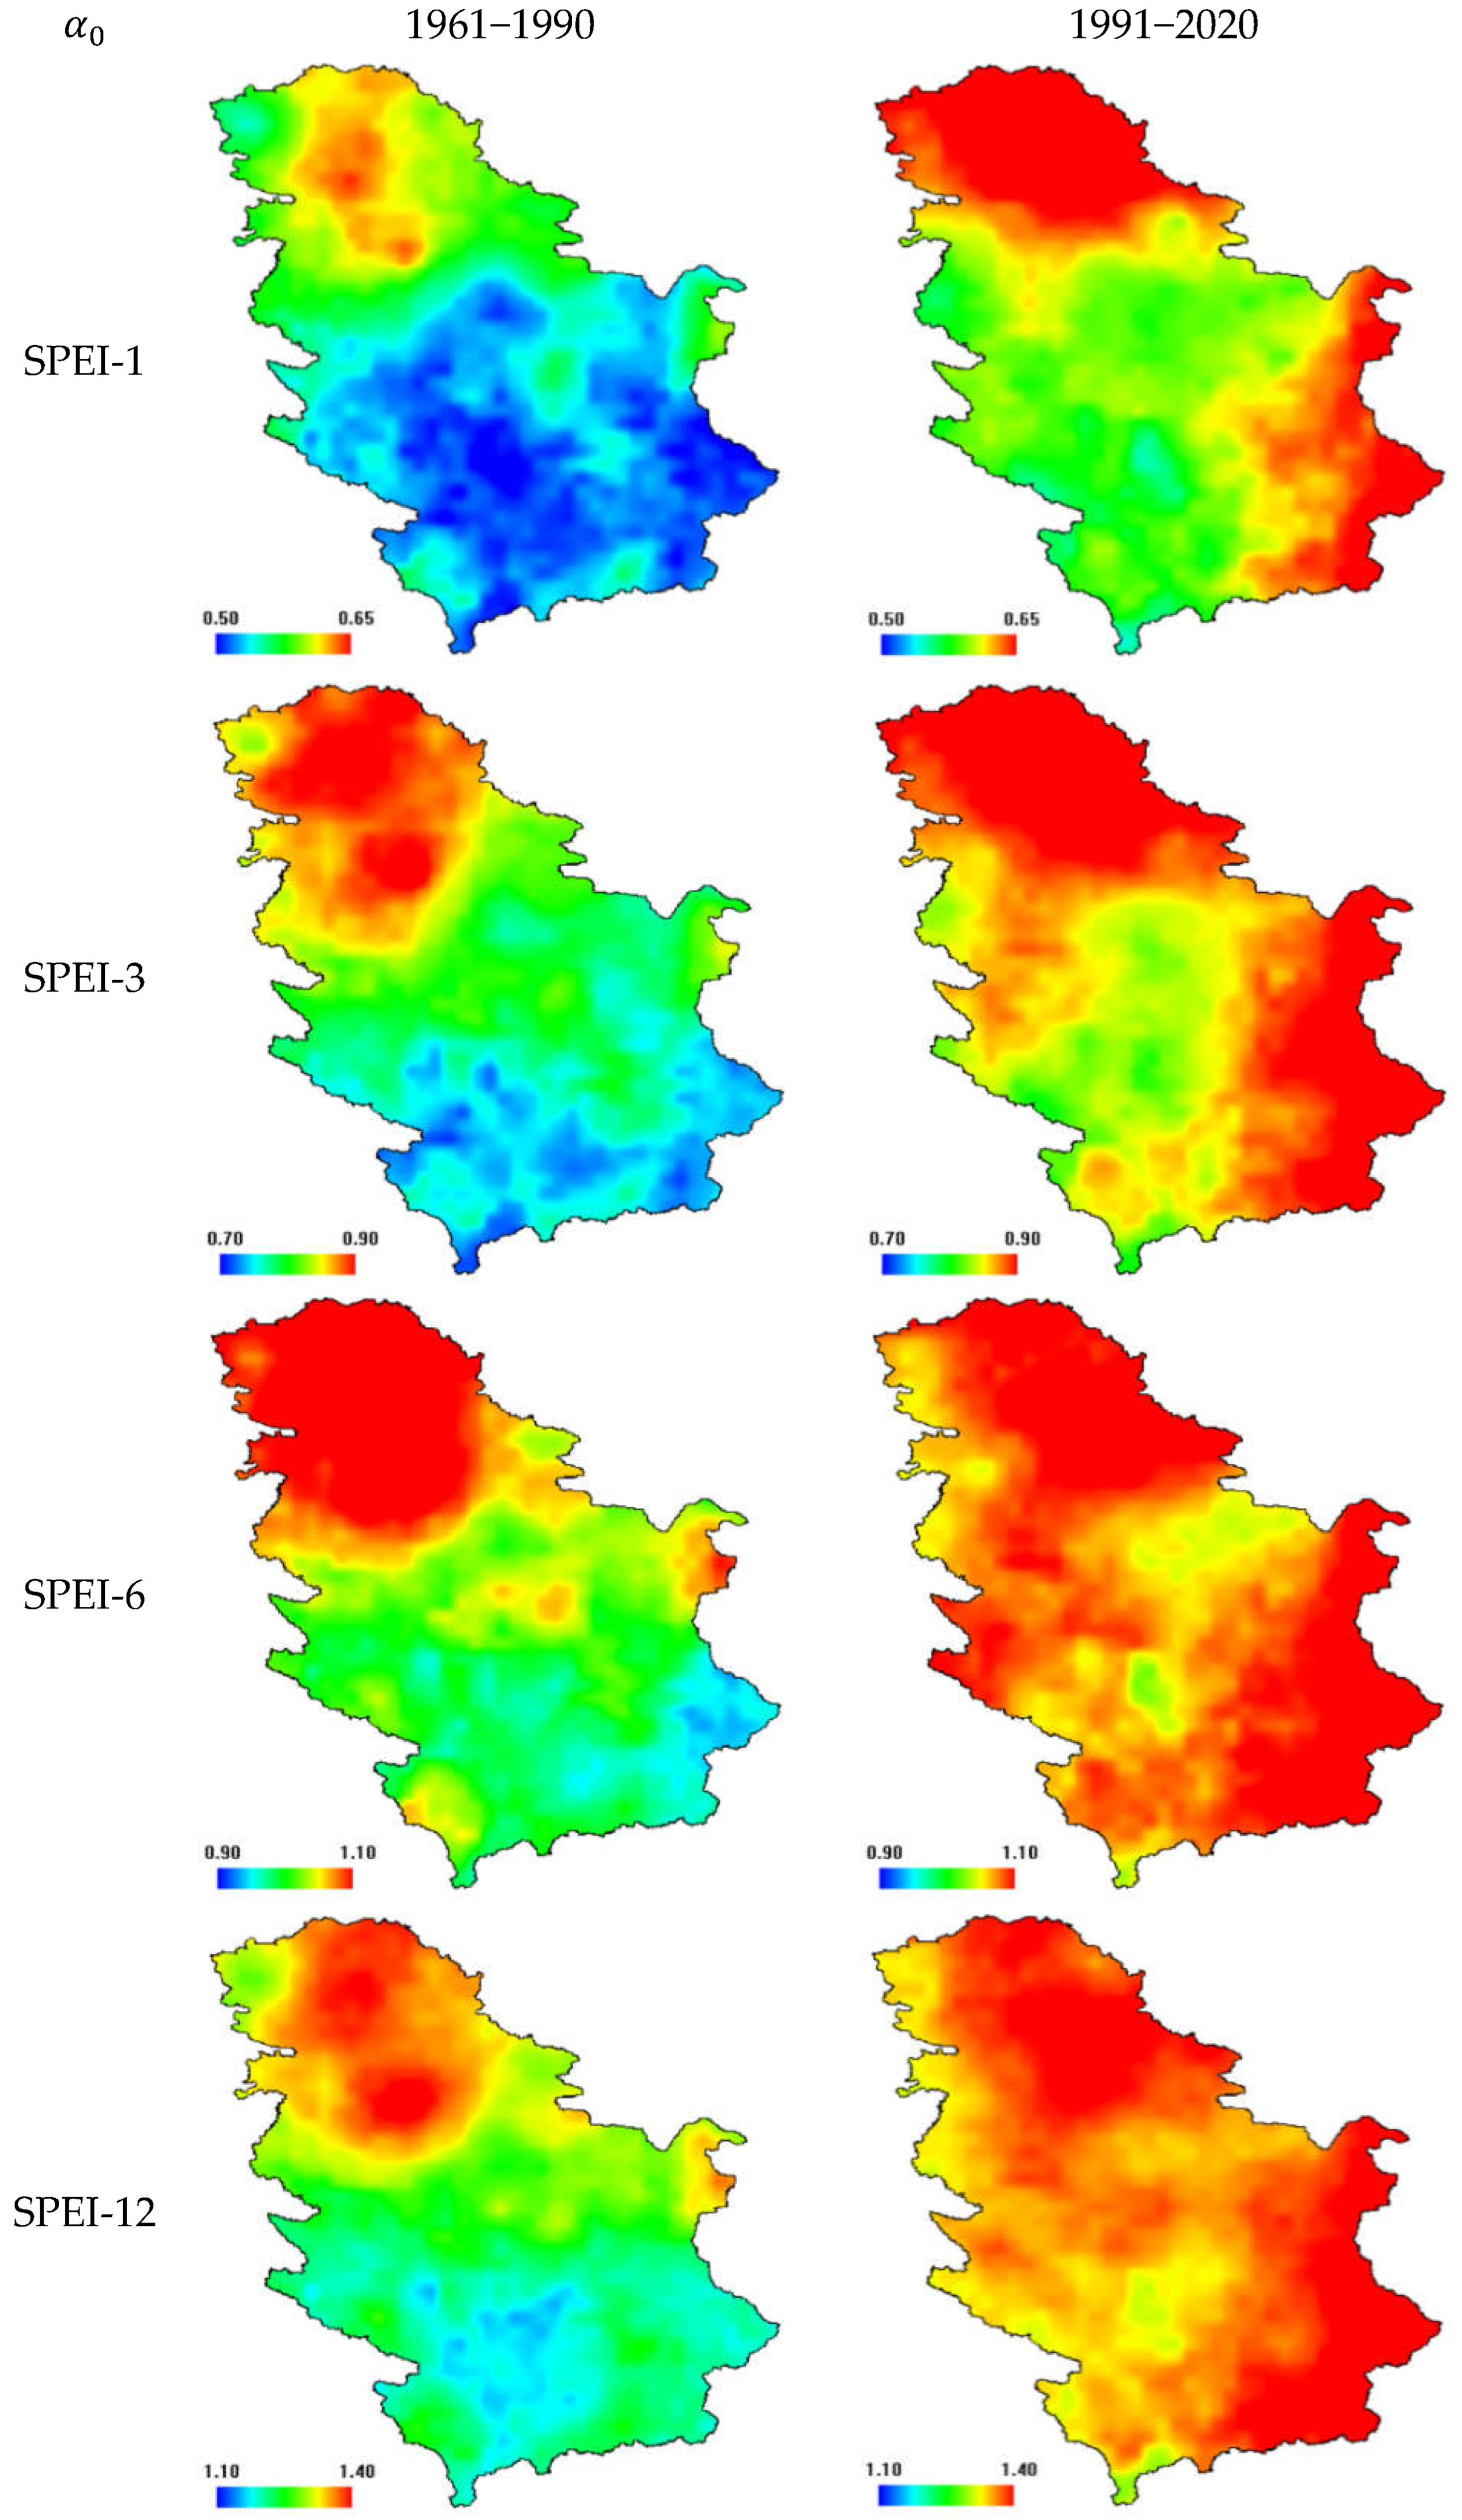
Figure 4.
Mutifractal parameter for SPEI-1, SPEI-3, SPEI-6 and SPEI-12 across Serbia, for the periods 1961−1990 and 1991−2020.
Figure 4.
Mutifractal parameter for SPEI-1, SPEI-3, SPEI-6 and SPEI-12 across Serbia, for the periods 1961−1990 and 1991−2020.
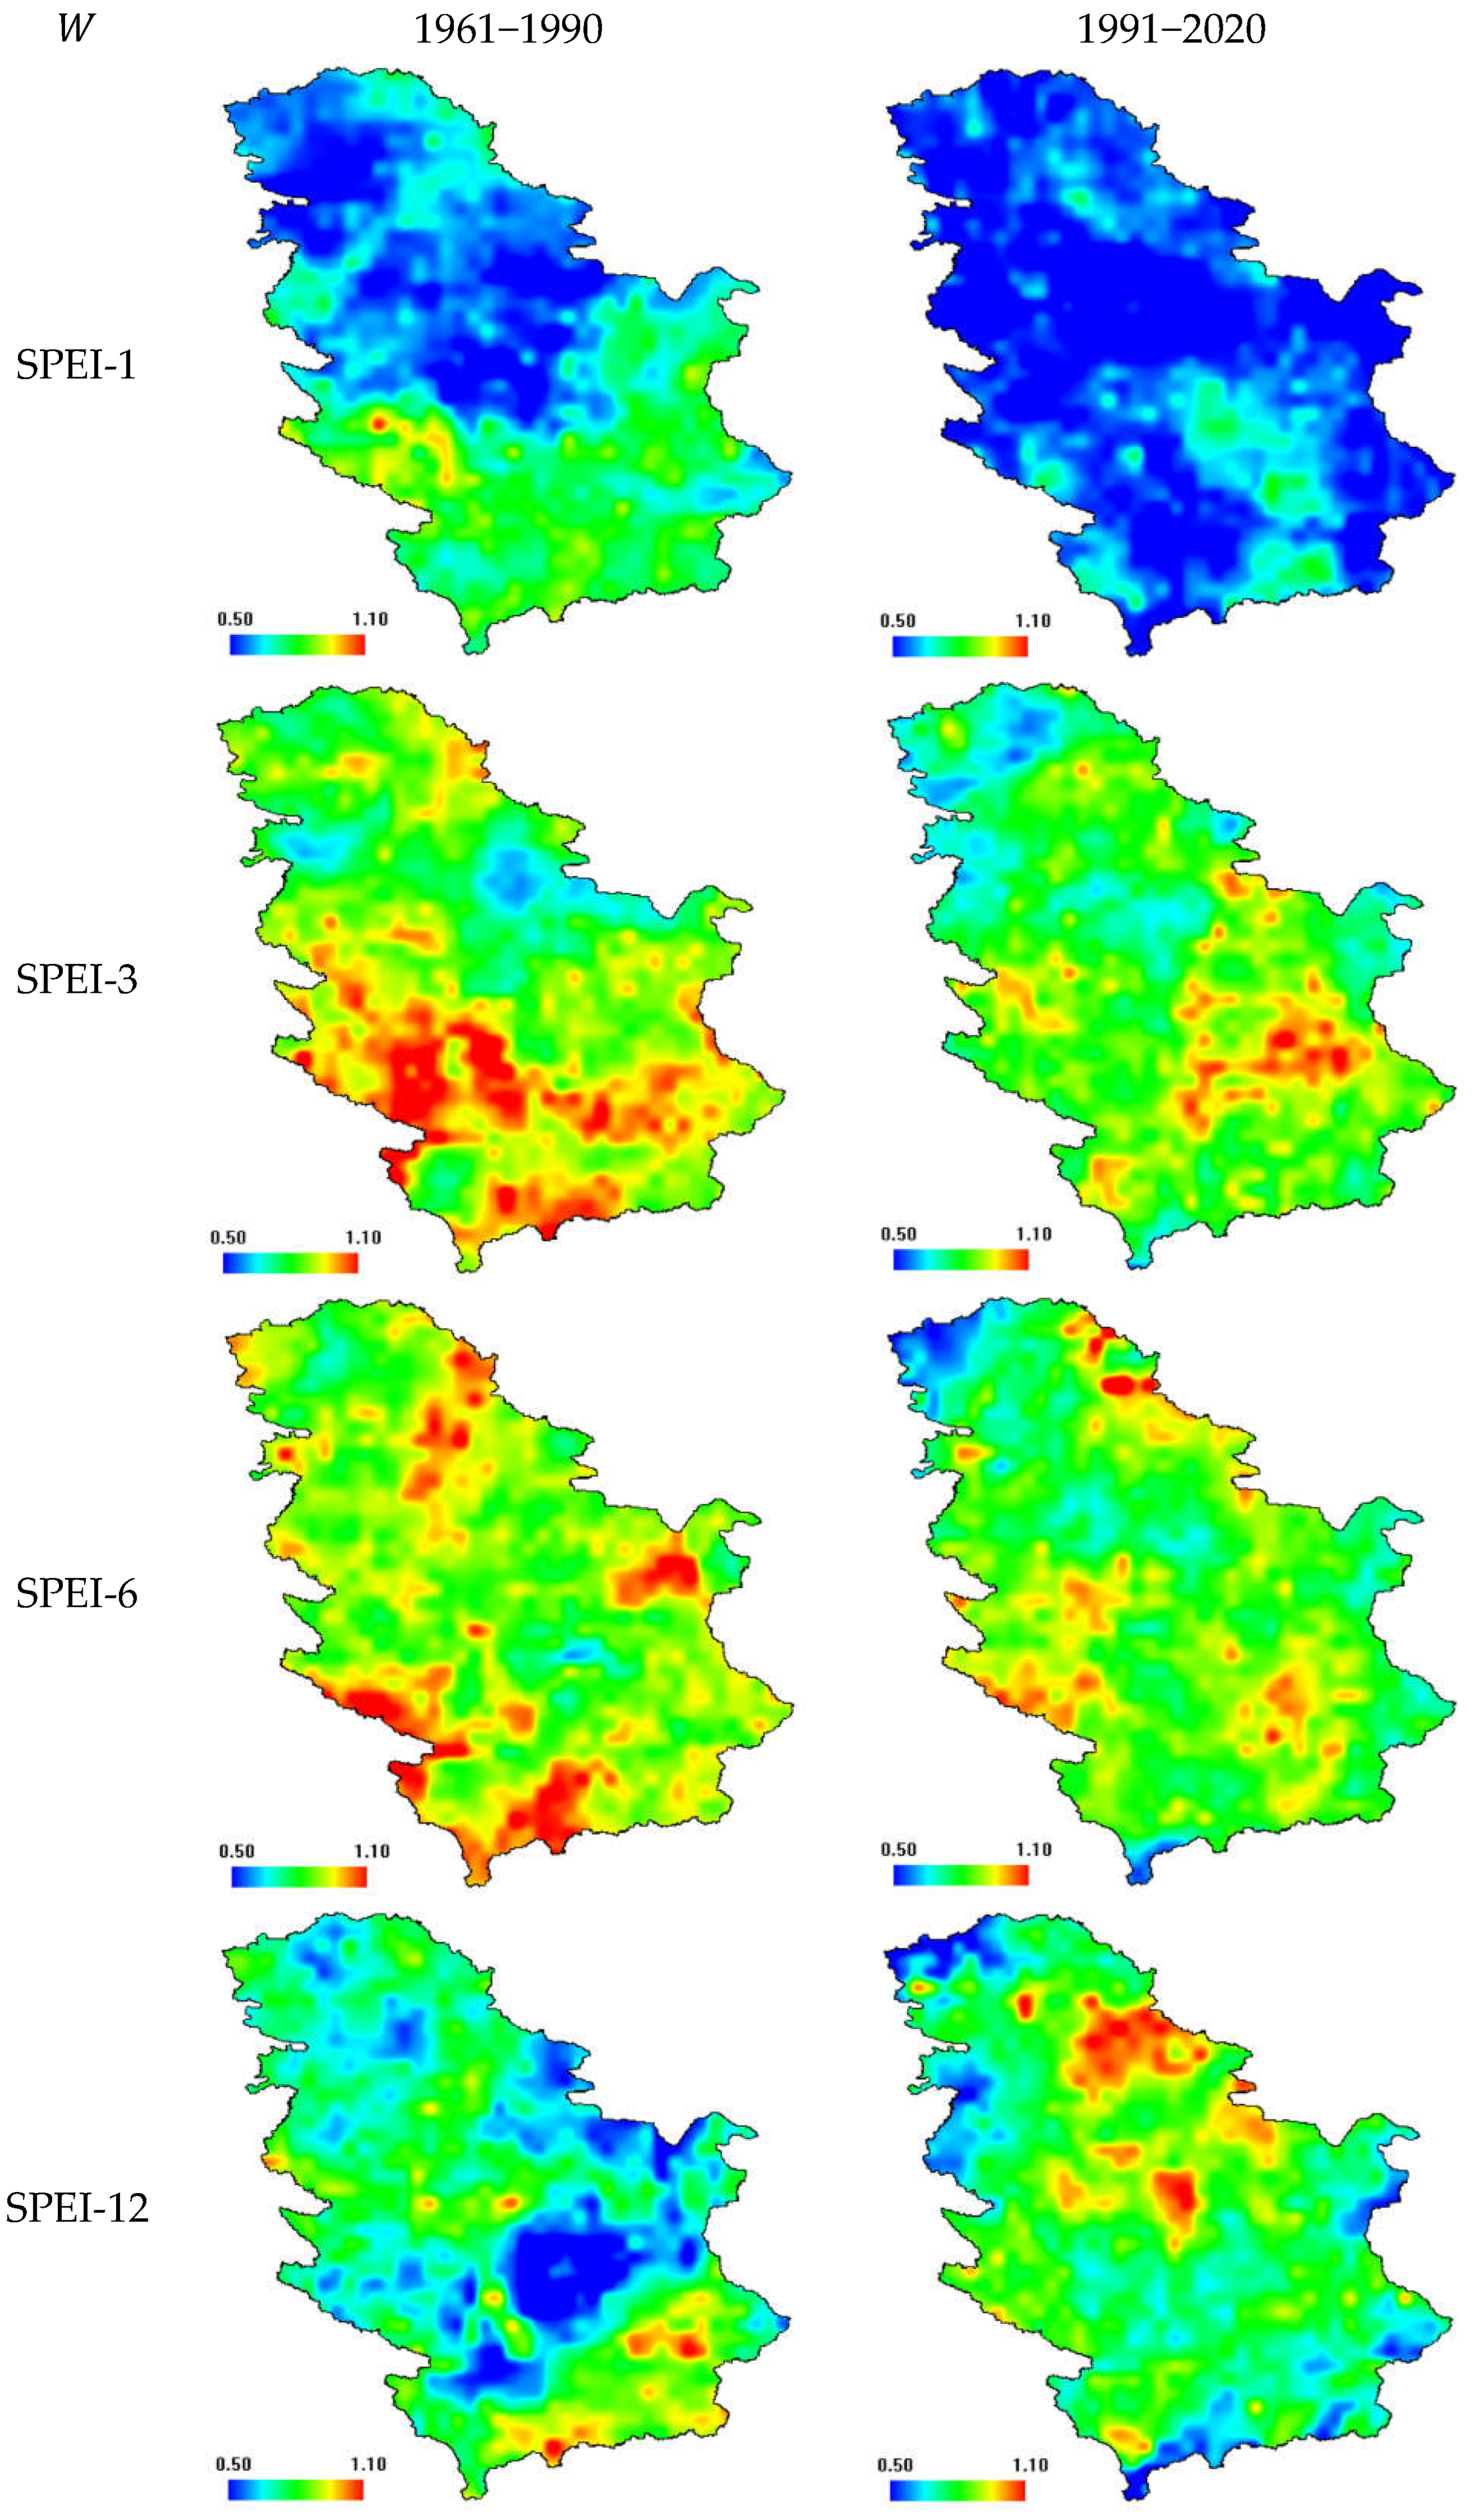
Figure 5.
Mutifractal parameter for SPEI-1, SPEI-3, SPEI-6 and SPEI-12 across Serbia, for the periods 1961−1990 and 1991−2020.
Figure 5.
Mutifractal parameter for SPEI-1, SPEI-3, SPEI-6 and SPEI-12 across Serbia, for the periods 1961−1990 and 1991−2020.
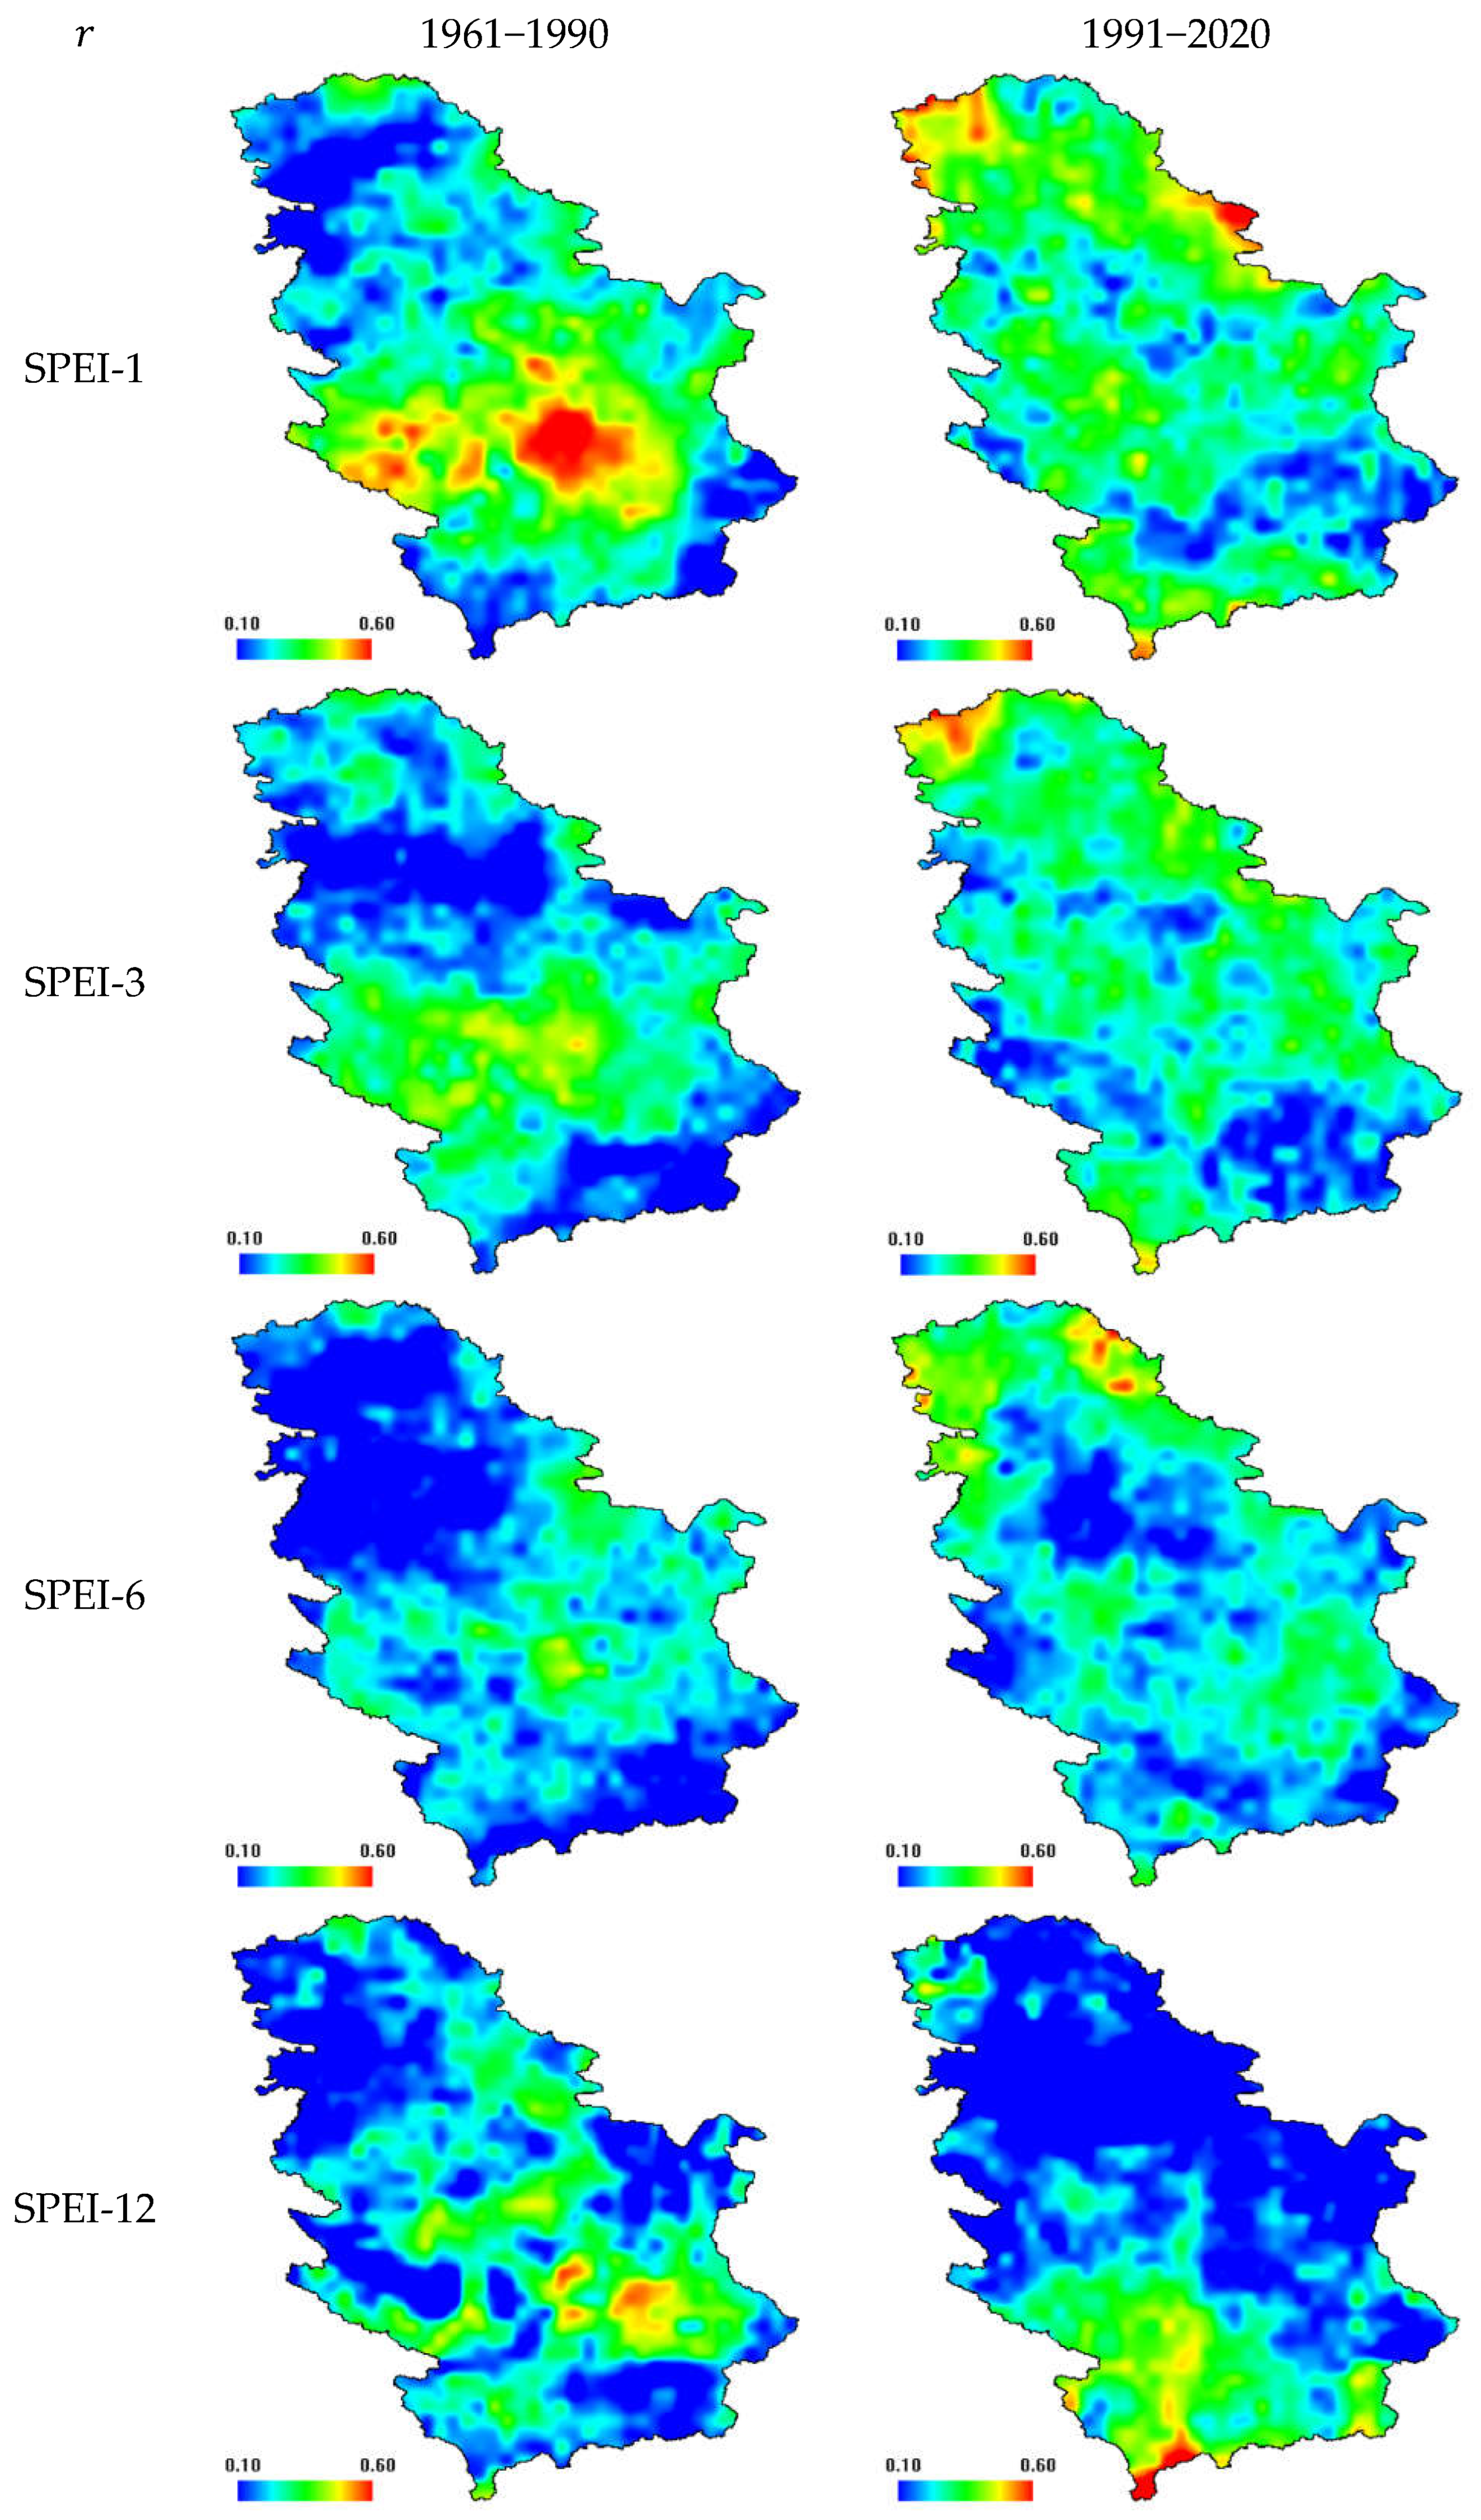

Table 1.
Drought classification based on SPEI.
| Drought category | SPEI values |
|---|---|
| Extremely dry | SPEI ≤ –2.0 |
| Severely dry | −2.0 < SPEI ≤ −1.5 |
| Moderately dry | −1.5 < SPEI ≤ −1.0 |
| Near Normal | −1.0 < SPEI < 1.0 |
| Moderately wet | 1.0 ≤ SPEI < 1.5 |
| Severely wet | 1.5 ≤ SPEI < 2.0 |
| Extreme wet | SPEI ≥ 2.0 |
Table 2.
Descriptive statistics of mutifractal parameters , and for SPEI-1, SPEI-3, SPEI-6 and SPEI-12 across Serbia, for the periods 1961-1990 and 1991-2020.
Table 2.
Descriptive statistics of mutifractal parameters , and for SPEI-1, SPEI-3, SPEI-6 and SPEI-12 across Serbia, for the periods 1961-1990 and 1991-2020.
| Title 1 | Mean | Minimum | Maximum | Standard deviation | Q1 | Median | Q3 |
|---|---|---|---|---|---|---|---|
| SPEI-1 1961-1990 | |||||||
| 0.551 | 0.485 | 0.646 | 0.037 | 0.522 | 0.541 | 0.578 | |
| 0.676 | 0.380 | 1.158 | 0.127 | 0.575 | 0.676 | 0.762 | |
| 0.268 | -0.156 | 0.689 | 0.137 | 0.176 | 0.254 | 0.356 | |
| SPEI-1 1991-2020 | |||||||
| 0.615 | 0.538 | 0.724 | 0.037 | 0.587 | 0.608 | 0.644 | |
| 0.532 | 0.242 | 0.842 | 0.093 | 0.471 | 0.527 | 0.588 | |
| 0.301 | -0.005 | 0.708 | 0.119 | 0.222 | 0.298 | 0.371 | |
| SPEI-3 1961-1990 | |||||||
| 0.802 | 0.704 | 0.927 | 0.055 | 0.755 | 0.790 | 0.852 | |
| 0.886 | 0.572 | 1.311 | 0.123 | 0.805 | 0.885 | 0.963 | |
| 0.215 | -0.073 | 0.521 | 0.109 | 0.141 | 0.215 | 0.290 | |
| SPEI-3 1991-2020 | |||||||
| 0.879 | 0.793 | 0.982 | 0.042 | 0.845 | 0.873 | 0.914 | |
| 0.806 | 0.504 | 1.246 | 0.112 | 0.730 | 0.802 | 0.878 | |
| 0.262 | -0.032 | 0.751 | 0.100 | 0.198 | 0.261 | 0.319 | |
| SPEI-6 1961-1990 | |||||||
| 1.039 | 0.927 | 1.185 | 0.060 | 0.992 | 1.030 | 1.081 | |
| 0.904 | 0.548 | 1.256 | 0.103 | 0.834 | 0.899 | 0.965 | |
| 0.167 | -0.223 | 0.491 | 0.102 | 0.097 | 0.175 | 0.242 | |
| SPEI-6 1991-2020 | |||||||
| 1.089 | 1.017 | 1.227 | 0.032 | 1.065 | 1.084 | 1.107 | |
| 0.820 | 0.457 | 1.628 | 0.123 | 0.749 | 0.823 | 0.897 | |
| 0.235 | -0.093 | 0.677 | 0.105 | 0.168 | 0.226 | 0.299 | |
| SPEI-12 1961-1990 | |||||||
| 1.267 | 1.146 | 1.429 | 0.068 | 1.208 | 1.259 | 1.326 | |
| 0.725 | 0.325 | 1.209 | 0.132 | 0.636 | 0.726 | 0.808 | |
| 0.195 | -0.277 | 0.606 | 0.132 | 0.104 | 0.191 | 0.283 | |
| SPEI-12 1991-2020 | |||||||
| 1.368 | 1.266 | 1.507 | 0.037 | 1.340 | 1.365 | 1.394 | |
| 0.767 | 0.247 | 1.447 | 0.148 | 0.679 | 0.765 | 0.853 | |
| 0.158 | -0.577 | 0.875 | 0.187 | 0.037 | 0.145 | 0.277 | |
Disclaimer/Publisher’s Note: The statements, opinions and data contained in all publications are solely those of the individual author(s) and contributor(s) and not of MDPI and/or the editor(s). MDPI and/or the editor(s) disclaim responsibility for any injury to people or property resulting from any ideas, methods, instructions or products referred to in the content. |
© 2024 by the authors. Licensee MDPI, Basel, Switzerland. This article is an open access article distributed under the terms and conditions of the Creative Commons Attribution (CC BY) license (http://creativecommons.org/licenses/by/4.0/).
Copyright: This open access article is published under a Creative Commons CC BY 4.0 license, which permit the free download, distribution, and reuse, provided that the author and preprint are cited in any reuse.


