
Submitted:
04 July 2024
Posted:
05 July 2024
You are already at the latest version
Abstract
Postprandial plasma glucose between 4 and 7.9 hours is associated with the diagnosis of diabetes, diabetes mortality, and cardiovascular mortality. However, it is unknown whether 2-hour plasma glucose during the oral glucose tolerance test conducted in this postprandial period (4–7.9 hours), termed as 2-h PGOGTT@4–7.9h, can accurately classify diabetes diagnosis and predict mortality risks. This study aimed to address these questions using 2,347 adult participants. Diabetes was defined as HbA1c ≥6.5%, and the ability of 2-h PGOGTT@4–7.9h to classify diabetes was analyzed using receiver operating characteristic curves. Cox proportional hazards models were employed to estimate mortality hazard ratios (HRs) and 95% confidence intervals (CIs). The results showed that 2-h PGOGTT@4–7.9h could classify diabetes with 92% accuracy. Participants were followed up for a mean of 21.4 years. A 1-natural-log higher 2-h PGOGTT@4–7.9h was associated with an increased risk of mortality from diabetes (adjusted HR, 21.1; 95% CI, 9.2–48.0) and cardiovascular disease (adjusted HR, 1.47; 95% CI, 1.13–1.91). Simulation analysis indicated that future studies may require at least 100 participants to investigate 2-h PGOGTT@4–7.9h for diabetes diagnosis. In conclusion, 2-h PGOGTT@4–7.9h may be useful for diabetes classification and prediction of mortality risk.
Keywords:
postprandial
; oral glucose tolerance test
; cardiovascular disease
; diabetes
; survival
1. Introduction
Diabetes is a metabolic disease characterized by elevated blood glucose levels [1]. As of 2021, approximately 529 million people worldwide were living with diabetes, a number projected to rise to 1.31 billion by 2050 [2]. This condition contributes to about 1.5 million deaths annually [3]. It imposes a substantial economic burden, costing $1.3 trillion globally in 2015, which figure is estimated to climb to around $2.2 trillion by 2030 [4].
In 2021, about half of diabetic cases in adults remained undiagnosed [5]. Those with undiagnosed diabetes are developing diabetes-related complications, leading to increased healthcare expenditure [6]. Individuals with undiagnosed diabetes face a 60% higher risk of mortality compared to those without diabetes [7]. Timely diagnosis is crucial for initiating appropriate medical interventions to prevent or delay diabetes-related complications [8]. Therefore, enhanced efforts are needed to improve diabetes detection.
Currently, diabetes diagnosis relies on fasting plasma glucose levels, 2-h plasma glucose during an oral glucose tolerance test (OGTT), and hemoglobin A1c (HbA1c) [9]. However, fasting requirements for tests such as fasting plasma glucose and OGTT can be inconvenient and may induce hypoglycemia in vulnerable individuals [10]. Exploring the diagnostic potential of non-fasting plasma glucose and non-fasting OGTT could therefore offer valuable insights.
Recent research highlights postprandial glucose levels measured between 4 and 7.9 h after a meal (PPG4–7.9h) as a promising biomarker for diagnosis. Computed PPG4–7.9h demonstrates an 87% accuracy in diagnosing diabetes [11], falling within the optimal accuracy range of 80% to 90% [12]. Moreover, PPG4–7.9h has been linked to predicting mortality from both diabetes and cardiovascular disease (CVD) [13]. Importantly, it remains stable throughout this postprandial period, as evidenced by consistent hourly measurements [13,14].
Supporting this finding, Eichenlau et al's study showed that plasma glucose returned to baseline levels within 4 h after a meal, regardless of meal type (standard meal or high carbohydrate meal) and meal time (breakfast, lunch or dinner) in healthy individuals [15]. These clinical results underscore the potential of the postprandial period between 4 and 7.9 h to reflect an individual's glucose homeostasis state, offering a promising window for diabetes diagnosis.
Yet, the diagnostic and prognostic value of 2-h plasma glucose during OGTT conducted within this postprandial period between 4 and 7.9 h (2-h PGOGTT@4–7.9h) remains unknown. This study aimed to explore whether 2-h PGOGTT@4–7.9h was associated with diabetes diagnosis and predicted mortality risks. It utilized data from 2,347 adult participants who attended the third National Health and Nutrition Examination Survey (NHANES III) during 1988–1994. Additionally, 3,865 participants from the same survey with 2-h plasma glucose during OGTT conducted in the fasting period (fasting time ≥8 h [9,16,17]), termed as 2-h PGOGTT@fasting, were included in the analysis.
2. Materials and Methods
2.1. Participants
This study included adult participants (aged ≥20 years) from NHANES III (1988–1994) [18]. Two cohorts of participants were selected from the participants: the postprandial cohort (fasting time, 4–7.9 h) and the fasting cohort (fasting time, ≥ 8 h [9,16,17]).
The postprandial cohort included all participants who had 2-h plasma glucose during OGTT conducted in the postprandial period between 4 and 7.9 h (n = 2410). This 2-h plasma glucose was termed as 2-h PGOGTT@4–7.9h. Participants missing follow-up time or with a follow-up of 0 months (n = 2) were excluded. Individuals who lacked the following data were also excluded: HbA1c (n = 13), body mass index (n = 4), systolic blood pressure (n = 4), total cholesterol (n = 21), and high-density lipoprotein (HDL) cholesterol (n = 19). Therefore, the remaining 2347 participants were included in the final analysis for the postprandial cohort (Figure 1).
The fasting cohort included all participants who had 2-h plasma glucose during OGTT conducted in the fasting period (fasting time, ≥ 8 h; n = 3961). The 2-h plasma glucose in this cohort was termed as 2-h PGOGTT@fasting. Participants missing follow-up time or with a follow-up of 0 months (n = 2) were excluded. Individuals who lacked the following data were also excluded: HbA1c (n = 16), body mass index (n = 5), systolic blood pressure (n = 4), total cholesterol (n = 41), and HDL cholesterol (n = 28). Therefore, the remaining 3865 participants were included in the final analysis for the fasting cohort (Figure 1).
2.2. Exposure Variable
The exposure variable of this study was 2-h plasma glucose during OGTT which was conducted in the postprandial period between 4 and 7.9 h or in the fasting period (fasting time, ≥ 8 h [9,16,17]). During the OGTT test, participants were administered a glucose challenge containing the equivalent of 75 grams of glucose [19]. Two hours later, a blood specimen was drawn to measure 2-h plasma glucose levels using the hexokinase method [20,21].
2.3. Outcome Variables
The outcome variables of this study were HbA1c, diabetes diagnosis, and various types of mortality.
HbA1c was measured using the Bio-Rad DIAMAT glycosylated hemoglobin analyzer system [20]. Currently, diabetes in the clinic is diagnosed using HbA1c, fasting plasma glucose and 2-h plasma glucose during OGTT which was conducted in the fasting period. However, participants in the postprandial cohort lacked fasting plasma glucose and OGTT that was conducted in the fasting period. Therefore, diabetes in the current study was defined as HbA1c ≥ 6.5 only in the main analyses. Diabetes was also defined as a self-reported diagnosis in additional analyses.
Data on mortality from diabetes, CVD, cancer, and all causes were directly retrieved from NHANES-linked mortality files [18]. To evaluate mortality status and the cause of death, the National Center for Health Statistics linked the NHANES data with death certificate records from the National Death Index records [22]. Follow-up time was the duration from the time when the individual was examined at the Mobile Examination Center until death or until the conclusion of follow-up (31 December 2019), whichever occurred first [23].
2.4. Covariables
Covariables were described previously [11,14] and included age, sex (female or male), ethnicity (non-Hispanic white, non-Hispanic black, Hispanic, or other), body mass index, poverty–income ratio (<130%, 130%–349%, ≥350%, or unknown), education (<high school, high school, >high school, or unknown), smoking status (current smoker, past smoker, or non-smoker), alcohol consumption (never, <1 drink per week, 1–6 drinks per week, ≥7 drinks per week, or unknown), physical activity (inactive, insufficiently active, or active), survey periods (1988–1991 or 1991–1994), systolic blood pressure, total cholesterol, high-density lipoprotein (HDL) cholesterol, and family history of diabetes (yes, no, or unknown).
2.5. Statistical Analyses
The baseline characteristics of these two cohorts of participants were presented as median and interquartile range for not normally distributed continuous variables, mean and standard deviation for normally distributed continuous variables, or number and percentage for categorical variables [24]. Differences in continuous variables were analyzed via the Mann-Whitney U test (not normally distributed) [25] and Student’s T-test (normally distributed) [26], and differences among categorical variables were analyzed via Pearson’s chi-square test [27].
The associations of 2-h plasma glucose with HbA1c and diabetes diagnosis were analyzed by multiple linear regression and binary logistic regression [28], respectively. Receiver operating characteristic curves were constructed and the area under the curve (AUC) was calculated to assess the association of 2-h plasma glucose with diabetes diagnosis [29], and the Youden Index was used to determine the optimal cutoff [30].
Cox proportional hazards models were used to calculate hazard ratios (HRs) and 95% confidence intervals (CIs) of 2-h plasma glucose for mortality from diabetes, CVD, cancer, and all causes [31]. 2-h plasma glucose was treated as a continuous variable (natural log-transformed) or categorical variable (≥ versus < 200 mg/dL). Kaplan–Meier curves were constructed to estimate the survival rates of participants between the two 2-h plasma glucose categories (≥ versus < 200 mg/dL), which were compared using the log-rank test [32]. To improve data distribution, body mass index, total cholesterol, HDL cholesterol, and systolic blood pressure were natural log-transformed in all the regression analyses [33].
Power estimation was conducted by simulations employing 10,000 randomly generated samples with various sample sizes (ranging from 50 to 200) derived from the postprandial cohort of 2347 participants [34,35]. Diabetes prediction was defined as a 2-h PGOGTT@4–7.9h ≥ 200 mg/dL, and actual diabetes status was defined as HbA1c ≥ 6.5% [36]. Within each sample, the diagnostic accuracy, sensitivity, and specificity of 2-h PGOGTT@4–7.9h for diabetes diagnosis were then calculated [37,38,39].
A diagnostic accuracy of 80%, which is deemed a minimum threshold for an excellent diagnostic marker [12], was used for power estimation. The percentage of samples exhibiting ≥ 80% accuracy out of 10,000 random samples was assigned as the diagnostic power of 2-h PGOGTT@4–7.9h in classifying diabetes. Mean sensitivity and specificity values were calculated from the 10,000 samples, and their 95% confidence intervals were generated from the 2.5th and 97.5th percentiles of the 10,000 sensitivity and specificity values [40]. In addition, a diagnostic accuracy of 81% was also used to estimate power and sample size.
The null hypothesis was rejected for two-sided values of p < 0.05. The estimation of power and sample size were conducted using the R program, and the remaining analyses were conducted using SPSS version 27.0 (IBM SPSS Statistics for Windows, Armonk, NY, USA, IBM Corporation) [41].
3. Results
3.1. Baseline Characteristics
This study included two cohorts of participants: the postprandial cohort (fasting time, 4–7.9 h; n = 2347) and the fasting cohort (fasting time, ≥ 8 h; n = 3865). Both cohorts had a mean age of 56 years. Participants with higher 2-h plasma glucose during OGTT were older, and had higher levels of HbA1c, body mass index, systolic blood pressure, and total cholesterol, and had lower levels of HDL-cholesterol, education, and income (Table 1 and Table 2).
3.2. Association of 2-h Plasma Glucose during OGTT with HbA1c
2-h PGOGTT@4–7.9h was positively associated with HbA1c without adjustment (Model 1, β = 0.544, p <0.001, Table 3). This association remained significant after adjustment for all the tested confounders (Model 6, β = 0.530, p <0.001, Table 3). Similarly, 2-h PGOGTT@fasting was positively associated with HbA1c in the absence (β = 0.603) and presence of adjustment (β = 0.574, Table 3).
3.3. Association of 2-h Plasma Glucose during OGTT with Diabetes Diagnosis
A 1-natural-log increase in 2-h PGOGTT@4–7.9h was associated with a higher risk of HbA1c-diagnosed diabetes after adjustment for all the tested confounders (Model 6; OR = 687; 95% CI, 310–1523; p <0.001; Table 4). 2-h PGOGTT@fasting was associated with HbA1c-diagnosed diabetes to a similar extent (Model 6; OR = 655; 95% CI, 356–1204; p <0.001; Table 4).
ROC curve analysis showed that 2-h PGOGTT@4–7.9h predicted HbA1c-diagnosed diabetes with an accuracy of 92% as indicated by the AUC value, and the accuracy for 2-h PGOGTT@fasting was 95% (Figure 2). The optimal cutoff for 2-h PGOGTT@4–7.9h to predict HbA1c-diagnosed diabetes was 206.8 mg/dL, and the corresponding cutoff for 2-h PGOGTT@fasting was 203.6 mg/dL (Figure 2).
In further analyses, we defined diabetes as a self-reported diagnosis. The results showed that both 2-h PGOGTT@4–7.9h and 2-h PGOGTT@fasting remained significantly associated with diabetes diagnosis (Table 5 and Figure 3).
2-h PGOGTT@4–7.9h, 2-hour plasma glucose during OGTT which was conducted in the postprandial period between 4 and 7.9 h; 2-h PGOGTT@fasting, 2-hour plasma glucose during OGTT which was conducted in the fasting period (fasting time, ≥ 8 h); CI, confidence interval; OGTT, oral glucose tolerance test; OR, odds ratio. 1 Out of 2347 participants, the self-reported diabetes status was missing in one participant. Therefore, the remaining 2346 participants were included in the analysis. 2 Out of 3865 participants, the self-reported diabetes status was missing in 5 participants. Therefore, the remaining 3860 participants were included in the analysis. Model 1 was not adjusted; Model 2 was adjusted for age, sex, and ethnicity; Model 3 was adjusted for all the factors in Model 2 plus body mass index, poverty–income ratio, and education; Model 4 was adjusted for all the factors in Model 3 plus physical activity, alcohol consumption, smoking status, and survey period; Model 5 was adjusted for all the factors in Model 4 plus total cholesterol, HDL cholesterol, and systolic blood pressure; and Model 6 was adjusted for all the factors in Model 5 plus family history of diabetes.
3.4. Association of 2-h Plasma Glucose during OGTT with Diabetes Mortality
The postprandial cohort was followed up for 50,185 person-years with a mean follow-up of 21.4 years. The fasting cohort was followed up for 82,039 person-years with a mean follow-up of 21.2 years. During the follow-up, diabetes led to 40 and 62 deaths in the postprandial and the fasting cohorts, respectively (Table 6).
A 1-natural-log increase in 2-h PGOGTT@4–7.9h was associated with a 21.1-fold increase in diabetes mortality risk after adjustment for all the tested confounders (Model 6; HR, 21.1; 95% CI, 9.2–48.0; p < 0.001; Table 7). A 1-natural-log increase in 2-h PGOGTT@fasting was associated with a 7.1-fold increase in diabetes mortality risk after adjustment for all the tested confounders (Model 6; HR, 7.1; 95% CI, 4.2–11.9; p < 0.001; Table 7).
Further analysis was conducted by treating 2-h plasma glucose as a categorical variable using the clinical cutoff of 200 mg/dL. The Kaplan–Meier survival curves showed that those with 2-h plasma glucose of ≥ 200 mg/dL (versus < 200 mg/dL) had an increased risk of diabetes mortality in both cohorts (p <0.001, Figure 4). The positive association remained after further adjustment for all the tested confounders (Table 8)
3.5. Association of 2-h Plasma Glucose during OGTT with All-Cause Mortality, CVD Mortality, and Cancer Mortality
We further analyzed the association of 2-h PGOGTT@4–7.9h with mortality from all causes and CVD. The results showed that a 1-natural-log increase in 2-h PGOGTT@4–7.9h was associated with a 41% increase in multivariable-adjusted risk of all-cause mortality (Model 6; HR, 1.41; 95% CI, 1.22–1.64; p <0.001; Table 9) and a 47% increase in multivariable-adjusted risk of CVD mortality (Model 6; HR, 1.47; 95% CI, 1.13–1.91; p <0.001; Table 10). 2-h PGOGTT@fasting predicted mortality from all causes and CVD to a similar extent (Table 9 and Table 10). In addition, neither 2-h PGOGTT@4–7.9h nor 2-h PGOGTT@fasting was independently associated with cancer mortality (Table 11).
3.6 Power and Sample Size Estimation for 2-h PGOGTT@4–7.9h to Diagnose Diabetes
Power analysis for using 2-h PGOGTT@4–7.9h to diagnose diabetes was conducted through the simulation of 10,000 random samples, and each simulation had a certain sample size ranging from 50 to 200 participants. The accuracy of predicted diagnoses for each of the 10,000 random samples was assessed by comparing them with the actual diabetes status.
A diagnostic accuracy within the range of 80% to 90% is considered excellent [12]. This study employed an accuracy threshold of 80% to conduct power and sample size estimations. Additionally, a slightly improved accuracy of 81% was also explored for these estimations (Table 12).
Analysis revealed that when the sample size increased, the analysis power increased and the confidence interval for sensitivity and specificity narrowed (Table 12). The findings suggested that a sample size of 100 participants may be necessary to achieve over 80% power in detecting a diagnostic accuracy of 81% (Table 12).
4. Discussion
Using a cohort of US adults (n = 2347), this study demonstrated, for the first time, that OGTT conducted during the postprandial period between 4 and 7.9 h may serve as a valuable tool for diabetes diagnosis and predicting mortality risk.
In epidemiological studies, self-reported diagnosis of diabetes is widely accepted due to its relatively higher accuracy compared to many other chronic conditions such as stroke, heart disease, and hypertension [42,43]. Studies across diverse populations have consistently shown that self-reported diagnosis exhibits a sensitivity of approximately 70%–75% in identifying true diabetes, with specificity exceeding 95% [44,45,46,47].
The slightly lower accuracy of 2-h plasma glucose in classifying self-reported diabetes compared to HbA1c-diagnosed diabetes (e.g., 88% versus 95% for 2-h PGOGTT@fasting) may be attributed to inherent limitations in the accuracy of self-reported diagnosis.
As fasting plasma glucose and OGTT conducted during fasting were not available in participants from the postprandial cohort, these parameters were not used as diagnostic criteria in this study. Therefore, the full diagnostic potential of 2-h PGOGTT@4–7.9h requires further investigation in well-designed studies where all three diabetes diagnostic criteria are concurrently assessed in each participant.
The optimal cutoff for predicting HbA1c-diagnosed diabetes with 2-h PGOGTT@4–7.9h was 206.8 mg/dL, aligning closely with the cutoff for 2-h PGOGTT@fasting at 203.6 mg/dL. This suggests that the clinical cutoff of 200 mg/dL used for 2-h PGOGTT@fasting [9,16,17] may be applicable to 2-h PGOGTT@4–7.9h as well. Participants with 2-h PGOGTT@4–7.9h ≥ 200 mg/dL demonstrated a significantly higher risk of diabetes mortality (HR, 12.3; 95% CI, 5.4–27.9) compared to those with lower values (< 200 mg/dL).
Regarding mortality predictions, both 2-h PGOGTT@4–7.9h and 2-h PGOGTT@fasting effectively forecasted mortality from CVD and all causes. This is consistent with literature suggesting that 2-h PGOGTT@fasting serves as an independent predictor for CVD [48,49,50,51] and all-cause mortality [52,53,54,55]. Furthermore, 2-h PGOGTT@4–7.9h also demonstrated comparable predictive ability for mortality from CVD and all causes.
Interestingly, neither 2-h PGOGTT@4–7.9h nor 2-h PGOGTT@fasting predicted cancer mortality in this study, consistent with some reports in the literature regarding 2-h PGOGTT@fasting [56,57,58]. Notably, other studies have reported associations between 2-h PGOGTT@fasting and cancer mortality [59,60].
Moreover, both 2-h PGOGTT@4–7.9h and 2-h PGOGTT@fasting predicted mortality specifically from diabetes, consistent with a previous report that 2-h PGOGTT@fasting predicted diabetes mortality [61]. In fact, 2-h PGOGTT@4–7.9h exhibited potentially greater sensitivity for predicting diabetes mortality compared to its fasting counterpart, evidenced by an adjusted HR of 21.1 (95% CI, 9.2–48.0) versus 7.1 (95% CI, 4.2–11.9) per 1-natural-log increase. A similar trend was observed when analyzing 2-h plasma glucose as a categorical variable (≥ versus < 200 mg/dL), with adjusted HRs of 12.3 (95% CI, 5.4–27.9) and 5.9 (95% CI, 3.4–10.1) for higher PGOGTT@4–7.9h and PGOGTT@fasting, respectively. Notably, PGOGTT@4–7.9h and PGOGTT@fasting data were mutually exclusive in this study, necessitating future research to directly compare their predictive capacities within the same participant cohort.
A limitation of this study was its reliance on HbA1c alone for defining diabetes, excluding fasting plasma glucose and OGTT from fasting periods due to their absence in participants with 2-h PGOGTT@4–7.9h. Nevertheless, analyses involving self-reported diagnosis yielded similar findings, indicating comparable diagnostic utility between 2-h PGOGTT@4–7.9h and 2-h PGOGTT@fasting for diabetes. Future investigations should incorporate all three diagnostic criteria to comprehensively assess the diagnostic value of 2-h PGOGTT@4–7.9h. This study provides valuable insights into sample size estimation for future research aimed at elucidating the full diagnostic potential of 2-h PGOGTT@4–7.9h.
5. Conclusions
This study found that 2-h PGOGTT@4–7.9h classified HbA1c-diagnosed diabetes with an outstanding accuracy of 92%, similar to that of 2-h PGOGTT@fasting (i.e., 95%). 2-h PGOGTT@4–7.9h predicted mortality risk from diabetes, CVD and all causes. Therefore, 2-h PGOGTT@4–7.9h, a non-fasting test, might be useful for diabetes diagnosis and risk prediction.
Author Contributions
Conceptualization, Y.W. and G.Y.; formal analysis, Y.W.; data curation, Y.W., Y.F., G.Y.; writing—original draft preparation, Y.W., Y.F., G.Y.; writing—review and editing, Y.W., Y.F., G.Y.; funding acquisition, Y.W. All authors have read and agreed to the published version of the manuscript.
Funding
Y.W. was supported by a grant from the National Health and Medical Research Council of Australia (1062671).
Institutional Review Board Statement
The study was conducted in accordance with the Declaration of Helsinki and approved by the NHANES Institutional Review Board. Approval codes: NHANES III 1988–1994.
Informed Consent Statement
All participants provided written informed consent. The participants’ records were anonymized before being accessed by the author.
Data Availability Statement
All data in the current analysis are publicly available on the NHANES website (https://www.cdc.gov/nchs/nhanes/index.htm, accessed on 1 March 2023).
Conflicts of Interest
The author declares no conflicts of interest.
References
- ElSayed, N.A.; Aleppo, G.; Aroda, V.R.; Bannuru, R.R.; Brown, F.M.; Bruemmer, D.; Collins, B.S.; Hilliard, M.E.; Isaacs, D.; Johnson, E.L.; et al. 1. Improving Care and Promoting Health in Populations: Standards of Care in Diabetes—2023. Diabetes Care 2022, 46, S10–S18. [Google Scholar] [CrossRef] [PubMed]
- GBD 2021 Diabetes Collaborators. Global, regional, and national burden of diabetes from 1990 to 2021, with projections of prevalence to 2050: a systematic analysis for the Global Burden of Disease Study 2021. Lancet 2023, 402, 203–234. [Google Scholar] [CrossRef] [PubMed]
- World Health Organization. Diabetes overview. Available at https://www.who.int/health-topics/diabetes#tab=tab_1. Accessed on 21 June 2024.
- Bommer, C.; Sagalova, V.; Heesemann, E.; Manne-Goehler, J.; Atun, R.; Bärnighausen, T.; Davies, J.; Vollmer, S. Global Economic Burden of Diabetes in Adults: Projections From 2015 to 2030. Diabetes Care 2018, 41, 963–970. [Google Scholar] [CrossRef] [PubMed]
- Ogurtsova, K.; Guariguata, L.; Barengo, N.C.; Ruiz, P.L.-D.; Sacre, J.W.; Karuranga, S.; Sun, H.; Boyko, E.J.; Magliano, D.J. IDF diabetes Atlas: Global estimates of undiagnosed diabetes in adults for 2021. Diabetes Res. Clin. Pract. 2022, 183, 109118. [Google Scholar] [CrossRef] [PubMed]
- Islam, R.M.; Magliano, D.J.; Khan, M.N.; Hossain, M.B.; Rana, J.; Oldroyd, J.C. Prevalence of undiagnosed diabetes and the relative importance of its risk factors among adults in Bangladesh: Findings from a nationwide survey. Diabetes Res. Clin. Pract. 2022, 185, 109228. [Google Scholar] [CrossRef] [PubMed]
- Wild, S.H.; Smith, F.B.; Lee, A.J.; Fowkes, F.G.R. Criteria for previously undiagnosed diabetes and risk of mortality: 15-year follow-up of the Edinburgh Artery Study cohort. Diabet. Med. 2005, 22, 490–496. [Google Scholar] [CrossRef] [PubMed]
- The Lancet Diabetes, E. Undiagnosed type 2 diabetes: an invisible risk factor. Lancet Diabetes Endocrinol 2024, 12, 215. [Google Scholar] [CrossRef] [PubMed]
- ElSayed, N.A.; Aleppo, G.; Aroda, V.R.; Bannuru, R.R.; Brown, F.M.; Bruemmer, D.; Collins, B.S.; Hilliard, M.E.; Isaacs, D.; Johnson, E.L.; et al. 2. Classification and Diagnosis of Diabetes: Standards of Care in Diabetes-2023. Diabetes Care 2023, 46, S19–s40. [Google Scholar] [CrossRef]
- Darras, P.; Mattman, A.; Francis, G.A. Nonfasting lipid testing: the new standard for cardiovascular risk assessment. CMAJ 2018, 190, E1317–E1318. [Google Scholar] [CrossRef]
- Wang, Y.; Fang, Y.; Aberson, C.L.; Charchar, F.J.; Ceriello, A. Postprandial Plasma Glucose between 4 and 7.9 h May Be a Potential Diagnostic Marker for Diabetes. Biomedicines 2024, 12, 1313. [Google Scholar] [CrossRef]
- Mandrekar, J.N. Receiver Operating Characteristic Curve in Diagnostic Test Assessment. J. Thorac. Oncol. 2010, 5, 1315–1316. [Google Scholar] [CrossRef] [PubMed]
- Wang, Y. Postprandial Plasma Glucose Measured from Blood Taken between 4 and 7.9 h Is Positively Associated with Mortality from Hypertension and Cardiovascular Disease. J. Cardiovasc. Dev. Dis. 2024, 11, 53. [Google Scholar] [CrossRef] [PubMed]
- Wang, Y.; Fang, Y. Late non-fasting plasma glucose predicts cardiovascular mortality independent of hemoglobin A1c. Sci. Rep. 2022, 12, 7778. [Google Scholar] [CrossRef] [PubMed]
- Eichenlaub, M.M.; Khovanova, N.A.; Gannon, M.C.; Nuttall, F.Q.; Hattersley, J.G. A Glucose-Only Model to Extract Physiological Information from Postprandial Glucose Profiles in Subjects with Normal Glucose Tolerance. J. Diabetes Sci. Technol. 2022, 16, 1532–1540. [Google Scholar] [CrossRef]
- American Diabetes Association. 2. Classification and Diagnosis of Diabetes: Standards of Medical Care in Diabetes—2021. Diabetes Care 2021, 44, S15–S33. [Google Scholar] [CrossRef]
- American Diabetes Association. Classification and Diagnosis of Diabetes: Standards of Medical Care in Diabetes-2019. Diabetes Care 2019, 42, S13–s28. [Google Scholar] [CrossRef] [PubMed]
- Wang, Y.; Fang, Y.; Magliano, D.J.; Charchar, F.J.; Sobey, C.G.; Drummond, G.R.; Golledge, J. Fasting triglycerides are positively associated with cardiovascular mortality risk in people with diabetes. Cardiovasc. Res. 2023, 119, 826–834. [Google Scholar] [CrossRef]
- Centers for Disease Control and Prevention. Plan and operation of the Third National Health and Nutrition Examination Survey, 1988-94. Series 1: programs and collection procedures. Vital Health Stat. 1 1994, 1-407.
- Gunter, E.W.; Lewis, B.G.; Koncikowski, S.M. Laboratory Procedures Used for the Third National Health and Nutrition Examination Survey (NHANES III), 1988-1994. https://wwwn.cdc.gov/nchs/data/nhanes3/manuals/labman.pdf. (accessed on 1 February 2024).
- Kubihal, S.; Goyal, A.; Gupta, Y.; Khadgawat, R. Glucose measurement in body fluids: A ready reckoner for clinicians. Diabetes & Metabolic Syndrome: Clinical Research & Reviews 2021, 15, 45–53. [Google Scholar] [CrossRef]
- Wang, Y.; Fang, Y.; Witting, P.K.; Charchar, F.J.; Sobey, C.G.; Drummond, G.R.; Golledge, J. Dietary fatty acids and mortality risk from heart disease in US adults: an analysis based on NHANES. Sci. Rep. 2023, 13, 1614. [Google Scholar] [CrossRef]
- Qin, H.; Shen, L.; Xu, D. Association of composite dietary antioxidant index with mortality in adults with hypertension: evidence from NHANES. Front Nutr 2024, 11, 1371928. [Google Scholar] [CrossRef] [PubMed]
- Jungo, K.T.; Meier, R.; Valeri, F.; Schwab, N.; Schneider, C.; Reeve, E.; Spruit, M.; Schwenkglenks, M.; Rodondi, N.; Streit, S. Baseline characteristics and comparability of older multimorbid patients with polypharmacy and general practitioners participating in a randomized controlled primary care trial. BMC Fam. Pract. 2021, 22, 123. [Google Scholar] [CrossRef] [PubMed]
- Qian, T.; Sun, H.; Xu, Q.; Hou, X.; Hu, W.; Zhang, G.; Drummond, G.R.; Sobey, C.G.; Charchar, F.J.; Golledge, J.; et al. Hyperuricemia is independently associated with hypertension in men under 60 years in a general Chinese population. J. Hum. Hypertens. 2021, 35, 1020–1028. [Google Scholar] [CrossRef] [PubMed]
- Jackman, K.A.; Brait, V.H.; Wang, Y.; Maghzal, G.J.; Ball, H.J.; McKenzie, G.; De Silva, T.M.; Stocker, R.; Sobey, C.G. Vascular expression, activity and function of indoleamine 2,3-dioxygenase-1 following cerebral ischaemia-reperfusion in mice. Naunyn Schmiedebergs Arch. Pharmacol. 2011, 383, 471–481. [Google Scholar] [CrossRef] [PubMed]
- Wang, Y. Stage 1 hypertension and risk of cardiovascular disease mortality in United States adults with or without diabetes. J. Hypertens. 2022, 40, 794–803. [Google Scholar] [CrossRef]
- Lyu, Y.; Xu, Q.; Liu, J. Exploring the medical decision-making patterns and influencing factors among the general Chinese public: a binary logistic regression analysis. BMC Public Health 2024, 24, 887. [Google Scholar] [CrossRef]
- Luckett, D.J.; Laber, E.B.; El-Kamary, S.S.; Fan, C.; Jhaveri, R.; Perou, C.M.; Shebl, F.M.; Kosorok, M.R. Receiver operating characteristic curves and confidence bands for support vector machines. Biometrics 2021, 77, 1422–1430. [Google Scholar] [CrossRef]
- Unal, I. Defining an Optimal Cut-Point Value in ROC Analysis: An Alternative Approach. Comput. Math. Methods Med. 2017, 2017, 3762651. [Google Scholar] [CrossRef] [PubMed]
- Harrell, F.E. Cox Proportional Hazards Regression Model. In Regression Modeling Strategies: With Applications to Linear Models, Logistic Regression, and Survival Analysis, Harrell, F.E., Ed.; Springer New York: New York, NY, 2001; pp. 465–507. [Google Scholar]
- Goel, M.K.; Khanna, P.; Kishore, J. Understanding survival analysis: Kaplan-Meier estimate. Int J Ayurveda Res 2010, 1, 274–278. [Google Scholar] [CrossRef] [PubMed]
- West, R.M. Best practice in statistics: The use of log transformation. Ann. Clin. Biochem. 2022, 59, 162–165. [Google Scholar] [CrossRef]
- Arnold, B.F.; Hogan, D.R.; Colford, J.M.; Hubbard, A.E. Simulation methods to estimate design power: an overview for applied research. BMC Med. Res. Methodol. 2011, 11, 94. [Google Scholar] [CrossRef]
- Wilson, D.T.; Hooper, R.; Brown, J.; Farrin, A.J.; Walwyn, R.E. Efficient and flexible simulation-based sample size determination for clinical trials with multiple design parameters. Stat. Methods Med. Res. 2021, 30, 799–815. [Google Scholar] [CrossRef] [PubMed]
- American Diabetes Association Professional Practice Committee. 10. Cardiovascular Disease and Risk Management: Standards of Medical Care in Diabetes-2022. Diabetes Care 2022, 45, S144–s174. [Google Scholar] [CrossRef]
- Šimundić, A.M. Measures of Diagnostic Accuracy: Basic Definitions. Ejifcc 2009, 19, 203–211. [Google Scholar]
- Shreffler, J.; Huecker, M. Diagnostic testing accuracy: Sensitivity, specificity, predictive values and likelihood ratios. StatPearls. 2023. Availbe from https://www.ncbi.nlm.nih.gov/books/NBK557491/. Accessed on 5 April 2024, 5 April.
- Eusebi, P. Diagnostic Accuracy Measures. Cerebrovasc. Dis. 2013, 36, 267–272. [Google Scholar] [CrossRef]
- Ialongo, C. Confidence interval for quantiles and percentiles. Biochem. Med. (Zagreb) 2019, 29, 010101. [Google Scholar] [CrossRef]
- Wang, Y.; Zhang, W.; Qian, T.; Sun, H.; Xu, Q.; Hou, X.; Hu, W.; Zhang, G.; Drummond, G.R.; Sobey, C.G.; et al. Reduced renal function may explain the higher prevalence of hyperuricemia in older people. Sci. Rep. 2021, 11, 1302. [Google Scholar] [CrossRef] [PubMed]
- Muggah, E.; Graves, E.; Bennett, C.; Manuel, D.G. Ascertainment of chronic diseases using population health data: a comparison of health administrative data and patient self-report. BMC Public Health 2013, 13, 16. [Google Scholar] [CrossRef] [PubMed]
- Lix, L.M.; Yogendran, M.S.; Shaw, S.Y.; Burchill, C.; Metge, C.; Bond, R. Population-based data sources for chronic disease surveillance. Chronic Dis. Can. 2008, 29, 31–38. [Google Scholar] [CrossRef]
- Huerta, J.M.; Tormo, M.J.; Egea-Caparrós, J.M.; Ortolá-Devesa, J.B.; Navarro, C. Accuracy of self-reported diabetes, hypertension and hyperlipidemia in the adult Spanish population. DINO study findings. Rev. Esp. Cardiol. 2009, 62, 143–152. [Google Scholar] [CrossRef]
- Guo, H.; Yu, Y.; Ye, Y.; Zhou, S. Accuracy of Self-Reported Hypertension, Diabetes, and Hyperlipidemia among Adults of Liwan, Guangzhou, China. Iran J. Public Health 2020, 49, 1622–1630. [Google Scholar] [CrossRef]
- Li, H.L.; Fang, J.; Zhao, L.G.; Liu, D.K.; Wang, J.; Han, L.H.; Xiang, Y.B. Personal Characteristics Effects on Validation of Self-reported Type 2 Diabetes From a Cross-sectional Survey Among Chinese Adults. J. Epidemiol. 2020, 30, 516–521. [Google Scholar] [CrossRef] [PubMed]
- Moradinazar, M.; Pasdar, Y.; Najafi, F.; Shakiba, E.; Hamzeh, B.; Samadi, M.; Mirzaei, M.; Dobson, A.J. Validity of self-reported diabetes varies with sociodemographic charecteristics: Example from Iran. Clinical Epidemiology and Global Health 2020, 8, 70–75. [Google Scholar] [CrossRef]
- de Vegt, F.; Dekker, J.M.; Ruhé, H.G.; Stehouwer, C.D.; Nijpels, G.; Bouter, L.M.; Heine, R.J. Hyperglycaemia is associated with all-cause and cardiovascular mortality in the Hoorn population: the Hoorn Study. Diabetologia 1999, 42, 926–931. [Google Scholar] [CrossRef] [PubMed]
- Rong, L.; Cheng, X.; Yang, Z.; Gong, Y.; Li, C.; Yan, S.; Sun, B. One-hour plasma glucose as a long-term predictor of cardiovascular events and all-cause mortality in a Chinese older male population without diabetes: A 20-year retrospective and prospective study. Front Cardiovasc Med 2022, 9, 947292. [Google Scholar] [CrossRef]
- Gabir, M.M.; Hanson, R.L.; Dabelea, D.; Imperatore, G.; Roumain, J.; Bennett, P.H.; Knowler, W.C. Plasma glucose and prediction of microvascular disease and mortality: evaluation of 1997 American Diabetes Association and 1999 World Health Organization criteria for diagnosis of diabetes. Diabetes Care 2000, 23, 1113–1118. [Google Scholar] [CrossRef] [PubMed]
- Silbernagel, G.; Sourij, H.; Grammer, T.B.; Kleber, M.E.; Hartaigh, B.; Winkelmann, B.R.; Boehm, B.O.; März, W. Isolated post-challenge hyperglycaemia predicts increased cardiovascular mortality. Atherosclerosis 2012, 225, 194–199. [Google Scholar] [CrossRef] [PubMed]
- Nakagami, T. Hyperglycaemia and mortality from all causes and from cardiovascular disease in five populations of Asian origin. Diabetologia 2004, 47, 385–394. [Google Scholar] [CrossRef] [PubMed]
- DECODE Study Group. Glucose tolerance and cardiovascular mortality: comparison of fasting and 2-hour diagnostic criteria. Arch. Intern. Med. 2001, 161, 397–405. [Google Scholar] [CrossRef]
- Rodriguez, B.L.; Abbott, R.D.; Fujimoto, W.; Waitzfelder, B.; Chen, R.; Masaki, K.; Schatz, I.; Petrovitch, H.; Ross, W.; Yano, K.; et al. The American Diabetes Association and World Health Organization classifications for diabetes: their impact on diabetes prevalence and total and cardiovascular disease mortality in elderly Japanese-American men. Diabetes Care 2002, 25, 951–955. [Google Scholar] [CrossRef]
- Metter, E.J.; Windham, B.G.; Maggio, M.; Simonsick, E.M.; Ling, S.M.; Egan, J.M.; Ferrucci, L. Glucose and insulin measurements from the oral glucose tolerance test and mortality prediction. Diabetes Care 2008, 31, 1026–1030. [Google Scholar] [CrossRef] [PubMed]
- Brunner, E.J.; Shipley, M.J.; Witte, D.R.; Fuller, J.H.; Marmot, M.G. Relation Between Blood Glucose and Coronary Mortality Over 33 Years in the Whitehall Study. Diabetes Care 2006, 29, 26–31. [Google Scholar] [CrossRef] [PubMed]
- Lu, W.; Resnick, H.E.; Jain, A.K.; Adams-Campbell, L.L.; Jablonski, K.A.; Gottlieb, A.M.; Robbins, D.C.; Howard, B.V. Effects of isolated post-challenge hyperglycemia on mortality in American Indians: the Strong Heart Study. Ann. Epidemiol. 2003, 13, 182–188. [Google Scholar] [CrossRef] [PubMed]
- Stengård, J.H.; Tuomilehto, J.; Pekkanen, J.; Kivinen, P.; Kaarsalo, E.; Nissinen, A.; Karvonen, M.J. Diabetes mellitus, impaired glucose tolerance and mortality among elderly men: the Finnish cohorts of the Seven Countries Study. Diabetologia 1992, 35, 760–765. [Google Scholar] [CrossRef] [PubMed]
- Jiang, C.Q.; Xu, L.; Lam, T.H.; Jin, Y.L.; Sen Zhang, W.; Zhu, F.; Thomas, G.N.; Cheng, K.K. Glycemic Measures and Risk of Mortality in Older Chinese: The Guangzhou Biobank Cohort Study. The Journal of Clinical Endocrinology & Metabolism 2019, 105, e181–e190. [Google Scholar] [CrossRef]
- Zhou, X.H.; Qiao, Q.; Zethelius, B.; Pyörälä, K.; Söderberg, S.; Pajak, A.; Stehouwer, C.D.; Heine, R.J.; Jousilahti, P.; Ruotolo, G.; et al. Diabetes, prediabetes and cancer mortality. Diabetologia 2010, 53, 1867–1876. [Google Scholar] [CrossRef]
- Sievers, M.L.; Bennett, P.H.; Nelson, R.G. Effect of glycemia on mortality in Pima Indians with type 2 diabetes. Diabetes 1999, 48, 896–902. [Google Scholar] [CrossRef]
Figure 1.
Flow diagram of the study participants. 2-h PGOGTT@4–7.9h, 2-h plasma glucose during OGTT conducted in the postprandial period between 4 and 7.9 h; 2-h PGOGTT@fasting, 2-h plasma glucose during OGTT conducted in the fasting period (fasting time, ≥ 8 h); BMI, body mass index; HbA1c, hemoglobin A1c; HDL, high-density lipoprotein; NHANES III, the third National Health and Nutrition Examination Survey; OGTT, oral glucose tolerance test; PG, plasma glucose; SBP, systolic blood pressure.
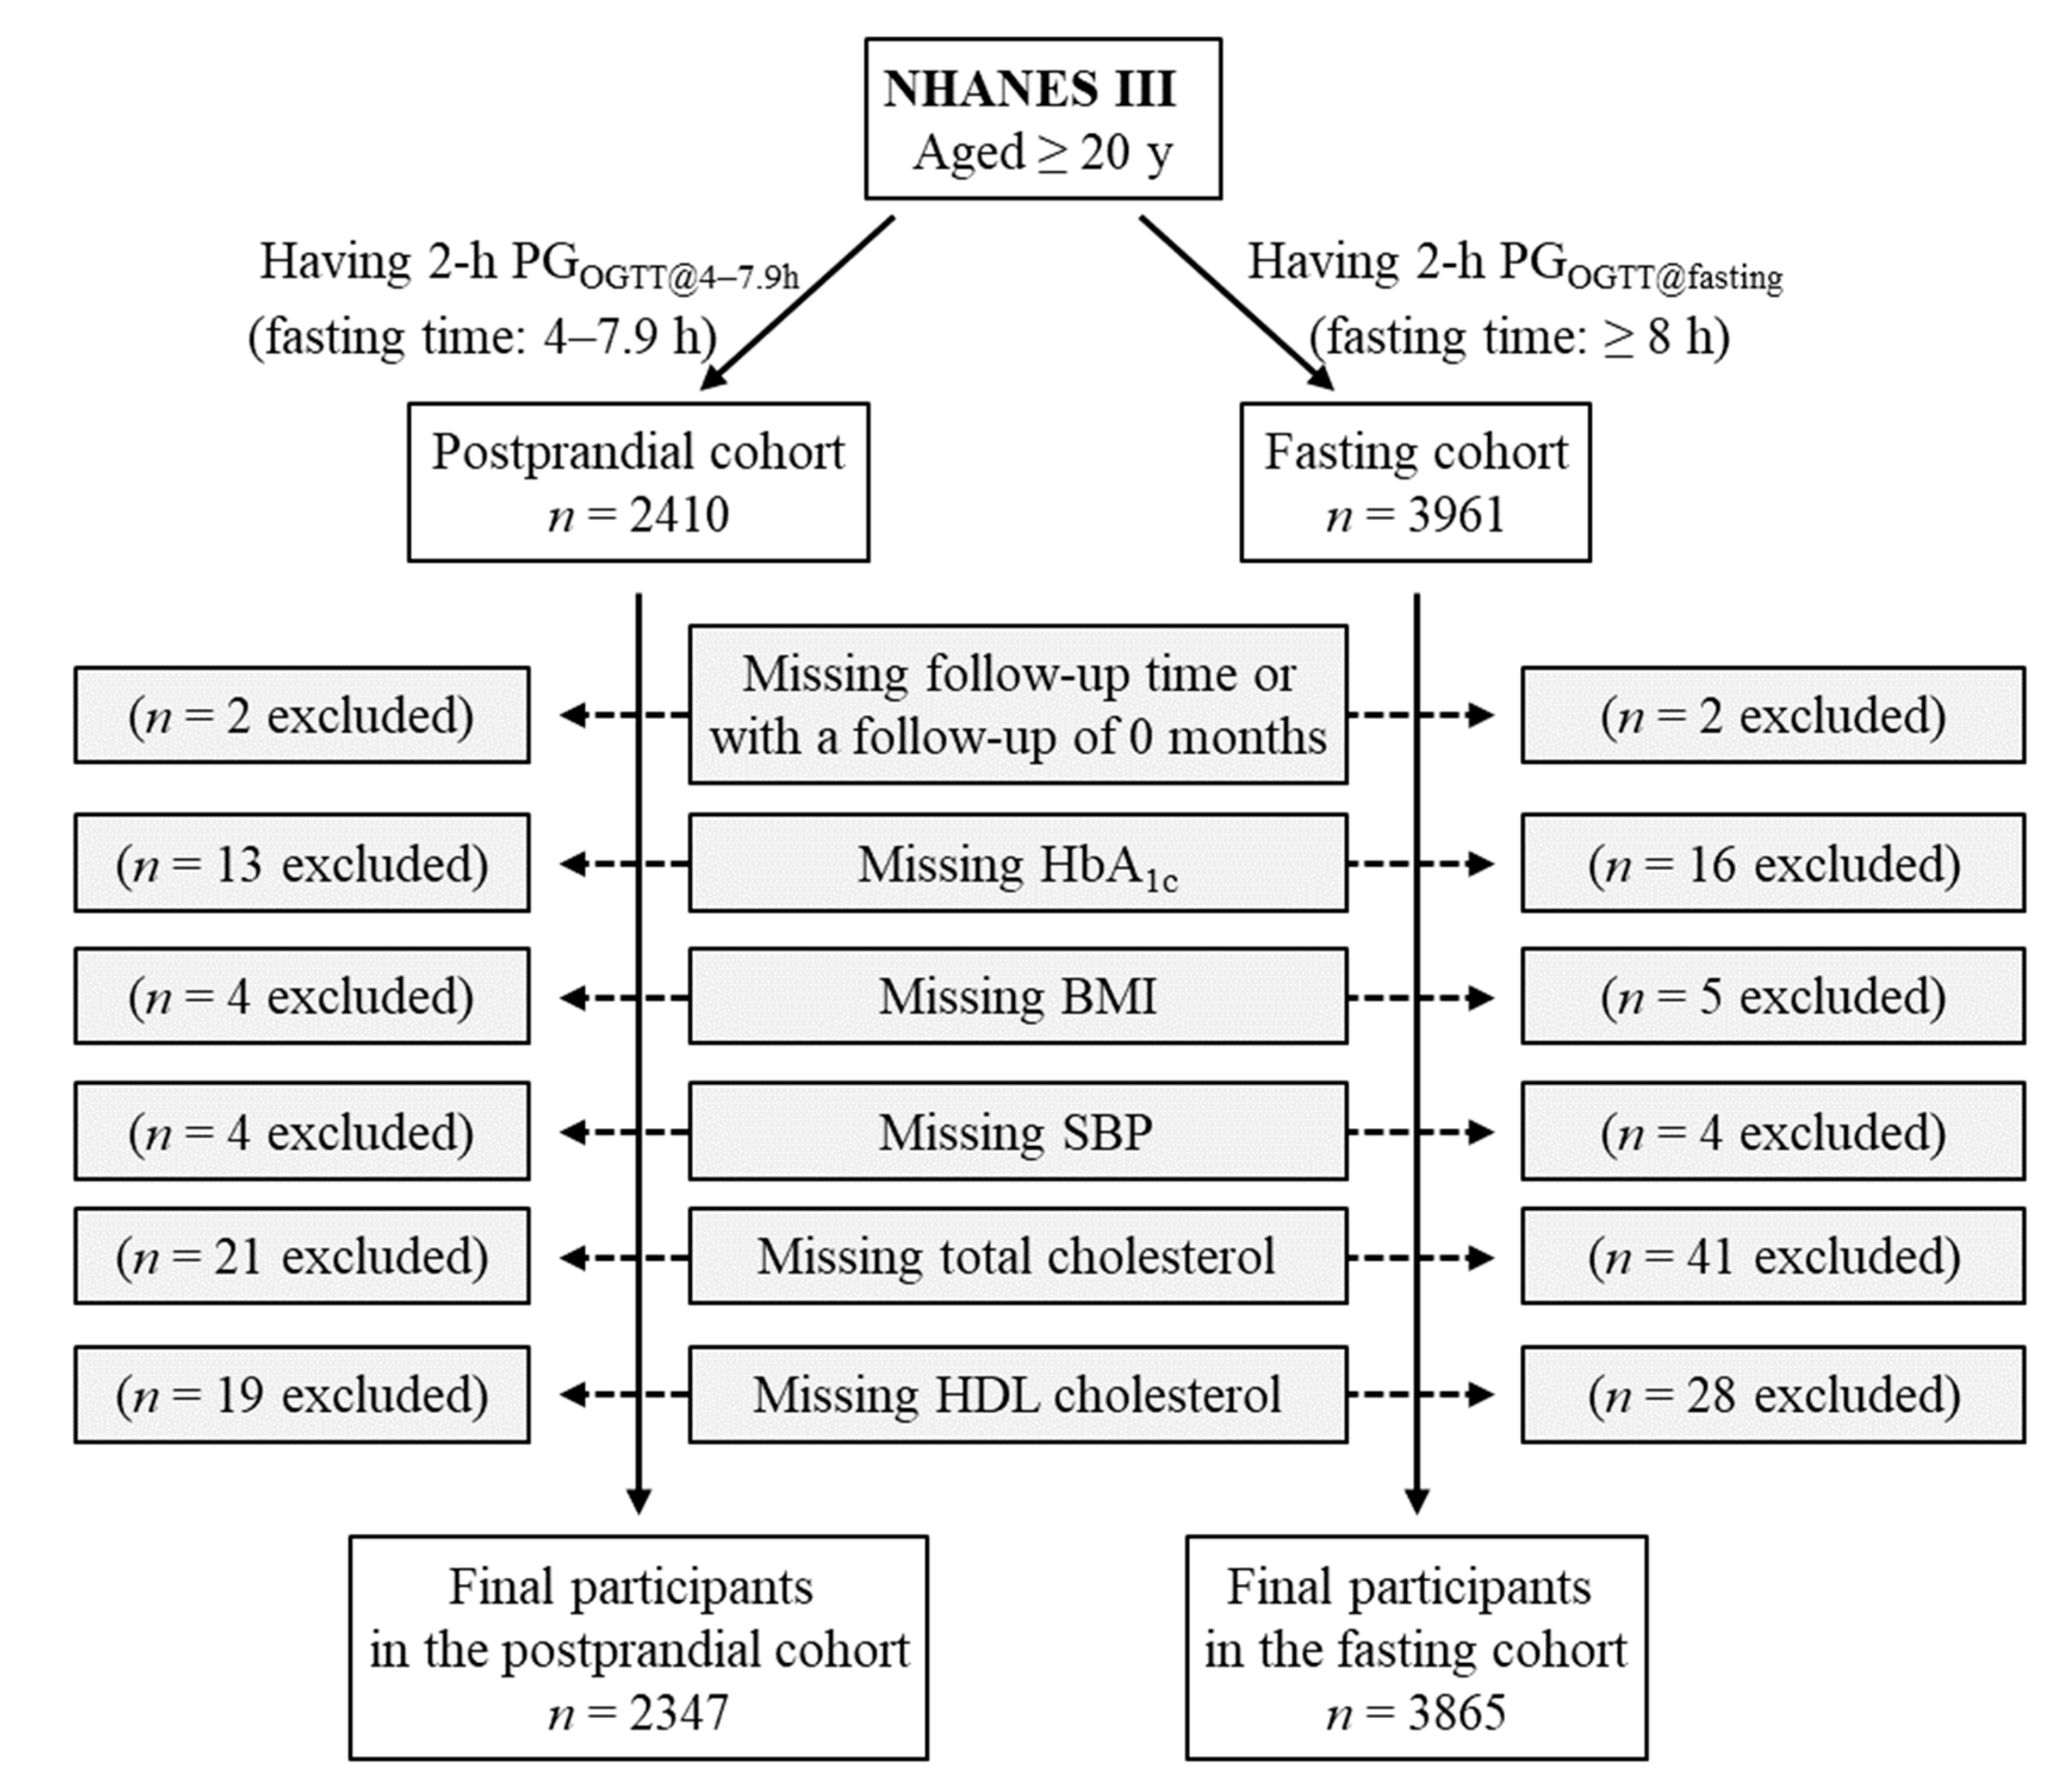
Figure 2.
ROC curves of 2-h plasma glucose to classify diabetes, defined as HbA1c ≥ 6.5%. A, OGTT was conducted in the postprandial period between 4 and 7.9 h. The optimal cutoff was 206.8 mg/dL, with a sensitivity of 84.8%, specificity of 86.1%, and an area under the curve (AUC) of 0.92. B, OGTT was conducted in the fasting period (fasting time, ≥ 8 h). The optimal cutoff was 203.6 mg/dL, with a sensitivity of 85.8%, specificity of 93.1%, and an AUC of 0.95. HbA1c, hemoglobin A1c; OGTT, oral glucose tolerance test; ROC, receiver operating characteristic.
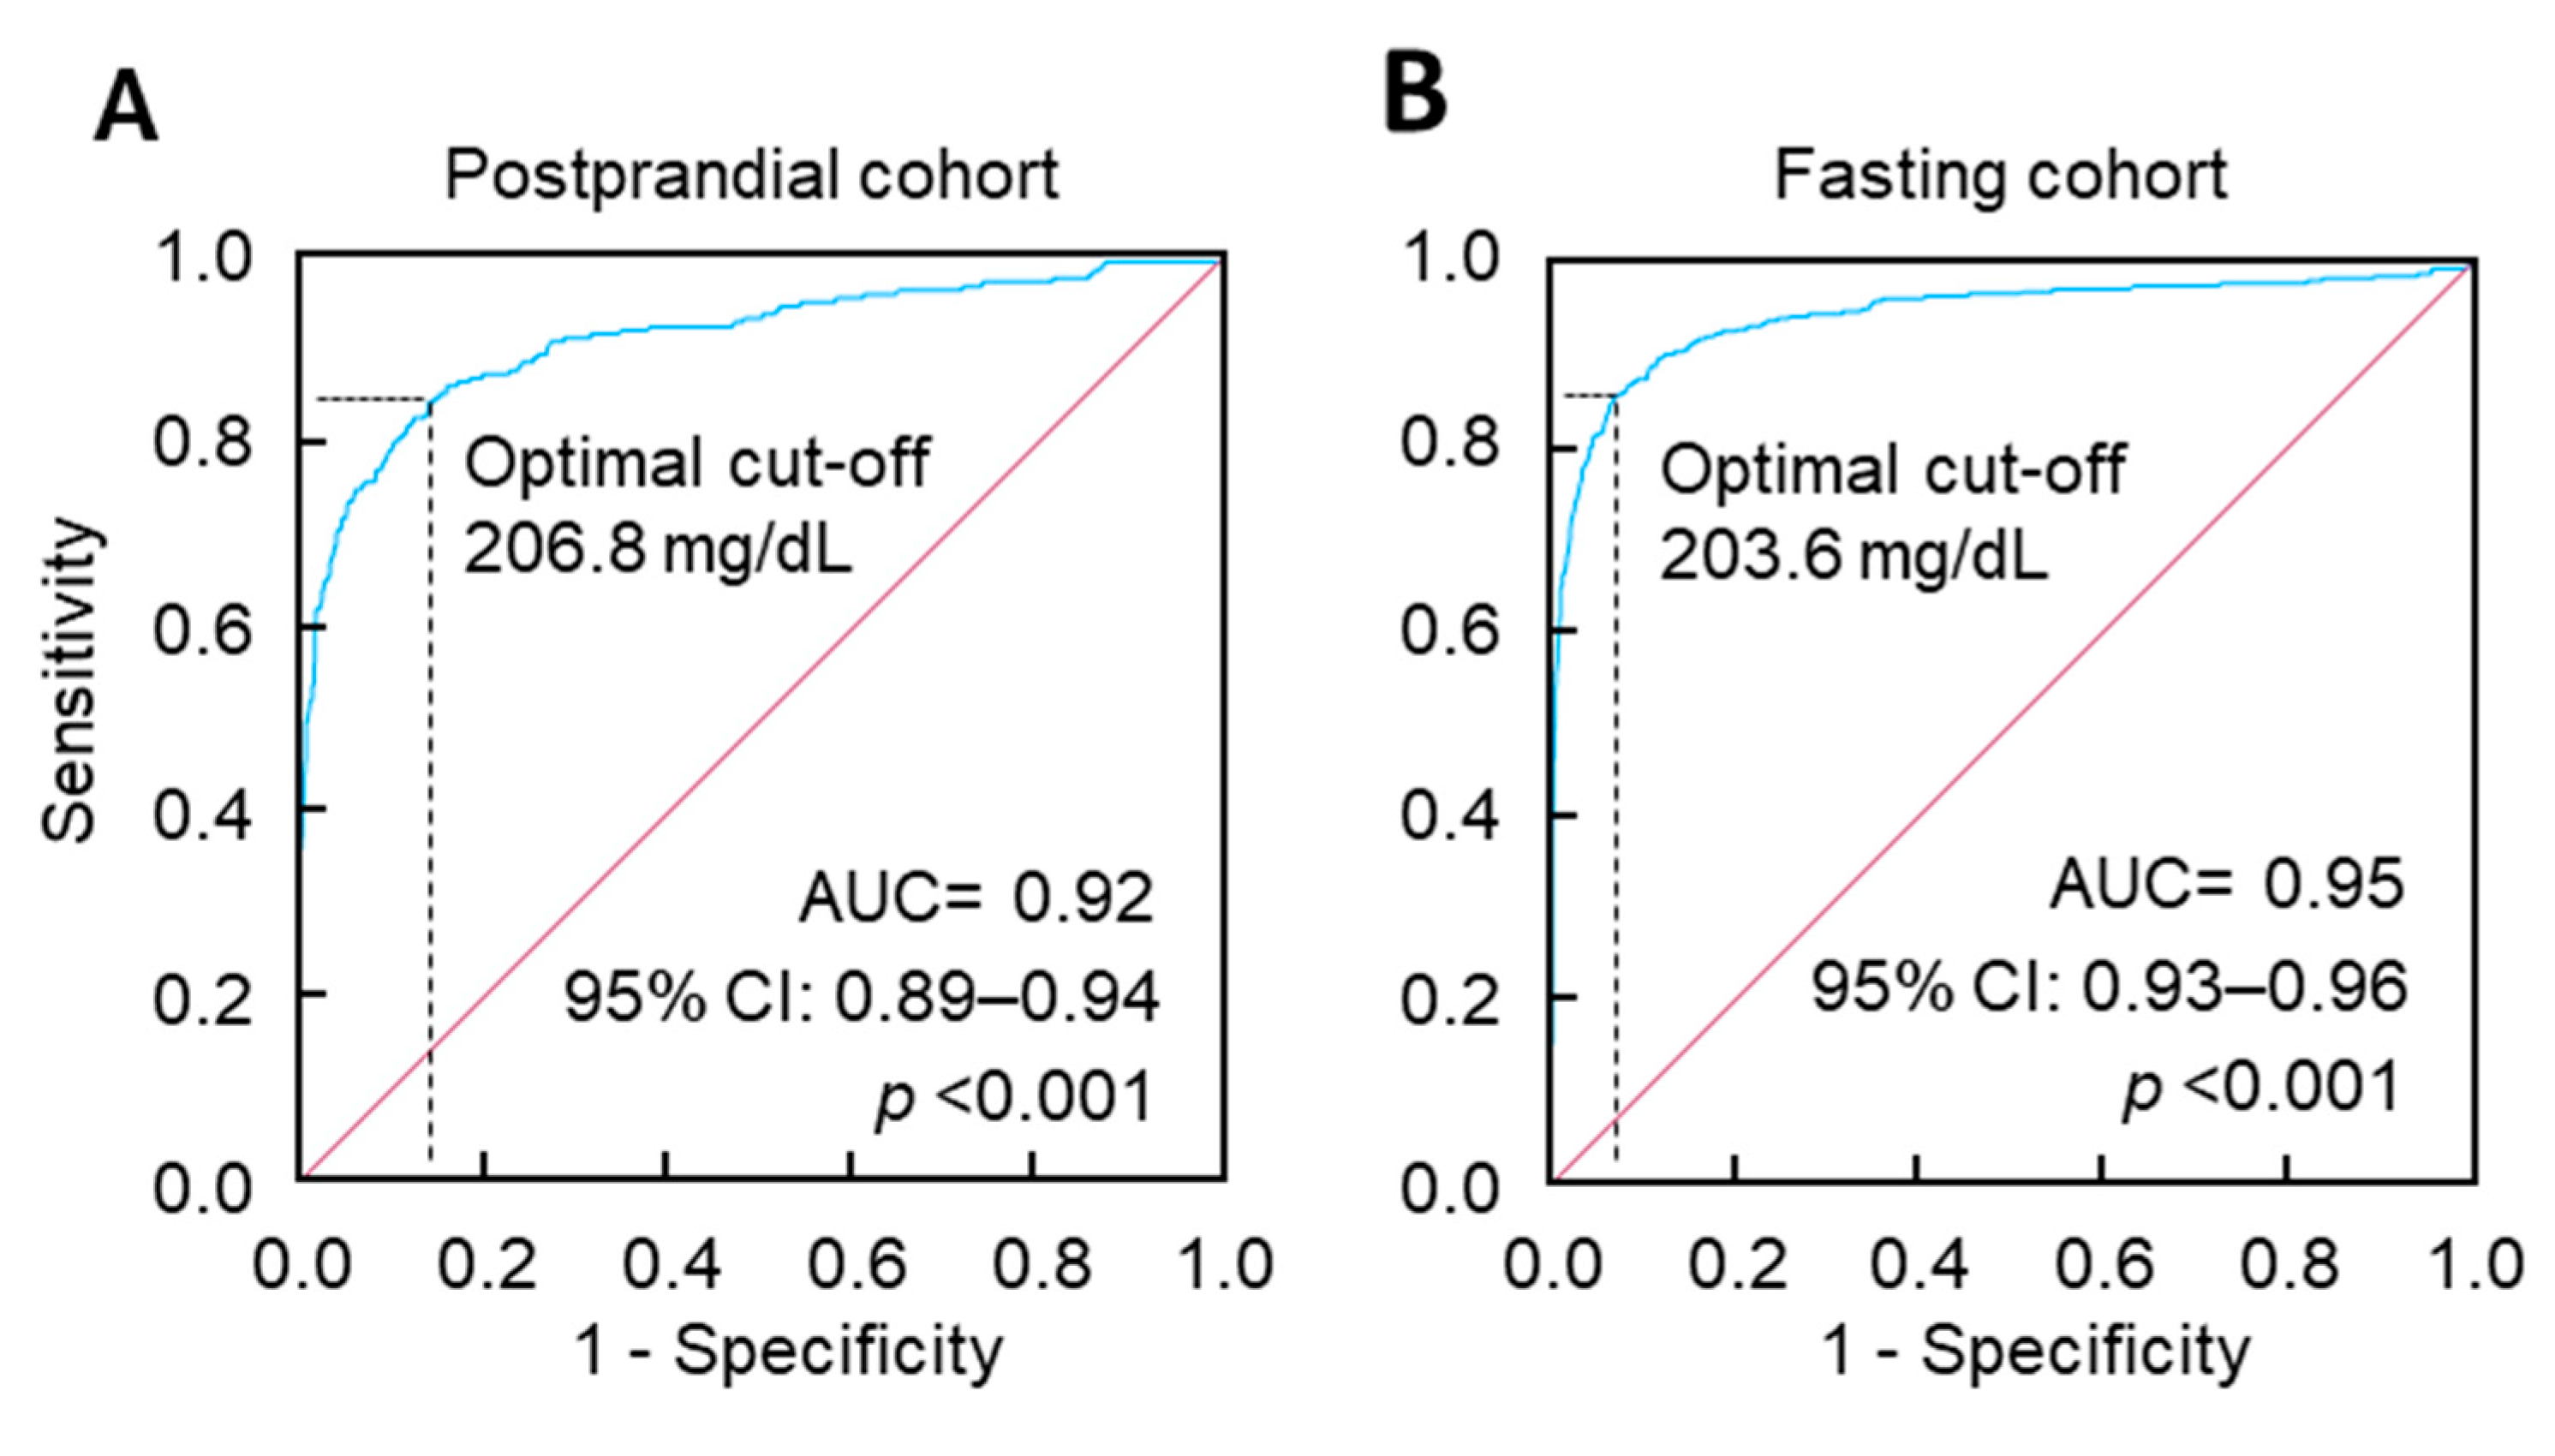
Figure 3.
ROC curves of 2-h plasma glucose to classify diabetes, defined as a self-reported diagnosis. A, OGTT was conducted in the postprandial period between 4 and 7.9 h. The optimal cutoff was 221.1 mg/dL, with a sensitivity of 79.0%, specificity of 88.7%, and an area under the curve (AUC) of 0.89. B, OGTT was conducted in the fasting period (fasting time, ≥ 8 h). The optimal cutoff was 185.6 mg/dL, with a sensitivity of 79.5%, specificity of 87.0%, and an AUC of 0.88. OGTT, oral glucose tolerance test; ROC, receiver operating characteristic.
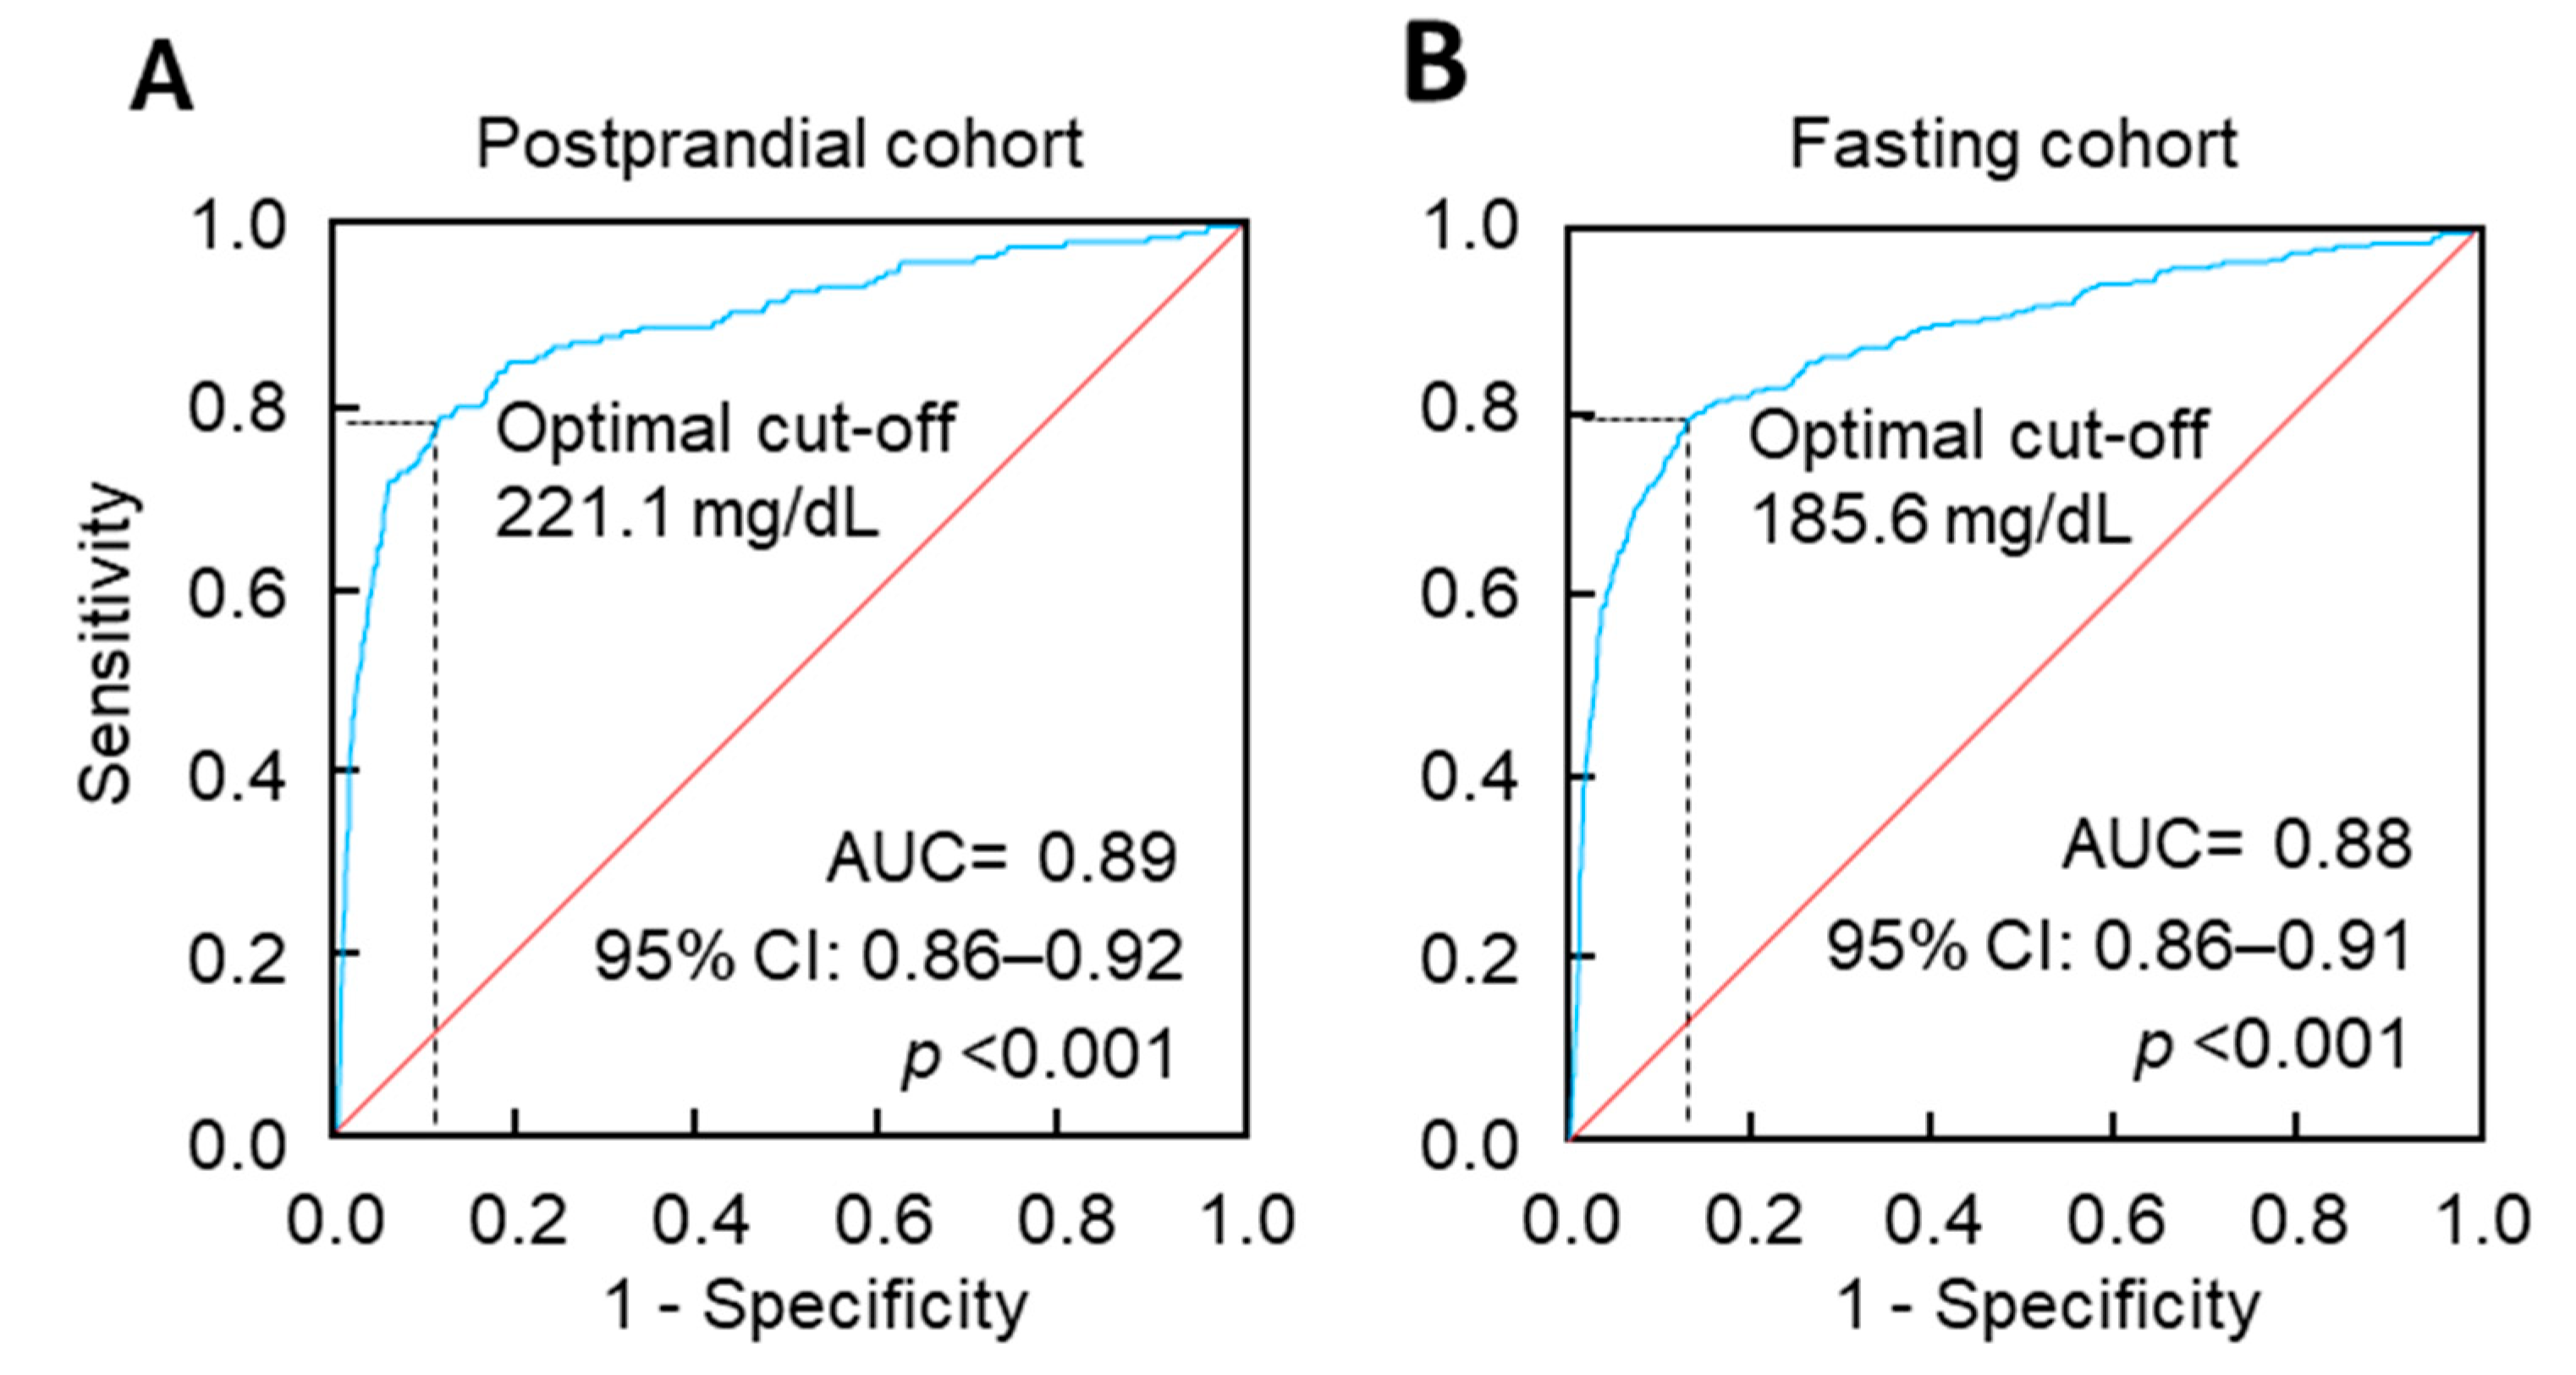
Figure 4.
Kaplan–Meier survival curves of 2-h plasma glucose for diabetes mortality. A, The postprandial cohort; B, The fasting cohort. The 2-h plasma glucose during OGTT was stratified as ≥ versus < 200 mg/dL. OGTT, oral glucose tolerance test.
Figure 4.
Kaplan–Meier survival curves of 2-h plasma glucose for diabetes mortality. A, The postprandial cohort; B, The fasting cohort. The 2-h plasma glucose during OGTT was stratified as ≥ versus < 200 mg/dL. OGTT, oral glucose tolerance test.
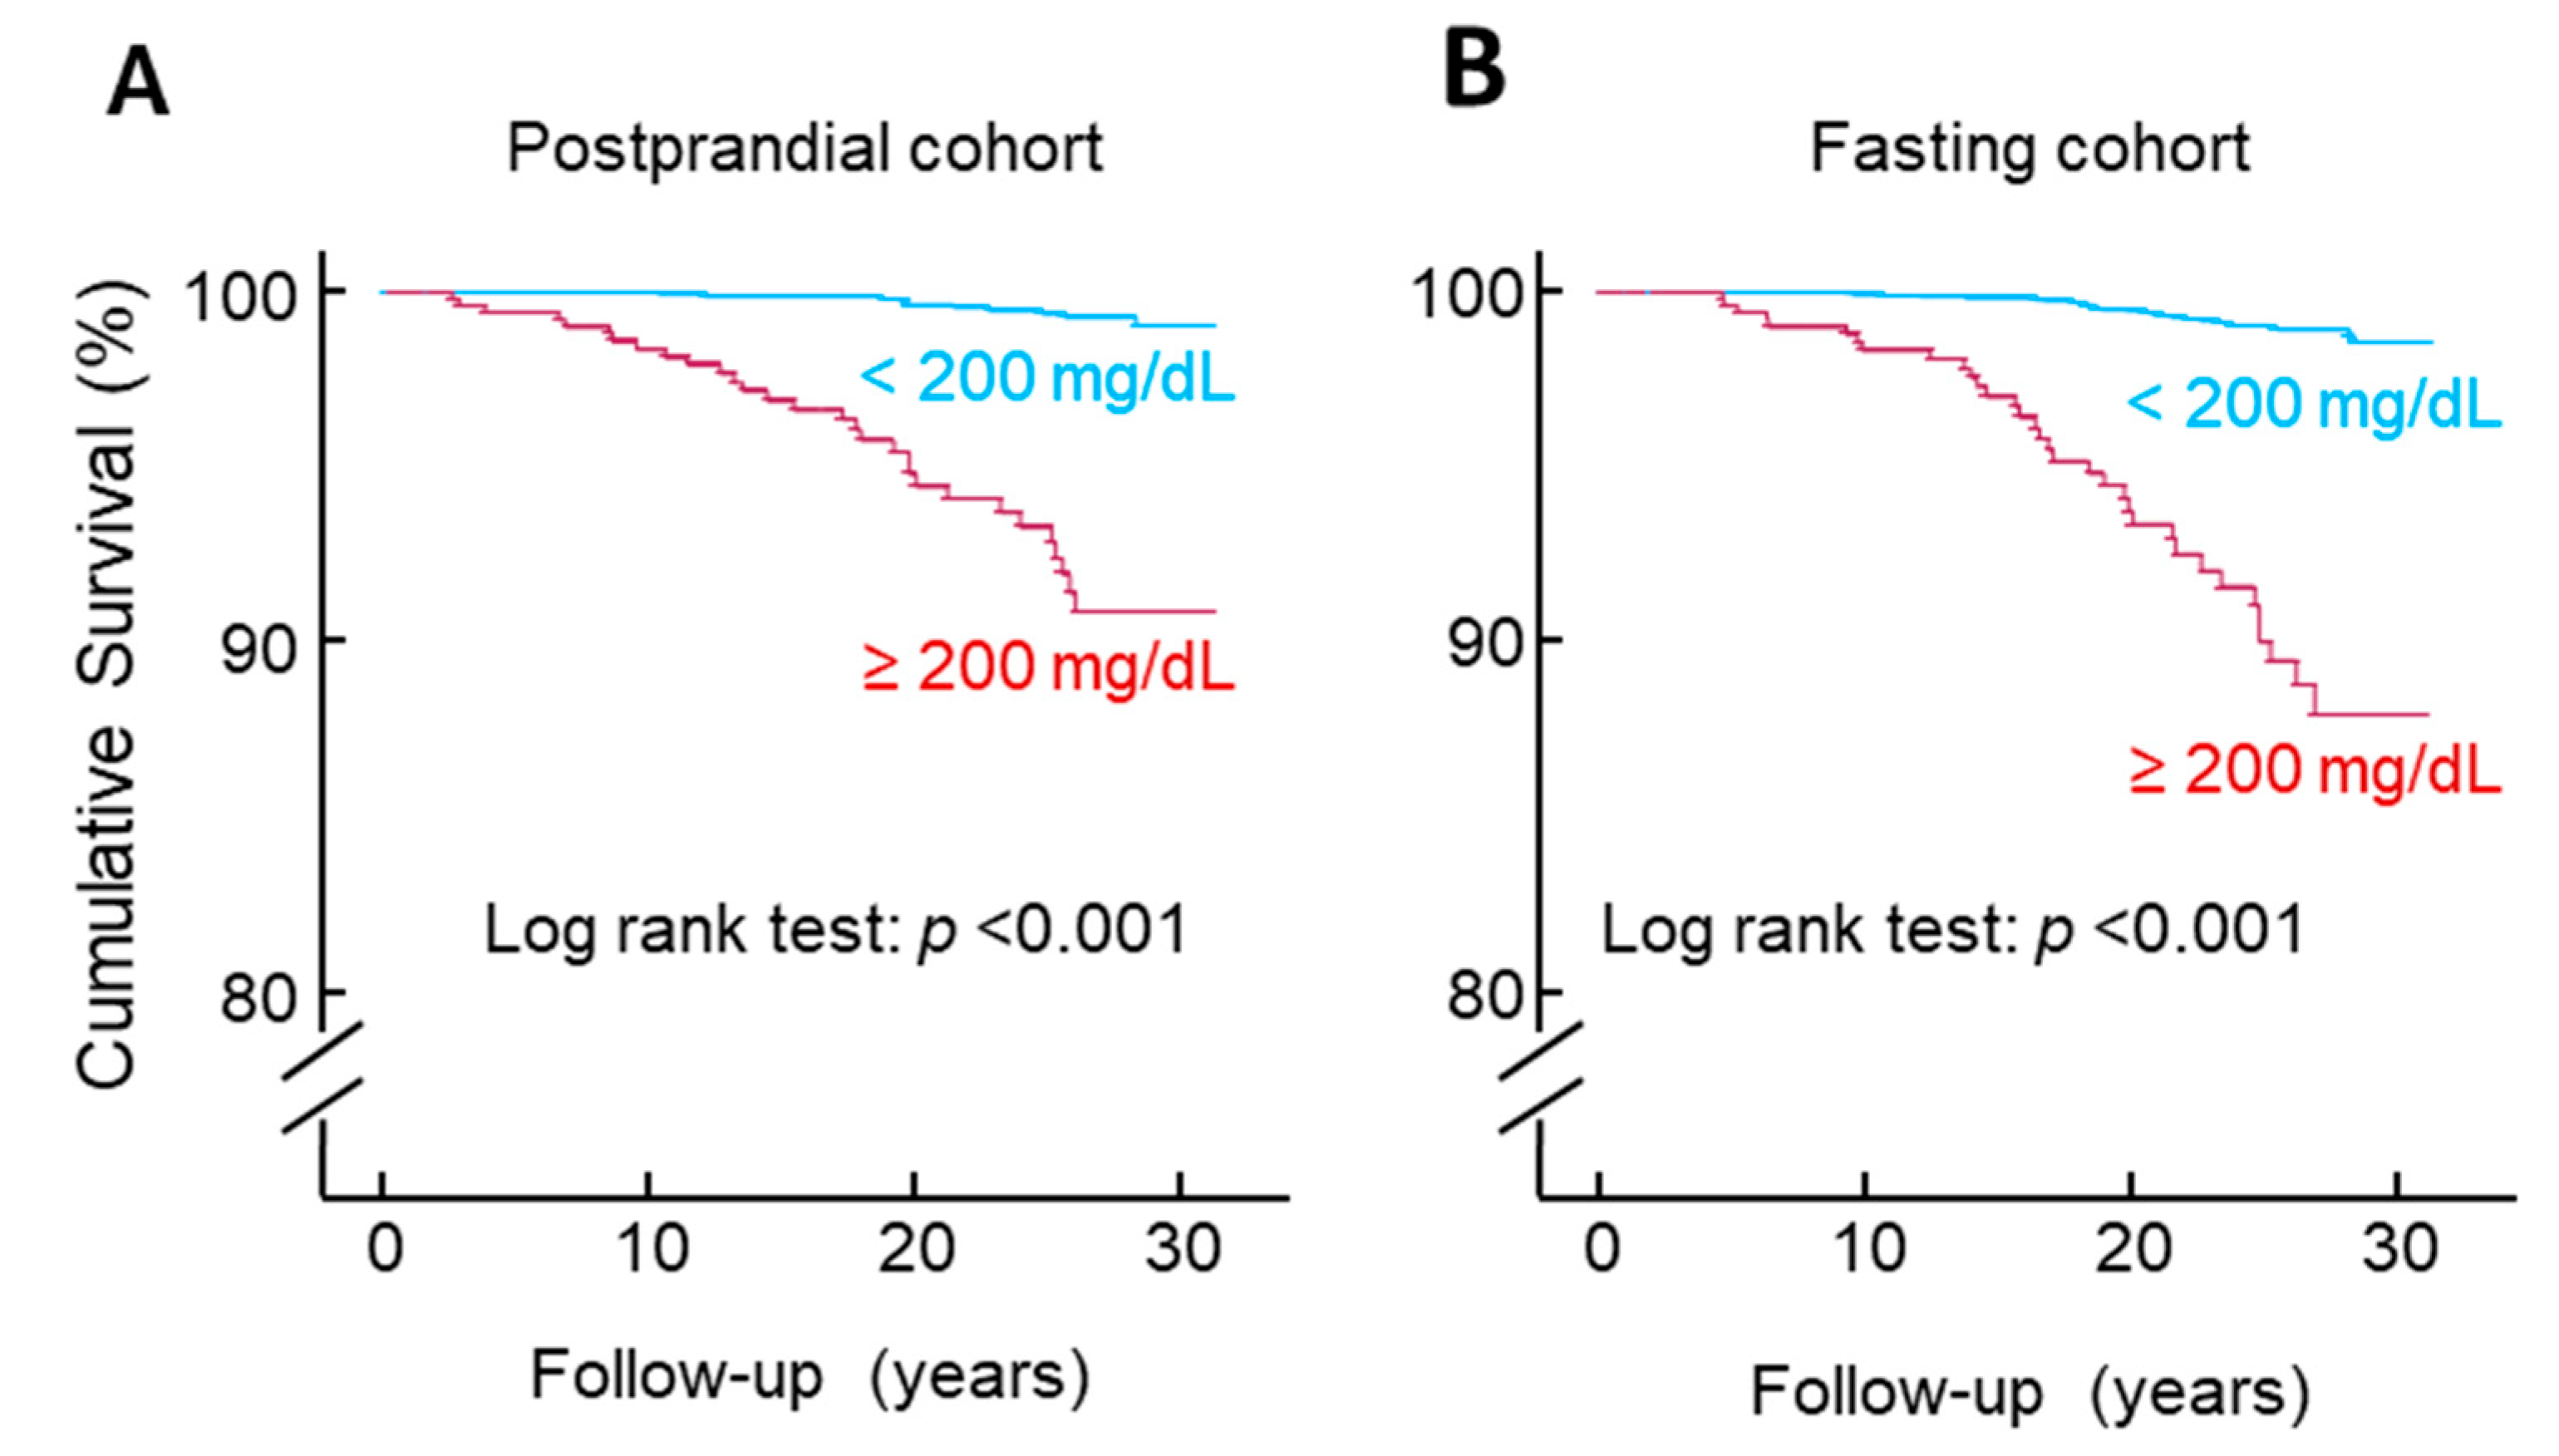

Table 1.
Baseline characteristics of the postprandial cohort (fasting time, 4–7.9 h).
| 2-h PGOGTT@4–7.9h | All | p | ||
| < 200 mg/dL | ≥ 200 mg/dL | |||
| Sample size | 1797 | 550 | 2347 | NA |
| Age, y, mean (SD) | 55 (11) | 61 (9) | 56 (11) | <0.001 |
| Sex (male), n (%) | 869 (48.4) | 246 (44.7) | 1115 (47.5) | 0.14 |
| 2-h PGOGTT@4–7.9h, mg/dL, median (IQR) | 131 (105–158) | 247 (218–303) | 147 (114–196) | <0.001 |
| HbA1c, %, median (IQR) | 5.4 (5.1–5.7) | 6.0 (5.4–7.1)) | 5.5 (5.1–5.8) | <0.001 |
| BMI, kg/m2, median (IQR) | 27 (24–30) | 28 (25–32) | 27 (24–31) | <0.001 |
| TC, mg/dL, median (IQR) | 212 (185–242) | 226 (199–253) | 215 (189–245) | <0.001 |
| HDL-C, mg/dL, median (IQR) | 49 (40–60) | 47 (38–57) | 49 (40–59) | 0.003 |
| SBP, mm Hg, median (IQR) | 127 (117–140) | 136 (126–151) | 129 (118–142) | <0.001 |
| Ethnicity, n (%) | ||||
| Non-Hispanic white | 928 (51.6) | 245 (44.5) | 1173 (50) | <0.001 |
| Non-Hispanic black | 408 (22.7) | 100 (18.2) | 508 (21.6) | |
| Hispanic | 436 (24.3) | 198 (36.0) | 634 (27.0) | |
| Other | 25 (1.4) | 7 (1.3) | 32 (1.4) | |
| Education, n (%) | ||||
| <High school | 674 (37.5) | 276 (50.2) | 950 (40.5) | <0.001 |
| High school | 551 (30.7) | 151 (27.5) | 702 (29.9) | |
| >High school | 561 (31.2) | 120 (21.8) | 681 (29.0) | |
| Unknown | 11 (0.6) | 3 (0.5) | 14 (0.6) | |
| Poverty–income ratio, n (%) | ||||
| <130% | 372 (20.7) | 139 (25.3) | 511 (21.8) | 0.002 |
| 130%–349% | 746 (41.5) | 236 (42.9) | 982 (41.8) | |
| ≥350% | 553 (30.8) | 127 (23.1) | 680 (29.0) | |
| Unknown | 126 (7.0) | 48 (8.7) | 174 (7.4) | |
| Physical activity, n (%) | ||||
| Active | 667 (37.1) | 192 (34.9) | 859 (36.6) | 0.56 |
| Insufficiently active | 796 (44.3) | 247 (44.9) | 1043 (44.4) | |
| Inactive | 334 (18.6) | 111 (20.2) | 445 (19.0) | |
| Alcohol consumption, n (%) | ||||
| 0 drinks/week | 277 (15.4) | 121 (22.0) | 398 (17.0) | <0.001 |
| <1 drink/week | 228 (12.7) | 53 (9.6) | 281 (12.0) | |
| 1–6 drinks/week | 345 (19.2) | 71 (12.9) | 416 (17.7) | |
| ≥7 drinks/week | 222 (12.4) | 62 (11.3) | 284 (12.1) | |
| Unknown | 725 (40.3) | 243 (44.2) | 968 (41.2) | |
| Smoking status, n (%) | ||||
| Current smoker | 459 (25.5) | 78 (14.2) | 537 (22.9) | <0.001 |
| Past smoker | 547 (30.4) | 209 (38.0) | 756 (32.2) | |
| Non-smoker | 791 (44.0) | 263 (47.8) | 1054 (44.9) | |
| Survey period, n (%) | ||||
| 1988–1991 | 873 (48.6) | 253 (46.0) | 1126 (48.0) | 0.29 |
| 1991–1994 | 924 (51.4) | 297 (54.0) | 1221 (52.0) | |
| Family history of diabetes, n (%) | ||||
| Yes | 787 (43.8) | 290 (52.7) | 1077 (45.9) | <0.001 |
| No | 990 (55.1) | 249 (45.3) | 1239 (52.8) | |
| Unknown | 20 (1.1) | 11 (2.0) | 31 (1.3) | |
| Selt reported diagnosis, n (%) | ||||
| Yes | 29 (1.6) | 152 (27.6) | 181 (7.7) | <0.001 |
| No | 1767 (98.3) | 398 (72.4) | 2165 (92.2) | |
| Unknown | 1 (0.1) | 0 (0.0) | 1 (0.0) | |
Abbreviations: 2-h PGOGTT@4–7.9h, 2-hour plasma glucose during OGTT which was conducted in the postprandial period between 4 and 7.9 h; BMI, body mass index; HbA1c, hemoglobin A1c; HDL-C, high-density lipoprotein cholesterol; IQR, interquartile range; NA, not applicable; OGTT, oral glucose tolerance test; SBP, systolic blood pressure; SD, standard deviation; TC, total cholesterol.
Table 2.
Baseline characteristics of the fasting cohort (fasting time, ≥8 h).
| 2-h PGOGTT@fasting | All | p | ||
| < 200 mg/dL | ≥ 200 mg/dL | |||
| Sample size | 3287 | 578 | 3865 | NA |
| Age, y, mean (SD) | 55 (10) | 60 (9) | 56 (10) | <0.001 |
| Sex (male), n (%) | 1614 (49.1) | 292 (50.5) | 1906 (49.3) | 0.53 |
| 2-h PGOGTT@fasting, mg/dL, median (IQR) | 114 (93–140) | 275 (224–353) | 121 (97–162) | <0.001 |
| HbA1c, %, median (IQR) | 5.4 (5.1–5.7) | 6.7 (5.9–8.4) | 5.5 (5.2–5.9) | <0.001 |
| BMI, kg/m2, median (IQR) | 27 (24–31) | 30 (26–33) | 27 (24–31) | <0.001 |
| TC, mg/dL, median (IQR) | 213 (188–240) | 222 (194–251) | 214 (189–242) | <0.001 |
| HDL-C, mg/dL, median (IQR) | 49 (40–60) | 44 (36–54) | 48 (39–59) | <0.001 |
| SBP, mm Hg, median (IQR) | 126 (115–139) | 136 (126–150) | 128 (117–141) | <0.001 |
| Ethnicity, n (%) | ||||
| Non-Hispanic white | 1527 (46.5) | 216 (37.4) | 1743 (45.1) | <0.001 |
| Non-Hispanic black | 864 (26.3) | 126 (21.8) | 990 (25.6) | |
| Hispanic | 847 (25.8) | 231 (40.0) | 1078 (27.9) | |
| Other | 49 (1.5) | 5 (0.9) | 54 (1.4) | |
| Education, n (%) | ||||
| <High school | 1350 (41.1) | 332 (57.4) | 1682 (43.5) | <0.001 |
| High school | 977 (29.7) | 150 (26.0) | 1127 (29.2) | |
| >High school | 939 (28.6) | 96 (16.6) | 1035 (26.8) | |
| Unknown | 21 (0.6) | 0 (0) | 21 (0.5) | |
| Poverty–income ratio, n (%) | ||||
| <130% | 766 (23.3) | 197 (34.1) | 963 (24.9) | <0.001 |
| 130%–349% | 1308 (39.8) | 218 (37.7) | 1526 (39.5) | |
| ≥350% | 902 (27.4) | 101 (17.5) | 1003 (26.0) | |
| Unknown | 311 (9.5) | 62 (10.7) | 373 (9.7) | |
| Physical activity, n (%) | ||||
| Active | 1198 (36.4) | 187 (32.4) | 1385 (35.8) | 0.08 |
| Insufficiently active | 1397 (42.5) | 249 (43.1) | 1646 (42.6) | |
| Inactive | 692 (21.1) | 142 (24.6) | 834 (21.6) | |
| Alcohol consumption, n (%) | ||||
| 0 drinks/week | 467 (14.2) | 118 (20.4) | 585 (15.1) | <0.001 |
| <1 drink/week | 391 (11.9) | 50 (8.7) | 441 (11.4) | |
| 1–6 drinks/week | 612 (18.6) | 76 (13.1) | 688 (17.8) | |
| ≥7 drinks/week | 409 (12.4) | 66 (11.4) | 475 (12.3) | |
| Unknown | 1408 (42.8) | 268 (46.4) | 1676 (43.4) | |
| Smoking status, n (%) | ||||
| Current smoker | 910 (27.7) | 112 (19.4) | 1022 (26.4) | <0.001 |
| Past smoker | 1015 (30.9) | 231 (40.0) | 1246 (32.2) | |
| Non-smoker | 1362 (41.4) | 235 (40.7) | 1597 (41.3) | |
| Survey period, n (%) | ||||
| 1988–1991 | 1584 (48.2) | 261 (45.2) | 1845 (47.7) | 0.18 |
| 1991–1994 | 1703 (51.8) | 317 (54.8) | 2020 (52.3) | |
| Family history of diabetes, n (%) | ||||
| Yes | 1435 (43.7) | 309 (53.5) | 1744 (45.1) | <0.001 |
| No | 1814 (55.2) | 262 (45.3) | 2076 (53.7) | |
| Unknown | 38 (1.2) | 7 (1.2) | 45 (1.2) | |
| Selt reported diagnosis, n (%) | ||||
| Yes | 76 (2.3) | 212 (36.7) | 288 (7.5) | <0.001 |
| No | 3207 (97.6) | 365 (63.1) | 3572 (92.4) | |
| Unknown | 4 (0.1) | 1 (0.2) | 5 (0.1) | |
Abbreviations: 2-h PGOGTT@fasting, 2-hour plasma glucose during OGTT which was conducted in the fasting period (fasting time, ≥ 8 h); BMI, body mass index; HbA1c, hemoglobin A1c; HDL-C, high-density lipoprotein cholesterol; IQR, interquartile range; NA, not applicable; OGTT, oral glucose tolerance test; SBP, systolic blood pressure; SD, standard deviation; TC, total cholesterol.
Table 3.
Association of 2-h plasma glucose during OGTT1 (independent variable) with HbA1c1 (dependent variable)
Table 3.
Association of 2-h plasma glucose during OGTT1 (independent variable) with HbA1c1 (dependent variable)
| Models | 2-h PGOGTT@4–7.9h | 2-h PGOGTT@fasting | ||
| β | p | β | p | |
| Model 1 | 0.544 | <0.001 | 0.603 | <0.001 |
| Model 2 | 0.545 | <0.001 | 0.590 | <0.001 |
| Model 3 | 0.530 | <0.001 | 0.578 | <0.001 |
| Model 4 | 0.537 | <0.001 | 0.583 | <0.001 |
| Model 5 | 0.533 | <0.001 | 0.578 | <0.001 |
| Model 6 | 0.530 | <0.001 | 0.574 | <0.001 |
2-h PGOGTT@4–7.9h, 2-hour plasma glucose during OGTT which was conducted in the postprandial period between 4 and 7.9 h; 2-h PGOGTT@fasting, 2-hour plasma glucose during OGTT which was conducted in the fasting period (fasting time, ≥ 8 h); HbA1c, hemoglobin A1c; OGTT, oral glucose tolerance test. 1 Natural log-transformed. Model 1 was not adjusted; Model 2 was adjusted for age, sex, and ethnicity; Model 3 was adjusted for all the factors in Model 2 plus body mass index, poverty–income ratio, and education; Model 4 was adjusted for all the factors in Model 3 plus physical activity, alcohol consumption, smoking status, and survey period; Model 5 was adjusted for all the factors in Model 4 plus total cholesterol, HDL cholesterol, and systolic blood pressure; and Model 6 was adjusted for all the factors in Model 5 plus family history of diabetes.
Table 4.
Association of 2-h plasma glucose during OGTT (natural log-transformed) with diabetes diagnosis (defined as HbA1c ≥ 6.5%).
Table 4.
Association of 2-h plasma glucose during OGTT (natural log-transformed) with diabetes diagnosis (defined as HbA1c ≥ 6.5%).
| Models | 2-h PGOGTT@4–7.9h | 2-h PGOGTT@fasting | ||||
| OR | 95% CI | p | OR | 95% CI | p | |
| Model 1 | 451 | 229–885 | <0.001 | 402 | 242–669 | <0.001 |
| Model 2 | 589 | 284–1221 | <0.001 | 632 | 357–1119 | <0.001 |
| Model 3 | 563 | 270–1176 | <0.001 | 609 | 341–1090 | <0.001 |
| Model 4 | 695 | 320–1511 | <0.001 | 714 | 390–1305 | <0.001 |
| Model 5 | 688 | 313–1513 | <0.001 | 658 | 359–1207 | <0.001 |
| Model 6 | 687 | 310–1523 | <0.001 | 655 | 356–1204 | <0.001 |
2-h PGOGTT@4–7.9h, 2-hour plasma glucose during OGTT which was conducted in the postprandial period between 4 and 7.9 h; 2-h PGOGTT@fasting, 2-hour plasma glucose during OGTT which was conducted in the fasting period (fasting time, ≥ 8 h); CI, confidence interval; HbA1c, hemoglobin A1c; OGTT, oral glucose tolerance test; OR, odds ratio. Model 1 was not adjusted; Model 2 was adjusted for age, sex, and ethnicity; Model 3 was adjusted for all the factors in Model 2 plus body mass index, poverty–income ratio, and education; Model 4 was adjusted for all the factors in Model 3 plus physical activity, alcohol consumption, smoking status, and survey period; Model 5 was adjusted for all the factors in Model 4 plus total cholesterol, HDL cholesterol, and systolic blood pressure; and Model 6 was adjusted for all the factors in Model 5 plus family history of diabetes.
Table 5.
Association of 2-h plasma glucose (natural log-transformed) with diabetes (defined as a self-reported diagnosis).
Table 5.
Association of 2-h plasma glucose (natural log-transformed) with diabetes (defined as a self-reported diagnosis).
| Models | 2-h PGOGTT@4–7.9h (n = 23461) | 2-h PGOGTT@fasting (n = 38602) | ||||
| OR | 95% CI | p | OR | 95% CI | p | |
| Model 1 | 31.2 | 23.0–42.3 | <0.001 | 20.7 | 16.6–25.7 | <0.001 |
| Model 2 | 33.2 | 23.4–46.9 | <0.001 | 17.9 | 14.2–22.5 | <0.001 |
| Model 3 | 33.9 | 23.3–49.3 | <0.001 | 17.1 | 13.5–21.7 | <0.001 |
| Model 4 | 38.6 | 25.9–57.4 | <0.001 | 17.6 | 13.8–22.4 | <0.001 |
| Model 5 | 40.2 | 26.8–60.3 | <0.001 | 16.6 | 13.0–21.2 | <0.001 |
| Model 6 | 39.7 | 26.3–59.9 | <0.001 | 15.7 | 12.2–20.1 | <0.001 |
2-h PGOGTT@4–7.9h classified HbA1c-diagnosed diabetes with 92% accuracy (95% CI 89%–94%), falling within the outstanding accuracy range (>90%) [12]. This accuracy was comparable to its fasting counterpart, 2-h PGOGTT@fasting, which achieved 95% accuracy (95% CI, 93%–96%). Further analysis using self-reported diagnosis confirmed similar diagnostic accuracies between 2-h PGOGTT@4–7.9h and 2-h PGOGTT@fasting (89% versus 88%). These findings suggest that 2-h PGOGTT@4–7.9h holds promise as a diagnostic marker for diabetes.
Table 6.
Numbers of mortality during the follow-up.
| Mortality | Postprandial cohort | Fasting cohort | All |
| All causes | 1299 | 2144 | 3443 |
| Diabetes | 40 | 62 | 102 |
| CVD | 432 | 734 | 1166 |
| Cancer | 319 | 562 | 881 |
CVD, cardiovascular disease.
Table 7.
Association of 2-h plasma glucose (natural log transformed) with diabetes mortality.
| Models | 2-h PGOGTT@4–7.9h | 2-h PGOGTT@fasting | ||||
| HR | 95% CI | p | HR | 95% CI | p | |
| Model 1 | 18.1 | 9.5–34.6 | <0.001 | 10.4 | 6.6–16.4 | <0.001 |
| Model 2 | 17.2 | 8.4–35.1 | <0.001 | 8.7 | 5.4–13.9 | <0.001 |
| Model 3 | 16.0 | 7.6–33.6 | <0.001 | 8.2 | 5.0–13.3 | <0.001 |
| Model 4 | 22.0 | 10.2–47.5 | <0.001 | 8.1 | 4.9–13.4 | <0.001 |
| Model 5 | 21.7 | 9.6–49.4 | <0.001 | 7.3 | 4.4–12.2 | <0.001 |
| Model 6 | 21.1 | 9.2–48.0 | <0.001 | 7.1 | 4.2–11.9 | <0.001 |
2-h PGOGTT@4–7.9h, 2-hour plasma glucose during OGTT which was conducted in the postprandial period between 4 and 7.9 h; 2-h PGOGTT@fasting, 2-hour plasma glucose during OGTT which was conducted in the fasting period (fasting time, ≥ 8 h); CI, confidence interval; HR, hazard ratio; OGTT, oral glucose tolerance test. Model 1 was not adjusted; Model 2 was adjusted for age, sex, and ethnicity; Model 3 was adjusted for all the factors in Model 2 plus body mass index, poverty–income ratio, and education; Model 4 was adjusted for all the factors in Model 3 plus physical activity, alcohol consumption, smoking status, and survey period; Model 5 was adjusted for all the factors in Model 4 plus total cholesterol, HDL cholesterol, and systolic blood pressure; and Model 6 was adjusted for all the factors in Model 5 plus family history of diabetes.
Table 8.
Association of 2-h plasma glucose during OGTT (≥ versus < 200 mg/dL) with diabetes mortality.
Table 8.
Association of 2-h plasma glucose during OGTT (≥ versus < 200 mg/dL) with diabetes mortality.
| Models | 2-h PGOGTT@4–7.9h | 2-h PGOGTT@fasting | ||||
| HR | 95% CI | p | HR | 95% CI | p | |
| Model 1 | 12.4 | 6.0–25.4 | <0.001 | 10.4 | 6.3–17.2 | <0.001 |
| Model 2 | 10.0 | 4.7–20.9 | <0.001 | 8.1 | 4.8–13.7 | <0.001 |
| Model 3 | 9.0 | 4.3–19.1 | <0.001 | 7.3 | 4.3–12.4 | <0.001 |
| Model 4 | 13.7 | 6.2–30.6 | <0.001 | 7.3 | 4.3–12.5 | <0.001 |
| Model 5 | 12.0 | 5.3–27.1 | <0.001 | 6.1 | 3.6–10.4 | <0.001 |
| Model 6 | 12.3 | 5.4–27.9 | <0.001 | 5.9 | 3.4–10.1 | <0.001 |
2-h PGOGTT@4–7.9h, 2-hour plasma glucose during OGTT which was conducted in the postprandial period between 4 and 7.9 h; 2-h PGOGTT@fasting, 2-hour plasma glucose during OGTT which was conducted in the fasting period (fasting time, ≥ 8 h); CI, confidence interval; HR, hazard ratio; OGTT, oral glucose tolerance test. Model 1 was not adjusted; Model 2 was adjusted for age, sex, and ethnicity; Model 3 was adjusted for all the factors in Model 2 plus body mass index, poverty–income ratio, and education; Model 4 was adjusted for all the factors in Model 3 plus physical activity, alcohol consumption, smoking status, and survey period; Model 5 was adjusted for all the factors in Model 4 plus total cholesterol, HDL cholesterol, and systolic blood pressure; and Model 6 was adjusted for all the factors in Model 5 plus family history of diabetes.
Table 9.
Association of 2-h plasma glucose during OGTT (natural log transformed) with all-cause mortality.
Table 9.
Association of 2-h plasma glucose during OGTT (natural log transformed) with all-cause mortality.
| Models | 2-h PGOGTT@4–7.9h | 2-h PGOGTT@fasting | ||||
| HR | 95% CI | p | HR | 95% CI | p | |
| Model 1 | 1.97 | 1.72–2.24 | <0.001 | 1.96 | 1.79–2.15 | <0.001 |
| Model 2 | 1.38 | 1.20–1.60 | <0.001 | 1.45 | 1.31–1.60 | <0.001 |
| Model 3 | 1.37 | 1.19–1.58 | <0.001 | 1.44 | 1.30–1.59 | <0.001 |
| Model 4 | 1.50 | 1.30–1.74 | <0.001 | 1.52 | 1.37–1.68 | <0.001 |
| Model 5 | 1.41 | 1.22–1.64 | <0.001 | 1.42 | 1.28–1.57 | <0.001 |
| Model 6 | 1.41 | 1.22–1.64 | <0.001 | 1.40 | 1.26–1.55 | <0.001 |
2-h PGOGTT@4–7.9h, 2-hour plasma glucose during OGTT which was conducted in the postprandial period between 4 and 7.9 h; 2-h PGOGTT@fasting, 2-hour plasma glucose during OGTT which was conducted in the fasting period (fasting time, ≥ 8 h); CI, confidence interval; HR, hazard ratio; OGTT, oral glucose tolerance test. Model 1 was not adjusted; Model 2 was adjusted for age, sex, and ethnicity; Model 3 was adjusted for all the factors in Model 2 plus body mass index, poverty–income ratio, and education; Model 4 was adjusted for all the factors in Model 3 plus physical activity, alcohol consumption, smoking status, and survey period; Model 5 was adjusted for all the factors in Model 4 plus total cholesterol, HDL cholesterol, and systolic blood pressure; and Model 6 was adjusted for all the factors in Model 5 plus family history of diabetes.
Table 10.
Association of 2-h plasma glucose during OGTT (natural log transformed) with CVD mortality.
Table 10.
Association of 2-h plasma glucose during OGTT (natural log transformed) with CVD mortality.
| Models | 2-h PGOGTT@4–7.9h | 2-h PGOGTT@fasting | ||||
| HR | 95% CI | p | HR | 95% CI | p | |
| Model 1 | 2.37 | 1.89–2.96 | <0.001 | 2.24 | 1.92–2.61 | <0.001 |
| Model 2 | 1.63 | 1.28–2.09 | <0.001 | 1.59 | 1.35–1.87 | <0.001 |
| Model 3 | 1.54 | 1.21–1.98 | <0.001 | 1.54 | 1.31–1.82 | <0.001 |
| Model 4 | 1.64 | 1.27–2.11 | <0.001 | 1.60 | 1.35–1.89 | <0.001 |
| Model 5 | 1.49 | 1.15–1.93 | 0.003 | 1.43 | 1.20–1.70 | <0.001 |
| Model 6 | 1.47 | 1.13–1.91 | 0.004 | 1.41 | 1.19–1.68 | <0.001 |
2-h PGOGTT@4–7.9h, 2-hour plasma glucose during OGTT which was conducted in the postprandial period between 4 and 7.9 h; 2-h PGOGTT@fasting, 2-hour plasma glucose during OGTT which was conducted in the fasting period (fasting time, ≥ 8 h); CI, confidence interval; CVD, cardiovascular disease; HR, hazard ratio; OGTT, oral glucose tolerance test. Model 1 was not adjusted; Model 2 was adjusted for age, sex, and ethnicity; Model 3 was adjusted for all the factors in Model 2 plus body mass index, poverty–income ratio, and education; Model 4 was adjusted for all the factors in Model 3 plus physical activity, alcohol consumption, smoking status, and survey period; Model 5 was adjusted for all the factors in Model 4 plus total cholesterol, HDL cholesterol, and systolic blood pressure; and Model 6 was adjusted for all the factors in Model 5 plus family history of diabetes.
Table 11.
Association of 2-h plasma glucose during OGTT (natural log transformed) with cancer mortality.
Table 11.
Association of 2-h plasma glucose during OGTT (natural log transformed) with cancer mortality.
| Models | 2-h PGOGTT@4–7.9h | 2-h PGOGTT@fasting | ||||
| HR | 95% CI | p | HR | 95% CI | p | |
| Model 1 | 1.13 | 0.86–1.49 | 0.37 | 1.23 | 1.02–1.50 | 0.03 |
| Model 2 | 0.89 | 0.67–1.19 | 0.43 | 0.97 | 0.80–1.19 | 0.79 |
| Model 3 | 0.94 | 0.70–1.25 | 0.65 | 0.99 | 0.81–1.22 | 0.93 |
| Model 4 | 1.05 | 0.78–1.41 | 0.76 | 1.08 | 0.88–1.32 | 0.48 |
| Model 5 | 1.00 | 0.74–1.36 | 0.99 | 1.03 | 0.84–1.27 | 0.78 |
| Model 6 | 1.03 | 0.76–1.39 | 0.87 | 1.01 | 0.82–1.24 | 0.95 |
2-h PGOGTT@4–7.9h, 2-hour plasma glucose during OGTT which was conducted in the postprandial period between 4 and 7.9 h; 2-h PGOGTT@fasting, 2-hour plasma glucose during OGTT which was conducted in the fasting period (fasting time, ≥ 8 h); CI, confidence interval; HR, hazard ratio; OGTT, oral glucose tolerance test. Model 1 was not adjusted; Model 2 was adjusted for age, sex, and ethnicity; Model 3 was adjusted for all the factors in Model 2 plus body mass index, poverty–income ratio, and education; Model 4 was adjusted for all the factors in Model 3 plus physical activity, alcohol consumption, smoking status, and survey period; Model 5 was adjusted for all the factors in Model 4 plus total cholesterol, HDL cholesterol, and systolic blood pressure; and Model 6 was adjusted for all the factors in Model 5 plus family history of diabetes.
Table 12.
Power estimation for 2-h PGOGTT@4–7.9h to diagnose diabetes1.
| Sample size | n = 50 | n = 90 | n = 100 | n = 150 | n = 175 | n = 200 |
| Power for razmak80% accuracy | 82.8% | 86.4% | 87.8% | 91.8% | 92.8% | 94.1% |
| Power forrazmak81% accuracy | 71.2% | 79.3% | 81.7% | 83.1% | 85.8% | 88.0% |
| Sensitivityrazmak(95% CI) | 86.5% razmak(50.0%–100%) | 86.5% razmak(60.0%–100%) | 86.6% razmak(61.5%–100%) | 86.5%razmak(66.7%–100%) | 86.5%razmak(68.8%–100%) | 86.6%razmak(70.0%–100%) |
| Specificity (95% CI) |
83.5% (72.1%–93.5%) |
83.4% (75.3%–91.0%) |
83.4% (75.8%–90.4%) |
83.4% (77.3%–89.4%) |
83.4% (77.6%–88.7%) |
83.4% (78.0%–88.5%) |
2-h PGOGTT@4–7.9h, 2-hour plasma glucose during OGTT which was conducted in the postprandial period between 4 and 7.9 h; CI, confidence interval; OGTT, oral glucose tolerance test. 1 Diabetes was defined as HbA1c ≥6.5%. Power was estimated using simulations on 10,000 random samples for each sample size.
Disclaimer/Publisher’s Note: The statements, opinions and data contained in all publications are solely those of the individual author(s) and contributor(s) and not of MDPI and/or the editor(s). MDPI and/or the editor(s) disclaim responsibility for any injury to people or property resulting from any ideas, methods, instructions or products referred to in the content. |
© 2024 by the authors. Licensee MDPI, Basel, Switzerland. This article is an open access article distributed under the terms and conditions of the Creative Commons Attribution (CC BY) license (http://creativecommons.org/licenses/by/4.0/).
Copyright: This open access article is published under a Creative Commons CC BY 4.0 license, which permit the free download, distribution, and reuse, provided that the author and preprint are cited in any reuse.


