Submitted:
04 July 2024
Posted:
05 July 2024
You are already at the latest version
Abstract
This work offers a new log generalized odd log-logistic exponential regression model for analyzing weekly dengue fever cases in 2022 with a location-systematic component. To achieve this, a data set of 49 observations of dengue fever cases in the Federal District of Brazil is employed. A review of the mathematical properties of the generalized odd log-logistic exponential distribution is provided, the maximum likelihood method is used to estimate the parameters, and, through Monte Carlo simulations, the accuracy of the estimators is investigated. The model's fit is assessed using global influence metrics and residual analysis. For the time scenario studied, the proposed regression identified factors that have an impact on dengue fever cases, which may contribute to improve disease control. Finally, several interpretations are addressed, and a discussion presents results that aid in better understanding the data set and future research on different data.
Keywords:
dengue fever
; epidemiological data
; exponential distribution
; generalized odd log-logistic family
; maximum likelihood
; regression model
; simulation
1. Introduction
Dengue fever represents a major challenge in epidemiology around the world, especially in Brazil, where recurring epidemics happen in some endemic territories. The uncontrollable increase in the metropolitan population and the lack of information and control are factors that are determinants of the occurrence of the disease and the burden on the healthcare system. More than 100 countries have dengue fever as an endemic problem, which affects millions of people each year. One of the most important factors contributing to the global spread of the virus nowadays is climate change, which is growing fast.
In this regard, many applications for generalized extreme value (GEV) distributions can be found in epidemiological studies. [1] presented a review study on the relationship between dengue fever and meteorological parameters, as well as a meta-analysis to investigate the impact of ambient temperature and precipitation on dengue fever. Dengue case counts during outbreaks in Thailand were modeled using extreme value theory (EVT) [2]. A zero-inflated GEV regression model is used in an application using Vietnam dengue data [3]. The estimate of the risk of infection for the individuals is based on the covariates of age and weight.
Likewise, [4] presented a GEV approach to study the frequency and intensity of extreme novel epidemics similar to COVID-19. As well, extreme value statistics are used to predict in real-time severe influenza epidemics [5]. Moreover, [6] investigated the extreme correlation between infectious illness outbreaks and crude oil futures. [7] estimated the disease burden of dengue in endemic regions to study the influence pattern of socioeconomic factors. They recommend allocating more resources to areas with high population expansion and urbanization.
Further, [8] explored the characteristics and studied the temporal-spatial cases of the overseas imported dengue fever in outbreak provinces of China. [9] studied myocardial manifestations related to dengue fever cases in a systematic review. In [10], dengue fever cases in the Brazilian state of Alagoas were modeled monthly using GEV distribution. The findings underline the significance of ongoing monitoring and assistance in this area.
Therefore, the study is based on the dengue fever cases of the epidemiological weeks in 2022 in the Federal District of Brazil. A regression analysis is applied to study extreme events (an epidemiological event that affects health centers and the economy) and the maximum likelihood method is used to estimate the parameters. The accuracy of the estimators is confirmed by means of Monte Carlo simulations. Some local influence measures are used, as are residual analyses, to validate the goodness-of-fitness of the proposed model.
Considering this, the studies present a novel bimodal regression model based on the generalized odd log-logistic exponential (GOLLE) distribution [11] and [12], namely the log generalized odd log-logistic exponential (LGOLLE) regression model. The GOLL-G class’s broad flexibility, which allows modeling its tails and asymetry, combined with the exponential distribution, which is used in many EVT applications and has a closed mathematical form, makes the novel regression a relevant model to apply in many areas, as well as a potential application in extreme events.
The rest of the work is organized as follows. Section 2 presents the GOLLE distribution [11] and [12]. Moreover, reviews the linear representation and some of its mathematical features. Maximum likelihood estimation is discussed, as well as a Monte Carlo simulation study to show the estimators’ consistency. The new LGOLLE distribution is introduced, maximum likelihood is used and some simulations assess the consistency of the maximum likelihood estimates (MLEs) in Section 3. In Section 4, a novel regression model based on the GOLLE distribution, using location parametrization, is proposed and simulations examine the behavior of the estimates. The model’s fit is assessed using global influence metrics and residual analysis. Section 5 demonstrates the usefulness of the new regression model using an epidemiological data set. The results and a discussion are presented in Section 6. Additionally, diagnostic and residual analyses are provided. Section 7 contains some final observations.
2. Materials and Methods
2.1. The GOLLE Distribution
Recently, the development of new distributions using well-known distributions aims to capture accurately the underlying distribution of the data and obtain more precise estimates or key quantities of interest.
In this context, the generalized odd log-logistic-G (GOLL-G) family, pioneered by [13], is a versatile class of continuous distributions for modeling various types of data. In their study, [13] elucidated the advantages of the introduced family of distributions and its applicability across various fields, highlighting its superiority over well-known generators. This particular distribution offers advantages compared to other competing models, as elaborated in the upcoming sections.
This family is based on the transformer-transformer (T-X) generator defined by [14]. Consider a baseline cdf , where denotes an unknown parameter vector. The GOLL-G cdf is defined by integrating the log-logistic density function, namely
where > 0 and > 0 are two extra shape parameters.
The pdf corresponding to (1) can be expressed as
where is the baseline pdf. Its hazard rate function (hrf) is easily found as .
These equations define some characteristics of the GOLL-G family, allowing it to effectively model a wide range of data types (skewed, bimodal, asymmetric, etc.) The parameters and play an important role in shaping the distribution. In addition, Equations (1) and (2) do not involve complex mathematical functions, unlike the gamma and beta classes.
The cumulative distribution function (cdf) and the probability density function (pdf) of the GOLLE distribution are defined in [11] and [12], respectively, as
and
The hazard rate function (hrf) can be obtained as follows
Here, in Table 2, the sub-models obtained from Equation (4) are provided. Its capacity to handle data fitting across a wide range of distributions demonstrates its versatility and application.
2.2. Main Properties
This Section presents the GOLLE distribution’s linear representation of the density function, including the qf, moments, and mgf, as defined in [12].
2.3. Representation
Definition 1.
The GOLLE density (4) can be represented linearly using exponential densities as
where is the exponential density with a shared parameter and is defined below
2.4. Quantile function
Definition 2.
The GOLLE quantile function (qf) of Y is expressed by
where
Figure 3 displays Galton’s skewness and Moors’ kurtosis for different and , with . These plots show how both parameters influence the distribution shape. As and increase, the skewness and kurtosis measures reduce to a minimum value.
2.5. Moments
Definition 3.
The nth moment of the GOLLE distribution is defined by
2.6. Generating Function
Definition 4.
The moment generating function (mgf) of the GOLLE density can be expressed as
2.7. Estimation
The MLEs of the GOLLE parameters vector are calculated from a complete sample by maximizing
Let’s consider
Therefore, the elements of the score vector can be formulated as follows
and
Using a Newton-Raphson type method and setting the score equations , the MLEs are calculated. The optim procedure can also be used to numerically maximize Equation (8).
2.7.1. Simulation Study
In two scenarios, Monte Carlo simulations generated by samples of varied sizes of the GOLLE distribution are utilized to assess the accuracy of MLEs. For each sample size, , the average estimates (AEs), absolute biases (ABs) and root mean square errors (RMSEs) are computed, for each .
As predicted by the consistency requirement, the results in Table 10 indicate that AEs approximate to the real values and ABs and RMSE approach zero as n increases. It is notable that for scenario 1, all the estimates obtained when were overestimated, while for scenario 2, the parameters and were overestimated. This shows the sensitivity of the model’s parameters to some values, but in general, as the sample size increases, convergence towards the true values is achieved.
3. The proposal LGOLLE distribution
Let be a rv Y following the GOLLE density function (4), here is defined . Setting , the density function of W is expressed as (for )
where .
The Equation (9) is the log generalized odd log-logistic exponential (LGOLLE) distribution, namely LGOLLE() where is the location parameter. Thus, if GOLLE() then LGOLLE(). The density function in Figure 4 is displayed for select values of the parameters and . These plots show the versatility of the new distribution with its skewed and bimodal shapes.
4. The New LGOLLE Regression Model
Let be LGOLLE() the density function, thus the rv is given by
and the rv LGOLLE(,0).
In order to introduce a new regression structure in the class of models (10), the parameter is assumed to vary across observations through a regression structure expressed as
where the random error has density function (10) and is parameterized by
where is the parameter vector of dimension p associated with the explanatory variables for the location parameter.
4.1. Estimation
Except for , the components of the score vector for and are the same as those obtained from the Equations presented in Subsection (Section 2.7). The score component of the location parameter is defined to add the regression part as follows
where and are the cdf and pdf of the exponential distribution, respectively, and denotes the derivatives of the parameter using the chain rule.
The MLE of of the regression model is calculated by setting the score equations or using the optim routine in [18].
4.2. Regression Simulation Study
To show the accuracy of the MLEs for , , and , 1,000 samples of size were generated. The study is based on the measurements: biases, MSEs and ALs. The measures are (for )
Figure 5, Figure 6 and Figure 7 show the values of these measures in relation to n. Biases, MSEs and ALs tend to zero as the sample size increases. In the biases, the estimate of is overestimated, while the estimate of shows oscillatory behavior. These indicated potential concerns with optimization for certain values and sample sizes. Despite this, the biases converge to zero as expected. These findings corroborate the consistency of the MLEs.
4.3. Model Checking
Several approaches for analyzing outliers have been documented in the literature, including [19,20] and [21]. Diagnostic methods such as observation exclusion are used to detect influential observations in the proposed regression model.
In this context, for the proposed systematic component, the exclusion of observations follows
For investigating the influential observations, the generalized Cook’s distance is given by
and the likelihood distance, as
where the subscript i denotes the observation deleted from the dataset and is the observed information matrix.
Moreover, the objective of residual analysis is to find trends or characteristics in the residuals that may affect the model’s validity. Therefore, the deviance residuals have been commonly used to assess the goodness-of-fit of regression models [22]. It follows that the deviance residuals are given by
where
are the martingale residuals and sign(·) is the signal function with a value if the argument is positive and if the argument is negative.
[23] proposed the construction of envelopes to support the analysis of the residuals with normal probability plots. For these envelopes, confidence bands are simulated, and if the model fits well, the majority of the points will be randomly distributed inside.
5. Application: Dengue Fever Cases Data
To demonstrate the potential of the GOLLE distribution, Table 4 illustrates some alternative distributions of well-known generators, in addition to the nested model.
The distributions are presented (for ), respectively, as
and
where all of the parameters are positive and and represent the exponential and Fréchet distributions, respectively. The goodness.fit function of AdequacyModel package (see, [29]) computes the MLEs (standard errors (SEs) in parentheses) for all fitted models using the BFGS approach.
5.1. Descriptive of the Data
The data set was extracted from the Health Problem and Notification Information System (SINAN) (https://datasus.saude.gov.br/acesso-a-informacao/doencas-e-agravos-de-notificacao-de-2007-em-diante-sinan/, accessed on 02nd July 2024). This system maintains a repository of patient notifications encompassing diseases, injuries and public health incidents listed as nationally mandatory for reporting. Notably, this includes more than 40 diseases (dengue fever, chikungunya fever, pandemic influenza, etc). The data is composed of notifications related to dengue fever cases documented within the Federal District, Brazil, spanning all 49 epidemiological weeks (observations) throughout the year 2022: 689, 1205, 938, 1121, 1523, 1469, 1508, 1999, 2468, 2827, 3196, 3651, 3550, 4142, 4118, 4178, 3853, 2700, 6726, 2183, 2581, 1616, 1126, 898, 548, 752, 622, 415, 309, 291, 396, 476, 411, 360, 500, 402, 418, 313, 385, 475, 406, 277, 323, 433, 505, 574, 465, 1.682.
The focus of the study is on the variables below:
- : total dengue fever cases of a epidemiological week (DG) (response variable);
- : month (levels: 0 - January to 11 - December). Thus, for and , dummy variables.
The proposed model provides both advantages and disadvantages over counting models. The exponential distribution used as a baseline has several important characteristics, including applicability in some epidemiological contexts, memorylessness, a good fit with real data with heavy tails, flexibility and a simple density form. On the other hand, a variety of concerns might arise, including a lack of flexibility for trend modeling, violations of the independence assumption, which can result in inaccurate models, and restrictions with inflated zero data, among others. Nonetheless, the model captures the significance of the exploratory variables as well as an extreme event involving dengue fever patients in the temporal scenario.
Table 5 presents descriptive statistics. The number of dengue fever cases varied from very low (277) to high (6726). The standard deviation of 1445,35 indicates increased variability in dengue fever cases over time. The distribution is skewed to the right (1.509), indicating that there are more severe values near the top of the scale and the kurtosis indicates heavier tails (4.998).
Figure 8 shows the histogram and time series of the data. Figure 8(a) demonstrated heavy tail behavior, consistent with extreme event data. Figure 8(b) shows unusual event behavior between May and June. This is a record compared to the same period since 1998 (https://www.correiobraziliense.com.br/cidades-df/2022/06/5017446-casos-atingem-maior-numero-desde-1998.html, accessed on 02nd July 2024), demonstrating the atypical behavior of the observations, which deviate significantly from the historical average, indicating an unusual outbreak, or, in epidemiology, an extreme event of dengue fever that can have an impact on both the health system and the economy. In addition, the plot shows an increase in tendency between February and June, when the disease is most likely to develop in the Federal District and a decrease in tendency between July and December, which is the drought period.
Brazil is a continental country with different patterns, however the Midwest has the highest incidence of dengue fever, according to the arbovirus monitoring panel of the Ministry of Health (https://www.gov.br/saude/pt-br/assuntos/saude-de-a-a-z/a/aedes-aegypti/monitoramento-das-arboviroses, accessed on 02nd July 2024), which is the region of the study data.
6. Results
6.1. Findings from GOLLE Distribution
The analysis of time series data requires a detailed inspection, which includes identifying relationships between the observations. Failure to account for these associations may result in an inadequate model that neglects temporal relationships, potentially leading to incorrect forecasts and interpretations. To identify serial correlation, it is essential to analyze the autocorrelation function (ACF) and partial autocorrelation function (PACF) plots. Figure 9 shows ACF and PACF for an autoregressive integrated moving average model with one-lag in the differenced series ARIMA(1,1,0).
Despite the fact that the data set demonstrates a correlation, i.e., dependence, the model can be employed if this assumption is relaxed given the small number of observations and the employing of diagnostic and residual analyses.
Table 6 presents the results of the fitted distributions to the current data and shows that the GOLLE distribution is the best fit. Figure 10(a) and Figure 10(b) show histograms and plots of estimated density functions, as well as empirical cdf estimated ones. The Fréchet distribution density is commonly used to model extreme occurrences and these findings suggest that the KwFr distribution (the second-best model) is competitive with the presented model.
LR tests were used to compare the GOLLE distribution and its nested models. Table 7 shows that adding more parameters has a significant influence on accurately modeling the existing data.
6.2. Findings from LGOLLE Regression Model
To assess the LGOLLE model, Figure 11 shows the ACF and PACF plots for a model with one-lag in the differenced series ARIMA(0,1,0), which indicates a cumulative sum of an i.i.d. process, which itself is known as ARIMA(0,0,0) (random walk). Therefore, the proposed regression model can be employed in the current data set.
A histogram and time series of the log data are displayed in Figure 12. Figure 12(a) showed a behavior that was bimodal. Extreme occurrences between May and June and a trend behavior during the time scenario are shown in Figure 12(b).
The LGOLLE distribution is the best fit, as demonstrated by Table 8, which displays the results of the fitted nested distributions to the log data. In addition to histograms and the estimated density functions in Figure 13(a), Figure 13(b) displays the empirical cdf estimated ones.
LR tests are employed to compare the LGOLLE distribution’s nested models. Table 9 shows that adding extra parameters has a considerable influence on modeling performance with the given data.
The new LGOLLE regression model for the dengue fever cases data in Federal District, Brazil can be expressed as follows
where are independent rv variables with density function (10) and the systematic structure is defined by
The results (MLEs, SEs, and p-values) of the fitted LGOLLE regression model are presented in Table 10. Therefore, using a significance level of , the months of the temporal scenario are significant and can be utilized to model the location.
Figure 14 presents two potentially significant observations based on the LD and GCD measures. It’s worth noting that the 20th and 49th observations, respectively, correspond to the beginning of June and the last epidemiological week. The first matches to the record (https://www.metropoles.com/distrito-federal/boletim-revela-aumento-dos-casos-de-dengue-em-todas-as-regioes-do-df, accessed on 02nd July 2024) of dengue fever cases in the Federal District. The second relates to the end-of-year vacation/recess period, which results in a backlog of alerts due to a lack of health care professionals available to notify cases and input data into the system.
Nonetheless, Figure 15 indicates that the index deviation residuals behave randomly over the range and are within the simulated envelope, implying that the observations have a minimal effect on the regression model.
6.3. Discussion
The findings indicate that the LGOLLE regression model is suitable for explaining the weekly dengue fever cases in the Federal District. Table 10 presents parameter estimates for the LGOLLE regression model, which becomes (for )
The following discussion examines the systematic structure, using January as the month of reference.
Interpretations for
- Except for the covariates and , referring to the months July and December, all other covariates are significant at a level of significance. This indicates that there is a difference in dengue fever cases registered in the Federal District between the other months and January. The months of July and December are probably not significant due to their similar behavior to the reference month;
- The months of February to June have positive estimates, which is significant, showing an increase in comparison to January. This may be seen in Figure 12(b), which shows an extreme event (between May and June) in that window data scenario;
- August to November have negative values, indicating a decline in dengue fever cases compared to January. During this period, the Federal District experiences a drought that corroborates the study’s findings (https://portal.inmet.gov.br/uploads/notastecnicas/Estado-do-clima-no-Brasil-em-2022-OFICIAL.pdf, accessed on 02nd July 2024).
7. Conclusions
The paper defined the generalized odd log-logistic exponential distribution (see [11] and [12]) and introduced a new bimodal regression model based on the GOLLE distribution with a location-systematic structure to investigate weekly dengue fever cases in the Federal District in 2022. Some mathematical properties are reviewed, the parameters are estimated by the maximum likelihood method and the consistency criterion is evaluated by means of Monte Carlo simulations. The consistency of the MLEs of the regression model is evaluated by means of simulations using some measures. Some global influence measures and residual analysis are addressed to investigate the fit of the new model.
Some important findings are addressed. Except for the July and December months, the remaining months are significant at a significance level. February to June exhibit positive estimates, suggesting a positive impact on dengue fever cases during this period. This is corroborated by the time scenario of the climatological effects that increase the cases in these months. August to November experience a drought, supporting the negative estimates during this period, which have a negative effect on weekly dengue fever cases.
The epidemiology data set showed that the novel regression model is more flexible than other nested and competitively well-known models. As a result, the proposed model enhances comprehension of dengue fever cases in the Federal District, as well as an extreme event that occurred during the study period.
Author Contributions
Conceptualization, N.S.S.d.C.; methodology, N.S.S.d.C., M.d.C.S.d.L. and G.M.C.; software, N.S.S.d.C.; validation, N.S.S.d.C., M.d.C.S.d.L. and G.M.C.; formal analysis, N.S.S.d.C., M.d.C.S.d.L. and G.M.C.; investigation, N.S.S.d.C., M.d.C.S.d.L. and G.M.C.; data curation, N.S.S.d.C.; writing—original draft preparation, N.S.S.d.C. and M.d.C.S.d.L.; writing—review and editing, N.S.S.d.C., M.d.C.S.d.L. and G.M.C.; visualization, N.S.S.d.C., M.d.C.S.d.L. and G.M.C.; supervision, N.S.S.d.C., M.d.C.S.d.L. and G.M.C.; project administration, N.S.S.d.C. and M.d.C.S.d.L. All authors have read and agreed to the current version of the manuscript.
Funding
This research is awaiting to external funding
Institutional Review Board Statement
Not applicable
Informed Consent Statement
Not applicable.
Data Availability Statement
The authors confirm that the data supporting the findings of this study are available within the article.
Conflicts of Interest
The authors declare no conflict of interest.
Abbreviations
The following abbreviations are used in this manuscript:
| Anderson Darling | |
| ACF | autocorrelation function |
| AE | average estimate |
| AE | average estimate |
| AL | average estimate length |
| ARIMA | utoregressive integrated moving average model |
| BE | beta-Fréchet |
| cdf | cumulative distribution function |
| COVID-19 | corona virus disease 2019 |
| DG | dengue fever cases |
| E | exponential distribution |
| EE | exponentiated exponential distribution |
| EVT | extreme value theory |
| Fr | Fréchet |
| GCD | generalized Cook distance |
| GEV | generalized extreme value |
| GE | gamma-exponential distribution |
| GFr | gamma-Fréchet distribution |
| GOLLE | generalized odd log-logistic exponential distribution |
| GOLL-G | generalized odd log-logistic distribution |
| hrf | hazard rate function |
| KS | Kolmorogov-Sminorv |
| KwE | Kumaraswamy exponential distribution |
| KwFr | Kumaraswamy Fréchet distribution |
| LD | loglikelihood distance |
| LGOLLE | log generalized odd log-logistic exponential distribution |
| LR | likelihood ratio |
| mgf | moment generation function |
| MLE | maximum likelihood estimate |
| MSE | mean squared error |
| OLLE | odd log-logistic exponential distribution |
| PACF | partial autocorrelation function |
| probability distribution function | |
| RMSE | root mean squared error |
| SE | standard error |
| SINAN | sistema de informação de agravos de notificação |
| T-X | transformer-transformer generator |
| Cramér-von Misses |
References
- Li, Y.; Dou, Q., Lu; Y., Xiang; H., Yu, X.; Liu, S. Effects of Ambient Temperature and Precipitation on the Risk of Dengue Fever: A Systematic Review and Updated Meta-Analysis. Environmental Research 2020, 191, 110043. [CrossRef] [PubMed]
- Lim, J. T.; Dickens, B. S. L.; Cook, A. R. Modelling the Epidemic Extremities of Dengue Transmissions in Thailand. Epidemics 2020, 33, 100402. [Google Scholar] [CrossRef] [PubMed]
- Diop, A.; Deme, E. H.; Diop, A. Zero-inflated Generalized Extreme Value Regression Model for Binary Response data and Application in Health Study. Journal of Statistical Computation and Simulation 2023, 93, 1–24. [Google Scholar] [CrossRef]
- Marani, M., Katul, G. G.. Pan, W. K.; Parolari, A. J. Intensity and Frequency of Extreme Novel Epidemics. Proceedings of the National Academy of Sciences 2021, 35, e2105482118. [CrossRef]
- Thomas, M.; RootzÉn, H. Real-time Prediction of Severe Influenza Epidemics Using Extreme Value Statistics. Journal of the Royal Statistical Society Series C: Applied Statistics 2022, 71, 376–394. [Google Scholar] [CrossRef]
- Lin, H.; Zhang, Z. Extreme Co-movements Between Infectious Disease Events and Crude Oil Futures Prices: From Extreme Value Analysis Perspective. Energy Economics 2022, 110, 106054. [Google Scholar] [CrossRef]
- Tian, N.; Zheng, J.-X.; Guo, Z.-Y.; Li, L.-H.; Xia, S.; Lv, S.; Zhou, X.-N. Dengue Incidence Trends and its Burden in Major Endemic Regions from 1990 to 2019. Tropical Medicine and Infectious Disease 2022, 7, 180. [Google Scholar] [CrossRef] [PubMed]
- Lun, X.; Wang, Y.; Zhao, C.; Wu, H.; Zhu, C.; Ma, D.; Xu, M.; Wang, J.; Liu, Q.; Xu, L. et al. Epidemiological Characteristics and Temporal-Spatial Analysis of Overseas Imported Dengue Fever Cases in Outbreak Provinces of China, 2005-2019. Infectious Diseases of Poverty 2022, 11, 1–17. [CrossRef]
- Sandeep, M.; Padhi, B. K.; Yella, S. S. T.; Sruthi, K. G.; Venkatesan, R. G.; Sasanka, K. S., Krishna, B. S.; Satapathy, P.; Mohanty, A.; Al-Tawfiq, J. A.; Iqhrammullah, M. et al. Myocarditis Manifestations in Dengue Cases: A Systematic Review and Meta-analysis. Journal of Infection and Public Health 2023, 16, 1761–1768. [CrossRef]
- de Oliveira-Júnior, J. F.; Souza, A.; Abreu, M. C.; Nunes, R. S. C.; Nascimento, L. S.; Silva, S. D.; Correia Filho, W. L. F.; Silva, E. B. Modeling of Dengue by Cluster Analysis and Probability Distribution Functions in the State of Alagoas in Brazilian. Brazilian Archives of Biology and Technology 2023, 66, e23220086. [Google Scholar] [CrossRef]
- Qoshja, A.; Muça, M. A New Modified Generalized Odd Log-logistic Distribution with Three Parameters. Mathematical Theory and Modeling 2018, 8. Available online: https://www.researchgate.net/publication/331483356_A_NEW_MODIFIED_GENERALIZED_ODD_LOG-LOGISTIC_DISTRIBUTION_WITH_THREE_PARAMETERS (accessed on 28 June 2024).
- A. Z.; Suzuki, A. K.; Zhang, C.; Nassar, M. On Three-parameter Exponential Distribution: Properties, Bayesian and non-Bayesian Estimation Based on Complete and Censored Samples. Mathematical Theory and Modeling 2021, 50, 3799-3819. [CrossRef]
- Cordeiro, G.M.; Alizadeh, M.; Ozel, G.; Hosseini, B.; Ortega, E.M.M.; Altun, E. The Generalized Odd Log-Logistic Family of Distributions: Properties, Regression Models and Applications. J. Stat. Comput. Simul. 2017, 87, 908–932. [Google Scholar] [CrossRef]
- Alzaatreh, A.; Lee, C.; Famoye, F. A New Method for Generating Families of Continuous Distributions. Metron 2013, 71, 63–79. [Google Scholar] [CrossRef]
- Gleaton, J.U.; Lynch, J.D. Properties of Generalized Log-Logistic Families of Lifetime Distributions. J. Probab. Stat. Sci. 2006, 4, 51-64. Available online: https://www.researchgate.net/publication/283595537_Properties_of_generalized_log-logistic_families_of_lifetime_distributions (accessed on 28 June 2024).
- Gupta, R.C.; Gupta, R.D. Proportional Reversed Hazard Rate Model and its Applications. J. Stat. Plan. Inference 2007, 137, 3525–3536. [Google Scholar] [CrossRef]
- Gupta, R.C.; Gupta, R.D. Exponentiated Exponential Family: An Alternative to Gamma and Weibull Distributions. Biometrical Journal: Journal of Mathematical Methods in Biosciences 2001, 43, 117–1306. [Google Scholar] [CrossRef]
- R Core Team. R Core Team: A Language and Environment for Statistical Computing; R Foundation for Statistical Computing: Vienna, Austria, 2024.
- Cox, D. R.; Snell, E. J. A General Definition of Residuals. Journal of the Royal Statistical Society. Series B (Methodological) 1968, 30, 248–275. [Google Scholar] [CrossRef]
- Cook, R. D.; Weisberg, S. Residuals and influence in regression. 1982. Chapman & Hall.
- Ortega, E. M. M.; Paula, G. A.; Bolfarine, H. Deviance Residuals in Generalised Log-gamma Regression Models with Censored Observations. Journal of Statistical Computation and Simulation) 2008, 78, 747–764. [Google Scholar] [CrossRef]
- Silva, G. O.; Ortega, E. M. M.; Paula, G. A. Residuals for Log-Burr XII Regression Models in Survival Analysis. Journal of Applied Statistics) 2011, 38, 1435–1445. [Google Scholar] [CrossRef]
- Atkinson, A.C. Plots, Transformations, and Regression: An Introduction to Graphical Methods of Diagnostic Regression Analysis. Clarendon Press 1987. [CrossRef]
- Mead, M. E. A. A Note on Kumaraswamy Fréchet Distribution. Australia 2014, 8, 294-300. Available online: http://www.ajbasweb.com/old/ajbas/2014/September/294-300.pdf (accessed on 28 June 2024).
- Adepoju, K. A.; Chukwu, O. I. Maximum Likelihood Estimation of the Kumaraswamy exponential Distribution with Applications. Journal of Modern Applied Statistical Methods 2015, 14, 208–214. [Google Scholar] [CrossRef]
- Kudriavtsev, A. A. On the Representation of Gamma-exponential and Generalized Negative Binomial Distributions. Informatika i Ee Primeneniya [Informatics and its Applications]s2019,13, 76-80. [CrossRef]
- Nadarajah, S.; Kotz, S. The Beta Exponential Distribution.Reliability Engineering & System Safety 2006,91, 689-697. [CrossRef]
- Fréchet, M. Sur La Loi de Probabilité de L’écart Maximum.Ann. de la Soc. Polonaise de Math. Available online: https://cir.nii.ac.jp/crid/1572261550191409280 (accessed on 28 June 2024).
- Marinho, P.R.D.; Silva, R.B.; Bourguignon, M.; Cordeiro, G.M.; Nadarajah, S. AdequacyModel: An R package for probability distributions and general purpose optimization.PLoS ONE 2019,14, e0221487. https://doi.org/10.1371/journal.pone.0221487. [CrossRef]
Figure 1.
GOLLE hrf for selected values.
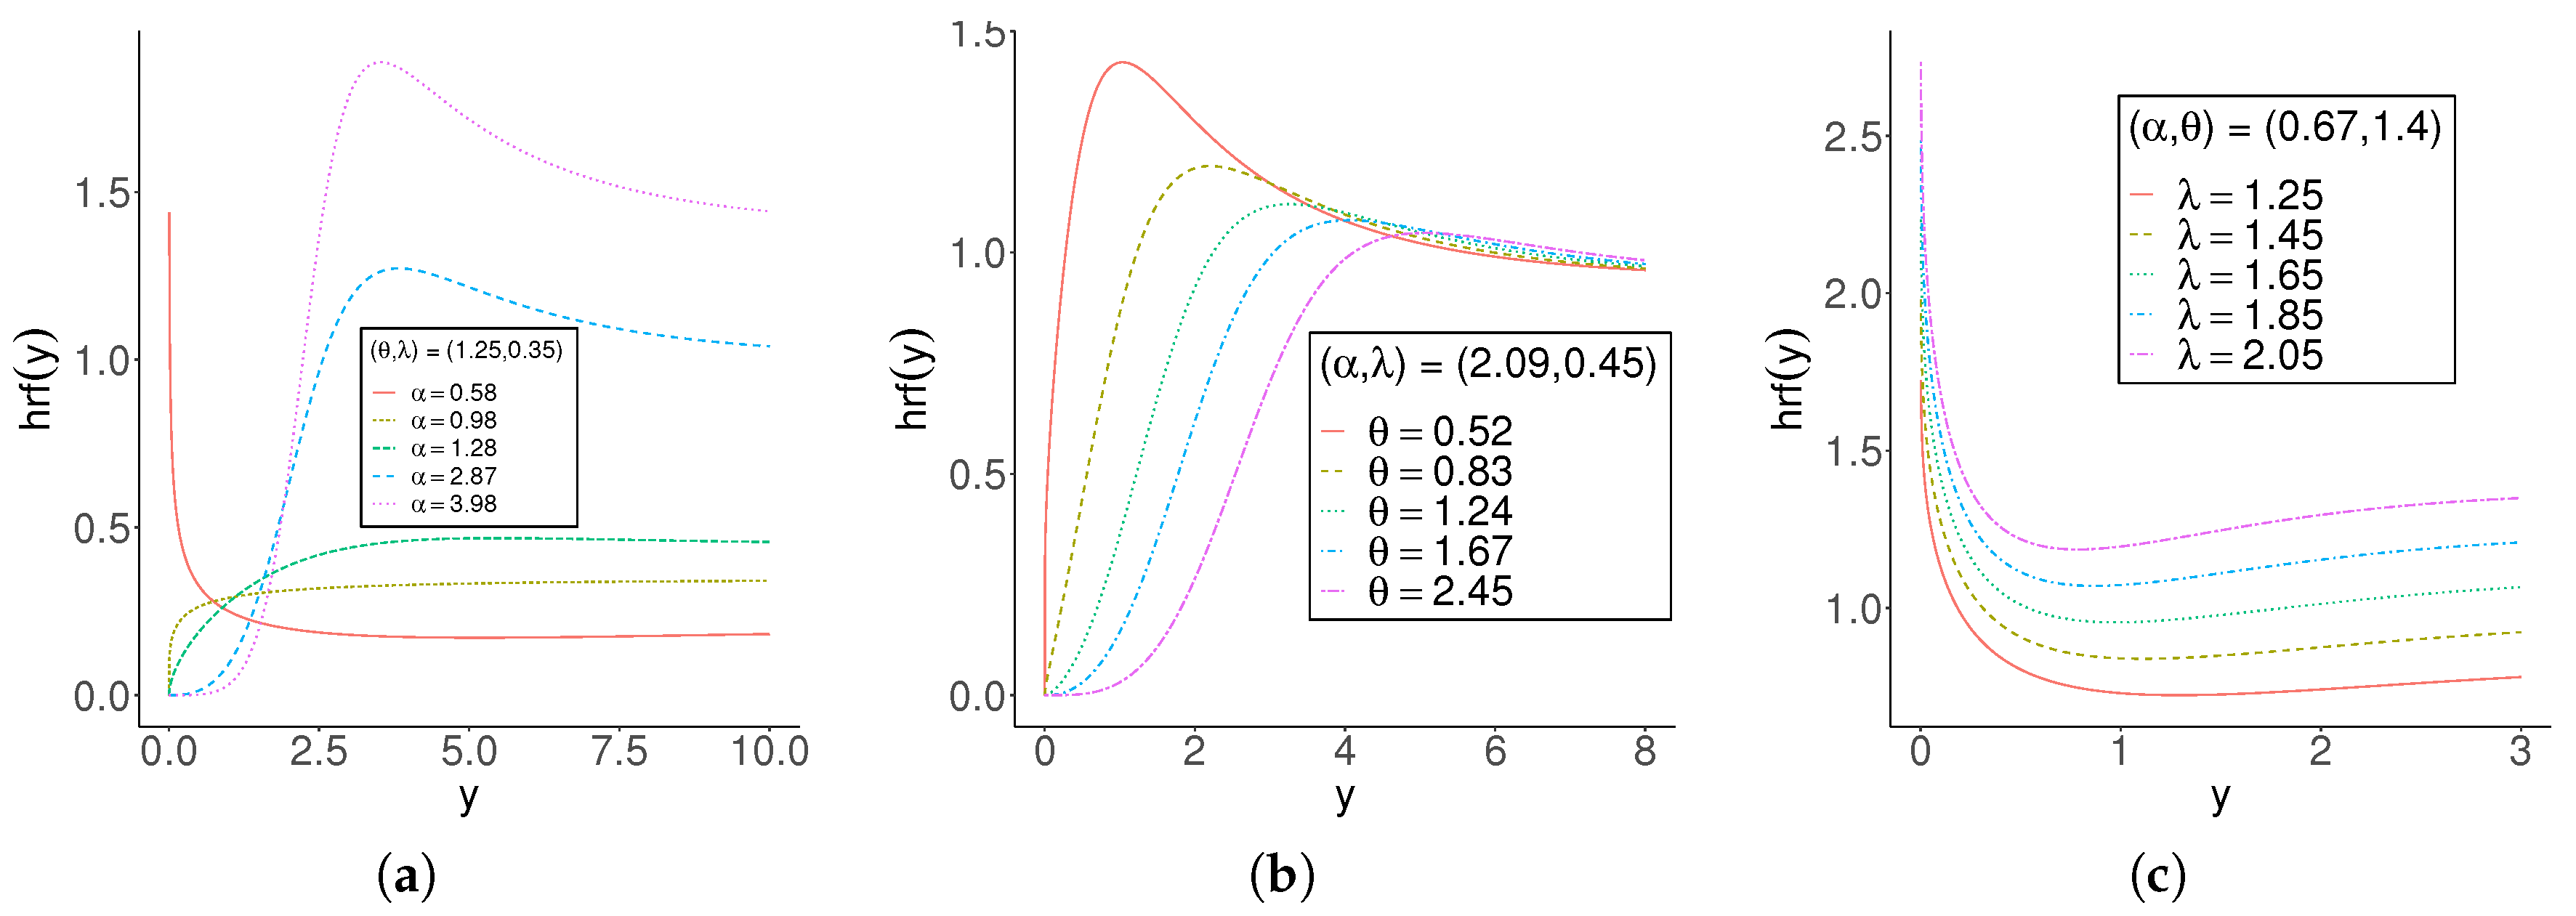
Figure 2.
GOLLE histogram. (a) GOLLE(0.15,73,2.50). (b) GOLLE(0.22,1.13,7.50). (c) GOLLE(0.07,120.13,3.50).
Figure 2.
GOLLE histogram. (a) GOLLE(0.15,73,2.50). (b) GOLLE(0.22,1.13,7.50). (c) GOLLE(0.07,120.13,3.50).
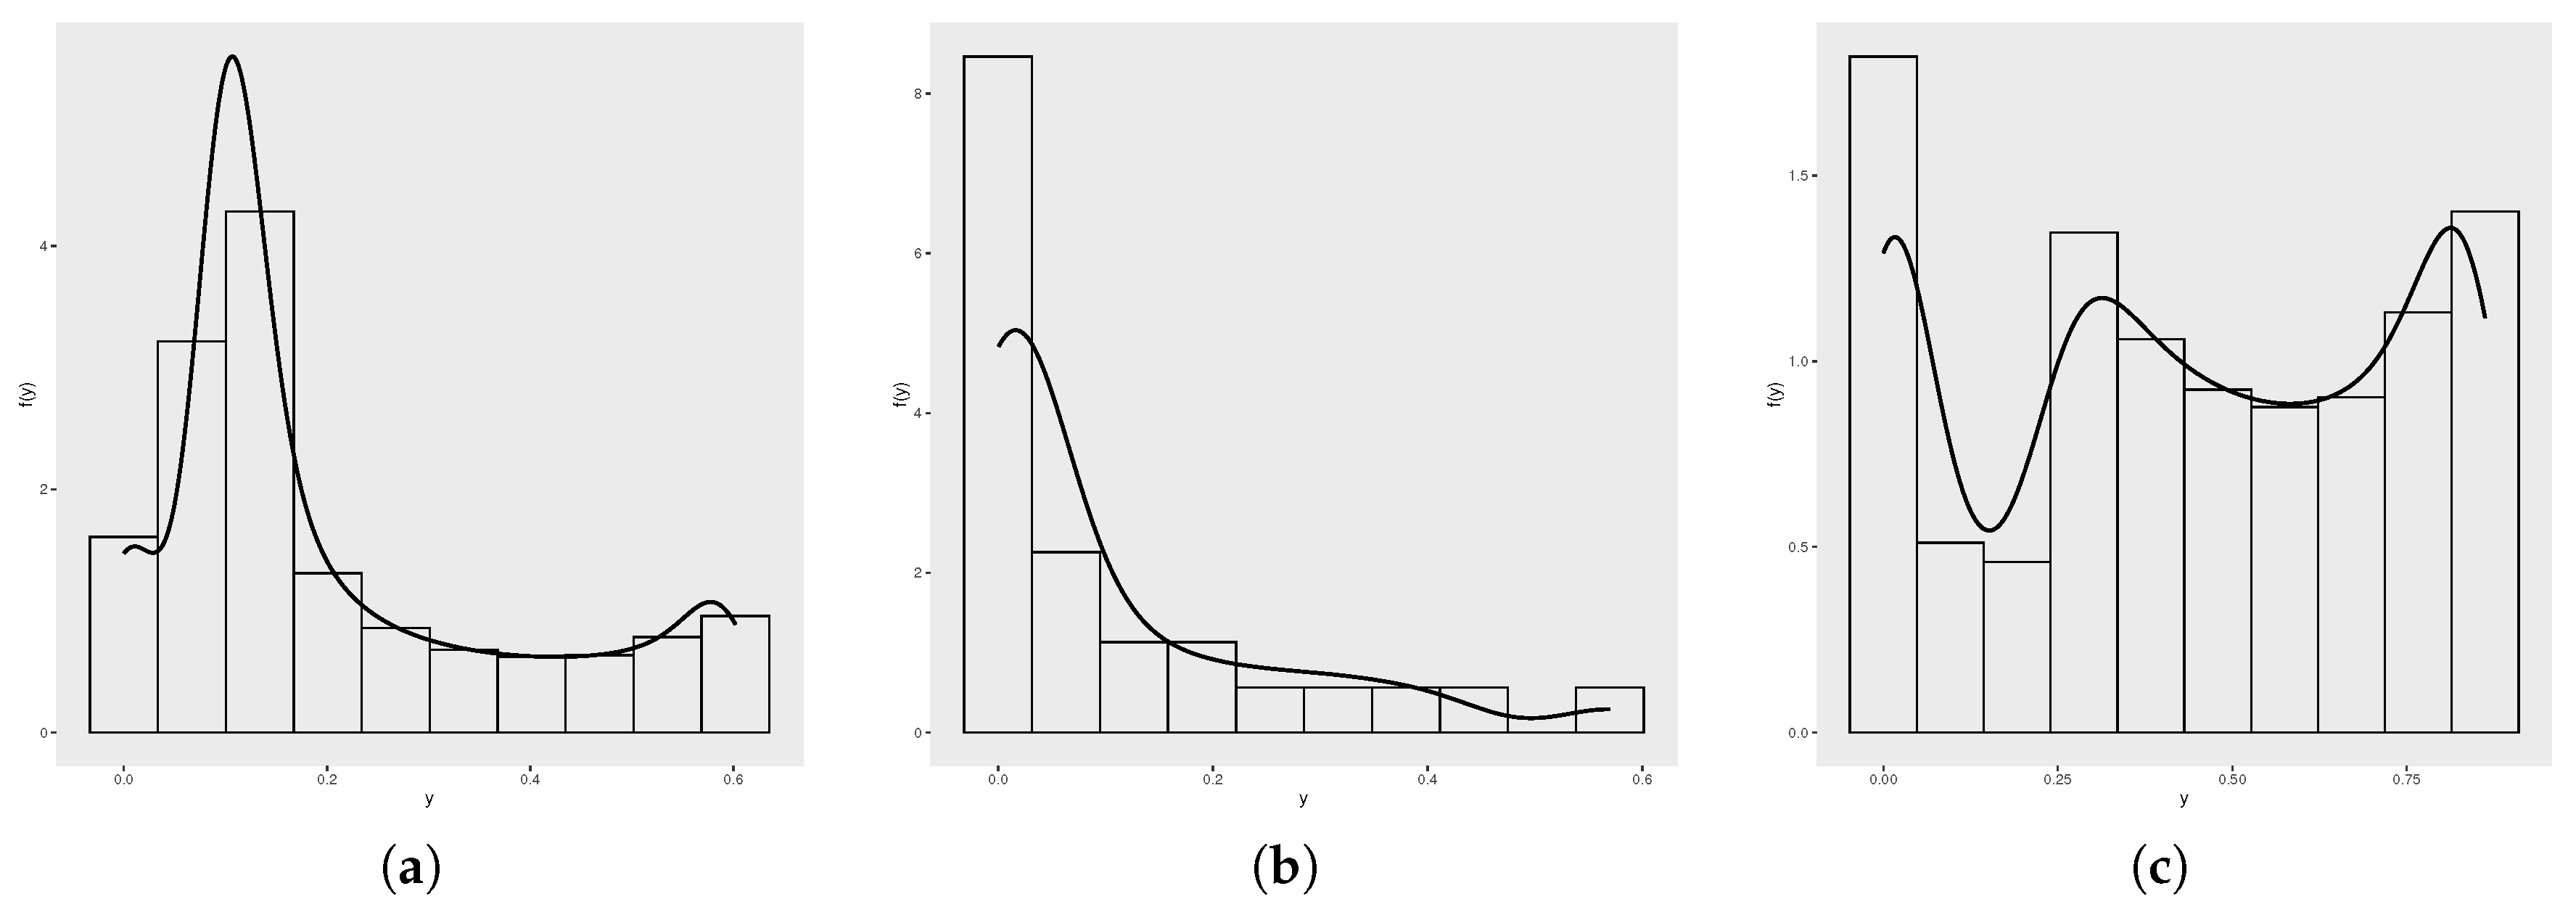
Figure 3.
GOLLE distribution. (a) Galton’s skewness. (b) Moors’ kurtosis.
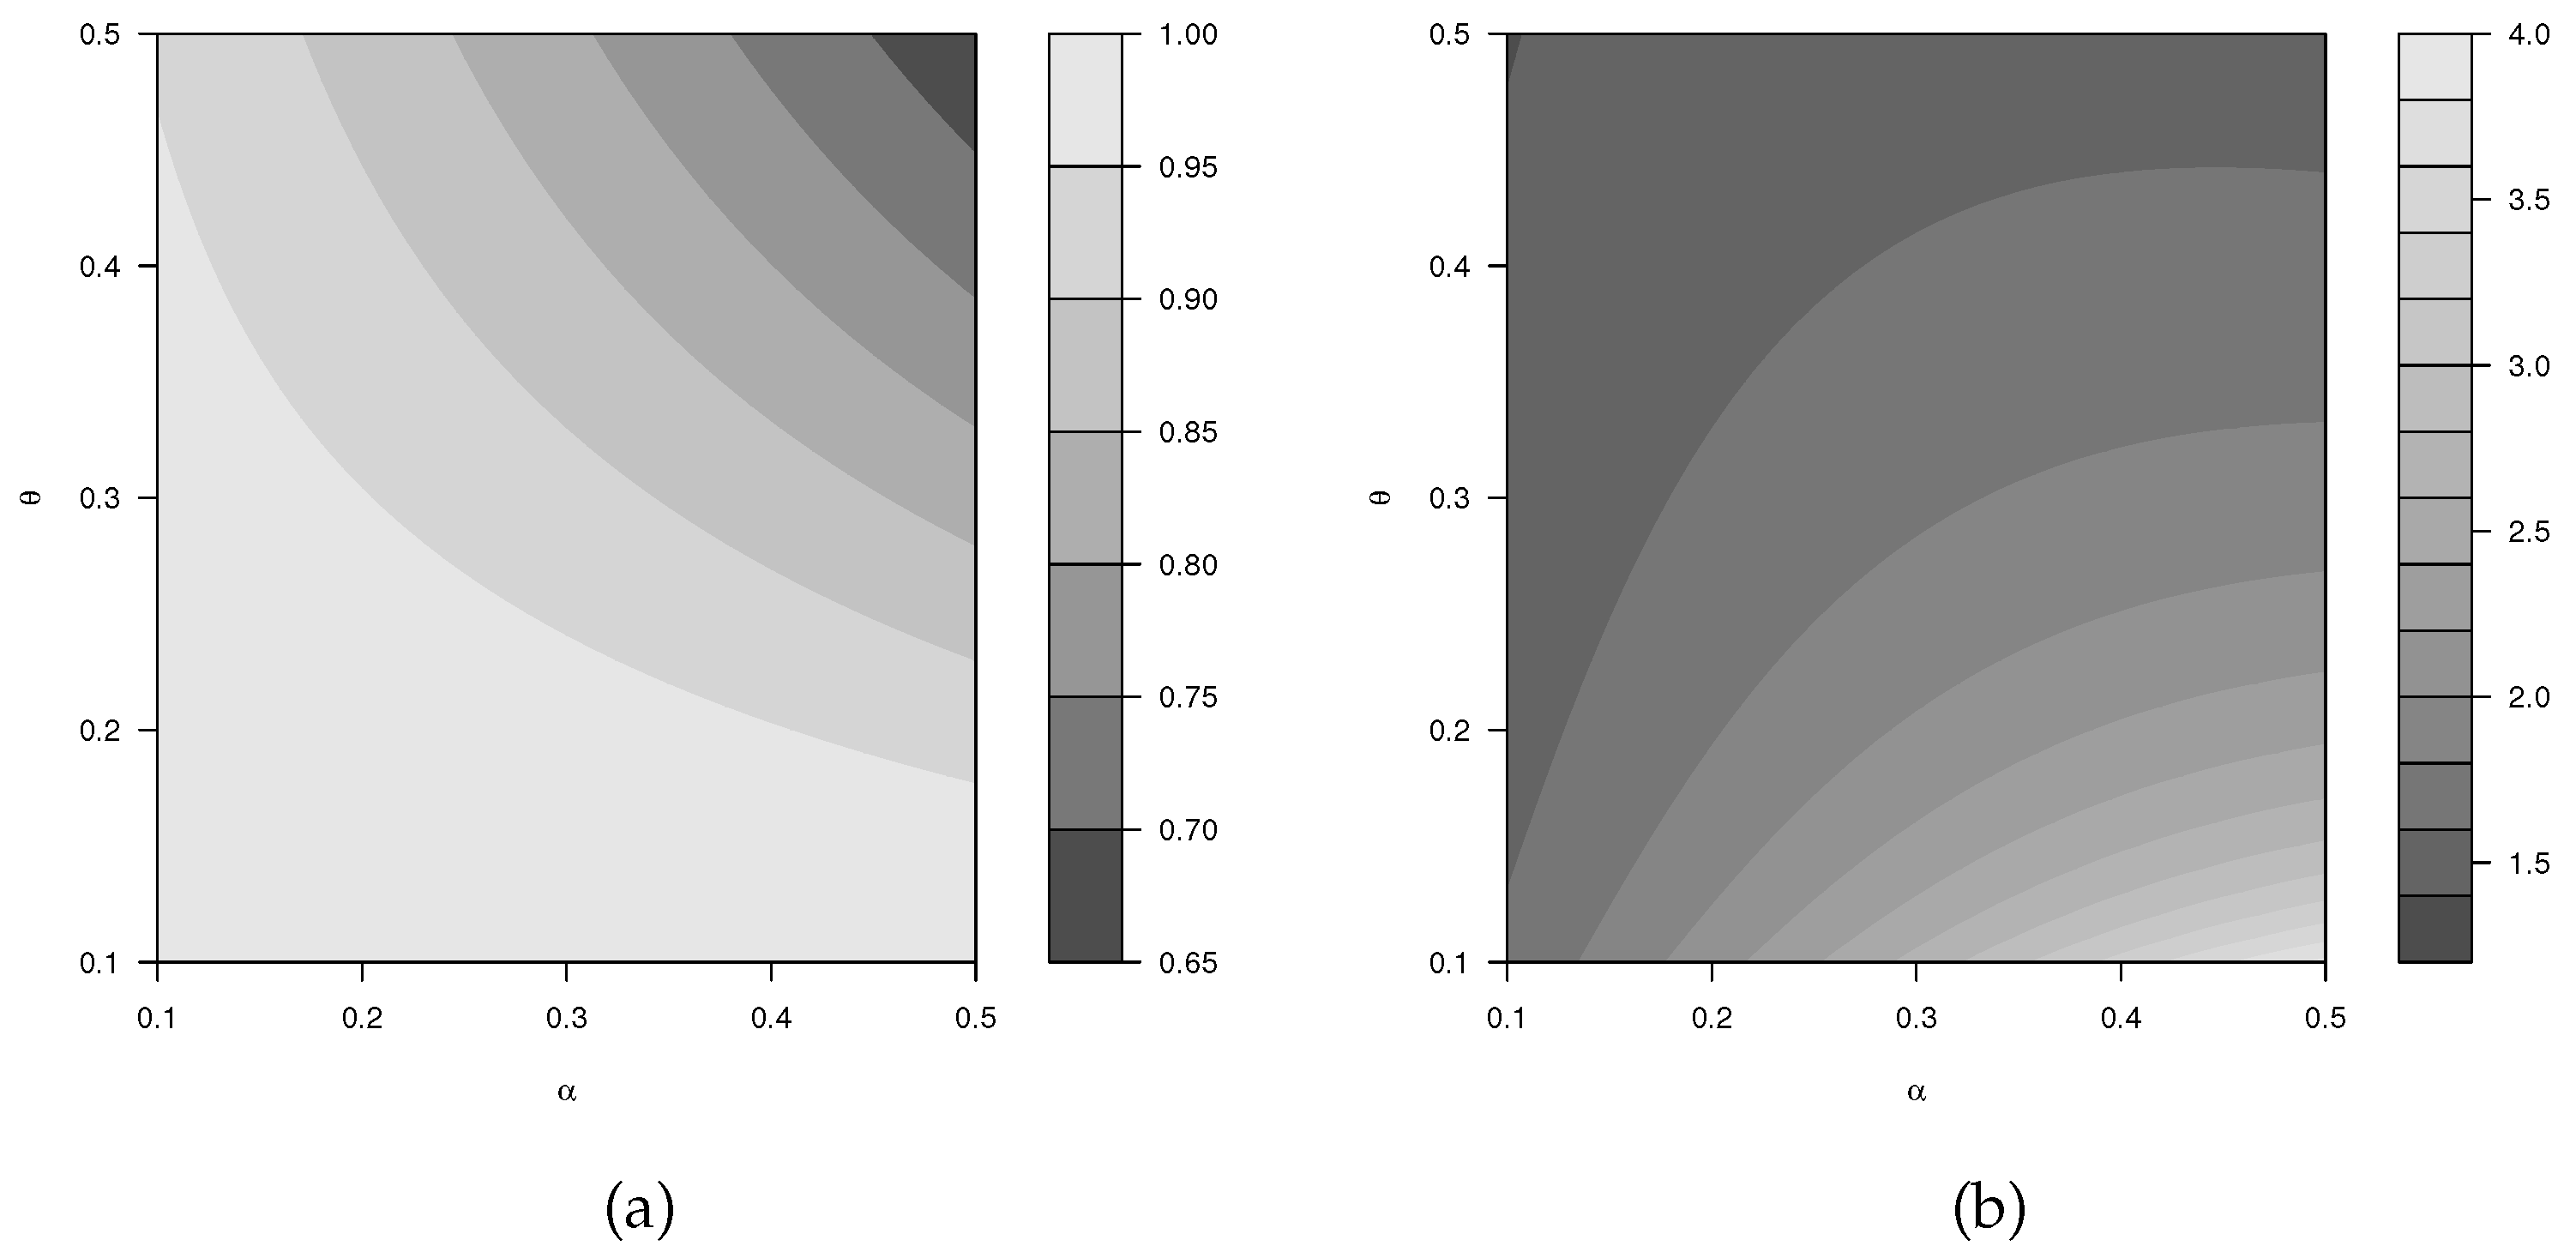
Figure 4.
Plots odf the LGOLLE density function for selected values. (a) For and . (b) For and . (c) For and .
Figure 4.
Plots odf the LGOLLE density function for selected values. (a) For and . (b) For and . (c) For and .
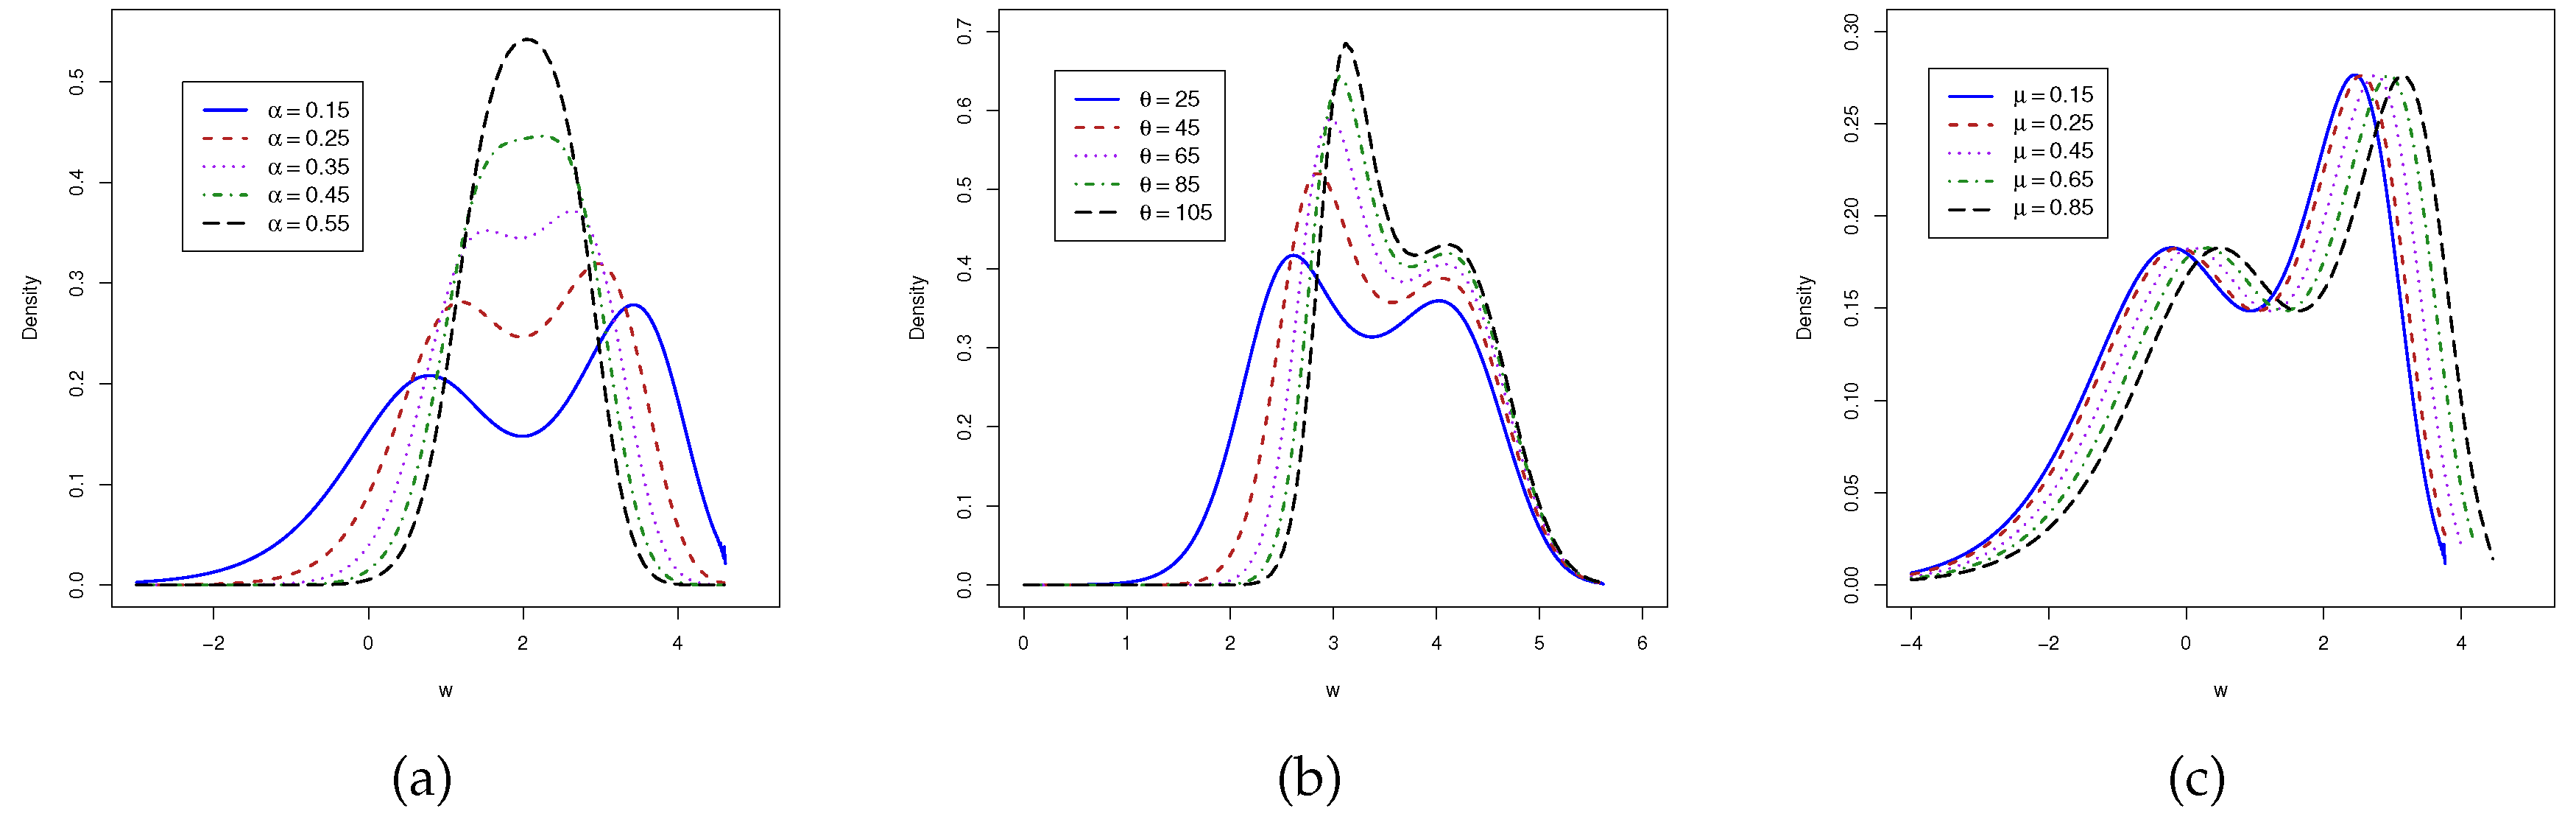
Figure 5.
Biases versus sample size from LGOLLE regression model.
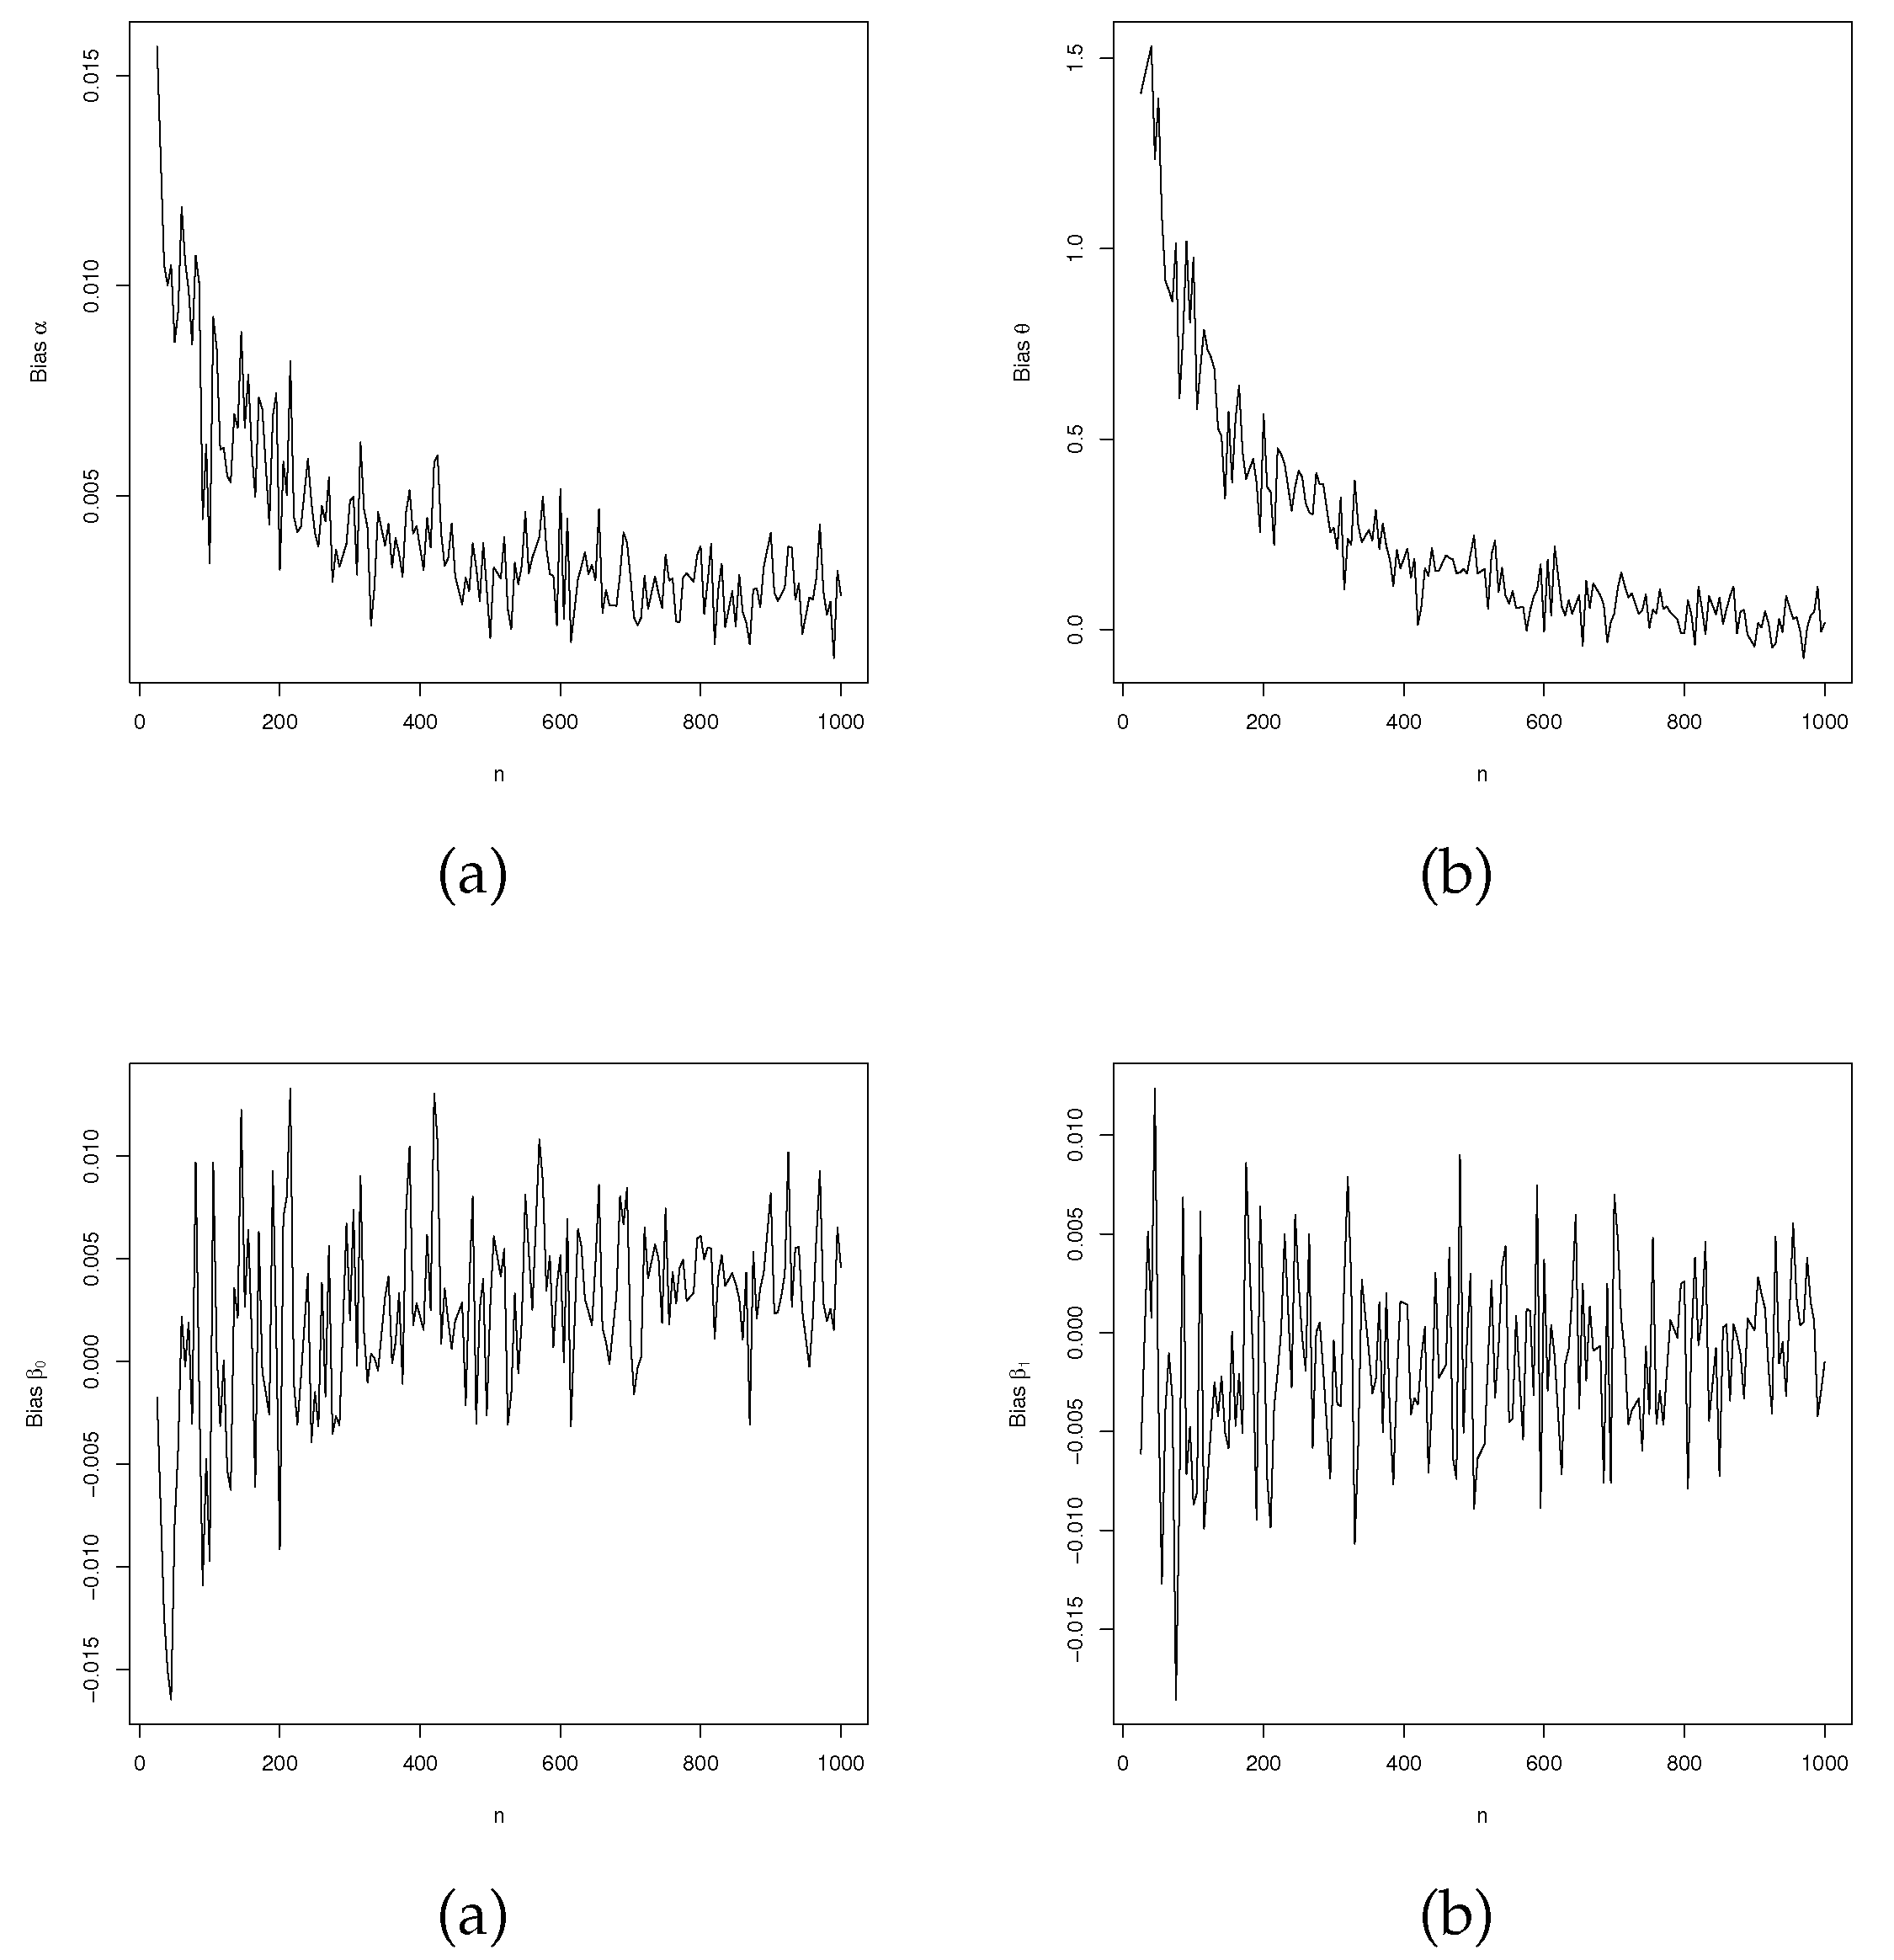
Figure 6.
MSEs versus sample size from LGOLLE regression model.
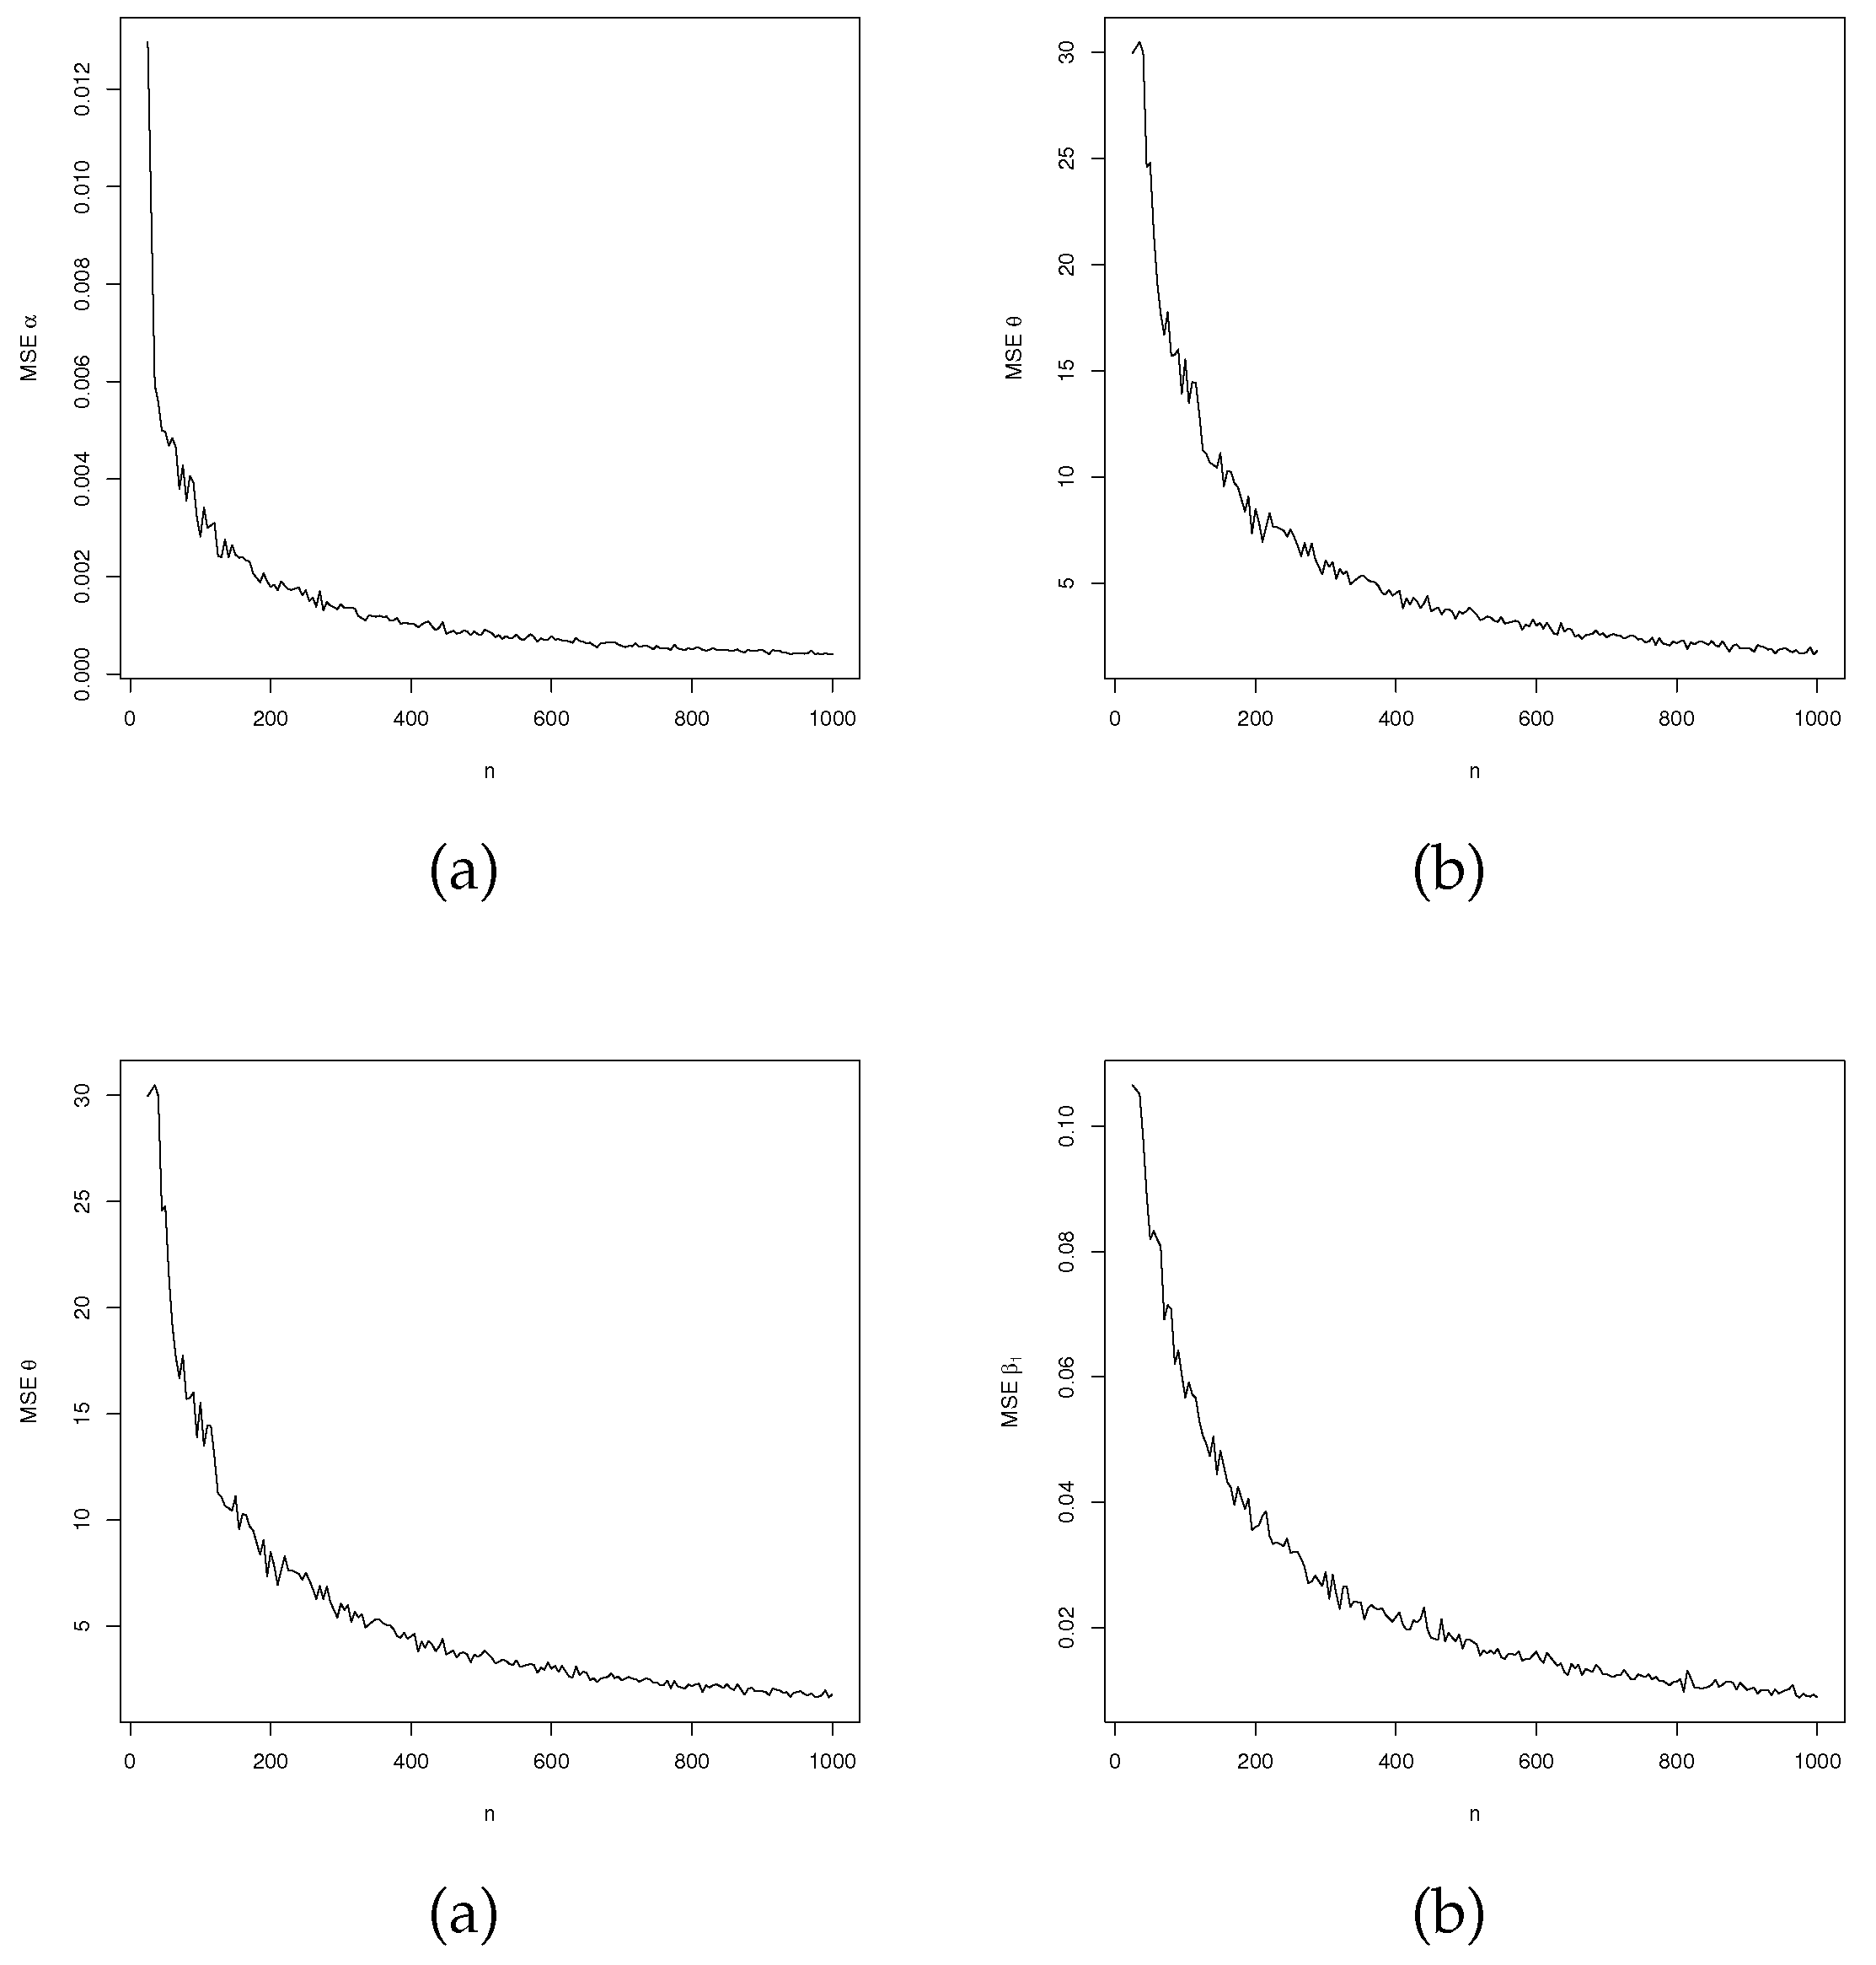
Figure 7.
ALs versus sample size from LGOLLE regression model.
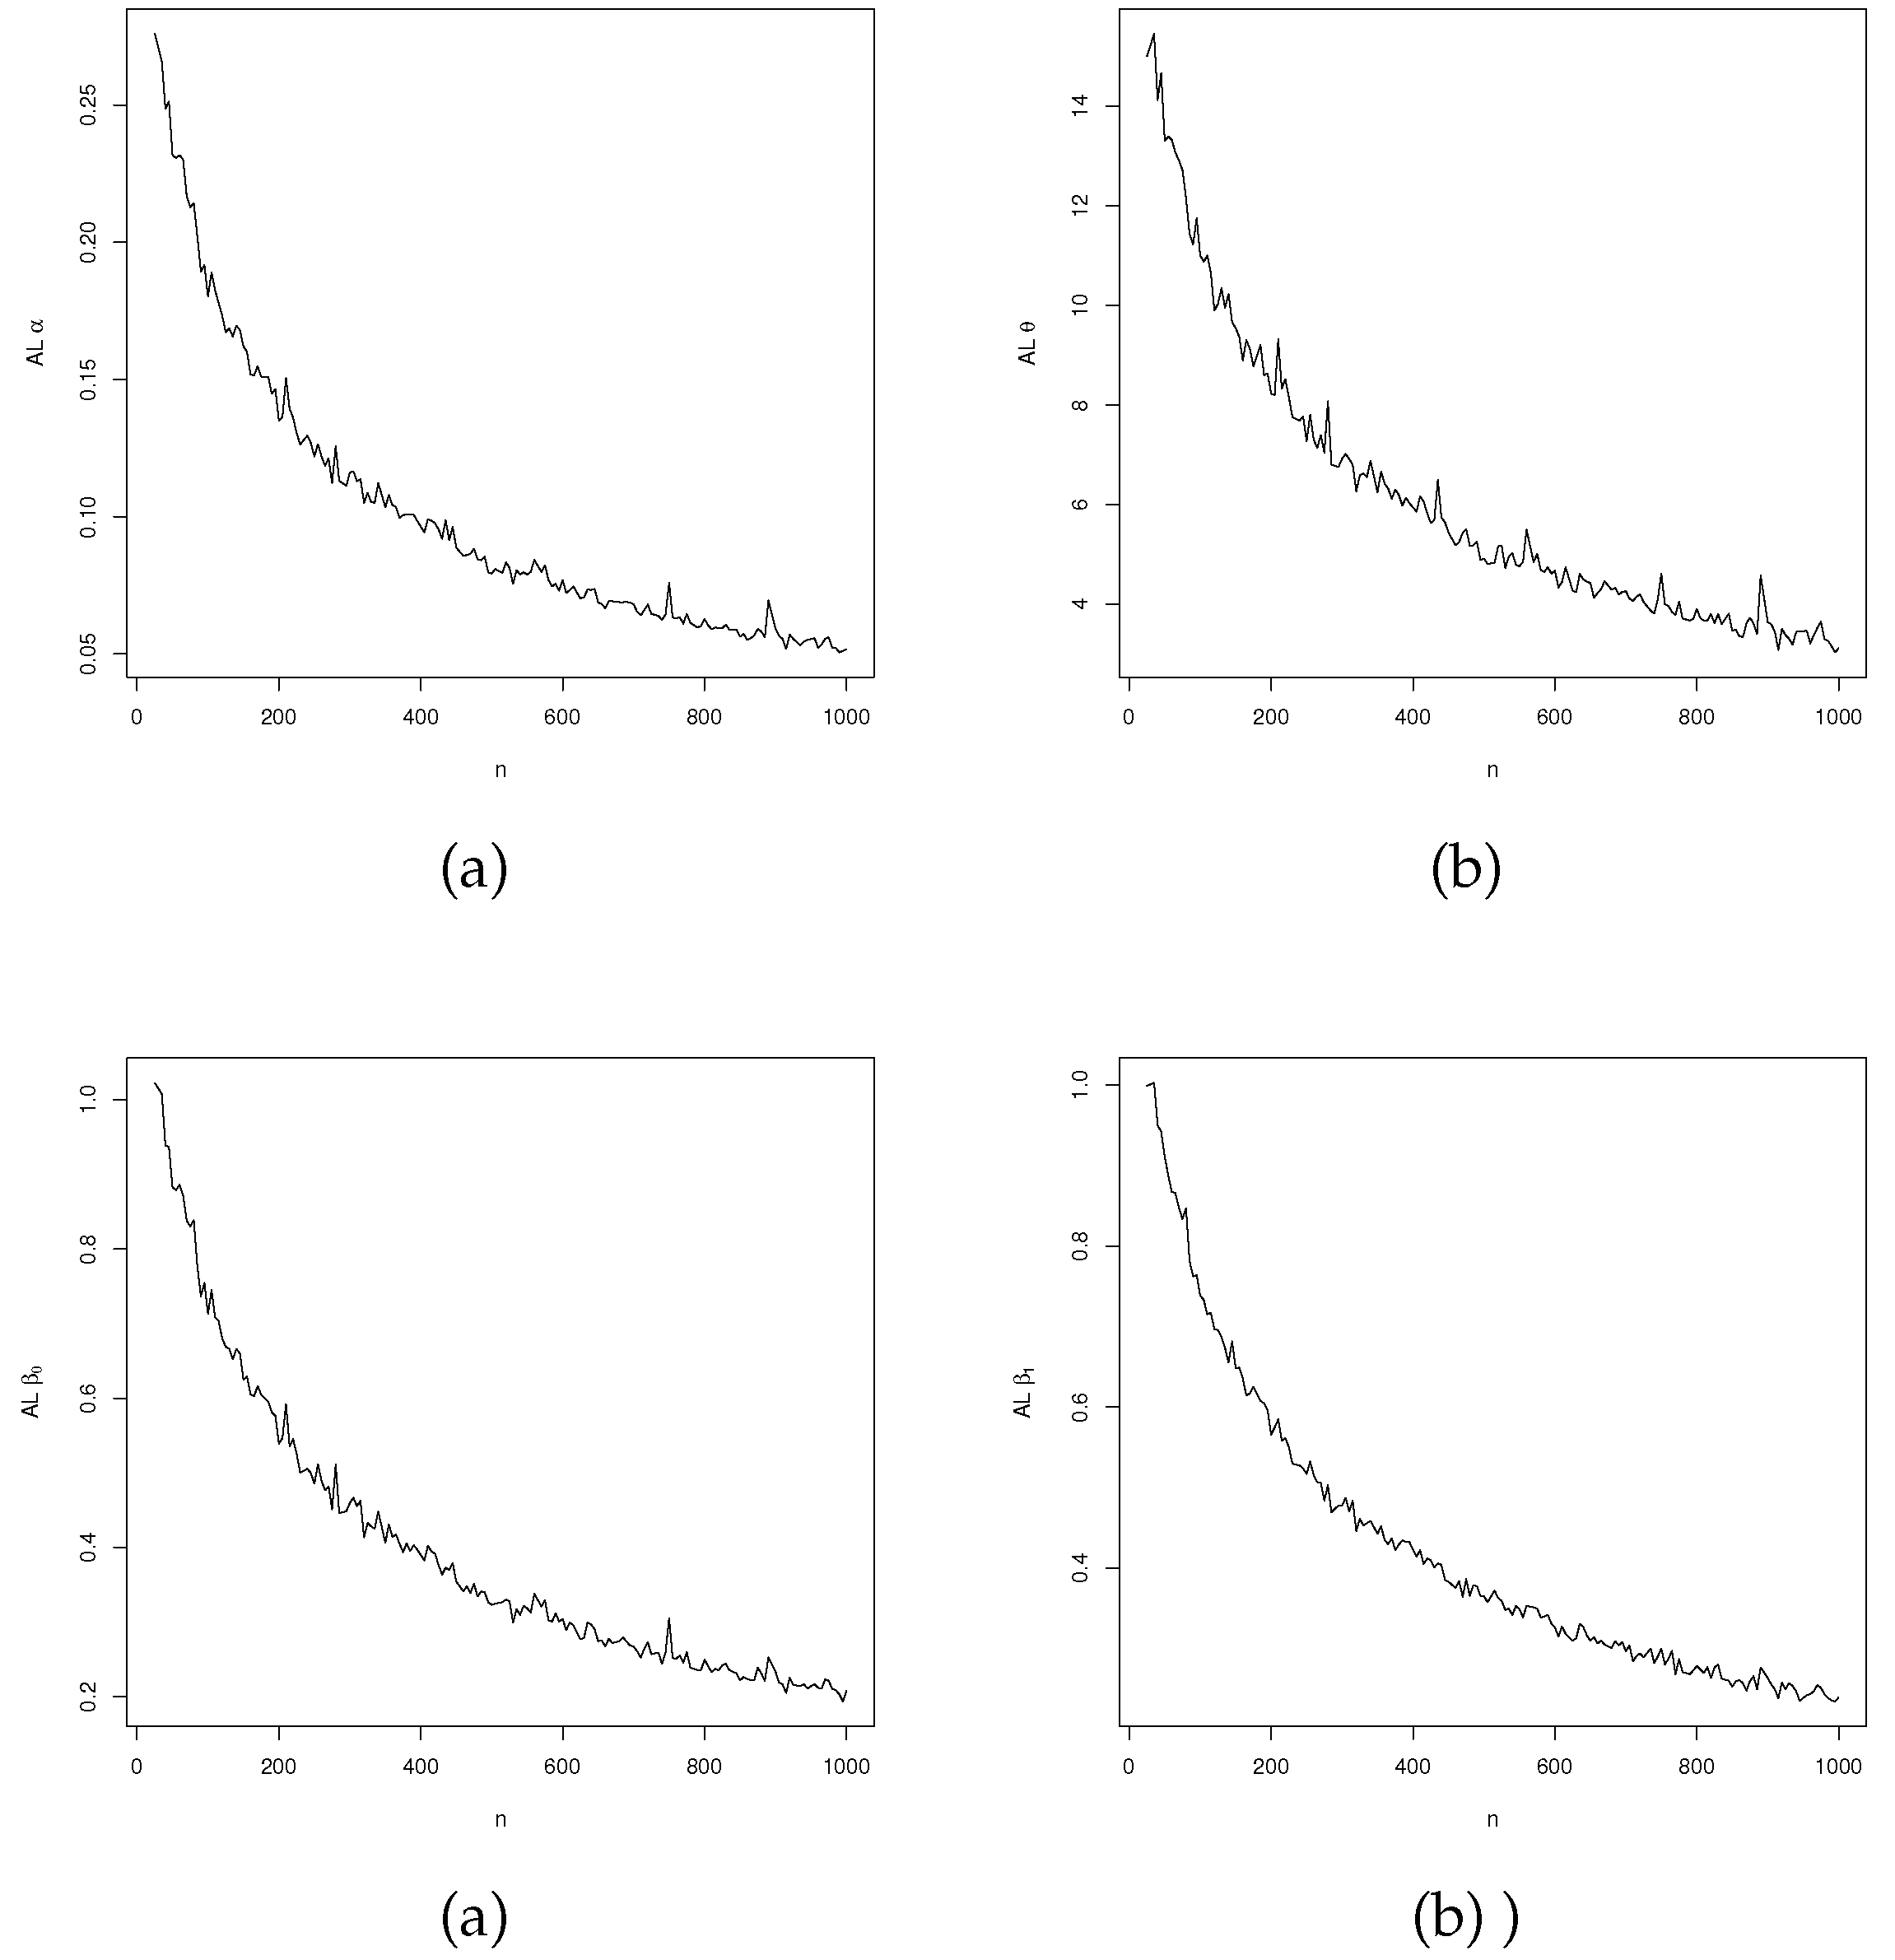
Figure 8.
Dengue fever cases data. (a) Histogram and empirical density. (b) Variation across months with trend smoothed line.
Figure 8.
Dengue fever cases data. (a) Histogram and empirical density. (b) Variation across months with trend smoothed line.

Figure 9.
Dengue fever cases data. (a) ACF. (b) PACF.
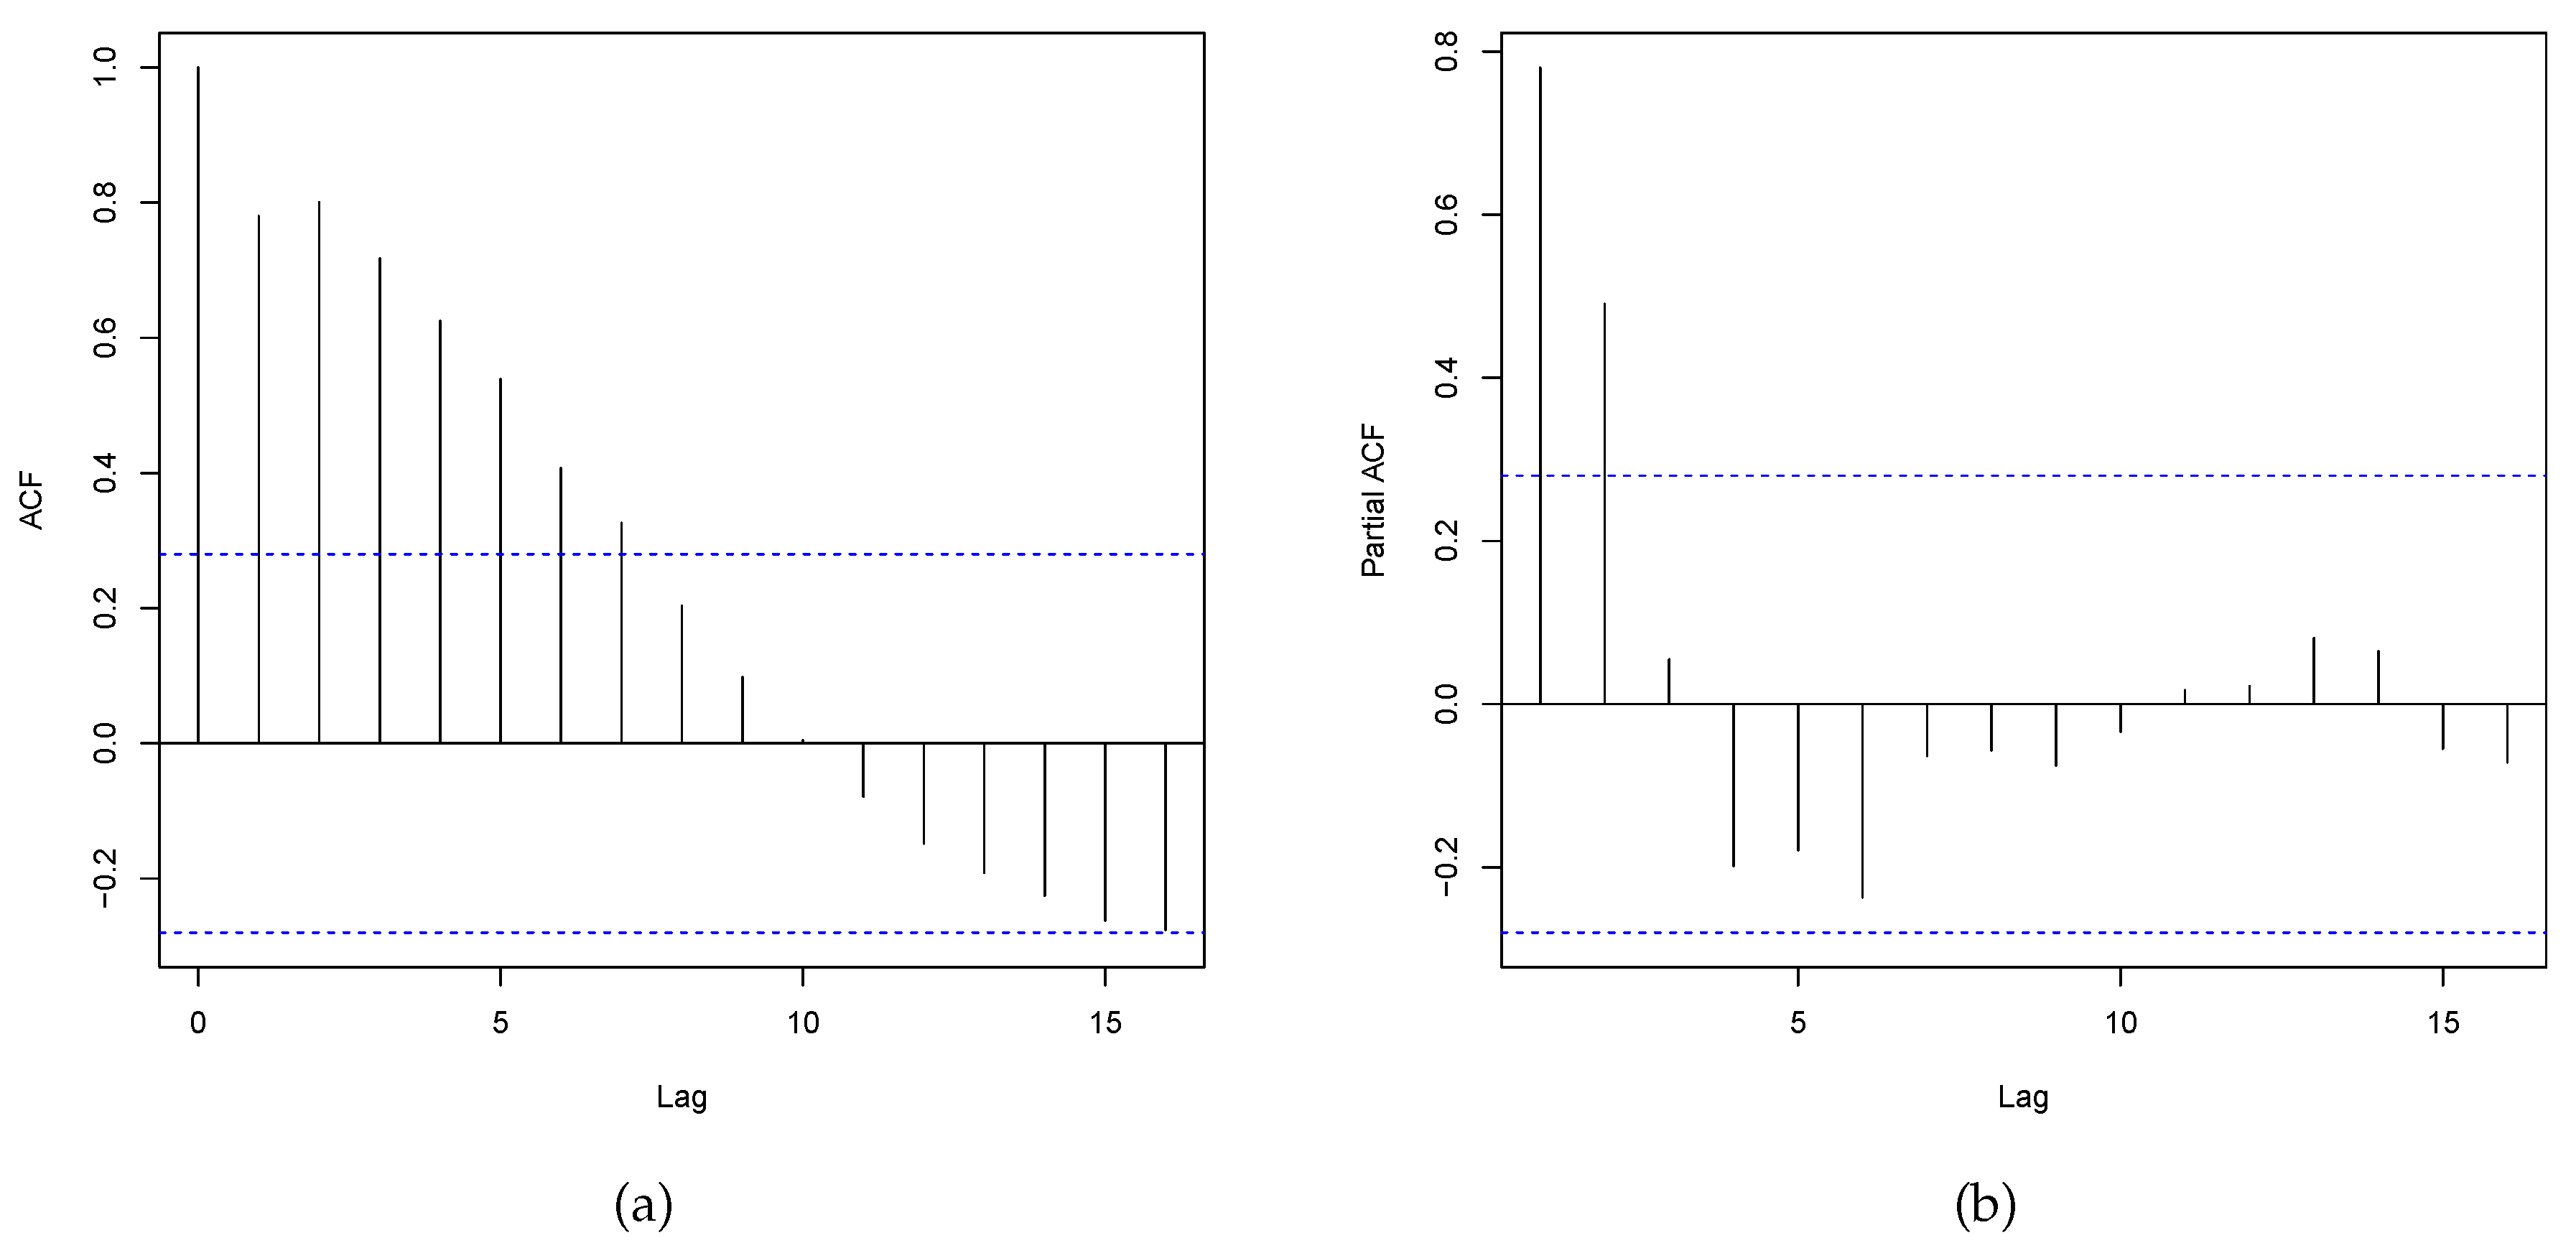
Figure 10.
Fitted models of dengue fever cases data. (a) Histogram and estimated pdfs. (b) Empirical and estimated cdfs.
Figure 10.
Fitted models of dengue fever cases data. (a) Histogram and estimated pdfs. (b) Empirical and estimated cdfs.
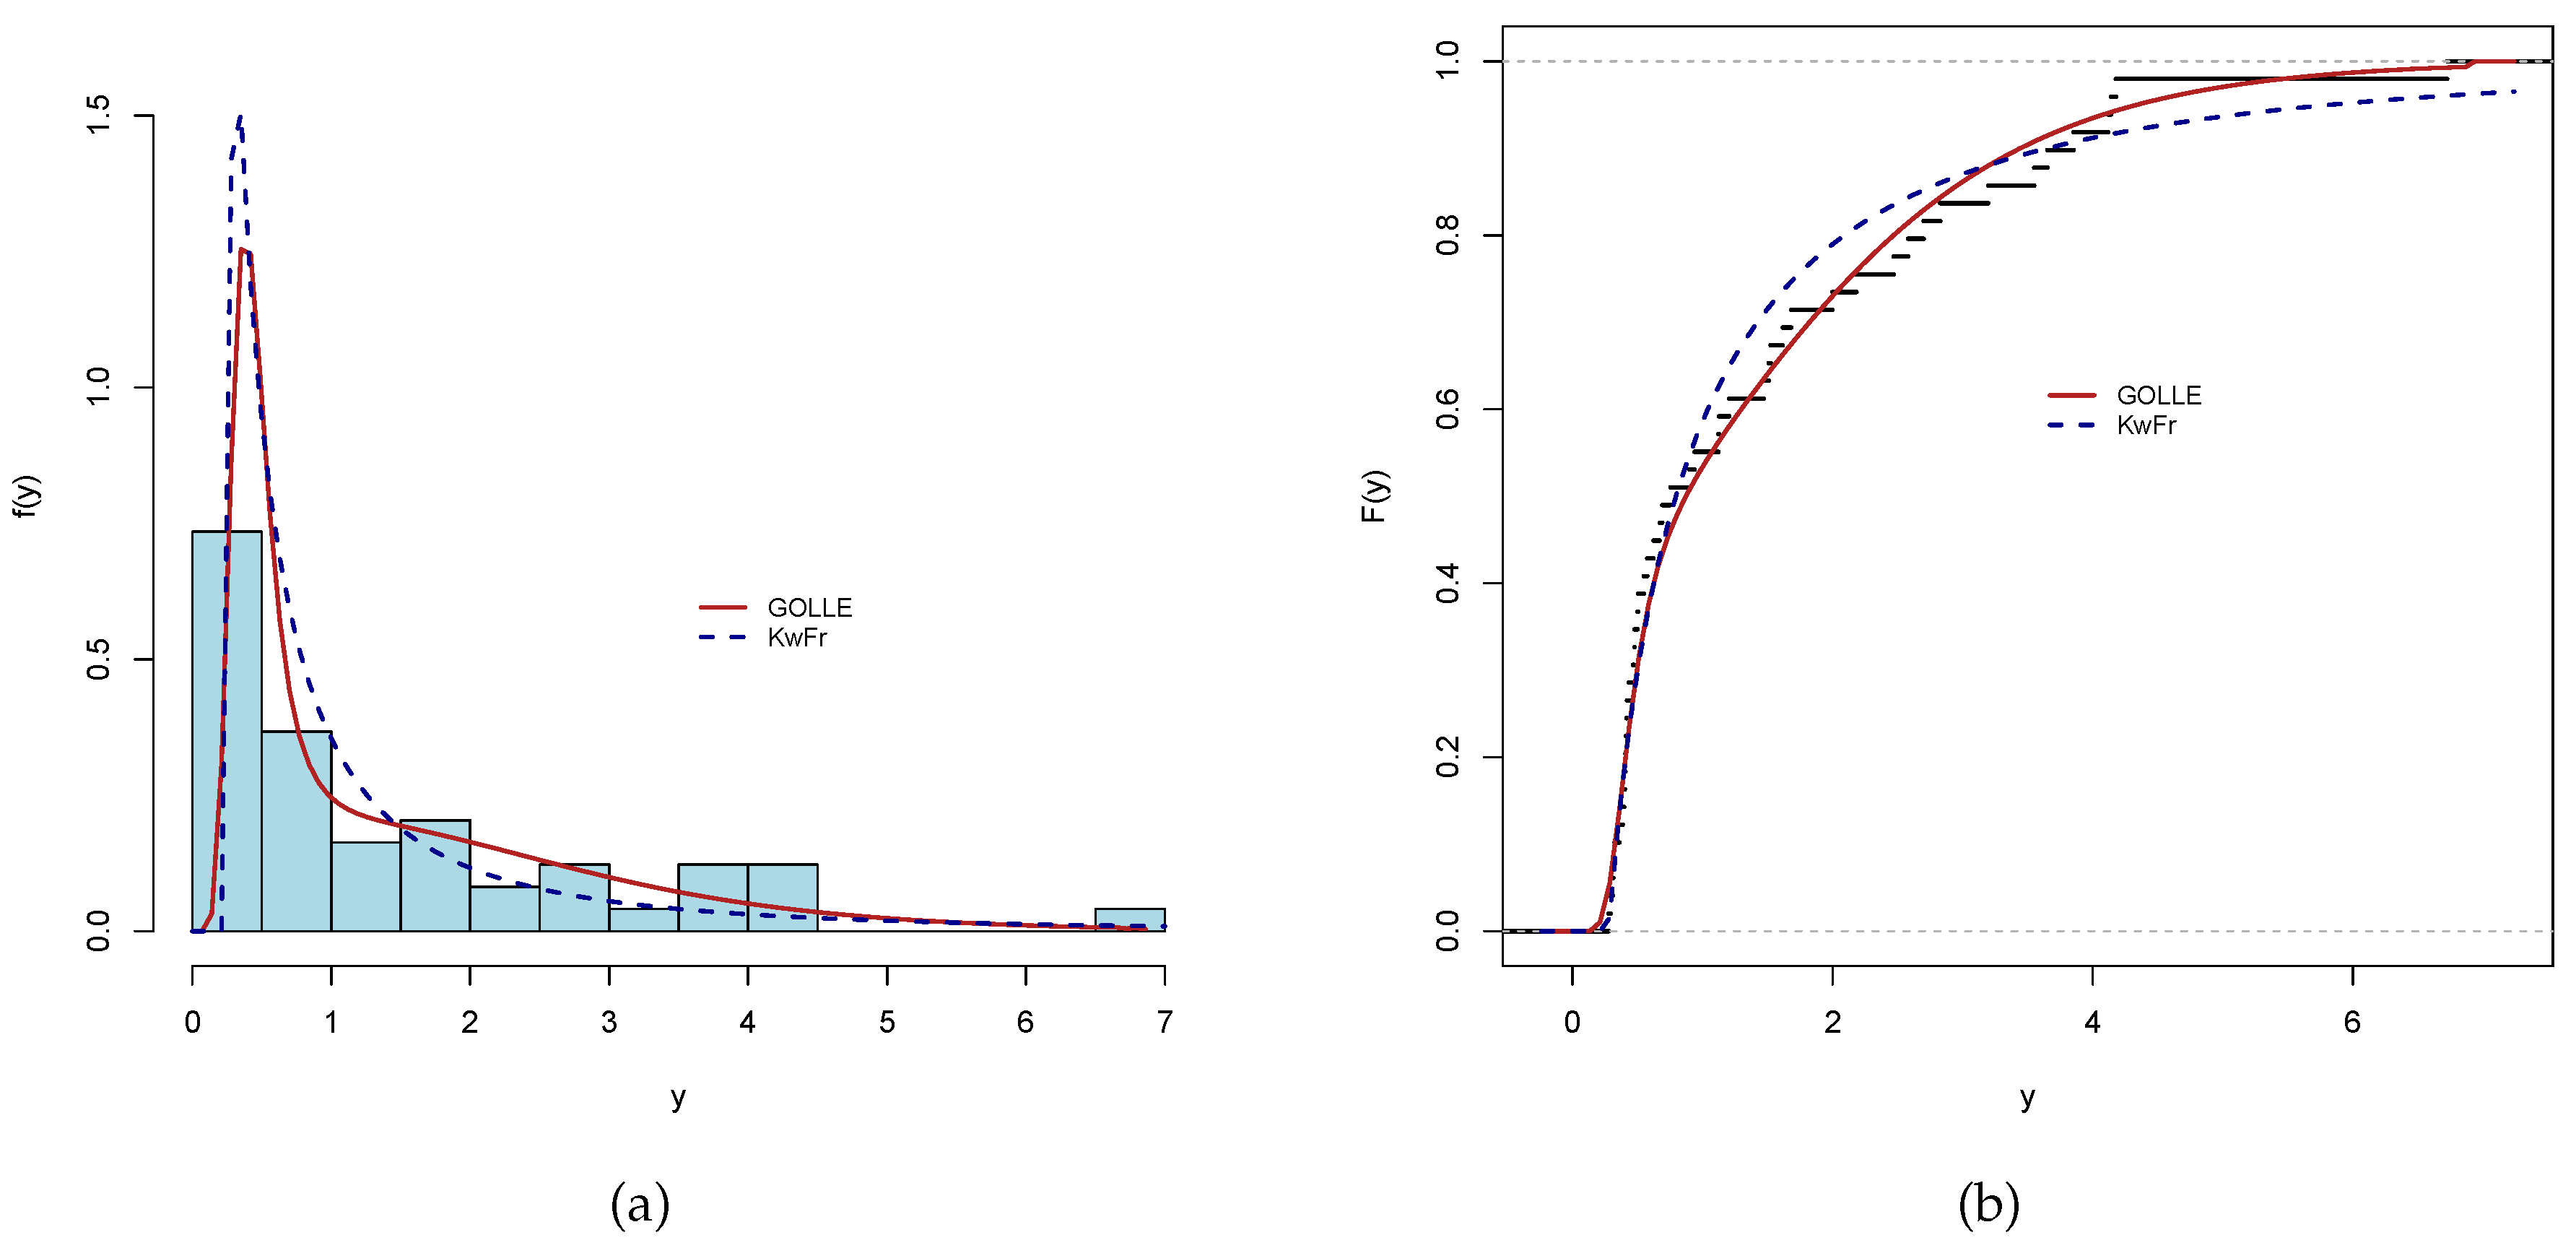
Figure 11.
Log-dengue fever cases data. (a) ACF. (b) PACF.
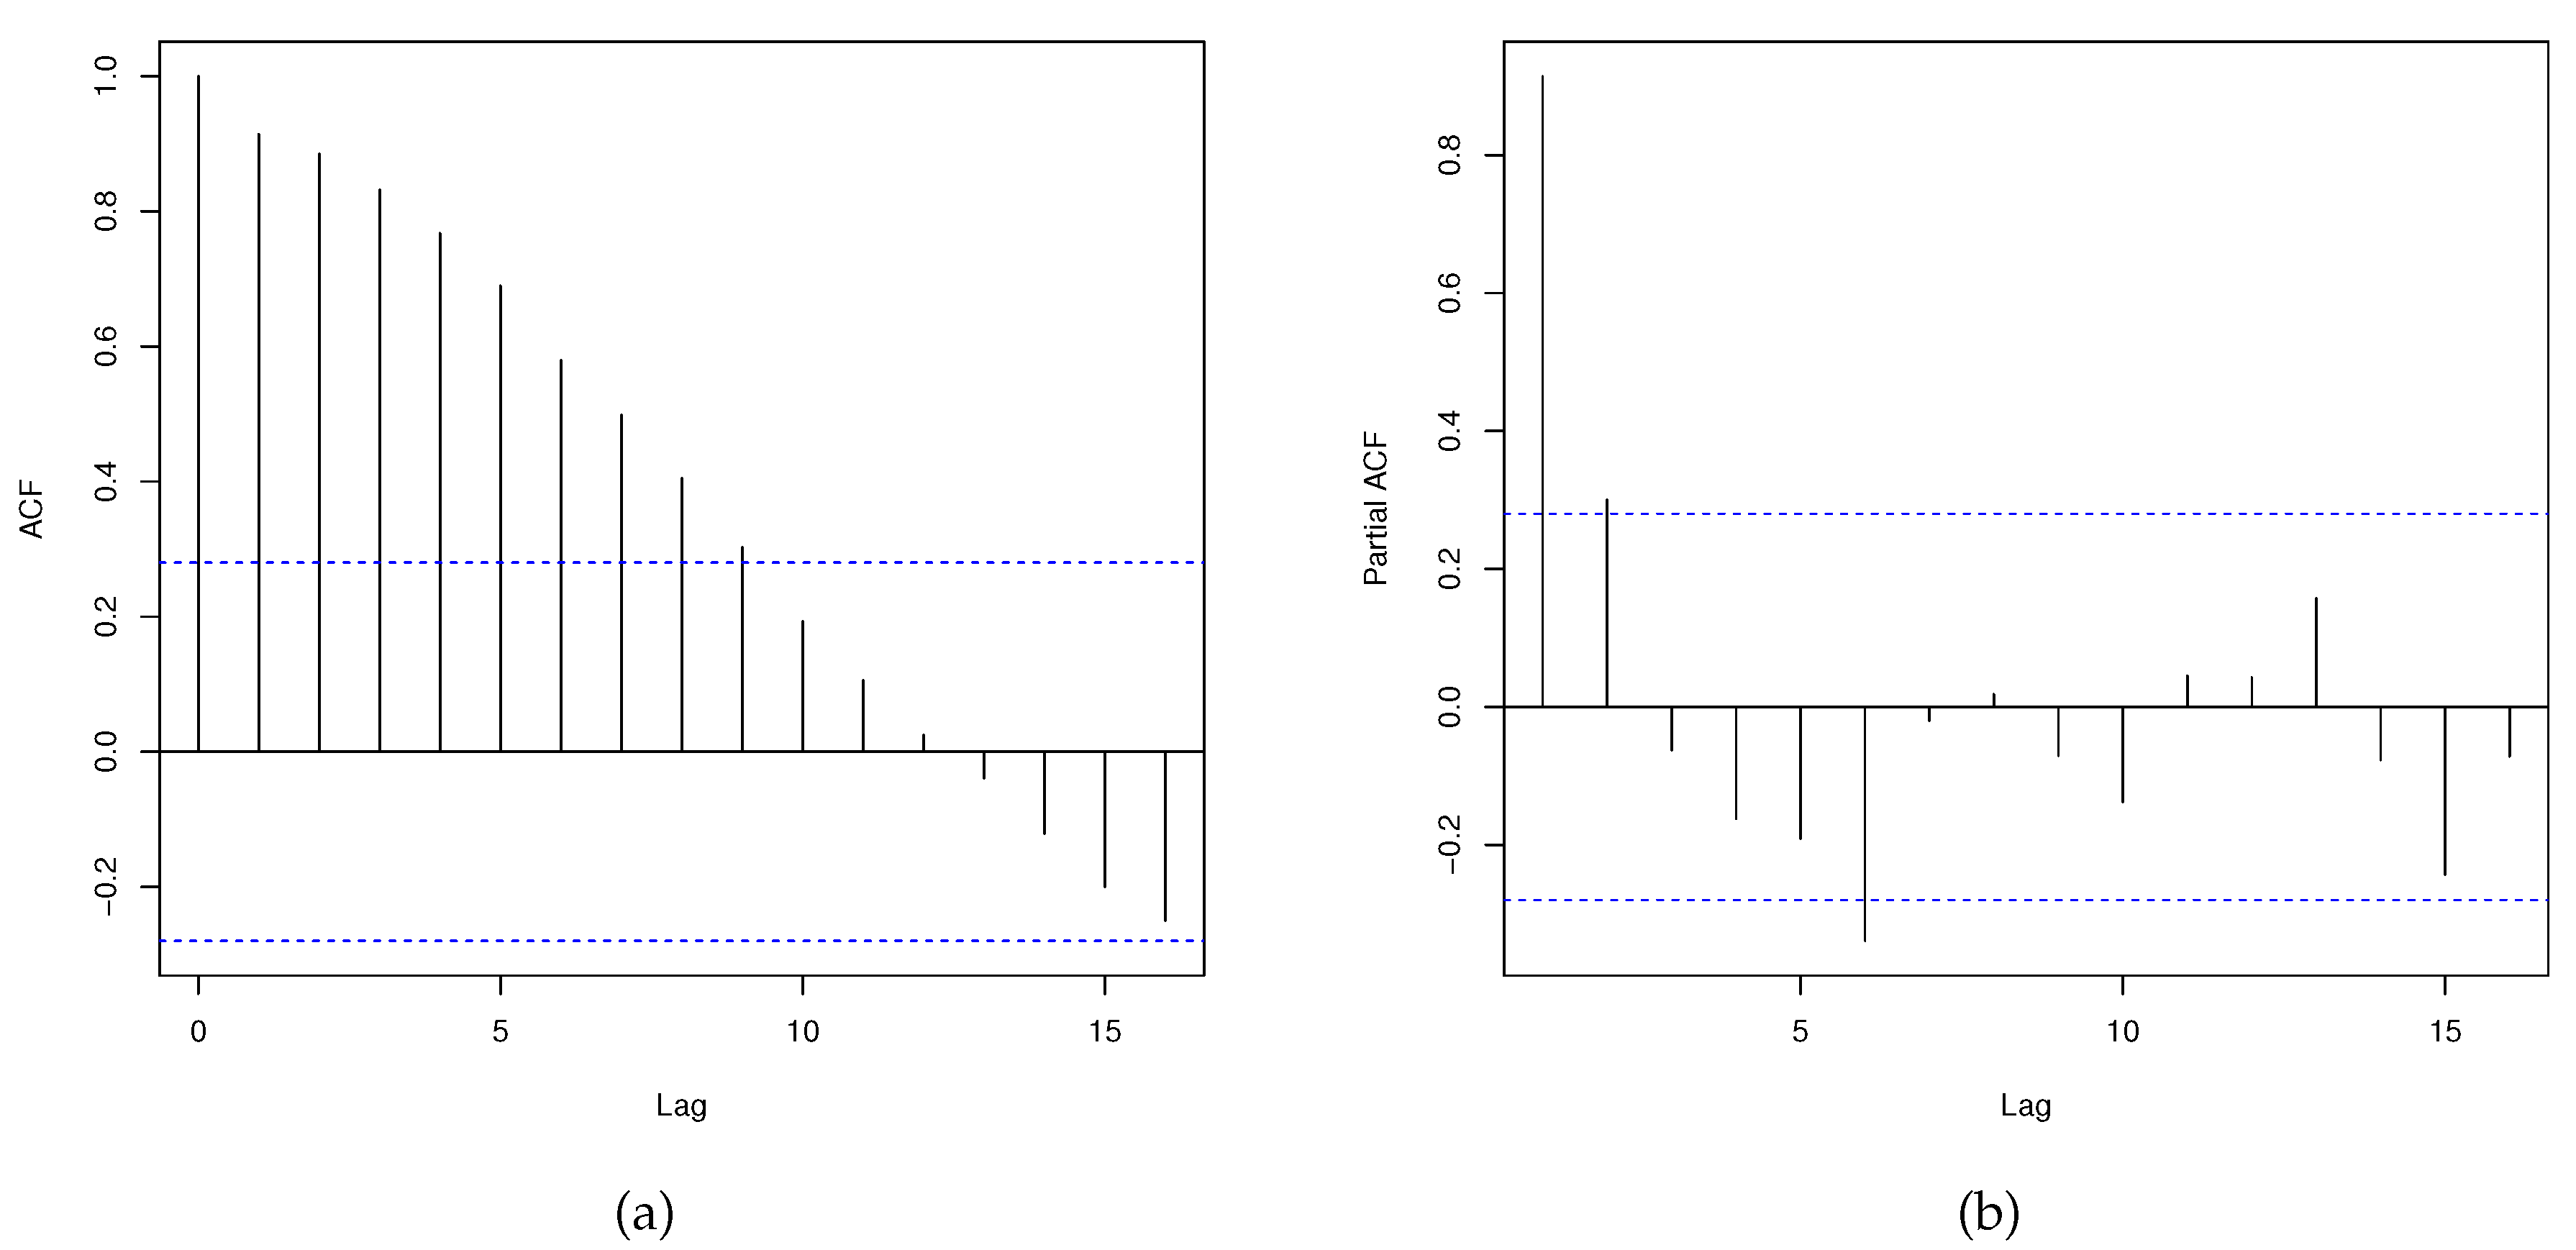
Figure 12.
Log dengue fever cases data. (a) Histogram and empirical density. (b) Variation across months with trend smoothed line.
Figure 12.
Log dengue fever cases data. (a) Histogram and empirical density. (b) Variation across months with trend smoothed line.
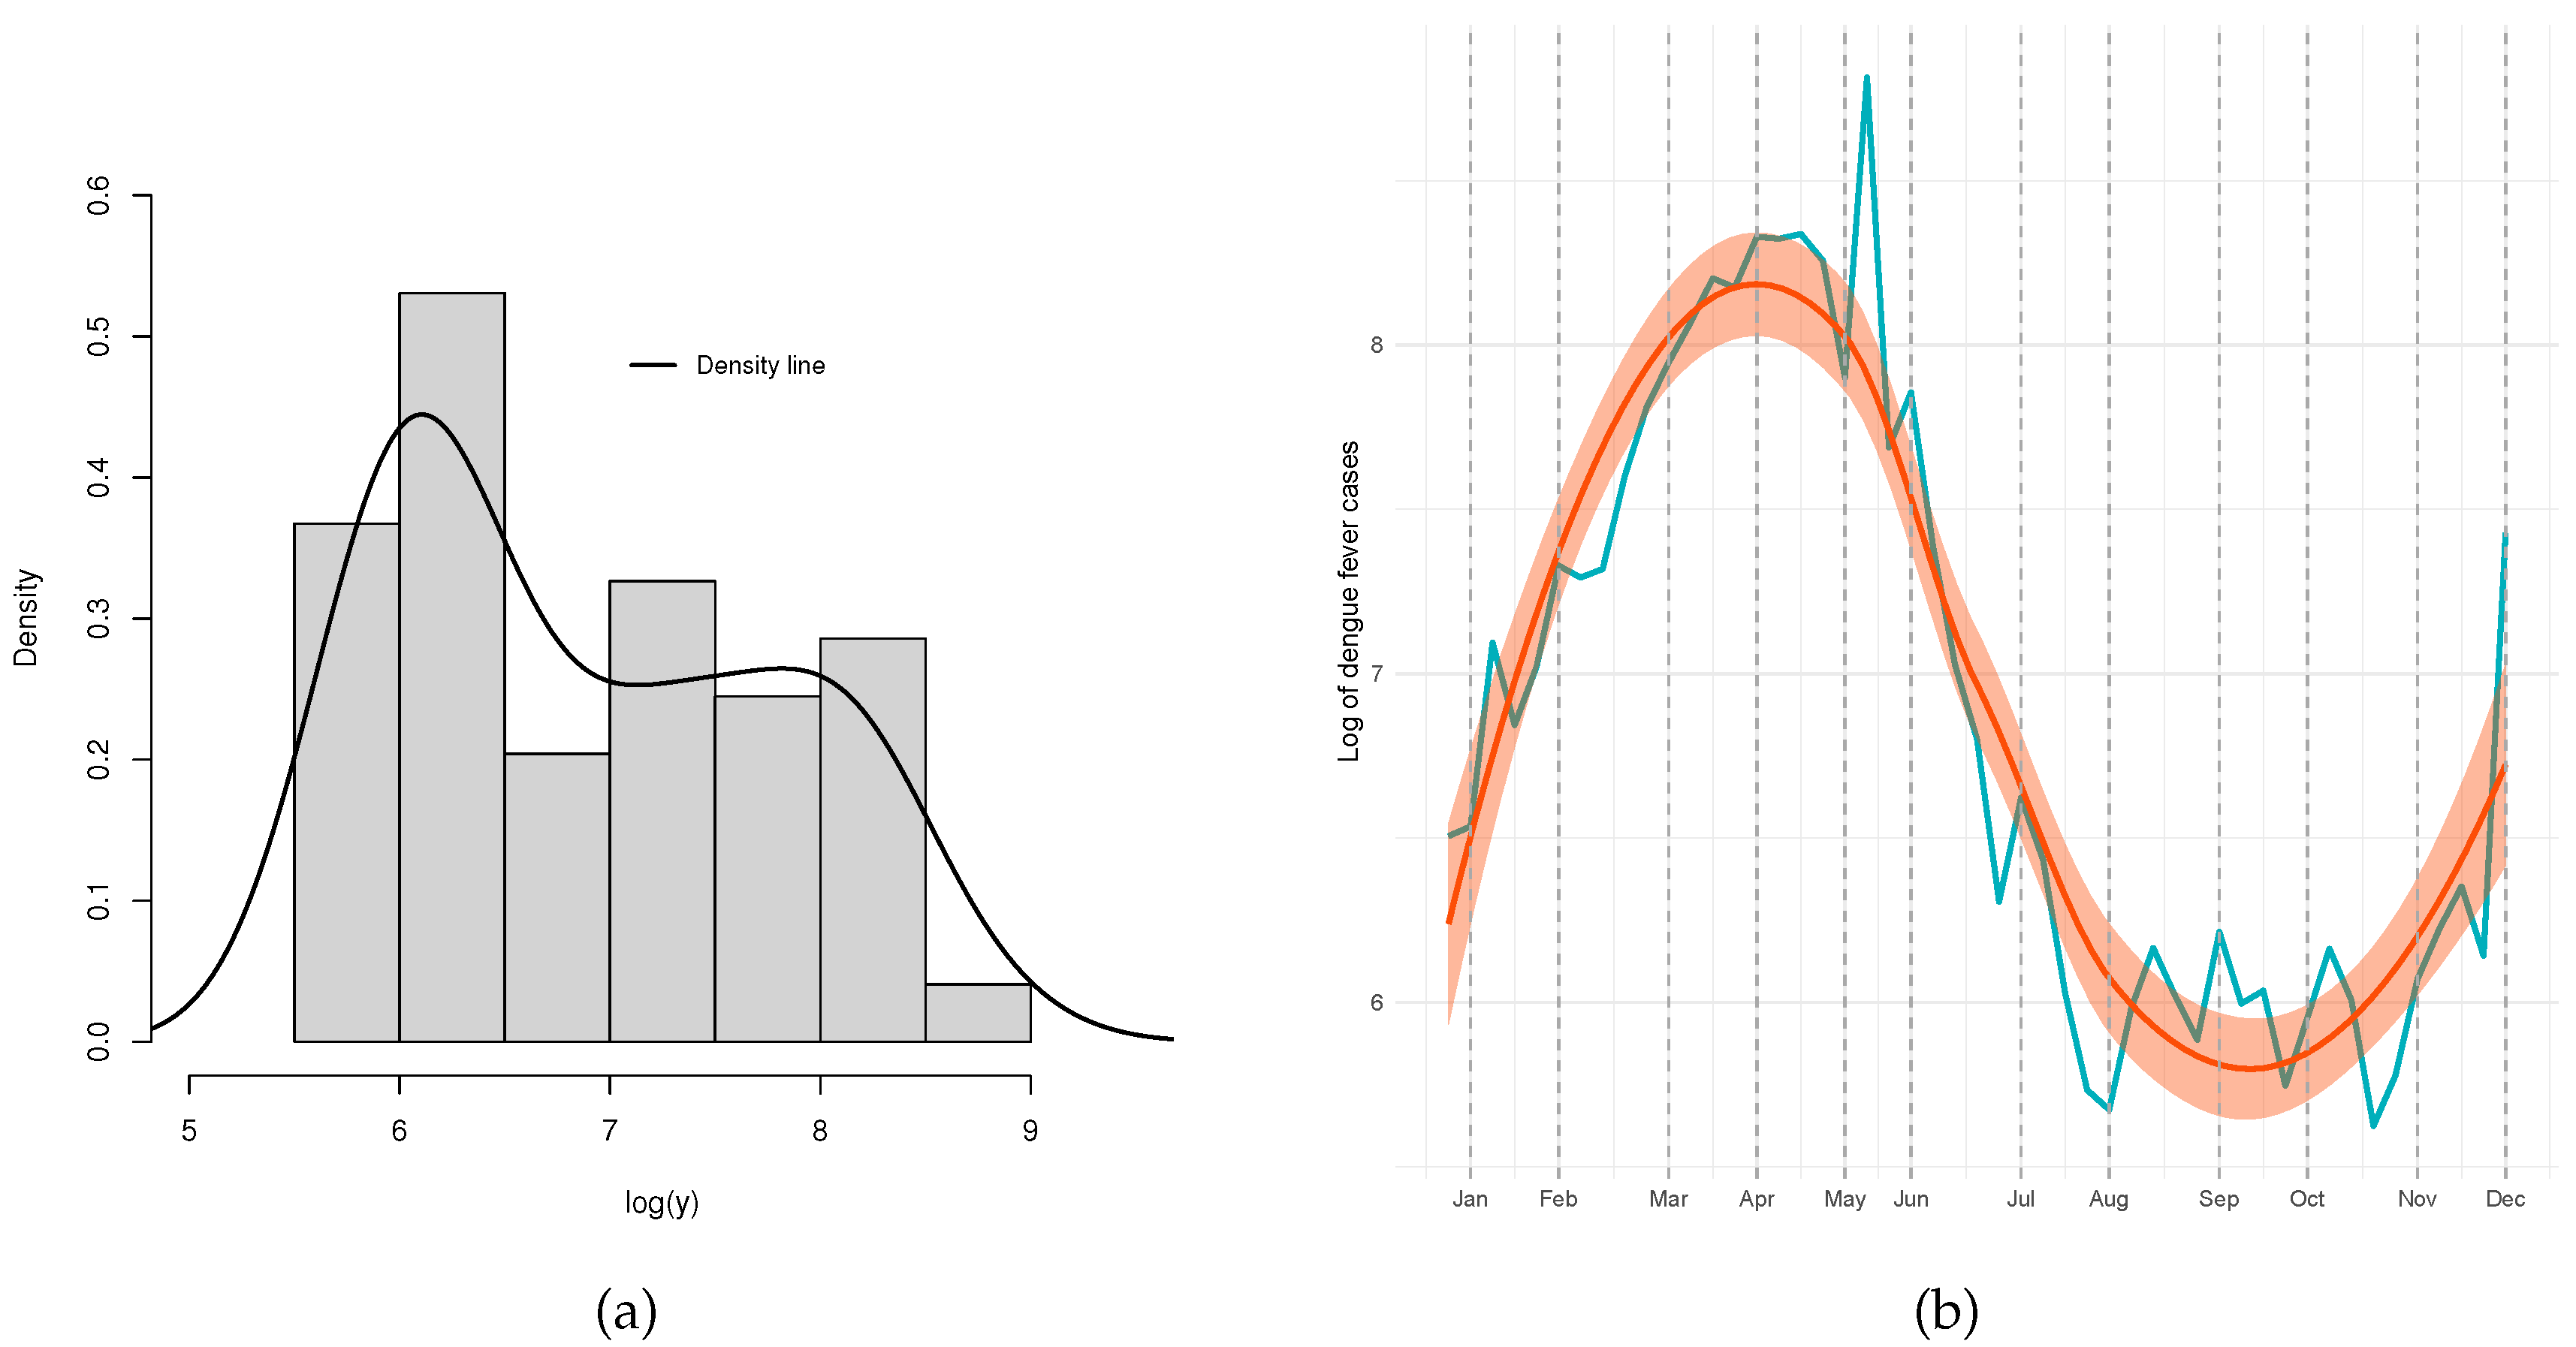
Figure 13.
Fitted models of log-dengue fever cases data. (a) Histogram and estimated pdfs. (b) Empirical and estimated cdfs.
Figure 13.
Fitted models of log-dengue fever cases data. (a) Histogram and estimated pdfs. (b) Empirical and estimated cdfs.
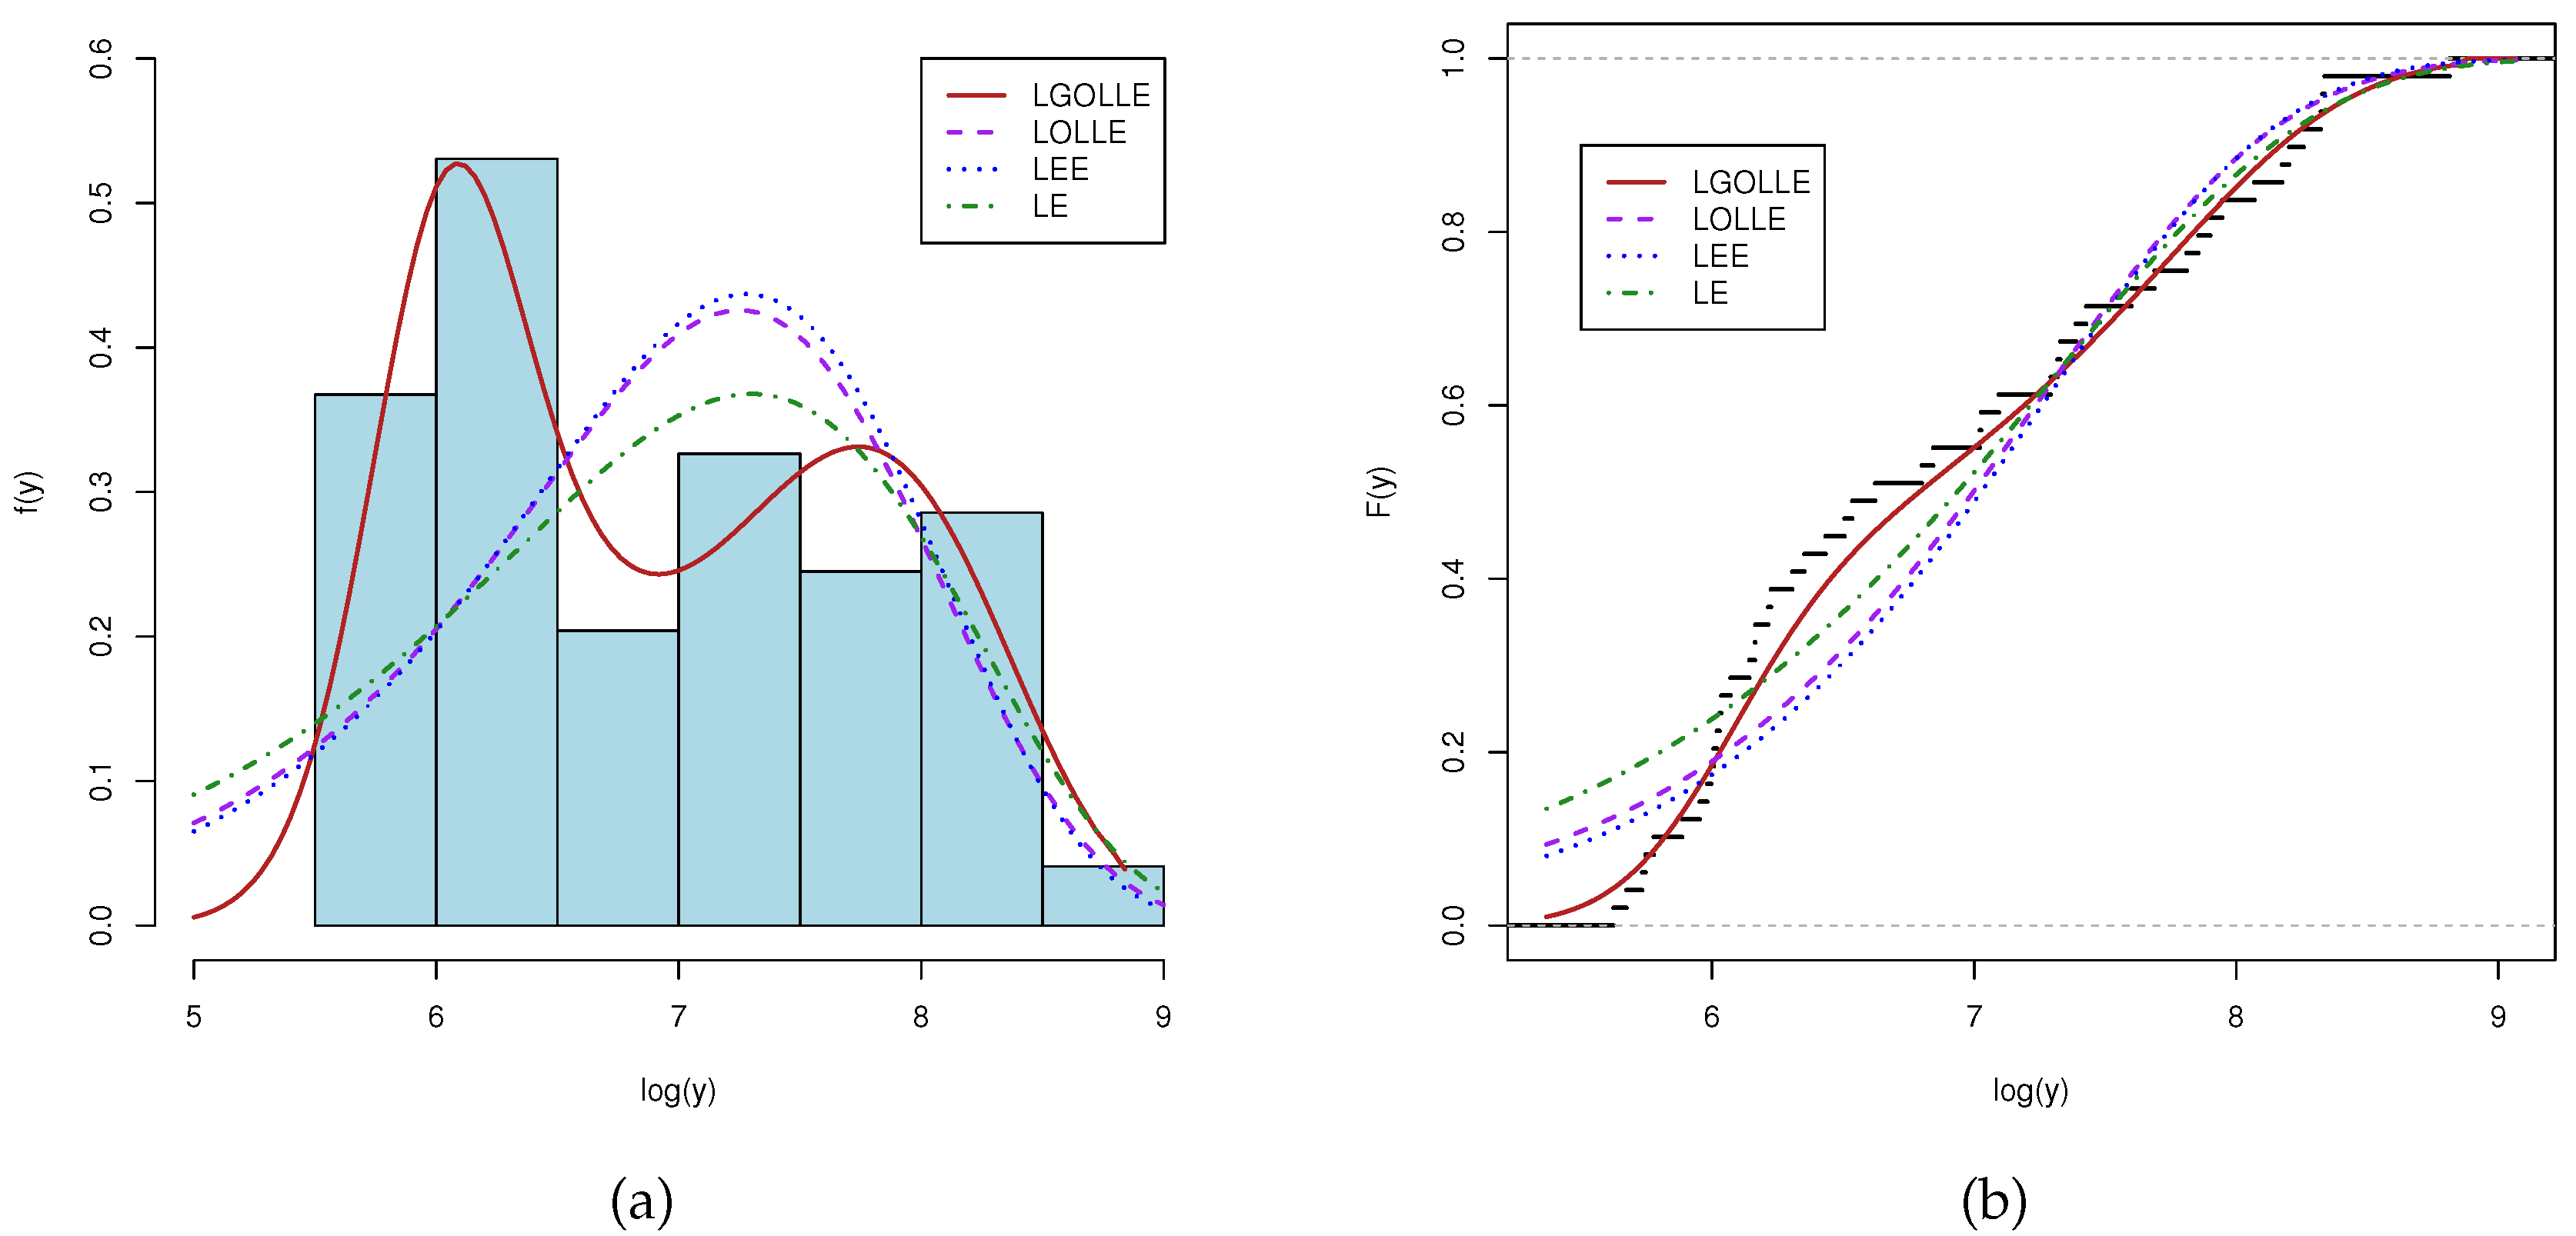
Figure 14.
The LGOLLE regression model. (a) LD. (b) GCD.
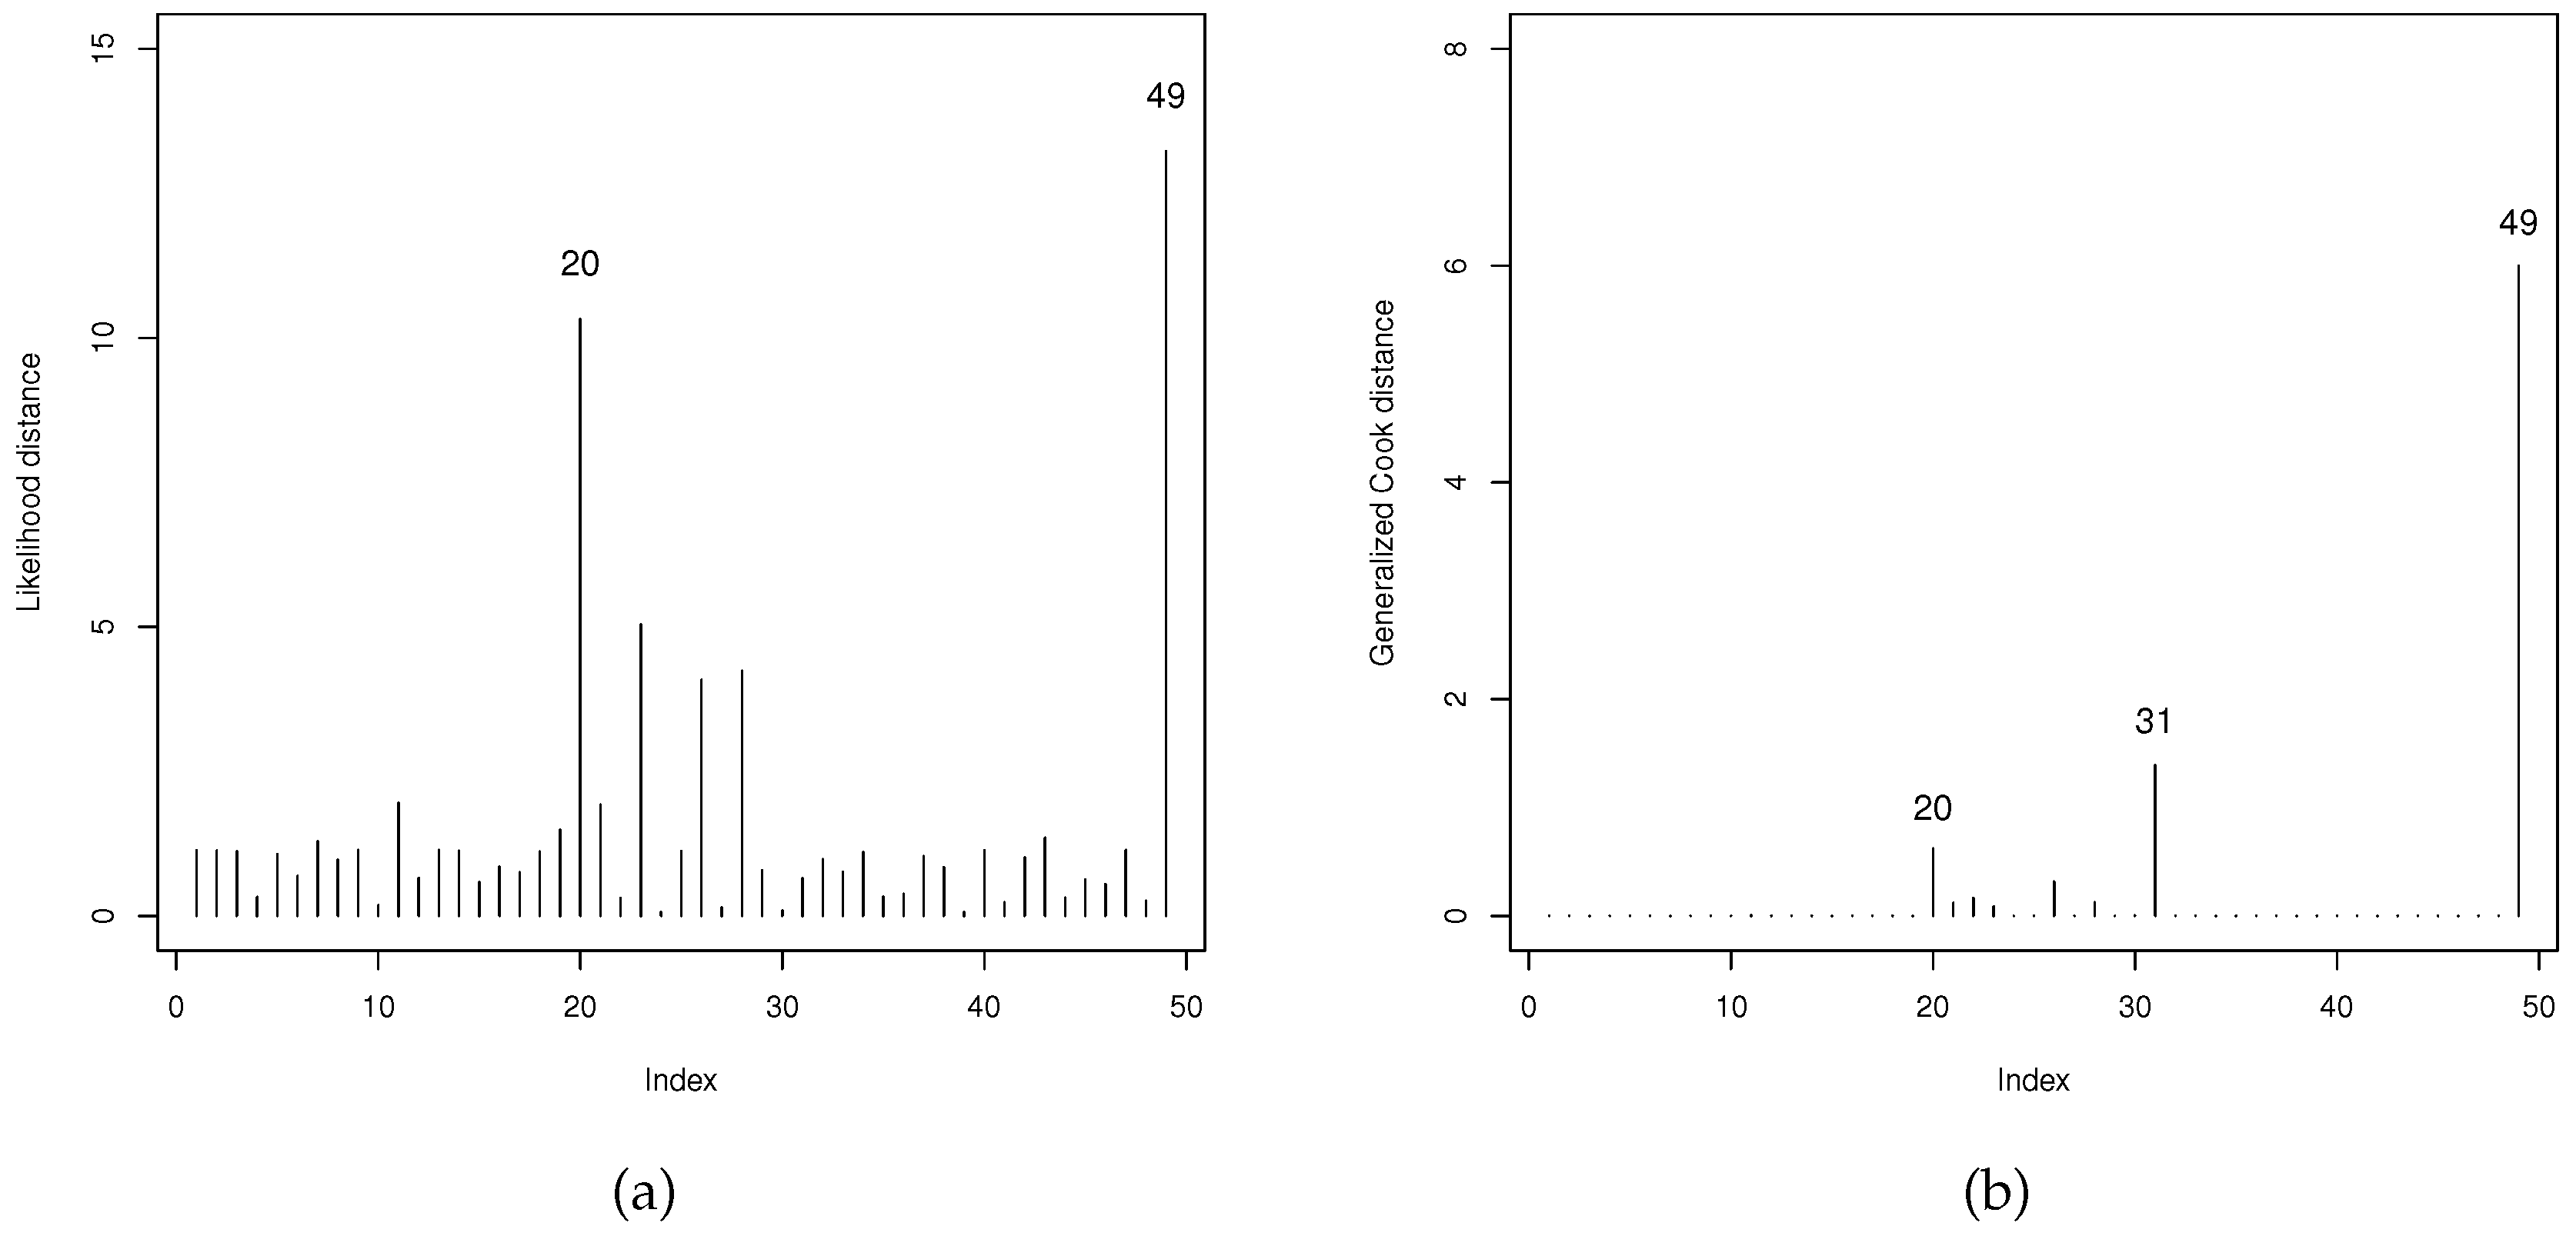
Figure 15.
The LGOLLE regression model. (a) Deviance residual index. (b) Simulated envelope.
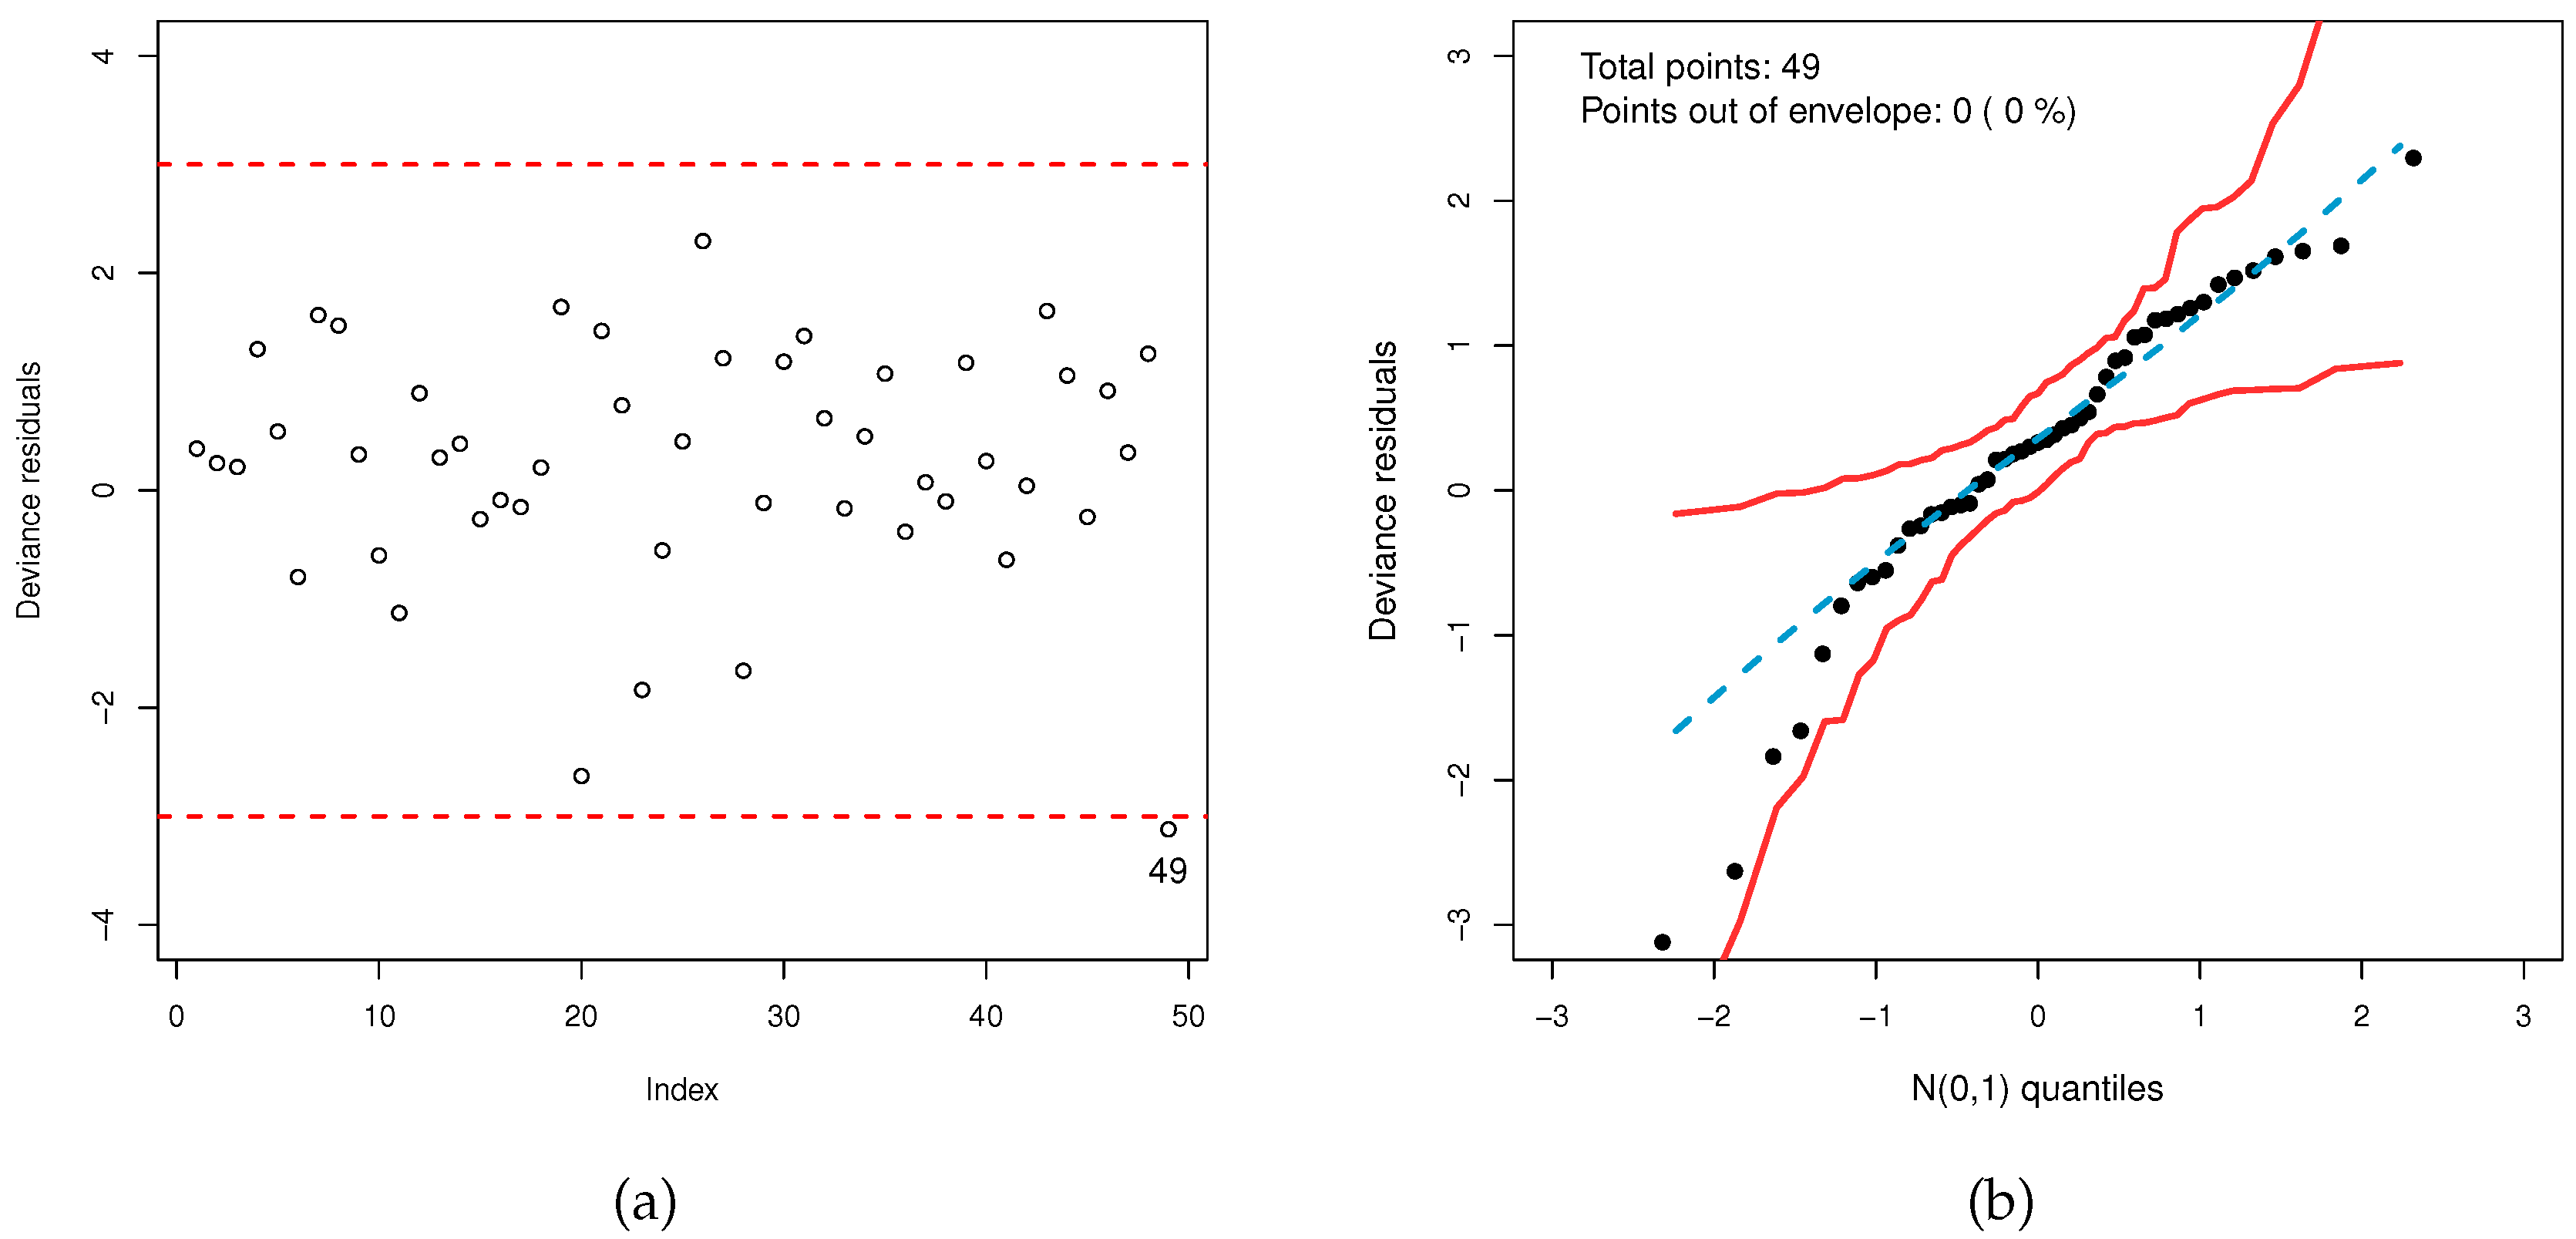

Table 1.
Sub-models of the GOLL-G family.
| Sub-Model | ||
|---|---|---|
| - | 1 | Generalized log-logistic family [15] |
| 1 | - | Proportional reversed hazard rate family [16] |
| 1 | 1 | Baseline |
Table 2.
Sub-models of the GOLLE distribution.
| Sub-Model | ||
|---|---|---|
| - | 1 | Odd log-logistic exponential (OLLE) distribution, see [15] |
| 1 | - | Exponentiated-exponential (EE) distribution, see [17] |
| 1 | 1 | Exponential (E) distribution |
Table 3.
Simulations results for GOLLE distribution.
| scenario 1 - GOLLE(0.23,1.25,0.89) | |||||||||||
|---|---|---|---|---|---|---|---|---|---|---|---|
| Par | n=50 | n =150 | n = 300 | ||||||||
| AE | AB | RMSE | AE | AB | RMSE | AE | AB | RMSE | |||
| 0.274 | 0.044 | 0.207 | 0.266 | 0.036 | 0.141 | 0.249 | 0.019 | 0.088 | |||
| 1.580 | 0.330 | 0.909 | 1.357 | 0.107 | 0.618 | 1.292 | 0.042 | 0.417 | |||
| 1.076 | 0.186 | 0.603 | 0.932 | 0.042 | 0.399 | 0.908 | 0.0018 | 0.281 | |||
| Par | n = 500 | n = 750 | n = 1000 | ||||||||
| 0.239 | 0.009 | 0.060 | 0.234 | 0.008 | 0.041 | 0.235 | 0.005 | 0.034 | |||
| 1.279 | 0.029 | 0.309 | 1.244 | 0.006 | 0.211 | 1.252 | 0.002 | 0.179 | |||
| 0.906 | 0.016 | 0.213 | 0.884 | 0.006 | 0.147 | 0.890 | 0.000 | 0.124 | |||
| scenario 2 - GOLLE(0.85,0.15,1.15) | |||||||||||
| Par | n = 50 | n = 150 | n = 300 | ||||||||
| 0.824 | 0.026 | 0.292 | 0.837 | 0.012 | 0.184 | 0.855 | 0.005 | 0.121 | |||
| 0.201 | 0.051 | 0.175 | 0.164 | 0.014 | 0.051 | 0.154 | 0.004 | 0.024 | |||
| 2.232 | 1.082 | 3.356 | 1.479 | 0.329 | 0.980 | 1.239 | 0.089 | 0.446 | |||
| Par | n = 500 | n = 750 | n = 1000 | ||||||||
| 0.848 | 0.002 | 0.090 | 0.851 | 0.001 | 0.062 | 0.849 | 0.001 | 0.054 | |||
| 0.153 | 0.003 | 0.017 | 0.151 | 0.001 | 0.011 | 0.151 | 0.001 | 0.010 | |||
| 1.225 | 0.075 | 0.338 | 1.172 | 0.022 | 0.218 | 1.176 | 0.026 | 0.196 | |||
Table 4.
Competitive distributions compared to the GOLLE distribution.
| Distribution | Reference |
|---|---|
| Kumaraswamy-Fréchet (KwFr) | [24] |
| Kumaraswamy -Exponential (KwE) | [25] |
| Gamma-Fréchet (GFr) | (-) |
| Gamma-Exponentital (GE) | [26] |
| Beta-Exponentital (BE) | [27] |
| Fréchet (Fr) | [28] |
Table 5.
Descriptive statistics of dengue fever cases data.
| Variable | Min. | Max. | Mean | Median | SD | Skewness | Kurtosis | |||||||
|---|---|---|---|---|---|---|---|---|---|---|---|---|---|---|
| DG | 277 | 6726 | 1483 | 752 | 1445.35 | 1.509 | 4.998 |
Table 6.
Findings from the fitted models of dengue fever cases data.
| Model | Parameters | KS | ||||||||||||
|---|---|---|---|---|---|---|---|---|---|---|---|---|---|---|
| GOLLE() | 0.154 | 76.500 | 5.402 | 0.060 | 0.400 | 0.077 | ||||||||
| (0.018) | (0.019) | (0.003) | (0.914) | |||||||||||
| OLLE() | 1.180 | 1 | 0.634 | 0.318 | 1.929 | 0.160 | ||||||||
| (0.142) | (-) | (0.086) | (0.145) | |||||||||||
| EE() | 1 | 1.391 | 0.830 | 0.313 | 1.898 | 0.175 | ||||||||
| (-) | (0.284) | (0.147) | (0.088) | |||||||||||
| E() | 1 | 1 | 0.674 | 0.316 | 1.913 | 0.170 | ||||||||
| (-) | (-) | (0.096) | (0.103) | |||||||||||
| KwFr() | 3.851 | 51.070 | 0.172 | 0.271 | 0.087 | 0.559 | 0.097 | |||||||
| (1.409) | (71.389) | (0.060) | (0.008) | (0.705) | ||||||||||
| KwE() | 4.500 | 0.151 | 5.402 | 0.242 | 1.482 | 0.205 | ||||||||
| (0.005) | (0.022) | (0.003) | (0.028) | |||||||||||
| GFr() | 0.465 | 0.777 | 0.225 | 0.128 | 0.830 | 0.120 | ||||||||
| (0.082) | (0.142) | (0.039) | (0.443) | |||||||||||
| BE() | 3.027 | 0.150 | 5.402 | 0.253 | 1.548 | 0.197 | ||||||||
| (0.1.054) | (0.023) | (0.003) | (0.038) | |||||||||||
| GE() | 1.323 | 0.892 | 0.317 | 1.917 | 0.173 | |||||||||
| (0.241) | (0.197) | (0.096) | ||||||||||||
| Fr(a,b) | 1.791 | -0.281 | 0.235 | 1.449 | 0.173 | |||||||||
| (0.285) | (0.076) | (0.094) | ||||||||||||
Table 7.
LR tests of the GOLLE distribution
| Models | Statistic w | p-value |
|---|---|---|
| GOLLE vs E | 29.657 | < 0.0001 |
| GOLLE vs EE | 27.143 | < 0.0001 |
| GOLLE vs OLLE | 27.937 | < 0.0001 |
Table 8.
Findings from the fitted models of log-dengue fever cases data.
| Model | Parameters | KS | ||||||||||
|---|---|---|---|---|---|---|---|---|---|---|---|---|
| LGOLLE() | 0.1517 | 78.7499 | 5.2352 | 0.054 | 0.3664 | 0.0862 | ||||||
| (0.0178) | (0.0274) | (0.0034) | (0.8293) | |||||||||
| LOLLE() | 1.1798 | 1 | 7.3631 | 0.3184 | 1.9289 | 0.1601 | ||||||
| (0.1423) | (-) | (0.1353) | (0.1453) | |||||||||
| LEE() | 1 | 1.3911 | 7.0935 | 0.3132 | 1.8975 | 0.1750 | ||||||
| (-) | (0.2839) | (0.1769) | (0.0879) | |||||||||
| LE() | 1 | 1 | 7;3019 | 0.3161 | 1.9131 | 0.1704 | ||||||
| (-) | (-) | (0.1429) | (0.1032) | |||||||||
Table 9.
LR tests of the LGOLLE distribution
| Models | Statistic w | p-value |
|---|---|---|
| LGOLLE vs LE | 29.650 | < 0.0001 |
| LGOLLE vs LEE | 27.136 | < 0.0001 |
| LGOLLE vs LOLLE | 27.930 | < 0.0001 |
Table 10.
Fitted LGOLLE regression model of dengue fever cases data.
| Parameter | Estimate | SE | p-value | |||
|---|---|---|---|---|---|---|
| -15.7495 | 0.6398 | <0.0001 | ||||
| (Fev) | -0.5511 | 0.1836 | <0.0049 | |||
| (Mar) | -1.0827 | 0.1909 | <0.0001 | |||
| (Apr) | -1.6788 | 0.1764 | <0.0001 | |||
| (May) | -1.7125 | 0.1822 | <0.0001 | |||
| (Jun) | -1.4393 | 0.2262 | <0.0001 | |||
| (Jul) | 0.3091 | 0.1935 | <0.1192 | |||
| (Ago) | -0.5881 | 0.2006 | <0.0059 | |||
| (Sep) | -0.4623 | 0.1723 | <0.0110 | |||
| (Oct) | -0.5778 | 0.1776 | <0.0025 | |||
| (Nov) | -0.5749 | 0.1802 | <0.0030 | |||
| (Dec) | -0.1612 | 0.1928 | <0.4088 | |||
| 47.1443 | 6.4074 | - | ||||
| 0.0751 | 0.0054 | - |
Disclaimer/Publisher’s Note: The statements, opinions and data contained in all publications are solely those of the individual author(s) and contributor(s) and not of MDPI and/or the editor(s). MDPI and/or the editor(s) disclaim responsibility for any injury to people or property resulting from any ideas, methods, instructions or products referred to in the content. |
© 2024 by the authors. Licensee MDPI, Basel, Switzerland. This article is an open access article distributed under the terms and conditions of the Creative Commons Attribution (CC BY) license (http://creativecommons.org/licenses/by/4.0/).
Copyright: This open access article is published under a Creative Commons CC BY 4.0 license, which permit the free download, distribution, and reuse, provided that the author and preprint are cited in any reuse.


