
Submitted:
03 July 2024
Posted:
04 July 2024
You are already at the latest version
Preprints on COVID-19 and SARS-CoV-2
Abstract
This study explores the role of inflammation and oxidative stress, hallmarks of COVID-19, in accelerating cellular biological aging. We investigated early molecular markers—DNA methylation age (DNAmAge) and telomere length (TL)—in blood leukocytes, nasal cells (NC), and induced sputum (IS) one-year post-infection in pauci- and asymptomatic healthcare workers (HCWs) infected during the first pandemic wave (February-May 2020), compared to COPD patients, model for "aged lung". Data by questionnaires, Work Ability Index (WAI), blood analyses, autonomic cardiac balance assessments, heart rate variability (HRV), and pulmonary function tests were collected. Elevated leukocyte DNAmAge significantly correlated with advancing age, male gender, daytime work, and an aged phenotype characterized by chronic diseases, elevated LDL and glycemia levels, medications affecting HRV, and declines in lung function, WAI, lymphocyte count, hemoglobin levels, and HRV (p<0.05). Increasing age, LDL levels, job positions involving intensive patient contact, and higher leukocyte counts collectively contributed to shortened leukocyte TL (p<0.05). Notably, HCWs exhibited accelerated biological aging in IS cells compared to both blood leukocytes (p≤0.05) and NC (p<0.001), and were biologically older than COPD patients (p<0.05). These findings suggest the need for monitoring aging in pauci- and asymptomatic COVID-19 survivors, who represent the majority of the general population.
Keywords:
Biological aging
; DNA methylation age
; Telomere length
; post COVID-19
; Healthcare workers
; Pauci-symptomatic
; Heart Rate Variability
; Nasal cells
; Induced sputum.
1. Introduction
Nearly four years after the World Health Organization (WHO) declared COVID-19 a pandemic, with over 775 million confirmed cases by May 2024 [1], the long-term consequences of the disease on the health of those infected remain largely unknown and are a significant area of research for global health [2]. The term “Long COVID” describes symptoms that persist or develop after the acute phase of COVID-19. This includes symptoms that last from 4 to 12 weeks after the acute phase, as well as post-COVID-19 syndrome, which refers to symptoms lasting more than 12 weeks and not explained by an alternative diagnosis [3].
While extensive research has focused on post-COVID-19 conditions in severely ill patients [4], there has been less attention on those with mild or asymptomatic infections, such as many healthcare workers (HCWs). Of 81 studies on post-COVID prevalence symptoms up to one year after infection [5,6,7], only 8 studies focused on pauci- and asymptomatic subjects after one year [8,9,10,11,12,13,14,15]. Furthermore, despite mild initial symptoms, 28% to 76% of these individuals developed post-COVID-19 syndrome. A one-year follow-up study on a mixed population (hospitalized and non-hospitalized patiens) conducted by Lombardo et al. [13] highlighted that more severe impairment in the acute phase did not appear to predict more serious complications. This gap is particularly important as these individuals represent a large portion of the population and underscores the importance of monitoring and supporting all COVID-19 patients, regardless of the initial severity of their symptoms, to adequately manage long-term complications.
Inflammation and oxidative stress, hallmarks of COVID-19 disease, play a key role in cell biological aging, supporting the hypothesis of its acceleration in COVID-19 [16]. At the cellular level, two interconnected “pillars of aging” are the earliest targets of cellular aging, i.e., telomere length (TL) and DNA methylation age (DNAmAge) [17,18]. One study reported evidence of biological age acceleration (i.e., epigenetic age acceleration and telomere shortening) in severe COVID-19 patients [16] as well as in COVID-19 survivors [19], whereas Franzen et al. [20] reported no epigenetic age acceleration in COVID-19 patients. Furthermore, in our recent work, we demonstrate that lung becomes older than blood, as measured by both TL and DNAmAge in induced sputum cells (IS) from the deep airways, compared to circulating blood leukocytes, in the same COPD patients, chronically exposed to inflammatory injury [21]. COVID-19 infection and the consequent pulmonary oxidative-inflammatory reaction lead to structural and functional pathological changes in the lung, also postulates an accelerated lung aging. To date, no one has investigated biological age indicators in pauci- and asymptomatic COVID-19 patients in different tissues other than blood, such as nasal cells (NC) and IS from the deep airways, which are tissues preferentially infected by SARS-CoV-2.
The aim of this study is to assess the biological aging of blood leukocytes and target tissues of the infection (i.e., IS and NC) in SARS-CoV-2 positive HCWs of the first wave (February-May, 2020), recruited at the health surveillance visit approximately 12 months after infection, and to verify the long-term sequelae of the infection and the impact on work capacity.
Given the global impact of the COVID-19 pandemic, studying the potential influence of SARS-CoV-2 infection on accelerated biological aging is of significant public health, economic, and social relevance. For the first time, we are examining this effect not only in the blood but also in the target tissues primarily exposed to the virus. This research will enable the development of personalized strategies to facilitate a full return to work.
2. Results
2.1. Post-COVID Syndrome (PCS) and Symptom Prevalence
In Table 3 the prevalence of PCS symptoms in the HCWs cohort (n=76) at 12 weeks was higher in women than men (p=0.0043), but similar after 1 year (p=0.5238). However, after 1 year, symptoms decreased in women (p=0.0204), while persisting in men (p=0.9999). Table 4 shows the distribution and percentage of COVID-19 symptoms reported by the HCWs cohort (n=76) up to 4 weeks, from 4 to 12 weeks, beyond 12 weeks after diagnosis (NICE guidelines [22]), and at the 1-year follow-up. Dyspnea, palpitations, peripheral neuropathy, loss of concentration, memory problems, and anxiety, as well as rare symptoms like dermatological signs, persisted beyond 12 weeks and at the 1-year follow-up (p>0.05). However, brain fog, sleep disorders, depression, and less frequent symptoms, including ocular symptoms, persisted beyond 12 weeks but not after 1 year (p>0.05). Supplementary Figure 1 shows that in 30% of HCWs, symptoms persisted 1 year after SARS-CoV-2 infection.
2.2. Blood Leukocytes Biological Age
The mean values and standard deviations of blood leukocytes DNAmAge, AgeAcc, and TL for all HCWs (n=76) are reported in Table 5. Simple linear regression analyses confirmed that blood leukocytes DNAmAge positively correlated with chronological age (Figure 1A, r=0.9433, p<0.0001), and blood leukocytes TL negatively correlated with chronological age (Figure 1B, r=-0.3217, p=0.0046). Increased blood leukocytes DNAmAge, but not TL, was associated with the duration of COVID-19 infection (Figure 2A, r=0.0618, p=0.596; Figure 2B, r=0.2378, p=0.0386). Additionally, subjects with greater biological age, detected by DNAmAge and TL, showed lower WAI (Figure 3A, DNAmAge r=-0.5169, p<0.0001; Figure 3B, TL r=0.2828, p=0.0194).
2.3. Determinants of Blood Leukocytes DNAmAge and TL
Multiple linear regression analysis (Table 6) indicated that an increase in blood leukocytes DNAmAge was determined by age (p<0.0001), being male (p=0.014), presence of chronic diseases (p=0.029), decline in lung function (FEV1, p=0.0014), and decrease in lymphocyte count (p=0.002). Decreased blood leukocytes TL was determined by age (p=0.003) and reduced lymphocyte count (p=0.033).
Multiple regression analysis (Table 7) showed that an increase in blood leukocytes DNAmAge correlated with a decrease in WAI (p=0.0015) and daytime work (p=0.0325), but not job position (p=0.4352). Blood leukocytes TL decreased with job positions involving direct patient contact (healthcare assistants, nurses, doctors, residents) (p=0.0295), but not with WAI (p=0.2268) or daytime work (p=0.1864).
Multiple regression analysis of the influence of haemoglobin (g/dL), glycaemia (mg/dL), cholesterol (mg/dL), triglycerides (mg/dL), HDL (mg/dL), LDL (mg/dL), creatinine (mg/dL) and bilirubin (mg/dL) on blood leukocytes DNAmAge and TL (Table 8) revealed that higher DNAmAge was associated with lower hemoglobin (p=0.0163), higher glycemia (p=0.0078), and higher LDL (p=0.0015). Shorter TL was associated only with higher LDL levels (p=0.0506). Cholesterol, triglycerides, HDL, creatinine, and bilirubin were not determinants in biological aging indicators.
Multiple regression analysis of the influence of mean HR and HRV Parameters (i.e., SDNN, RMSSD) and drugs affecting HRV (i.e., antidepressants, beta-blockers, calcium channel blockers, inhaled or oral beta-mimetics, theophylline, and alpha-adrenergic agonists) on blood leukocytes DNAmAge and TL (Table 9) indicated that increased DNAmAge correlated with low mean HR and drug use affecting HRV, but not with other HRV parameters. No significant correlations were found for TL.
Multiple linear regression analysis of the influence of leukocytes (109/L) and different blood cell counts, including neutrophils (109/L), lymphocytes (109/L), and monocytes (109/L) on blood leukocytes DNAmAge and TL (Supplementary Table S1) showed positive correlations between TL and neutrophils (p=0.0006) and lymphocytes (p=0.0046), and negative correlations with leukocytes (p=0.0344), but not with monocytes. DNAmAge was not determined by leukocytes, neutrophils, lymphocytes, or monocytes (p>0.05).
2.4. Biological Age of Blood Leukocytes, IS Cells, and NC
Supplementary Table S2 reports number of subjects and mean values of biological aging indicators i.e., DNAmAge, AgeAcc, TL, in blood leukocytes, NC, and IS cells. DNAmAge of blood leukocytes (Figure 1A, r=0.9433, p<0.0001), NC, and IS (Figure S2, A r=0.8015, p<0.0001; B, r=0.9279, p<0.0001) was positively correlated with chronological age, while TL of blood leukocytes (Figure 1B, r=-0.3217, p=0.0046), but not of IS (Figure S2 C, r=-0.2641, p=0.2897), was negatively correlated with chronological age. Insufficient DNA prevented TL analysis in NC samples.
Figure 4A shows that in a subset of 17 HCWs with all tissue samples, the IS DNAmAge was higher than blood leukocytes (p=0.0011) and NC (p=0.0003), and NC DNAmAge was lower than blood leukocytes (p=0.0028). Similarly, Figure 4B reports that IS TL was shorter than blood leukocytes in the same patients (p=0.05).
2.5. Correlations between Biological Aging Indicators
Simple linear regression analyses (Figure S3) showed positive correlations between DNAmAge of blood leukocytes and NC (r=0.8207; p<0.0001) and IS (r=0.9353; p<0.0001), but no correlation between TL of blood leukocytes and IS (r=-0.0222; p=0.9304).
2.6. Comparison of Biological Aging in HCWs and COPD Patients
Comparing HCWs (n=17) with COPD patients (n=7), HCWs showed greater biological aging in blood and IS cells, including higher AgeAcc (Table 10: blood leukocytes AgeAcc, p=0.0002; IS AgeAcc, p=0.012) and shorter TL (Table 10: predicted blood and IS TL, p<0.0001) one year after SARS-CoV-2 infection resolution.
3. Discussion
This study offers groundbreaking insights on the biological aging, long-term sequelae, and their impact on work ability in pauci- and asymptomatic HCWs of the University Hospital of Padua, who survived COVID-19 during the first wave (February-May 2020). We also assessed the biological aging of blood leukocytes, NC, and IS cells in HCWs and compared them to a control group of COPD patients, who are considered a model group for ‘aged lung’ resulting from continuous inflammatory action affecting these patients [23].
3.1. PCS and Symptom Prevalence
At 12 weeks, PCS symptoms were more prevalent in women than men consistent with Ortona et al.‘s findings that women are twice as likely as men to develop PCS until around the age of 60 [24]. Given our population’s median age of 47.5 years and a peak age of 66 years, this trend is confirmed. Women make up about 71% of our study population and dominate the healthcare workforce, with the WHO reporting that women constitute 67% of the global health and social care workforce [25]. This demographic representation explains the higher prevalence of PCS among women in our study. Furthermore, the autoimmune hypothesis posits that women’s stronger immune response, influenced by genetic and hormonal factors, leads to a higher incidence of PCS [24,26]. After 1 year, symptom prevalence was similar between genders, with symptoms decreased in women but persisted in men. This persistence is an ongoing area of investigation. Overall, 30% of HCWs reported persistent symptoms 1 year post-infection. This is in line with previous studies in paucisymptomatic individuals, reporting similar rates at one year [11,27,28], and even two years post-infection [29]. Persistent symptoms such as dyspnea, palpitations, peripheral neuropathy, anxiety, loss of concentration, and memory problems were observed approximately one year after infection, confirming earlier findings [14,27]. These underscore the need for ongoing research and tailored healthcare strategies to manage the long-term effects of PCS, particularly among HCWs, who represent our study cohort.
3.2. Determinants of Increased Blood Leukocyte Dnamage
3.2.1. Sex-Related DNAmAge Differences
Male sex is significantly associated with increased DNAmAge, corroborating findings from Oblak et al. [30]. This aligns with the male-female health survival paradox, where males typically have shorter lifespans than female, who tend to experience higher rates of disability and poor health [31], supporting again the need for sex-specific health strategies.
3.2.2. Impact of SARS-CoV-2 Infection
Increased leukocyte DNAmAge correlates with the duration of SARS-CoV-2 infection (average 17 days) because prolonged infections lead to sustained inflammatory responses and cellular stress, which induce significant epigenetic changes [32,33,34,35]. This mechanism is similar to that observed in other viral infections like HIV [36,37,38] and SARS-CoV-2 infection [16], where extended viral presence exacerbates epigenetic modifications, thus increasing DNAmAge. This insight is crucial for developing post-infection management strategies, particularly for those with extended infection durations, to mitigate accelerated aging effects.
3.2.4. Chronic Diseases and DNAmAge
Our findings confirm that chronic diseases are linked to elevated DNAmAge, consistent with previous research on frailty [39], cancer [40], diabetes [41], cardiovascular diseases (CVD) [42], dementia [43], and the decreased lung function (FEV1) in COPD patients [21], a known consequence of aging [44,45,46]. This underscores the importance of managing chronic diseases to potentially slow down the biological aging process and improve overall health outcomes.
3.2.5. Lung Function and DNAmAge
We also found a correlation between the acceleration in DNAmAge and the decline in lung function measured by forced expiratory volume (FEV1), which is a well-documented consequence of aging [44,45,46]. This finding is consistent with our previous work on COPD patients [21]. Therefore, DNAmAge appears to be a reliable signature of the epigenetic aging chronic disease-related.
3.2.6. Lipid Levels and DNAmAge
We identified a positive association between DNAmAge and LDL levels. Even if our finding contrasts with an unexpected inverse association reported by Ammous et al. [47], it aligns with the hypothesis on the detrimental health effects of these lipids [48,49], which are connected to an increased risk of CVD [50,51,52] and suggests that lipid management could be integral to mitigating accelerated aging. This highlights the need for comprehensive lipid monitoring and management strategies in PCS patients.
3.2.7. Blood Glucose and DNAmAge
Our study also found a positive correlation between DNAmAge and blood glucose, which showed consistent and stronger associations with CVD risk factors in patients with diabetes (Borg et al., 2011). This correlation underscores the critical role of glucose regulation in aging. High blood glucose contributes to oxidative stress and inflammation, leading to epigenetic changes that increase DNAmAge. Effective glycemic control is crucial for slowing biological aging, particularly in diabetic populations, as highlighted by recent research [53].
3.2.8. Work Capacity and DNAmAge
The higher DNAmAge found in daytime workers may be attributed to older age, as they transition to daytime roles due to the challenges of night shifts. Furthermore, HCWs with greater DNAmAge showed lower WAI scores, marking this as the first study to link leukocyte DNAmAge with WAI, consistent with the decline in work capacity due to aging and chronic diseases [54,55]. Work capacity, measured by WAI, refers to an individual’s perception of the balance between work demands and their ability to cope with them [56], resulting from the interaction between psychosocial and physical work-related elements, mental and physical capabilities, and health issues [57,58]. Our finding calls for workplace interventions to support aging workers, such as job modifications and health promotion programs, to sustain their work ability and productivity.
3.2.9. Lymphocyte Counts and DNAmAge
We observed a negative correlation between DNAmAge and lymphocyte counts. Aging is known to reduce the number of B cells and CD4+ and CD8+ T cells, increasing memory T cells while decreasing naïve T cells [59]. This finding is supported by Zhang et al. [60], who noted variations in epigenetic age depending on lymphocyte subpopulations. Strategies to also support immune health could play a role in mitigating DNAmAge increases, especially in the aging workforce
3.2.10. Haemoglobin Levels and DNAmAge
An association between higher DNAmAge and lower haemoglobin levels was found, reflecting the intertwined nature of aging and haematological health. Lower haemoglobin levels are indicative of anemia, which is common in older adults and linked to increased biological aging. This condition is often linked to increased biological aging due to its association with chronic inflammation, oxidative stress, and decreased erythropoiesis [61]. Monitoring and addressing haemoglobin levels can be beneficial in managing age-related health risks and potentially mitigating accelerated biological aging.
3.2.11. HR, HRV and DNAmAge
We found a relationship between increased DNAmAge and low mean HR. Basal and non-basal HR decreases with age and elderly people are more prone to bradycardia [62], and even HRV decreasing with age [63]. DNAmAge is a marker of aging associated with pathological conditions [64]. Increased DNAmAge signifies accelerated biological aging, exacerbated by factors like chronic stress and infections. COVID-19 survivors show increased DNAmAge [19] and reduced mean HR one year after SARS-CoV-2 infection compared to the post-acute phase [65], highlighting the impact of infections on biological aging. Maintaining HR and HRV through interventions could mitigate accelerated aging.
Furthermore, we noted an association between drugs affecting HRV and higher leukocyte DNAmAge. Drugs such as beta-blockers, calcium channel blockers, inhaled or oral beta-mimetics, theophylline, and alpha-adrenergic agonists like phenylephrine infusion can interfere with HRV [65,66]. While limited research exists, some studies indicate antihypertensives like calcium channel blockers may reduce DNAmAge [67]. Therefore, our findings highlight the need for further investigation into the effects of other HRV-modifying drugs on DNAmAge and elucidate the underlying biological mechanisms. Further research is necessary to elucidate the biological mechanisms and optimize pharmacological strategies to minimize adverse effects on biological aging.
Lastly, we established the robust positive correlation between DNAmAge and chronological age, reinforcing the accuracy of our analysis and the predictive strength of our model. This consistency with established methodologies [68,69] underscores that DNAmAge is a reliable biomarker for biological aging.
3.3. Determinants of Shorter Blood Leukocytes TL
Our study established a negative correlation between leukocyte TL and chronological aging, consistent with existing literature such as the systematic review by Müezzinler et al. [70] across 124 cross-sectional studies, reported a similar negative correlation (r = 0.3).
3.3.1. WAI
HCWs with shorter leukocyte TL exhibit lower WAI, reflecting accelerated biological aging. Chronic job-related stress and inflammation accelerate telomere shortening, impairing cellular repair and function [71]. This relationship is biologically plausible as shorter TL indicates advanced cellular aging, which reduces physical and cognitive capacity, impacting work ability. The parallel with epigenetic age (DNAmAge) further supports this connection, highlighting the detrimental effects of occupational stress on aging markers and work capacity. Interventions to reduce stress could improve HCWs’ health and work performance.
3.3.2. LDL Levels and Cardiovascular Disease
Our research supports the well-documented association between shorter TL and CVD, alongside elevated LDL levels as a major risk factor [72]. The observed correlation between shorter leukocyte TL and higher LDL levels contributes another piece to this controversial area, aligning with some previous studies [73,74,75,76,77], while contradicting others [76,78,79,80]. This underscores the need for further investigation into the interplay between lipid levels and TL.
3.3.3. Blood Leukocyte TL and Job Position
The observation that blood leukocyte TL is decreased in HCWs involved in direct patient contact (assistants, nurses, doctors, residents) can be explained by a few key mechanisms. HCWs face high levels of chronic stress due to long hours, high workload, and emotional strain [81]. Chronic stress increases cortisol levels, which can lead to oxidative stress and inflammation. Elevated cortisol from chronic stress increases oxidative stress, producing reactive oxygen species (ROS) that damage cells and DNA, including telomeres [71]. Frequent exposure to pathogens (viruses, bacteria) in healthcare settings triggers immune responses, increasing leukocyte replication and further contributing to telomere shortening [82,83,84]. Overall, the combination of chronic stress, oxidative stress, inflammation, and frequent exposure to pathogens leads to accelerated telomere shortening in HCWs involved in direct patient contact.
3.3.4. Lymphocyte Numbers
We observed a relationship between TL shortening and a decrease in lymphocyte numbers. Although lymphocytes experience a faster rate of age-dependent TL shortening than granulocytes [85], recent studies have shown significant reductions in lymphocyte numbers among healthy COVID-19 survivors [86]. Furthermore, our analysis revealed that TL shortening was associated with an increased total leukocyte count, primarily driven by monocytes. This is in line with findings of generalized low-grade inflammation, T lymphocyte senescence, and increased monocyte activation in individuals with long-COVID [87]. Mean leukocytes TL is considered an indicator of biological aging [88]. Our findings, linking TL shortening to lymphocyte reduction, expand on this understanding, suggesting novel mechanisms underlying TL dynamics in relation to immune cell populations and chronic stress responses.
These innovative results provide new insights into the determinants of leukocyte TL, advancing our comprehension of biological aging and its interaction with chronic disease, stress, and occupational factors.
3.4. Biological Age of the Blood Leukocytes, IS Cells, and NC Determined by DNAmAge AND TL
Our study uniquely analyzed DNAmAge and TL in blood leukocytes, IS cells, and NC from the same cohort of 17 HCWs who survived COVID-19. This comprehensive comparison revealed that IS cells exhibit a higher biological age than both blood leukocytes and NC. Specifically, IS cells demonstrated higher DNAmAge and shorter TL, while NC had a lower DNAmAge compared to blood leukocytes, indicating different aging rates within the same individuals.
3.4.1. Tissue-Specific Aging Rates
The accelerated aging observed in IS cells compared to blood leukocytes and NC confirms that different tissues and organs age at varying rates within the same individuals. This aligns with previous findings on heart, kidney, and COPD patients [21,89,90], showing tissue-specific aging rates [68]. The study also suggests that cells in the deeper airways of COVID-19 survivors are more susceptible to epigenetic changes than those in more superficial airways and blood leukocytes [21].
3.4.2. COVID-19 Impact on DNAmAge and TL
Our study supports existing research showing that COVID-19 significantly alters DNA methylation profiles, particularly in critically ill patients [91,92]. These epigenetic changes persist even after recovery, suggesting long-term impacts on gene expression and cellular function [34,93,94,95]. Additionally, shorter telomeres are associated with severe COVID-19 and lingering post-COVID-19 conditions, supporting the hypothesis that telomere attrition plays a role in the pathology of COVID-19 [96,97,98]. Telomere shortening can lead to cellular aging and reduced regenerative capacity, contributing to the severe and long-lasting effects observed in COVID-19 patients [96,99,100]. Our findings agree with other studies that have documented accelerated biological aging in various tissues due to COVID-19 [16,19,101], emphasizing the need for further research into the long-term effects of the virus on cellular health and aging.
3.4.3. Biological Implications of Telomere Shortening in IS
Telomere shortening, a marker of biological aging, occurs with increased cell division and DNA replication. Our study found that IS cells, the primary target of SARS-CoV-2, showed significant telomere shortening, supporting previous findings in alveolar epithelial cells of COVID-19 patients [101]. This suggests that SARS-CoV-2 infection accelerates telomere shortening due to an enhanced proliferative response to regenerate alveolar injury, potentially leading to long-term lung fibrosis [101,102].
3.4.4. Epigenetic Aging in IS cells, NC and Implications for Surrogate Tissue Use
While the change in methylation profile is evident in the blood of COVID-patients and survivors [16,19,103], there is no data yet on the other target tissues. However, epigenetics, linking environmental and genetic factors [104], is recognized as the basis of inflammation [105], which underpins several lung diseases like COPD, cancer, and COVID-19 [106]. The lung is the primary target of SARS-CoV-2 infection, causing diffuse alveolar damage, apoptotic epithelial cells, interstitial inflammation and activated T-cell responses resulting in a cytokine storm [107], mainly through host immune dysregulation, increased inflammation and/or hyperinflammation. This similarity and overlap in the pathogenetic mechanism between lung disease and COVID-19 [106], coupled with the results of our previous study in COPD patients showing accelerated lung aging [21], supports our finding that IS cells are older than blood leucocytes.
Interestingly, NC were found to be biologically younger than IS cells and blood leukocytes. This could be due to their role as the initial entry point for SARS-CoV-2 [108], acting as a gateway to the lower respiratory tract and triggering systemic inflammation upon viral replication [109], or as a gateway to the central nervous system [110,111].
A strong correlation was found between the DNAmAge of IS cells, NC, and blood leukocytes, suggesting that blood leukocytes could serve as a surrogate for studying lung and airway aging. However, caution is advised as there was a noted six-year difference in DNAmAge between lung tissue and blood leukocytes in post-COVID-19 patients, mirroring findings in COPD patients [21].
3.5. Comparison of Biological Aging (AgeAcc and TL) in HCWs and COPD Patients
Given the numerous overlaps between COPD and COVID-19 [106], we compared a group of HCWs recruited approximately one year after SARS-CoV-2 infection with a group of COPD patients as a positive control group. COPD patients are considered a suitable positive control group because they exemplify accelerated biological aging due to chronic inflammation and oxidative stress [21,112,113,114,115].
Our results revealed that the blood leukocytes and IS cells of HCWs are biologically older than those of COPD patients, as determined by AgeAcc and predicted TL. This indicates that COVID-19 may induce more pronounced epigenetic changes and telomere attrition than COPD.
3.6. Limitations and Strengths
The current study has several limitations. Firstly, the lack of a control group of COVID-19-free, age-matched subjects is a significant limitation. This was due to the difficulty in recruiting HCWs approximately one year after infection during the first wave (February-May 2020), when workloads were high and reinfections were common, leading to the exclusion of these subjects from the study. To address this, we compared our HCWs population (n=17), for whom we had all three tissues available, with a small positive control group of COPD patients (n=7) known for accelerated lung aging compared to blood leukocytes [21,112,115].
The ongoing pandemic and restrictions imposed by the University Hospital of Padua on techniques involving droplets and airborne exposure, such as spirometry and the induced sputum technique, limited the number of IS samples collected. Despite the limited number of subjects (n=17) for whom we have all three tissues (IS cells, NC, and blood leukocytes), our sample size estimate indicates it is sufficient to obtain statistically significant results. Another limitation is the inability to analyze TL in NC samples due to insufficient DNA after performing DNAmAge analysis.
Our study has several strengths. Firstly, it provides a comprehensive assessment of biomarkers of biological aging, both genetic (TL) and epigenetic (DNAmAge), related to various parameters, including inflammation, basic hematochemical biomarkers, lung function indicators, and data on demographics, lifestyle, work, and physiological history. This study involved the collaboration of many healthcare professionals, including clinicians and researchers.
To our knowledge, this is the first study to determine the biological aging of post-COVID-19 subjects across three different tissues collected from the same individual, comparing blood leukocytes with SARS-CoV-2 target tissues (IS cells and NC). We found a strong correlation between the DNAmAge of IS cells and NC with that of blood leukocytes, suggesting the potential use of blood as a surrogate indicator of the biological age of IS cells and NC, although further investigations are needed.
Another strength of our study is the use of a validated non-invasive airway sampling technique, the induced sputum technique, to study biological age indicators in IS cells. This technique could be valuable for future research on lung biological aging, not only in COPD patients but also in other conditions.
4. Materials and Methods
4.1. Study Design
This study is a cross-sectional study in which the established clinical protocol has been applied to examine SARS-COV-2 positive healthcare workers (HCW) of the University –Padova Hospital approximately 1 year after the diagnosis of SARS-CoV-2 infection. The inclusion criteria were to be SARS-COV-2 positive HCW of the University –Padova Hospital, do not have COVID-19 vaccination, and not have had COVID-19 reinfection in the 12 months preceding the clinical visit. Study population consists of the n=76 among the n=144 HCW of the first wave (February-May, 2020). They were enrolled during the health surveillance activity foreseen according to Legislative Decree 81/2008 at the Occupational Medicine Unit approximately 12 months after the diagnosis of SARS-CoV-2 infection with molecular swab. Paucisymptomatic and asymptomatic HCWs, who did not have symptoms at the time of the swab and who continued to remain asymptomatic during the entire isolation period (at least 14 days), were included in the study population. The local Ethics Committee approved the study (288n/AO/22) in accordance with the principles of the Declaration of Helsinki.
All participants were informed of the purpose of the study and provided a written informed consent. Subjects unwilling to participate to the study were excluded. At enrolment each study participant was characterized by an ad hoc structured questionnaire to collect information on, among others, demographics, lifestyle, medical history, environmental and occupational exposure. The assessment of medium-long term effects in HCW who have had confirmed COVID-19, irrespective of whether they were hospitalized or had a positive SARS-CoV-2 molecular swab, were performed according to Guidelines of Managing the long-term effects of COVID-19 [116]. All patients underwent a clinical examination including respiratory function tests, cardiac assessment with evaluation of heart rate variability (HRV), administration of the work ability index (WAI) questionnaire to assess their work ability. For each patient, the biological samples were also collected for basic biochemistry tests, immunological profile and biological aging analyses. Table 1 summarizes the characteristics of the study population, including demographic variables, lifestyle, occupational history, basic biochemistry parameters, liver function, inflammation, lung function and HRV. Table 2 reports all data on the course of SARS-CoV-2 infection. The biological aging of HCWs was compared with that of a positive control group for biological aging parameters, including n=7 patients with chronic obstructive pulmonary disease (COPD) who gave their final consent to participate in the study [21], which had already been approved by the Ethics Committee (3849/AO/16) in accordance with the principles of the Declaration of Helsinki.
4.2. Information Acquired through Questionnaires
An ad hoc structured questionnaire [117] was administered during interviews to elicit information on: demographics (age, sex, marital status) and other personal information (mother/father age at birth, years of education), occupation [job title; hospital department; total years worked; years spent in the current job; shift work (work was considered scheduled in day shift from 6 a.m. to 2 p.m., afternoon shift from 2 p.m. to 8 p.m. and night-shift from 8 p.m. to 6 a.m.); and frequency of night shifts/month; job energy requirement (expressed as metabolic equivalent, MET) at work; work injury], and medically relevant complaints including cardiovascular disease, musculoskeletal disorder, spinal disc hernia, gastrointestinal disease, endocrine disease, diabetes, respiratory disease and tumors. The Charlson comorbidity index, a method of predicting mortality by classifying or weighting comorbid conditions (comorbidities), was calculated, excluding diabetes, tumors and/or respiratory diseases and other inflammatory conditions [118]. Smoking history (current active smokers, former-smokers, never smokers) and pack-years [(number of cigarettes smoked per day/20) × number of years smoked] were also recorded, as well as the habitual alcohol consumption (yes/no), alcohol intake (units of drink/day, each unit being approximately 10–12 g alcohol intake) and binge drinking (>4 drink-units/day, i.e., more than 40 g alcohol/day). Physical activity in leisure time was estimated according to the International Physical Activity Questionnaire (IPAQ score).
4.3. Work Ability Assessment
The Work Ability Index (WAI), a self-assessment questionnaire consisting in 7 domains, was used as previously described [118]. WAI ranged from 7 to 49 points; four categories were identified to describe WAI levels into “poor” (score 7–27), “moderate” (score 28–36), “good” (score 37–43), and “excellent” (score 44–49) work ability as a function of the total WAI score. This is a valuable tool to identify any imbalances between what is required (performance requirements) and what you are able to give (individual potential) [119].
4.4. Respiratory FUNCTION TESTS
ALL LUNG FUNCTION MEASUREMENTS, Including forced expiratory volume in 1 second (FEV1), forced vital capacity (FVC), forced expiratory flows at different lung volumes), total lung capacity (TLC), residual volume (RV), were measured using a spirometer (Jaeger MasterScreen PFT, PRO, Viasys Sanità, Firenze, Italy) according to the guidelines/recommendations of the American Thoracic Society/European Respiratory Society (ATS/ERS) [120]. Predicted normal values from the Communaute Europeenne du Carbon et de l’Acier (CECA) were used [121].
4.5. Assessment of Autonomic Cardiac Balance and HRV Parameters
ECG was recorded during periodical health checks. Blood pressure was also measured with an Omron 705IT electronic device (Omron Healthcare Europe, The Netherlands) while the patient was lying quietly for at least 5 min, according to the recommendations of the 2023 European Society of Hypertension [122]. Subjects were instructed to avoid smoking, and to stop coffee and alcohol intake for 2 h and 48 h, respectively. They should have had sufficient (at least 8 h) rest and must not have worked the night shift before the test was performed. Blood pressure was measured once with a sphygmomanometer while the patient was lying calmly. HRV was assessed by an ECG performed in a supine position under physiologically stable conditions and using a device connected to the patient via two electrodes. HRV data were acquired by a Bluetooth acquisition system (BT16 Plus, FM, Monza, Italy). ECG was recorded for at least 5 min between 9 a.m. and 2 p.m., at rest and under ideal temperature conditions. HRV was analyzed using Kubios HRV software (ver. 3.3) [123]. Normal and aberrant complexes were identified and all adjacent intervals between normal beats over 5 min intervals were considered. We analyzed the spectral components (HRV frequency domain variables) as the absolute values of power (ms2). Power spectral density was analyzed with an autoregressive modeling-based method (AR spectrum), using the default value for the model order, i.e., 16. The main spectral components were very low frequency (VLF), low frequency (LF), high frequency (HF), and the LF/HF ratio. The area under the curve of the spectral peaks within the frequencies 0.01–0.4, 0.01–0.04, 0.04–0.15, and 0.15–0.40 Hz were defined as the total power (TP), very low-frequency power (VLF), low-frequency power (LF), and high-frequency power (HF), respectively. In order to normalize LF and HF, we used the total power within the frequency range of 0.01–0.4 Hz. The normalized low-frequency power (nLF = LF/TP) corresponds to an index of combined sympathetic and vagal modulation [124] as well as a baroreflex index [125,126], while the normalized HF power (nHF = HF/TP) represents an index of vagal activity. The low/high-frequency power ratio (LF/HF) is thus an index of sympathovagal balance. Time domain measures included the standard deviation of normal-to-normal RR intervals (SDNN), the root mean square of successive RR interval differences (RMSSD)”.
4.6. Samples Collection and IS Procedure
For each patient, blood samples were collected for basic biochemistry, immunological profile and biological aging analyses (i.e., TL and DNAmAge). During medical examination, the procedure of sputum induction and nasal swab were carried out for each patient to collect both a sample of airways cells and nasal epithelium cells, respectively, for biological aging analyses.
IS procedure was performed according to a standard protocol, and the induced sputum sample was processed as previously described [21].
4.7. Basic Biochemistry Analyses
Data of basic biochemistry included number of blood red cells, platelets and white cells, lymphocytes, monocytes, neutrophils, basophils, eosinophils, hematocrit, hemoglobin, blood glucose, triglycerides, cholesterol, low density lipoprotein (LDL), high density lipoprotein (HDL), and c-reactive protein (CRP), interleukin 6 (IL-6), alanine aminotransferase (ALT), aspartate aminotransferase (AST), Gamma-glutamyl transferase (gamma-GT), ferritin, total bilirubin, protein profile and creatinine. All the analyses were performed at the Laboratory Medicine Unit (AOUP).
4.8. DNA Extraction (from Biological Samples)
DNA was extracted from whole blood samples using the QIAamp DNA Mini Kit (Qiagen, Milano, Italy) on a QIAcube System (Qiagen, Milano, Italy) for automated high-throughput DNA purification, according to a customized protocol as previously described [21].
DNA extraction was also carried out from the IS and nasal cells collected, by the automated QIAcube System (Qiagen, Milano, Italy) utilizing QIAamp DNA Mini Kit (Qiagen, Milano, Italy) according to a customized protocol developed for highly viscous samples as previous described [21]. DNA was quantified and checked for quality using QIAxpert Quantification System (Qiagen, Milano, Italy).
4.9. DNAmAge Analysis and AgeAcc Estimation
DNAmAge was determined by analysing the methylation levels of five selected markers (ELOVL2, C1orf132, KLF14, TRIM59 and FHL2) in genomic DNA using bisulfite conversion and Pyrosequencing® methodology on PyroMark Q48 Autoprep (QIAGEN, Milano, Italy), as previously described [127]. The methylation levels of were expressed as a percentage of methylated cytosines at the 5 CpG sites considered and were used for estimation of DNAmAge as previously reported [127]. All samples were analysed 3 times for each marker to verify the reproducibility of our results, and their average was used in statistical analyses. All samples were analysed in two different days and coefficient of variation (CV) in replicate pyrosequencing runs was 0.5 %. AgeAcc was computed as the discordance between the DNAmAge of blood leukocytes and IS and NC and the subjects’ chronological age.
4.10. TL Analysis
TL was determined using quantitative real-time PCR after DNA extraction from both whole blood and IS samples [128]. This assay determines the ratio of telomere repeat copy number (T) to a single nuclear copy gene (S) in experimental samples relative to the T/S ratio of a reference pooled sample to determine measure TL in genomic DNA. Human (beta) globin (hbg) was the single-copy gene used. The PCR runs were performed in triplicate using a StepOnePlus Real-Time PCR System (Applied Biosystems, Milano, Italy), and the average of the three T/S ratio measurements was considered in the statistical analyses. To assess measurement reproducibility, 20 % of samples were replicated on separate days, and the CV for the average T/S ratio was accepted if less than 10%.
4.11. Statistical Analyses
Univariate and multivariate methods were used selecting the appropriate models. The analysese were performed using the statistical software StatsDirect and Rstudio. Regarding the analysis of biological age, our hypothesis of an accelerated lung and in nasal epithelium by COVID-19 infection were converted in a model with two final outcomes: TL and DNAmAge as previously described [21]. The biological aging of HCWs after 1 year from COVID-19 was compared to that of COPD patients as a positive control group for biological aging parameters. For this comparison we used the AgeAcc, i.e., the difference between DNAmAge and chronological age, and TL predicted computed by regressing TL measurements on chronologic age for each subject.
5. Conclusions
This innovative study’s approach, involving the assessment of biological aging across multiple tissues, provides valuable insights into how different tissues age at varying rates within the same individuals. It also underscores the significant impact of SARS-CoV-2 on biological aging, revealing that HCWs exhibit accelerated aging in blood leukocytes and IS cells compared to COPD patients, even one year after SARS-CoV-2 infection. These findings highlight the need for targeted interventions to mitigate the long-term effects of COVID-19 on cellular aging and health also in pauci- and asymptomatic COVID-19 survivors who represent the general population.
Supplementary Materials
The following supporting information can be downloaded at the website of this paper posted on Preprints.org, Figure S1: Percentage of subjects with and without persistent symptoms at 1 year after SARS-CoV2 infection, out of a total of n=76 HCWs; Figure S2: Correlation curves between NC and IS DNAmAge (A) or IS TL (B) with chronological age of HCWs COVID19 survivors; Figure S3: Correlation curves between blood leukocytes DNAmAge and NC DNAmAge (A) or IS DNAmAge (B), and blood leukocytes TL and IS TL (C) of HCWs COVID19 survivors; Table S1: Multiple linear regression analysis of the influence of leukocytes (109/L) and different blood cell counts, including neutrophils (109/L), lymphocytes (109/L), and monocytes (109/L) on blood leukocytes DNAmAge / TL; Table S2: Number of different tissues (blood, nasal cells, induced sputum cells) samples collected from our HCWs population, biomarkers of biological aging analyzed (DNAmAge, AgeAcc and TL), and measurements determined (mean(±SD)).
Author Contributions
Study Design S.P.; Conceptualization, M.C. and S.P.; Methodology, M.C., L.C. and S.P.; Subject Enrolment S.P. M.C., L.C., F.L., M.L.S., A.M., P.M.,; Analysis of biological aging, M.C. and L.C.; IS procedure: M.C., A.B. and Occupational Medicine working group; Analysis of HRV: F.L. and Occupational Medicine working group; Investigation, M.C., L.C., F.L., S.P., Occupational Medicine working group.; Data Curation, MC and L.C.; Writing—Original Draft Preparation, M.C., L.C. and S.P.; Writing—Review & Editing, S.P. M.C., L.C., F.L., M.L.S., A.M., P.M., ; Supervision, S.P.; Funding Acquisition, S.P.” All authors have read and agreed to the published version of the manuscript.
Funding
This research was funded by the European Union – Next Generation EU, in the context of The National Recovery and Resilience Plan, Investment PE8 – Project Age-It: “Ageing Well in an Ageing Society”.
Institutional Review Board Statement
The study was conducted in accordance with the Declaration of Helsinki, and approved by the local Ethics Committee approved the study (288n/AO/22) in accordance with the principles of the Declaration of Helsinki.
Informed Consent Statement
Informed consent was obtained from all subjects involved in the study.
Data Availability Statement
The datasets presented in this study are available from the corresponding author upon reasonable request.
Acknowledgments
We acknowledge funding from Next Generation EU, in the context of the National Recovery and Resilience Plan, Investment PE8 – Project Age-It: “Ageing Well in an Ageing Society” [DM 1557 11.10.2022] - Ministry of University and Research. We acknowledge the scientific contribution and support of the Occupational Medicine Working Group. Laboratory staff: Isabella Bortoletti, Alberto Gambalunga, Alessandro Nalesso, Annamaria Nicolli, Fabiola Pasqualato. Residents: Monica Battistella, Laura Fabbris, Rachele Paccagnella, Francesco Zuin, Giulia Cesarini. Master’s thesis students: Federica Casson. Nurses: Maria Beatrice Galvan, Lucia La Serra, Michela Tognon, Maria Teresa Vangelista. The authors would like to sincerely thank the General Management, Medical Management, all personnel of the Units of Occupational Health, Laboratory Medicine and Microbiology.
Conflicts of Interest
The authors declare no conflicts of interest.
References
- COVID-19 Cases | WHO COVID-19 Dashboard. Available online: https://data.who.int/dashboards/covid19/cases (accessed on 17 June 2024).
- Gorna, R.; MacDermott, N.; Rayner, C.; O’Hara, M.; Evans, S.; Agyen, L.; Nutland, W.; Rogers, N.; Hastie, C. Long COVID Guidelines Need to Reflect Lived Experience. The Lancet 2021, 397, 455–457. [Google Scholar] [CrossRef] [PubMed]
- Fernández-de-las-Peñas, C.; Palacios-Ceña, D.; Gómez-Mayordomo, V.; Cuadrado, M.L.; Florencio, L.L. Defining Post-COVID Symptoms (Post-Acute COVID, Long COVID, Persistent Post-COVID): An Integrative Classification. Int J Environ Res Public Health 2021, 18, 2621. [Google Scholar] [CrossRef] [PubMed]
- Parotto, M.; Gyöngyösi, M.; Howe, K.; Myatra, S.N.; Ranzani, O.; Shankar-Hari, M.; Herridge, M.S. Post-Acute Sequelae of COVID-19: Understanding and Addressing the Burden of Multisystem Manifestations. The Lancet Respiratory Medicine 2023, 11, 739–754. [Google Scholar] [CrossRef] [PubMed]
- Alkodaymi, M.S.; Omrani, O.A.; Fawzy, N.A.; Shaar, B.A.; Almamlouk, R.; Riaz, M.; Obeidat, M.; Obeidat, Y.; Gerberi, D.; Taha, R.M.; et al. Prevalence of Post-Acute COVID-19 Syndrome Symptoms at Different Follow-up Periods: A Systematic Review and Meta-Analysis. Clinical Microbiology and Infection 2022, 28, 657–666. [Google Scholar] [CrossRef] [PubMed]
- Han, Q.; Zheng, B.; Daines, L.; Sheikh, A. Long-Term Sequelae of COVID-19: A Systematic Review and Meta-Analysis of One-Year Follow-Up Studies on Post-COVID Symptoms. Pathogens 2022, 11, 269. [Google Scholar] [CrossRef] [PubMed]
- Ma, Y.; Deng, J.; Liu, Q.; Du, M.; Liu, M.; Liu, J. Long-Term Consequences of Asymptomatic SARS-CoV-2 Infection: A Systematic Review and Meta-Analysis. International Journal of Environmental Research and Public Health 2023, 20, 1613. [Google Scholar] [CrossRef] [PubMed]
- Boscolo-Rizzo, P.; Hummel, T.; Hopkins, C.; Dibattista, M.; Menini, A.; Spinato, G.; Fabbris, C.; Emanuelli, E.; D’Alessandro, A.; Marzolino, R.; et al. High Prevalence of Long-Term Olfactory, Gustatory, and Chemesthesis Dysfunction in Post-COVID-19 Patients: A Matched Case-Control Study with One-Year Follow-up Using a Comprehensive Psychophysical Evaluation. Rhinology 2021, 59, 517–527. [Google Scholar] [CrossRef] [PubMed]
- Boscolo-Rizzo, P.; Guida, F.; Polesel, J.; Marcuzzo, A.V.; Capriotti, V.; D’Alessandro, A.; Zanelli, E.; Marzolino, R.; Lazzarin, C.; Antonucci, P.; et al. Sequelae in Adults at 12 Months after Mild-to-moderate Coronavirus Disease 2019 (COVID-19). Int Forum Allergy Rhinol 2021, 11, 1685–1688. [Google Scholar] [CrossRef]
- Andrei Appelt, P.; Taciana Sisconetto, A.; Baldo Sucupira, K.S.M.; Neto, E. de M.; Chagas, T. de J.; Bazan, R.; Moura Cabral, A.; Andrade, A. de O.; de Souza, L.A.P.S.; José Luvizutto, G. Changes in Electrical Brain Activity and Cognitive Functions Following Mild to Moderate COVID-19: A One-Year Prospective Study After Acute Infection. Clin EEG Neurosci 2022, 53, 543–557. [Google Scholar] [CrossRef]
- Rank, A.; Tzortzini, A.; Kling, E.; Schmid, C.; Claus, R.; Löll, E.; Burger, R.; Römmele, C.; Dhillon, C.; Müller, K.; et al. One Year after Mild COVID-19: The Majority of Patients Maintain Specific Immunity, But One in Four Still Suffer from Long-Term Symptoms. J Clin Med 2021, 10, 3305. [Google Scholar] [CrossRef]
- Maestre-Muñiz, M.M.; Arias, Á.; Mata-Vázquez, E.; Martín-Toledano, M.; López-Larramona, G.; Ruiz-Chicote, A.M.; Nieto-Sandoval, B.; Lucendo, A.J. Long-Term Outcomes of Patients with Coronavirus Disease 2019 at One Year after Hospital Discharge. J Clin Med 2021, 10, 2945. [Google Scholar] [CrossRef]
- Lombardo, M.D.M.; Foppiani, A.; Peretti, G.M.; Mangiavini, L.; Battezzati, A.; Bertoli, S.; Martinelli Boneschi, F.; Zuccotti, G.V. Long-Term Coronavirus Disease 2019 Complications in Inpatients and Outpatients: A One-Year Follow-up Cohort Study. Open Forum Infectious Diseases 2021, 8, ofab384. [Google Scholar] [CrossRef]
- Seeßle, J.; Waterboer, T.; Hippchen, T.; Simon, J.; Kirchner, M.; Lim, A.; Müller, B.; Merle, U. Persistent Symptoms in Adult Patients 1 Year After Coronavirus Disease 2019 (COVID-19): A Prospective Cohort Study. Clin Infect Dis 2022, 74, 1191–1198. [Google Scholar] [CrossRef] [PubMed]
- Fischer, A.; Zhang, L.; Elbéji, A.; Wilmes, P.; Oustric, P.; Staub, T.; Nazarov, P.V.; Ollert, M.; Fagherazzi, G. Long COVID Symptomatology After 12 Months and Its Impact on Quality of Life According to Initial Coronavirus Disease 2019 Disease Severity. Open Forum Infect Dis 2022, 9, ofac397. [Google Scholar] [CrossRef] [PubMed]
- Cao, X.; Li, W.; Wang, T.; Ran, D.; Davalos, V.; Planas-Serra, L.; Pujol, A.; Esteller, M.; Wang, X.; Yu, H. Accelerated Biological Aging in COVID-19 Patients. Nat Commun 2022, 13, 2135. [Google Scholar] [CrossRef] [PubMed]
- Jylhävä, J.; Pedersen, N.L.; Hägg, S. Biological Age Predictors. EBioMedicine 2017, 21, 29–36. [Google Scholar] [CrossRef]
- Pavanello, S.; Campisi, M.; Tona, F.; Lin, C.D.; Iliceto, S. Exploring Epigenetic Age in Response to Intensive Relaxing Training: A Pilot Study to Slow Down Biological Age. Int J Environ Res Public Health 2019, 16, 3074. [Google Scholar] [CrossRef] [PubMed]
- Mongelli, A.; Barbi, V.; Gottardi Zamperla, M.; Atlante, S.; Forleo, L.; Nesta, M.; Massetti, M.; Pontecorvi, A.; Nanni, S.; Farsetti, A.; et al. Evidence for Biological Age Acceleration and Telomere Shortening in COVID-19 Survivors. International Journal of Molecular Sciences 2021, 22, 6151. [Google Scholar] [CrossRef] [PubMed]
- Franzen, J.; Nüchtern, S.; Tharmapalan, V.; Vieri, M.; Nikolić, M.; Han, Y.; Balfanz, P.; Marx, N.; Dreher, M.; Brümmendorf, T.H.; et al. Epigenetic Clocks Are Not Accelerated in COVID-19 Patients. International Journal of Molecular Sciences 2021, 22, 9306. [Google Scholar] [CrossRef]
- Campisi, M.; Liviero, F.; Maestrelli, P.; Guarnieri, G.; Pavanello, S. DNA Methylation-Based Age Prediction and Telomere Length Reveal an Accelerated Aging in Induced Sputum Cells Compared to Blood Leukocytes: A Pilot Study in COPD Patients. Front. Med. 2021, 8. [Google Scholar] [CrossRef]
- COVID-19 Rapid Guideline: Managing the Long-Term Effects of COVID-19; National Institute for Health and Care Excellence: Clinical Guidelines; National Institute for Health and Care Excellence (NICE): London, 2020; ISBN 978-1-4731-3943-5.
- Tudorache, E.; Fildan, A.P.; Frandes, M.; Dantes, E.; Tofolean, D.E. Aging and Extrapulmonary Effects of Chronic Obstructive Pulmonary Disease. CIA 2017, 12, 1281–1287. [Google Scholar] [CrossRef] [PubMed]
- Ortona, E.; Buonsenso, D.; Carfi, A.; Malorni, W.; Group, T.L.C.K. study Long COVID: An Estrogen-Associated Autoimmune Disease? Cell Death Discovery 2021, 7. [Google Scholar] [CrossRef]
- Value Gender and Equity in the Global Health Workforce. Available online: https://www.who.int/activities/value-gender-and-equity-in-the-global-health-workforce (accessed on 19 June 2024).
- Khamsi, R. Rogue Antibodies Could Be Driving Severe COVID-19. Nature 2021, 590, 29–31. [Google Scholar] [CrossRef]
- Ballouz, T.; Menges, D.; Anagnostopoulos, A.; Domenghino, A.; Aschmann, H.E.; Frei, A.; Fehr, J.S.; Puhan, M.A. Recovery and Symptom Trajectories up to Two Years after SARS-CoV-2 Infection: Population Based, Longitudinal Cohort Study. BMJ 2023, 381, e074425. [Google Scholar] [CrossRef] [PubMed]
- Fumagalli, C.; Zocchi, C.; Tassetti, L.; Silverii, M.V.; Amato, C.; Livi, L.; Giovannoni, L.; Verrillo, F.; Bartoloni, A.; Marcucci, R.; et al. Factors Associated with Persistence of Symptoms 1 Year after COVID-19: A Longitudinal, Prospective Phone-Based Interview Follow-up Cohort Study. European Journal of Internal Medicine 2022, 97, 36–41. [Google Scholar] [CrossRef] [PubMed]
- Fernandez-de-las-Peñas, C.; Notarte, K.I.; Macasaet, R.; Velasco, J.V.; Catahay, J.A.; Ver, A.T.; Chung, W.; Valera-Calero, J.A.; Navarro-Santana, M. Persistence of Post-COVID Symptoms in the General Population Two Years after SARS-CoV-2 Infection: A Systematic Review and Meta-Analysis. Journal of Infection 2024, 88, 77–88. [Google Scholar] [CrossRef]
- Oblak, L.; van der Zaag, J.; Higgins-Chen, A.T.; Levine, M.E.; Boks, M.P. A Systematic Review of Biological, Social and Environmental Factors Associated with Epigenetic Clock Acceleration. Ageing Research Reviews 2021, 69, 101348. [Google Scholar] [CrossRef]
- Alberts, S.C.; Archie, E.A.; Gesquiere, L.R.; Altmann, J.; Vaupel, J.W.; Christensen, K. The Male-Female Health-Survival Paradox: A Comparative Perspective on Sex Differences in Aging and Mortality. In Sociality, Hierarchy, Health: Comparative Biodemography: A Collection of Papers; National Academies Press (US), 2014. [Google Scholar]
- Corley, M.J.; Pang, A.P.S.; Dody, K.; Mudd, P.A.; Patterson, B.K.; Seethamraju, H.; Bram, Y.; Peluso, M.J.; Torres, L.; Iyer, N.S.; et al. Genome-Wide DNA Methylation Profiling of Peripheral Blood Reveals an Epigenetic Signature Associated with Severe COVID-19. Journal of Leukocyte Biology 2021, 110, 21–26. [Google Scholar] [CrossRef]
- Schäfer, A.; Baric, R.S. Epigenetic Landscape during Coronavirus Infection. Pathogens 2017, 6, 8. [Google Scholar] [CrossRef]
- Castro de Moura, M.; Davalos, V.; Planas-Serra, L.; Alvarez-Errico, D.; Arribas, C.; Ruiz, M.; Aguilera-Albesa, S.; Troya, J.; Valencia-Ramos, J.; Vélez-Santamaria, V.; et al. Epigenome-Wide Association Study of COVID-19 Severity with Respiratory Failure. EBioMedicine 2021, 66, 103339. [Google Scholar] [CrossRef]
- Menachery, V.D.; Schäfer, A.; Burnum-Johnson, K.E.; Mitchell, H.D.; Eisfeld, A.J.; Walters, K.B.; Nicora, C.D.; Purvine, S.O.; Casey, C.P.; Monroe, M.E.; et al. MERS-CoV and H5N1 Influenza Virus Antagonize Antigen Presentation by Altering the Epigenetic Landscape. Proc Natl Acad Sci U S A 2018, 115, E1012–E1021. [Google Scholar] [CrossRef] [PubMed]
- Esteban-Cantos, A.; Rodríguez-Centeno, J.; Barruz, P.; Alejos, B.; Saiz-Medrano, G.; Nevado, J.; Martin, A.; Gayá, F.; De Miguel, R.; Bernardino, J.I.; et al. Epigenetic Age Acceleration Changes 2 Years after Antiretroviral Therapy Initiation in Adults with HIV: A Substudy of the NEAT001/ANRS143 Randomised Trial. The Lancet HIV 2021, 8, e197–e205. [Google Scholar] [CrossRef] [PubMed]
- Horvath, S.; Levine, A.J. HIV-1 Infection Accelerates Age According to the Epigenetic Clock. The Journal of Infectious Diseases 2015, 212, 1563–1573. [Google Scholar] [CrossRef] [PubMed]
- Horvath, S.; Stein, D.J.; Phillips, N.; Heany, S.J.; Kobor, M.S.; Lin, D.T.S.; Myer, L.; Zar, H.J.; Levine, A.J.; Hoare, J. Perinatally Acquired HIV Infection Accelerates Epigenetic Aging in South African Adolescents. AIDS 2018, 32, 1465. [Google Scholar] [CrossRef] [PubMed]
- Gale, C.R.; Marioni, R.E.; Harris, S.E.; Starr, J.M.; Deary, I.J. DNA Methylation and the Epigenetic Clock in Relation to Physical Frailty in Older People: The Lothian Birth Cohort 1936. Clin Epigenet 2018, 10, 101. [Google Scholar] [CrossRef] [PubMed]
- Dugué, P.-A.; Bassett, J.K.; Joo, J.E.; Jung, C.-H.; Ming Wong, E.; Moreno-Betancur, M.; Schmidt, D.; Makalic, E.; Li, S.; Severi, G.; et al. DNA Methylation-Based Biological Aging and Cancer Risk and Survival: Pooled Analysis of Seven Prospective Studies. International Journal of Cancer 2018, 142, 1611–1619. [Google Scholar] [CrossRef] [PubMed]
- Grant, C.D.; Jafari, N.; Hou, L.; Li, Y.; Stewart, J.D.; Zhang, G.; Lamichhane, A.; Manson, J.E.; Baccarelli, A.A.; Whitsel, E.A.; et al. A Longitudinal Study of DNA Methylation as a Potential Mediator of Age-Related Diabetes Risk. GeroScience 2017, 39, 475–489. [Google Scholar] [CrossRef]
- Roetker, N.S.; Pankow, J.S.; Bressler, J.; Morrison, A.C.; Boerwinkle, E. Prospective Study of Epigenetic Age Acceleration and Incidence of Cardiovascular Disease Outcomes in the ARIC Study (Atherosclerosis Risk in Communities). Circulation: Genomic and Precision Medicine 2018, 11, e001937. [Google Scholar] [CrossRef] [PubMed]
- Horvath, S.; Ritz, B.R. Increased Epigenetic Age and Granulocyte Counts in the Blood of Parkinson’s Disease Patients. Aging 2015, 7, 1130–1142. [Google Scholar] [CrossRef]
- Lowery, E.M.; Brubaker, A.L.; Kuhlmann, E.; Kovacs, E.J. The Aging Lung. CIA 2013, 8, 1489–1496. [Google Scholar] [CrossRef]
- Sharma, G.; Goodwin, J. Effect of Aging on Respiratory System Physiology and Immunology. Clinical Interventions in Aging 2006, 1, 253. [Google Scholar] [CrossRef] [PubMed]
- Thomas, E.T.; Guppy, M.; Straus, S.E.; Bell, K.J.L.; Glasziou, P. Rate of Normal Lung Function Decline in Ageing Adults: A Systematic Review of Prospective Cohort Studies. BMJ Open 2019, 9, e028150. [Google Scholar] [CrossRef] [PubMed]
- Ammous, F.; Zhao, W.; Ratliff, S.M.; Mosley, T.H.; Bielak, L.F.; Zhou, X.; Peyser, P.A.; Kardia, S.L.R.; Smith, J.A. Epigenetic Age Acceleration Is Associated with Cardiometabolic Risk Factors and Clinical Cardiovascular Disease Risk Scores in African Americans. Clinical Epigenetics 2021, 13, 55. [Google Scholar] [CrossRef] [PubMed]
- Peters, S.A.E.; Singhateh, Y.; Mackay, D.; Huxley, R.R.; Woodward, M. Total Cholesterol as a Risk Factor for Coronary Heart Disease and Stroke in Women Compared with Men: A Systematic Review and Meta-Analysis. Atherosclerosis 2016, 248, 123–131. [Google Scholar] [CrossRef] [PubMed]
- Nagasawa, S.; Okamura, T.; Iso, H.; Tamakoshi, A.; Yamada, M.; Watanabe, M.; Murakami, Y.; Miura, K.; Ueshima, H.; et al. Relation Between Serum Total Cholesterol Level and Cardiovascular Disease Stratified by Sex and Age Group: A Pooled Analysis of 65 594 Individuals From 10 Cohort Studies in Japan. Journal of the American Heart Association 2012, 1, e001974. [Google Scholar] [CrossRef] [PubMed]
- The Lipid Research Clinics Coronary Primary Prevention Trial Results: I. Reduction in Incidence of Coronary Heart Disease. JAMA 1984, 251, 351–364. [CrossRef]
- Castelli, W.P.; Garrison, R.J.; Wilson, P.W.F.; Abbott, R.D.; Kalousdian, S.; Kannel, W.B. Incidence of Coronary Heart Disease and Lipoprotein Cholesterol Levels: The Framingham Study. JAMA 1986, 256, 2835–2838. [Google Scholar] [CrossRef] [PubMed]
- Castelli, W.P.; Anderson, K.; Wilson, P.W.F.; Levy, D. Lipids and Risk of Coronary Heart Disease The Framingham Study. Annals of Epidemiology 1992, 2, 23–28. [Google Scholar] [CrossRef] [PubMed]
- Doucet, J.; Gourdy, P.; Meyer, L.; Benabdelmoumene, N.; Bourdel-Marchasson, I. Management of Glucose-Lowering Therapy in Older Adults with Type 2 Diabetes: Challenges and Opportunities. Clin Interv Aging 2023, 18, 1687–1703. [Google Scholar] [CrossRef]
- Alavinia, S.M.; van Duivenbooden, C.; Burdorf, A. Influence of Work-Related Factors and Individual Characteristics on Work Ability among Dutch Construction Workers. Scand J Work Environ Health 2007, 33, 351–357. [Google Scholar] [CrossRef]
- Ilmarinen, J.E. Aging Workers. Occup Environ Med 2001, 58, 546–552. [Google Scholar] [CrossRef] [PubMed]
- McGonagle, A.K.; Fisher, G.G.; Barnes-Farrell, J.L.; Grosch, J.W. Individual and Work Factors Related to Perceived Work Ability and Labor Force Outcomes. J Appl Psychol 2015, 100, 376–398. [Google Scholar] [CrossRef] [PubMed]
- Alcover, C.-M.; Topa, G. Work Characteristics, Motivational Orientations, Psychological Work Ability and Job Mobility Intentions of Older Workers. PLoS One 2018, 13, e0195973. [Google Scholar] [CrossRef] [PubMed]
- Guidetti, G.; Viotti, S.; Bruno, A.; Converso, D. Teachers’ Work Ability: A Study of Relationships between Collective Efficacy and Self-Efficacy Beliefs. Psychol Res Behav Manag 2018, 11, 197–206. [Google Scholar] [CrossRef] [PubMed]
- McElhaney, J.E.; Effros, R.B. Immunosenescence: What Does It Mean to Health Outcomes in Older Adults? Curr Opin Immunol 2009, 21, 418–424. [Google Scholar] [CrossRef] [PubMed]
- Zhang, Z.; Reynolds, S.R.; Stolrow, H.G.; Chen, J.-Q.; Christensen, B.C.; Salas, L.A. Deciphering the Role of Immune Cell Composition in Epigenetic Age Acceleration: Insights from Cell-Type Deconvolution Applied to Human Blood Epigenetic Clocks. Aging Cell 2024, 23, e14071. [Google Scholar] [CrossRef] [PubMed]
- Wacka, E.; Nicikowski, J.; Jarmuzek, P.; Zembron-Lacny, A. Anemia and Its Connections to Inflammation in Older Adults: A Review. J Clin Med 2024, 13, 2049. [Google Scholar] [CrossRef]
- Bradycardia: Slow Heart Rate Available online:. Available online: https://www.heart.org/en/health-topics/arrhythmia/about-arrhythmia/bradycardia--slow-heart-rate (accessed on 2 July 2024).
- O’Brien, I.A.; O’Hare, P.; Corrall, R.J. Heart Rate Variability in Healthy Subjects: Effect of Age and the Derivation of Normal Ranges for Tests of Autonomic Function. Br Heart J 1986, 55, 348–354. [Google Scholar] [CrossRef] [PubMed]
- Fransquet, P.D.; Wrigglesworth, J.; Woods, R.L.; Ernst, M.E.; Ryan, J. The Epigenetic Clock as a Predictor of Disease and Mortality Risk: A Systematic Review and Meta-Analysis. Clinical Epigenetics 2019, 11, 62. [Google Scholar] [CrossRef]
- Liviero, F.; Scapellato, M.L.; Volpin, A.; Battistella, M.; Fabris, L.; Brischigliaro, L.; Folino, F.; Moretto, A.; Mason, P.; Pavanello, S. Long Term Follow-up of Heart Rate Variability in Healthcare Workers with Mild COVID-19. Front Neurol 2024, 15, 1403551. [Google Scholar] [CrossRef]
- Tiwari, R.; Kumar, R.; Malik, S.; Raj, T.; Kumar, P. Analysis of Heart Rate Variability and Implication of Different Factors on Heart Rate Variability. Curr Cardiol Rev 2021, 17, e160721189770. [Google Scholar] [CrossRef]
- Tang, B.; Li, X.; Wang, Y.; Sjölander, A.; Johnell, K.; Thambisetty, M.; Ferrucci, L.; Reynolds, C.A.; Finkel, D.; Jylhävä, J.; et al. Longitudinal Associations between Use of Antihypertensive, Antidiabetic, and Lipid-Lowering Medications and Biological Aging. Geroscience 2023, 45, 2065–2078. [Google Scholar] [CrossRef]
- Horvath, S. DNA Methylation Age of Human Tissues and Cell Types. Genome Biol 2013, 14, 3156. [Google Scholar] [CrossRef] [PubMed]
- Hannum, G.; Guinney, J.; Zhao, L.; Zhang, L.; Hughes, G.; Sadda, S.; Klotzle, B.; Bibikova, M.; Fan, J.-B.; Gao, Y.; et al. Genome-Wide Methylation Profiles Reveal Quantitative Views of Human Aging Rates. Molecular Cell 2013, 49, 359–367. [Google Scholar] [CrossRef]
- Müezzinler, A.; Zaineddin, A.K.; Brenner, H. A Systematic Review of Leukocyte Telomere Length and Age in Adults. Ageing Res Rev 2013, 12, 509–519. [Google Scholar] [CrossRef] [PubMed]
- Lin, J.; Epel, E. Stress and Telomere Shortening: Insights from Cellular Mechanisms. Ageing Res Rev 2022, 73, 101507. [Google Scholar] [CrossRef]
- Ference, B.A.; Ginsberg, H.N.; Graham, I.; Ray, K.K.; Packard, C.J.; Bruckert, E.; Hegele, R.A.; Krauss, R.M.; Raal, F.J.; Schunkert, H.; et al. Low-Density Lipoproteins Cause Atherosclerotic Cardiovascular Disease. 1. Evidence from Genetic, Epidemiologic, and Clinical Studies. A Consensus Statement from the European Atherosclerosis Society Consensus Panel. Eur Heart J 2017, 38, 2459–2472. [Google Scholar] [CrossRef] [PubMed]
- Ornish, D.; Lin, J.; Daubenmier, J.; Weidner, G.; Epel, E.; Kemp, C.; Magbanua, M.J.M.; Marlin, R.; Yglecias, L.; Carroll, P.R.; et al. Increased Telomerase Activity and Comprehensive Lifestyle Changes: A Pilot Study. Lancet Oncol 2008, 9, 1048–1057. [Google Scholar] [CrossRef]
- Rehkopf, D.H.; Needham, B.L.; Lin, J.; Blackburn, E.H.; Zota, A.R.; Wojcicki, J.M.; Epel, E.S. Leukocyte Telomere Length in Relation to 17 Biomarkers of Cardiovascular Disease Risk: A Cross-Sectional Study of US Adults. PLoS Med 2016, 13, e1002188. [Google Scholar] [CrossRef]
- Mazidi, M.; Kengne, A.P.; Sahebkar, A.; Banach, M. Telomere Length Is Associated With Cardiometabolic Factors in US Adults. Angiology 2018, 69, 164–169. [Google Scholar] [CrossRef]
- Kim, D.; Li, A.A.; Ahmed, A. Leucocyte Telomere Shortening Is Associated with Nonalcoholic Fatty Liver Disease-Related Advanced Fibrosis. Liver Int 2018, 38, 1839–1848. [Google Scholar] [CrossRef] [PubMed]
- Révész, D.; Verhoeven, J.E.; Picard, M.; Lin, J.; Sidney, S.; Epel, E.S.; Penninx, B.W.J.H.; Puterman, E. Associations Between Cellular Aging Markers and Metabolic Syndrome: Findings From the CARDIA Study. J Clin Endocrinol Metab 2018, 103, 148–157. [Google Scholar] [CrossRef] [PubMed]
- Baragetti, A.; Palmen, J.; Garlaschelli, K.; Grigore, L.; Pellegatta, F.; Tragni, E.; Catapano, A.L.; Humphries, S.E.; Norata, G.D.; Talmud, P.J. Telomere Shortening over 6 Years Is Associated with Increased Subclinical Carotid Vascular Damage and Worse Cardiovascular Prognosis in the General Population. J Intern Med 2015, 277, 478–487. [Google Scholar] [CrossRef] [PubMed]
- Zhan, Y.; Karlsson, I.K.; Karlsson, R.; Tillander, A.; Reynolds, C.A.; Pedersen, N.L.; Hägg, S. Exploring the Causal Pathway From Telomere Length to Coronary Heart Disease: A Network Mendelian Randomization Study. Circ Res 2017, 121, 214–219. [Google Scholar] [CrossRef]
- Rode, L.; Nordestgaard, B.G.; Bojesen, S.E. Peripheral Blood Leukocyte Telomere Length and Mortality among 64,637 Individuals from the General Population. J Natl Cancer Inst 2015, 107, djv074. [Google Scholar] [CrossRef] [PubMed]
- Cohen, S.; Janicki-Deverts, D.; Miller, G.E. Psychological Stress and Disease. JAMA 2007, 298, 1685–1687. [Google Scholar] [CrossRef]
- Bellon, M.; Nicot, C. Telomere Dynamics in Immune Senescence and Exhaustion Triggered by Chronic Viral Infection. Viruses 2017, 9, 289. [Google Scholar] [CrossRef]
- Chou, J.P.; Effros, R.B. T Cell Replicative Senescence in Human Aging. Curr Pharm Des 2013, 19, 1680–1698. [Google Scholar] [CrossRef] [PubMed]
- Dowd, J.B.; Bosch, J.A.; Steptoe, A.; Jayabalasingham, B.; Lin, J.; Yolken, R.; Aiello, A.E. Persistent Herpesvirus Infections and Telomere Attrition Over 3 Years in the Whitehall II Cohort. J Infect Dis 2017, 216, 565–572. [Google Scholar] [CrossRef]
- Aubert, G.; Baerlocher, G.M.; Vulto, I.; Poon, S.S.; Lansdorp, P.M. Collapse of Telomere Homeostasis in Hematopoietic Cells Caused by Heterozygous Mutations in Telomerase Genes. PLoS Genet 2012, 8, e1002696. [Google Scholar] [CrossRef]
- Al-Attiyah, R.; Safar, H.A.; Botras, L.; Botras, M.; Al-Kandari, F.; Chehadeh, W.; Mustafa, A.S. Immune Cells Profiles In The Peripheral Blood Of Patients With Moderate To Severe COVID-19 And Healthy Subjects With and Without Vaccination With The Pfizer-BioNTech mRNA Vaccine. Front Immunol 2022, 13, 851765. [Google Scholar] [CrossRef]
- Berentschot, J.C.; Drexhage, H.A.; Aynekulu Mersha, D.G.; Wijkhuijs, A.J.M.; GeurtsvanKessel, C.H.; Koopmans, M.P.G.; Voermans, J.J.C.; Hendriks, R.W.; Nagtzaam, N.M.A.; de Bie, M.; et al. Immunological Profiling in Long COVID: Overall Low Grade Inflammation and T-Lymphocyte Senescence and Increased Monocyte Activation Correlating with Increasing Fatigue Severity. Front. Immunol. 2023, 14. [Google Scholar] [CrossRef]
- Fasching, C.L. Telomere Length Measurement as a Clinical Biomarker of Aging and Disease. Crit Rev Clin Lab Sci 2018, 55, 443–465. [Google Scholar] [CrossRef]
- Pavanello, S.; Campisi, M.; Fabozzo, A.; Cibin, G.; Tarzia, V.; Toscano, G.; Gerosa, G. The Biological Age of the Heart Is Consistently Younger than Chronological Age. Sci Rep 2020, 10, 10752. [Google Scholar] [CrossRef] [PubMed]
- Pavanello, S.; Campisi, M.; Rigotti, P.; Bello, M.D.; Nuzzolese, E.; Neri, F.; Furian, L. DNA Methylation - and Telomere - Based Biological Age Estimation as Markers of Biological Aging in Donors Kidneys. Front Med (Lausanne) 2022, 9, 832411. [Google Scholar] [CrossRef]
- Binnie, A.; Walsh, C.J.; Hu, P.; Dwivedi, D.J.; Fox-Robichaud, A.; Liaw, P.C.; Tsang, J.L.Y.; Batt, J.; Carrasqueiro, G.; Gupta, S.; et al. Epigenetic Profiling in Severe Sepsis: A Pilot Study of DNA Methylation Profiles in Critical Illness. Crit Care Med 2020, 48, 142–150. [Google Scholar] [CrossRef] [PubMed]
- Güiza, F.; Vanhorebeek, I.; Verstraete, S.; Verlinden, I.; Derese, I.; Ingels, C.; Dulfer, K.; Verbruggen, S.C.; Garcia Guerra, G.; Joosten, K.F.; et al. Effect of Early Parenteral Nutrition during Paediatric Critical Illness on DNA Methylation as a Potential Mediator of Impaired Neurocognitive Development: A Pre-Planned Secondary Analysis of the PEPaNIC International Randomised Controlled Trial. Lancet Respir Med 2020, 8, 288–303. [Google Scholar] [CrossRef]
- Balnis, J.; Madrid, A.; Hogan, K.J.; Drake, L.A.; Chieng, H.C.; Tiwari, A.; Vincent, C.E.; Chopra, A.; Vincent, P.A.; Robek, M.D.; et al. Blood DNA Methylation and COVID-19 Outcomes. Clin Epigenetics 2021, 13, 118. [Google Scholar] [CrossRef] [PubMed]
- Morselli, M.; Farrell, C.; Montoya, D.; Gören, T.; Sabırlı, R.; Türkçüer, İ.; Kurt, Ö.; Köseler, A.; Pellegrini, M. DNA Methylation Profiles in Pneumonia Patients Reflect Changes in Cell Types and Pneumonia Severity. Epigenetics 2022, 17, 1646–1660. [Google Scholar] [CrossRef]
- Saiz, M.L.; DeDiego, M.L.; López-García, D.; Corte-Iglesias, V.; Baragaño Raneros, A.; Astola, I.; Asensi, V.; López-Larrea, C.; Suarez-Alvarez, B. Epigenetic Targeting of the ACE2 and NRP1 Viral Receptors Limits SARS-CoV-2 Infectivity. Clin Epigenetics 2021, 13, 187. [Google Scholar] [CrossRef]
- Wang, Q.; Codd, V.; Raisi-Estabragh, Z.; Musicha, C.; Bountziouka, V.; Kaptoge, S.; Allara, E.; Angelantonio, E.D.; Butterworth, A.S.; Wood, A.M.; et al. Shorter Leukocyte Telomere Length Is Associated with Adverse COVID-19 Outcomes: A Cohort Study in UK Biobank. EBioMedicine 2021, 70, 103485. [Google Scholar] [CrossRef]
- Mahmoodpoor, A.; Sanaie, S.; Roudbari, F.; Sabzevari, T.; Sohrabifar, N.; Kazeminasab, S. Understanding the Role of Telomere Attrition and Epigenetic Signatures in COVID-19 Severity. Gene 2022, 811, 146069. [Google Scholar] [CrossRef] [PubMed]
- Aviv, A. Telomeres and COVID-19. FASEB J 2020, 34, 7247–7252. [Google Scholar] [CrossRef]
- Sanchez-Vazquez, R.; Guío-Carrión, A.; Zapatero-Gaviria, A.; Martínez, P.; Blasco, M.A. Shorter Telomere Lengths in Patients with Severe COVID-19 Disease. Aging (Albany NY) 2021, 13, 1–15. [Google Scholar] [CrossRef]
- Froidure, A.; Mahieu, M.; Hoton, D.; Laterre, P.-F.; Yombi, J.C.; Koenig, S.; Ghaye, B.; Defour, J.-P.; Decottignies, A. Short Telomeres Increase the Risk of Severe COVID-19. Aging (Albany NY) 2020, 12, 19911–19922. [Google Scholar] [CrossRef]
- Martínez, P.; Sánchez-Vazquez, R.; Saha, A.; Rodriguez-Duque, M.S.; Naranjo-Gonzalo, S.; Osorio-Chavez, J.S.; Villar-Ramos, A.V.; Blasco, M.A. Short Telomeres in Alveolar Type II Cells Associate with Lung Fibrosis in Post COVID-19 Patients with Cancer. Aging 2023, 15, 4625–4641. [Google Scholar] [CrossRef] [PubMed]
- Ruiz, A.; Flores-Gonzalez, J.; Buendia-Roldan, I.; Chavez-Galan, L. Telomere Shortening and Its Association with Cell Dysfunction in Lung Diseases. International Journal of Molecular Sciences 2022, 23, 425. [Google Scholar] [CrossRef]
- Bejaoui, Y.; Humaira Amanullah, F.; Saad, M.; Taleb, S.; Bradic, M.; Megarbane, A.; Ait Hssain, A.; Abi Khalil, C.; El Hajj, N. Epigenetic Age Acceleration in Surviving versus Deceased COVID-19 Patients with Acute Respiratory Distress Syndrome Following Hospitalization. Clin Epigenetics 2023, 15, 186. [Google Scholar] [CrossRef] [PubMed]
- Raghuraman, S.; Donkin, I.; Versteyhe, S.; Barrès, R.; Simar, D. The Emerging Role of Epigenetics in Inflammation and Immunometabolism. Trends Endocrinol Metab 2016, 27, 782–795. [Google Scholar] [CrossRef]
- Bayarsaihan, D. Epigenetic Mechanisms in Inflammation. J Dent Res 2011, 90, 9–17. [Google Scholar] [CrossRef]
- Ahmad, S.; Manzoor, S.; Siddiqui, S.; Mariappan, N.; Zafar, I.; Ahmad, A.; Ahmad, A. Epigenetic Underpinnings of Inflammation: Connecting the Dots between Pulmonary Diseases, Lung Cancer and COVID-19. Seminars in Cancer Biology 2022, 83, 384–398. [Google Scholar] [CrossRef]
- Stukas, S.; Hoiland, R.L.; Cooper, J.; Thiara, S.; Griesdale, D.E.; Thomas, A.D.; Orde, M.M.; English, J.C.; Chen, L.Y.C.; Foster, D.; et al. The Association of Inflammatory Cytokines in the Pulmonary Pathophysiology of Respiratory Failure in Critically Ill Patients With Coronavirus Disease 2019. Crit Care Explor 2020, 2, e0203. [Google Scholar] [CrossRef] [PubMed]
- Sungnak, W.; Huang, N.; Bécavin, C.; Berg, M.; Queen, R.; Litvinukova, M.; Talavera-López, C.; Maatz, H.; Reichart, D.; Sampaziotis, F.; et al. SARS-CoV-2 Entry Factors Are Highly Expressed in Nasal Epithelial Cells Together with Innate Immune Genes. Nat Med 2020, 26, 681–687. [Google Scholar] [CrossRef] [PubMed]
- Wellford, S.A.; Moseman, E.A. Olfactory Immune Response to SARS-CoV-2. Cell Mol Immunol 2024, 21, 134–143. [Google Scholar] [CrossRef] [PubMed]
- Meinhardt, J.; Radke, J.; Dittmayer, C.; Franz, J.; Thomas, C.; Mothes, R.; Laue, M.; Schneider, J.; Brünink, S.; Greuel, S.; et al. Olfactory Transmucosal SARS-CoV-2 Invasion as a Port of Central Nervous System Entry in Individuals with COVID-19. Nat Neurosci 2021, 24, 168–175. [Google Scholar] [CrossRef] [PubMed]
- Butowt, R.; von Bartheld, C.S. Anosmia in COVID-19: Underlying Mechanisms and Assessment of an Olfactory Route to Brain Infection. Neuroscientist 2021, 27, 582–603. [Google Scholar] [CrossRef] [PubMed]
- Barnes, P.J. Inflammatory Mechanisms in Patients with Chronic Obstructive Pulmonary Disease. Journal of Allergy and Clinical Immunology 2016, 138, 16–27. [Google Scholar] [CrossRef]
- Barnes, P.J. Cellular and Molecular Mechanisms of Asthma and COPD. Clinical Science 2017, 131, 1541–1558. [Google Scholar] [CrossRef]
- da Silva, C.O.; de Souza Nogueira, J.; do Nascimento, A.P.; Victoni, T.; Bártholo, T.P.; da Costa, C.H.; Costa, A.M.A.; Valença, S. dos S.; Schmidt, M.; Porto, L.C. COPD Patients Exhibit Distinct Gene Expression, Accelerated Cellular Aging, and Bias to M2 Macrophages. Int J Mol Sci 2023, 24, 9913. [Google Scholar] [CrossRef]
- Kukrety, S.P.; Parekh, J.D.; Bailey, K.L. Chronic Obstructive Pulmonary Disease and the Hallmarks of Aging. Lung India 2018, 35, 321–327. [Google Scholar] [CrossRef]
- Shah, W.; Hillman, T.; Playford, E.D.; Hishmeh, L. Managing the Long Term Effects of Covid-19: Summary of NICE, SIGN, and RCGP Rapid Guideline. BMJ 2021, 372, n136. [Google Scholar] [CrossRef] [PubMed]
- Pavanello, S.; Stendardo, M.; Mastrangelo, G.; Bonci, M.; Bottazzi, B.; Campisi, M.; Nardini, M.; Leone, R.; Mantovani, A.; Boschetto, P. Inflammatory Long Pentraxin 3 Is Associated with Leukocyte Telomere Length in Night-Shift Workers. Front Immunol 2017, 8, 516. [Google Scholar] [CrossRef] [PubMed]
- Pavanello, S.; Stendardo, M.; Mastrangelo, G.; Casillo, V.; Nardini, M.; Mutti, A.; Campisi, M.; Andreoli, R.; Boschetto, P. Higher Number of Night Shifts Associates with Good Perception of Work Capacity and Optimal Lung Function but Correlates with Increased Oxidative Damage and Telomere Attrition. Biomed Res Int 2019, 2019, 8327629. [Google Scholar] [CrossRef]
- Ilmarinen, J. The Work Ability Index (WAI). Occupational Medicine 2007, 57. [Google Scholar] [CrossRef]
- Miller, M.R.; Hankinson, J.; Brusasco, V.; Burgos, F.; Casaburi, R.; Coates, A.; Crapo, R.; Enright, P.; van der Grinten, C.P.M.; Gustafsson, P.; et al. Standardisation of Spirometry. Eur Respir J 2005, 26, 319–338. [Google Scholar] [CrossRef] [PubMed]
- des Communautes Europeennes, C. Tables de Reference Pour Les Examens Spirometriques; Office Des Publications Officielle Des Communautes Europeennes: Luxembourg, 1971. [Google Scholar]
- Mancia, G.; Kreutz, R.; Brunström, M.; Burnier, M.; Grassi, G.; Januszewicz, A.; Muiesan, M.L.; Tsioufis, K.; Agabiti-Rosei, E.; Algharably, E.A.E.; et al. 2023 ESH Guidelines for the Management of Arterial Hypertension The Task Force for the Management of Arterial Hypertension of the European Society of Hypertension: Endorsed by the International Society of Hypertension (ISH) and the European Renal Association (ERA). Journal of Hypertension 2023, 41, 1874. [Google Scholar] [CrossRef] [PubMed]
- Tarvainen, M.P.; Niskanen, J.-P.; Lipponen, J.A.; Ranta-aho, P.O.; Karjalainen, P.A. Kubios HRV – Heart Rate Variability Analysis Software. Computer Methods and Programs in Biomedicine 2014, 113, 210–220. [Google Scholar] [CrossRef]
- Koizumi, K.; Terui, N.; Kollai, M. Effect of Cardiac Vagal and Sympathetic Nerve Activity on Heart Rate in Rhythmic Fluctuations. J Auton Nerv Syst 1985, 12, 251–259. [Google Scholar] [CrossRef]
- Moak, J.P.; Goldstein, D.S.; Eldadah, B.A.; Saleem, A.; Holmes, C.; Pechnik, S.; Sharabi, Y. Supine Low-Frequency Power of Heart Rate Variability Reflects Baroreflex Function, Not Cardiac Sympathetic Innervation. Heart Rhythm 2007, 4, 1523–1529. [Google Scholar] [CrossRef]
- Rahman, F.; Pechnik, S.; Gross, D.; Sewell, L.; Goldstein, D.S. Low Frequency Power of Heart Rate Variability Reflects Baroreflex Function, Not Cardiac Sympathetic Innervation. Clin Auton Res 2011, 21, 133–141. [Google Scholar] [CrossRef]
- Campisi, M.; Mastrangelo, G.; Mielżyńska-Švach, D.; Hoxha, M.; Bollati, V.; Baccarelli, A.A.; Carta, A.; Porru, S.; Pavanello, S. The Effect of High Polycyclic Aromatic Hydrocarbon Exposure on Biological Aging Indicators. Environmental Health 2023, 22, 27. [Google Scholar] [CrossRef] [PubMed]
- Pavanello, S.; Campisi, M.; Grassi, A.; Mastrangelo, G.; Durante, E.; Veronesi, A.; Gallucci, M. Longer Leukocytes Telomere Length Predicts a Significant Survival Advantage in the Elderly TRELONG Cohort, with Short Physical Performance Battery Score and Years of Education as Main Determinants for Telomere Elongation. J Clin Med 2021, 10, 3700. [Google Scholar] [CrossRef] [PubMed]
Figure 1.
Correlation curves between blood leukocytes DNAmAge (A) or TL (B) and chronological age of n = 76 HCWs COVID19 survivors. In (A), a simple linear regression plot shows the correlation between blood leukocyte DNAmAge and chronological age [correlation coefficient (r) = 0.9433; two-sided p < 0.0001], while in (B), simple linear regression linear regression plot showing the correlation between blood leukocyte TL and chronological age [correlation coefficient (r) = -0.3217; two-sided p = 0.0046]. Mean, standard error (SE), and 95% coefficient intervals (CI) are represented as green, pink, and black lines, respectively.
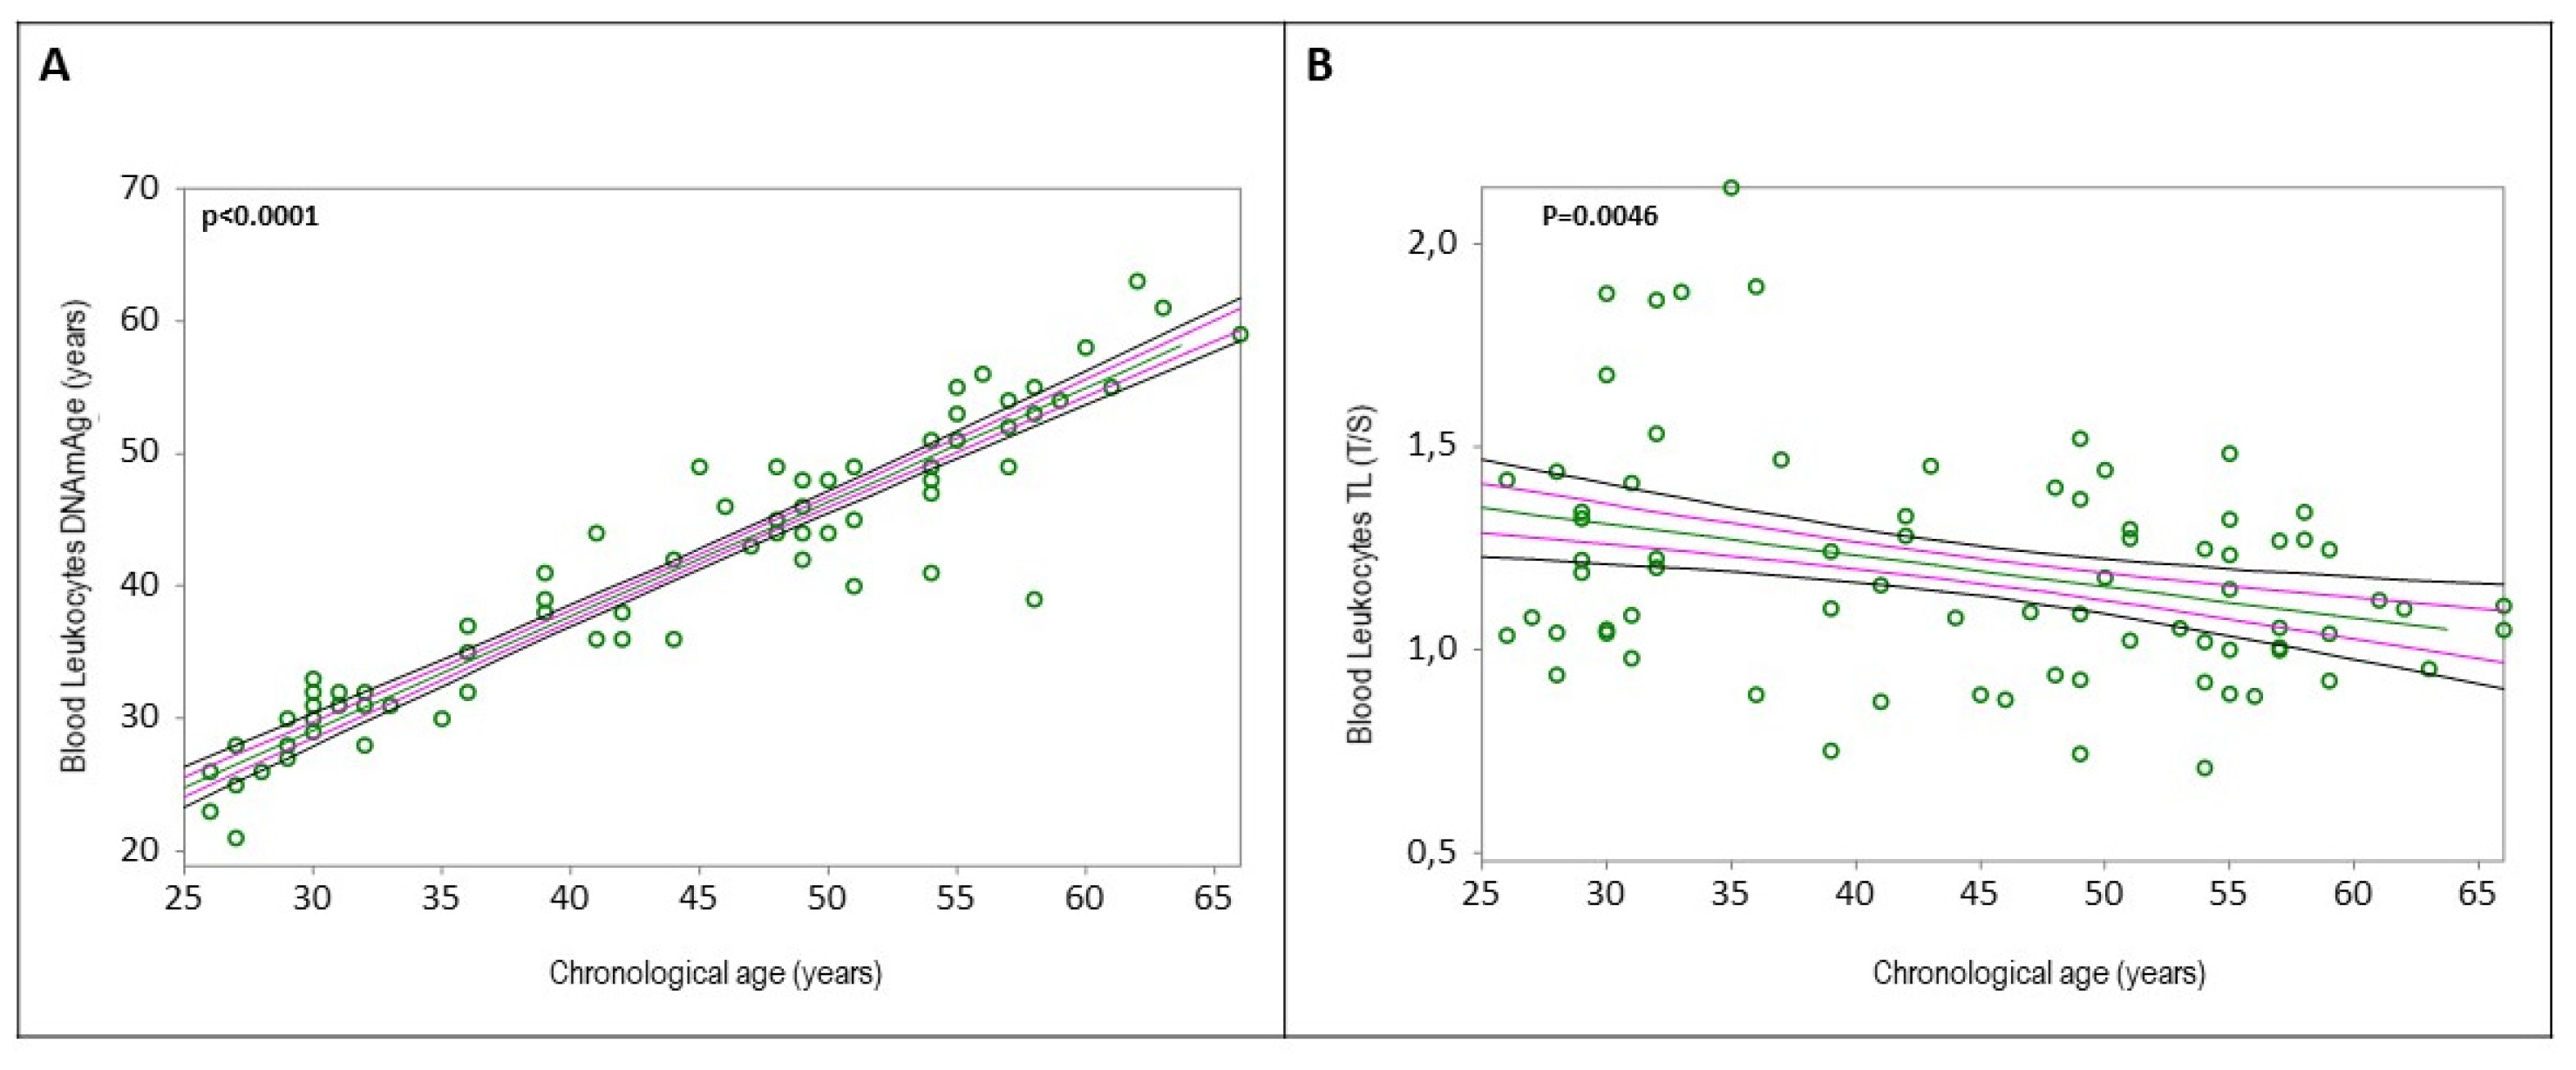
Figure 2.
Correlation curves between blood leukocytes TL (A) or DNAmAge (B) and duration of infection (days) in n = 76 HCWs COVID19 survivors. In (A), a simple linear regression plot shows the correlation between blood leukocyte TL and days of infection [correlation coefficient (r) = 0.0618; two-sided p = 0.596], while in (B), simple linear regression linear regression plot showing the correlation between blood leukocyte DNAmAge and days of infection [correlation coefficient (r) = 0.2378; two-sided p = 0.0386]. Mean, standard error (SE), and 95% coefficient intervals (CI) are represented as green, pink, and black lines, respectively.
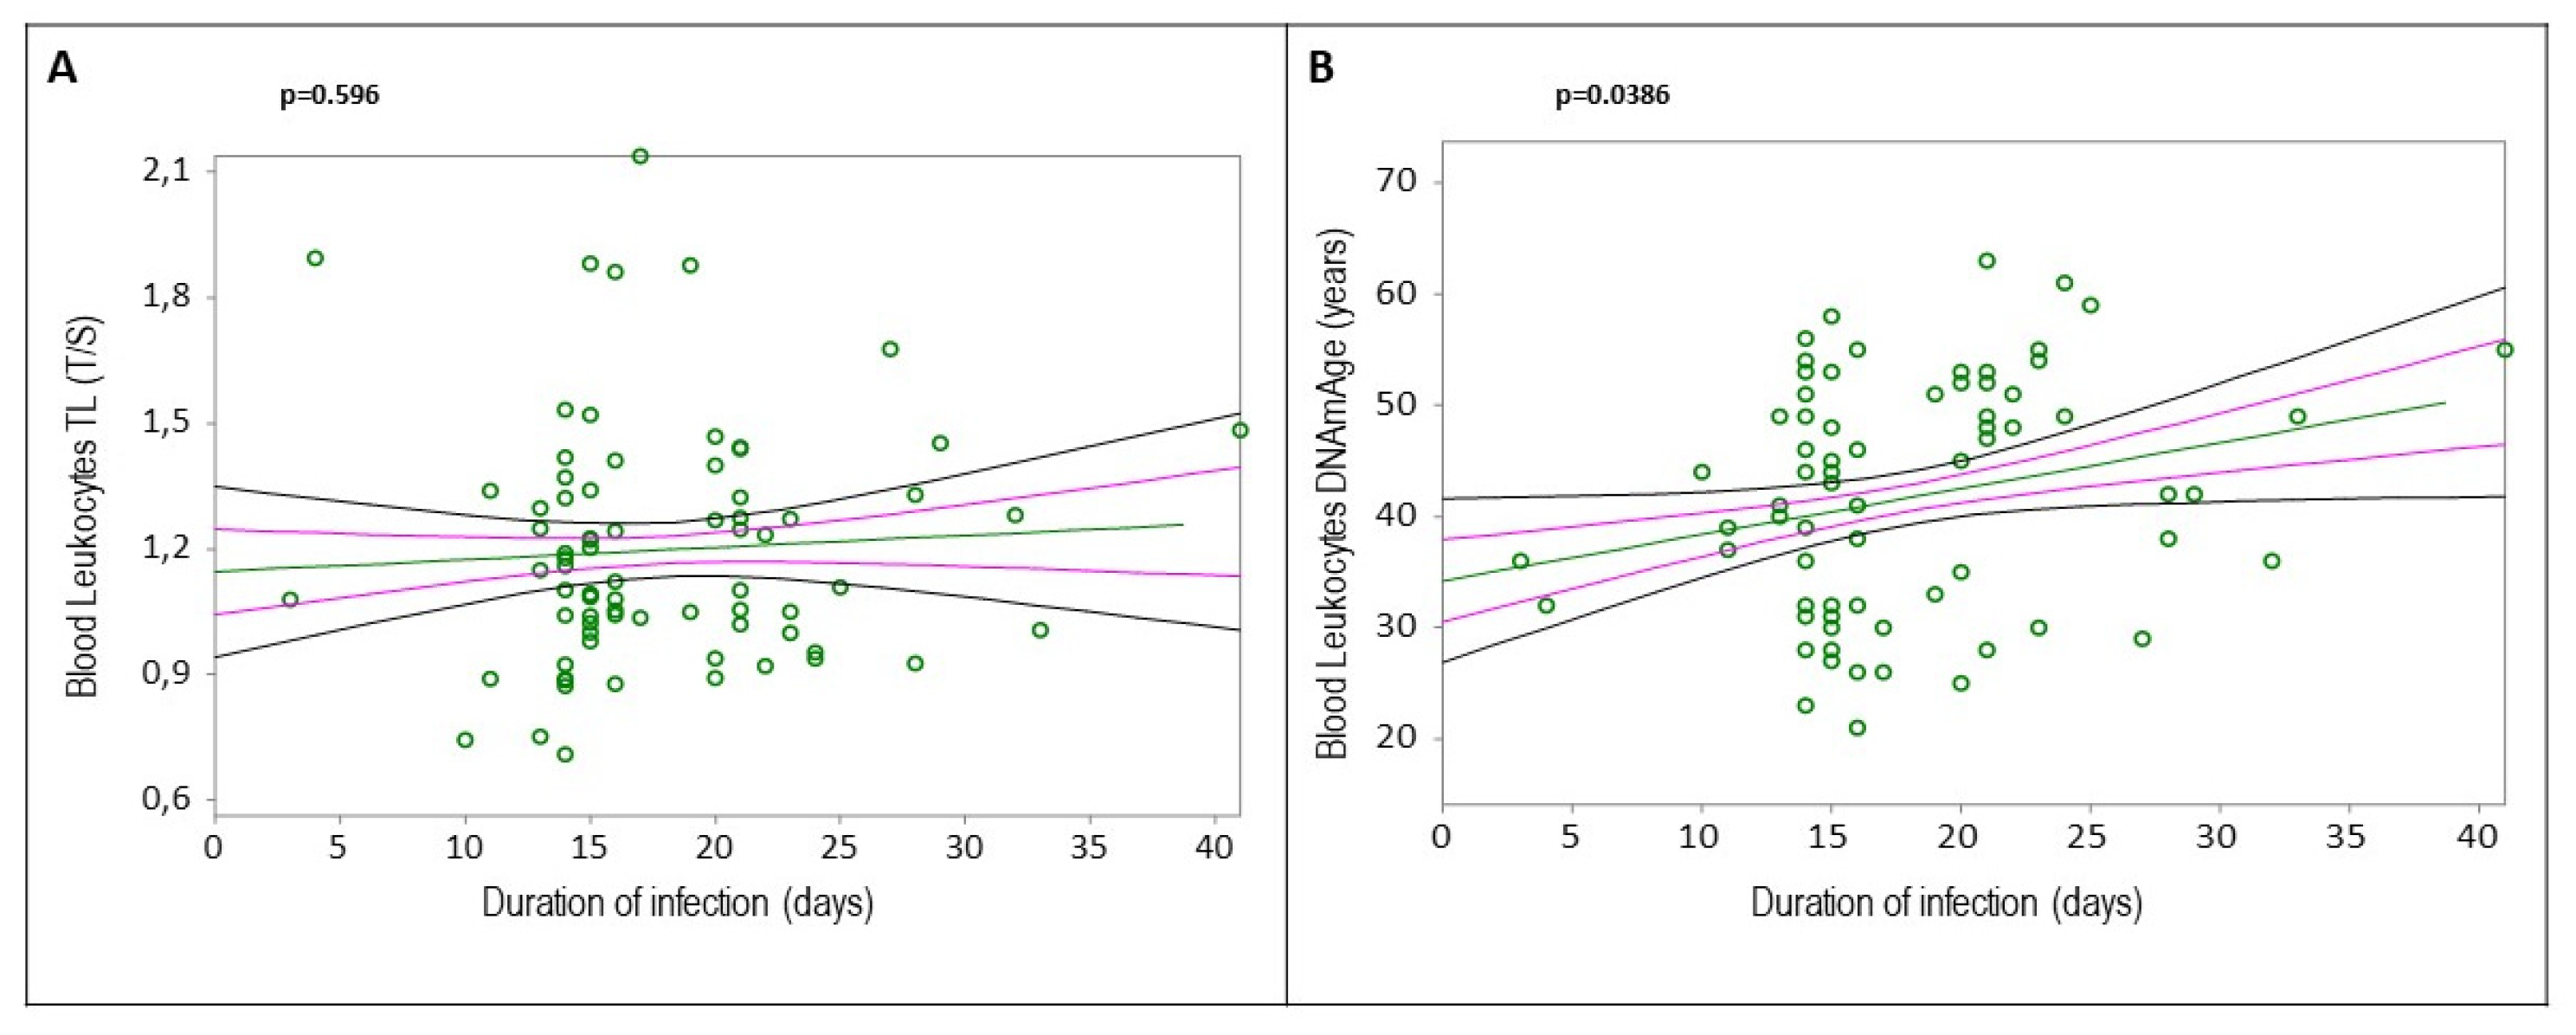
Figure 3.
Correlation curves between blood leukocytes DNAmAge (A) or TL (B) and work ability index (WAI) in n = 76 HCWs COVID19 survivors. In (A), a simple linear regression plot shows the correlation between blood leukocyte DNAmAge and WAI score [correlation coefficient (r) = 0.5169; two-sided p < 0.0001], while in (B), simple linear regression linear regression plot showing the correlation between blood leukocyte TL and WAI score [correlation coefficient (r) = 0.2828; two-sided p = 0.0194]. Mean, standard error (SE), and 95% coefficient intervals (CI) are represented as green, pink, and black lines, respectively. Table 1. Demographic and clinical characteristics of study population (n=76 HCWs).
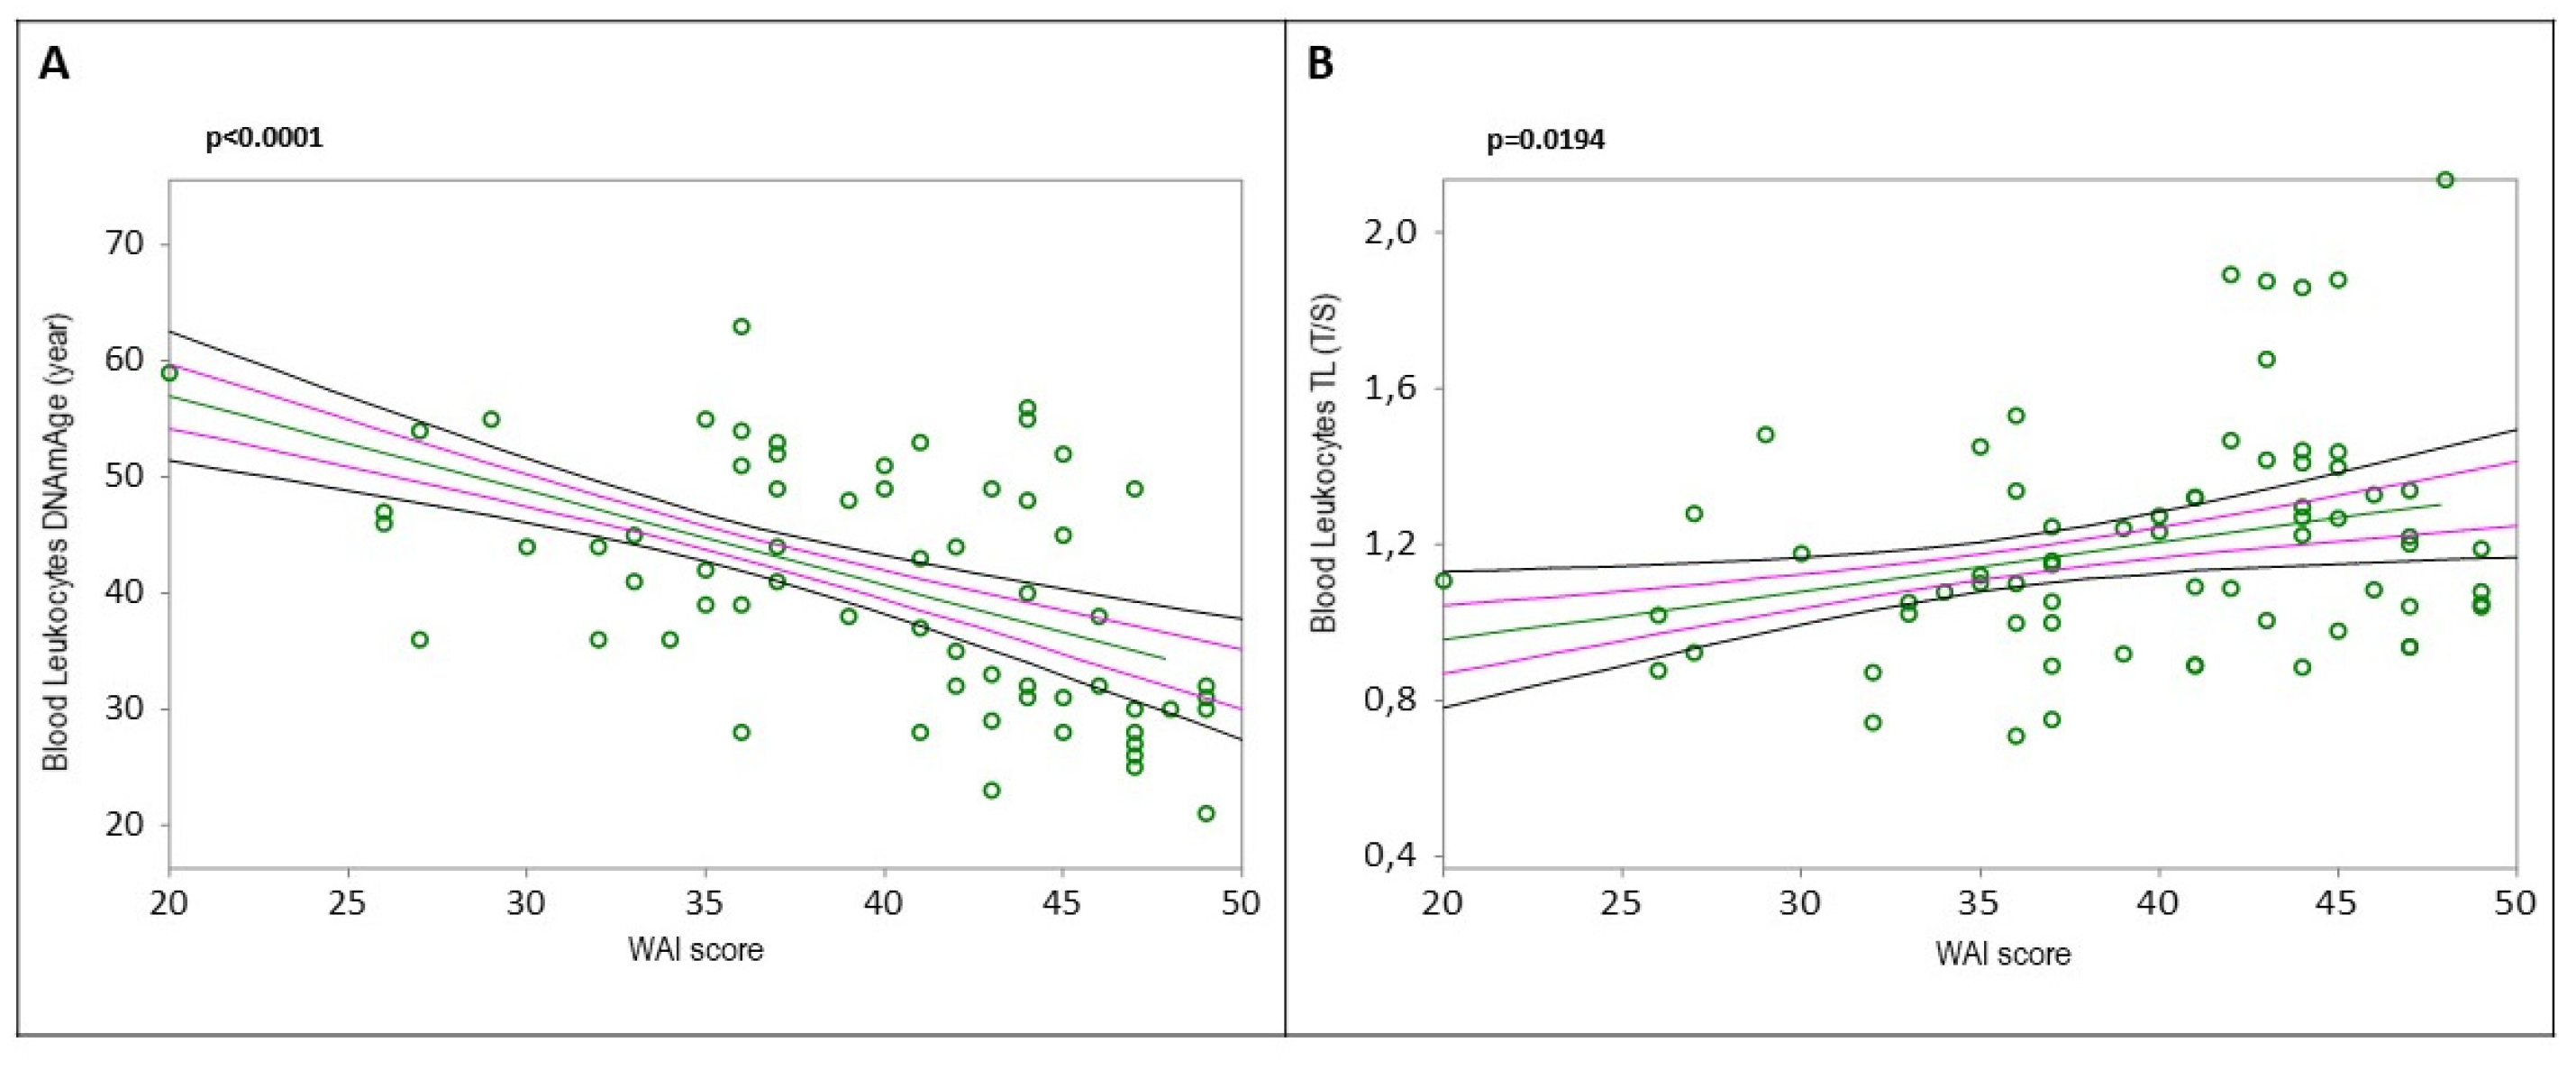
Figure 4.
DNAmAge and TL of blood leukocytes, NC and IS cells in the subgroup of n = 17 HCWs COVID19 survivors. In (A), box plots show levels of DNAmAge (years) in blood leukocytes, NC and IS cells in the subgroup of n = 17 HCWs COVID19 survivors from whom all three tissue samples were collected. In box plots, the boundary of the box closest to the x-axis indicates the 25th percentile, the line within the box marks the mean, and the boundary of the box farthest from the x-axis indicates the 75th percentile. Whiskers (error bars) above and below the box indicate the 95 and 5th percentiles. The horizontal bar with asterisks indicates the significant comparison between blood leukocytes and paired NC of the same subject (*Paired t-test: mean 43.4 ± 12.9 years vs. mean 37.6 ± 14.0 years; p = 0.0028), NC and paired IS cells of the same subject (*Paired t-test: mean 37.6 ± 14.0 years vs. mean 47.1 ± 12.4 years; p = 0.0003), and blood leukocytes and paired IS cells of the same subject (*Paired t-test: mean 43.4 ± 12.9 years vs. mean 47.1 ± 12.4 years; p = 0.0011). In (B), box plots show levels of TL in blood leukocytes and paired IS cells of n = 17 HCWs COVID19 survivors. In box plots, the boundary of the box closest to the x-axis indicates the 25th percentile, the line within the box marks the mean, and the boundary of the box farthest from the x-axis indicates the 75th percentile. Whiskers (error bars) above and below the box indicate the 95th and 5th percentiles. The horizontal bar with an asterisk indicates the significant comparison between in blood leukocytes and paired IS cells TL of the same patient (*Paired t-test (n = 7): mean 1.15 ± 0.32 T/S vs. mean 0.88 ± 0.43 T/S; p = 0.05].
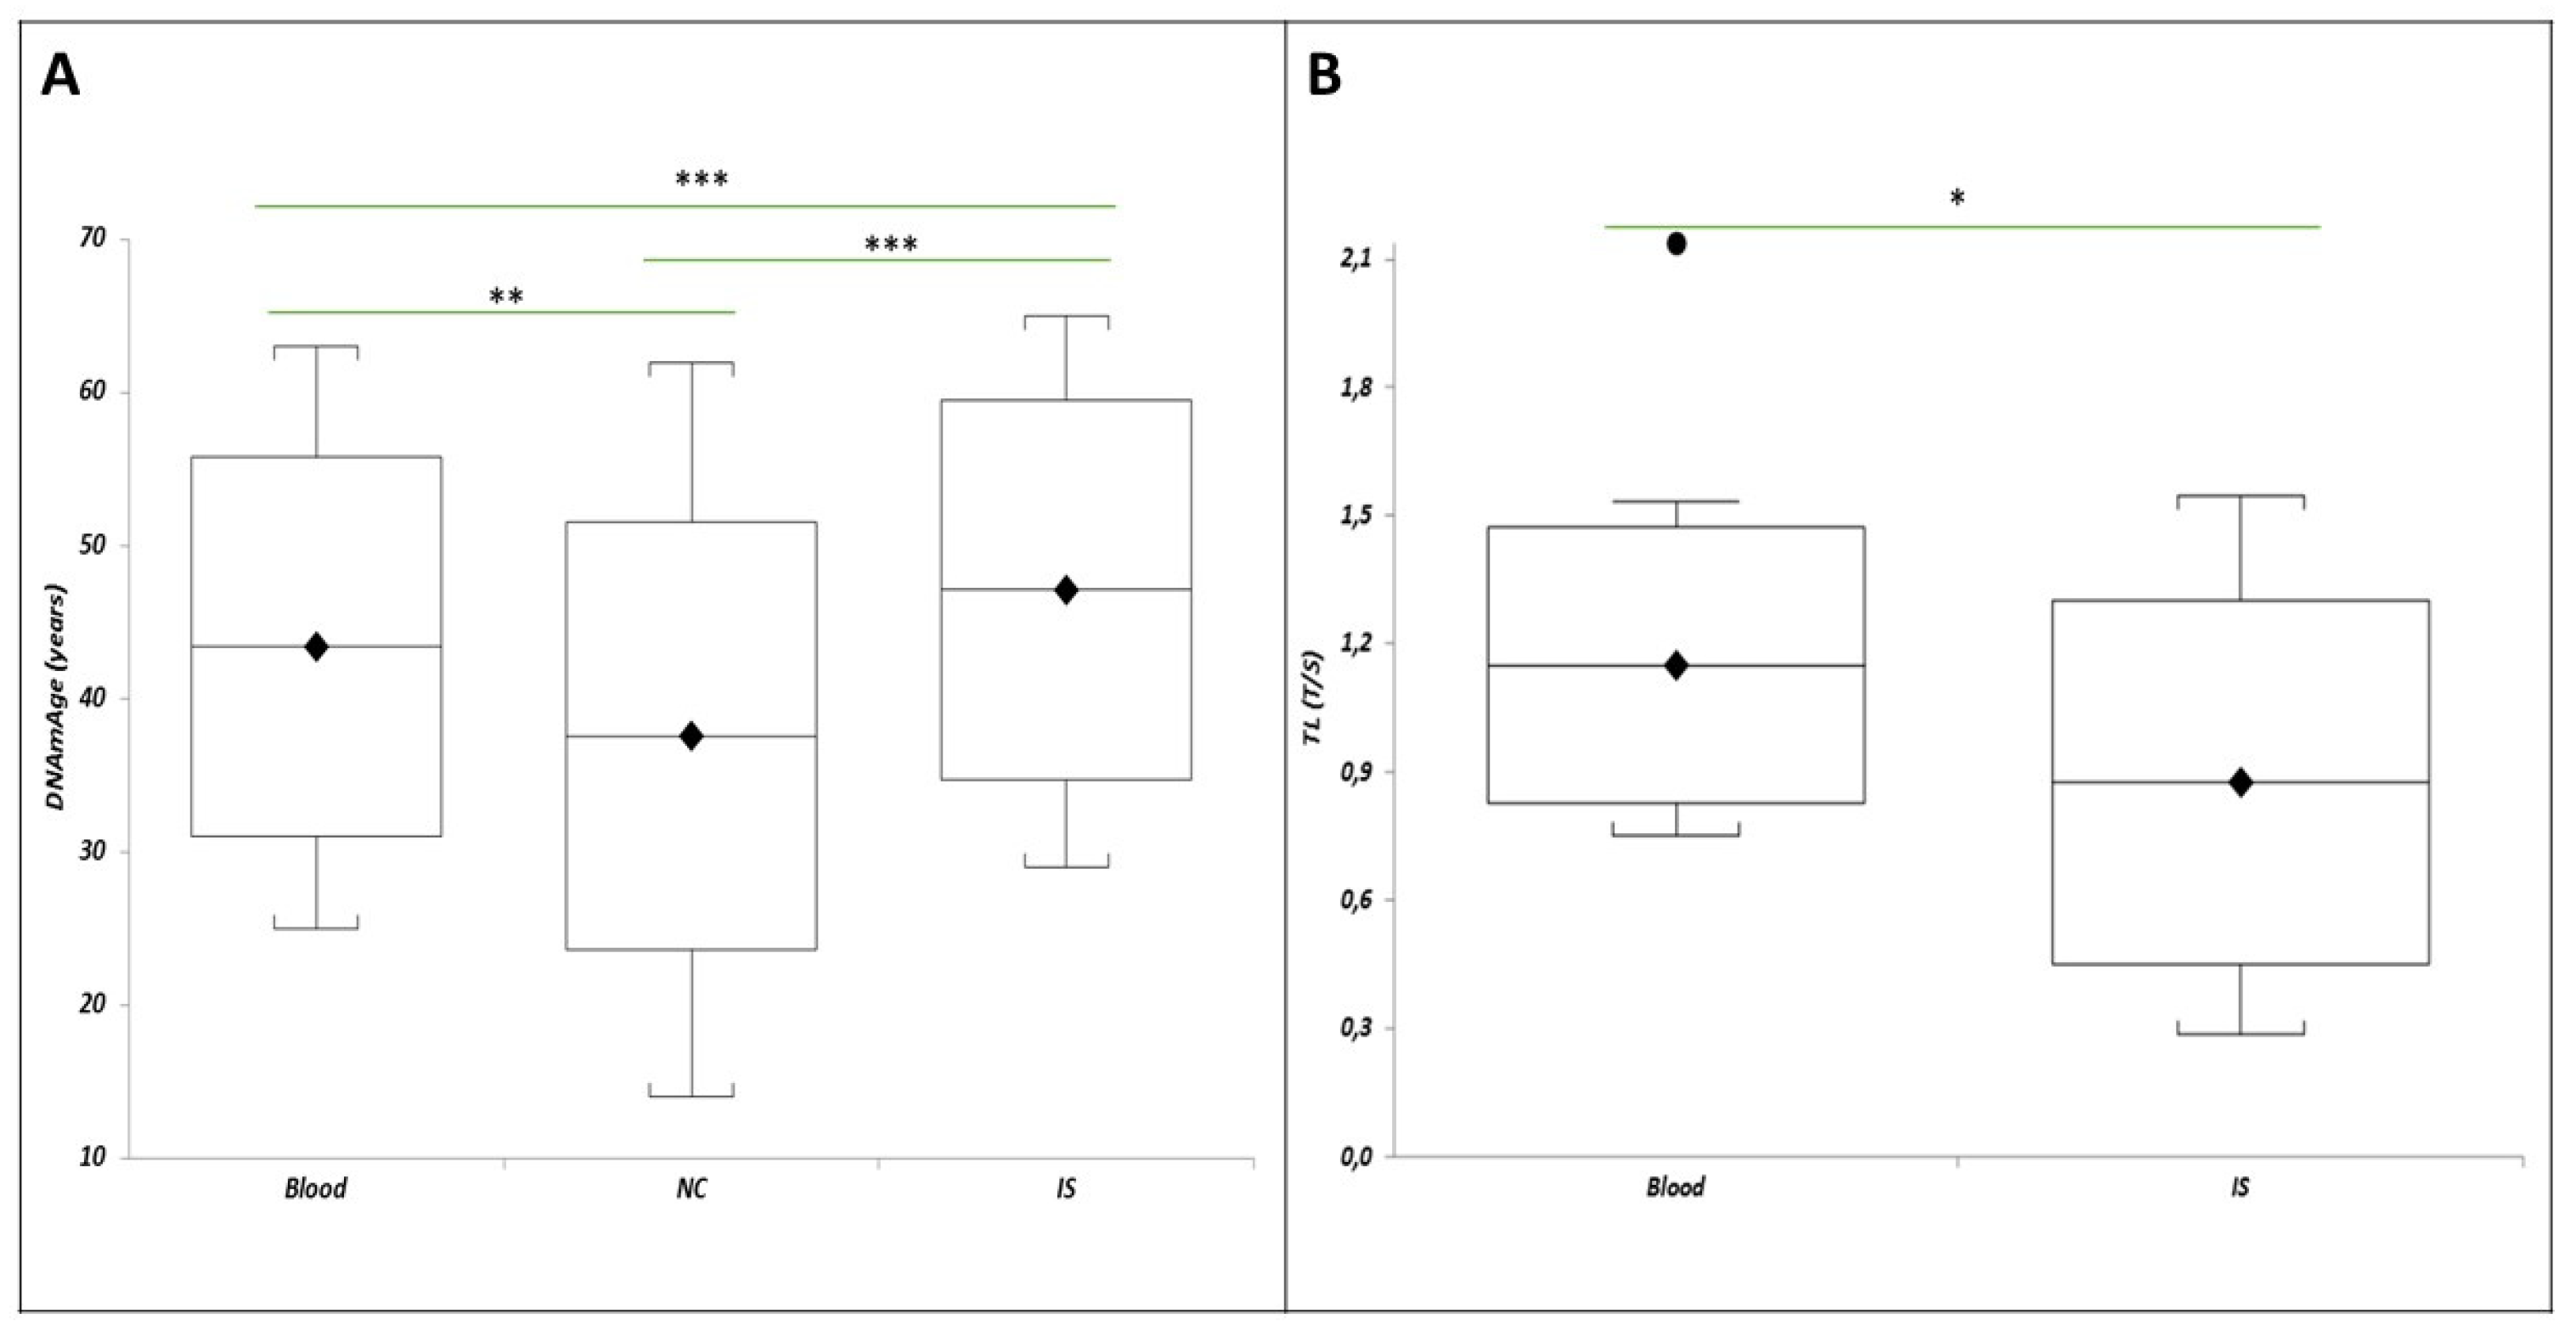

Table 3.
Prevalence of symptoms (Post Covid Syndrome - PCS), in the HCWs cohort (n=76) divided by gender and period since infection.
Table 3.
Prevalence of symptoms (Post Covid Syndrome - PCS), in the HCWs cohort (n=76) divided by gender and period since infection.
| PCS>12 weeks | PCS~1 year | P_Trend | |
|---|---|---|---|
| HCWs | 0.4605 | 0.3026 | 0.0663 |
| Women | 0.5741 | 0.3333 | 0.0204 |
| Men | 0.1818 | 0.2273 | 0.9999 |
| P_Trend | 0.0043 | 0.5238 |
Table 4.
Absolute and percentage distribution of COVID-19 symptoms reported by the HCWs up to 4 weeks, from 4 to 12 weeks, over 12 weeks after diagnosis, and at the time of the visit (1-year follow-up) (n=76 HCWs).
Table 4.
Absolute and percentage distribution of COVID-19 symptoms reported by the HCWs up to 4 weeks, from 4 to 12 weeks, over 12 weeks after diagnosis, and at the time of the visit (1-year follow-up) (n=76 HCWs).
| Symptoms | Up to 4 weeks after diagnosis n, (%) |
From 4 to 12 weeks after diagnosis n , (%) |
Over 12 weeks after diagnosis n, (%) |
P Chi2 | 1-year follow-up | P Chi2 | |
|---|---|---|---|---|---|---|---|
| General symptoms | |||||||
| Asthenia | 46 (60.53) | 34 (44.74) | 19 (25.00) | <0.0001 | 12 (15.79) | <0.0001 | |
| Fever | 46 (60.53) | 1 (1.32) | 0 (0.00) | <0.0001 | 0 (0.00) | Na | |
| Pain | 20 (26.32) | 8 (10.53) | 6 (7.89) | 0.0026 | 6 (7.89) | 0.0013 | |
| Respiratory symptoms | |||||||
| Dyspnoea | 11 (14.47) | 7 (9.21) | 7 (9.21) | 0.4873 | 5 (6.58) | 0.4217 | |
| Cough | 36 (47.37) | 7 (9.21) | 4 (5.26) | <0.0001 | 2 (2.63) | <0.0001 | |
| Rhinitis | 2 (2.63) | 1 (1.32) | 0 (0.00) | Na | 0 (0.00) | Na | |
| Cardiovascular symptoms | |||||||
| Chest pain | 8 (10.53) | 1 (1.32) | 1 (1.32) | 0.0059 | 0 (0.00) | Na | |
| Thoracic oppression | 14 (18.12) | 5 (6.58) | 2 (2.63) | 0.0022 | 0 (0.00) | Na | |
| Palpitations | 11 (14.47) | 7 (9.21) | 6 (7.89) | 0.3761 | 3 (3.95) | 0.1495 | |
| Neurological symptoms | |||||||
| Brain fog | 10 (13.16) | 7 (9.21) | 3 (3.95) | 0.1316 | 2 (2.63) | 0.0453 | |
| Headache | 37 (48.78) | 10 (13.16) | 5 (6.58) | <0.0001 | 3 (3.95) | <0.0001 | |
| Delirium | 2 (2.63) | 0 (0.00) | 0 (0.00) | Na | 0 (0.00) | Na | |
| Sleep disorders | 20 (26.32) | 11 (14.47) | 10 (13.16) | 0.0668 | 8 (10.53) | 0.0412 | |
| Peripheral neuropathies | 4 (5.26) | 4 (5.26) | 3 (3.95) | 0.9089 | 3 (3.95) | 0.9601 | |
| Loss of concentration | 14 (18.42) | 13 (17.11) | 11 (14.47) | 0.8017 | 9 (11.84) | 0.6858 | |
| Memory problems | 11 (14.47) | 14 (18.42) | 13 (17.11) | 0.8017 | 11 (14.47) | 0.8833 | |
| Dizziness | 5 (6.58) | 0 (0.00) | 0 (0.00) | 0.0056 | 0 (0.00) | Na | |
| Hypersomnia | 2 (2.63) | 0 (0.00) | 0 (0.00) | Na | 0 (0.00) | Na | |
| Gastrointestinal symptoms | |||||||
| Diarrhoea | 18 (23.68) | 1 (1.32) | 1 (1.32) | 0.0059 | 1 (1.32) | <0.0001 | |
| Abdominal pain | 5 (6.58) | 0 (0.00) | 0 (0.00) | 0.006 | 0 (0.00) | Na | |
| Nausea | 9 (11.84) | 0 (0.00) | 0 (0.00) | <0.0001 | 0 (0.00) | Na | |
| Anorexia | 16 (21.05) | 0 (0.00) | 0 (0.00) | <0.0001 | 0 (0.00) | Na | |
| Vomiting | 2 (2.63) | 0 (0.00) | 0 (0.00) | Na | 0 (0.00) | Na | |
| Other | 2 (2.63) | 0 (0.00) | 0 (0.00) | Na | 0 (0.00) | Na | |
| Musculoskeletal symptoms | |||||||
| Joint pain | 39 (51.32) | 15 (19.74) | 13 (17.11) | <0.0001 | 8 (10.53) | <0.0001 | |
| Muscle pain | 37 (48.68) | 17 (22.37) | 8 (10.53) | <0.0001 | 6 (7.89) | <0.0001 | |
| Psychological or psychiatric symptoms | |||||||
| Anxiety | 11 (14.47) | 9 (11.84) | 7 (9.21) | 0.6040 | 5 (6.58) | 0.4245 | |
| Depression | 7 (9.21) | 5 (6.58) | 4 (5.26) | 0.6247 | 0 (0.00) | Na | |
| Other | 1 (1.32) | 0 (0.00) | 0 (0.00) | Na | 0 (0.00) | Na | |
| Otorhinolaryngological symptoms | |||||||
| Ageusia | 40 (52.63) | 10 (13.16) | 3 (3.95) | <0.0001 | 2 (2.63) | <0.0001 | |
| Anosmia | 41 (53.95) | 12 (15.79) | 4 (5.26) | <0.0001 | 2 (2.63) | <0.0001 | |
| Sore throat | 8 (10.53) | 1 (1.32) | 1 (1.32) | 0.0059 | 0 (0.00) | Na | |
| Otalgia | 1 (1.32) | 0 (0.00) | 0 (0.00) | 0.3663 | 0 (0.00) | Na | |
| Dermatological signs | 3 (3.95) | 2 (2.63) | 3 (3.95) | 0.8785 | 2 (2.63) | 0.9374 | |
| Ocular symptoms | 11 (14.47) | 5 (6.58) | 4 (5.26) | 0.0947 | 2 (2.63) | 0.0318 | |
| Other | 10 (13.16) | 5 (6.58) | 4 (5.26) | 0.1687 | 3 (3.95) | 0.1280 | |
Abbreviations: NA= not available.
Table 5.
Mean values and standard deviations of blood leukocytes DNAmAge, AgeAcc, and TL of all n=76 HCWs.
Table 5.
Mean values and standard deviations of blood leukocytes DNAmAge, AgeAcc, and TL of all n=76 HCWs.
| Age | Blood leukocytes DNAmAge (years) | Blood leukocytes AgeAcc (years) | Blood leukocytes TL (T/S) | |
| Mean± SD | 46.00±12.88 | -2.59±3.47 | 1.12±4.37 | 1.20±0.06 |
Abbreviations: DNAmAge= DNA methylation Age; AgeAcc= Age acceleration; TL= telomere length.
Table 1.
Demographic and clinical characteristics of study population (n=76 HCWs).
| Variable | Mean±SD | N subjects | % |
|---|---|---|---|
| Age [years] | 44.64±11.75 | ||
| Gender [n (%)] | |||
| M | 22 | 28.95 | |
| F | 54 | 71.05 | |
| Marital status [n (%)] | |||
| Not married | 31 | 40.79 | |
| Married | 40 | 52.63 | |
| Divorced | 5 | 6.58 | |
| Widower | 0 | 0.00 | |
| Years of education [years] | 16.67±5.57 | ||
| BMI [Kg/m2] | 24.48±4.01 | ||
| Systolic blood pressure [mmHg] | 123.55±13.74 | ||
| Diastolic blood pressure [mmHg] | 77.43±10.55 | ||
| EMPLOYMENT ANAMNESIS | |||
| Professional position: [n (%)] | |||
| Healthcare assistant | 19 | 25.00 | |
| Nurse | 30 | 39.47 | |
| Doctor | 19 | 25.00 | |
| Resident | 0 | 0.00 | |
| Other | 8 | 10.53 | |
| Total years of work [years] | 19.74±12.65 | ||
| Years of work in the current job [years] | 9.78±9.23 | ||
| Performance of night shifts [n (%)] | 43 | 56.58 | |
| Frequency of night shifts/month | |||
| 0 | 33 | 43.42 | |
| From 1 to 4 | 13 | 17.11 | |
| >5 | 30 | 39.47 | |
| Work ability - WAI (n=68) [n (%)] | |||
| Poor (7-27) | 5 | 7.35 | |
| Moderate (28-36) | 15 | 22.06 | |
| Good (37-43) | 5 | 33.82 | |
| Excellent (44-49) | 25 | 36.76 | |
| PHYSIOLOGICAL ANAMNESIS AND LIFESTYLE | |||
| Chronic diseases [n (%)] | |||
| 0 | 28 | 36.84 | |
| 1 | 16 | 21.05 | |
| ≥2 | 32 | 42.11 | |
| Tobacco habit [n (%)] | |||
| Smoker | 10 | 13.16 | |
| Ex-smoker | 13 | 17.11 | |
| Non-smoker | 53 | 69.74 | |
| Pack/years [(cigarettes/20) per years of smoking] | 1.63±4.26 | ||
| Alcohol consumption [n (%)] | 56 | 73.68 | |
| Alcohol consumption [u.a./die] | 106.89±155.76 | ||
| Binge drinking habit [n (%)] | 1 | 1.32 | |
| Meals with grilled meat or pizza cooked in a wood-fired oven/year [n of meals/year] | 80.63±59.72 | ||
| Frequency of fruit meals/day [n (%)] | |||
| <2 | 39 | 51.32 | |
| >2 | 37 | 48.68 | |
| Frequency of vegetable meals/day [n (%)] | |||
| <2 | 32 | 42.11 | |
| >2 | 44 | 57.89 | |
| IPAQ score (n=69) [n (%)] | |||
| <700 | 11 | 15.94 | |
| ≥700; ≤ 2519 | 20 | 28.99 | |
| >2520 | 38 | 55.07 | |
| Indoor pollution* | |||
| 0 | 52 | 68.42 | |
| 1 | 19 | 25.00 | |
| 2 | 5 | 6.58 | |
| 3 | 0 | 0.00 | |
| Living area [n (%)] | |||
| Urban/ peripheral area | 50 | 65.79 | |
| Rural area | 26 | 34.21 | |
| Traffic in the living area [n (%)] | |||
| Continuous intense for a good part of the day | 23 | 30.26 | |
| Intermittent intense | 30 | 39.47 | |
| Scarce or absent | 23 | 30.26 | |
| BASIC BIOCHEMISTRY PARAMETERS | |||
| Leukocytes (103/ml) | 6.19±1.59 | ||
| Blood red cells (103/ml) | 4.70±0.43 | ||
| Platelet count (103/ml) | 267.08±57.13 | ||
| Neutrophils (103/ml) | 3.41±1.18 | ||
| Lymphocytes (103/ml) | 2.17±0.58 | ||
| Monocytes (103/ml) | 0.51±0.13 | ||
| Eosinophils (103/ml) | 0.27±0.97 | ||
| Basophils (103/ml) | 0.03±0.03 | ||
| Hemoglobin (g/dl) | 138.18±13.79 | ||
| Glycemia (mg/dl) | 92.12±14.31 | ||
| Cholesterol (mg/dl) | 194.00±14.27 | ||
| Triglycerides (mg/dl) | 93.11±42.18 | ||
| HDL (mg/dl) | 59.85±15.58 | ||
| LDL (mg/dl) | 123.04±30.74 | ||
| Creatinine (mg/dl) | 1.49±6.26 | ||
| Bilirubin (umol/L) | 9.60±10.58 | ||
| LIVER FUNCTION | |||
| AST/GOT (U/L) | 23.23±6.85 | ||
| ALT/GPT (U/L) | 21.8±12.73 | ||
| GGT (U/L) | 9.60±10.58 | ||
| INFLAMMATION | |||
| PCR (mg/L) | 5.19±3.23 | ||
| LUNG FUNCTION | |||
| FEV1 (L) | 3.30±0.88 | ||
| FEV1 (%) | 101.76±13.54 | ||
| FVC (L) | 4.10±0.92 | ||
| FVC (%) | 95.56±12.68 | ||
| FEV1/VC (%) | 0.82±0.06 | ||
| TLC (L) | 5.55±1.26 | ||
| TLC (%) | 96.47±15.70 | ||
| RV (L) | 1.59±0.40 | ||
| RV (%) | 107.36±23.43 | ||
| HEART RATE | |||
| Mean HR | 68.05±9.71 | ||
| HEART RATE VARIABILITY | |||
| nLF: 0.04 - 0.15 Hz | 52.38±18.20 | ||
| nHF: 0.15 - 0.40 Hz | 47.31±18.41 | ||
| LF/HF ratio | 1.54±1.30 | ||
| SDNN | 35.16±25.45 | ||
| RMSSD | 36.89±34.19 |
*Sum of three variables: presence of a pellet or wood stove in the home used more than five times a year, extra-occupational exposure to Polycyclic Aromatic Hydrocarbons (PAH) and exposure to passive tobacco smoke. Abbreviations: ALT= Alanine Aminotransferase; AST= Aspartate Aminotransferase; BMI= Body mass index ; FEV1= Forced Expiratory Volume in the 1st second; FVC= Forced vital capacity; GGT= Gamma glutamyl transferase; HCWs= Health Care Workers; HDL= High-density lipoproteins; HR= Heart rate; IPAQ= International Physical Activity Questionnaires; LDL= Low-density lipoproteins; nHF= normalized high frequency; nLF= normalized low frequency; PCR= C-reactive protein; RMSSD= Root mean square of successive RR interval differences; RV= Residual volume; SDNN= Standard deviation of normal-to-normal R-R intervals; TLC= Total lung capacity; WAI= Work ability index.
Table 6.
Multiple regression analysis of the influence of age, gender, presence of chronic diseases, decline in lung function (FEV1) and lymphopenia on blood leukocytes DNAmAge / LTL.
Table 6.
Multiple regression analysis of the influence of age, gender, presence of chronic diseases, decline in lung function (FEV1) and lymphopenia on blood leukocytes DNAmAge / LTL.
| Blood Leukocytes DNAmAge (years) | b | r | t value | P | |
| Age | b1 = 0.74399 | r = 0.911647 | t = 17.884209 | <0.0001 | |
| Gender (male) | b2 = 2.703646 | r = 0.298937 | t = 2.525593 | 0.014 | |
| Chronic diseases (0=no; 1=yes) | b3 = 1.860584 | r = 0.266824 | t = 2.23213 | 0.0291 | |
| FEV1 (L) | b4 = -2.219589 | r = -0.382602 | t = -3.338666 | 0.0014 | |
| Lymphocytes (109/L) | b5 = -2.017434 | r = -0.36957 | t = -3.206587 | 0.0021 | |
| Blood Leukocytes TL (T/S) | Age | b1 = -0.011446 | r = -0.363521 | t = -3.146031 | 0.0025 |
| Gender (male) | b2 = 0.004352 | r = 0.005765 | t = 0.046482 | 0.9631 | |
| Chronic diseases (0=no; 1=yes) | b3 = 0.131573 | r = 0.218459 | t = 1.804868 | 0.0757 | |
| FEV1 (L) | b4 = -0.023505 | r = -0.05008 | t = -0.404266 | 0.6873 | |
| Lymphocytes (109/L) | b5 = 0.120086 | r = 0.261295 | t = 2.182445 | 0.0327 |
Abbreviations: DNAmAge= DNA methylation Age; FEV1= Forced Expiratory Volume in the 1st second; LTL= leukocyte telomere length.
Table 7.
Multiple regression analysis of the influence of occupation or professional position, night shift work and work ability index (WAI) on blood leukocytes DNAmAge / TL.
Table 7.
Multiple regression analysis of the influence of occupation or professional position, night shift work and work ability index (WAI) on blood leukocytes DNAmAge / TL.
| Blood Leukocytes DNAmAge (years) | b | r | t value | P | |
| Occupation (0=HA; 1=N; 2=D; 3=R; 4=T and A) | b1 = -0.727891 | r = -0.097697 | t = -0.785337 | 0.4352 | |
| Night shift work (0=no; 1=yes) | b2 = -5.367146 | r = -0.263551 | t = -2.185686 | 0.0325 | |
| WAI | b3 = -0.617807 | r = -0.382432 | t = -3.311157 | 0.0015 | |
| Blood Leukocytes TL (T/S) | Occupation (0=HA; 1=N; 2=D; 3=R; 4=T and A) | b1 = 0.064564 | r = 0.268124 | t = 2.226516 | 0.0295 |
| Night shift work (0=no; 1=yes) | b2 = 0.102616 | r = 0.164683 | t = 1.3357 | 0.1864 | |
| WAI | b3 = 0.007125 | r = 0.150818 | t = 1.220504 | 0.2268 |
Abbreviations: HA=healthcare assistants, N=nurses, D=doctors, R=residents, T and A=technicians and administrators.
Table 8.
Multiple regression analysis of the influence of haemoglobin (g/dL), glycaemia (mg/dL), cholesterol (mg/dL), triglycerides (mg/dL), HDL (mg/dL), LDL (mg/dL), creatinine (mg/dL) and bilirubin (mg/dL) on blood leukocytes DNAmAge / TL.
Table 8.
Multiple regression analysis of the influence of haemoglobin (g/dL), glycaemia (mg/dL), cholesterol (mg/dL), triglycerides (mg/dL), HDL (mg/dL), LDL (mg/dL), creatinine (mg/dL) and bilirubin (mg/dL) on blood leukocytes DNAmAge / TL.
| Blood Leukocytes DNAmAge (years) | b | r | t value | P | |
| haemoglobin (g/dL) | b1 = -0.205578 | r = -0.300885 | t = -2.484288 | 0.0157 | |
| glycaemia (mg/dL) | b2 = 0.2006 | r = 0.329513 | t = 2.748063 | 0.0078 | |
| cholesterol (mg/dL) | b3 = 0.006919 | r = 0.022835 | t = 0.179853 | 0.8579 | |
| triglycerides (mg/dL) | b4 = 0.003211 | r = 0.01292 | t = 0.101744 | 0.9193 | |
| HDL (mg/dL) | b5 = 0.063761 | r = 0.098495 | t = 0.779342 | 0.4387 | |
| LDL (mg/dL) | b6 = 0.172631 | r = 0.388744 | t = 3.322289 | 0.0015 | |
| creatinine (mg/dL) | b7 = 0.267526 | r = 0.205048 | t = 1.649598 | 0.1041 | |
| bilirubin (mg/dL) | b8 = 0.022068 | r = 0.028541 | t = 0.224826 | 0.8229 | |
| Blood Leukocytes TL (T/S) | haemoglobin (g/dL) | b1 = 0.003138 | r = 0.141452 | t = 1.125107 | 0.2649 |
| glycaemia (mg/dL) | b2 = -0.00175 | r = -0.089968 | t = -0.711294 | 0.4796 | |
| cholesterol (mg/dL) | b3 = -0.000016 | r = -0.001611 | t = -0.012687 | 0.9899 | |
| triglycerides (mg/dL) | b4 = 0.001514 | r = 0.177891 | t = 1.42342 | 0.1596 | |
| HDL (mg/dL) | b5 = -0.000176 | r = -0.008083 | t = -0.06365 | 0.9495 | |
| LDL (mg/dL) | b6 = -0.003492 | r = -0.245463 | t = -1.993777 | 0.0506 | |
| creatinine (mg/dL) | b7 = -0.0017 | r = -0.039478 | t = -0.311094 | 0.7568 | |
| bilirubin (mg/dL) | b8 = -0.000485 | r = -0.018608 | t = -0.146549 | 0.884 |
Abbreviations: HDL=high density lipoprotein, LDL=low density lipoprotein.
Table 9.
Multiple regression analysis of the influence of mean HR, HRV parameters (i.e., SDNN, RMSSD), and drugs affecting HRV (i.e., antidepressants, beta-blockers, calcium channel blockers, inhaled or oral beta-mimetics, theophylline, and alpha-adrenergic agonists) on blood leukocytes DNAmAge / TL.
| Blood Leukocytes DNAmAge (years) | b | r | t value | P | |
| SDNN | b1 = -0.311272 | r = -0.186422 | t = -1.564708 | 0.1223 | |
| RMSSD | b2 = 0.14605 | r = 0.114644 | t = 0.95165 | 0.3446 | |
| Mean HR | b3 = -0.403812 | r = -0.356467 | t = -3.14618 | 0.0025 | |
| Drugs affecting HRV (0=no; 1=yes) | b4 = 8.905208 | r = 0.297306 | t = 2.567761 | 0.0124 | |
| Blood Leukocytes TL (T/S) | SDNN | b1 = 0.008358 | r = 0.166005 | t = 1.388176 | 0.1696 |
| MSSD | b2 = -0.006522 | r = -0.167858 | t = -1.404117 | 0.1648 | |
| Mean HR | b3 = 0.005025 | r = 0.154982 | t = 1.293644 | 0.2002 | |
| Drugs affecting HRV (0=no; 1=yes) | b4 = 0.154968 | r = 0.176234 | t = 1.476368 | 0.1445 |
Abbreviations: SDNN=standard deviation of normal-to-normal RR intervals, RMSSD= root mean square of successive RR interval differences, HR=heart rate.
Table 10.
AgeAcc and Predicted TL Post COVID-19 subjects and COPD patients.
| Post COVID-19 subjects | |||||
| N=17 | Age | Blood AgeAcc (years) | IS AgeAcc (years) | Predicted Blood TL (T/S) | Predicted IS TL (T/S) |
| Mean±SD | 46.00±12.88 | -2.59±3.47*§ | 1.12±4.37§ | 1.20±0.06*§ | 0.93±0.02§ |
| COPD patients | |||||
| N=7 | Age | Blood AgeAcc (years) | IS AgeAcc (years) | Predicted Blood TL (T/S) | Predicted IS TL (T/S) |
| Mean±SD | 72.43±6.00 | -10.29±3.50* | -4.29±5.15 | 1.31±0.03* | 0.97±0.01 |
Abbreviations: AgeAcc = Age acceleration; IS= Induced sputum cells; TL= Telomere Length. *Paired t test: Post COVID19 subjects. Blood AgeAcc versus IS AgeAcc (Two sided p=0.0011). Predicted Blood TL (T/S) vs Predicted IS TL (T/S) (Two sided p<0.0001). COPD patients. Blood AgeAcc versus IS AgeAcc (Two sided p=0.0006). Blood TL versus IS TL (Two sided p<0.0001). §Mann-Whitney U test: PostCOVID19 Blood AgeAcc versus COPD Blood AgeAcc (Two sided p=0.0002). PostCOVID19 IS AgeAcc versus COPD IS AgeAcc (Two sided p=0.012). PostCOVID19 Predicted Blood TL (T/S) vs COPD Predicted Blood TL (T/S) (Two sided p<0.0001). PostCOVID19 Predicted IS TL (T/S) vs COPD Predicted IS TL (T/S) (Two sided p<0.0001).
Table 2.
Data relating to the course of SARS-CoV-2 infection (n=76 HCWs).
| Variable | Mean±SD | N subjects | % |
| Duration of SARS-CoV-2 infection [days] | 17.81±6.03 | ||
| Diagnosis of SARS-CoV-2 pneumonia | |||
| Yes | 4 | 5.26 | |
| No | 72 | 94.74 | |
| Hospitalisation for COVID-19 [n (%)] | 5 | 6.58 | |
| Drug therapy during acute infection [n (%)] | |||
| Antibiotics | 14 | 18.42 | |
| Inhaled Corticosteroids | 2 | 2.63 | |
| Systemic Corticosteroids | 4 | 5.26 | |
| NSAID or paracetamol | 49 | 64.47 | |
| Hydroxychloroquine | 8 | 10.53 | |
| Tocilizumab | 1 | 1.32 | |
| Antiviral | 2 | 2.63 | |
| Anticoagulant | 3 | 3.95 | |
| Other | 7 | 9.21 | |
| None | 22 | 28.95 |
Abbreviations: NSAID= Non-steroidal anti-inflammatory drug.
Disclaimer/Publisher’s Note: The statements, opinions and data contained in all publications are solely those of the individual author(s) and contributor(s) and not of MDPI and/or the editor(s). MDPI and/or the editor(s) disclaim responsibility for any injury to people or property resulting from any ideas, methods, instructions or products referred to in the content. |
© 2024 by the authors. Licensee MDPI, Basel, Switzerland. This article is an open access article distributed under the terms and conditions of the Creative Commons Attribution (CC BY) license (http://creativecommons.org/licenses/by/4.0/).
Copyright: This open access article is published under a Creative Commons CC BY 4.0 license, which permit the free download, distribution, and reuse, provided that the author and preprint are cited in any reuse.


