
Submitted:
01 July 2024
Posted:
03 July 2024
You are already at the latest version
Abstract
The article evaluates the use of machine learning methods to predict valve plate failures in hydraulic pumps. To conduct this assessment, a laboratory setup was developed that allowed the creation of a training dataset containing both the normal operating state of the pump and the operating state with three different valve plate damages. Five different predictive models were evaluated, including three composite models based on decision trees: Random Forest, Gradient-Boosted Trees, and Rotation Forest, as well as the kNN algorithm and a neural network. The analysis showed that neural networks achieved the highest prediction accuracy, enabling a prediction accuracy level of 89%. The kNN algorithm ranked second, and tree-based algorithms performed 4% worse than the neural network. Additionally, the attribute importance analysis revealed that leak flow, pressure output together with output flow, are the most important parameters for accurate prediction.
Keywords:
piston pump
; machine learning
; failure prediction
; deep learning
; predictive maintenance
1. Introduction
Over the last few years, artificial intelligence or machine learning has been widely discussed in public opinion. However, for many years, attempts have been made to apply and implement machine learning models in many branches of industry. One of the tasks of this technology is predictive maintenance, i.e. monitoring and analysis of device and system parameters in order to early detect damage to system components and avoid failure [1].
Many industrial applications and systems are based on hydraulic solutions. Hydraulic components such as hydraulic motors and pumps are key elements of hydraulic systems in automotive, mining, metal processing or mobile machines [2]. Their reliable operation determines the stability of the production line and significantly affects the competitive advantage of companies. Important production processes often depend on the efficiency of the hydraulic system; hence, their good technical condition is crucial. Depending on the industry branch and the role a given device or system plays in the infrastructure, damage to a single component can cause serious problems, including significant economic losses. The relatively inexpensive device can have a huge impact on high economic loss when it breaks down. As an example, here one can give a pump damage in the hydraulic system of a long-wall shearer in a coal mine. The failure of a component worth several hundred euros caused an economic loss of one hundred thousand euros. That is why the ability to predict failures is so important.
One of the obstacles to large-scale implementation of machine learning methods in industry is the availability of a large amount of training data describing both failure states and normal operational states of the equipment. While collecting data from an operational system does not generally seem to be a difficult task, collecting data during system failures are practically impossible because companies strive to prevent failures from occurring. There are two solutions to this problem: one is the creation of digital twins [3,4], which through computer simulations allow the creation of any failure states, and the other is conducting experiments on actual equipment but in laboratory conditions.
This article describes the research and analysis of piston pump damage conducted in laboratory conditions. During the tests, simulations were carried out with the pump operating with a properly functioning valve plate as well as with three different levels of cavitation damage to the valve plate. The research involved replacing one of the components and conducting simulations under various operating conditions of the pump with load controlled by an electric motor managed via an inverter.
In the further part of the study, the collected data were transformed into a dataset suitable for evaluation by machine learning methods. Using this prepared data, a comparison was made of various predictive models including three different ensemble models based on trees: Random Forest [5], Gradient Boosted Trees [6], and Rotation Forest [7], the kNN algorithm [8], and a neural network [9].
The subsequent sections are organized as follows. The next section describes the current state of knowledge in the field of predicting hydraulic equipment failures, the following Section 4 provides a detailed description of laboratory tests on the pump and the method of constructing the dataset for the evaluation of machine learning models. Section 5 presents the results obtained along with the discussion of the performance of the models evaluated. It also includes analysis of the significance of individual attributes. The final section summarizes the conducted research and suggests directions for future work.
2. Related Work
The literature analysis shows that machine learning techniques are popular tools for failure prediction including a large family of methods. A good example of a neural network application particularly a convolutional neural network is described [10]. However, it is noted that classic machine-learning algorithms are dominant in this area. One can find examples of the use of a modified KNN algorithm, which in combination with the just-in-time learning rule (JITL) was used to determine the remaining useful life (RUL) [11]. This method was used for hydraulic pumps taking into account pressure measurements. Also, authors of [12] and [13] use term RUL in combination with Bayesian regularized radial basis function neural network (Trainbr-RBFNN) during research on external gear pump or modified auto-associative kernel regression (MAAKR) and monotonicity-constrained particle filtering (MCPF) approach when examining piston pump. Another application is based on the use of RBF neural networks combined with noise filtering algorithms and the use of vibrodiagnostics [12]. The literature review also includes comparisons of classic machine learning algorithms, including SVM, KNN, and gradient-boosted trees [14]. Another publication [15] describes the use of a method based on empirical wavelet transform (EWT), principal component analysis (PCA), and extreme learning machine (ELM) to analyze data from vibration sensors. Another approach is using a convolutional neural network presented in [16,17]. In these articles pressure, vibration, and acoustic signals were used as the input data for the prediction. The authors of [18] present a review of the recent literature touching ML-based condition monitoring systems. Among many authors draw attention to artificial neural networks (ANN), multilayer perceptron (MLP), or convolutional neural networks (CNN). Remaining useful life is also predicted in [19] where the Auto-Regressive Integrated Moving-Average (ARIMA) forecasting method is used. The research object was a piston pump for which leakage volume was considered a significant parameter for RUL prediction. Another proposal for the predictive maintenance model was presented in [20]. This paper is focused on a hybrid solution that combines Improved Complete Ensemble Empirical Mode Decomposition with Adaptive Noise (ICEEMDAN), Principal Component Analysis (PCA) and Least Squares Support Vector Machine (LSSVM). The model is optimised by the combination of Coupled Simulated Annealing and Nelder-Mead Simplex optimization algorithms (ICEEMDAN-PCA-LSSVM). The proposed technique is compared with three established methods [Linear Discriminant Analysis (LDA), Support Vector Machine (SVM), and Artificial Neural Network (ANN)] with multiclass classification capabilities. Authors of [21] describe deep learning methods where the Bayesian optimization (BO) algorithm is used to find the best hyperparameters of the model. In this paper vibration signal of the piston pump is used as a source of data. The CWT preprocesses the signal and then the preliminary CNN model is prepared. Finally, BO based on the Gaussian process was used to prepare an adaptive CNN model (CNN-BO). Another article [22] presenting research on axial piston pumps proposes a transfer learning method for fault severity recognition. The method is based on adversarial discriminative domain adaptation combined with a convolutional neural network (CNN). Similar to [21] there is also a vibration signal utilized as a data source for ML. In the paper [23], the authors do the research using a one-way analysis of variance ANOVA. This is another article in which the authors rely on the vibration signal and additional pressure on the output port of the pump. Pump wear classification methods used were: decision tree (DT), discriminant analysis (DA), KNN, naïve Bayesian classifiers, and SVM.
3. The Dataset
3.1. Data Collection Process
In order to obtain data used in the research, a model of a hydraulic power unit (HPU) was built. The model is based on a piston pump, as it is one of the most popular types of pumps used in industrial installations. In the first stage, a hydraulic diagram of the system was prepared, including appropriate measurement sensors. Diagram is shown on Figure 1. The built model allows to collect data both for correct operating and damaged condition pump. Detailed list of HPU model components is given in Table 1.
In hydraulic systems, pumps are most often used as a source of specific pressure to, for example, generate the required force using a hydraulic cylinder or torque using a hydraulic motor. For this reason, a forced pump load in the form of a given load torque was used when collecting training data. This, in turn, causes the pump to generate the appropriate pressure. There are structural losses between the cooperating pump components, causing internal oil leaks, especially when operating under pressure. This is a normal feature of these devices. Wear and tear or failure causes these leaks to become more severe. Hydraulic oil, which has a specific nominal kinematic viscosity according to ISO 3448, is usually used as the working medium. To be able to observe the operational wear of the pump or its failure state, the viscosity of the working medium plays an important role. The built system uses ISO VG46 oil, which means that it has a nominal kinematic viscosity of 46 mm2/s at a temperature of . Oil with this viscosity value is most often used in hydraulic systems. The viscosity of the oil strongly depends on its temperature, therefore the measured parameters were recorded while increasing the oil temperature. The temperature in the oil tank, and thus in the suction line, was increased from ambient temperature to approximately . Because the data were collected in different months of the year, starting ambient temperature ranges from around up to . The built system enables the registration of many parameters, but for the purposes of failure prediction research, seven of them were selected based on expert knowledge and the technical specificity of the pump design.
The data collected during the tests show the correct and damaged condition (worn valve plate) of the piston pump. The test HPU built for the research uses a pump driven by an electric motor (Figure 2).
A hydraulic motor was used as the pump load, which was then loaded with a second electric motor acting as an adjustable brake for which a specific braking torque value can be set.
The electric motor working as a brake is powered by a frequency inverter, which is then controlled by a PLC controller and a computer system. In real hydraulic systems, the way the pumps are loaded is quite random, depending on many factors. These can be both sudden pressure changes from a few bars when the pump is unloaded to values reaching 300 bar and more, but also smooth pressure changes when the system works with proportional parameter control. Taking these factors into account, both a stepped load and a sinusoidal waveform were used during data collection. Graphs showing the applied load torque are shown in Figure 3. The torque value was set in the range of 20 - 220Nm, which corresponds to the obtained output pressure value in range around 25 - 235bar.
The process parameters recorded during the tests were collected at three points in the system:
- suction line: temperature of the oil
- output line of the pump: pressure, temperature and flow
- leak line: pressure, temperature and flow
The data acquisition system is quite extensive software running under Windows OS. Its limitation is that it is not possible to set a constant sampling frequency, and it depends on the operation of the operating system and the PLC controller. As a result, a sampling rate of approximately 40 samples/second was achieved. After collecting the data, the recorded values for each sensor were joined by the time stamp to form a sample record. Finally, each data sample consisted of seven values that describe the temperature, pressure, and flow on the suction line, the output line, and the leak line as described above. The data were collected for four different pump states, one with correct functioning and three representing the damaged state. In order to collect data on the damaged condition, a functional element in the pump was replaced with a damaged one. The damaged element was the valve plate. Three damaged plates, shown in Figure 4, with varying degrees of damage, were prepared. The first, described as "Failure 1", is an element from a pump that was damaged during operation. The irregular cavity in the oval hole is the effect of cavitation. Two other plates (described as "Failure 2" and "Failure 3") were intentionally damaged to carry out tests. All valve plates have similar damage type, which differs in size of material loss. The smallest cavity is in "Failure 2" and the biggest, where damage is made in two oval holes, was made in valve plate "Failure 3". Therefore, "Failure 1" represents the middle state of the damage, which is similar to "Failure 2" in terms of the value of missing material.
During the research, approximately 6.6 million data records were collected. Their approximate quantity is listed below:
- No-fail state: 2,7 mln records
- Failure 1: 2,3 mln records
- Failure 2: 770 k records
- Failure 3: 900 k records
3.2. Data Preprocessing and Forming the Training and Test Set
To carry out further work with the evaluation of ML models, the data set was pre-processed in two steps. First, recorded samples were filtered and rows with NaN values were removed. Next, since the sampling frequency was much higher than the signal changes, the recorded values were averaged to obtain a sample rate of 1 sample per second (the records were grouped and averaged within a second interval). After these processing steps the data set consisted of:
- No-fail state: 68344 records
- Failure 1: 54050 records
- Failure 2: 14330 records
- Failure 3: 16469 records
To form the final data set used for machine learning evaluation, the obtained records were divided into training set and testing set. Since the amount of data describing Failure 1 was significantly larger compared to the data describing Failure 2 and Failure 3, the data describing Failure 1 was used as the positive class in the training dataset, while the data representing Failure 2 and Failure 3 were used to create the testing set. For the negative class, no-fail data was used. In this case, all records except the last 15,000 were used to create the negative class in the training dataset, while the last 15,000 records were used to create the negative class in both test datasets. Therefore, the negative class contained the same set of records in both test datasets. Finally, according to the experts knowledge an additional attribute was generated which represents the difference between the temperature on the leak line and the temperature on the suction line, . The attribute description and symbols are presented in Table 2
4. The Experiments
One of the problems in machine learning applications is the problem of selecting an appropriate predictive model. Among the available methods, three main families can be selected: models derived from decision trees, distance-based methods, and neural networks.
When it comes to the first group of algorithms, i.e. those based on decision trees, we usually refer to complex models or ensembles of models that address the limitations of individual trees. For single decision trees, the problem lies in the shape of the decision boundary, which, for continuous data, takes the form of a stepwise curve. In this case, the application of complex models, including ensuring their diversity, results in multiple trees working together to increasingly better approximate the true decision boundary. As mentioned earlier, it is important to ensure the diversity of individual trees. To solve this problem, many different algorithms have been developed, among which the most popular is Random Forest [5], where tree diversity is ensured by creating individual trees on independent subsets of features, and the final decision of the model is generated through a democratic vote of the component models. Another popular solution is the Gradient Boosted Trees algorithm [6]. In this case, unlike the Random Forest algorithm, subsequent trees are added sequentially, focusing on the areas where previous trees caused the greatest model error. This is achieved by adapting the probability distribution used for sampling training vectors with replacement, so that each subsequent tree is generated on a subset of training data. In this case, the final decision of the model is the result of a weighted vote of the individual component models. In the conducted experiments, another tree-based algorithm, the Rotation Forest algorithm [7], was used. It operates similarly to Random Forest, with the difference that the algorithm generates random subspaces for which the tree is generated; however, before training the tree, the PCA algorithm is used to rotate the coordinate system. This algorithm is particularly useful for correlated variables, facilitating the construction of a predictive model. All the tree-based algorithms have an additional significant advantage, namely, they provide the possibility of partial interpretation of the model results by using the MDI (Mean Decrease in Impurity) coefficients. These coefficients are used to assess the importance of attributes, thus they can be interpreted as a measure of evaluating the quality of individual variables. Another important advantage of tree-based algorithms is the speed of training and prediction, as trees ensure low computational complexity and ease of parallelization.
A separate group of models consists of distance-based algorithms. A typical example of this group is the k-Nearest Neighbors (kNN) algorithm [8]. It belongs to the group of lazy learning methods because the entire inference process occurs during prediction, where the k nearest neighbors for a given vector are identified from among the stored training vectors, and a vote is taken among them to select the appropriate class. Besides the voting method, the factor determining the quality of kNN is also the selection of reference vectors stored in the model’s memory. These methods are also called instance selection methods. This also enables the interpretation of the model, including the use of so-called prototype-based rules [24] and case-based reasoning methods [25].
The last method evaluated is the neural network [9,26]. In this case, a fully-connected neural network also called multi-layer perceptron (MLP) was used, without convolutional layers. This choice results from the characteristics of the data, where the data could not be decomposed into time series due to the shape of the waveform, the sampling frequency, and the speed of recorded signal changes.
The complement to the conducted analysis is the evaluation of attribute quality. As mentioned earlier, attribute importance can be assessed using tree-based algorithms, including Mean Decrease in Impurity (MDI). This measure is generated based on results obtained from the training data, which can lead to overestimation of the importance of individual attributes. Therefore, in this work, the permutation feature importance measure was used to assess attribute importance [27,28]. This measure is model-independent, allowing it to evaluate tree-based models, as well as kNN and neural networks. This method measures the contribution of each feature to the statistical performance of the fitted model by randomly shuffling the values of a single feature and observing the impact on the model’s prediction quality. By breaking the association between the feature and the labels, we determine how much the model relies on that particular feature while keeping the distribution of the feature unchanged. Moreover, this method can also be applied to test data, thus avoiding the issue of overestimating feature importance due to model overfitting, as it often appears for the MDI feature importance estimator.
4.1. Model evaluation procedure
The model evaluation procedure comprised two steps. In the first step, the predictive model underwent parameter optimization, and in the second step, the quality of the best obtained predictive model was assessed using test data, which included different types of valve plate damage as described in section XX.
The full data processing schema is presented in Figure 5. It starts with the initial standardization of the training data, which is then evaluated using the grid search procedure involving 10-fold cross-validation test. The range of optimized parameters for each model is provided in Table 3. Subsequently, the best model obtained from the parameter optimization was used to verify accuracy on the test data describing two different levels of valve plate damage. In this case, the normalization coefficients derived from the entire dataset were applied to the test sets, standardizing them. After this initial processing, predictions were made using the model trained on the first valve plate damage data set and applied to both test data sets.
The next step in the model evaluation process was assessing attribute importance using the permutation method. Applying this method to both test sets and comparing the obtained results allows for the verification of the model in terms of the consistency of the results. Obtaining similar attribute importance for two independent test data sets confirms the validity of the model’s quality. The analysis of attribute importance using the permutation method has certain limitations (the problem also applies to the MDI method). This limitation arises in the case of strongly correlated attributes. In such situations, replacing an attribute with a new one containing permuted values causes the other strongly correlated attribute to take over its role, making the decrease in prediction accuracy invisible. To circumvent the above-described problem, this work includes an analysis of the correlations between attributes. For attributes identified as strongly correlated, i.e., those with a correlation above 0.9, a PCA analysis was conducted, leaving only one principal component. The analysis of attribute importance was then performed on the dataset with a reduced number of attributes.
An important factor worth highlighting was the model evaluation method during cross-validation. The traditional approach to using cross-validation involves randomly splitting the data into individual folds. In this study, this procedure was abandoned due to the nature of the data. The recorded data should be treated to some extent as a signal, which means that with randomized data and the step-wise nature of the pump load operation, we would obtain almost identical training and test data. This would consequently lead to an overestimation of the model’s quality. Therefore, a linear partitioning approach was adopted in this work. From the available data, a sequence of samples was extracted and used for testing.
In the calculations performed, simple accuracy was used as the measure of prediction performance, calculated as the number of correctly predicted cases relative to the total number of evaluated cases. The use of simple accuracy is justified because the datasets evaluated were balanced, with the class distribution being 47%, 49%, and 48% respectively for the Failure 1, Failure 2, and Failure 3 datasets. As a complement to the accuracy, a confusion matrix was used for evaluation, which allows for the assessment of false positive and false negative errors.
All of the experiments were conducted using scikit-learn python library for machine learning. The final dataset used in the experiments is available at 1.
5. Results
According to the procedure described in Section 4.1, five prediction models were evaluated. The results of the model evaluation procedure were collected and presented in Table 4. They indicate that, in the case of identifying failures in hydraulic pumps, tree-based models exhibited the highest prediction error. Among the tree-based models, the Gradient Boosted Trees algorithm achieved the best results, with an accuracy of 84.55%. The kNN algorithm ranked next, showing a 3-percentage-point improvement in accuracy compared to the GBT algorithm. The best results were obtained by the neural network, which achieved the accuracy of 88.68%.
It is also worth noting that the use of autoregressive data, including up to 3 historical samples, did not positively affect the quality of the obtained results. These findings indicate no significant impact on model quality, and in many cases, a minimal degradation in model quality can be observed with an increasing window size.
Ultimately, the MLP model, which achieved the highest accuracy, was used for verification on the test data. The quality of the results obtained on the Failure 2 and Failure 3 datasets is presented in Table 5. Complementing the results is the confusion matrix obtained for both datasets, which is shown in Figure 6. The results indicate identical prediction quality for class 0, corresponding to the correct operation of the pump, while for class 1 (failure state), the obtained results are similar. The main differences occur in the case of false negative values.
The identical values obtained for the negative class (0) are justified because the same set of values describing the normal operating condition of the pump was used for both datasets. However, differences appeared in the data describing the failure state. The obtained results indicate very good properties of the model, with error levels, both false positives and false negatives, are at an acceptable level.
The final factor considered during the analysis was the verification of attribute importance for the obtained model. Attribute quality was assessed using the permutation method applied to both test datasets. As discussed, in the previous section, the correlation between the attributes was measured. The obtained results are presented in Table 6. In the experiment, we compared all three datasets, and in all of the cases, the correlations between attributes were almost identical. The table contains the average correlation over all three datasets. The obtained values indicate a very strong dependency between the output temperature () and the suction line temperature (), with a correlation level of 0.99. Similarly, a high correlation exists between the output temperature () and the leak line temperature (), with a correlation level of 0.91 in this case. As described above, PCA analysis was performed for all three attributes, resulting in a new attribute that replaced its predecessors. The obtained coefficients describing the importance of individual attributes are presented in Figure 7 separately for both datasets.
The obtained results indicate that in both cases, the most important parameters were ’Flow - leak line,’ ’Pressure - output,’ and ’Flow - output.’ The next in the order was Temperature (a feature derived from the PCA operation on the highly correlated attributes describing the temperature in the system). The attributes identified as insignificant were ’Pressure - leak line’ and ’Temp. diff.’ This characteristic is observed for both test datasets, with only minor variations in the "Decrease in accuracy". It is worth noting that the interpretation of the obtained results aligns with expert knowledge, where a high ’Flow - leak line’ can indicate a valve plate failure, although the flow rate strongly depends on the pressure in the system, therefore the ’Pressure - output’ was marked as the second most important. ’Flow - output’ complements the information set.
6. Conclusions
The article describes the process of building a system to predict valve plate failures in a piston pump. To construct the system, a dedicated dataset was developed, describing three different failure states of the pump and the normal operating state. For the failure states, three different plates with varying degrees of degradation were used. During the measurements, various values of pressure, temperature, and flow parameters were recorded at different locations in the system. Using the recorded data, various machine learning models were evaluated along with hyper-parameter tuning. These models were assessed on the dataset describing the moderate state of the valve plate (failure 1 dataset) for which the highest number of samples was recorded during physical experiments. Among the five predictive models assessed, the neural network with 10 hidden units achieved the best results. The final best-obtained model was trained on the entire dataset called Failure 1 and then evaluated on datasets representing failure 2 and failure 3, allowing for an independent assessment of the model’s quality. The results indicate a very high prediction accuracy of the neural network, achieving prediction accuracies of 87% and 89% for the two test sets. The feature importance analysis revealed that the most critical parameters are the flow in the leak line, the system pressure, and the output flow. This information allows for the reduction in the number of sensors needed for practical system implementation, significantly lowering costs.
Further research is planned to expand the collected information with vibrodiagnostic data, which should further improve the prediction quality of the system.
References
- Carvalho, T.P.; Soares, F.A.; Vita, R.; Francisco, R.d.P.; Basto, J.P.; Alcalá, S.G. A systematic literature review of machine learning methods applied to predictive maintenance. Computers & Industrial Engineering 2019, 137, 106024. [Google Scholar]
- Jędrzykiewicz, Z.; Stojek, J.; Rosikowski, P. Napęd i sterowanie hydrostatyczne; Wydawnictwo Akademii Górniczo-Hutniczej, 2017.
- Blachnik, M.; Przyłucki, R.; Golak, S.; Ściegienka, P.; Wieczorek, T. On the development of a digital twin for underwater UXO detection using magnetometer-based data in application for the training set generation for machine learning models. Sensors 2023, 23, 6806. [Google Scholar] [CrossRef] [PubMed]
- Rivera, D.L.; Scholz, M.R.; Fritscher, M.; Krauss, M.; Schilling, K. Towards a predictive maintenance system of a hydraulic pump. IFAC-PapersOnLine 2018, 51, 447–452. [Google Scholar] [CrossRef]
- Breiman, L. Random forests. Machine learning 2001, 45, 5–32. [Google Scholar] [CrossRef]
- Natekin, A.; Knoll, A. Gradient boosting machines, a tutorial. Frontiers in neurorobotics 2013, 7, 21. [Google Scholar] [CrossRef] [PubMed]
- Rodriguez, J.J.; Kuncheva, L.I.; Alonso, C.J. Rotation forest: A new classifier ensemble method. IEEE transactions on pattern analysis and machine intelligence 2006, 28, 1619–1630. [Google Scholar] [CrossRef] [PubMed]
- Kordos, M.; Blachnik, M.; Strzempa, D. Do we need whatever more than k-NN? Artificial Intelligence and Soft Computing: 10th International Conference, ICAISC 2010, Zakopane, Poland, June 13-17, 2010, Part I 10. Springer, 2010, pp. 414–421. [CrossRef]
- Bishop, C.M.; Bishop, H. Deep learning: Foundations and concepts; Springer Nature, 2023.
- Tang, S.; Zhu, Y.; Yuan, S. A novel adaptive convolutional neural network for fault diagnosis of hydraulic piston pump with acoustic images. Advanced Engineering Informatics 2022, 52, 101554. [Google Scholar] [CrossRef]
- Li, Z.; Jiang, W.; Zhang, S.; Xue, D.; Zhang, S. Research on prediction method of hydraulic pump remaining useful life based on KPCA and JITL. Applied Sciences 2021, 11, 9389. [Google Scholar] [CrossRef]
- Guo, R.; Li, Y.; Zhao, L.; Zhao, J.; Gao, D. Remaining useful life prediction based on the Bayesian regularized radial basis function neural network for an external gear pump. IEEE Access 2020, 8, 107498–107509. [Google Scholar] [CrossRef]
- Yu, H.; Li, H. Pump remaining useful life prediction based on multi-source fusion and monotonicity-constrained particle filtering. Mechanical Systems and Signal Processing 2022, 170, 108851. [Google Scholar] [CrossRef]
- Bykov, A.; Voronov, V.; Voronova, L. Machine learning methods applying for hydraulic system states classification. 2019 Systems of Signals Generating and Processing in the Field of on Board Communications. IEEE, 2019, pp. 1–4. [CrossRef]
- Ding, Y.; Ma, L.; Wang, C.; Tao, L. An EWT-PCA and extreme learning machine based diagnosis approach for hydraulic pump. IFAC-PapersOnLine 2020, 53, 43–47. [Google Scholar] [CrossRef]
- Tang, S.; Zhu, Y.; Yuan, S. An improved convolutional neural network with an adaptable learning rate towards multi-signal fault diagnosis of hydraulic piston pump. Advanced Engineering Informatics 2021, 50, 101406. [Google Scholar] [CrossRef]
- Tang, S.; Khoo, B.C.; Zhu, Y.; Lim, K.M.; Yuan, S. A light deep adaptive framework toward fault diagnosis of a hydraulic piston pump. Applied Acoustics 2024, 217, 109807. [Google Scholar] [CrossRef]
- Surucu, O.; Gadsden, S.A.; Yawney, J. Condition monitoring using machine learning: A review of theory, applications, and recent advances. Expert Systems with Applications 2023, 221, 119738. [Google Scholar] [CrossRef]
- Sharma, A.K.; Punj, P.; Kumar, N.; Das, A.K.; Kumar, A. Lifetime prediction of a hydraulic pump using ARIMA model. Arabian Journal for Science and Engineering 2024, 49, 1713–1725. [Google Scholar] [CrossRef]
- Buabeng, A.; Simons, A.; Frempong, N.K.; Ziggah, Y.Y. Hybrid intelligent predictive maintenance model for multiclass fault classification. Soft Computing, 2023; 1–22. [Google Scholar] [CrossRef]
- Tang, S.; Zhu, Y.; Yuan, S. Intelligent fault diagnosis of hydraulic piston pump based on deep learning and Bayesian optimization. ISA transactions 2022, 129, 555–563. [Google Scholar] [CrossRef]
- Shao, Y.; Chao, Q.; Xia, P.; Liu, C. Fault severity recognition in axial piston pumps using attention-based adversarial discriminative domain adaptation neural network. Physica Scripta 2024, 99, 056009. [Google Scholar] [CrossRef]
- Konieczny, J.; atas, W.; Stojek, J. Application of analysis of variance to determine important features of signals for diagnostic classifiers of displacement pumps. Scientific Reports 2024, 14, 6098. [Google Scholar] [CrossRef]
- Blachnik, M.; Duch, W. LVQ algorithm with instance weighting for generation of prototype-based rules. Neural Networks 2011, 24, 824–830. [Google Scholar] [CrossRef]
- Kolodner, J. Case-based reasoning; Morgan Kaufmann, 2014.
- Blachnik, M.; Kordos, M. Comparison of instance selection and construction methods with various classifiers. Applied Sciences 2020, 10, 3933. [Google Scholar] [CrossRef]
- Nicodemus, K.K.; Malley, J.D.; Strobl, C.; Ziegler, A. The behaviour of random forest permutation-based variable importance measures under predictor correlation. BMC bioinformatics 2010, 11, 1–13. [Google Scholar] [CrossRef] [PubMed]
- Kaneko, H. Cross-validated permutation feature importance considering correlation between features. Analytical Science Advances 2022, 3, 278–287. [Google Scholar] [CrossRef] [PubMed]
| 1 | The dataset is currently in the process of publishing and soon should be available. |
Figure 1.
Hydraulic diagram.
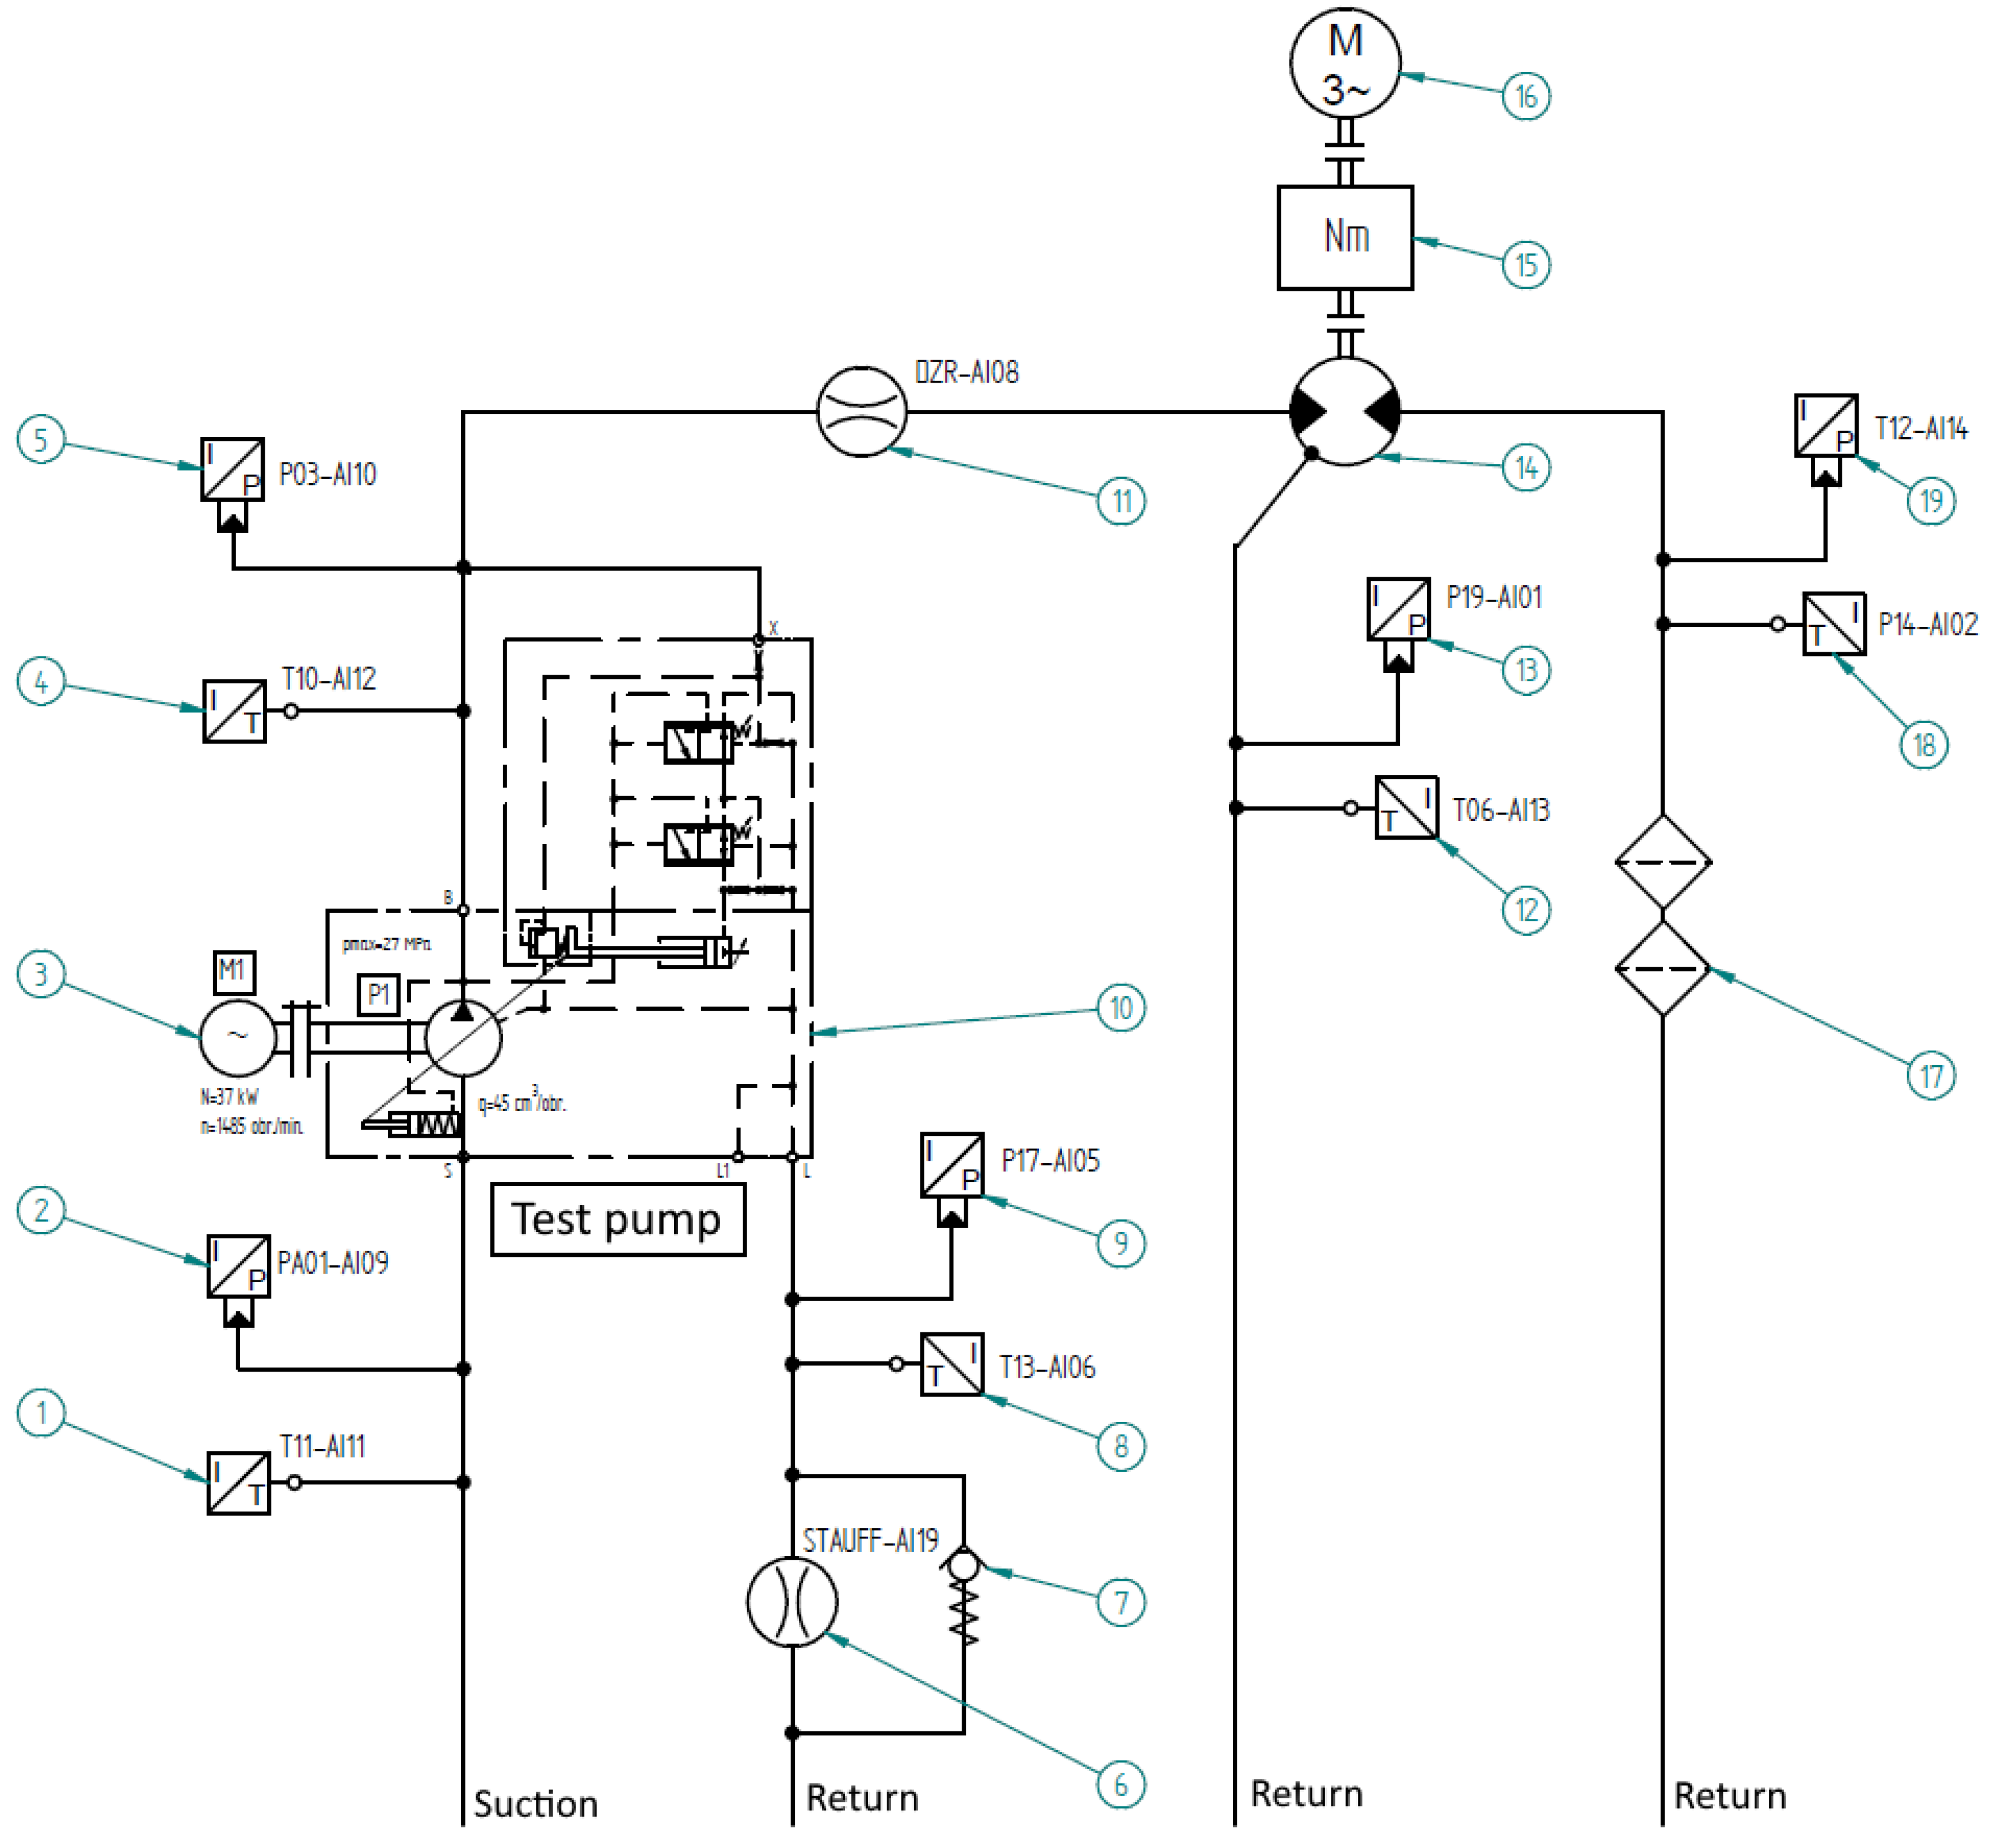
Figure 2.
Test unit for data acquisition.
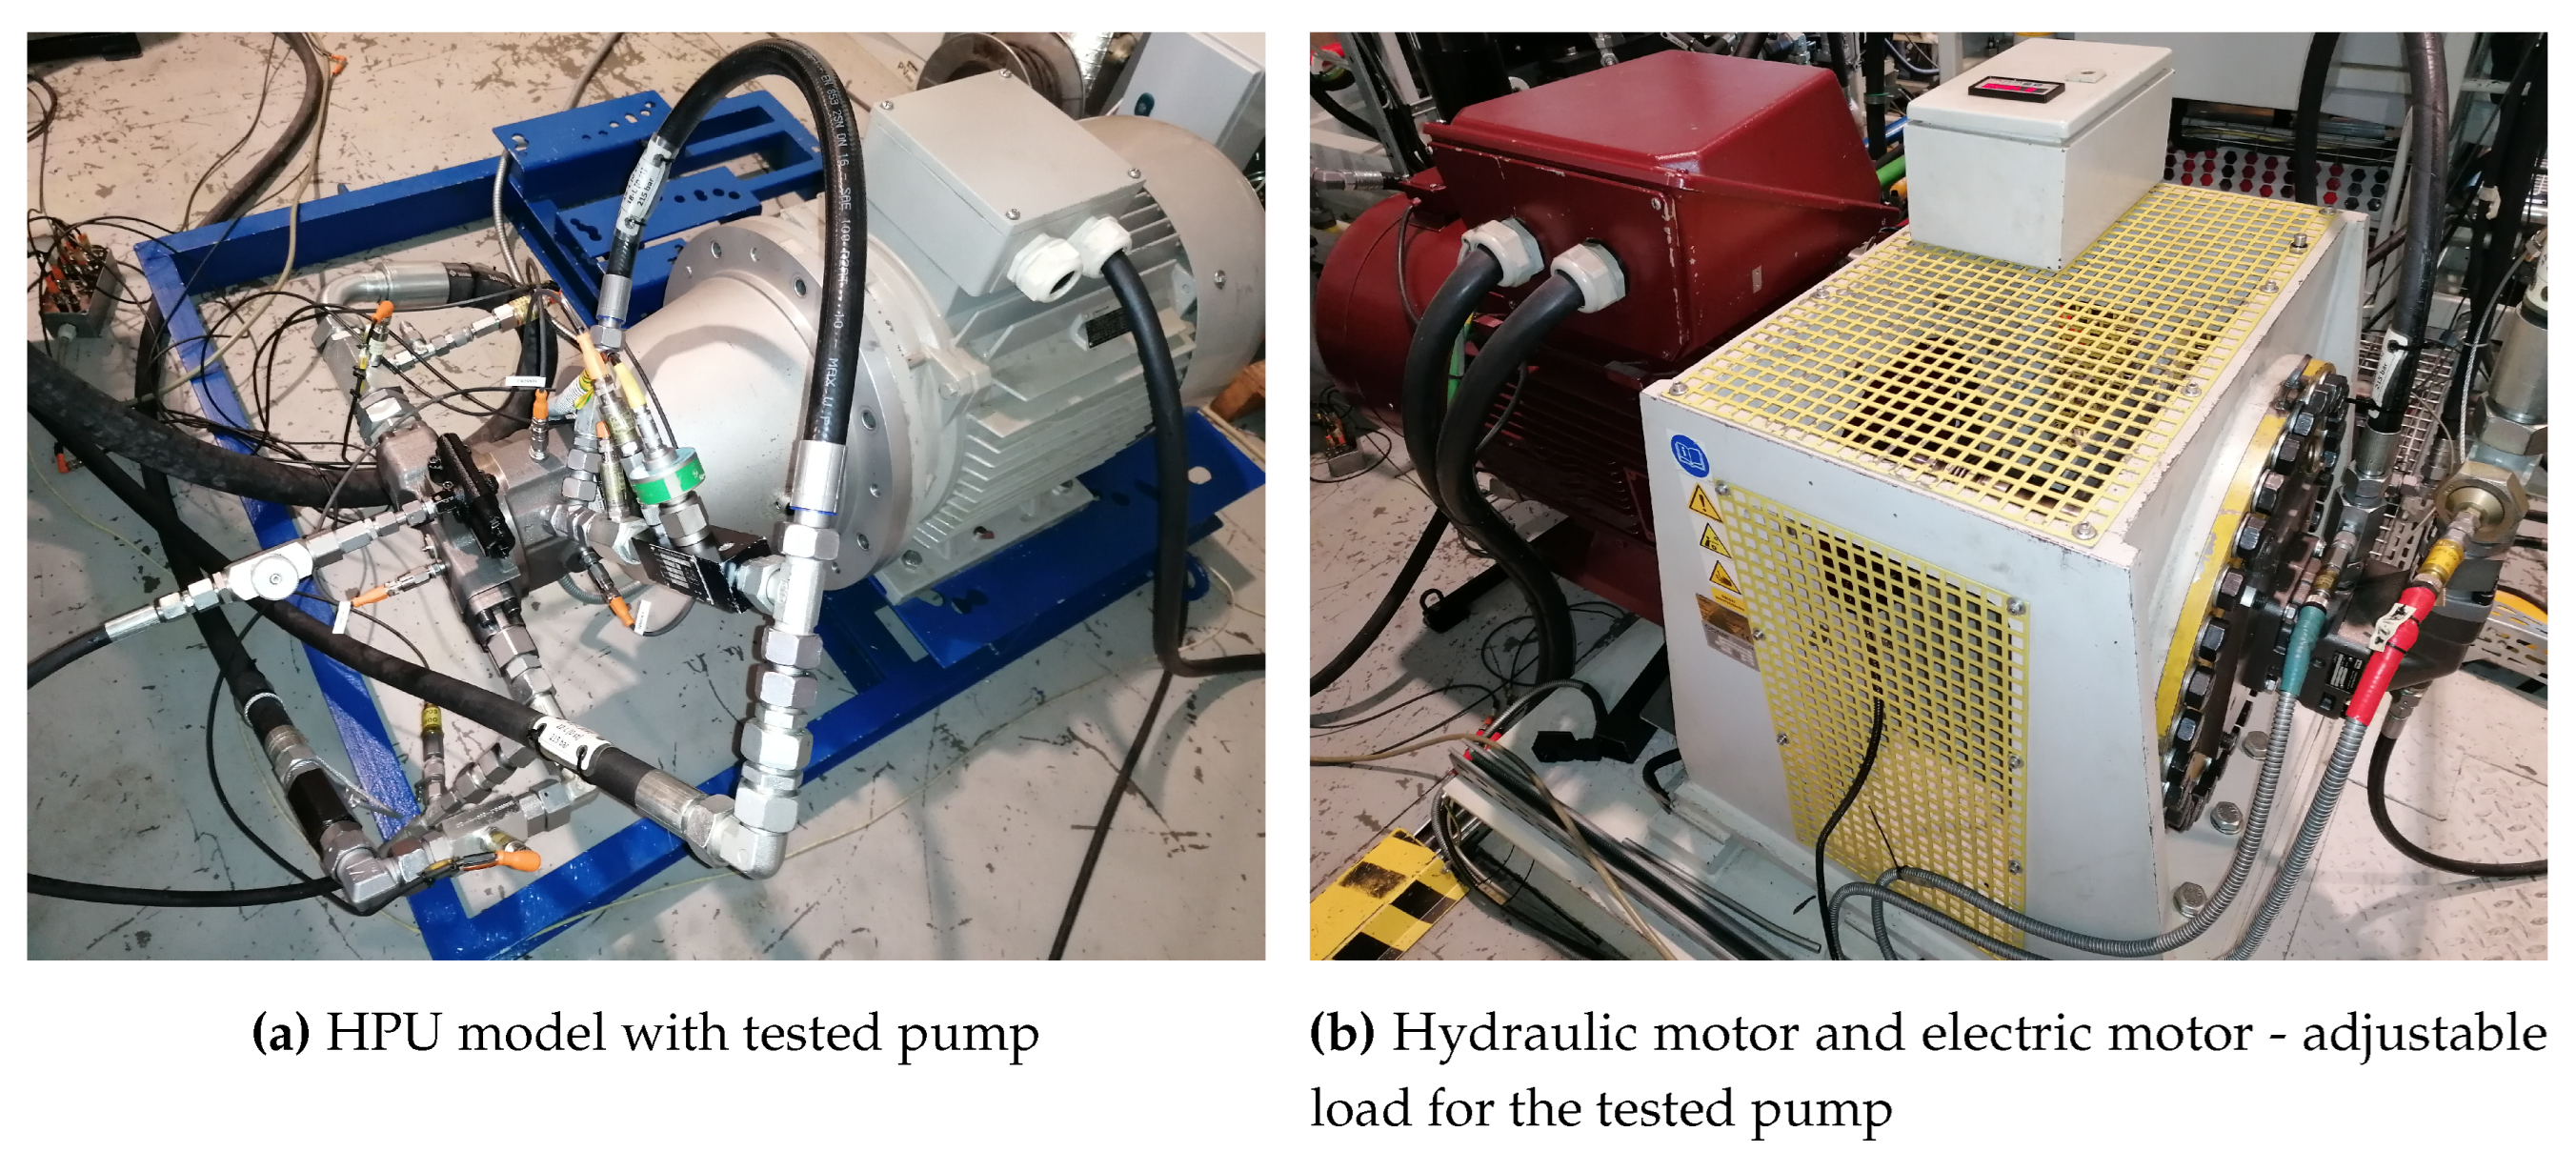
Figure 3.
Examples of applied load torque - stepped and sine wave.
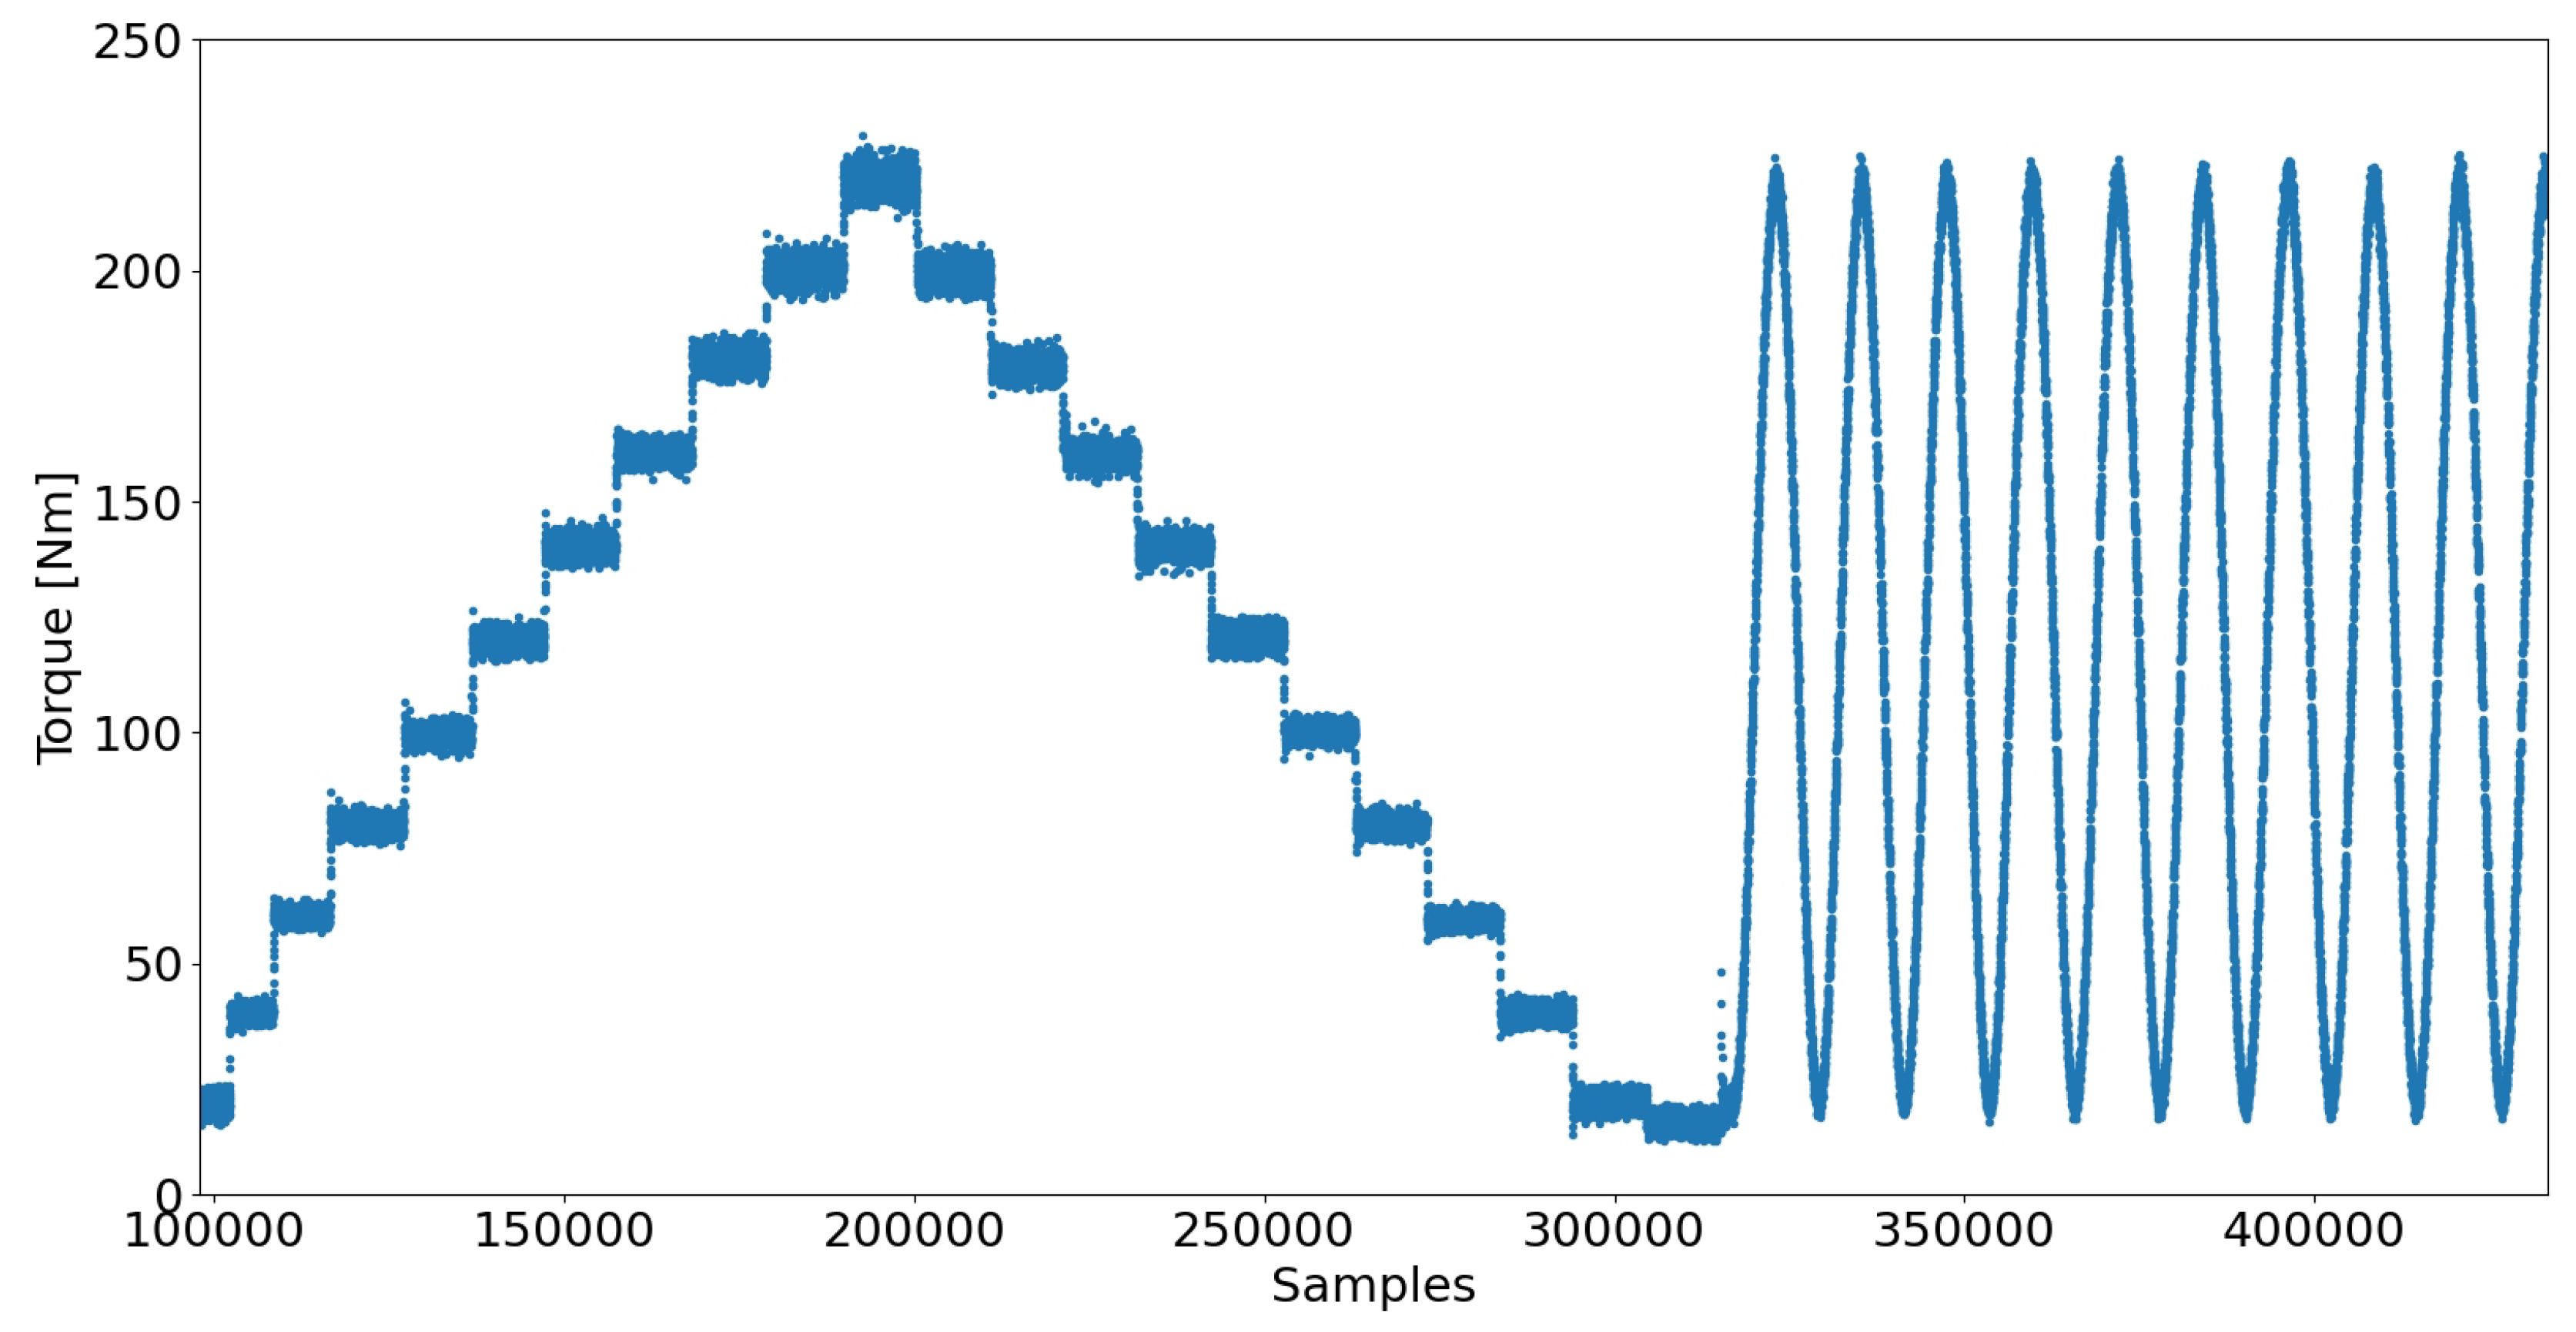
Figure 4.
Damaged valve plates.
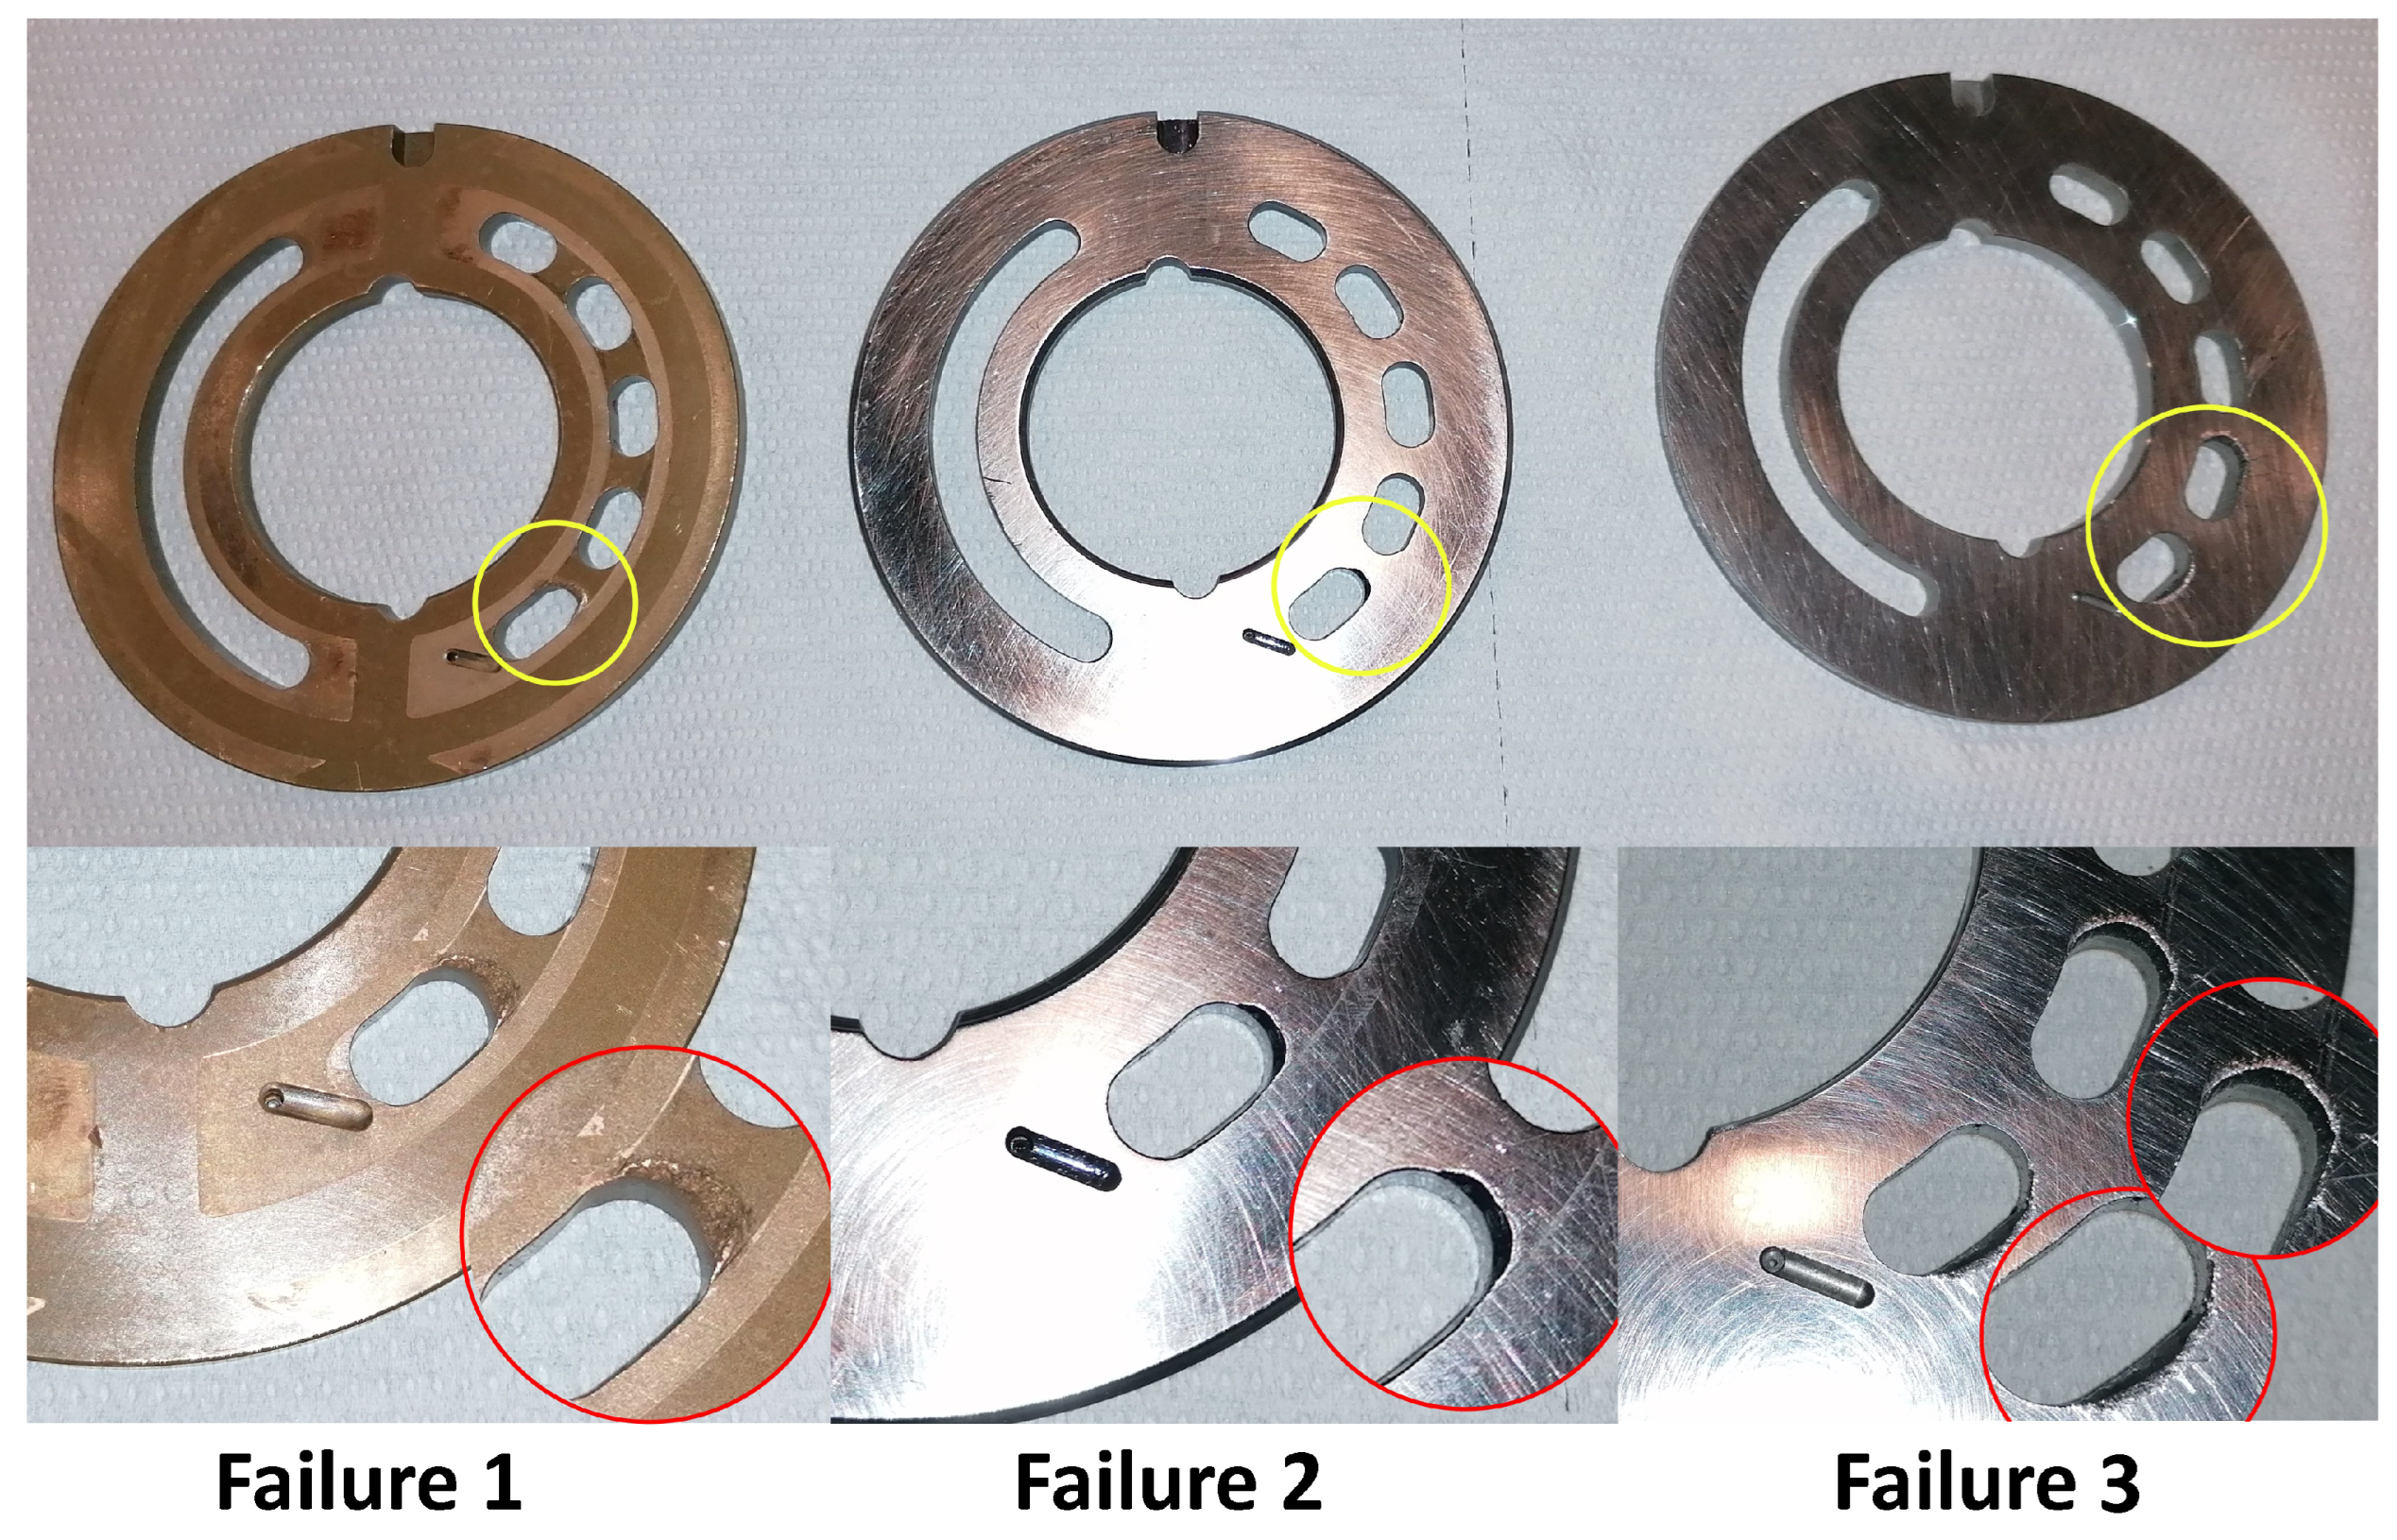
Figure 5.
Model evaluation scheme.
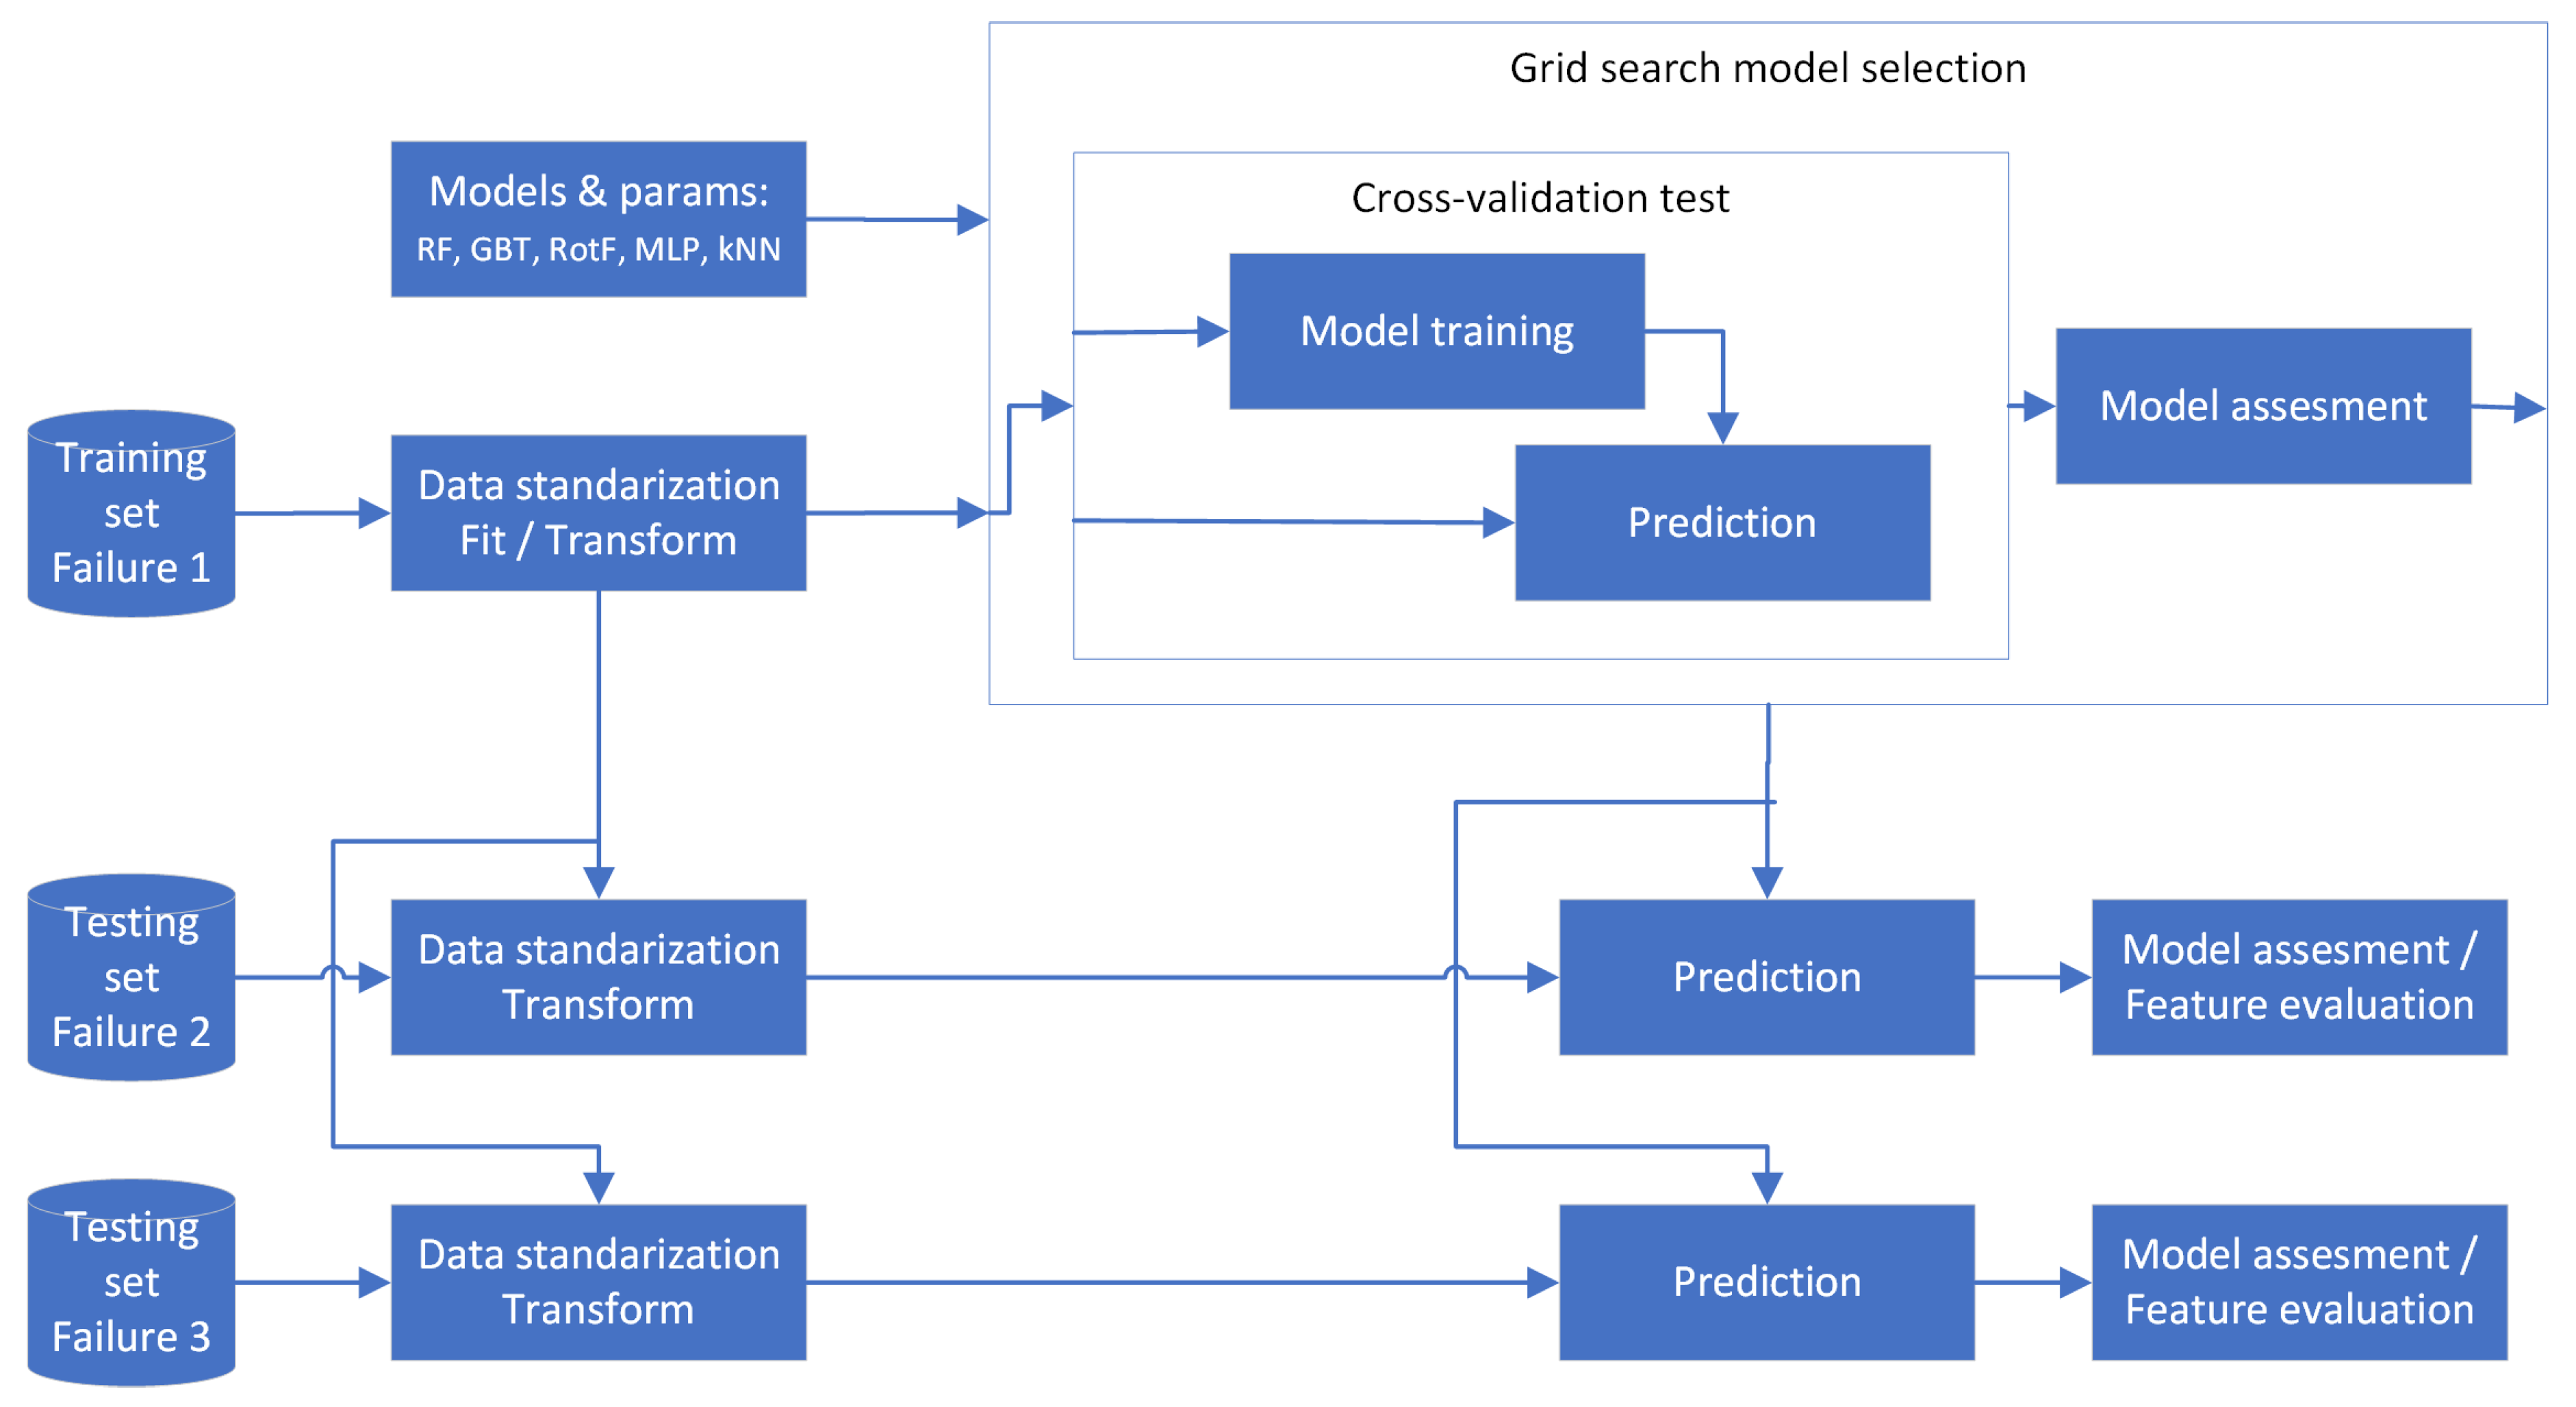
Figure 6.
Confusion matrix obtained for the Failure 2 and Failure 3 datasets.
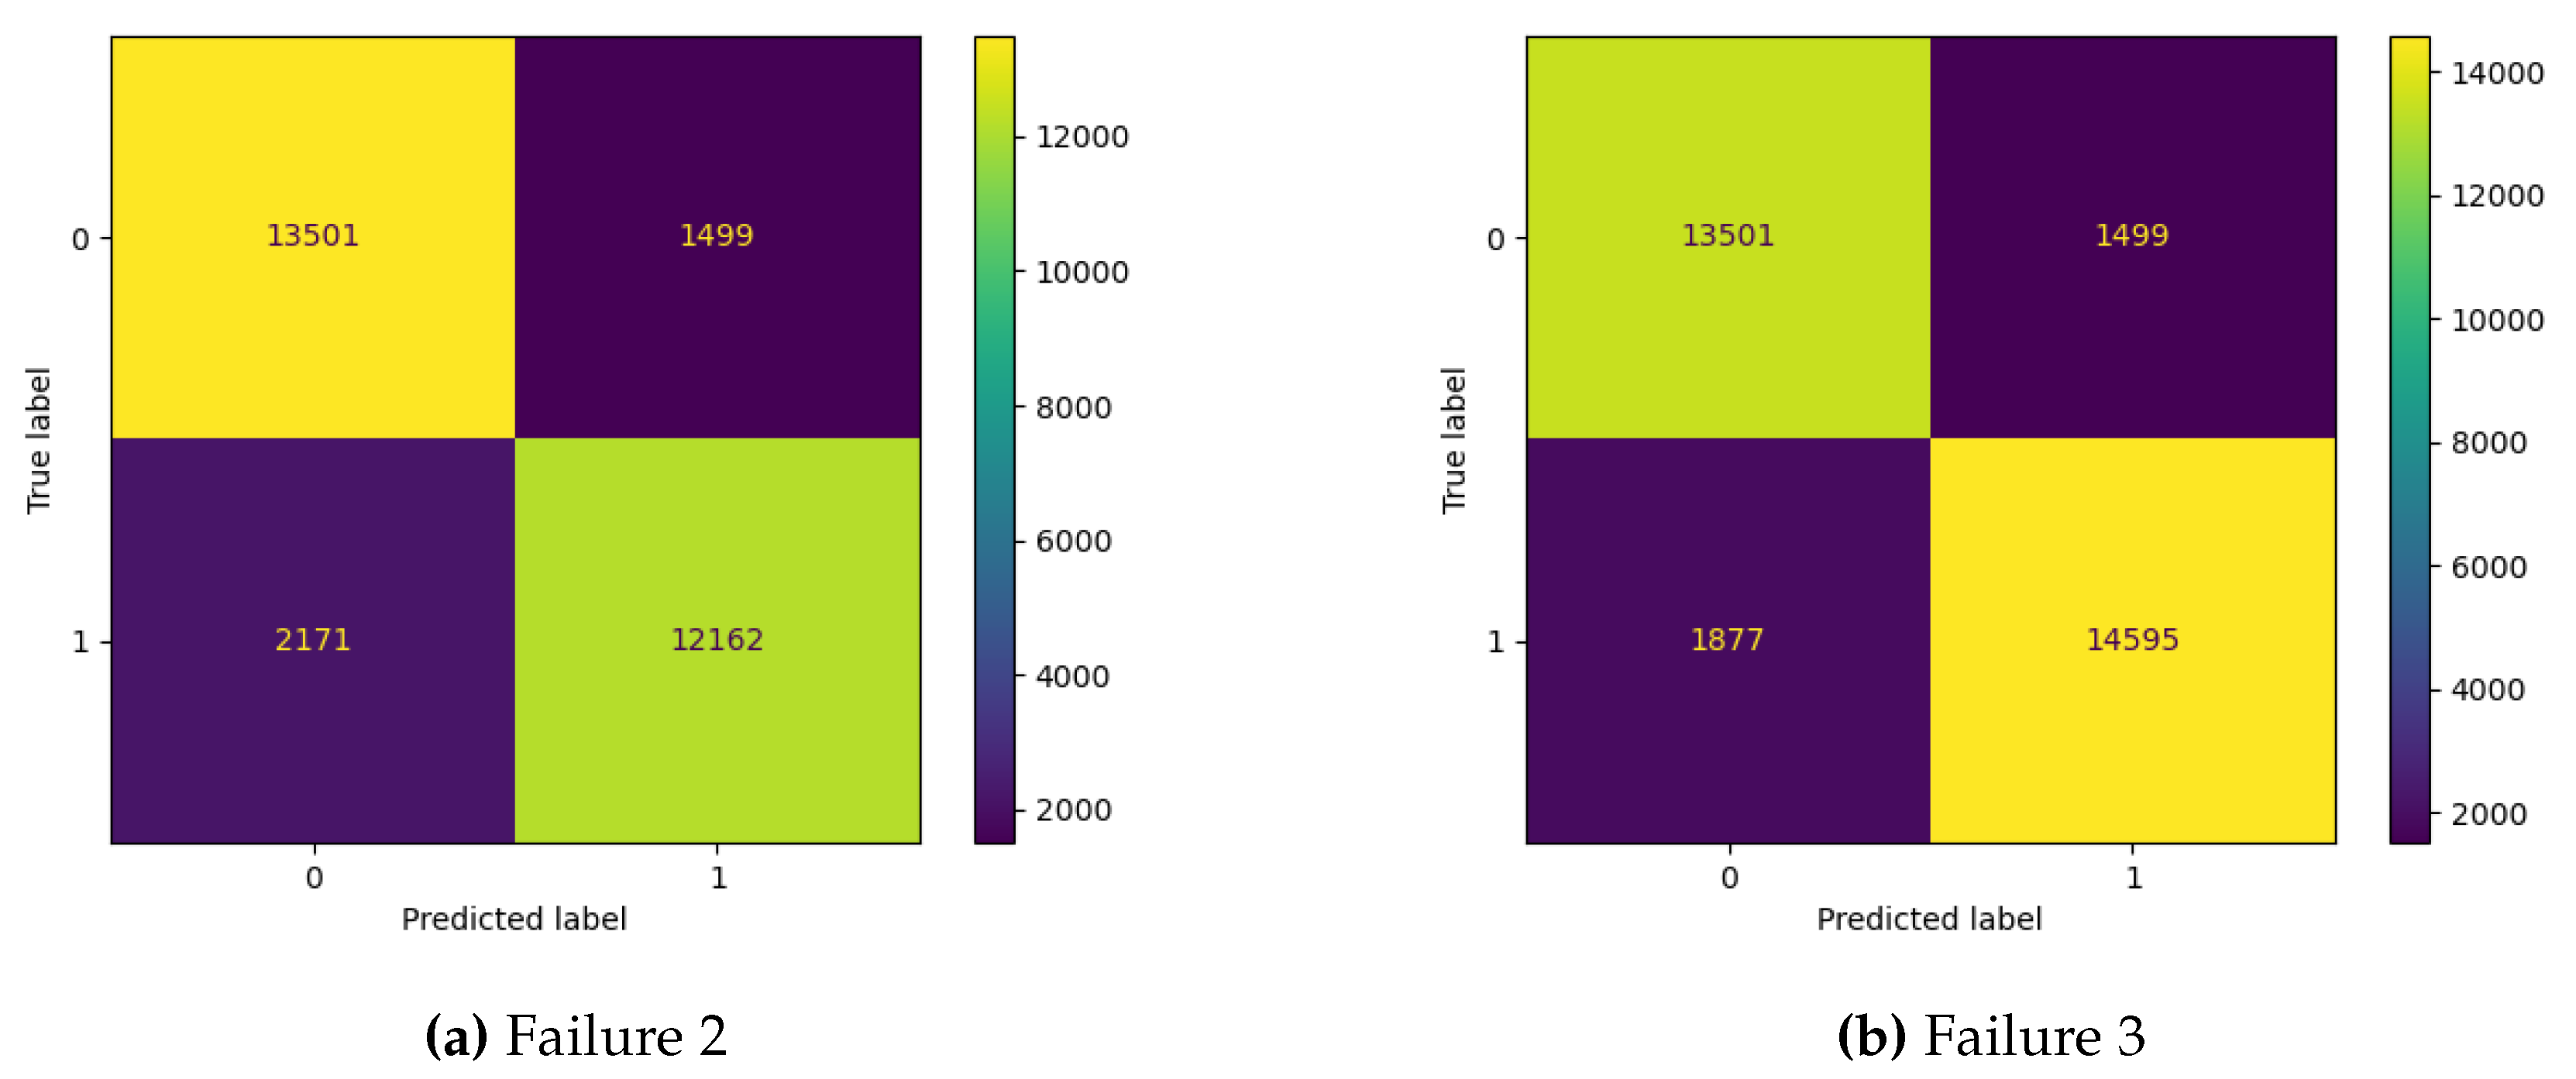
Figure 7.
Feature importance plot obtained for Failure 2 and Failure 3 datasets.
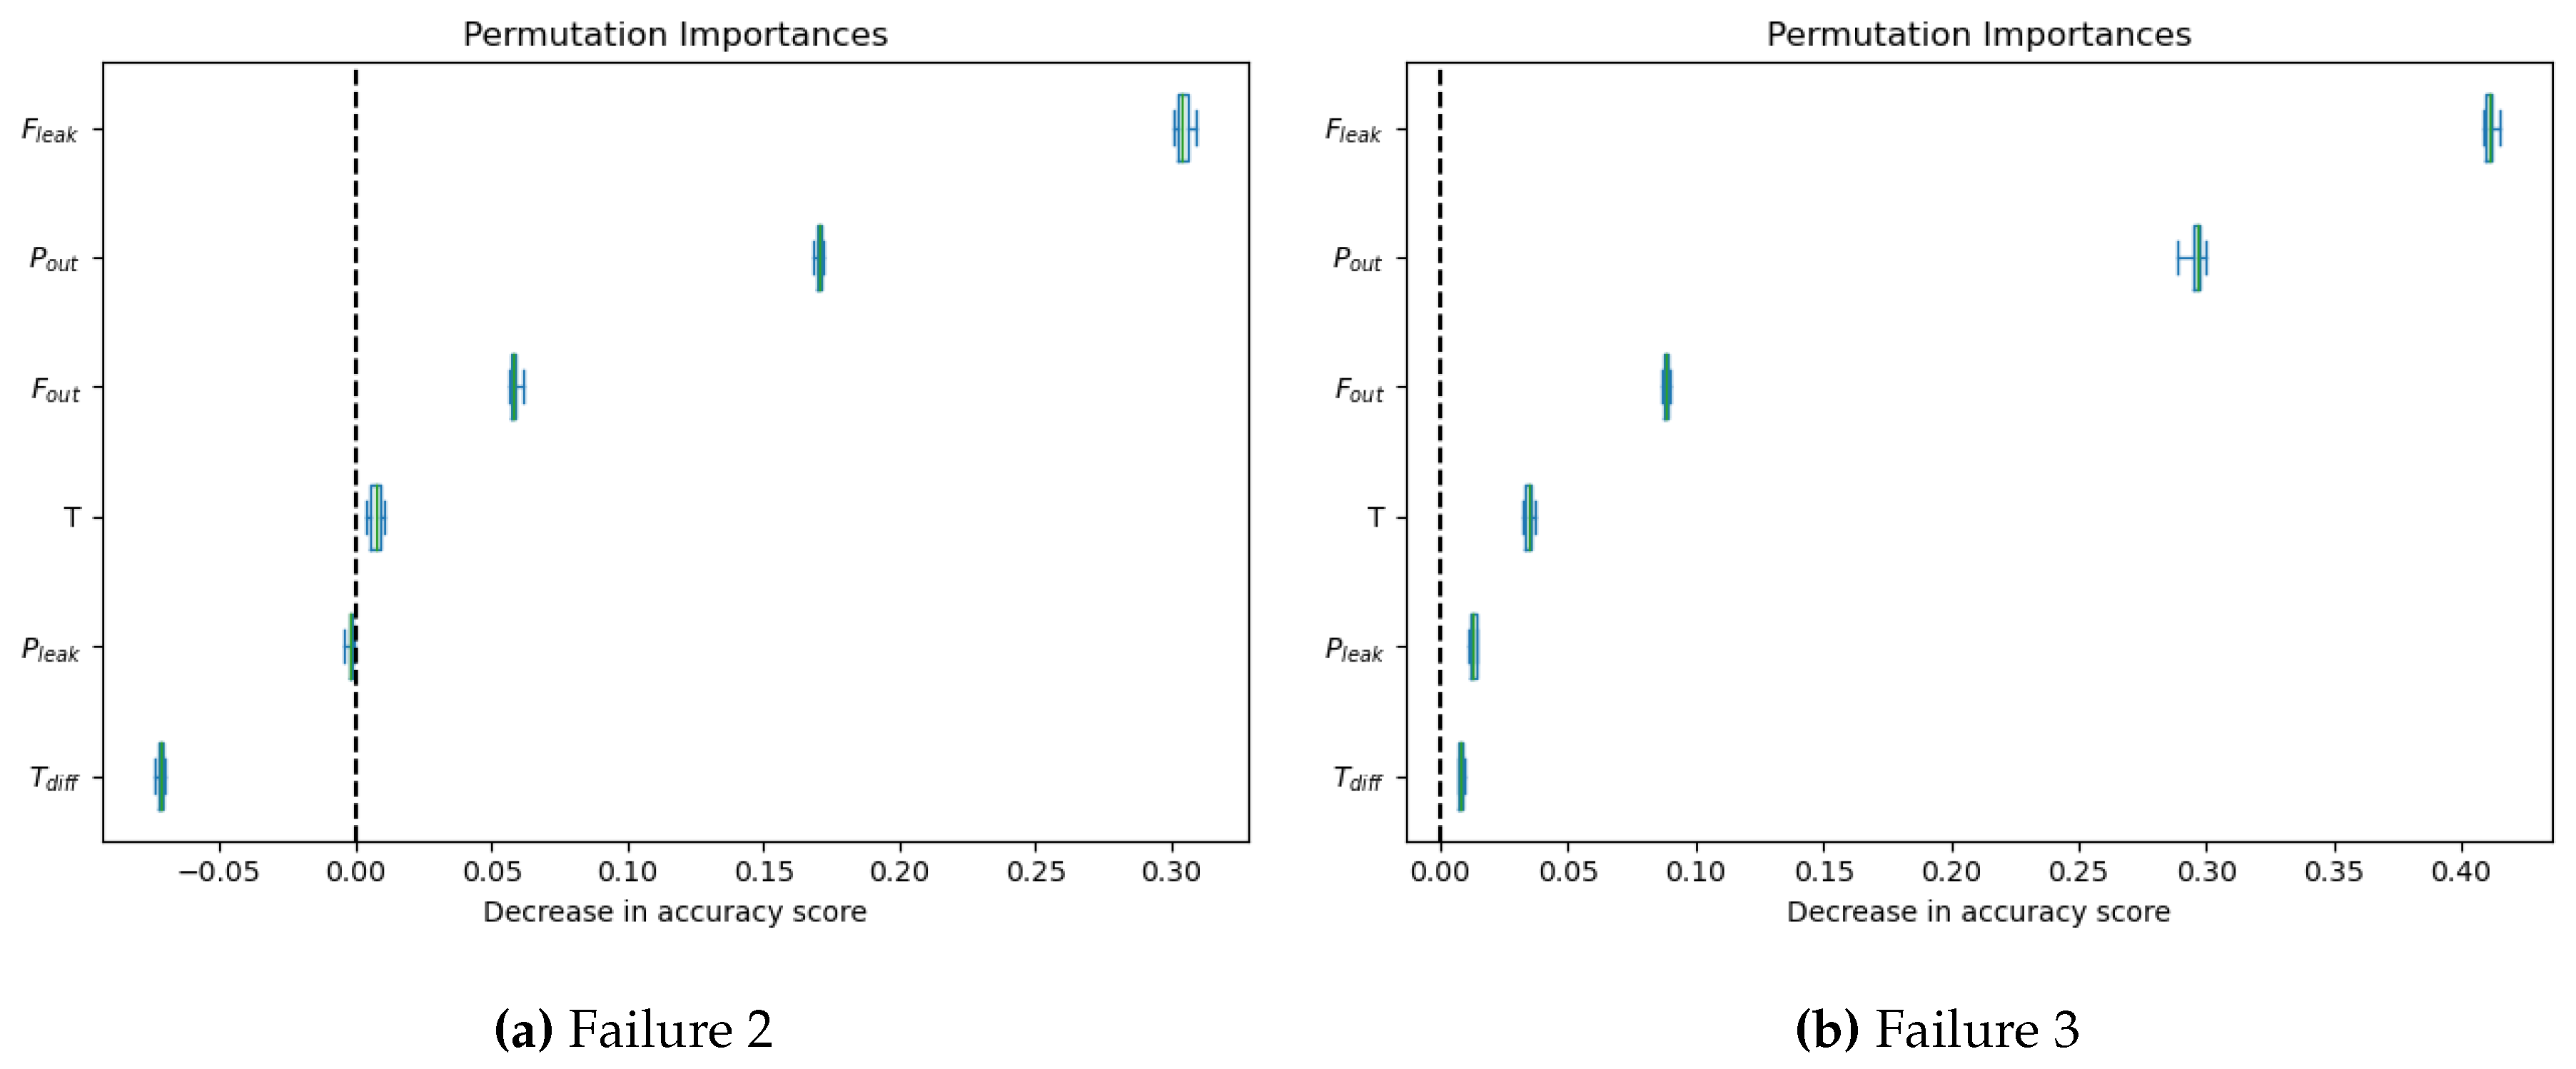

Table 1.
HPU components.
| Pos. | Description | Symbol | Manufacturer |
| 1 | Temperature sensor Pt1000 150°C | TA2105 | IFM |
| 2 | Pressure sensor -1…1bar | PA3509 | IFM |
| 3 | Electric motor 37kW | FCMP 225S-4/PHE | AC-Motoren |
| 4 | Temperature sensor Pt1000 150°C | TA2105 | IFM |
| 5 | Pressure sensor 400bar | PT5400 | IFM |
| 6 | Turbine flow meter | PPC-04/12-SFM-015 | Stauff |
| 7 | Check valve | S8A1.0 | Ponar |
| 8 | Temperature sensor Pt1000 150°C | TA2105 | IFM |
| 9 | Pressure sensor 10bar | PT5404 | IFM |
| 10 | Piston pump | HSP10VO45DFR | Hydraut |
| 11 | Gear wheel flow meter | DZR-10155 | Kobold |
| 12 | Temperature sensor Pt1000 150°C | TA2105 | IFM |
| 13 | Pressure sensor 10bar | PT5404 | IFM |
| 14 | Hydraulic motor | F12 060 MF | Parker |
| 15 | Torque meter | T22/1KNM | HBM |
| 16 | Electric motor 170kW | LSRPM250ME1 | Emerson |
| 17 | Filter | FS1 | Ponar |
| 18 | Pressure sensor 250bar | PT5401 | IFM |
| 19 | Temperature sensor Pt1000 150°C | TA2105 | IFM |
Table 2.
Column names and its symbols.
| Columns name | Symbol | |
| 1 | Pressure - leak line | |
| 2 | Temperature - leak line | |
| 3 | Pressure - output | |
| 4 | Temperature - suction line | |
| 5 | Temperature - output | |
| 6 | Flow - leak line | |
| 7 | Flow - output | |
| 8 | Temp. diff |
Table 3.
Parameter settings for the models evaluation procedure.
| Model | Param | Values |
| RandomForest | # trees | [t] |
| max depth | ||
| max features | [b] | |
| RotationForest | # trees | [t] |
| max depth | ||
| # featuressubset | [b] | |
| GradientBoostedTrees | # trees | [50, 100, 200, 300] [t] |
| max depth | ||
| learning rate | [b] | |
| kNN | k | [t] |
| voting | democratic/weighted [b] | |
| MLP | architecture | [(4,),(10,),(30,),(50,),(100,),(100,10)] [t] |
| # iter. | [100,500,1000] | |
| learning rate | [b] |
Table 4.
Comparison of the models’ performance using grid search procedure on failure 1 dataset.
| LagModel | RandomForest | RotationForest | GradientBoostedTrees | kNN | MLP |
| 0 | 0.8442 | 0.8335 | 0.8455 | 0.8739 | 0.8868 |
| 1 | 0.8223 | 0.8224 | 0.8440 | 0.8742 | 0.8803 |
| 2 | 0.8180 | 0.8295 | 0.8429 | 0.8737 | 0.8865 |
Table 5.
Model performance obtained on the test datasets: the Failure 2 and Failure 3 dataset.
| Failure 2 | Failure 3 | |
| MLP | 0.8748 | 0.8927 |
Table 6.
Correlation between attributes in Failure 1 dataset.
| 1.00 | -0.35 | 0.57 | -0.52 | -0.44 | 0.36 | 0.03 | 0.46 | |
| -0.35 | 1.00 | 0.33 | 0.88 | 0.91 | 0.43 | 0.37 | -0.07 | |
| 0.57 | 0.33 | 1.00 | 0.05 | 0.17 | 0.79 | 0.26 | 0.47 | |
| -0.52 | 0.88 | 0.05 | 1.00 | 0.99 | 0.23 | 0.27 | -0.54 | |
| -0.44 | 0.91 | 0.17 | 0.99 | 1.00 | 0.32 | 0.30 | -0.47 | |
| 0.36 | 0.43 | 0.79 | 0.23 | 0.32 | 1.00 | 0.12 | 0.29 | |
| 0.03 | 0.37 | 0.26 | 0.27 | 0.30 | 0.12 | 1.00 | 0.10 | |
| 0.46 | -0.07 | 0.47 | -0.54 | -0.47 | 0.29 | 0.10 | 1.00 |
Disclaimer/Publisher’s Note: The statements, opinions and data contained in all publications are solely those of the individual author(s) and contributor(s) and not of MDPI and/or the editor(s). MDPI and/or the editor(s) disclaim responsibility for any injury to people or property resulting from any ideas, methods, instructions or products referred to in the content. |
© 2024 by the authors. Licensee MDPI, Basel, Switzerland. This article is an open access article distributed under the terms and conditions of the Creative Commons Attribution (CC BY) license (http://creativecommons.org/licenses/by/4.0/).
Copyright: This open access article is published under a Creative Commons CC BY 4.0 license, which permit the free download, distribution, and reuse, provided that the author and preprint are cited in any reuse.


