Submitted:
01 July 2024
Posted:
02 July 2024
You are already at the latest version
Abstract
Hyaluronic acid, in the form of a gel or viscoelastic colloidal solution, is currently used for viscosupplementation of joints affected by osteoarthritis, but its effectiveness is under debate in relation to newer alternatives. Based on meta-analytical arguments, the present article reinforces the opinion that there are still no decisive arguments for its complete replacement, but for its use adapted to the peculiarities of the disease manifestation and of the patients. A “broad” comparison is first made with almost all alternatives studied in the last decade, and then a meta-regression study is performed to compare and predict the effect size induced by viscosupplementation and platelet-rich plasma therapies. If they are computerized, the developed models can represent tools for clinicians in determining the appropriateness of the option or not for viscosupplementation, in a manner adapted to the pain felt by the patients, to their age, or to other clinical circumstances. The models were generated using the latest algorithms for meta-analysis and meta-regression implemented in the R language and assembled in different R packages. All primary data and necessary R scripts are provided in accordance with the philosophy of reproducible research. Finally, HA-based products, currently under circumspection, are still clinically useful.
Keywords:
hyaluronic acid
; viscosupplementation
; platelet-rich plasma
; osteoarthritis
; meta-analysis
; meta-regression
; reproducible research
1. Introduction
Osteoarthritis (OA) is a progressive degenerative disease of multifactorial etiology, characterized by joint stiffness, swelling, pain, and loss of movement. These symptoms arise from the loss of articular cartilage and periarticular bone remodeling. It is estimated that OA affects almost 500 million people worldwide (7% of the world population, approximately half of the world’s population over the age of 65) [1].
The knee is typically the joint most affected by osteoarthritis, followed by the hip, hand, spine, and feet. This high prevalence of knee osteoarthritis (KOA) is attributed to several factors such as: population aging, rising obesity rates, demographic growth, gender, diet and an increase in joint injuries. Among them, age often emerges as the most significant determinant of knee KOA onset and severity [2]. The primary therapeutical goals for patients suffering from KOA are to reduce pain, improve mobility, promote cartilage regeneration, and restore overall function [3]. In cases of advanced knee osteoarthritis, total joint arthroplasty is the recommended treatment option however, in the early stages of KOA a range of therapeutical options exist that can effectively alleviate the symptoms caused by the disease. These options include intra-articular administration of medications, or oral painkillers such as paracetamol, opioids, and non-steroidal anti-inflammatory drugs (NSAIDs). However, due to their high toxicity and low tolerance after long periods, intraarticular (IA) treatments are often preferred by clinicians and patients [4].
It is already accepted that, once initiated, there is no clinical intervention able to completely stop the advance, or to irreversibly cure OA [5,6]. One conservative treatment option for reducing patients’ symptoms caused by KOA consists in minimally invasive intra-articular injections. Among the many variants tested over the years [7], three types are currently applied: (i) injections for short-term pain relief (by using analgesics and anti-inflammatory drugs), (ii) injections for long-term suffering alleviation and/or mobility rehabilitation (that make use of NSAIDs, hyaluronic acid (HA), platelet-rich plasma (PRP), or various mixtures thereof with or without other small molecule drugs), and (iii) injections for the robust fight against inflammation through immunomodulation (by means of cortisol mimicking drugs, mesenchymal stem cells, ozone etc.).
Hyaluronic acid is one of the widely applicable products both for reducing the symptoms of OA and for delaying the structural deterioration of the joints. Once introduced into the synovial fluid, it mainly plays the role of joint lubricant and shock absorber. Since HA is naturally present in both healthy and injured articulations, the medical act of adding it by injection is called viscosupplementation of the synovial fluid.
To be used for viscosupplementation, HA is produced by controlled biosynthesis in recombinant bacteria cultures [8,9], then is formulated [10,11] or derivatized [12,13,14], and possibly crosslinked [15,16] to increase its resistance against intra-articular enzymatic degradation. As a result, HA sterile assortments having molecular weights of 20 to 1000 kDa (rarely up to 5000 kDa) and stable viscosity values of 0.1 to 1.1 Pa‧s [17] are available for clinical use. Commercial products incorporate HA gels (or elasto-viscous colloidal solutions) of 10 to 20 mg/mL, buffered to neutral pH and adjusted with salt to approximately 290 to 335 mOsm/kg, packaged in prefilled syringes with volumes of 1 to 4 mL per dose. The dosage of such a product is determined by the physician depending on the degree of damage of the joint, and on the joint size (the volume of synovial fluid it naturally contains). The intra-articular dosage of HA gels aims to increase the volume of synovial fluid up to the physiological levels, or even to replace it completely, once or periodically.
In medical practice, the main challenger of HA is the extemporaneously prepared autologous PRP [18]. The latter has, in most cases, the characteristics of a colloidal suspension or of a very loose physical gel, with apparent viscosities of the order of 0.01 Pa‧s [19]. It can be transformed into a platelet-rich plasma gel matrix (PRP-GM) by plasmatic proteins polymerization [20], in order to be directly administered, or to be further synergistically formulated along with HA, as complex structured gels applicable for viscosupplementation [21,22], prepared according the Cellular Matrix® technology (Regen Lab, Le Mont-sur-Lausanne, Switzerland) [23,24]. The amount of PRP per administered dose is usually adjusted to conform to the volume per dose of commercial HA products (1 to 4 mL). Variants of PRP derivatives have also been clinically tested, like the plasma rich in growth factors (PRGF) [25], or like platelet-rich plasma-derived growth factor (PGRF) [26], but their extemporaneous preparation is still too difficult to be widely applied.
One of the obstacles in evaluating the effectiveness of treatments in OA derives from the subjectivity of reporting the pain felt by the patient at the level of the joint, before and after the treatment. Even if objective assessment of the stage and evolution of OA is possible (for example by radiological imaging), it is not always feasible, mainly because of the costs involved by the instrumental investigations applied to large numbers of patients during clinical trials. Most clinical investigations still use subjective scales to assess joint pain and/or discomfort based on questionnaires completed by patients, according to the technique of self-reporting outcomes [27]. For this reason, the comparison and systematization of clinical studies in OA can only be done through meta-analyses and meta-regression, even these ones affected by a significant variability / heterogeneity / uncertainty when applied to pre- and post-treatment pain scores. Usually, the evaluating scales are highly peculiar, and no direct conversion between their scores is available, or even possible. However, this deficiency can be overcome by calculating the size effect of the treatment outcome, which is a dimensionless numerical value, thus being able to be the subject of statistical (and possibly narrative) comparison. The approaches based on meta-analysis techniques (which represents a framework for the statistical treatment of distinctive sources of information in order to substantiate an assessment or a decision, here of clinical value, usually by combining the results reported in several studies) are largely reported in order to (periodically) assess the changes in the acceptance of OA treatment options from the perspective of patients.
Score-based qualitative evaluation of OA status and stage has been frequently criticized, and several improvements have been proposed [28,29], especially to try to avoid the evaluation of unsimilar or divergent aspects of joint pain when distinctive scale and subscale are considered. Beside the newest scale, the Osteoarthritis Symptom Inventory Scale (OASIS), older ones are still used, like WOMAC (Western Ontario and McMaster Universities), VAS (Visual Analogue Scale), KOOS (Knee Injury and Osteoarthritis Outcome Score), or IKDC (International Knee Documentation Committee). The most perturbing issue when reports based on distinctive pain (sub)scales are used for meta-analysis consists in the significant differences in sensitivity of those (sub)scales in pain evaluation. Such differences increase the incertitude of the meta-analysis conclusions, and induce unjustified and improper biases between the compared clinical studies. Fortunately, modern meta-analysis methods are capable of highlighting (but not compensating for) differences of this type, by measuring the degree of randomness of the explanatory variables / factors involved (variables / factors that argue the magnitude of the calculated effect size) [30]. This kind of meta-analyses offer statistical models of multivariate mixed random-effects type, that estimate both the within-study and between-studies heterogeneity (intrinsic and extrinsic variability of the reported clinical studies) [31].
In the realm of current opinions about the clinical value and opportunity of applying HA viscosupplementation compared to modern OA treatment options, the present paper intend to (i) offer a general meta-analytic view about the status of HA clinical use according to the recently published studies, but also to (ii) deeper evaluate the relation between the outcomes of HA-based treatments and the achievements reported for the treatment option that seems to install it-self as the new referential in the OA pain alleviation, the PRP intra-articular injections. In this regard, our approach consists of performing a typical meta-analytic study combined with meta-regression, to generate and narratively exploit statistical models of the dependence of calculated effect sizes of clinical trials comparing HA viscosupplementation with recent (and for now “exotic”) alternative treatments. In this context, our work contributes to the formulation of a reasoned opinion regarding the opportunity of maintaining viscosupplementation among the clinically applicable treatment schemes, nuanced according to patient-related considerations, mainly to the way he/she feels and subjectively reports joint pain. In a broader perspective, we aim to bring meta-analytic arguments regarding the advisability of continuing studies on improving viscosupplementation by better HA-based products formulation.
2. Results and Discussion
The present paper applies some methods of the meta-analytic investigation of literature data to assess the position of clinicians regarding the effects of use and the utility of continuing to prescribe and perform viscosupplementation of synovial liquid with HA, in OA conditions. An intentionally heterogeneous set of papers published in the last ten years was collected and processed according to the PRISMA procedure [32]. The discrepancy of the set of papers originates from the wide variety of therapeutic attitudes towards OA pain alleviation methods, deliberately chosen to describe the present “landscape” of OA treatment trials. To gain value for practicing clinicians, our study then focuses on quantitatively comparing the effects offered by the two most applied non-pharmacological treatments, viscosupplementation and intra-articular autologous PRP injections.
2.1. The “wide landscape” of non-surgical osteoarthritis treatments, in meta-analytical terms
Meta-analysis statistically combines the results of different studies, aiming to benefit systematic reviews by generating summaries, both numerically and graphically. Several scenarios can be approached through meta-analysis, but all have in common the objective comparison, in abstract units, of the results reported in various sources of information (usually in scientific articles or in clinical trials). The comparison of the effects of distinct treatments can be done, for example, by comparing the effect sizes calculated as standardized mean differences (SMDs) of the measured results of the individual treatments. By doing so, the graphic way of comparing the reported effects of the treatments brought together in the systematic study of the literature carried out by us was obtained and depicted in Figure 1.
The two dashed lines delimit the range [-0.8, +0.8] on the abstract scale of the effect size beyond which the differences between the outcomes of the reference treatment (viscosupplementation with HA) and the alternative treatments are highly statistically significant.
Three of the included studies does not express a genuine comparison against viscosupplementation by HA injections. One of them, (Petrella, 2015), only reports the effect of applying or not the viscosupplementation. Another one, (Abate 2015), discuss the effect of using booster doses of HA to perform viscosupplementation, versus no other treatment. The third one, (Wang, 2021), compares HA treatment with placebo intra-articular injections. These three studies were included in the meta-analysis to serve as a reference for the effect size direction (sign), magnitude and dispersity. Such a reference is necessary because the relative size of the treatments effect is measured using subjective assessment scales, in some cases different from each other. In addition, statistical-mathematical modeling algorithms that use Bayesian inference methods require such starting information (including prior probabilities and their confidence intervals). The effect size of the viscosupplementation alone was chosen as the primary reference for the direction of the favorability of the treatment effects, while the dispersion reported for the booster treatment was used to calculate the potential magnitude of viscosupplementation. Comparison with placebo injections was used to establish the sensitivity of the subjective assessment made by patients suffering from OA by means of joint pain assessment scales.
Obviously, the “wide” comparison reflected in Figure 1 has only a qualitative meaning, indicating the relative position of the alternative treatments on the dimensionless scale of standardized mean differences (effects size). The overall effect size (the orange rhombus) depicted in the bottom line of the forest plot is slightly positive (placed at +0.17), but it does not have a definite informational value for two reasons: (i) the heterogeneity of the alternative treatments that were subjected to comparison, and (ii) the large width of the prediction interval (represented by the color segment gray), which extends between -2.25 and +2.75, an interval in which the predicted cumulative effect could be placed anywhere. From a statistical point of view, such a large prediction interval expresses a poor precision of the comparison between treatments, while in clinical terms it means a very low decidability on the opportunity to opt for / to elect a certain alternative treatment.
The high level of randomness of the comparison results [33] is also expressed by the value of the heterogeneity statistic (I2 = 97.6%), which represents the percentage of variability between the included studies (the amount of dispersion caused by the pooled / combined interpretation of the studies). Numerical values of I2 exceeding 75% indicate substantial heterogeneity of the meta-analysis study. Its complement up to 100% (= 2.4%) is assimilated to the general variability caused by sampling error within the studies. The second measure of heterogeneity, the τ2 value (= 1.53), describes the distribution of the true overall effect size about its central value (of 0.17), and can be considered as being an indicator of the neat randomness reflected by the meta-analysis. Its square root is an estimate of the standard deviation of the statistical distribution (presumed to be gaussian) of the true overall effect size.
A large heterogeneity in comparing studies usually results in misinterpretation of data and fitted models. Therefore, an accurate and cautious validation must be done in all stages of the analysis. A biunivocal relationship exists between heterogeneity and the study / model biasing [34]. Generally speaking, bias consists in the difference between the observed, expected or predicted value of an estimator and its true value. In meta-analysis, bias must be anticipated, if not prevented, to avoid a poor validity of the results. Conflicting or, on the contrary, disbalanced selection of studies to be analyzed represents one of the main sources of bias. There are three moments when bias can intervene in meta-analysis [35]: (i) the primary collection of studies, (ii) the selection of relevant studies, and (iii) the correct extraction of information from the selected studies. If for the first and last of the three situations there are algorithms to ensure their correct execution, the selection of the studies that will be analyzed represents the critical moment for the collaboration between clinicians and analysts, when the selection criteria must be agreed.
Meta-analysis studies affected by large heterogeneity are difficult (and sometimes futile) to interpret. Various methods are available to reduce heterogeneity, such as (i) (re)grouping / clustering the included studies based on common characteristics, (ii) removing outlier studies, (iii) reconsidering the reference treatments against which alternative treatments are evaluated, (iv) limiting the number of included studies and then modeling the resulting selection. In this paper, the last-mentioned method will be used. To do this, study selection criteria must be defined.
2.2. Criteria derived from a clinical perspective for limiting the selected studies
The “wide” meta-analysis described above comprised 30 studies reflecting comparisons of 12 different alternative treatments, covering the three general strategies of combating OA pain (short-term pain relief, long-term suffering relief, and periodic control of inflammation through immunomodulation, respectively), and both the pharmacological and non-pharmacological types of treatment. Viscosupplementation using HA is involved in all studies, as a reference treatment, or as the only treatment.
Leaving aside the “exotic” alternatives of scientific interest rather than immediate application value, the idea that intra-articular PRP injections outperform HA-based treatments has been validated in clinical practice [36], and has been argued by recently published meta-analyses [37,38,39,40]. Due to the fact that the mechanisms by which these two treatment options lead to the relief of joint pain in OA are distinctly different [41], the selection criteria of the studies that have in common the specific comparison of HA and PRP treatments must consider the maximum possible number of details of clinical studies. The reason lies in the need to redo all the comparisons in the specific terms of meta-analysis and of meta-regression. Therefore, the effect size of individual treatments must be (re)calculated, taking into account, in addition, information related at least to (i) patients-related data, (ii) the reported pain scores before and after treatments, and (iii) the administered doses and administration conditions (e.g. doses of HA and PRP should be similar in volume). In such a context, review articles should be excluded, as they do not include all the necessary details. Furthermore, few published articles contain all this information.
Based on the above discussed selection criteria, out of the set of 30 published studies previously analyzed in corpore, only eight lend themselves to meta-regression. One of them, (Hegab, 2023), can be considered as an outlier (because it refers to a very peculiar joint, the temporomandibular joint¸ which is injected according to a particular protocol), thus being eliminated as well. Consequently, the final selected set of studies, specifically dedicated to the HA and PRP pair of treatments, includes those listed in Table 1, along with the narrative results stated by the papers authors. The set of studies covers the entire typology of clinical situations in which the comparison of HA versus PRP is relevant.
2.3. Fitting meta-analytic models to the data extracted from the limited selection of studies
The relationship between treatment effects and the common characteristics of a set of clinical studies can be modeled in a way that is exploitable for further analysis and prediction. Meta-analytic models express the statistical-mathematical relationship between (i) the effects-size (or outcomes) calculated based on the information extracted from the selected studies, (ii) a set of variables that are common to all the studies involved, and (iii) terms which describe the heterogeneity affecting the analysis in progress. In other words, the cumulative effect size, playing the role of the dependent variable (because it is calculated by the model), is related by a mathematical function to some predictors (also named explanatory variables) that act as independent variables (because they are directly or indirectly selected or manipulated in the conducted studies). The mentioned function is always parasitized by summative errors, which represents the heterogeneity of the studies subjected to the meta-analysis, errors which are, in turn, statistical functions. Classical meta-analytic models are usually fitted by using meta-analysis algorithms. They are strongly affected by the presence of bias in studies, whatever its source. If a significant value of heterogeneity is noticed for these models, its origin can be identified and evaluated by meta-regression, which is an extension of the meta-analysis. Meta-regression can replace sub-group meta-analysis, when the dependent variable is continuous [42] (pp. 267–271).
Pragmatically, meta-analytic modelling is carried out in the following steps: (i) data extraction from the selected studies or publications, finalized by a detailed and complete set of necessary data, relevant for modelling, (ii) inventorying of available common information, in order to identify the most relevant variables that can act as predictors, (iii) defining the role and the hierarchy (based on the weight of the role) of identified predictors into the model structure, (iv) postulating and actually generating the model by using the appropriate algorithms, (v) testing the adequacy of the model and assessing the statistical significance of its coefficients. In the following, we will detail this modelling process for the case of the meta-analytic study applied to the previously selected set of seven studies.
A number of 35 studies were selected from 32 articles taken from the set of 140 which were analyzed according the PRISMA guidelines for literature reviewing. The entire set of articles is included in Table S1 of the Supplementary Materials. The information extracted from the selected studies are included in the Raw.data.txt ASCII file as an object that can be loaded into R interpreter [43] by using the command:

in the spirit of reproducible research [44]. After a first outlier articles removal, 30 studies were retained for further meta-analyzing. Based on this adjusted first selection, the “wide” meta-analytic comparison of the studies regarding OA pain alleviation was performed (depicted in Figure 1). The modeling was then applied to the narrow set of studies mentioned in Table 1. The ASCII file Data.selected.txt includes the corresponding R object which can be loaded by using the R command:

Different models were successively generated and diagnosed in order to obtain increasingly better accuracies of fitting the contribution of individual studies to the cumulative effect size, in the context of reducing the models heterogeneity by selecting appropriate sets of predictor variables. With the same aim of reducing heterogeneity, different variables were included in the successive models to provide information regarding their randomness (the characteristics of their statistical distributions). These latter mentioned variables were chosen to have clinical relevance, both individually and in pairs. The pairing of random variables took into account their nesting [45] according to clinical logic (see sub-section 4.4 of this paper).
Multilevel mixed-effects models type with multiple random effects were fitted using the metafor R package, then they were diagnosed and, as a particular way of diagnosis, their prediction was represented graphically.
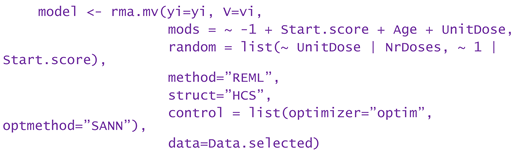
In the following, one of the models that offered a good fitting precision and a reasonably low level of heterogeneity will be described. The model in question considered three moderator (predictor) variables: the pain score at start, the patients average age, and the unit dose of HA or PRP administered as a single injection per treatment session. Three of the identified common variables in all studies and for all treated patients: unit dose, number of repeatedly administered doses, and the pain score at start, respectively, were taken in consideration to explain the random part and content of the model. The R command that generated the model had a structure similar to the simplified one below:
To facilitate reproducible research approaches, the R object corresponding to the above exemplified model is included in the ASCII file Example.model.txt, which can be loaded into R by using the instruction:

Th R script that exploit the model is included in the Supplementary Materials (the file Meta-analysis _ Exploitation of the model (Example).R).
that was fitted to the selected studies dedicated to PRP vs. HA efficacy meta-analysis.
The gray rhombuses (“diamonds”) represent the confidence intervals corresponding to the
individual studies, as predicted by the fitted model. Boundaries of clinical and statistical significance are drawn (the minimal clinically important difference (MCID = -0.37), and 0.8, the limit of high significant effects size) for both areas of favorability of the two types of treatment.
Figure 2 depicts the result (in the form of a “forest plot”) of the meta-regression applied to the above discussed exemplifying model, performed considering two continuous moderator variables (WOMAC pain score before treatments, and patients average age) and a discrete factor (administered unit dose). The graphic representation has a diagnostic role because it highlights the relationship between the confidence intervals calculated for the effects size of the individual studies (blue segments) and the confidence intervals of the effects size fitted by the model (gray rhombuses). The misalignments of the two confidence intervals are proportional to the fitting errors and expresses the effect of the heterogeneity of the studies on the predictive capacity of the model. In the particular case of the exemplifying model, the heterogeneity was reduced stepwise by taking into account the statistical parameters of the random variables mentioned in the model (pain score before treatments, unit doses and number of administered doses, the last two of discrete type). Residual heterogeneity is partially caused by the fraction of clinical studies inherently affected by uncertainty, which is expressed by the randomness of predictor variables (both moderators and those dedicated to the errors parametrization).
In general terms, multilevel mixed-effects models derive from random-effects models defined by relations of the following type [46]:
, weighted by , where , and . (1)
In the above equations, is the calculated / estimated outcome (here the cummulative size effect) associated by the model to study j, are the coefficients of the fitted linear model related to the i-th moderator variable, are the values of the i-th moderator variable in the j-th analyzed study, is the random “content” of the study j, is the sampling error associated to the j-th study, is the estimated variance for the j-th study, represents the estimated variance of between-study heterogeneity that is unexplained by the considered moderators, and is the calculated between-study variability (the variance of the true effects size). In addition, multilevel models also take into account the nesting of the declared random variables (~ inner | outer correlated random effects), by means of correlation coefficients between the inner and outer ones. For one and two such pairs, the coefficients are called and , respectively. Specifically, for example expresses the correlation between random effects of model variables that have the same level of the outer (if ) or of the inner (if ) imbriqued variable.
In particular, for the above-mentioned exemplifying model, its structure is as follows (yj represents the calculated effect sizes of the j-th study, and vj are their variance):
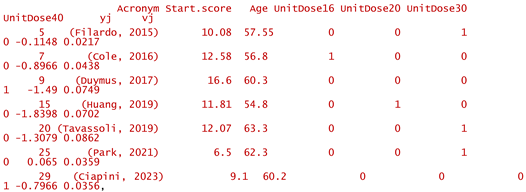
and the estimated coefficients, , have the values:
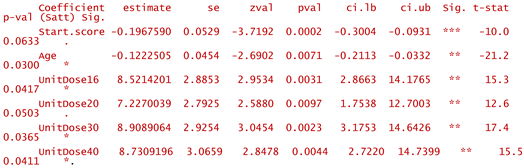
All coefficients are statistically significant (p < 0.05), and remain significant (p < 0.05) or near significant (p < 0.1) after applying the Satterthwaite correction for small samples. The coefficients expressing the heterogeneity, , are associated to the levels of discrete inner factor (unit dose) and have the values , , , and (see also the summarizing line in Figure 2). Except for the last value listed, that for unit doses of 40 mg per injection, the injected dose does not contribute significantly to explaining the heterogeneity of the meta-analytic study. The coefficient of the correlation between the inner and outer random variables, , is negative and has the value of -0.99846 (being basically -1), which, because both the inner and outer variables are discrete, indicates that multiple doses are favorable at any unit dose. In other words, for modeling it is not necessary to consider the nesting of the two variables.
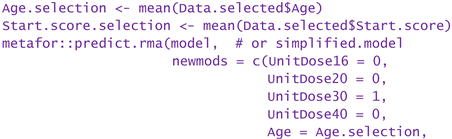
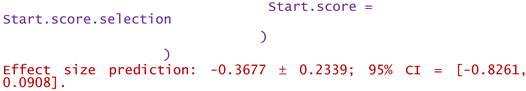
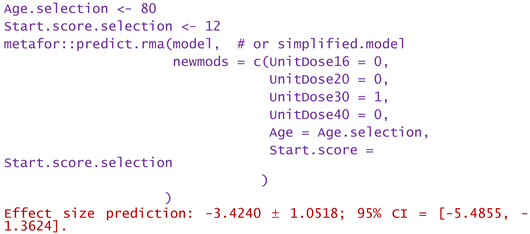
In conclusion, without significantly losing the accuracy of the modeling and without omitting the identification of important sources of heterogeneity, the model can be simplified. For example, the most frequently used unit dose (30 mg per injection) can be chosen, and its interdependence with the number of doses can be abandoned. Such numerical experiments (or “virtual studies”) can be performed by using the predict.rma function of metafor package, applied to either the original model or the simplified model. In the following, some examples of numerical experiments are provided.
Consider only unit doses of 30 mg HA or PRP per injection, and no nesting:
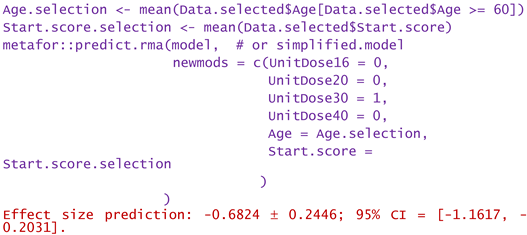
Same as above, but only patients over 60 years:
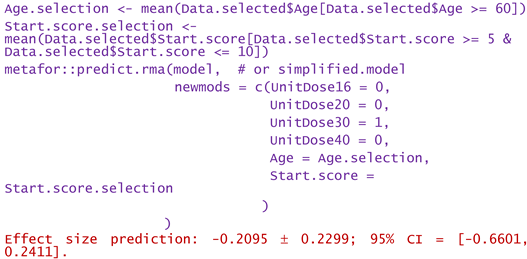
Same as above, but only WOMAC pain scores at start between 5 and 10:
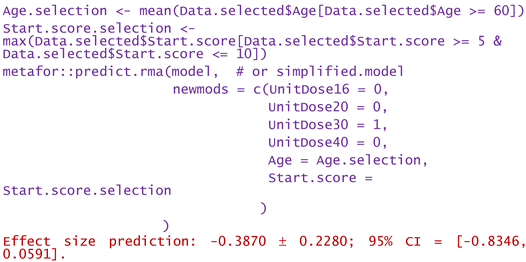
Same as above, but only the highest start WOMAC pain scores in the range of 5 to 10:
- -
- For a patient of aged 80 and reported WOMAC pain score of 12:
Dose of 16 mg administered to a patient of aged 50 and reported WOMAC of 6:
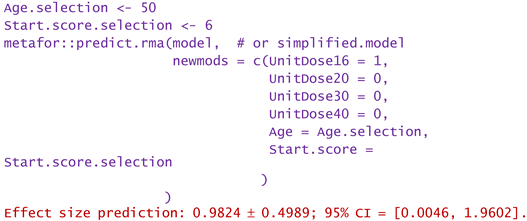
Predictions are reported as the calculated value of the effect size, in the hypotheses mentioned in the statement. Using them, clinicians can decide the degree of favorability of applying a certain injectable treatment in a wide variety of scenarios. If negative values are predicted, the alternative treatment (in particular the one using PRP) is more favorable in that circumstance. Positive predicted effects size indicates viscosupplementation as being more favorable. The higher the predicted absolute numerical values are, the more favorable is the choice of the treatment in question.
The more complex the validated meta-regression models are, the more sophisticated queries they can support, and the more elaborate and useful guidance they can provide. Therefore, detailed meta-analyses are useful, but only if accurate statistical validation of them is performed. However, the richer the meta-analysis/meta-regression is in predictor variables and the more such variables are included in the models, the more carefully and deeply their statistical validation needs to be done. Also, detailed checks must be performed in the preliminary stages of the meta-analysis. One such check is the publication bias of the articles/clinical studies considered and selected for modeling. The next section will address this issue, both graphically and using the Egger test.
2.4. Publication bias
Prejudgments and self-censorship are not uncommon in the process of publishing scientific papers. According to one of them, only (or predominantly) those studies reporting results with high statistical significance are published, disregarding the fact that (i) apparently less statistically convincing studies contain useful information, (ii) sometimes inadequate statistical investigations are carried out or are poorly interpreted, and (iii) even the studies that do not confirm the initial (statistical) hypotheses contain valid arguments. As a consequence, especially the optimistic or partisan articles are available to the scientific community or as official / formal clinical trials, the other studies remaining in the area of gray literature. This fact is detrimental to meta-analysis, as it determines the bias of the publications. For example, predominantly partisan studies related to new clinical attitudes can be found in the last decade, inducing the idea that older ones are inadequate, outdated, or comparatively even dangerous. The meta-analysis will, in such cases, be artificially/incorrectly unbalanced and will suggest an exaggerated heterogeneity, the sources of which are not found in the investigated data. For this reason, especially when the meta-analysis indicates large heterogeneities, it is necessary to check the degree of bias of the data that were collected from the available publications.
A widely used method to assess the effect of publication bias on meta-analysis results is the trim-and-fill procedure [47]. Due to its ability to explain the extent of heterogeneity of a collection of studies, it can also be used to discriminate between different models generated by meta-regression. The cut-and-fill procedure uses the funnel plot (a scatterplot that relates the precision of individual studies to their outcome) to detect publication bias and to suggest ways to compensate for it.
Figure 3 presents two variants of funnel plot, one dedicated to the studies precision (inverse of studies precision as a function of their calculated effect size), and the second dedicated to the studies robustness (sample size as a function of calculated effect size). Both are drawn after completing the set of studies through the trim-and-fill procedure, by adding two dummy studies. The sparse and wide distribution of study points indicate a large heterogeneity of the included studies. Practically all of them are placed outside of the “cone” of 95% confidence interval, suggesting that the between-studies variability is excessive, and, perhaps, a wide selection should be done. A probable cause of the heterogeneity derives from the large difference between the number of patients included in the selected studies (a three-fold difference). Due to the robustness disbalance of studies (the quasi-neutral study 1, (Filardo, 2015), being the more robust) the cumulative effect size (of -0.656 abstract units) still has a modest statistical relevance, even if it exceed the threshold of MCID. The imbalance is also reflected in the figures of asymmetry tests, as the presumed bias remains positive, even if a larger number of studies are placed to the left of the equivalent study represented by the calculated cumulative effect size. After the trim-and-fill procedure, the extended set of studies (the original ones plus two dummy studies appropriately chosen by the algorithm) seems to exhibits a four-fold reduced bias, from about 1.6 to about 0.4 (see the values of Harbord-Egger test in Figure 3).
In the context of the small volume of available studies, and because the dispersion of their results remains large even after the trimming and filling procedure, the heterogeneity of the studies most likely stems not only from publication bias, but also (and probably predominantly) from the variability of the studies selected to compare the effects of HA and PRP treatments. To confirm that the wide dispersion of study points in the funnel plot is mainly caused by between-study heterogeneity and only to a small extent by publication bias, in Figure 4 the pseudo confidence interval (which delimits the central green area) was incremented by the value of estimated residual heterogeneity. Compared to Figure 3 (generated using the R object associated with the equal-effects model included in Exmple.model.fix.EE.txt file in Supplementary Materials), the trim-and-fill procedure did not find it necessary to add, this time, additional study points. The meta-analytic random-effects model (whose R object is found in the Exmple.model.fix.REML.txt file) which is cappable to estimate the residual heterogeneity, , was fitted using the restricted maximum-likelihood estimator (REML) applicable for linear mixed models. The calculated cumulative effect size became more favorable for PRP treatment, the jump between the two models being from -0.66 to -0.89 simply by accounting for the identified/predicted residual heterogeneity.
In conclusion, based on the set of selected files, the ability to decide on the favorability of PRP treatment versus viscosupplementation remains modest. The reason consists in the fact that the studies from the last decade that report all the details necessary to conduct an independent meta-analysis are both few and discordant.
3. Conclusions
Even though newer alternatives for the treatment of (K)OA seem to offer better results (reported as effect size in contrasting clinical trials) compared to viscosupplementation, HA-based treatments retain some of their advantages, mainly stemming from the similarity of exogenous HA to the synovial fluid that is physiologically present in the joints. Since recent articles call into question the appropriateness of HA-based treatments of (K)OA (for example reference [63], which states: "The findings do not support broad use of viscosupplementation for the treatment of knee osteoarthritis."), this paper tried (i) to put viscosupplementation in a wider context of the treatments proposed or argued in the last ten years, and then (ii) to compare viscosupplemenation with its main alternative, autologous PRP. The overall aim was to help build an opinion on whether HA-based products are worth manufacturing and developing/formulating further, or whether they have come to an end. Our conclusion, not surprising and in line with other opinions, is that the clinical studies published in the scientific literature do not yet decisively lean towards the abandonment of viscosupplementation, but that autologous PRP is a more feasible alternative for severe cases and for elderly patients. As a tool for clinicians, we have developed exemplifying meta-analytic models, which can be useful in substantiating a treatment option. The models in question can be extended if additional clinical data will be accumulated, either through the current interaction with the patients (observational or case-control studies) or through comparative clinical studies (treatment trials).
4. Methods of statistical investigation
Our work focused mainly on the literature that reports systematic studies on the (K)OA medical conditions treated comparatively by viscosupplementation with neat HA (in the form of gels or elasto-viscous colloidal solutions) and by its newer alternatives. Original and review articles published on this topic were collected for the period of the last ten years (2014 – 2023), from four of the top rated scientific papers repositories. The full list of consulted articles is included in Table S1 of the Supplementary Materials.
4.1. The retrospective study in PRISMA terms
The present study uses the PRISMA (Preferred Reporting Items for Systematic Reviews and Meta-Analyses) philosophy to construct a meta-analytic view of the position of HA use in the landscape of modern alternatives that could replace viscosupplementation in clinical practice. It combines retrospective literature study, meta-analysis and meta-regression approaches, even if it is not a genuine systematic review, but a gradual processing of clinical information in the PRISMA spirit.
The phased selection and processing of the information found in the articles of potential interest for the successive stages of our study was performed according to the PRISMA guidelines, in their 2020 statement version [32]. The PRISMA flowchart of the procedure of information selection is depicted and quantitatively detailed in Figure 5 (which was generated based on the template from the WEB address https://www.prisma-statement.org/prisma-2020-flow-diagram). Since the objective of our study was not to carry out a comprehensive systematic review, the Prisma 2020 Checklist was only selectively covered.
The initial grouping of articles was subjected to a systematic analysis in order to identify those that provide the full set of information and numerical data needed to successfully apply meta-analysis and meta-regression on the calculated effect size of (K)OA comparative treatment. Following the two-stage systematic analysis, only about 25% of the initially selected articles were retained. As a general rule, review papers were excluded. A second group of articles was selected from the first one considering the presence in their content of a reported comparison between the effects of viscosupplementation (as a reference treatment) and the classically prepared PRP (as an alternative treatment). This second criterion was chosen considering the immediate clinical applicability of the two treatment options. Information on the number of patients involved, the initial and final pain scores reported, and the standard deviation of the corresponding scores were considered mandatory for the second selection stage, fact that acted as a drastic constraint (only about 5% of the collected articles were qualified under these conditions for the final analysis and modeling).
Tasks related to the retrospective study were seconded by R packages metagear v0.7 [48], PRISMA2020 v1.1.1 [49] and PRISMAstatement v1.1.1 [50], under R language (R version 4.4.0) [51] and the integrated development environment (IDE) RStudio 2024.04.1+748 for Windows [52]. The R interpreter, RStudio IDE and all packages are freeware software applications that can be downloaded from the WEB portals https://cran.r-project.org/ and https://posit.co/products/open-source/rstudio/.
4.2. The process of selecting articles of interest
From the pool of 197 references collected, 140 were systematized as a first step. Next, two succesive screening steps yielded a group of 57 original papers that include the information needed to compare HA-based treatments of (K)OA with different types of alternative tratments. Screening was operated starting from the requirement of gathering all the numerical data needed to calculate the effect size of the comparison treatment. As an additional step, of the 57 articles, 30 studies were identified as discussing significant alternative treatments. Among them, 7 are dedicated to the alternative pair HA versus PRP.
4.3. The semi-quantitative synthesis of comparison data by meta-analysis
A meta-analytic investigation was performed, first, on the heterogeneous set of the 30 studies dealing with a diversity of alternatives to HA-based treatment (12 in number). All three types of (K)OA pain alleviation types (by means of anti-inflanatory medication, intra-articular injections and immuno-modulators, respectively) were considered. In addition, three non-comparative / non-alternative reports on the effect of HA on pain were included, one against a placebo-type intra-articular injection, and two considering no alternative treatment: HA alone, and HA booster doses, respectively. Their role in the meta-analysis was that of referential for the effect size magnitude of the HA-based viscosupplementation.
Meta-analysis and adjacent calculations were performed using scripts written in the R language (R version 4.4.0) [43] under RStudio IDE (RStudio 2024.04.1+748 for Windows) [52]. The following R packages were used: metafor v4.6-0 [53], clubSandwich v 0.5.10 [54], TOSTER v0.8.3 [55] and their dependencies for optimization calculation and graphic representation, together with several complementary packages like compute.es v0.2-5 [56], effectsize v0.8.8 [57], esc v0.5.1 [58], openxlsx2 v1.7 [59].
The effect size of all treatment options, comparative or not, were calculated under the hypothesis of unequal variance [60], as standardized mean difference (SMD), with the necessary correction for small samples [42] (pp. 157–158, 582–584), ω, computed in R by using the expression (deduced from the suggestions of the reference [61]):

where the degree of freedom is df = (ntreatment - 1) + (nreference - 1), taking into account the number of patients treated with HA and with the alternative option, respectively. Two types of thresholds were used to judge the magnitude of the significance of the calculated effect size, one considering statistical and the second considering clinical terms, both expressed in abstract units. Statistically, the threshold was 0.8, which, according to Cohen’s convention, means “significantly large effect size values” [62]. All effects size exceeding ±0.8 were considered large enough to put in evidence a statistically significant difference between the treatment options being compared. In clinical terms, the threshold was adopted from reference [63] (Web-appendices 6 and 5) at the value of -0.37. It represents the minimal clinically important difference (MCID) between the treatment options compared in cases of KOA, when the reference treatment was viscosupplementation, and the outcome was the post-treatment pain intensity. Calculated effect size values exceeding ±0.37 were considered to significantly tip the balance towards the alternative treatment (in the case of negative values) or towards the HA-based treatment (when the effect size values were positive). The two conventions mentioned regarding the thresholds were applied both for the effect size in individual studies and for the cumulative effect size calculated by meta-analysis. Testing whether the calculated effect sizes exceeded the thresholds of statistical and/or clinical interest was performed using the procedure of two one-side test (TOST), offered by the functions in the TOSTER R package [55], which also provide the confidence (and prediction) interval for the standardized mean difference between the compared treatments. Finally, the statistical decision was objectified based on the position of the threshold values in relation to the calculated confidence interval (by means of calculated p-values, but also by graphical representation).
4.4. The quantitative synthesis of comparison data by dedicated meta-analysis and meta-regression
In order to specifically compare the outcomes of the two most clinically applied injectable pain treatments in cases of (K)OA, (i) the HA-based viscosupplementation of synovial fluid and (ii) the chondrocytes stimulation by PRP, information from the seven original papers devoted to this topic in the last ten years was used. The apparently small number of these articles is the consequence of a preliminary stage in which "outlier studies" were eliminated from the selection obtained in the screening stage of the PRISMA procedure. Those studies referring to discordant clinical situations, such as the cases of joints with different net volumes of synovial fluid (as temporomandibular joint compared to the knee), or unsimilar injection regimen (too different sequences, frequencies and/or cadence of administration) between HA and PRP treatment, were considered as being “outliers”. In statistical terms, keeping “outliers” in the selection lead to an artificial increase in the variability of the results, while in clinical terms, there is obviously a modest plausibility of the comparison. Therefore, in both circumstances, inadequate statistical models will result.
Useful information for interpreting the direction and amplitude of differences between the compared treatments (such as HA versus PRP) can be obtained by fitting meta-analytic models. Such models mathematically relate the meta-analyzed outcome (here the effect size of the considered studies) to a set of influencing factors selected from those that were included in the systematic PRISMA retrospective study. In our work, mixed-effects models were considered, which include both individual and hierarchical variables acting as predictors (also called moderators), some of which are affected by randomness. In simple terms, moderators are those study variables that are believed, based on clinical experience, to be able to explain the variability in the effect size of the individual studies being compared by meta-analysis (or the heterogeneity of the fitted model). Moderators can be continuous variables (such as pain scores, patient age, body mass index, gender percentage, etc.), or discrete factors (like the unit doses imposed by the characteristic of the administered product, number of administered doses, administration interval, etc.). Discrete factors are categorical variables, and some of them may be interrelated according to a logical hierarchy of interdependence. As an example, number of administered doses depends on the amount (volume, mass, concentration) of the unit dose of the product chosen to be administered. In statistical terms the two mentioned factors are imbricated (nested), one of them being the outer one (here the number of doses), and the other the inner one (here the unit dose, which is nested by the number of doses). In addition, the rule for selecting the levels of nested moderators (influencing factors) may operate as a function of, or correlated with, another variable or factor that is intrinsically random. In this context frequently encountered in clinical practice, the grouping of nested factors must also be treated as a random variable. For this reason, the model fitting algorithm must be "informed" about the randomness of the group of nested factors, as well as about the random variable that induced the respective status of the grouping.
Due to the complexity of the fitting situations, mixed-effects models are highly sensitive to the way of defining the type, nature and possible intercorrelation of their variables. If these are poorly "explicit", the model will hardly converge to a solution, will be modestly adequate, will provide coefficients with modest levels of significance and will only vaguely adjust the size-effect in the meta-analysis. In addition, optimization algorithms are used in the fitting procedure of mixed-effect models. In turn, these algorithms are sensitive to the starting conditions (initial parameters of the "problem" description) and to the size of the variation step. In order to reduce the risk of poor fitting, in our work we used optimization algorithms that possess self-adjustment mechanisms (Hooke-Jeeves derivative-free minimization algorithm, and simulated annealing method). Some assumptions must be satisfied when mixed-effects models are fitted, like the linearity of dependence of outcome on influencing variables / factors, absence of outliers in terms of variables values / factors levels, absence of multicollinearity between variables or factors, and the normal distribution of the models residuals.
The metafor R package includes versatile fitting functions applicable to the generation of mixed-effects models in the context of quantitative meta-analysis. It also includes functions for diagnosis, graphic representation and interpretation of this type of models. In our work, we used the functions rma.uni, rma.mv, escalc, predict.rma, profile, forest, regplot, funnel. We also resorted to the coef_test and conf_int functions of the clubSandwich package. Statistical significance for all tests, analyses and predictions was set at p < 0.05.
Supplementary Materials
The following supporting information can be downloaded at: Preprints.org, Table S1: The full list of consulted articles; R objects and scripts in ASCII format (for reproducible research approaches): Raw.data.txt, Data.selected.txt, Example.model.txt, Exmple.model.fix.txt, Meta-analysis _ Exploitation of the model (Example).R.
Author Contributions
Conceptualization, S.S.M. and T.P.; methodology, S.S.M.; software, S.S.M.; validation, T.P., P.D.S.; formal analysis, S.S.M.; investigation, T.P. and S.S.M.; resources, P.D.S.; data curation, T.P. and S.S.M.; writing—original draft preparation, S.S.M.; writing—review and editing, S.S.M. and T.P.; visualization, T.P.; supervision, P.D.S.; project administration, T.P. All authors have read and agreed to the published version of the manuscript.
Funding
This research received no external funding.
Institutional Review Board Statement
Not applicable.
Conflicts of Interest
The authors declare no conflicts of interest.
References
- Prevalence of osteoarthritis, its causes, and prevention. Available online: https://www.medicalnewstoday.com/articles/prevalence-of-osteoarthritis (accessed on June 5, 2024).
- Gezer, H.H.; Ostor, A. What Is New in Pharmacological Treatment for Osteoarthritis? Best Pract. Res. Clin. Rheumatol. 2023, 37(2), 101841. [Google Scholar] [CrossRef] [PubMed]
- Liao, C.-D.; Chen, H.-C.; Huang, M.-H.; Liou, T.-H.; Lin, C.-L.; Huang, S.-W. Comparative Efficacy of Intra-Articular Injection, Physical Therapy, and Combined Treatments on Pain, Function, and Sarcopenia Indices in Knee Osteoarthritis: A Network Meta-Analysis of Randomized Controlled Trials. Int. J. Mol. Sci. 2023, 24(7), 6078. [Google Scholar] [CrossRef] [PubMed]
- Householder, N.A.; Raghuram, A.; Agyare, K.; Thipaphay, S.; Zumwalt, M. A Review of Recent Innovations in Cartilage Regeneration Strategies for the Treatment of Primary Osteoarthritis of the Knee: Intra-Articular Injections. Orthop J Sports Med 2023, 11(4), 23259671231155950. [Google Scholar] [CrossRef] [PubMed]
- Vaquero-Picado, A.; Rodríguez-Merchán, E.C. Intra-articular Injections of Corticosteroids and Hyaluronic Acid in Knee Osteoarthritis. In Comprehensive Treatment of Knee Osteoarthritis. Recent Advances; Rodríguez-Merchán, E.C., Gómez-Cardero, P., Eds.; Springer Nature Switzerland: Cham, Switzerland, 2020, pp. 25–29.
- Sconza, C.; Di Matteo, B.; Queirazza, P.; Dina. A.; Amenta, R.; Respizzi, S.; Massazza, G.; Ammendolia, a.; Kon, E.; de Sire, A. Ozone Therapy versus Hyaluronic Acid Injections for Pain Relief in Patients with Knee Osteoarthritis: Preliminary Findings on Molecular and Clinical Outcomes from a Randomized Controlled Trial. Int. J. Mol. Sci. 2023, 24(10), 8788. [CrossRef]
- Testa, G.; Giardina, S.M.C.; Culmone, A.; Vescio, A.; Turchetta, M.; Cannavò, S.; Pavone, V. Intra-Articular Injections in Knee Osteoarthritis: A Review of Literature. J Funct Morphol Kinesiol. 2021, 6(1), 15. [Google Scholar] [CrossRef] [PubMed]
- United States Patent 7060466 / 2006, Methods of producing hyaluronic acid using a recombinant hyaluronan synthase gene.
- Serra, M.; Casas, A.; Toubarro, D.; Novo Barros, A.; Teixeira, J.A. Microbial Hyaluronic Acid Production: A Review. Molecules 2023, 28(5), 2084. [Google Scholar] [CrossRef]
- European Patent EP3498262B1 / 2021, Hyaluronic acid injectable gel.
- United States Patent 11191776B1 / 2021, Hyaluronic acid formulation.
- United States Patent 10821131B2 / 2020, Pharmaceutical formulations comprising chondroitin sulfate and hyaluronic acid derivatives.
- United States Patent 11013813B2 / 2021, Conjugates of stanozolol and hyaluronic acid.
- Sturabotti, E.; Consalvi, S.; Tucciarone, L.; Macrì, E.; Di Lisio, V.; Francolini, I.; Minichiello, C.; Piozzi, A.; Vuotto, C.; Martinelli, A. Synthesis of Novel Hyaluronic Acid Sulfonated Hydrogels Using Safe Reactants: A Chemical and Biological Characterization. Gels 2022, 8, 480. [Google Scholar] [CrossRef] [PubMed]
- United States Patent 8846640B2 / 2014, Viscoelastic gels as novel fillers.
- United States Patent 10058499B2 / 2018, Sterilized composition comprising at least one hyaluronic acid and magnesium ascorbyl phosphate.
- Nichols, M.; Manjoo, A; Shaw, P.; Rosen, J. Rheological Properties of Commercially Available Hyaluronic Acid Products in the United States for the Treatment of Osteoarthritis Knee Pain. Clin Med Insights Arthritis Musculoskelet Disord. 2018, 11, 1179544117751622. [CrossRef]
- Murali, A.; Khan, I; Tiwari, S. Navigating the treatment landscape: Choosing between platelet-rich plasma (PRP) and hyaluronic acid (HA) for knee osteoarthritis management – A narrative review. JOREP 2024, 3, 100248. [CrossRef]
- Mitra, H.; Jayaram, P.; Bratsman, A.; Gabel, T.; Alba, K. Characterization and rheology of platelet-rich plasma. J. Rheol. 2020, 64(5), 1017–1034. [Google Scholar] [CrossRef]
- Godoi, T.T.F.; Rodrigues, B.L.; Huber, S.C.; Santana, M.H.A.; da Fonseca, L.F.; Santos, G.S.; Azzini, G.O.M.; Mosaner, T.; Paulus-Romero, C.; Lana, J.F.S.D. Platelet-Rich Plasma Gel Matrix (PRP-GM): Description of a New Technique. Bioengineering (Basel) 2022, 9(12), 817. [Google Scholar] [CrossRef] [PubMed]
- Zhao, J.; Huang, H.; Liang, G.; Zeng, L.; Yang. W.; Liu, J. Effects and safety of the combination of platelet-rich plasma (PRP) and hyaluronic acid (HA) in the treatment of knee osteoarthritis: a systematic review and meta-analysis. BMC Musculoskeletal Disorders 2020, 21, 224. [CrossRef]
- Gupta, A.; Sharma, S.P.; Potty, A.G. Combination of Platelet-Rich Plasma and Hyaluronic Acid vs. Platelet-Rich Plasma Alone for Treatment of Knee Osteoarthritis. Biomedicines 2023, 11, 2759. [Google Scholar] [CrossRef]
- Ciapini, G.; Simonetti, M.; Giuntoli, M.; Varchetta, G.; De Franco, S.; Ipponi, E.; Scaglione, M.; Parchi, P.D. Is the Combination of Platelet-Rich Plasma and Hyaluronic Acid the Best Injective Treatment for Grade II-III Knee Osteoarthritis? A Prospective Study. Adv. Ortop. 2023, 2023, 1868943. [Google Scholar] [CrossRef]
- Cellular Matrix®. Available online: https://www.regenlab.com/products/cellular-matrix/ (accessed on June 5, 2024).
- Saiz, L.C.; Erviti, J.; Learche, L.; Gutiérrez-Valencia, M. Restoring Study PRGF: a randomized clinical trial on plasma rich in growth factors for knee osteoarthritis. Trials 2023, 24, 37. [Google Scholar] [CrossRef]
- Fernandez-Fuertes, J.; Arias-Fernandez, T.; Acebes-Huerta, A.; Alvarez-Rico, D.; Gutierrez, L. Clinical Response After Treatment of Knee Osteoarthritis With a Standardized, Closed-System, Low-Cost Platelet-Rich Plasma Product. 1-Year Outcomes. Orthop J Sports Med, 2022; 10, 3, 23259671221076496. [Google Scholar] [CrossRef]
- Thirumaran, A.J.; Deveza, L.A.; Atukorala, I.; Hunter, D.J. Assessment of Pain in Osteoarthritis of the Knee. J. Pers. Med. 2023, 13, 1139. [Google Scholar] [CrossRef] [PubMed]
- Cedraschi, C.; Delézay, S.; Marty, M.; Berenbaum, F.; Bouhassira, D.; Henrotin, Y.; Laroche, F.; Perrot, S. "Let's talk about OA pain": a qualitative analysis of the perceptions of people suffering from OA. Towards the development of a specific pain OA-Related questionnaire, the Osteoarthritis Symptom Inventory Scale (OASIS). PLoS One, 2013; 8, 11, e79988. [Google Scholar]
- Sethi, V.; Anand, C.; Della Paqua, O. Clinical Assessment of Osteoarthritis Pain: Contemporary Scenario, Challenges, and Future Perspectives. Pain Ther 2024, 13, 391–408. [Google Scholar] [CrossRef] [PubMed]
- Hall, J.A.; Rosenthal, R. Choosing between random effects models in meta-analysis: Units of analysis and the generalizability of obtained results. Soc Personal Psychol Compass. 2018, 12, e12414. [Google Scholar] [CrossRef]
- Blázquez-Rincón, D.; Sánchez-Meca, J.; Botella, J.; Suero, M. . Heterogeneity estimation in meta-analysis of standardized mean differences when the distribution of random effects departs from normal: A Monte Carlo simulation study. BMC Med. Res. Methodol. 2023, 23, 19. [Google Scholar] [CrossRef] [PubMed]
- Page, M.J.; McKenzie, J.E.; Bossuyt, P.M.; Boutron, I.; Hoffmann, T.C.; Mulrow, C.D.; et al. The PRISMA 2020 statement: an updated guideline for reporting systematic reviews. BMJ 2021, 372, n71. [Google Scholar] [CrossRef]
- Huang, H. Combining estimators in interlaboratory studies and meta-analyses. Res Syn Meth. 2023, 14(3), 526–543. [Google Scholar] [CrossRef]
- Hönekopp, J.; Linden, A.H. Heterogeneity estimates in a biased world. PLoS One 2022, 17(2), e0262809. [Google Scholar] [CrossRef]
- Felson, D.T. Bias in meta-analytic research. J. Clin. Epidemiol. 1992, 45(8), 885–892. [Google Scholar] [CrossRef]
- Montañez-Heredia, E.; Irízar, S.; Huertas, P.J.; Otero, E.; del Valle, M.; Prat, I.; Díaz-Gallardo, M.S.; Perán, M.; Marchal, J.A.; del Carmen Hernandez-Lamas, M. Intra-Articular Injections of Platelet-Rich Plasma versus Hyaluronic Acid in the Treatment of Osteoarthritic Knee Pain: A Randomized Clinical Trial in the Context of the Spanish National Health Care System. Int. J. Mol. Sci. 2016, 17(7), 1064. [Google Scholar] [CrossRef]
- Han, Y.; Huang, H.; Pan, J.; Lin, J.; Zeng, L.; Liang, G.; Yang, W.; Liu, J. . Meta-analysis Comparing Platelet-Rich Plasma vs Hyaluronic Acid Injection in Patients with Knee Osteoarthritis. Pain Medicine 2019, 20(7), 1418–1429. [Google Scholar] [CrossRef]
- Tang, J.Z.; Nie, M.J.; Zhao, J.Z.; Zhang, G.C.; Zhng, O.; Wang, B. Platelet-rich plasma versus hyaluronic acid in the treatment of knee osteoarthritis: a meta-analysis. JOSR 2020, 15, 403. [Google Scholar] [CrossRef]
- Zhang, Q.; Liu, T.; Gao, Y.; Ni, J. Efficacy and safety of platelet-rich plasma combined with hyaluronic acid versus platelet-rich plasma alone for knee osteoarthritis: a systematic review and meta-analysis. JOSR 2022, 17, 499. [Google Scholar] [CrossRef]
- Chen, L.; Jin, S.; Yao, Y.; He, S.; He, J. Comparison of clinical efficiency between intra-articular injection of platelet-rich plasma and hyaluronic acid for osteoarthritis: a meta-analysis of randomized controlled trials. Ther Adv Musculoskelet Dis. 2023, 15, 1759720X231157043. [Google Scholar] [CrossRef]
- Murali, A.; Khan, I.; Tiwari. S. Navigating the treatment landscape: Choosing between platelet-rich plasma (PRP) and hyaluronic acid (HA) for knee osteoarthritis management – A narrative review. JOREP 2024, 3, 100248. [CrossRef]
- Higgins, J.P.T.; Thomas, J.; Chandler, J.; Cumpston, M.; Li, T.; Page, M.J.; Welch, V.A. (editors). Cochrane Handbook for Systematic Reviews of Interventions, 2nd ed., John Wiley & Sons, Chichester, UK, 2019.
- R Core Team (2024). R: A Language and Environment for Statistical Computing. R Foundation for Statistical Computing, Vienna, Austria. (https://www.R-project.org/).
- Alston, J.M.; Rick, J.A. A Beginner's Guide to Conducting Reproducible Research. Bull. Ecol. Soc. Am. 2021, 102(2), e01801. [Google Scholar] [CrossRef]
- Fernández-Castilla, B.; Jamshidi, L.; Declercq, L.; Beretvas, S.N.; Onghena, P.; Van den Noortgate, W. The application of meta-analytic (multi-level) models with multiple random effects: A systematic review. Behav Res 2020, 52, 2031–2052. [Google Scholar] [CrossRef]
- StataCorp. 2023. Stata 18 Meta-Analysis Reference Manual. Stata Press, College Station, TX, USA.
- Shi, L.; Lin, L. The trim-and-fill method for publication bias: practical guidelines and recommendations based on a large database of meta-analyses. Medicine (Baltimore) 2019, 98(23), e15987. [Google Scholar] [CrossRef]
- Lajeunesse, M.J. Facilitating systematic reviews, data extraction, and meta-analysis with the metagear package for R. Methods in Ecology and Evolution 2016, 7, 323–330. [Google Scholar] [CrossRef]
- Haddaway, N.R.; Page, M.J.; Pritchard, C.C.; McGuinness, L.A. PRISMA2020: An R package and Shiny app for producing PRISMA 2020-compliant flow diagrams, with interactivity for optimised digital transparency and Open Synthesis. Campbell Systematic Reviews 2022, 18(2), e1230. [Google Scholar] [CrossRef]
- Wasey, J.O. (2016) PRISMAstatement: Plot Flow Charts According to the "PRISMA" Statement. R package version 1.1.1 (https://cran.r-project.org/web/packages/PRISMAstatement).
- RStudio Team (2020). RStudio: Integrated Development for R. RStudio, PBC, Boston, MA. (http://www.rstudio.com/).
- Viechtbauer, W. Conducting meta-analyses in R with the metafor package. Journal of Statistical Software, 2010, 36(3), 1–48. (https://doi.org/10.18637/jss.v036.i03). [CrossRef]
- Pustejovsky, J. (2023). clubSandwich: Cluster-Robust (Sandwich) Variance Estimators with Small-Sample Corrections. R package version 0.5.10. (https://CRAN.R-project.org/package=clubSandwich).
- Lakens, D. Equivalence tests: A practical primer for t-tests, correlations, and meta-analyses. Social Psychological and Personality Science 2017, 1, 1–8. [Google Scholar] [CrossRef]
- compute.es. Available online: https://cran.r-project.org/web/packages/compute.es/index.html (accessed on May 2, 2024).
- Ben-Shachar, M.S.; Lüdecke, D.; Makowski, D. effectsize: Estimation of Effect Size Indices and Standardized Parameters. J. Open Source Softw. 2020, 5(56), 2815. [Google Scholar] [CrossRef]
- Lüdecke, D. (2019). esc: Effect Size Computation for Meta Analysis (Version 0.5.1). (https://CRAN.R-project.org/package=esc).
- Barbone, J.M.; Garbuszus J.M. (2024). openxlsx2: Read, Write and Edit 'xlsx' Files. R package version 1.7 (https://janmarvin.github.io/openxlsx2/).
- Higgins, J.P.T.; Thomas, J.; Chandler, J.; Cumpston, M.; Li, T.; Page, M.J.; Welch, V.A. (editors). Cochrane Handbook for Systematic Reviews of Interventions, 2nd ed., John Wiley & Sons, Chichester, UK, 2019.
- Borenstein, M.; Hedges, L.V. Effect sizes for meta-analysis. In The Handbook of Research Synthesis and Meta-Analysis, 3rd ed.; Cooper, H., Hedges, L.V., Valentine, J.C., Eds.; Russell Sage Foundation: New York, USA, 2019; pp. 207–243.
- Ahn, S.; Fessler, J.A. Standard Errors of Mean, Variance, and Standard Deviation Estimators. Technical Report, 2003, EECS Department, University of Michigan, Ann Arbor, MI, USA. (https://web.eecs.umich.edu/~fessler/papers/files/tr/stderr.pdf).
- Cohen, J. Statistical Power Analysis for the Behavioral Sciences, 2nd ed.; Lawrence Erlbaum Associates: New York, USA, 1988; pp. 24–27.
- Pereira, T.V.; Jüni, P.; Saadat, P.; Xing, D.; Yao, L.; Bobos, P.; Agarwal, A.; Hincapié, C.A.; da Costa, B.R. . Viscosupplementation for knee osteoarthritis: Systematic review and meta-analysis. BMJ 2022, 378, e069722. [Google Scholar] [CrossRef] [PubMed]
Figure 1.
The “wide” meta-analytic comparison of the studies regarding OA pain alleviation, published in 2014-2023 decade. Studies are inserted in chronological ascending order.
Figure 1.
The “wide” meta-analytic comparison of the studies regarding OA pain alleviation, published in 2014-2023 decade. Studies are inserted in chronological ascending order.
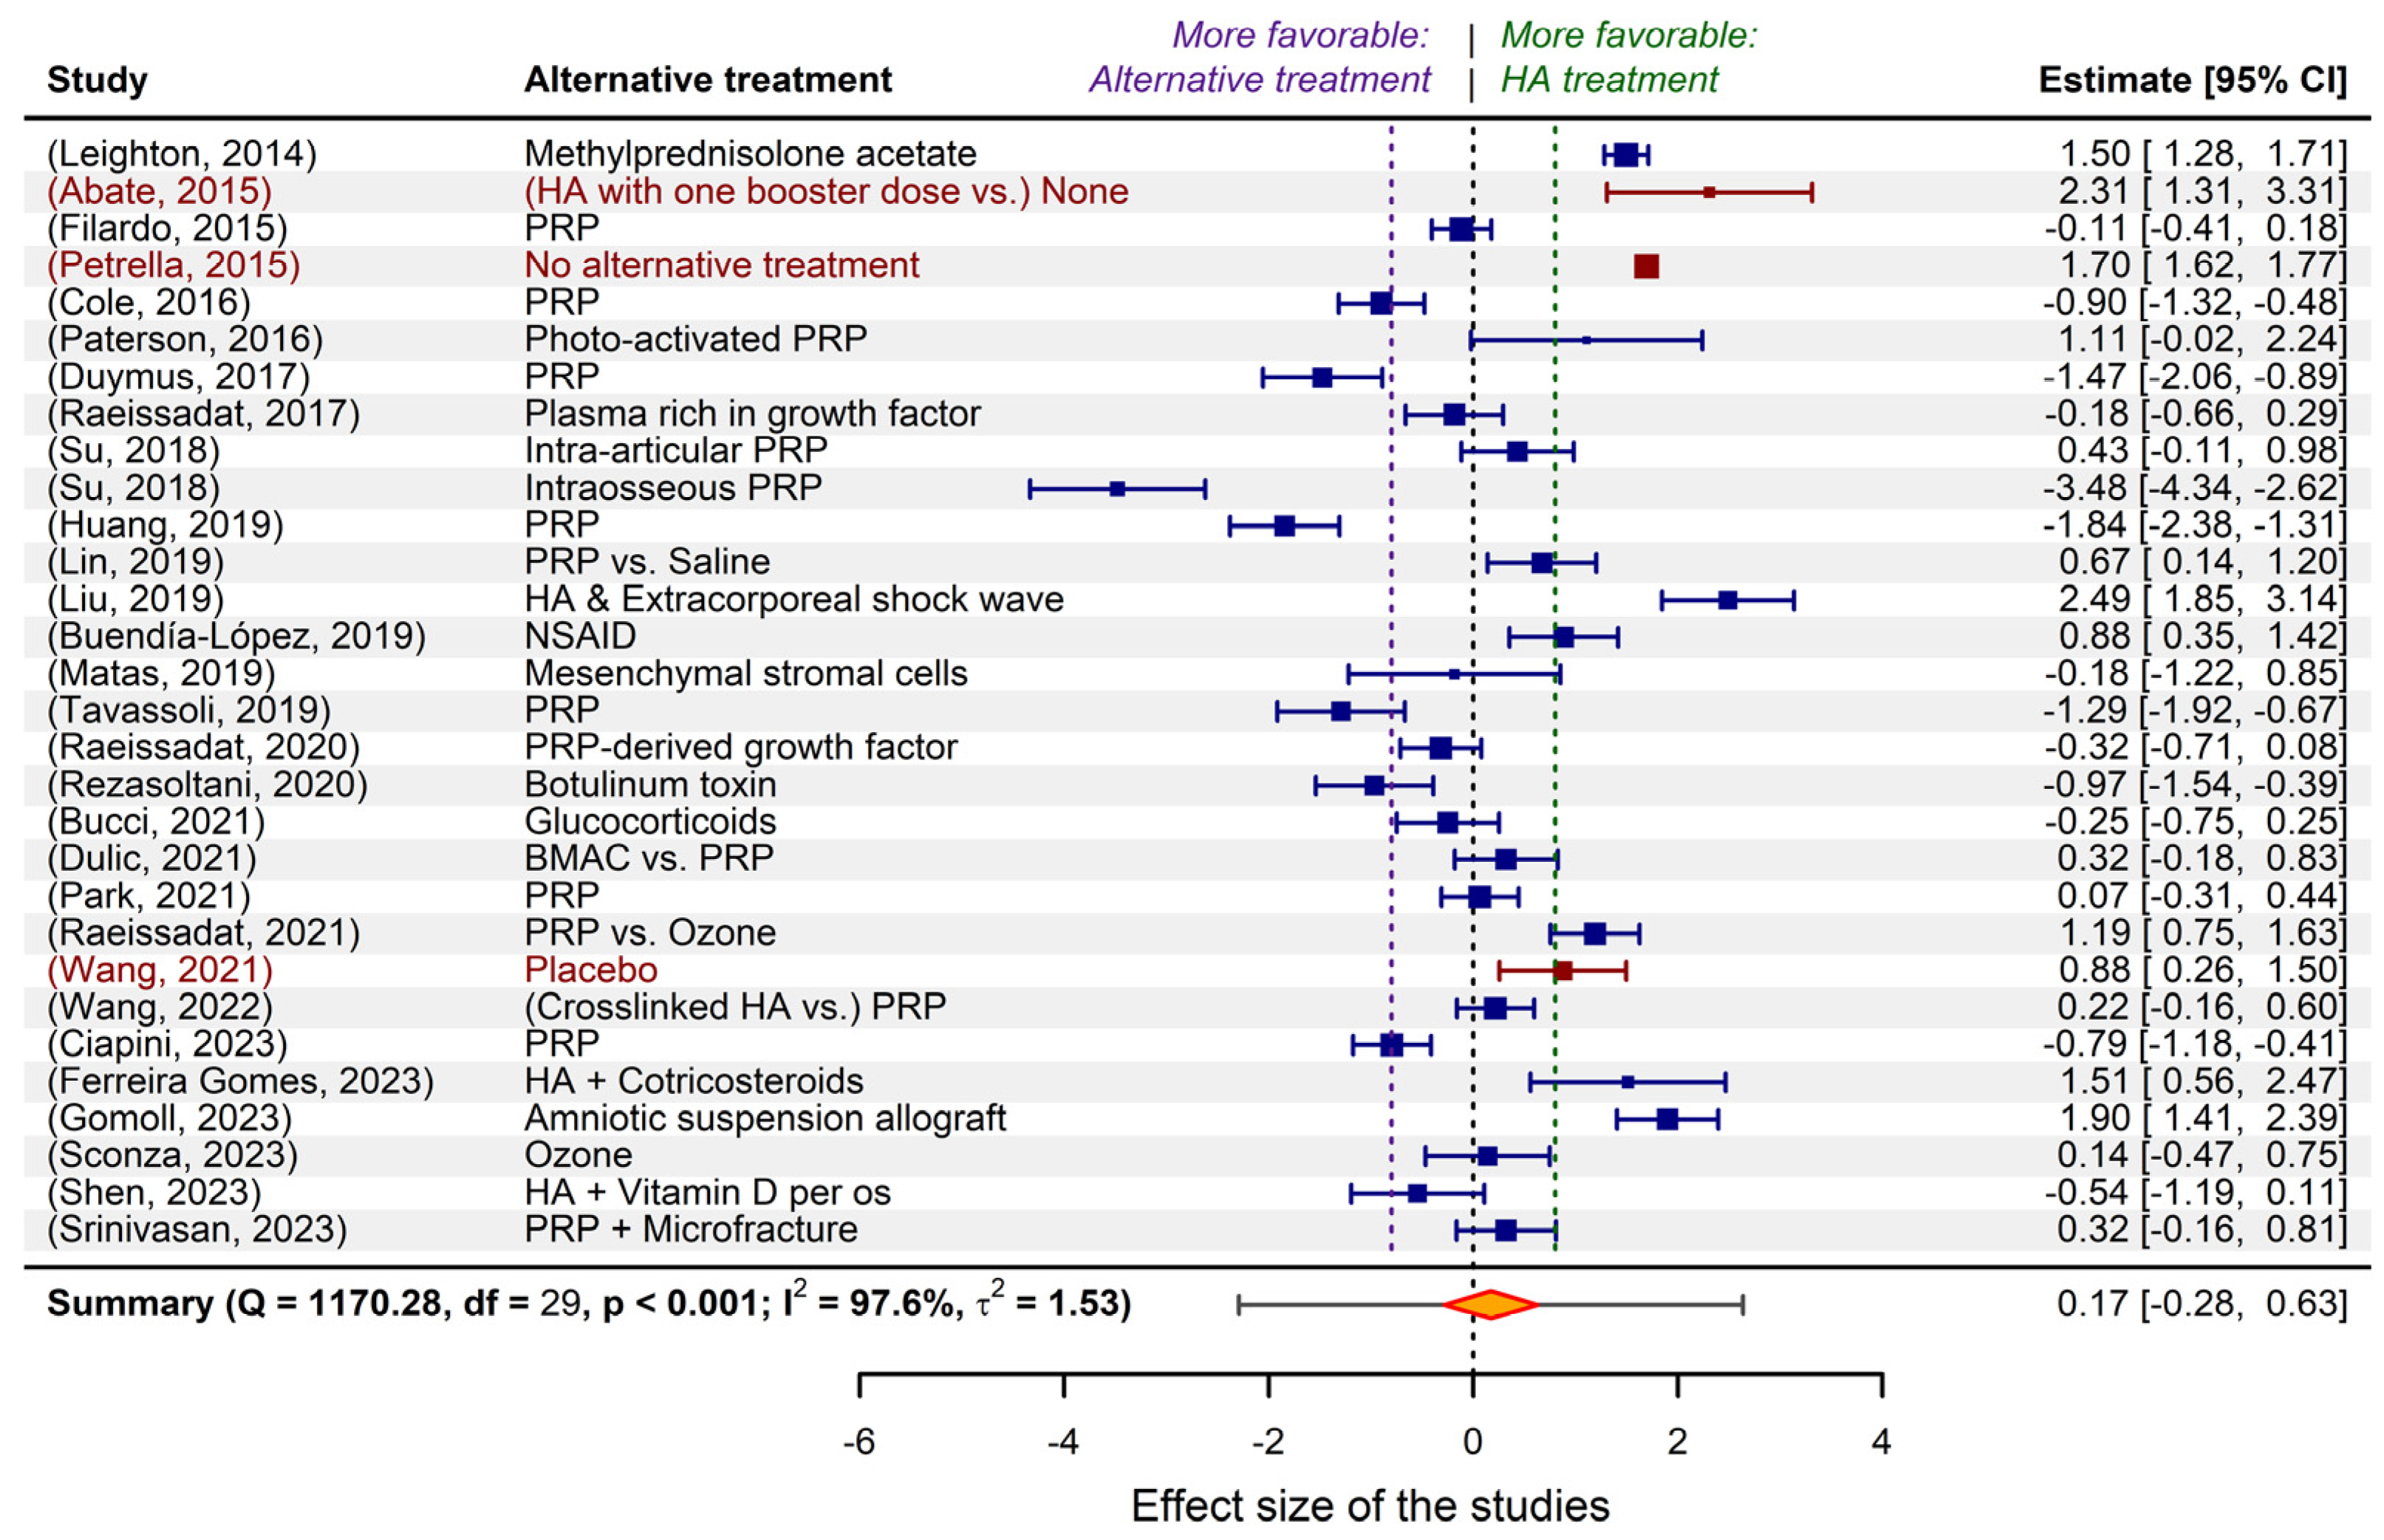
Figure 2.
The result of meta-regression applied to the exemplified model.
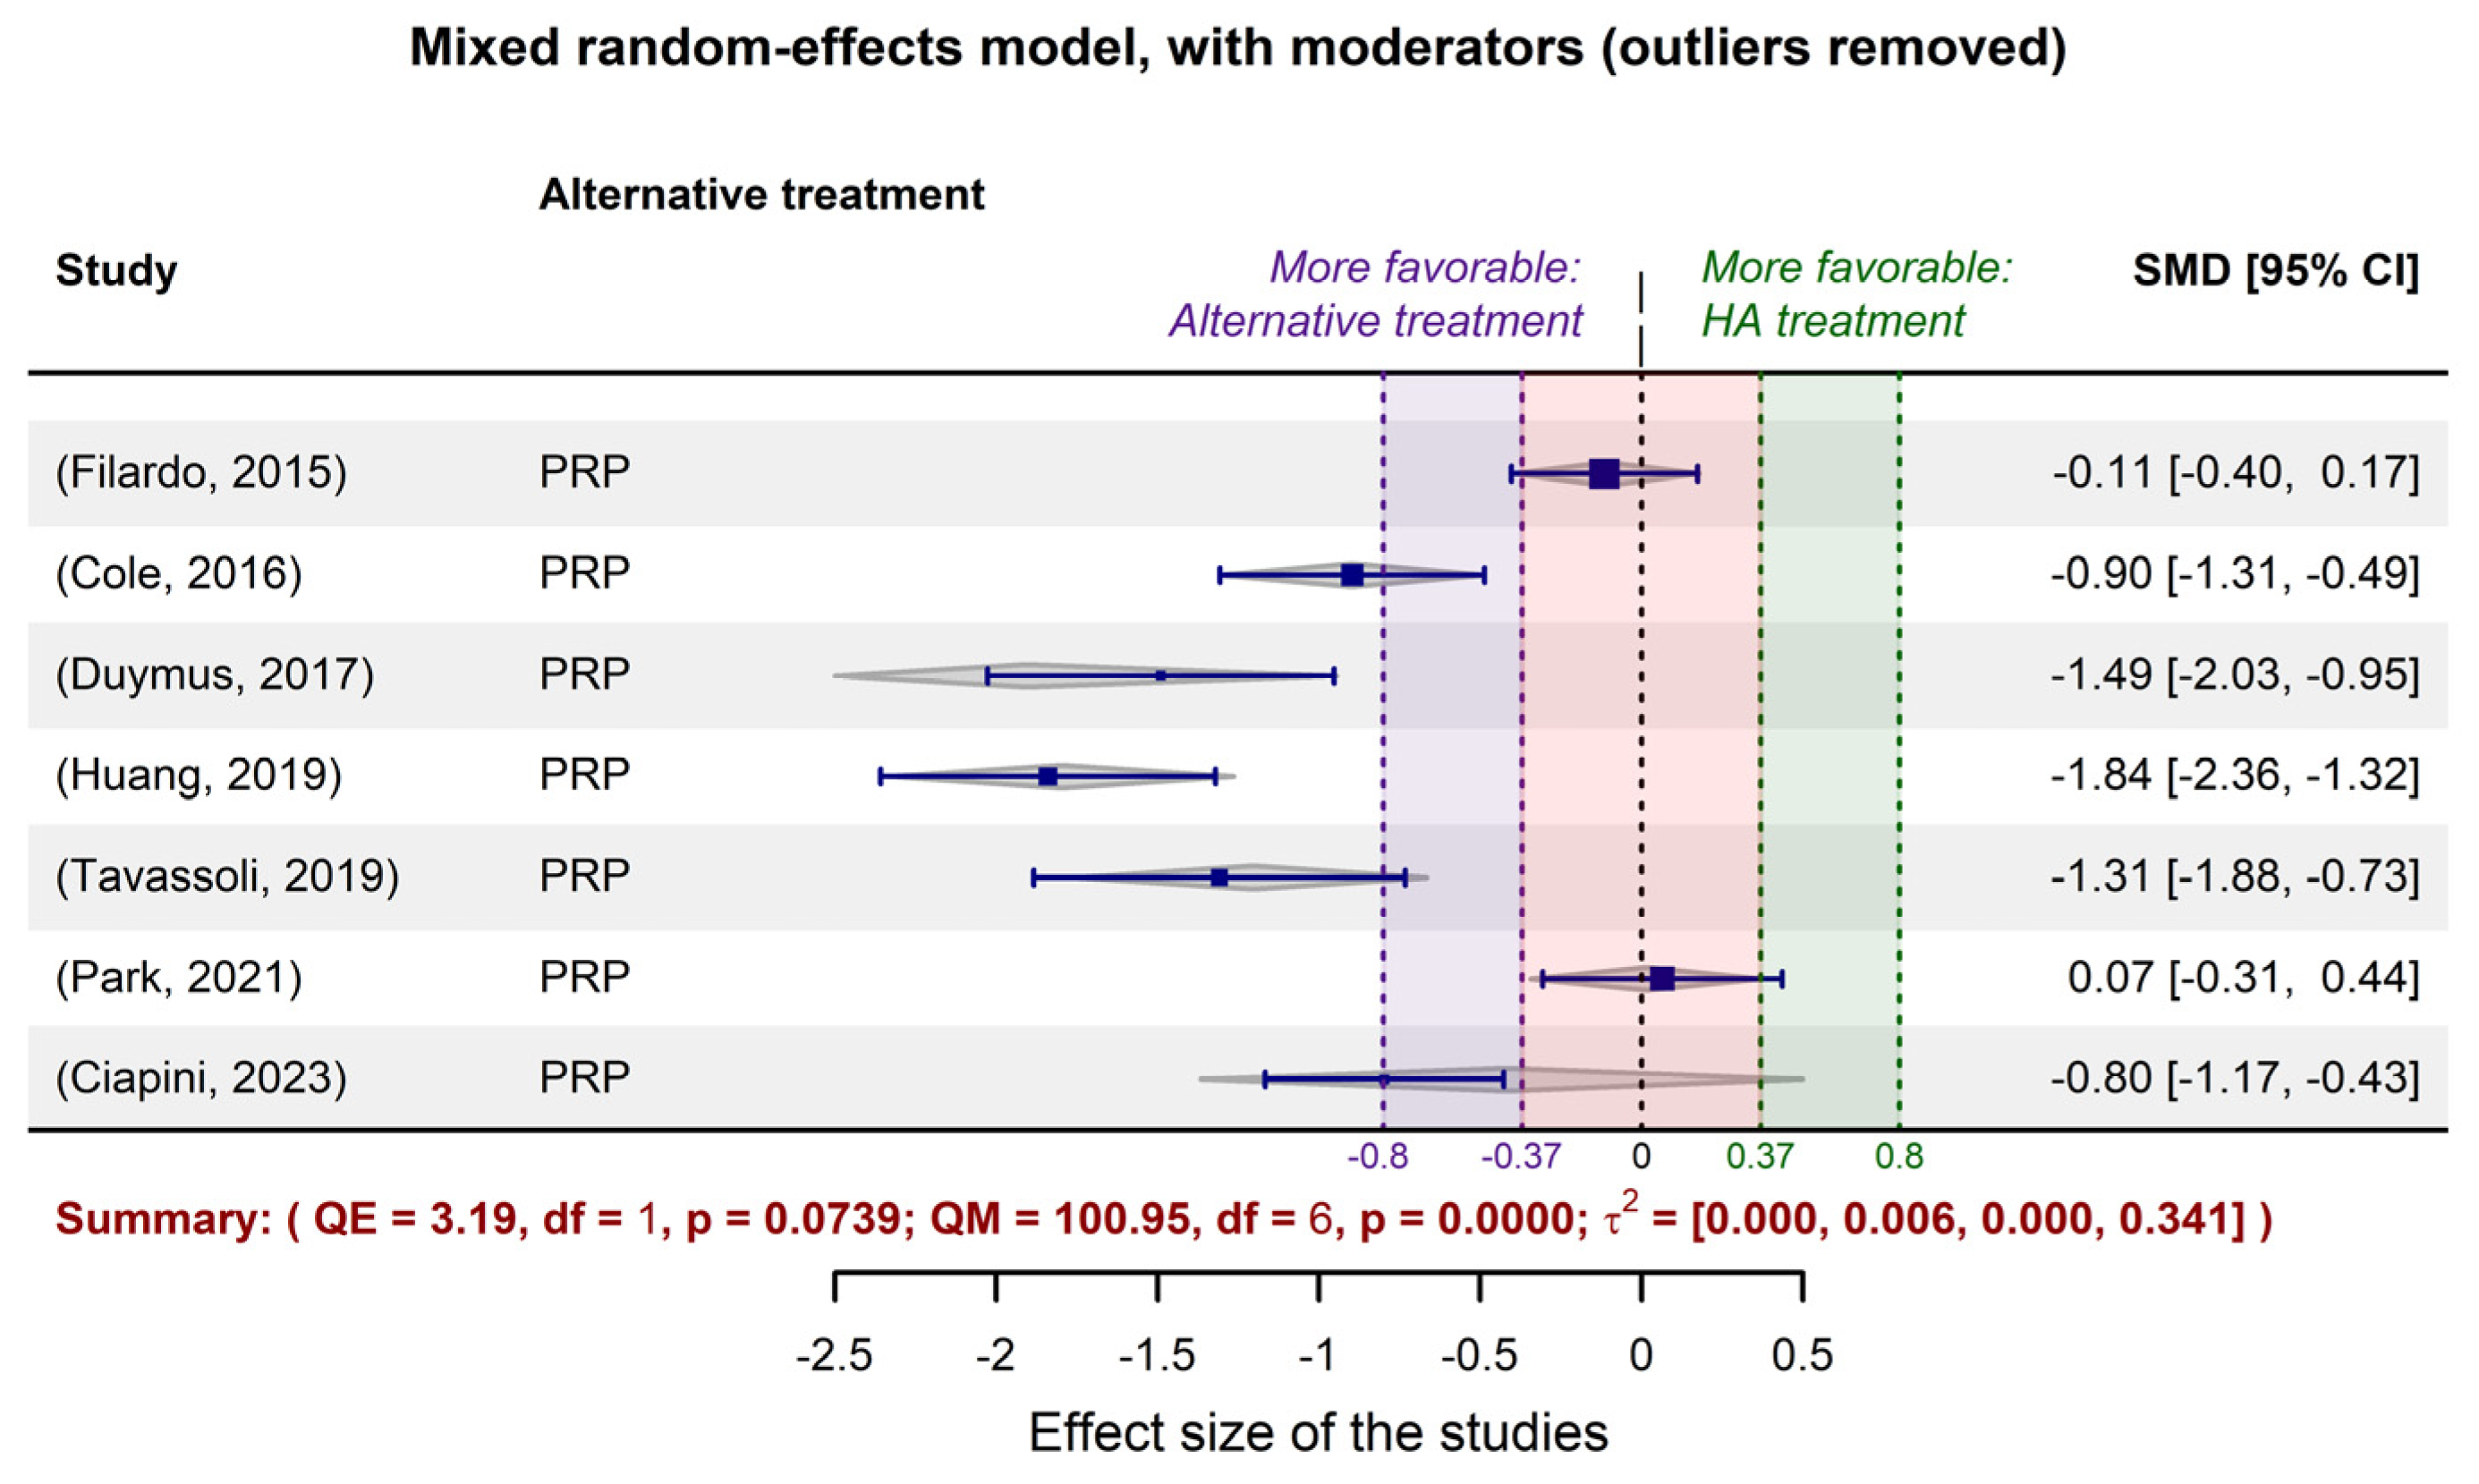
Figure 3.
The funnel plots associated to the equal-effects (method=”EE” in rma.uni function of metafor package) meta-regression performed for the exemplifying model discussed in the previous sections of the paper, after applying the trim-and-fill procedure. The precision (a) and robustness (b) of studies are depicted as a function of their calculated effect size. Harbord-Egger and Begg-Mazumdar asymmetry tests are included, for both pre- and post-adjustment.
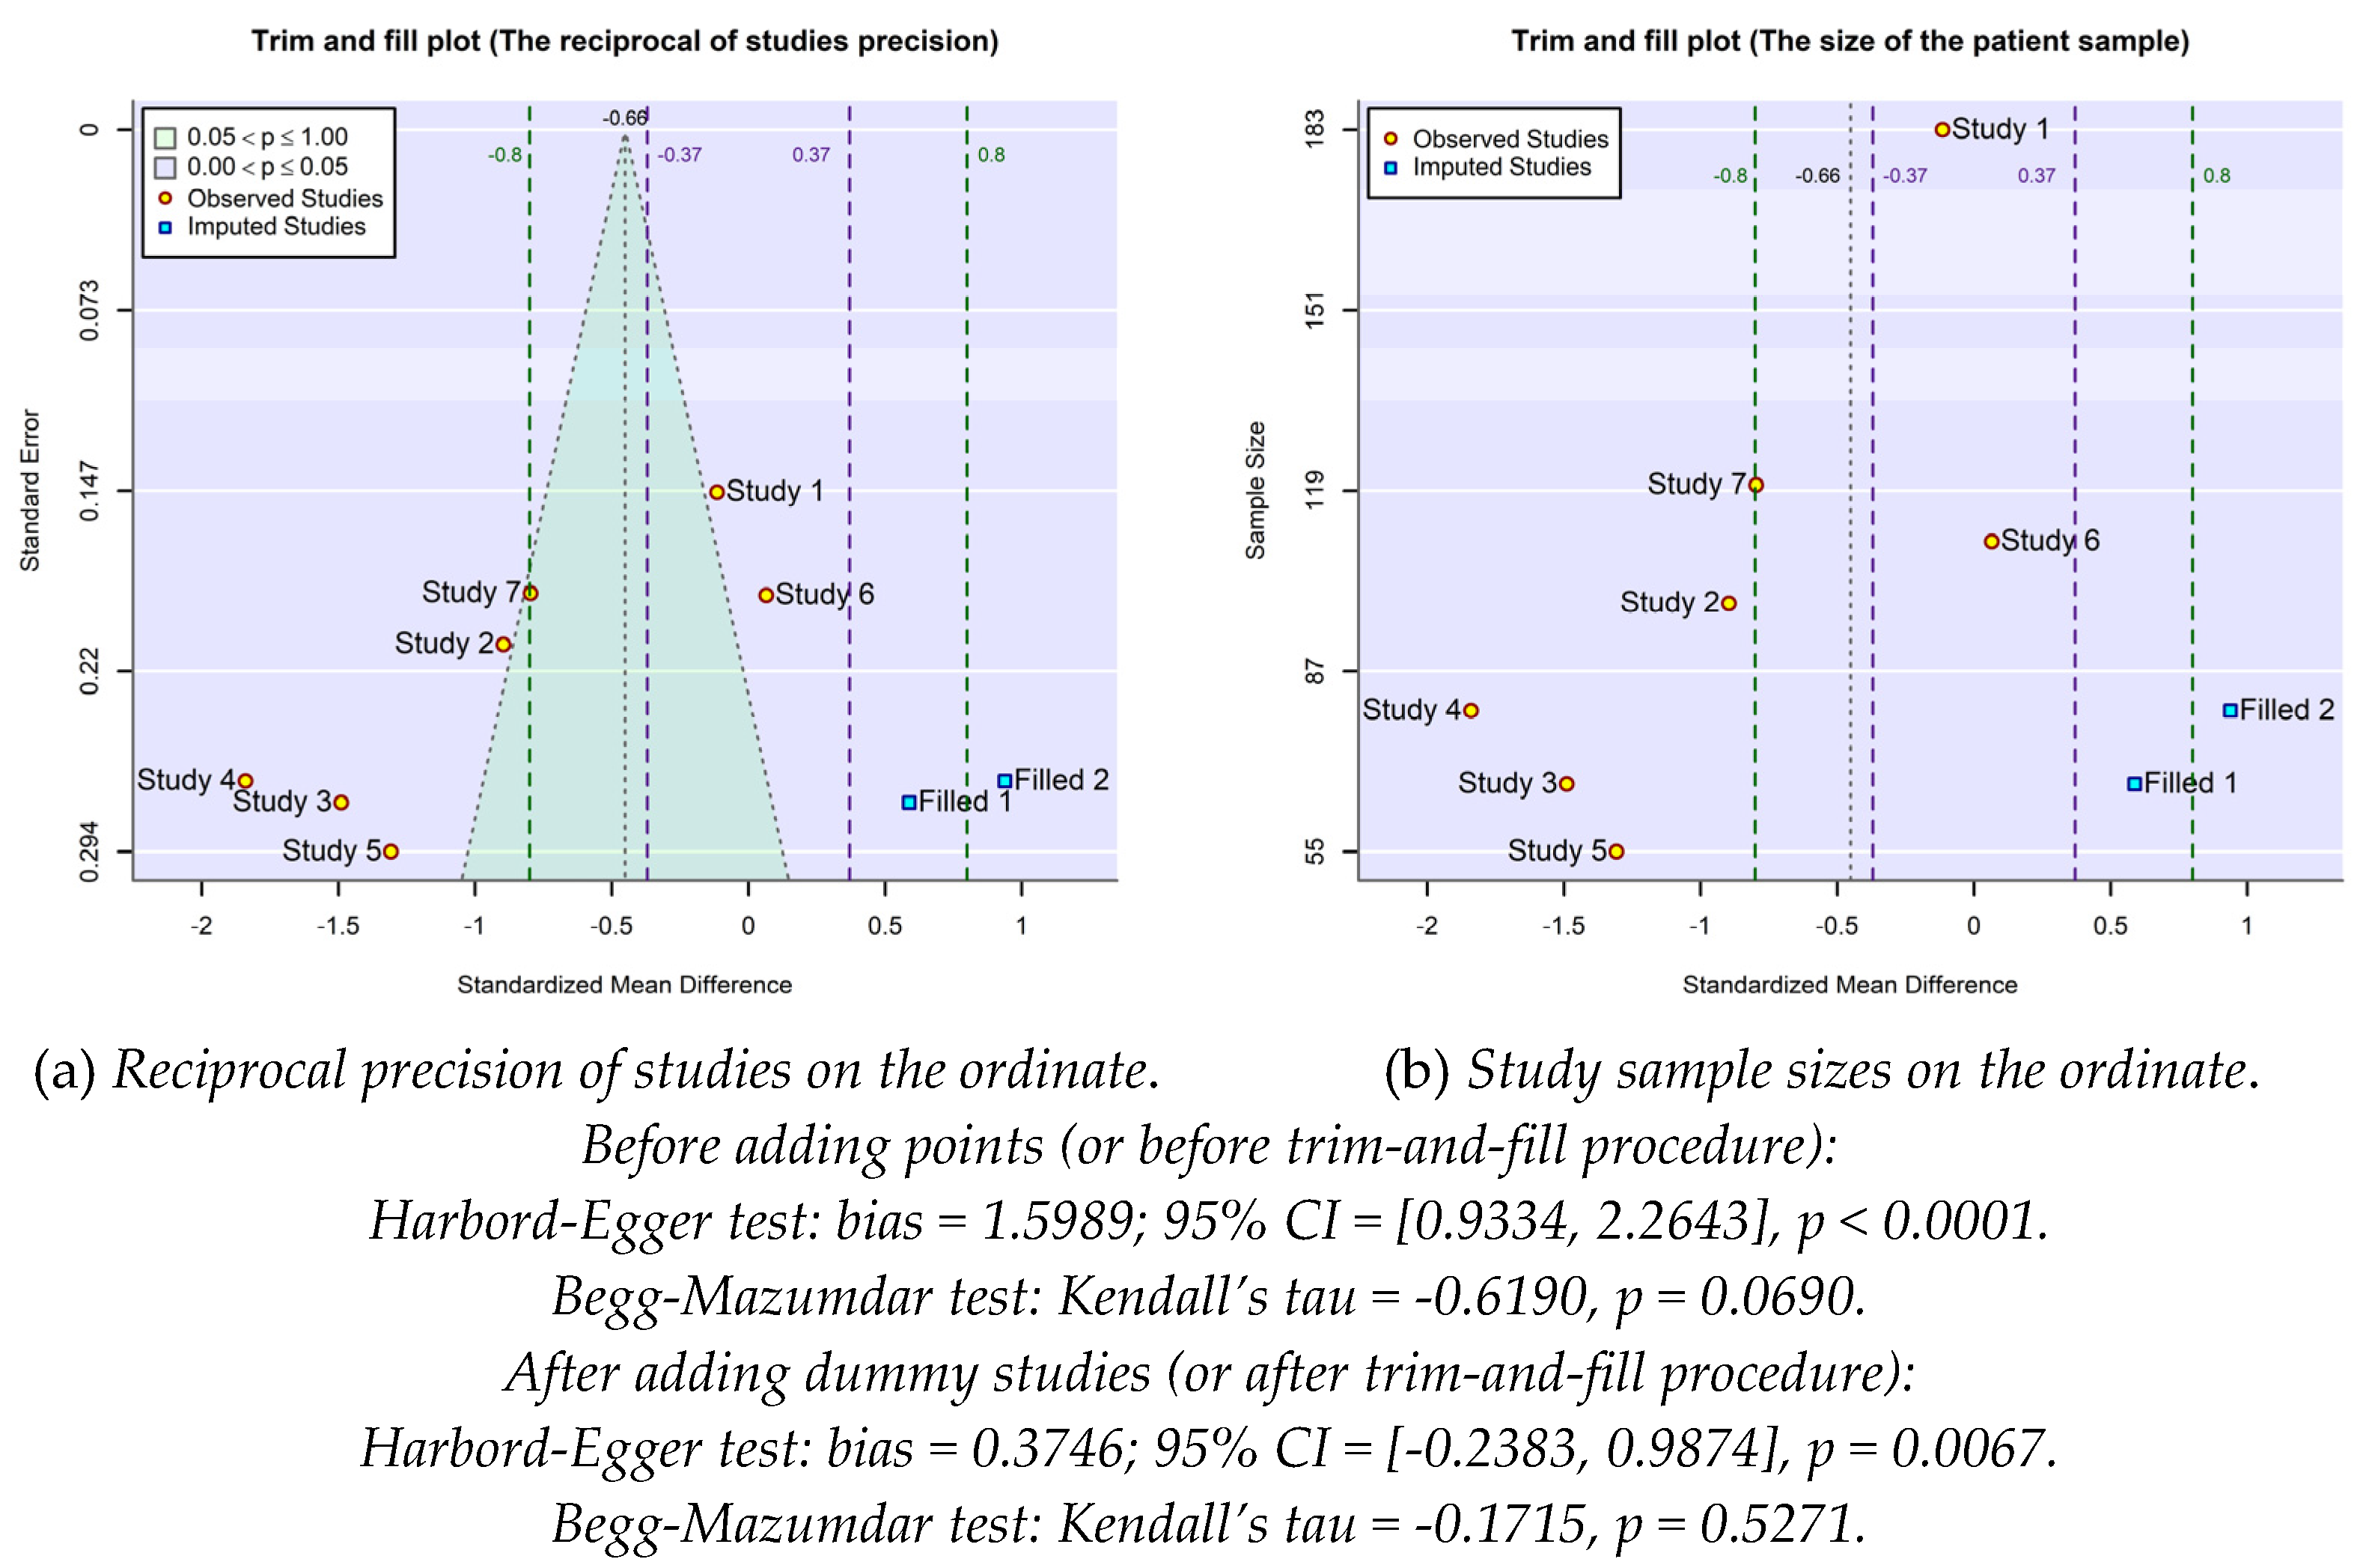
Figure 4.
The funnel plots associated to the random-effects model (method=”REML” in rma.uni function of metafor package) when the pseudo confidence interval also consider the amount of residual heterogeneity estimated by the model ().
Figure 4.
The funnel plots associated to the random-effects model (method=”REML” in rma.uni function of metafor package) when the pseudo confidence interval also consider the amount of residual heterogeneity estimated by the model ().
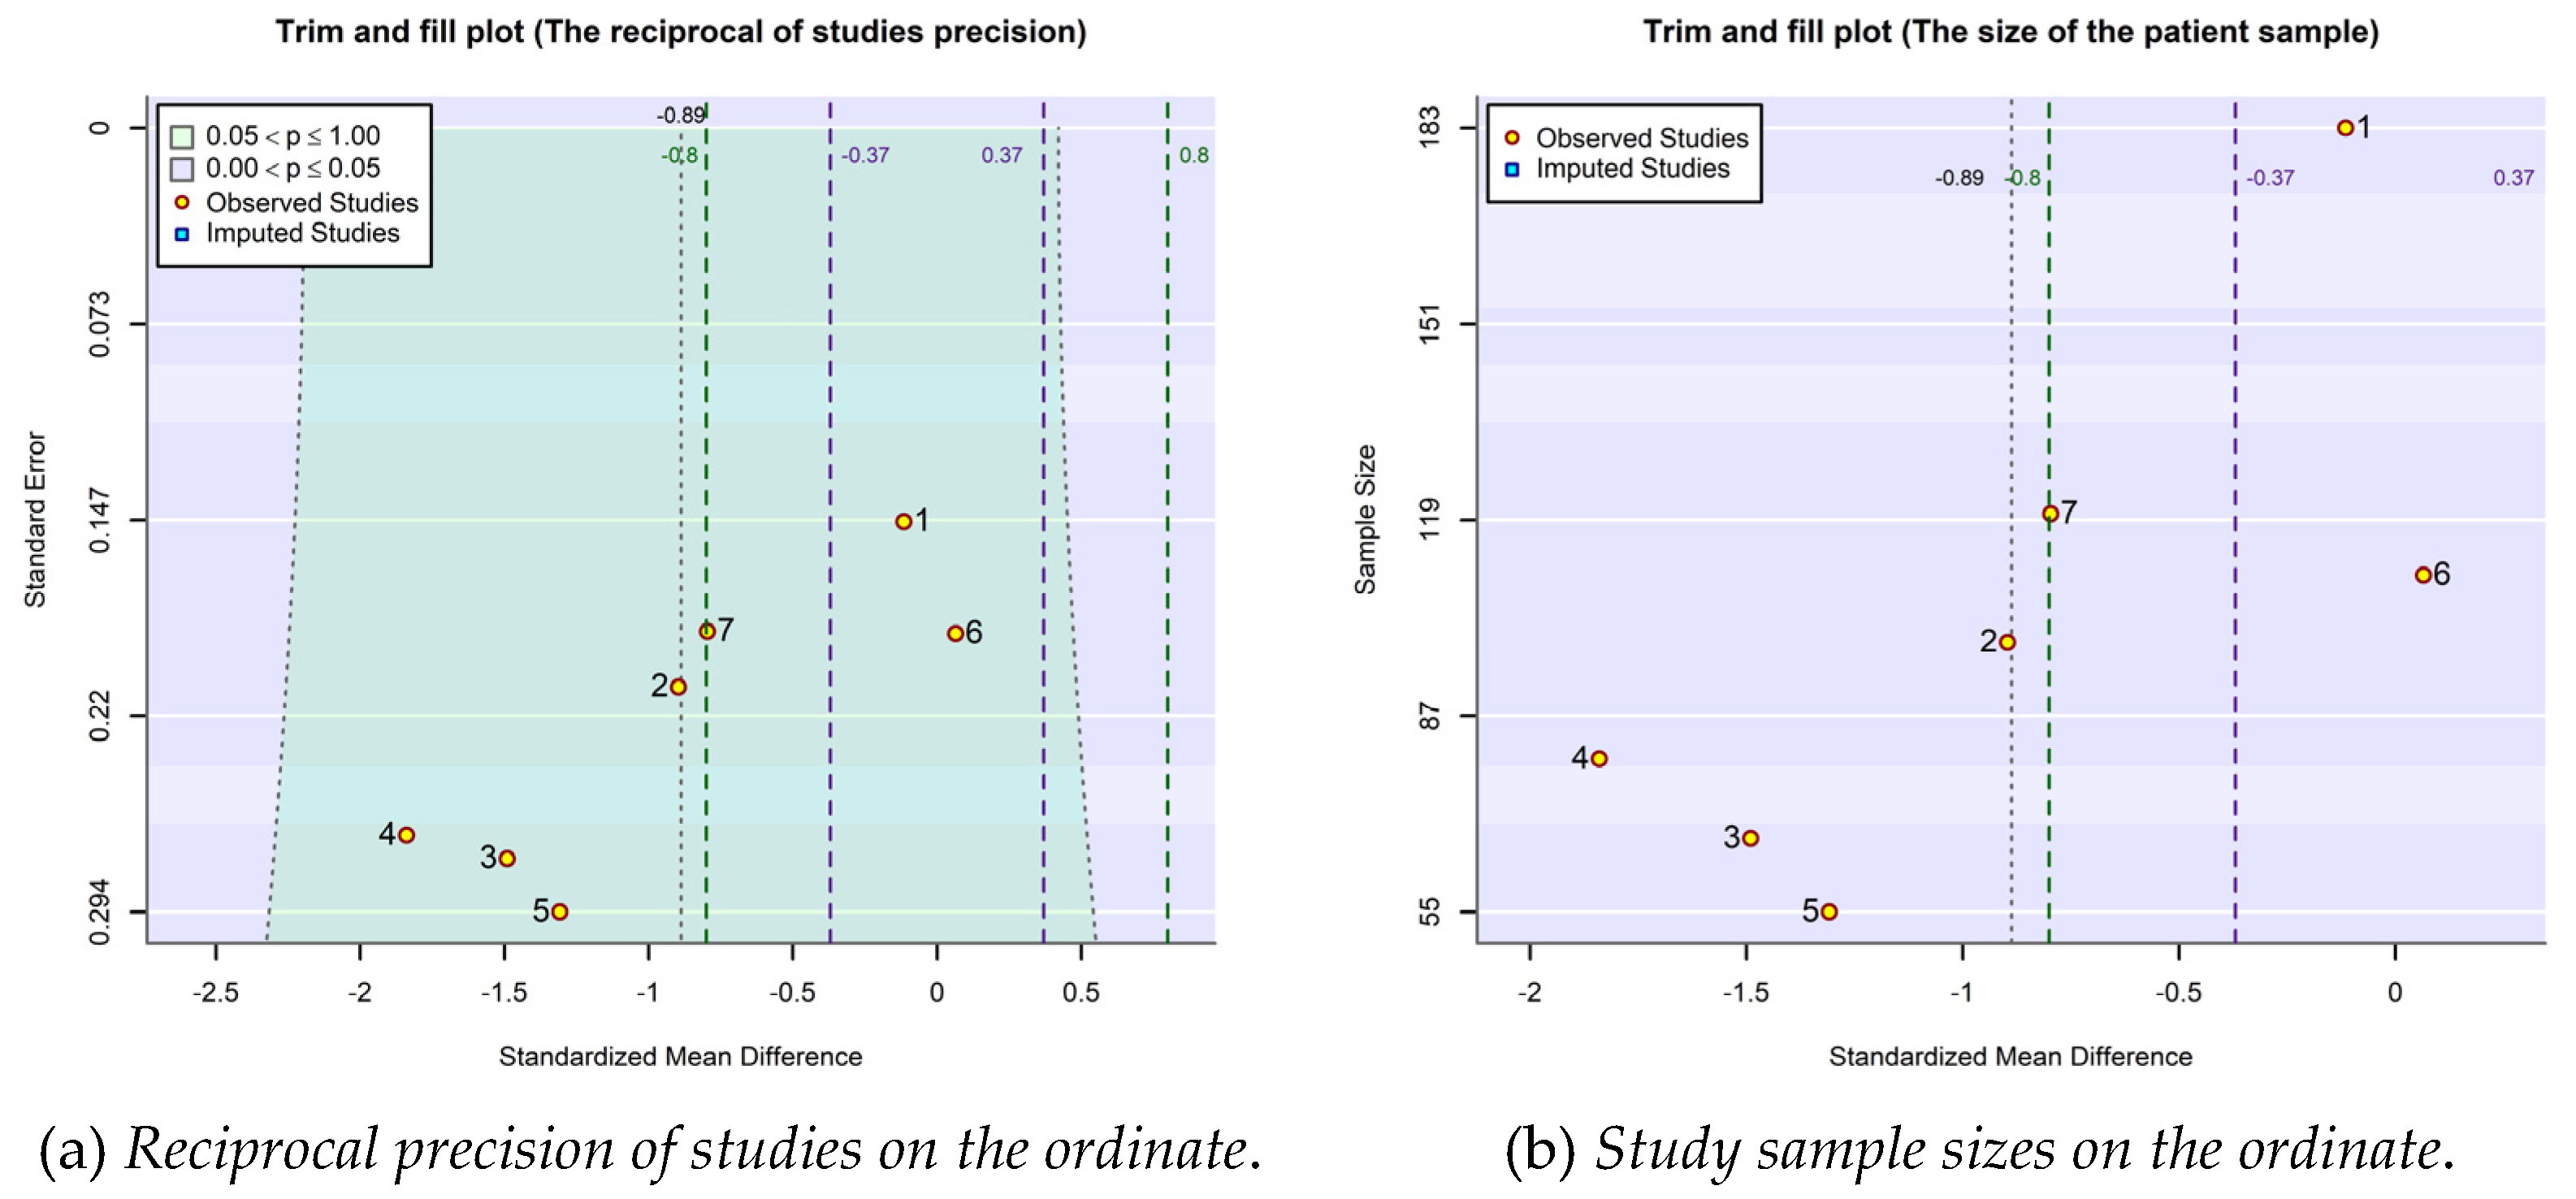
Figure 5.
The PRISMA 2020 flow diagram of the collection, screening and exploiting of information in the analyses carried out in the present work.
Figure 5.
The PRISMA 2020 flow diagram of the collection, screening and exploiting of information in the analyses carried out in the present work.
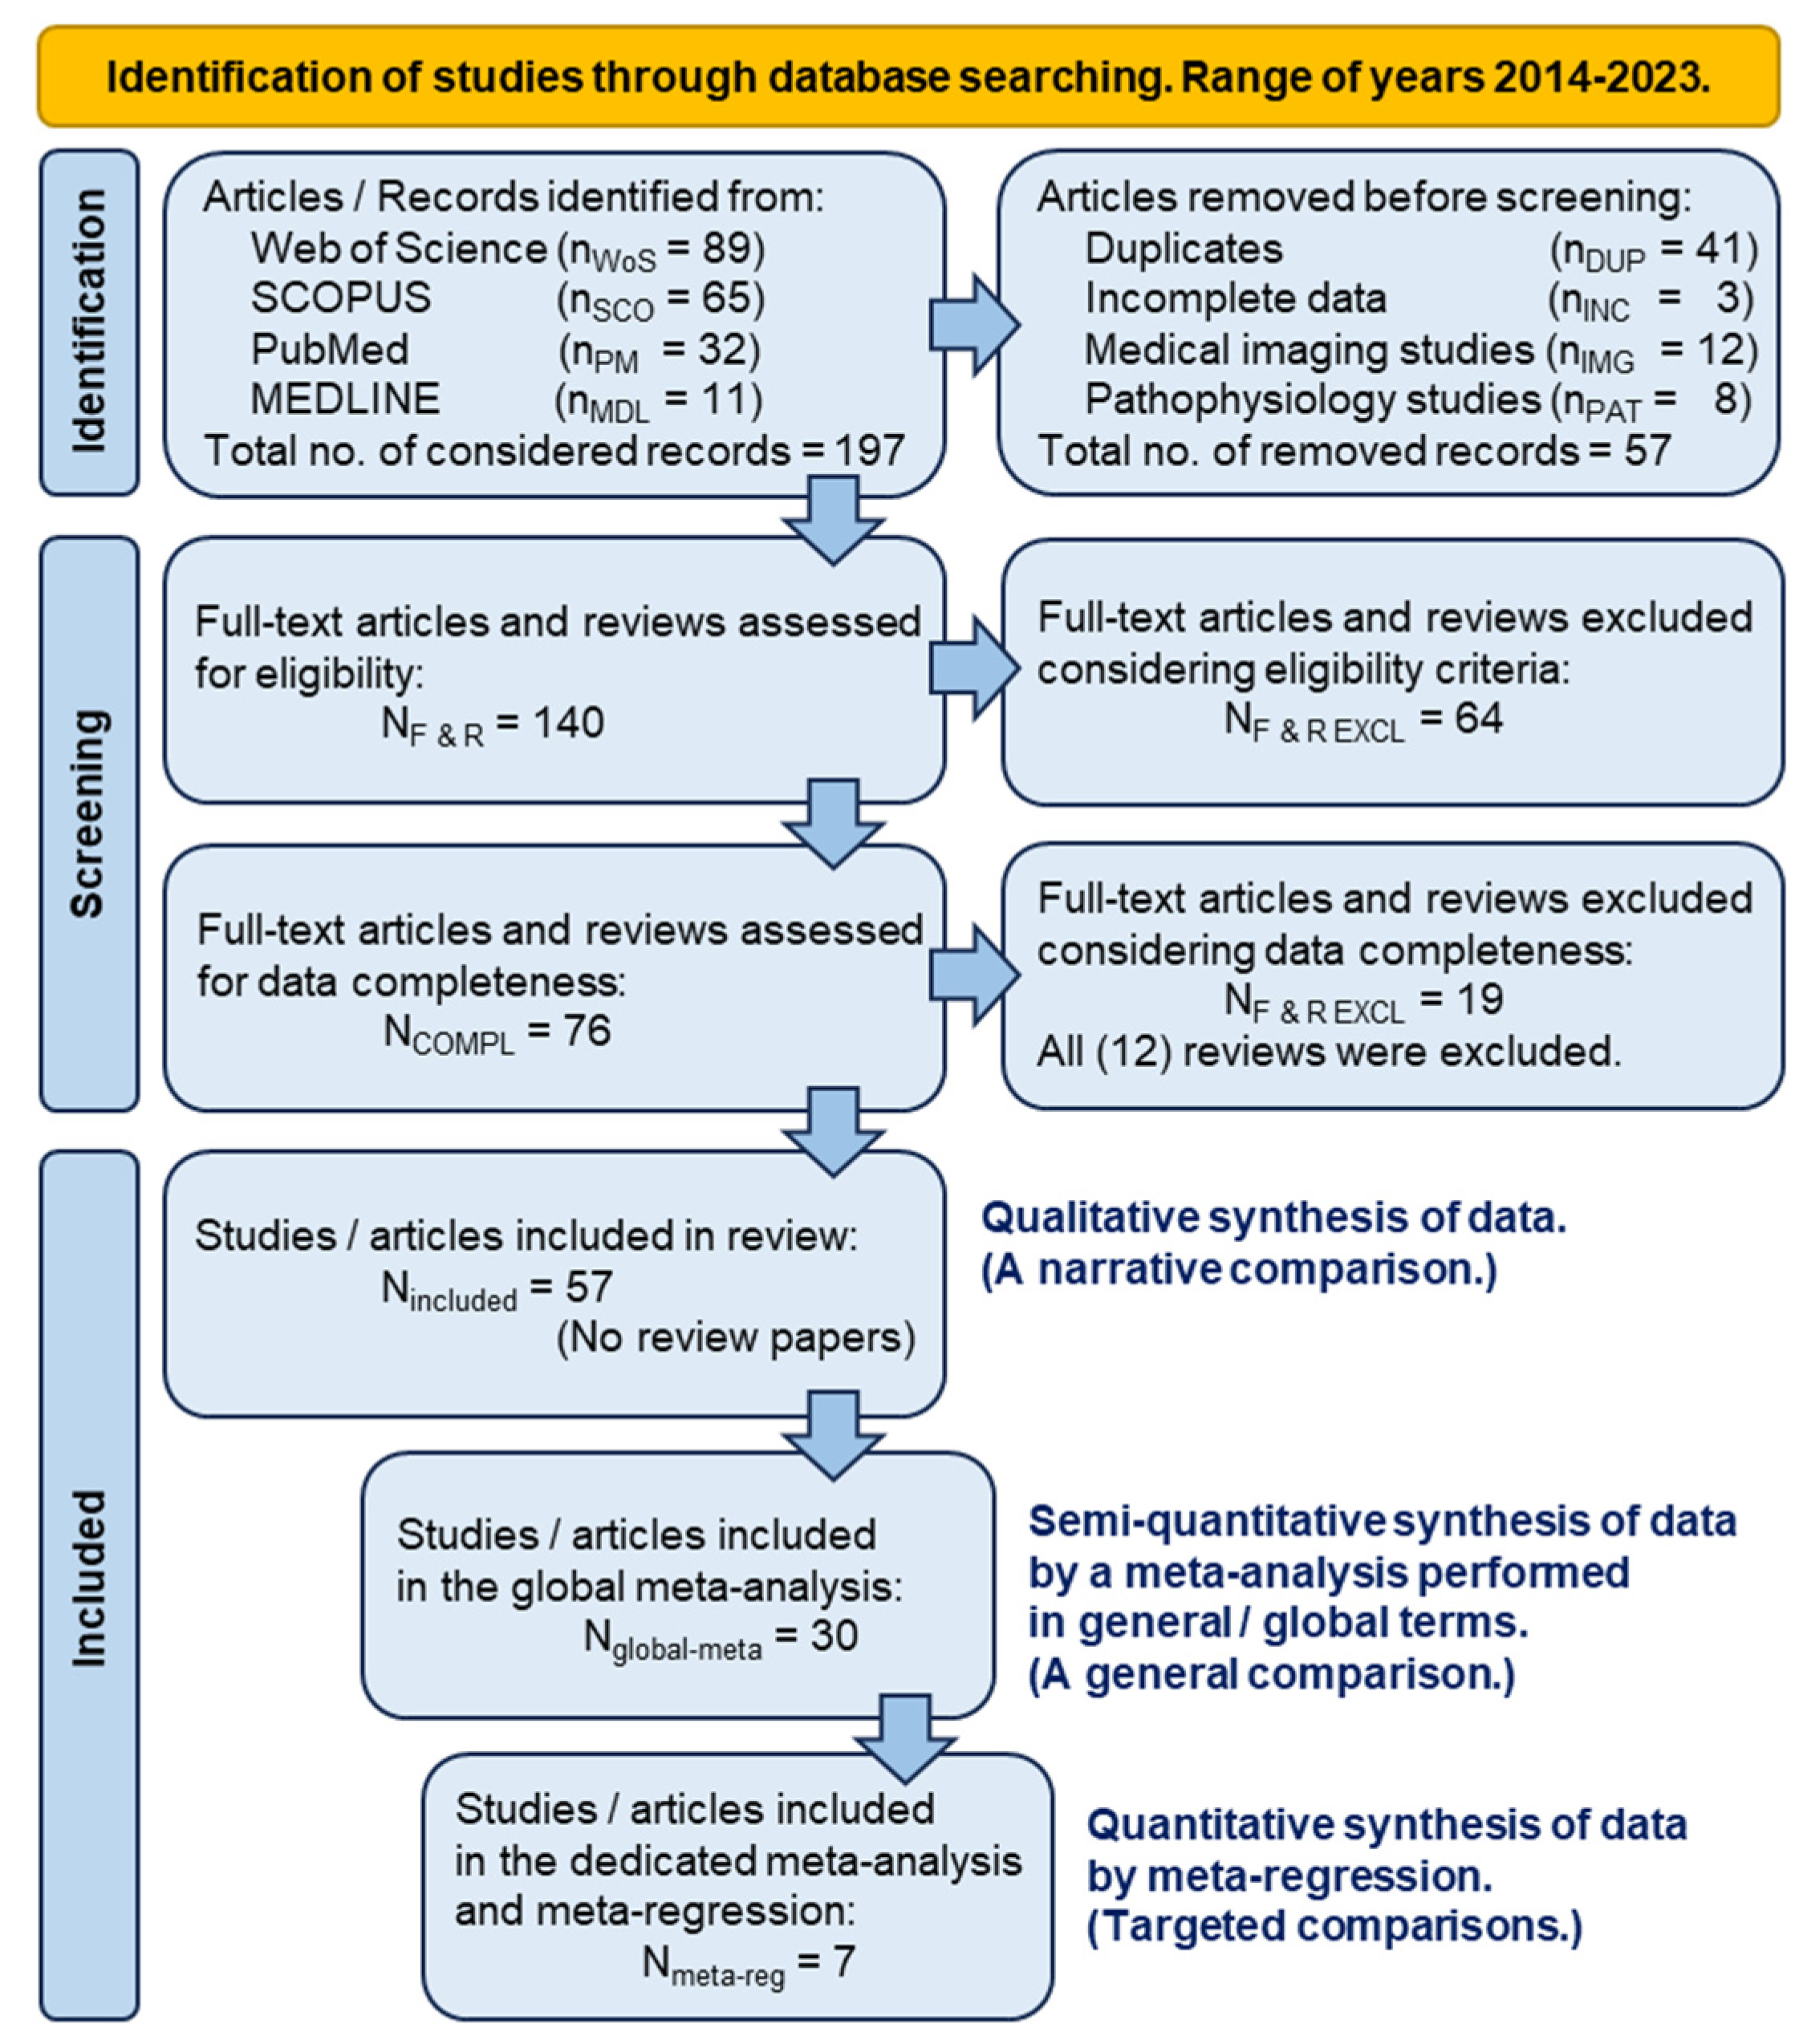

Table 1.
The studies selected for statistical-mathematical modeling by means of meta-analysis and meta-regression techniques.
Table 1.
The studies selected for statistical-mathematical modeling by means of meta-analysis and meta-regression techniques.
| Chronological order | Study | Narrative outcomes of compared treatments from the perspective of their inclusion in the meta-analysis / meta-regression investigation |
| 1. | (Filardo, 2015) | No superiority of PRP treatment over viscosupplementation. |
| 2. | (Cole, 2016) | No substantial difference between PRP and HA treatments in terms of the pain score on the WOMAC pain subscale. |
| 3. | (Duymus, 2017) | PRP is more successful than HA in the treatment of mild to moderate KOA. |
| 4. | (Huang, 2019) | PRP performs better than HA in the early stages of KOA. |
| 5. | (Tavassoli, 2019) | PRP is twice as effective in reducing pain as compared to HA, but after two injections at three-week interval. |
| 6. | (Park, 2021) | PRP acts significantly better in reducing KOA pain, even six months after the injection, when the viscosupplementation effect decreases. |
| 7. | (Ciapini, 2023) | The combination of PRP and HA outperforms treatment with HA alone, in KOA. |
Disclaimer/Publisher’s Note: The statements, opinions and data contained in all publications are solely those of the individual author(s) and contributor(s) and not of MDPI and/or the editor(s). MDPI and/or the editor(s) disclaim responsibility for any injury to people or property resulting from any ideas, methods, instructions or products referred to in the content. |
© 2024 by the authors. Licensee MDPI, Basel, Switzerland. This article is an open access article distributed under the terms and conditions of the Creative Commons Attribution (CC BY) license (http://creativecommons.org/licenses/by/4.0/).
Copyright: This open access article is published under a Creative Commons CC BY 4.0 license, which permit the free download, distribution, and reuse, provided that the author and preprint are cited in any reuse.


