Submitted:
27 June 2024
Posted:
29 June 2024
You are already at the latest version
Abstract
The focus was on developing machine learning models to predict the IC50 values of the compound OTX015 using gene expression levels of cancer cell lines. Through regression-based machine learning models, particularly the SVM model, trained on pre-laboratory data, consistent and generalizable performance with low error scores was achieved. These models underwent enhancement via hyperparameter optimization and were tested on validation data. The results indicate the utility of machine learning in drug discovery processes and personalized medicine, offering rapid and cost-effective predictions of IC50 values. However, for enhanced reliability, further model development, data gathering, and evaluation with diverse compounds are recommended. In conclusion, this research demonstrates the potential of machine learning approaches to optimize experimental processes, reduce costs, and contribute to personalized treatments in healthcare by accurately predicting compound responses.
Keywords:
machine learning
; prediction methods
; cancer
; ic50
; r programming
1. Introduction
Advancements in high-efficiency biology have greatly increased interest in precision medicine. Transforming genomic data into practical, individualized therapeutic programs and accurate patient-specific prognoses remains an ongoing goal.This primarily involves predicting drug responses across a large number of patients [1].
Identifying a logical relationship between the values of anticancer drugs and their quantitatively calculated physical amounts could be highly beneficial in predicting and designing new drugs, while also reducing time and cost [2]. Furthermore, predicting the response of a specific cancer to a treatment is a crucial objective in modern oncology, ultimately leading to personalized therapy [3].
In most modeling studies, assumptions have been made that similar drugs may exhibit similar responses in specific cell lines or, conversely, show divergent responses [4]. Additionally, one study demonstrated that it is possible to establish in silico multi-drug models using neural networks and random forests – non-parametric machine learning algorithms – to determine missing values by leveraging genomic features from cell lines and chemical information from drugs [5].
For instance, the Bromodomain and Extra-Terminal (BET) protein family is directly or indirectly responsible for many cancers [6,7,8,9,10,11,12]. In various cancer types, including hematological tumors, neuroblastomas, breast cancer, and prostate cancer, the compound OTX015 has demonstrated strong in vitro and in vivo anti-tumor activity and good tolerability in preclinical studies. Additionally, OTX015 is the first BET inhibitor (BETi) to successfully advance to clinical trials [13,14]. However, the potent effects of OTX015 may not be limited to these cancers. It could exhibit strong anti-tumor activity in other cancer types influenced by the BET protein family, or it might have entirely different effects than expected. Having an estimation of the potential relationship between this compound and other cancer cell lines before initiating clinical trials could help to outline a roadmap for these studies. Starting with cancer cell lines predicted to have high potential could save time and reduce costs.
Despite many studies based on these ideas, developing models to predict drug sensitivity remains challenging. One of the primary solutions to this challenge is to gather as much high-quality bioactivity data as possible, although this can be costly. Another approach is to develop more accurate and robust computational models based on existing datasets to improve prediction performance [15].
In this study, considering the many positive outcomes of predicting drug efficacy, it was aimed to develop a robust prediction model using the gene expression data of cancer cell lines and their response to OTX015 ( values), a potent BETi. Our findings suggest that The SVM model is the most suitable for predicting potential drug candidates for cancer treatment due to its high generalization capability and consistent performance with this type of data and problems.
2. Results
In this study, five different machine learning models were used to predict the values of the compound OTX015 on cancer cell lines found in the literature. Since values are continuous variables, the selected machine learning models were regression-based. These models were Elastic Net (EN), K-Nearest Neighbors (KNN), Neural Network (NNET), Support Vector Machine (SVM), and Extreme Gradient Boosting (XGB).
The performance of the models was evaluated by examining their Mean Absolute Error (MAE) scores. MAE scores are an important metric to measure how well or poorly each model performs. Using these scores, the performance of the models was compared both within different data dimensions and against each other.
2.1. The Impact of Data Dimensions on Models
To assess whether data dimensions affect the performance of the models, the main dataset was divided into five subsets. Each subset contained a different number of genes. This approach allowed us to examine whether increasing or decreasing the number of genes in the dataset had a significant impact on the performance of the prediction models. The gene counts in the five different subsets were 10, 25, 50, 75, and 100, respectively. The subsets were named according to the number of genes they contained. For instance, the dataset containing 10 genes was labeled as "Data of 10."
The performance of the OTX015 compound across different data dimensions is shown in Table 1.
2.2. Evaluation of Error Dimensions of Models
MAE scores provide information about the overall performance of the models. However, to obtain these average scores, the errors for each cell line were also examined. This analysis was conducted to determine whether the average error used to evaluate performance came from an abnormal distribution. The individual errors made by each model for the cell lines across all data groups are shown in Figure 1.
2.3. Evaluation of Error Distributions of The Models
Another crucial aspect in evaluating the performance of the models was the amaount of the errors. Ideally, models should frequently make low-degree errors while making fewer high-degree errors. In other words, for a model to be considered performing well, there should be frequent repetitions of errors close to zero, while larger errors should occur less frequently. Figure 2 presents the graphs showing the frequency of the errors made by the models.
2.4. Comparison of Predicted and Actual Values
In addition to the errors of the models, the scale of their predictions is also important. This allows for the assessment of whether the models are generalizing well based on the information learned from the training data. To evaluate this, the predicted values were compared with the actual values. The comparison graphs are shown in Figure 3.
2.4. Evaluation of the SVM Model In Singel-Patient Predictions
Considering all results, the SVM model emerged as the most prominent model with the lowest minimum, maximum, and average error rates. It also showed a high concentration of low-degree error repetitions and had the lowest average error scores across different data dimensions.
To emphasize the potential benefits of machine learning models in the field of personalized medicine, a scenario was created for individual patient predictions using the standout SVM model. Each cell line in the validation set of the Data of 10 was defined as individual patient data, and the SVM model was tasked with making predictions for a patient. The predictions made by the SVM model for 76 patients are shown in Table 2.
3. Discussion
Precision medicine, highlighted by advancements in biology, underscores the importance of translating genomic data into individualized therapies. Predicting drug responses is critical for personalized approaches in cancer treatment [16]. Machine learning offers a solution to the challenge of predicting drug efficacy [17].
In this study, the aim was to develop and compare robust machine learning prediction models using gene expression data from cancer cells and their responses to a specific drug. The models were evaluated based on error dimensions, error amounts, and their predictions against actual values, both within different data dimensions and against each other.
While previous machine learning studies have assumed that algorithms would learn better with more data, it has also been noted that traditional algorithms may encounter various challenges with large datasets [18]. In this study, subsets of the main dataset were created, and the relationship between data dimension and the performance of the machine learning models was assessed. Table 1 shows the performance of all models on the five different subsets created for the compound OTX015. However, the results demonstrated fluctuating performance rather than a consistently increasing-or-decreasing performance with larger data sizes.
Secondly, the performance of individual cell lines, which affects the overall performance of the machine learning models, was also evaluated. This assessment was conducted to examine the distribution of all errors considered in calculating the models' average error. For instance, the errors for the SVM model shown in Figure 2.d. ranged from 7.829 to –0.889, with an average error (MAE) calculated as 1.143. In contrast, the errors for the XGB model shown in Figure 2.e. ranged from 7.92 to –4.701, with an average error of 1.593. However, as seen in the XGB results, the degrees of both negative and positive errors were slightly higher compared to SVM. Consequently, the MAE score for the SVM model was lower than that for XGB. The EN model (Figure 2.a.) showed similar results to SVM, while the KNN and NNET models showed results similar to XGB. Similar results are observed in Figure 3, where the EN (Figure 2.a.) and SVM (Figure 2.d.) models made more errors close to zero. This indicates that these two models generally made low-degree errors for all cell lines, both negative and positive. In contrast, the KNN, NNET, and XGB models generally made slightly higher-degree errors compared to the other two models. This explains why, in Table 1, for the Data of 10 (the dataset used for these graphs), SVM had the lowest, and EN had the second-lowest MAE score.
An additional evaluation was conducted to assess the generalization performance of the models. Figure 4 shows the predicted values against the actual values for all cell lines in the validation set of the Data of 10. The predictions of the EN and SVM models were closer to each other compared to the other three models, resulting in a linear appearance in the graphs (Figures 4.a. and Figure 4.d.). This indicates that the EN and SVM models made more general and similar predictions, likely dependent on the training set. The SVM model, which stands out in line with all these results, also came to the fore with its low MAE scores in another study comparing several machine learning models [19].
In addition, this study demonstrated that the SVM model maintained its performance not only on the general dataset but also in predictions for individual patients (Table 2). This shows that the SVM model, trained on literature data, can achieve the same level of performance when given the gene profile of a single patient. Consequently, it is emphasized that machine learning models, particularly SVM, have strong potential for predicting individualized values.
Overall, when considering the results, the performance of all models was consistent across different compounds and demonstrated good performance with low MAE scores. However, the SVM model, evaluated with minor details, was identified as the most suitable model for the given problem among the five different machine learning algorithms. Therefore, this study, which used gene expression levels and values of compounds on cancer cell lines, suggests that the SVM model is the most appropriate for predicting potential drug candidates for cancer treatment. The SVM model has a high generalization capability and the ability to obtain consistent results for this type of data and problems.
The advancements in cancer treatment today are encouraging researchers to focus on developing new drugs and treatment strategies. In this context, the development of machine learning models to predict the sensitivity of cancer cells to drugs plays a significant role in identifying new treatment methods. This study aims to expand the boundaries of similar research and is based on some important studies found in the literature. For instance, in the study conducted by Chiu et al. (2019), machine learning models were used to predict the efficacy of drugs in different tumor types. Chiu and colleagues better understood the effects of drugs on cancer cells and identified potential drug candidates by using mutation and expression profiles of cancer cells or tumors [20]. A similar approach is evident in the significant work of Su et al. (2019) in cancer research, where they developed a prediction model based on gene expression levels that could be used to determine sensitivity to drugs in cancer cells [21]. Additionally, it is also reflected in the study by Dring et al. (2019) on cancer treatment. Dring and colleagues emphasized the development of a data-driven precision medicine approach that optimizes therapeutic efficacy using machine learning algorithms [22].
This study aims to offer a pioneering approach in cancer research and treatment, aiming to surpass similar studies in the literature. It addresses a crucial need in cancer research and treatment, namely, predicting potential drug candidates and recommended treatments for individual patients based on genomic information. Unlike other studies, this research does not focus on individual models for prediction or a single cancer type. Instead, the proposed models have the potential to predict for all cancer cell lines with gene expression levels for a compound. Moreover, they can provide drug response for compounds intended to be evaluated for every patient with genomic information. This highlights the unique diversity of performance of the proposed models, especially SVM, in the study.
However, this study also faced limitations. First, the quality and completeness of the data used can affect the accuracy of the predictions. It must be noted that data may be incomplete or erroneous, which can influence the model's results. Additionally, this study focused on a specific drug compound, and testing more drug candidates may be necessary. Testing a broader range of drug candidates is important for obtaining more comprehensive results. Furthermore, using different machine learning algorithms and feature engineering techniques could enhance the model's performance. This would help the model make more accurate predictions and be more effective in real-world applications. Future research could address the limitations of our study by collecting more data or using different data sources to improve model performance. Moreover, employing various machine learning algorithms and feature engineering techniques could be considered to achieve more accurate predictions.
In conclusion, our study highlights the significant role that machine learning can play in predicting potential drug candidates for cancer treatment and developing treatment options based on individual genetic profiles. While all models were shown to be effective in this context, the SVM model was found to be the best for this problem, demonstrating consistent results. Future studies should further explore this potential and make significant contributions to cancer treatment and personalized medicine. This study has laid the groundwork for achieving these goals and has introduced a new perspective to this important area of cancer research.
4. Materials and Methods
This study aims to develop five different regression-based machine learning models to predict the values of the promising bromodomain inhibitor OTX015 in cancer cell lines. The necessary data were obtained from the following sources:
- Values: The values of OTX015 in cancer cell lines were obtained from the [CancerRxGene] (https://www.cancerrxgene.org/) data source. This data provides a crucial measure of the impact of OTX015 on cancer cell lines.
- Gene Expression Data: The gene expression levels of cancer cells were obtained from the [Sanger Institute's Cancer Cell Lines Project] (https://cancer.sanger.ac.uk/cell_lines) data source. These data allow for a detailed examination of the gene expression profile in cancer cells.
4.1. Data Preprocessing
The obtained values and gene expression data required some preprocessing before being used in the training, testing, and validation stages of the model. The data preprocessing process included the following steps:
- Data Integration: values and gene expression data were merged based on cancer cell lines. This step helped determine in which cancer cells values were determined for the OTX015 compound and in which cells gene expression levels were measured.
- Data Processing: Missing data were checked, and any incomplete data were removed from the dataset. Following the literature (Table 1), cell lines with values of 200 µM or higher were considered inactive and were excluded from the dataset.
- Feature Engineering: To determine the features used for model development, feature engineering was performed on the gene expression data. Only significant gene expression levels were selected. Each gene in the dataset was subjected to Pearson correlation with the value. The relationships were ranked from highest to lowest based on the absolute value of the correlation, irrespective of whether the correlation was positive or negative. Genes with significant correlations to values were selected in sets of 10, 25, 50, 75, and 100 to evaluate the impact of data dimensions on the models, resulting in five different new datasets.
- Data Scaling: Rescaling the data often improves model performance by reducing error rates, depending on the nature of the problem, data, and models. Therefore, rescaling was applied to all five models used in this study. This contributed to better model performance and lower error rates.
- Creation of Training, Testing, and Validation Data: To evaluate the model's performance on a dataset it had not seen before, the dataset was split before model training. 80% of the data (314 samples) was used for training and testing, and 20% (76 samples) was used for validation. The validation data set was reserved for assessing the model’s performance and was not used during the training or optimization stages. Cross-validation was performed using the training data. In cross-validation, the value of k was set to 5, creating five different training and testing sets during model training.
4.2. Model Training, Utilization, and Evaluation
In this study, five different regression-based machine learning models were selected to predict the values of the compound OTX015 on cancer cell lines using the gene expression levels of these cells. Each model has distinct features and advantages, aiming to achieve the best predictive performance through this diversity:
- K-Nearest Neighbor
- Extreme Gradient Boosting
- Elastic Net
- Neural Networks
- Support Vector Machine
These five regression models were trained separately using the same dataset and their performances on the same validation set were compared. During model training, hyperparameter optimization was conducted for key parameters that influence model performance. The optimal hyperparameters were determined based on the Mean Absolute Error (MAE) calculated using Equation (1):
MAE was used to compute the mean of the absolute differences between the predicted and actual values. The parameters with the lowest MAE scores were selected as the optimal hyperparameters to maximize model performance. The models were then retrained with these optimal parameters and the same training set, and these retrained models were considered the best-performing models.
After optimization, the performance of the best models was evaluated using the validation set, which comprised 20% of the initial data that was not used during training. The MAE score was used for this evaluation. The MAE scores facilitated the comparison of model performances across different data sizes as well as among the five different machine learning models. The MAE scores obtained by the models on the validation sets are presented in Table 2.
The entire workflow is illustrated in Figure 5.
5. Conclusions
In conclusion, the development and evaluation of machine learning models to predict values, which indicate the half-maximal inhibitory concentration of compounds or drugs, have yielded promising results. Specifically, the models were rigorously assessed using the drug candidate compound OTX015, known for its successful role as a BETi (Bromodomain and Extra-Terminal inhibitor). The study was extended to evaluate model performance across varying data dimensions, providing valuable insights into scalability and adaptability.
The predictive capabilities of machine learning models are crucial for minimizing the cost and time associated with traditional laboratory experiments. Therefore, the outcomes of this research hold pioneering implications for experimental applications. By accurately predicting values, these models serve as invaluable tools for prioritizing and facilitating experimental efforts, thereby enhancing efficiency in the drug discovery process.
Moreover, beyond the realm of experimental optimization, these models demonstrate significant potential in the field of personalized medicine. The ability to predict individualized values for drugs has transformative implications for tailoring therapeutic interventions to the unique physiological characteristics of patients. This not only enhances treatment precision but also underscores the broader impact of the models in developing patient-centered healthcare strategies.
Based on these findings, further research and development are necessary to enhance the robustness, reliability, and applicability of machine learning models to various experimental scenarios. Specifically, there is a need for the collection of more data and better organization of existing data, as well as the evaluation of different model types and feature engineering techniques. Such improvements can accelerate progress in this field. Additionally, collaborative efforts between computational and experimental researchers can foster an iterative model improvement process, continuously advancing prediction accuracy and generalizability.
As a result, the study demonstrated the potential of using machine learning models to predict values in cell lines. However, ongoing research and further development of the models are necessary. Integrating the proposed models into routine laboratory applications and clinical decision-making processes will lay a significant foundation for developing an effective tool that could lead the way in drug discovery and personalized medicine.
Author Contributions
Con-ceptualization, Uğur Bilge, M. Okan Çakır and Gizem Tutkun; methodology, Uğur Bilge and Gizem Tutkun; software, Gizem Tutkun.; validation, Uğur Bilge; formal analysis, M. Okan Çakır; investigation, Uğur Bilge and M.Okan Çakır.; resources, Gizem Tutkun; data curation, Uğur Bilge; writing—original draft preparation, Gizem Tutkun.; writing—review and editing, M.Okan Çakır; visualization, Gizem Tutkun; supervision and project administration, Uğur Bilge. All authors have read and agreed to the published version of the manuscript.
Funding
This research received no external funding.
Data Availability Statement
We encourage all authors of articles published in MDPI journals to share their research data. In this section, please provide details regarding where data supporting reported results can be found, including links to publicly archived datasets analyzed or generated during the study. Where no new data were created, or where data is unavailable due to privacy or ethical restrictions, a statement is still required. Suggested Data Availability Statements are available in section “MDPI Research Data Policies” at https://www.mdpi.com/ethics.
Acknowledgments
In this section, you can acknowledge any support given which is not covered by the author contribution or funding sections. This may include administrative and technical support, or donations in kind (e.g., materials used for experiments).
Conflicts of Interest
The authors declare no conflicts of interest.
References
- Author 1, A.B.; Author 2, C.D. Title of the article. Abbreviated Journal Name Year, Volume, page range.
- Author 1, A.; Author 2, B. Title of the chapter. In Book Title, 2nd ed.; Editor 1, A., Editor 2, B., Eds.; Publisher: Publisher Location, Country, 2007; Volume 3, pp. 154–196.
- Author 1, A.; Author 2, B. Book Title, 3rd ed.; Publisher: Publisher Location, Country, 2008; pp. 154–196.
- Author 1, A.B.; Author 2, C. Title of Unpublished Work. Abbreviated Journal Name year, phrase indicating stage of publication (submitted; accepted; in press).
- Author 1, A.B. (University, City, State, Country); Author 2, C. (Institute, City, State, Country). Personal communication, 2012.
- Author 1, A.B.; Author 2, C.D.; Author 3, E.F. Title of Presentation. In Proceedings of the Name of the Conference, Location of Conference, Country, Date of Conference (Day Month Year).
- Author 1, A.B. Title of Thesis. Level of Thesis, Degree-Granting University, Location of University, Date of Completion.
- Title of Site. Available online: URL (accessed on Day Month Year).
Figure 1.
Errors made by the models in predicting values for each cell line in the Data of 10. The light green bars represent the highest and lowest errors. (a) EN, (b) KNN, (c) NNET, (d) SVM, and (e) XGB models show individual errors.
Figure 1.
Errors made by the models in predicting values for each cell line in the Data of 10. The light green bars represent the highest and lowest errors. (a) EN, (b) KNN, (c) NNET, (d) SVM, and (e) XGB models show individual errors.
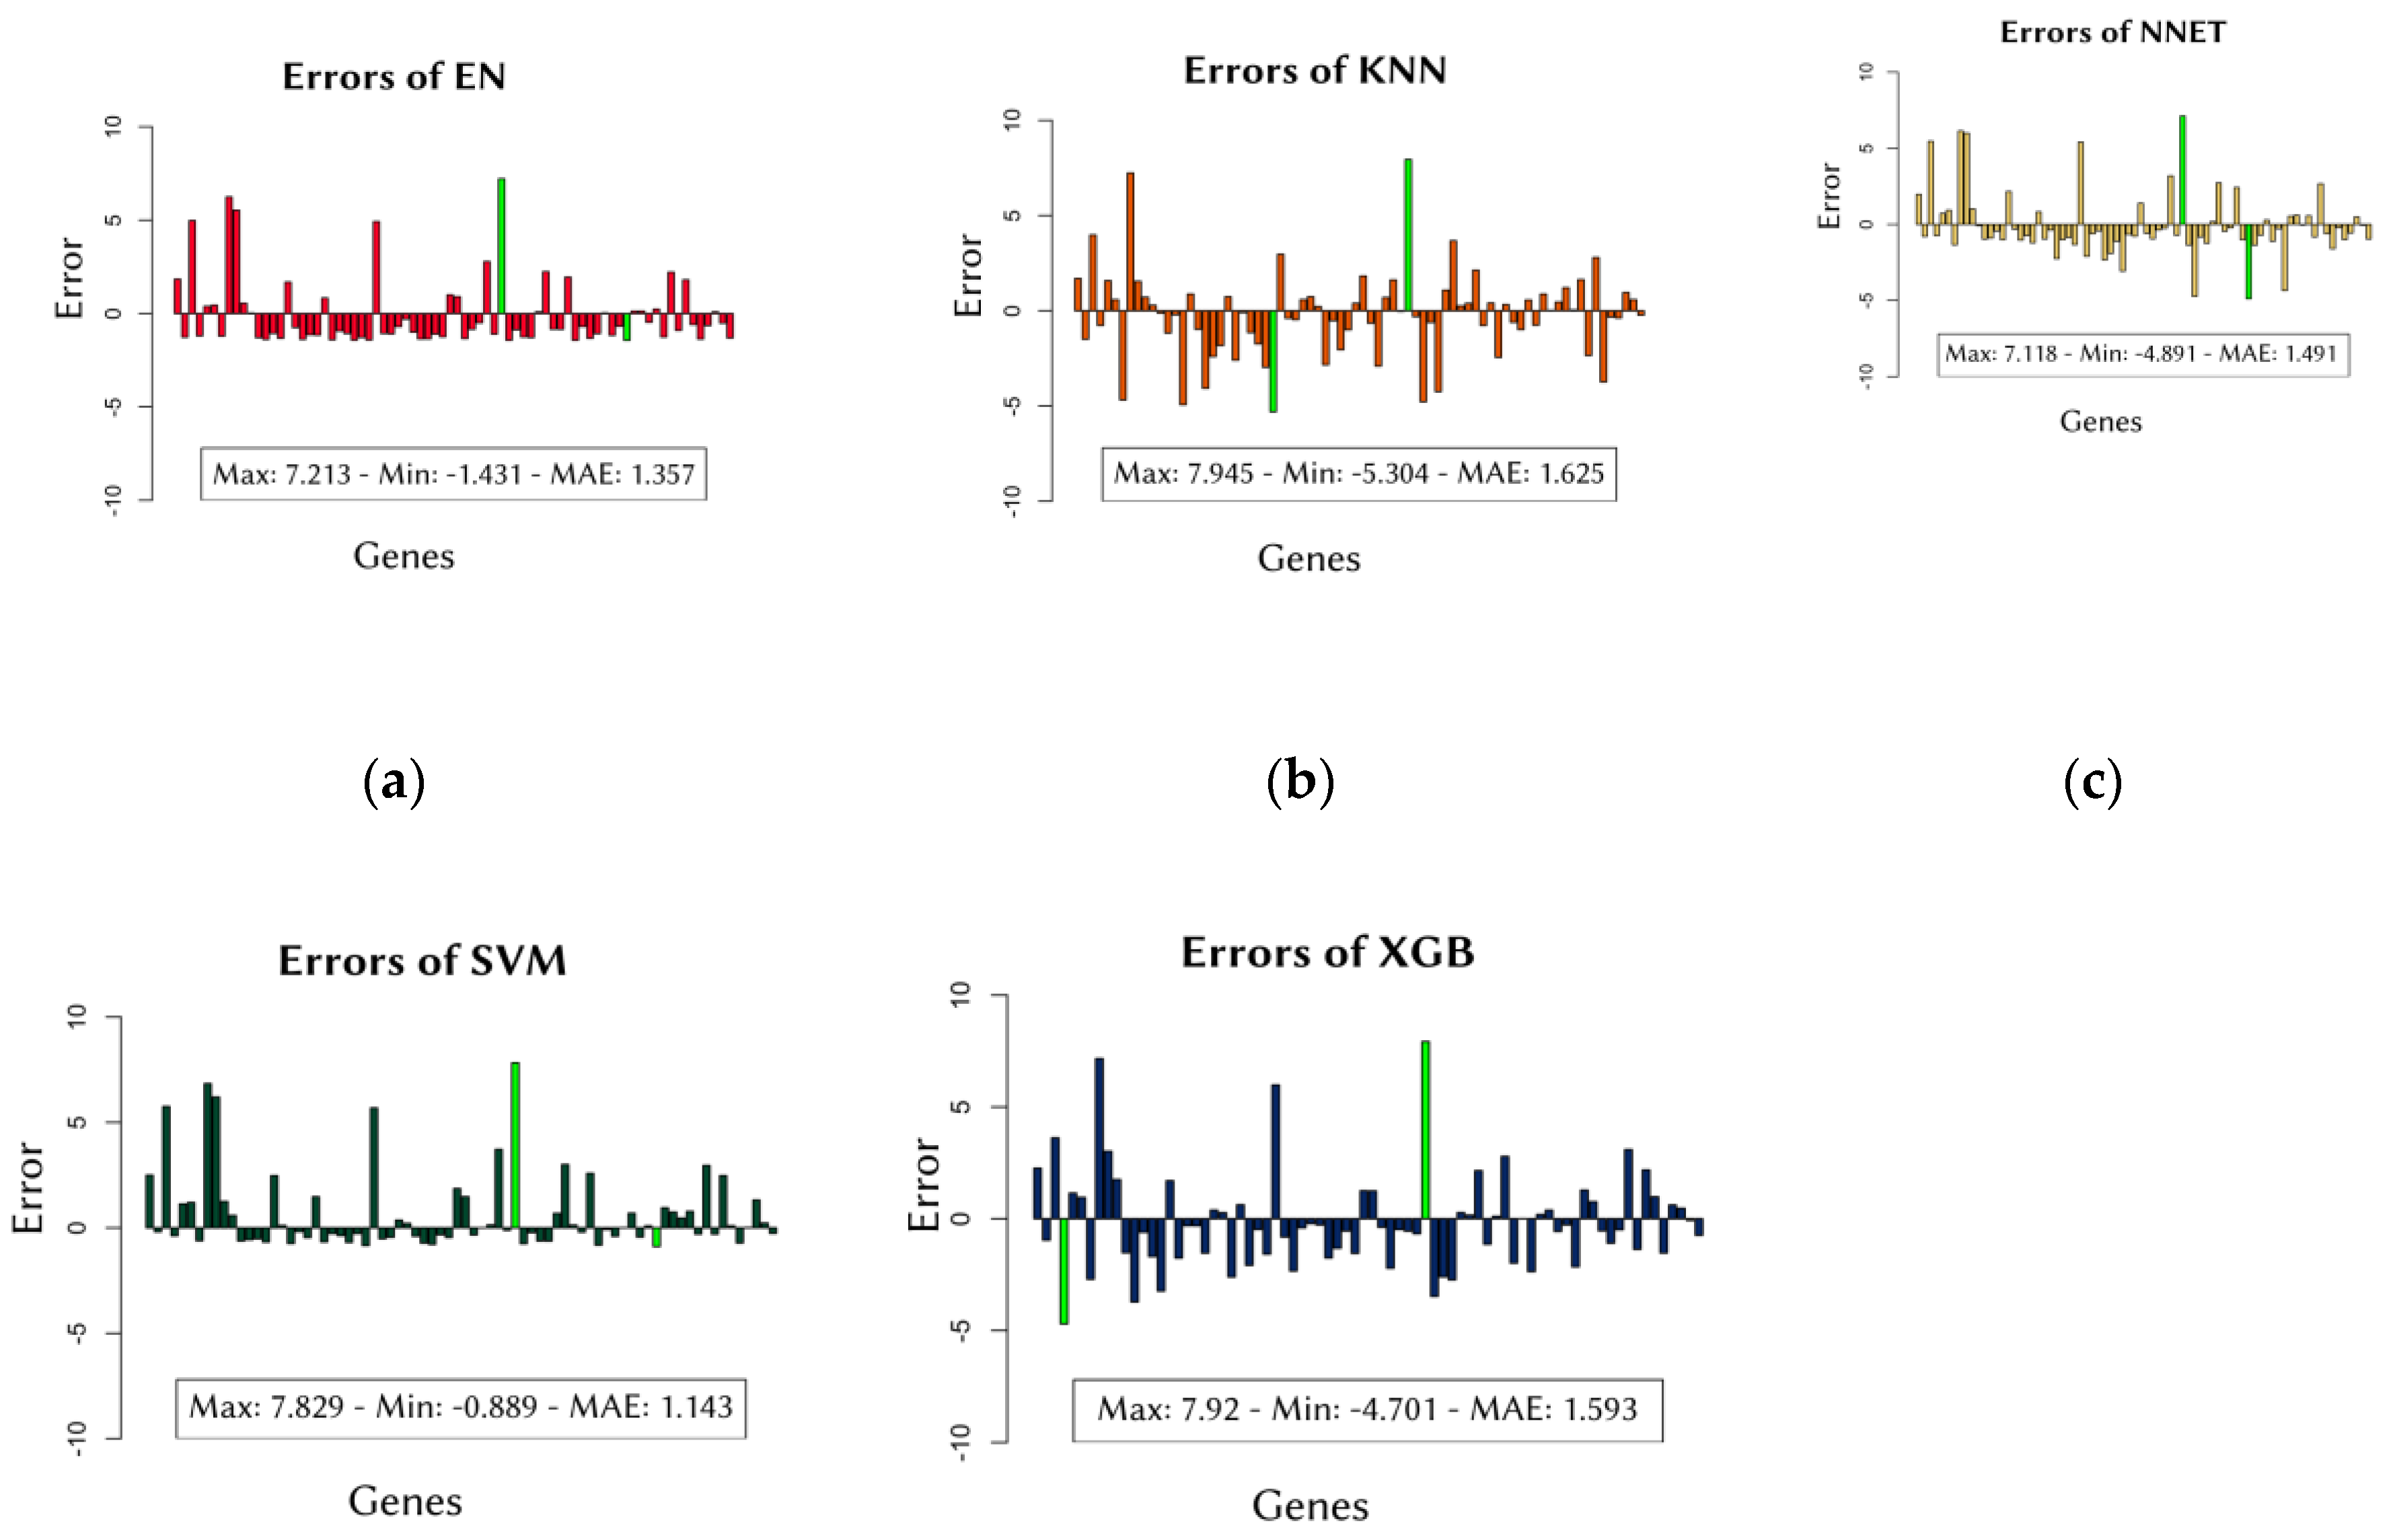
Figure 2.
Frequency of errors made by the models in the Data of 10. The X-axis represents the error magnitude, while the Y-axis indicates the frequency of these errors. (a) EN, (b) KNN, (c) NNET, (d) SVM, and (e) XGB models show the frequency of errors.
Figure 2.
Frequency of errors made by the models in the Data of 10. The X-axis represents the error magnitude, while the Y-axis indicates the frequency of these errors. (a) EN, (b) KNN, (c) NNET, (d) SVM, and (e) XGB models show the frequency of errors.
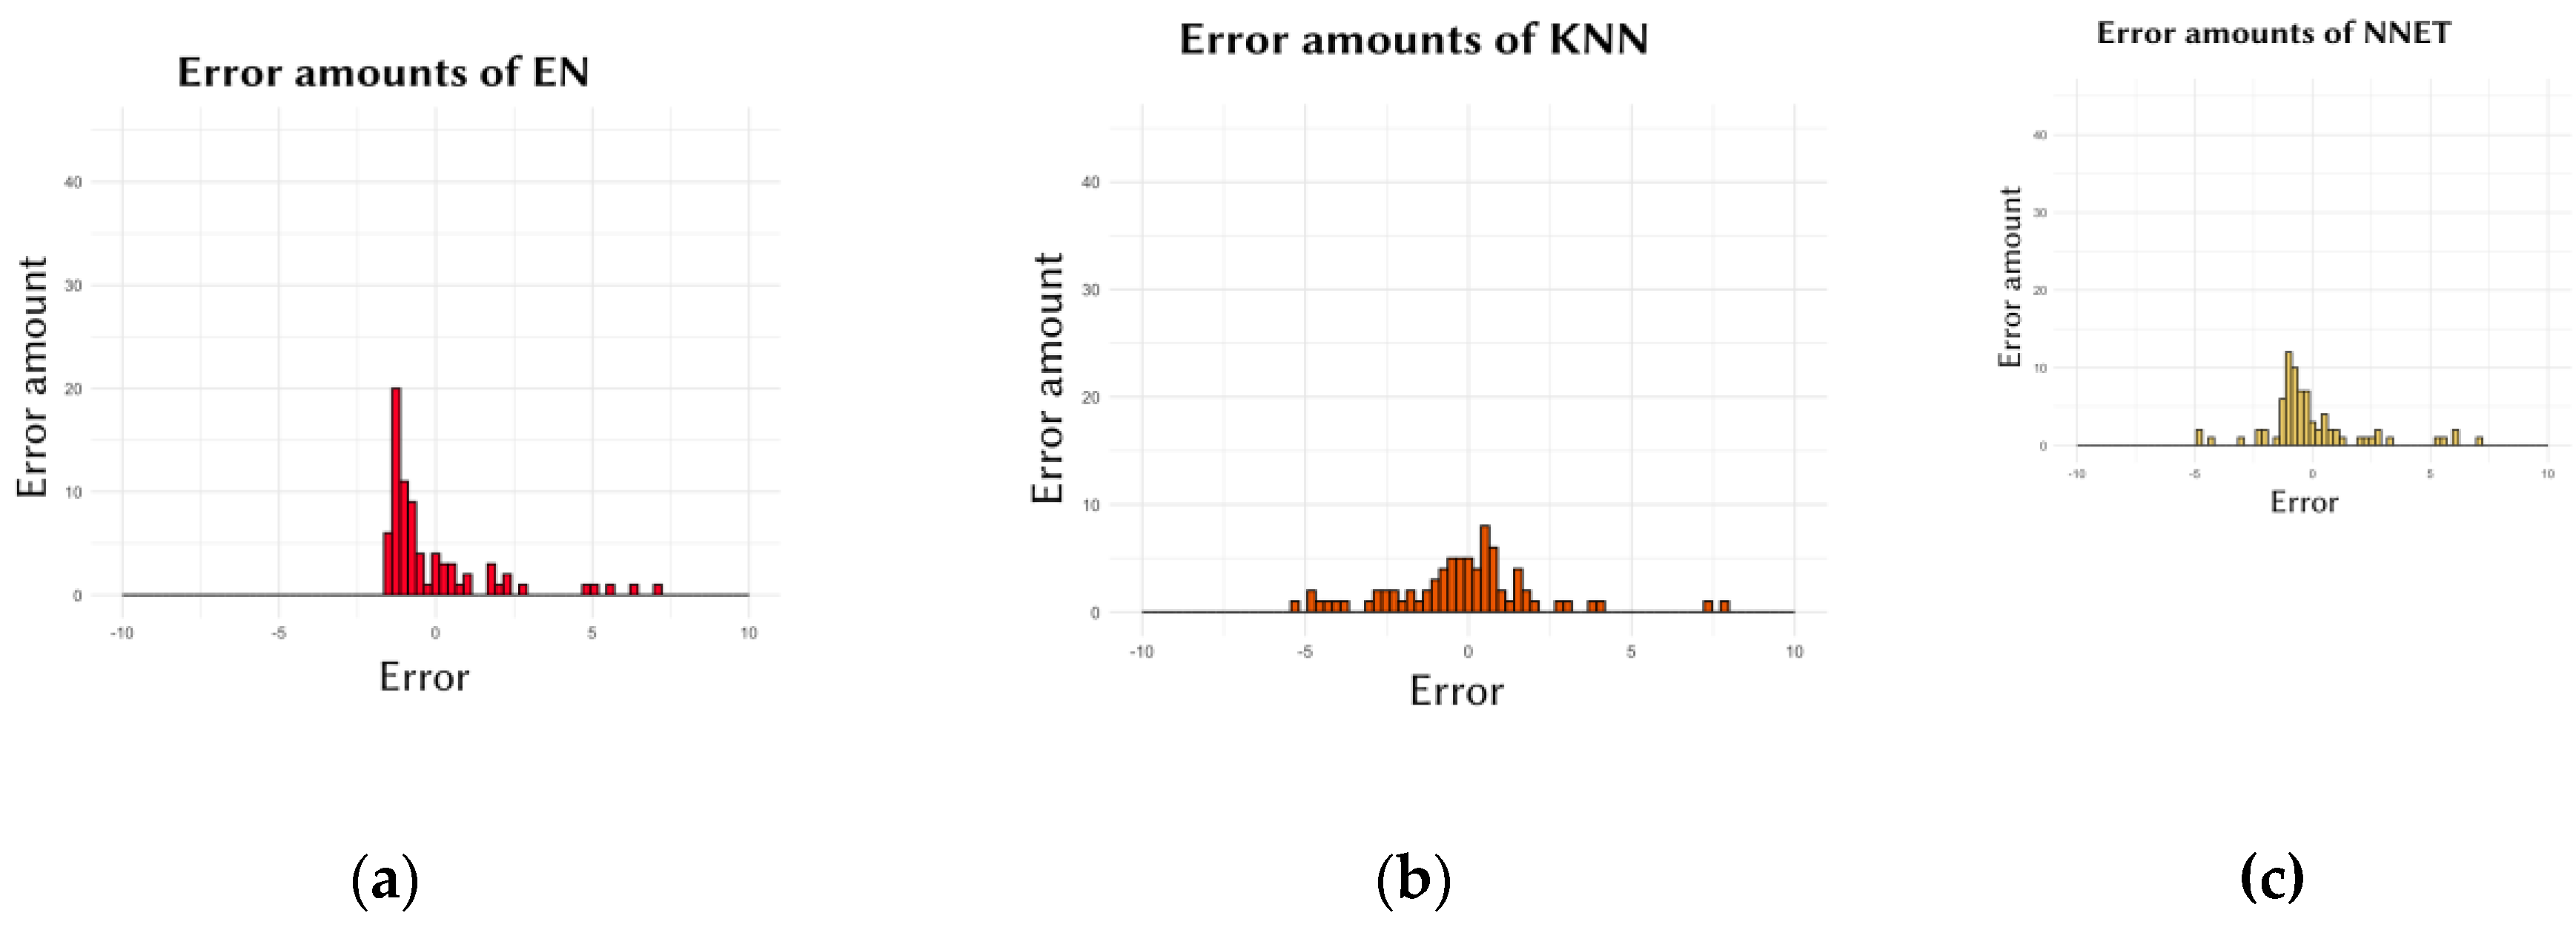
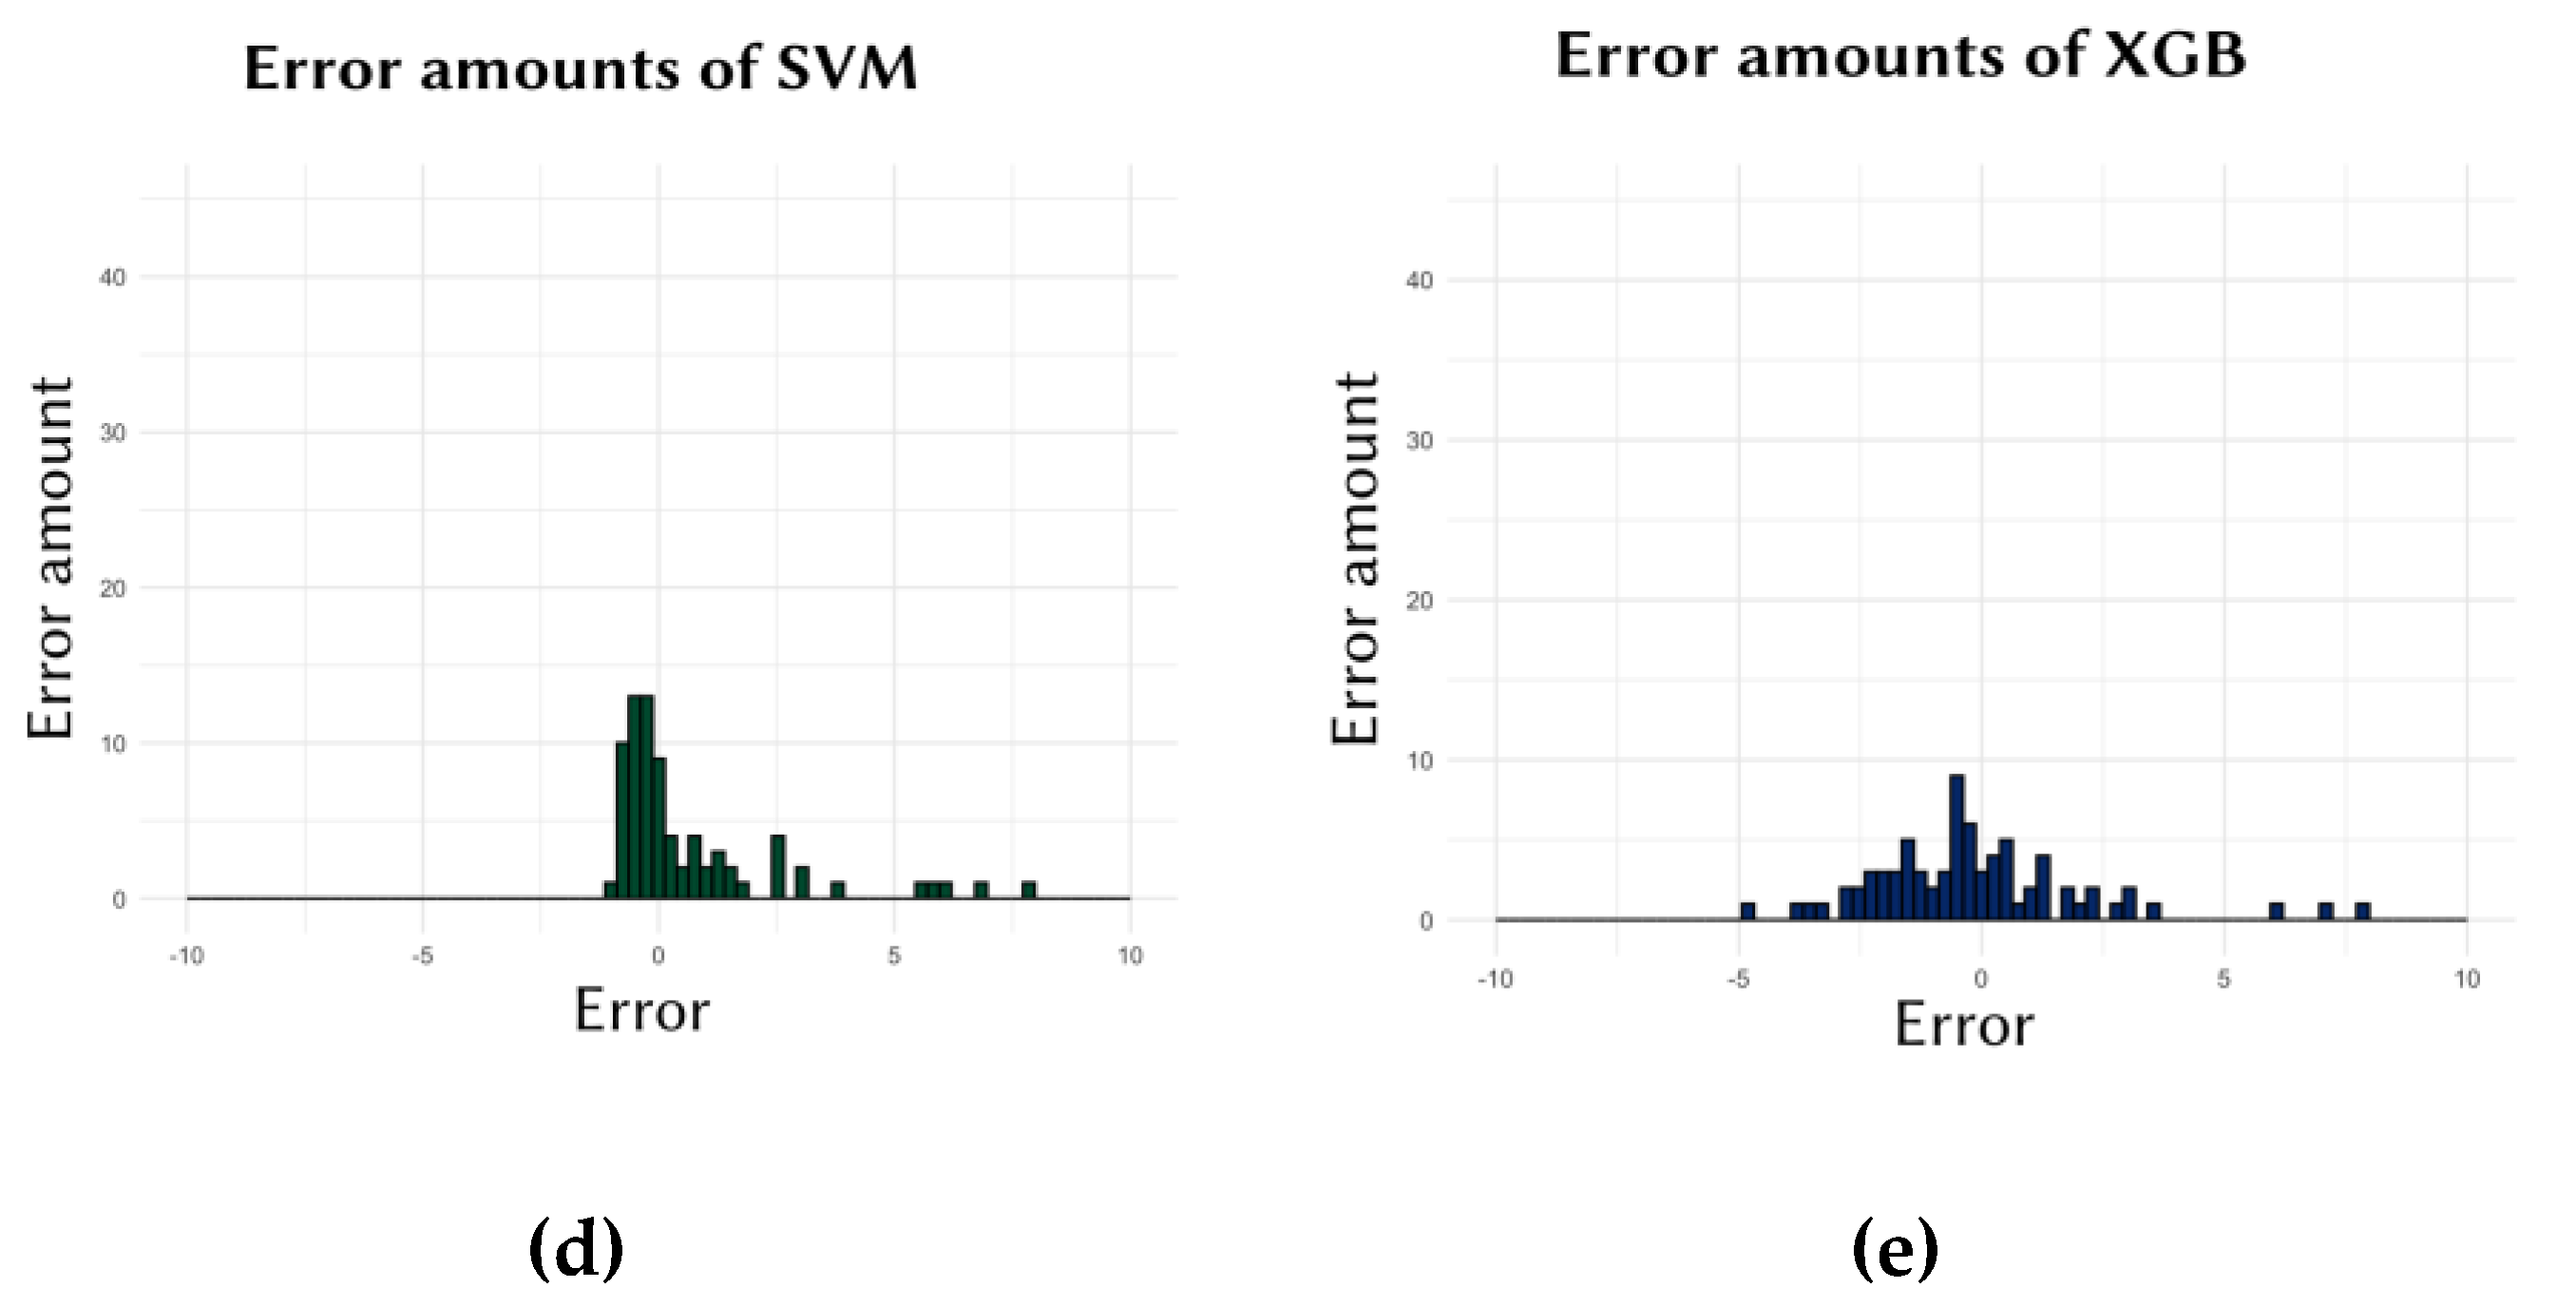
Figure 3.
Comparison of the predicted values (colored circles) and the actual values (light green triangles) for the models in the Data of 10. The X-axis represents the index numbers of the cell lines in the dataset, while the Y-axis represents the values. (a) EN, (b) KNN, (c) NNET, (d) SVM, and (e) XGB models show the performance of the models.
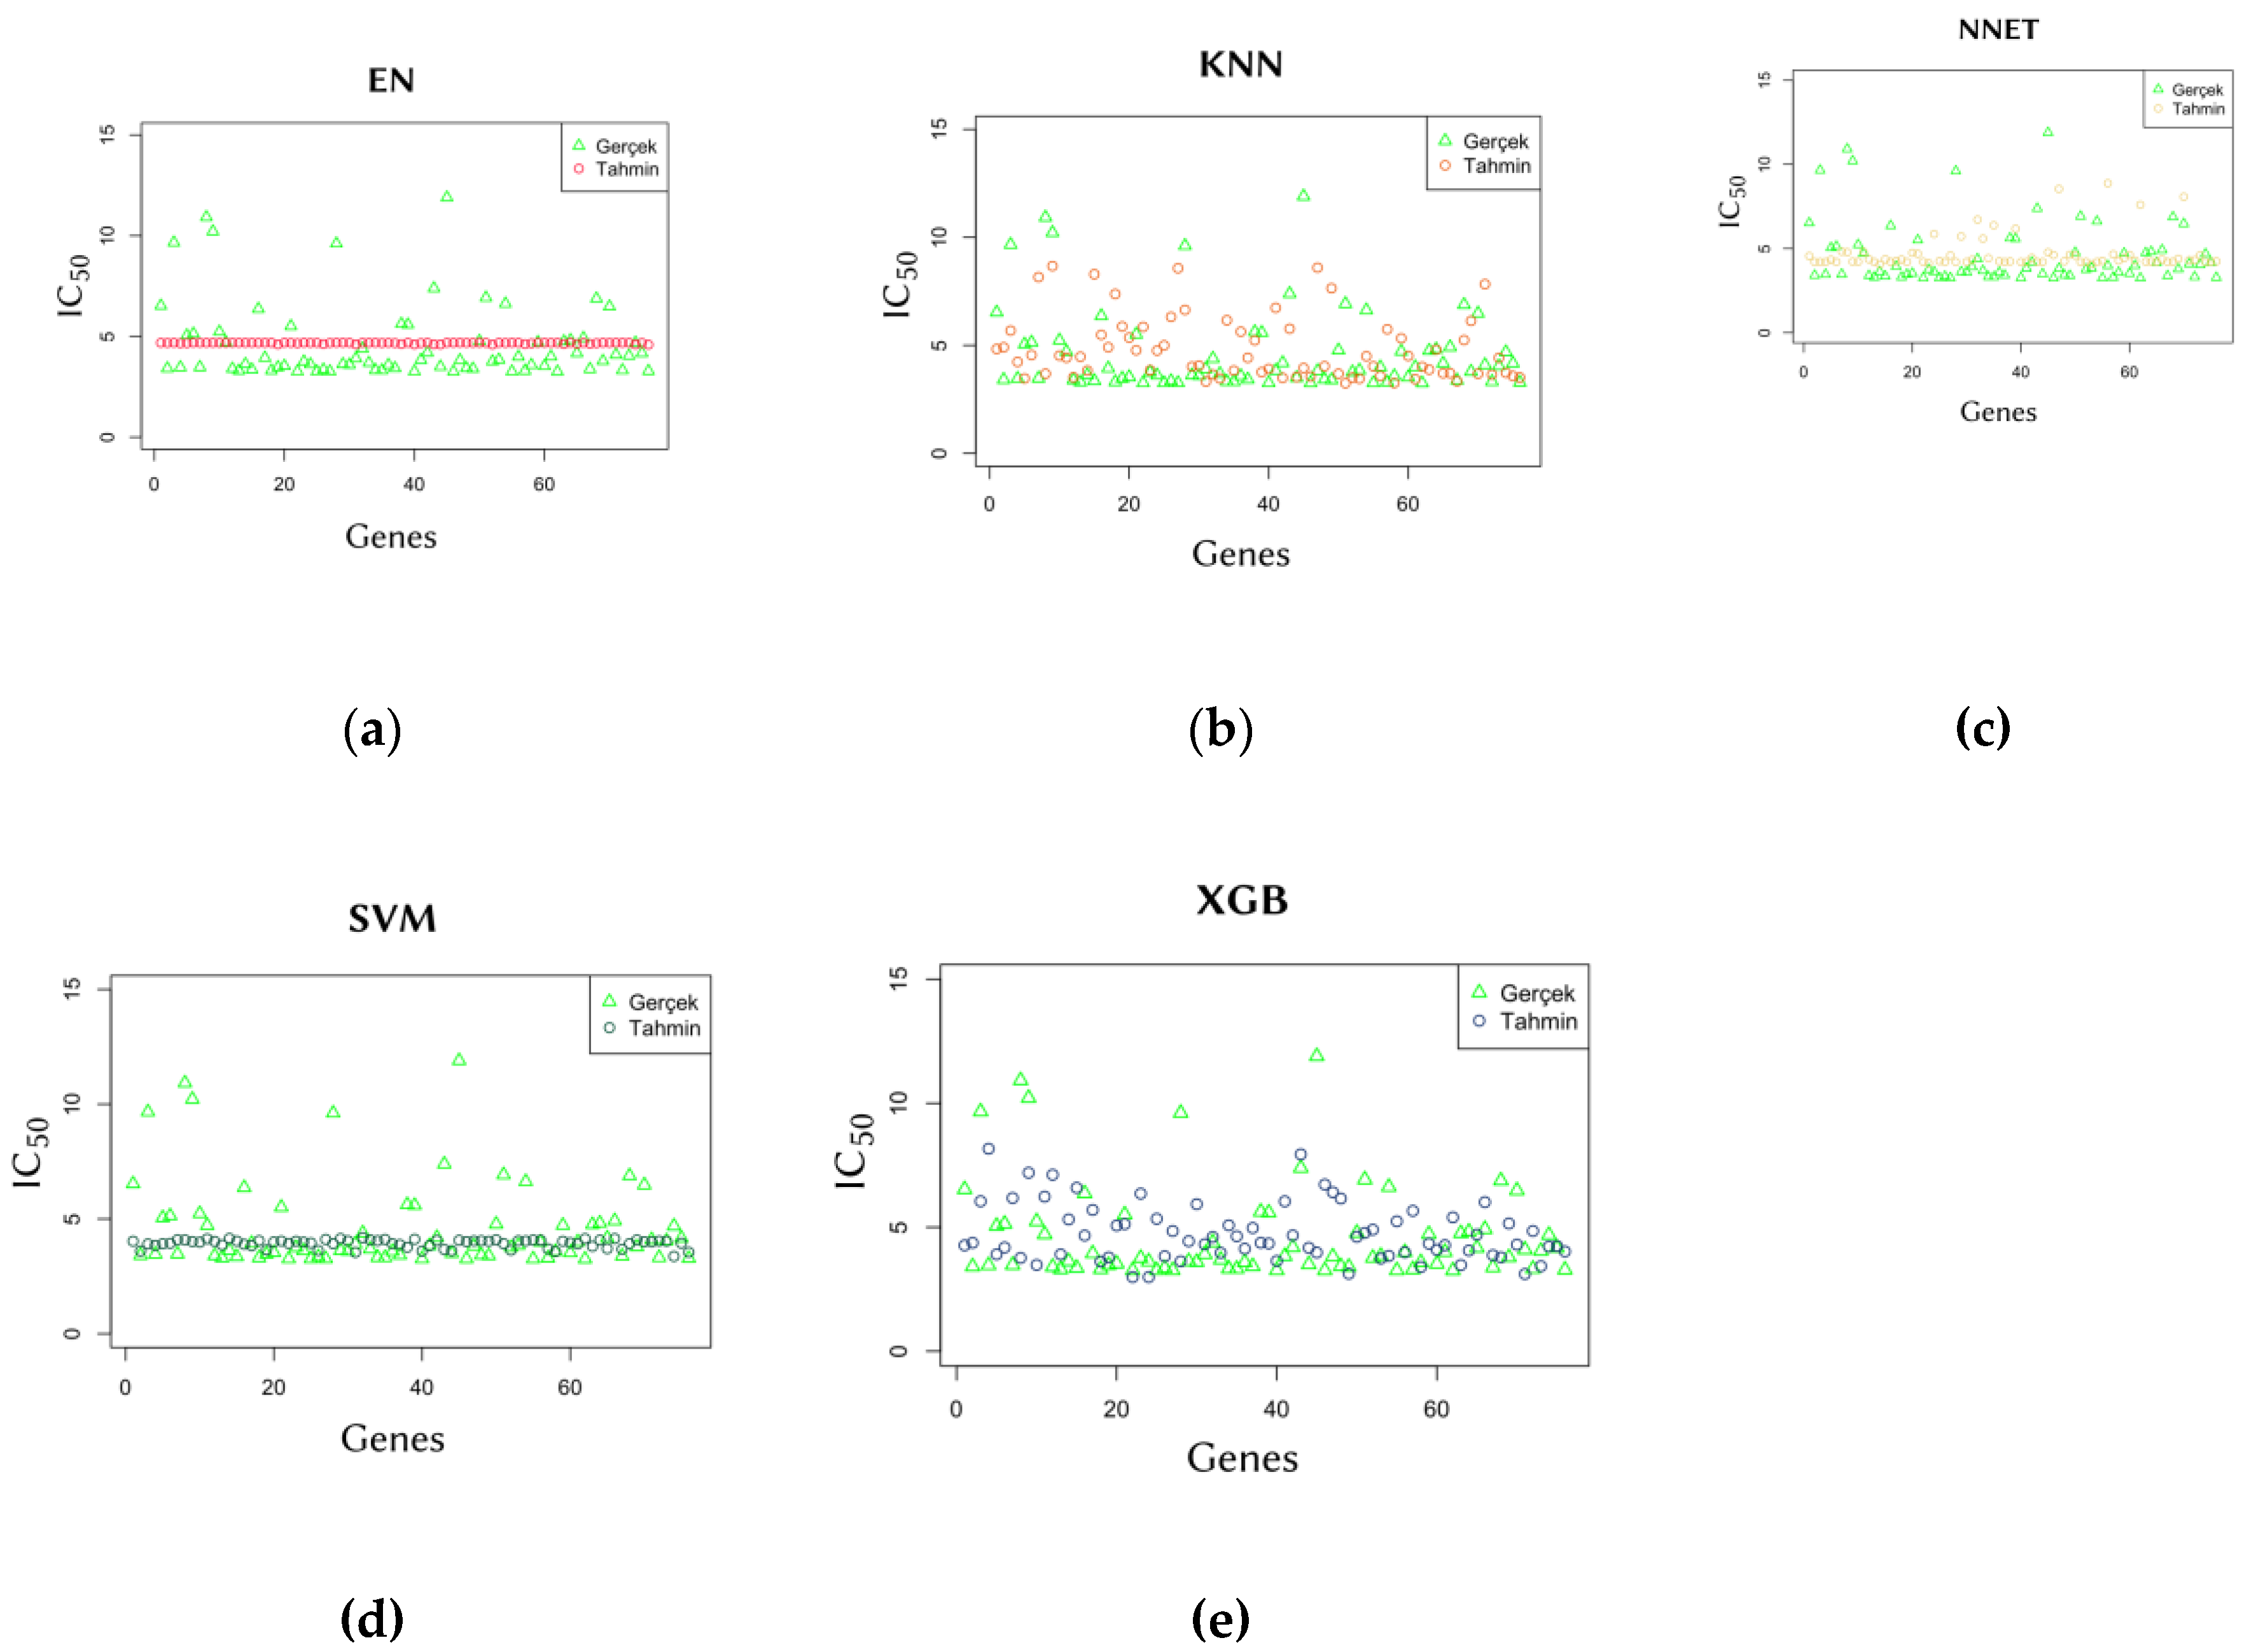
Figure 4.
This is the workflow diagram of the study.
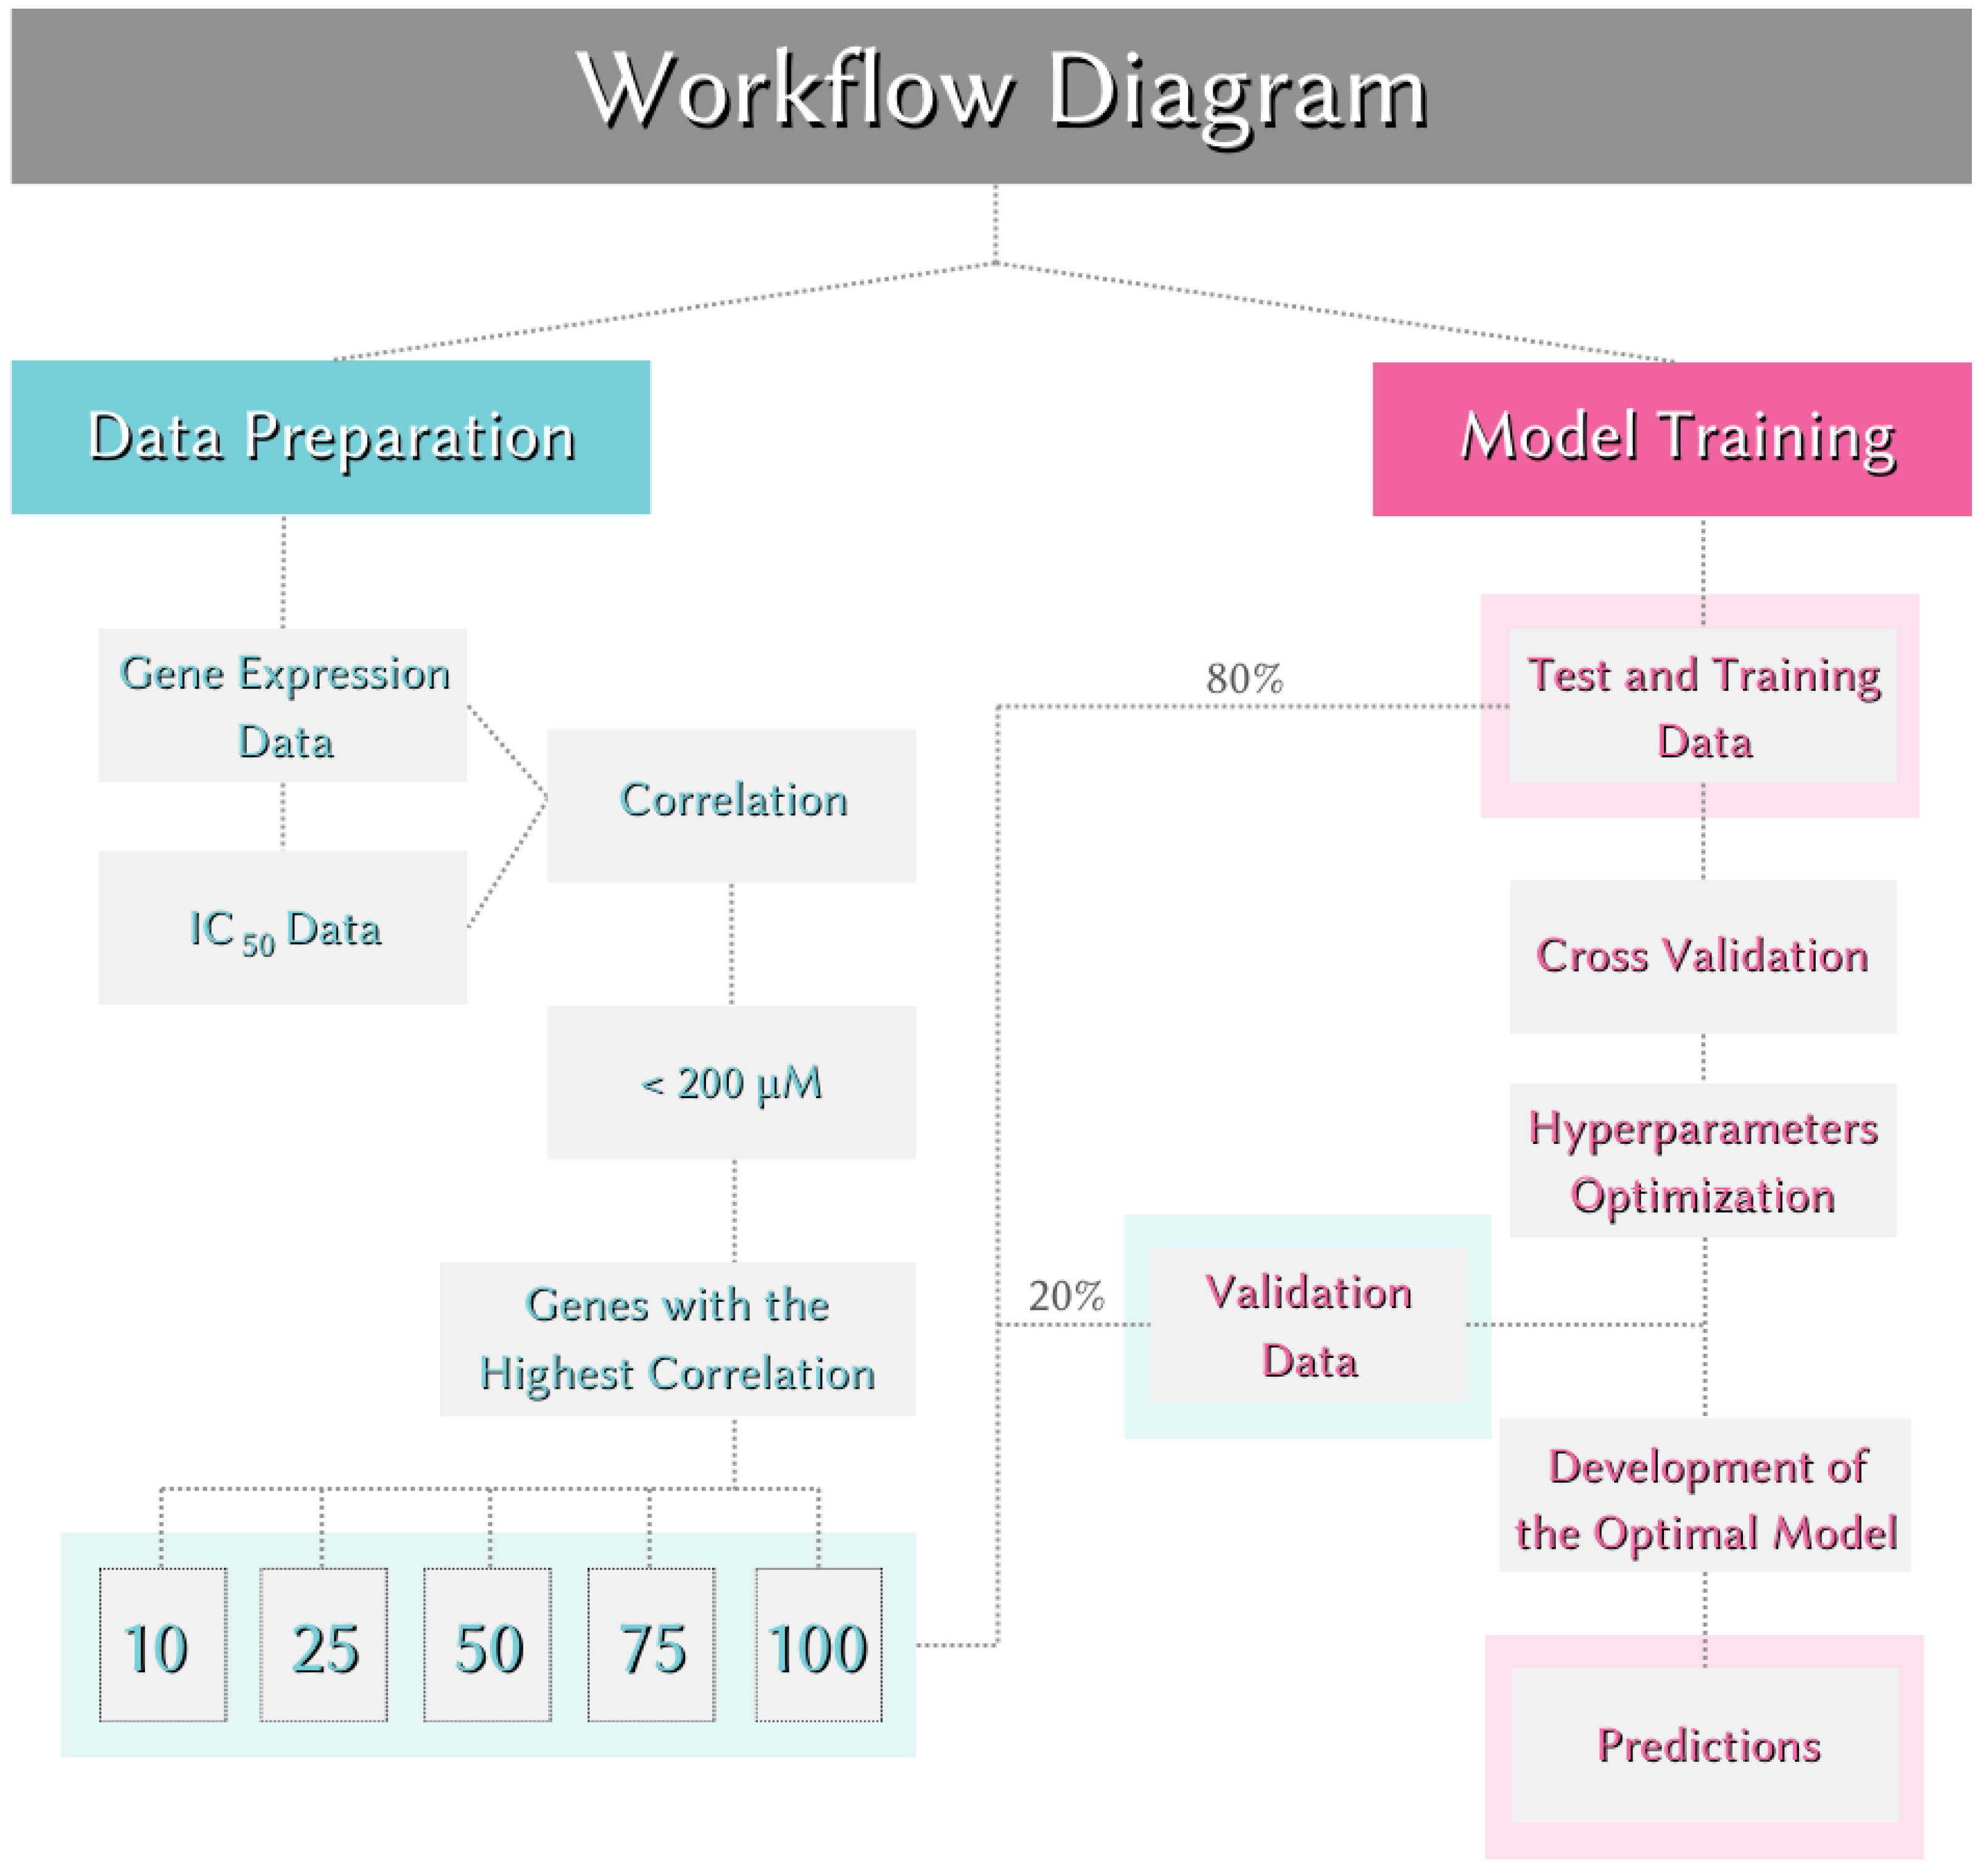

Table 1.
The mean absolute error (MAE) scores of OTX015 compound across different data dimensions and models based on the number of genes. The lowest MAE score and the dataset yielding this score are highlighted in bold.
Table 1.
The mean absolute error (MAE) scores of OTX015 compound across different data dimensions and models based on the number of genes. The lowest MAE score and the dataset yielding this score are highlighted in bold.
| Data | EN | KNN | NNET | SVM | XGB |
|---|---|---|---|---|---|
| Data of 10 | 1,357 | 1,625 | 1,491 | 1,143 | 1,593 |
| Data of 25 | 0,52 | 0,618 | 0,558 | 0,434 | 0,687 |
| Data of 50 | 1,04 | 1,174 | 1,167 | 0,855 | 1,307 |
| Data of 75 | 0,55 | 0,673 | 0,722 | 0,464 | 0,672 |
| Data of 100 | 0,281 | 0,355 | 0,491 | 0,254 | 0,352 |
Table 2.
Single-patient performance of the SVM model.
| Patient | Error | ||
|---|---|---|---|
| Patient 1 | 4,03 | 6,528 | -2,498 |
| Patient 2 | 3,604 | 3,413 | 0,191 |
| Patient 3 | 3,909 | 9,664 | -5,755 |
| Patient 4 | 3,843 | 3,464 | 0,379 |
*The continuation of Table 2 is on the next page.
Table 2.
(Continued). Single-patient performance of the SVM model.
| Patient | Error | ||
|---|---|---|---|
| Patient 5 | 3,918 | 5,052 | -1,134 |
| Patient 6 | 3,935 | 5,136 | -1,201 |
| Patient 7 | 4,091 | 3,476 | 0,615 |
| Patient 8 | 4,085 | 10,923 | -6,838 |
| Patient 9 | 4,014 | 10,214 | -6,2 |
| Patient 10 | 3,985 | 5,233 | -1,248 |
| Patient 11 | 4,131 | 4,716 | -0,585 |
| Patient 12 | 4,022 | 3,397 | 0,625 |
| Patient 13 | 3,871 | 3,302 | 0,569 |
| Patient 14 | 4,149 | 3,626 | 0,523 |
| Patient 15 | 4,036 | 3,359 | 0,677 |
| Patient 16 | 3,891 | 6,366 | -2,475 |
| Patient 17 | 3,83 | 3,939 | -0,109 |
| Patient 18 | 4,052 | 3,307 | 0,745 |
| Patient 19 | 3,651 | 3,469 | 0,182 |
| Patient 20 | 3,998 | 3,535 | 0,463 |
| Patient 21 | 4,038 | 5,51 | -1,472 |
| Patient 22 | 3,931 | 3,259 | 0,672 |
| Patient 23 | 4,03 | 3,755 | 0,275 |
| Patient 24 | 3,986 | 3,614 | 0,372 |
| Patient 25 | 3,953 | 3,26 | 0,693 |
| Patient 26 | 3,625 | 3,351 | 0,274 |
| Patient 27 | 4,108 | 3,264 | 0,844 |
| Patient 28 | 3,923 | 9,608 | -5,685 |
| Patient 29 | 4,144 | 3,622 | 0,522 |
| Patient 30 | 4,046 | 3,597 | 0,449 |
| Patient 31 | 3,542 | 3,907 | -0,365 |
| Patient 32 | 4,184 | 4,389 | -0,205 |
| Patient 33 | 4,085 | 3,69 | 0,395 |
| Patient 34 | 4,052 | 3,326 | 0,726 |
| Patient 35 | 4,107 | 3,318 | 0,789 |
| Patient 36 | 3,915 | 3,586 | 0,329 |
| Patient 37 | 3,882 | 3,424 | 0,458 |
| Patient 38 | 3,763 | 5,623 | -1,86 |
| Patient 39 | 4,115 | 5,589 | -1,474 |
| Patient 40 | 3,598 | 3,261 | 0,337 |
| Patient 41 | 3,835 | 3,833 | 0,002 |
| Patient 42 | 4,058 | 4,19 | -0,132 |
| Patient 43 | 3,67 | 7,39 | -3,72 |
| Patient 44 | 3,616 | 3,499 | 0,117 |
| Patient 45 | 4,068 | 11,897 | -7,829 |
| Patient 46 | 4,011 | 3,256 | 0,755 |
| Patient 47 | 4,045 | 3,818 | 0,227 |
| Patient 48 | 4,051 | 3,425 | 0,626 |
| Patient 49 | 4,029 | 3,399 | 0,63 |
| Patient 50 | 4,088 | 4,773 | -0,685 |
| Patient 51 | 3,923 | 6,924 | -3,001 |
| Patient 52 | 3,636 | 3,761 | -0,125 |
| Patient | Error | ||
| Patient 53 | 4,05 | 3,844 | 0,206 |
| Patient 54 | 4,044 | 6,627 | -2,583 |
| Patient 55 | 4,08 | 3,257 | 0,823 |
| Patient 56 | 4,073 | 3,991 | 0,082 |
| Patient 57 | 3,699 | 3,298 | 0,401 |
| Patient 58 | 3,579 | 3,582 | -0,003 |
| Patient 59 | 4,028 | 4,722 | -0,694 |
| Patient 60 | 3,961 | 3,524 | 0,437 |
| Patient 61 | 3,911 | 4,002 | -0,091 |
| Patient 62 | 4,14 | 3,251 | 0,889 |
| Patient 63 | 3,803 | 4,755 | -0,952 |
| Patient 64 | 4,075 | 4,819 | -0,744 |
| Patient 65 | 3,705 | 4,166 | -0,461 |
| Patient 66 | 4,142 | 4,921 | -0,779 |
| Patient 67 | 3,679 | 3,382 | 0,297 |
| Patient 68 | 3,922 | 6,88 | -2,958 |
| Patient 69 | 4,084 | 3,784 | 0,3 |
| Patient 70 | 4,006 | 6,483 | -2,477 |
| Patient 71 | 4,001 | 4,095 | -0,094 |
| Patient 72 | 4,04 | 3,319 | 0,721 |
| Patient 73 | 4,033 | 4,043 | -0,01 |
| Patient 74 | 3,37 | 4,689 | -1,319 |
| Patient 75 | 3,943 | 4,166 | -0,223 |
| Patient 76 | 3,548 | 3,283 | 0,265 |
| Mean Absolute Error (MAE) | 1,143 | ||
*The continuation of Table 2 is on the next page.
Disclaimer/Publisher’s Note: The statements, opinions and data contained in all publications are solely those of the individual author(s) and contributor(s) and not of MDPI and/or the editor(s). MDPI and/or the editor(s) disclaim responsibility for any injury to people or property resulting from any ideas, methods, instructions or products referred to in the content. |
© 2024 by the authors. Licensee MDPI, Basel, Switzerland. This article is an open access article distributed under the terms and conditions of the Creative Commons Attribution (CC BY) license (http://creativecommons.org/licenses/by/4.0/).
Copyright: This open access article is published under a Creative Commons CC BY 4.0 license, which permit the free download, distribution, and reuse, provided that the author and preprint are cited in any reuse.


