
Submitted:
27 June 2024
Posted:
27 June 2024
You are already at the latest version
Abstract
Abstract: Giant Cell Arteritis (GCA) is an autoimmune/autoinflammatory disease affecting large vessels in patients over 50 years old. The disease presents as an acute inflammatory response with two phenotypes, cranial-GCA and Large Vessel Vasculitis (LV)-GCA, involving the thoracic aor-ta and its branches. 18F-fluorodeoxyglucose positron emission tomography-computed tomogra-phy (18F-FDG PET-CT) is among the imaging techniques contributing to diagnosis of patients with systemic disease. However, its association with soluble inflammatory markers is still elu-sive. This proof-of-concept study aims to identify novel soluble serum biomarkers in PET/CT pos-itive patients with LV-GCA and associate them with active (0 months) and inactive disease (6 months following treatment), in sequential samples. The Most-Disease-Segment Target-to-Background Ratio (TBRMDS) was calculated for 9 LV-GCA patients, while 12 cranial-GCA and 7 Polymyalgia Rheumatica patients with negative initial PET/CT served as disease controls. Serum macrophage-related cytokines were evaluated by Cytometric Bead Array (CBA). Finally, previously published NMR-metabolomics data acquired at the same blood sampling were associated with PET/CT findings. TBRMDS was significantly increased in active versus inactive disease (3.45 vs. 2.55, p=0.008). The analysis identified 6 serum metabolites, as more sensitive to change from the active to inactive state. Among them, choline levels were exclusively altered in the LV-GCA group, but not the disease controls. Cytokine levels were not associated with PET/CT activity. Combining with CRP, ESR, and TBRMDS a composite index was generated to depict well the differences between active and inactive systemic LV-GCA (25.45 vs 11.45, p=0.0039). These preliminary results could pave the way for more extensive studies integrating serum metabolomic parameters with PET/CT imaging data to extract sensitive composite disease indexes useful for the everyday clinical practice.
Keywords:
Giant Cell Arteritis
; Large Vessel Vasculitis
; Cytokines
; Metabolomics
; 18F-FDG PET-CT
1. Introduction
Large vessel vasculitides (LVV) constitute a heterogeneous group of autoimmune/autoinflammatory diseases, affecting mainly the aorta, the aortic arch and its branches. Giant cell arteritis (GCA) is considered the prototype LVV, particularly in older adults and presents primarily with two different phenotypes: i) disease limited to temporal arteries (limited form, cranial-GCA) and ii) disease extending beyond, affecting mainly the thoracic aorta and its branches (systemic form, LV-GCA) [1]. The disease is considered as a prototypic delayed type hypersensitivity reaction in both acute and chronic form. Indeed, the inflamed vessels are infiltrated by activated macrophages, Th1, Th17, B cells and neutrophils that orchestrate a robust inflammatory response insulting the vessel wall [2].
In recent years, several imaging tools have been developed to depict the extent of the disease [3]. Among them, 18F-fluorodeoxyglucose positron emission tomography–computed tomography (18 F-FDG PET/CT, hereafter called PET/CT) is considered one of the most commonly used tools both for diagnosis and assessment of disease severity. PET/CT not only locates inflammatory isles within the vasculature bed, but provides also quantitative information on the metabolic activity of immune cells (i.e., activated macrophages, giant cells, and T-cells) [4], distinguishing vasculitic from atherosclerotic lesions. Several studies have assessed the relationship between PET/CT findings with disease activity and remission. Recently, the 2022 American College of Rheumatology/EULAR GCA classification criteria emphasized the use of PET/CT as well as other imaging modalities, such as vascular ultrasound and MRI, for use in clinical practice [5]. However, the standardization of scoring methods in PET/CT remains an unmet need in the field [6]. In addition, the relationship between PET/CT related markers and soluble factors of inflammatory response has not yet been investigated in the context of LV-GCA disease.
In this study we sought to investigate the associations between disease activity assessed by PET/CT and soluble macrophage related inflammatory markers, metabolites, and lipids in the serum of LV-GCA patients at the active and inactive disease state. Such an attempt is anticipated to better describe this set of patients during each disease state and create new stratification tools, based on the combination of serum biomarker and vascular imaging data.
2. Materials and Methods
2.1. Study Cohort
For the current study, 28 newly diagnosed patients with GCA and PMR who were followed up at the Rheumatology outpatient clinic of the Department of Pathophysiology in Laiko General Hospital, were prospectively recruited between 2021 and 2023. All patients had to fulfill the 2012 American College of Rheumatology (ACR)/European Alliance of Associations for Rheumatology (EULAR) classification criteria for PMR [7] or the 1990 American College of Rheumatology/EULAR classification criteria for GCA [8]. GCA patients with negative 18-FDG-PET/CT at diagnosis were classified as having cranial-GCA (n=12) while those with positive 18-FDG-PET/CT as LV-GCA (n=9). All PMR patients (n=12) had both negative temporal artery biopsy (TAB) and PET/CT scan. The definitions of positive or negative PET/CT are described below. Each LV-GCA patient underwent 2 sequential PET/CT scans: one at the time of diagnosis (active phase) and the second, 6 months after treatment initiation when patients were in remission (inactive phase). The 12 cranial-GCA and the 7 PMR patients served as controls and underwent PET/CT scans only at the time of diagnosis. Blood samples were also collected from all participants at diagnosis (active phase) and 6 months after glucocorticoid (GC) treatment (inactive phase) to measure acute phase reactants and inflammatory cytokines.
Active disease for GCA and PMR patients was defined as the presence of both clinical symptoms and increased acute phase reactants (ESR >20 mm/h and CRP >5 mg/l). The opposite definition was applied to define disease remission. All participants were in complete remission after 6 months of treatment. The study was approved by the Ethics Committee of the School of Medicine, National and Kapodistrian University of Athens, Greece. All participants gave written informed consent before enrollment.
2.2.18. F-FDG PET/CT Imaging Protocol
Following overnight fasting for ≥6 hours and if blood glucose levels were <180mg/dL before radiotracer injection, participants underwent PET/CT imaging. Ninety minutes following intravenous administration of 18F-FDG (3.7MBq per kg patient weight), PET/CT (Biograph, Siemens, Forchheim) imaging from the top of the skull to the mid-thigh level was performed with the patient placed in supine position. Attenuation correction and co-registration were performed with a low dose non-gated non-contrast enhanced CT (120kV - 30 - 70 mAs) scan. PET images were reconstructed using a standard Iterative Ordered-Subset Expectation Maximization algorithm. The reconstruction scheme consisted of 4 Iterations 5 Subsets of 440 x 440 image matrix
2.3.18. F-FDG PET/CT Measurements
18F-FDG PET/CT anonymized images were assessed qualitatively and semi-quantitatively by an experienced reader who was unaware of patients’ diagnoses and laboratory parameters. To assess large vessel involvement, the degree of arterial uptake was visually assessed relative to liver uptake in the aorta and its branch arteries as follows: 0 = no uptake; 1 = less than liver; 2 = same as liver; 3 = greater than liver [9]. Patients with a relative degree 0 or 1 were classified as having a negative PET/CT while those with FDG uptake greater that liver (degree of 2 or 3) as having a positive PET/CT. To investigate the relationship between PET/CT findings with soluble mediators of inflammation, semiquantitative image analysis was performed, the basic principles of which have been previously described [6,10]. In brief, cross sections of circular or ellipsoid volumes of interest (VOI) around the arterial wall were manually drawn along the whole vessel in consecutive axial images at intervals of 5 mm for the thoracic and abdominal aorta. For 18F-FDG uptake quantification, maximum standardized uptake value (SUVMAX) based on body weight was recorded as the highest pixel activity within each VOI. To normalize arterial PET signal for blood activity, 6 ROIs (3 to 4 mm in diameter) at least were placed over the superior vena cava (SVC) and average SUV mean value was calculated. Abnormal FDG uptake was defined as focal or diffuse uptake higher than the physiological uptake in the liver or mediastinal vascular vessels, and higher than the activity in the surrounding tissue. The arterial target-to-background ratio (TBR) was then derived by dividing the mean arterial SUVMAX to the average value of venous SUVMEAN estimated from the SVC. TBR of the abdominal aorta (TBRABD) was calculated as the average value of suprarenal and infrarenal abdominal aorta. Furthermore, global TBRaorta (TBRGLOBAL) was derived by calculating the sum of TBRs of ascending and descending aorta, aortic arch, suprarenal and infrarenal abdominal aorta divided by 5. TBR of the most diseased aortic segment (TBRMDS) was also obtained by selecting the slice with the highest SUVMAX and calculating the mean of the SUVMAX from this and the two neighboring slices. These semiquantitative measurements were subsequently used for generation of composite indices, which are described in detail below.
2.4. Cytometric Bead Array
Cytokines were measured using microbead arrays. A pre-validated array of 13 macrophage-related biomarkers was used from BioLegend (Cat. # 740502). The biomarkers tested were as follows: IL-12p70, TNF-α, IL-6, IL-4, IL-10, IL-1β, Arginase, CCL17(TARC), IL-1RA, IL-12p40, IL-23, IFN-γ, CXCL10 (IP-10). Samples were processed in duplicate and analyzed per manufacturer’s instructions. Beads were assayed using a BD Biosciences FACSCalibur™; analysis of all fcs files to determine protein concentrations was done via BioLegend Qognit cloud-based software.
2.5. Metabolomics Data
In the current study, a part of serum NMR metabolomics data set from the same GCA and PMR patients, already published recently from our team was utilized for further analysis [11]. More precisely, NMR metabolomics data were available for the 9 LV-GCA patients, 10 cranial-GCA patients and 7 PMR patients included in the current study. The corresponding NMR data were used to investigate plausible correlations between the features of the two different techniques. The NMR data of the specific individuals, include 21 metabolites (identified and quantified in SMolESY platform using 1D-NOESY NMR spectra) and 20 lipids (derived from LED spectra) and are presented in Supplementary Tables S1 and S2.
2.6. Composite Index Generation
Three composite index metrics were formed combining PET/CT measurements, CRP levels, ESR levels, and metabolite levels that demonstrated significant differences between activity and inactivity. All metrics, CRP, ESR, and choline levels were transformed into categorical values (Supplementary Table S3) to quantify in the same scale. Composite index 1 is the sum of TBRMDS, CRP-categorical, and ESR-categorical. Composite index 2 is the sum of TBRMDS, CRP-categorical, ESR-categorical, and Choline-categorical. Finally, composite index 3 is the sum of CRP-categorical, ESR-categorical, and Choline-categorical.
2.7. Statistical Analysis
Quantitative data are presented as medians and interquartile range (IQR), whereas qualitative variables as absolute and relative frequencies. For comparing non-parametric continuous variables and after implementing the Shapiro–Wilk normality test, the Wilcoxon signed rank test was used for statistical analysis. A two-tailed P<0.05 was considered to indicate statistical significance. Spearman’s correlation coefficient was used to assess correlations. For comparisons among multiple groups, a non-parametric Kruskal-Wallis-Test was used and Dunn’s test correction method was employed. Analysis was conducted using GraphPad Prism software for Mac (version 10.1.1) (GraphPad Software, San Diego, CA). PCA analysis was performed using Python (version 3.8.19) and the scikit-learn package (version 1.4.2).
3. Results
3.1. PET/CT Imaging Can Discriminate between Disease Activity and Remission in LV-GCA
Table 1 shows patients’ characteristics for the 3 patient groups included in the study. The ability of 18F-FDG-PET/CT to distinguish between the active and inactive phase in patients with LV-GCA was investigated. For this purpose, PET/CT imaging data collected at the 2 pre-defined time points were analyzed and compared accordingly. The median time between the active and inactive phase of the disease in the 9 LV-GCA patients was 6 months. Patients in the active phase presented higher TBR scores in ascending (TBRASC), aortic arch (TBRARC), abdominal (TBRABD), descending (TBRDSC), and global aortic (TBRGLOBAL) measurements compared to remission (p < 0.05 for all comparisons, Supplementary Table S4). A representation of TBRMDS measurement is shown in Figure 1A-B.
TBRMDS and TBRGLOBAL were significantly decreased from the active to inactive phase [(3.45 vs. 2.55, p = 0.008) (Figure 1C) and (2.66 vs. 2.07, p=0.0391) (Figure 1D), respectively]. There was a very strong correlation between TBRMDS and TBRGLOBAL with active and inactive disease states (r ≥ 0.95, p < 0.01 for both comparisons) and therefore TBRMDS was selected for the rest of the analysis.
The traditional inflammatory markers CRP and ESR confirmed clinical observations, showing a statistically significant reduction from disease activity to remission state (Figure 1E-F).
3.2. Serum Levels of Certain Metabolites, and Lipids, But Not Cytokine Levels Are Altered Significantly in LV-GCA Patients from Active to Inactive Disease States
To further identify other markers of systemic inflammation related to the active phase of LV-GCA compared to remission, we analyzed and compared serum levels of cytokines, metabolites, and lipids in LV-GCA patients between the 2 phases.
Interestingly, there were no statistically significant changes in serum levels of macrophage-related cytokines between disease activity and remission among LV-GCA patients (Supplementary Table S5).
Patients demonstrated an increase in serum levels of alanine (p=0.0195), choline (p=0.004), dimethyl sulfone (p=0.012) and certain lipids [CH2—lipids (p=0.04), and unsaturated lipids CH=CH (p=0.027)] as opposed to a decrease in GlycB levels (p=0.04) from the active to inactive phase (Figure 2A). The analysis of the 21 quantified metabolites and the assigned lipid moieties is presented in Supplementary Table S6.
Analysis of serum macrophage-related cytokines, 21 quantified metabolites and the assigned lipid moieties is presented in Supplementary Tables S7 and S8 for cranial-GCA and PMR patients, respectively. Out of the 6 metabolites that were altered in the LV-GCA group, choline and dimethyl sulfone were found to be significantly increased from active to inactive disease states exclusively in the LV-GCA group (Figure 2A-C).
Next, we calculated ΔCholine values (the difference in choline levels between active and inactive disease) and ΔDimethyl sulfone values (the difference in dimethyl sulfone levels between active and inactive disease) in all three groups. The comparison of ΔCholine and ΔDimethyl sulfone among the 3 subgroups showed that only choline levels were significantly altered in the LV-GCA group, while dimethyl sulfone difference between disease activity and inactivity was similar (Figure 2 D).
3.3. Generation of Composite Indices for the Determination of Disease Activity/Remission
To develop a more accurate tool for disease activity, we performed PCA analysis using the various parameters that were found to be statistically significant altered in LV-GCA patients between activity and remission, such as CRP, ESR, TBRMDS, and choline levels. The first PCA model was a combination of TBRMDS to CRP and ESR, resulted into a cumulative explained variance of 97% for the two principal components (Q2 = 0.95, 95CIPC1: 0.65 to 0.92, 95CIPC2: 0.06 to 0.30) (Figure 3A). The addition of choline to CRP, ESR and TBRMDS resulted into a cumulative explained variance of 86% for the two principal components (Q2 = 0.73, 95CIPC1: 054 to 0.81, 95CIPC2: 0.11 to 0.35) (Figure 3B). The addition of choline to CRP and ESR, resulted into a cumulative explained variance of 97% for the two principal components (Q2 = 0.96, 95CIPC1 : 0.58 to 0.86, 95CIPC2 : 0.11 to 0.40) (Figure 3C). PCA analysis demonstrated that every combination of tested parameters has the capacity to discriminate between the 2 phases of the disease.
Based on the findings of PCA analysis, we sought to generate different composite indices to assess disease activity in LV-GCA patients. Composite index 1 (the sum of TBRMDS, CRP-categorical, and ESR-categorical) showed a statistically significant reduction from the active to inactive disease (p=0.0039) (Figure 3D). In addition, Composite index 2 (the sum of TBRMDS, CRP-categorical, ESR-categorical, and Choline-categorical) (Figure 3E) and composite index 3 (the sum of CRP-categorical, ESR-categorical, and Choline-categorical) (Figure 3F) also showed a statistically significant decrease from the active to inactive disease. These data suggest that every combination of markers tested to generate a composite index of disease activity was able to separate the two groups effectively and there was no overlap of composite index values between the two disease states.
4. Discussion
In this proof-of-concept study, we have demonstrated the ability of 18F-FDG PET/CT imaging to distinguish disease activity and remission in LV-GCA patients and investigated the relationship between PET/CT findings with soluble mediators of inflammation using the TBR values of PET/CT. We found that metabolic inflammatory mediators (e.g., choline) rather than inflammatory cell-derived mediators (cytokines) are associated with 18F-FDG-PET/CT TBR values. Furthermore, choline levels were altered in the peripheral blood exclusively in the LV-GCA patient group and not in the inflammatory disease control groups consisted of PMR and cranial-GCA patients with negative PET/CT. In addition, TBR was significantly decreased from the active to inactive phase in LV-GCA patients. Finally, the composite index combining the traditional disease activity markers (ESR and CRP) and imaging markers along with choline levels, was able to cluster patients more efficiently compared to only ESR, CRP, and TBR.
Considering that in LV-GCA, the vascular wall is infiltrated by activated immune cells contributing to the signal intensity of PET/CT and that after glucocorticoid treatment there is a rapid switch of glycolysis to oxidative phosphorylation, it is conceivable that FDG can make a distinction between the active and inactive phase of the disease. However, in agreement with prior studies [12], we found a considerable overlap of TBR values between the two disease time points, due to the fact that FDG uptake could also represent vascular remodeling and not immune cell activity only. To this end, more specific immuno-PET tracers are currently under investigation for vasculitis. By obtaining a deeper insight into how specific cell subpopulations are involved and behave in the pathogenesis of specific forms of vasculitis, we may update our current tools for more accurate assessment of disease activity [13,14].
In that direction, the activated fibroblast has attracted interest for the development of specific radiotracers [fibroblast activation protein inhibitor (FAPI PET/CT)] for the diagnosis and monitoring of LV-GCA [15]. Additionally, we found that altered choline levels are associated with disease activity, indicating that choline-based radiotracers may also be alternative candidates to be utilized in the assessment of LV-GCA activity. In a murine model of atherosclerosis, 18F-Choline could better identify atherosclerotic plaques compared to the traditional radiotracer 18FDG, a phenomenon attributed to the increased choline uptake by macrophages as shown by in vitro studies [16]. Contributing to the animal model findings, a study in stroke patients indicated an increase in 18F-fluorocholine (18F-FCH) uptake in the affected carotid plaques that correlated with CD68+ cells in the endarterectomy biopsies of the same patients [17].
Choline is an essential nutrient for cell structure and plays a part in different biosynthesis pathways. Increased serum levels of choline have been associated with an increased cardiovascular disease risk [18], cerebrovascular disease risk [19], and increased risk of artery stenosis in hypertensive patients [20]. From a mechanistic perspective, macrophages, upon LPS (lipopolysaccharide) stimulation, present an increase in choline uptake and subsequent phosphatidylcholine synthesis, a biochemical process that renders them capable of proinflammatory cytokine production [21]. Choline can be transported into macrophages via the choline transporter-like protein-1 (CTL1). The inflammatory-macrophage phenotype can be abrogated by CTL1 inhibition of choline uptake [22]. The above in vitro data suggest a central role of choline in macrophage metabolism and inflammatory signaling.
Previous studies have investigated the serum levels of several cytokines and chemokines in GCA and PMR patients [23]. IL-6 is considered as the major cytokine in GCA pathogenesis that correlates with disease activity [24]; a finding that hasn’t been validated in our study. The fact that serum levels of macrophage-related cytokines didn’t differ between activity and remission in the LV-GCA patient cohort may be attributed to the small sample size tested, but other reasons could also apply including the different disease states and clinical phenotypes included in each study, the median time between treatment initiation and blood sampling and the implementation of various analytical methods (ELISA, Luminex assay, and Cytometric bead Array) [25,26]. Consequently, different cytokine expression levels are reported in the literature [27]. Furthermore, their upregulated protein expression may be restricted to tissue injury. The restricted-to-tissue injury production of cytokines has been shown recently in Takayasu Arteritis tissue injury, where IL-6 protein expression was increased in the affected vessels and not in the peripheral blood of patients [28]. The above data suggest that the determination of accurate cytokine levels depends on a set of factors and the results are not always representative of the disease state.
There is a limited number of studies investigating the serum metabolome in GCA and PMR patients [29]. Our previous work on NMR-based metabolomics in the serum of GCA and PMR patients yielded a number of metabolites and lipid moieties significantly altered from activity towards disease inactivity [11]. Among the results reported, N-acetylglycoproteins (GlycA and GlycB) and cholines were identified as predictive markers of disease activity both in GCA and PMR. However, in the current study, cholines were associated only with LV-GCA as well as signals from GlycB but not GlycA N-acetyl glycoproteins were associated with LV-GCA. GlycA exhibited a borderline p value of 0.0547. These findings may be attributed to the lower number of patients included in the current study and the subgrouping of patients based upon their disease endotype.
The strengths of this proof-of-concept study include encompassing different serum markers (cytokines, metabolites, lipids) along with normalized imaging data in two time points of the disease in an attempt to extract novel next-generation biomarkers of disease activity [2]. Moreover, our study highlights the central role for immunometabolism in the field of biomarker discovery though further data enrichment is required. The limitations of our study include the small patient cohort used since we opted to include LV-GCA patients who have undertaken two PET/CT scans from a single radiology center to avoid noise in the PET/CT results caused by different instrumentation.
5. Conclusions
In conclusion, the search for more sensitive disease activity biomarkers in LV-GCA can benefit from integrating patient clinical and imaging parameters with different omics technologies. Even if PET/CT is a sensitive method for assessing disease extent and activity, clinicians often face difficulties in everyday clinical practice. Thus, more studies, including wider patient cohorts, need to be conducted in order to extract novel biomarkers and composite indices capable of translating PET/CT imaging data into the fluid phase to increase the sensitivity of disease activity monitoring.
Supplementary Materials
The following supporting information can be downloaded at the website of this paper posted on Preprints.org.
Author Contributions
Conceptualization, C.D.A. and A.G.T.; Data curation, G.K.; Formal analysis, D.A.P., G.K. and D.B.; Funding acquisition, A.G.T.; Investigation, D.A.P., D.B., O.D.A., P.P., A.K., P.K. and M.M.; Methodology, D.A.P., G.K., C.D.A. and A.G.T.; Project administration, A.G.T.; Resources, O.A.D. and L.C.; Supervision, C.D.A. and A.G.T.; Visualization, D.A.P., G.K., P.P. and K.K.; Writing – original draft, D.A.P., G.K. and L.C.; Writing – review & editing, D.B., A.V.G., E.M., K.K., C.D.A. and A.G.T.; All authors have read and agreed to the published version of the manuscript.
Funding
This manuscript has partly been supported by the George and Victoria Karelias Foundation through donations to the Research Institute for Autoimmune Diseases (RISAD) and the Special Account for Research Grants, National Kapodistrian University of Athens (ELKE-EKPA) (grant number 10209).
Institutional Review Board Statement
The study was conducted in accordance with the Declaration of Helsinki, and approved by the Ethics and Deontology Commitee of Medical School of National and Kapodistrian University of Athens (protocol ID: 432/21.01.2021).
Informed Consent Statement
Informed consent was obtained from all subjects involved in the study.
Data Availability Statement
The original contributions presented in the study are included in the article/supplementary material, further inquiries can be directed to the corresponding authors.
Conflicts of Interest
The authors declare no conflicts of interest.
References
- Salvarani, C.; Cantini, F.; Hunder, G.G. Polymyalgia rheumatica and giant-cell arteritis. Lancet 2008, 372, 234–245. [Google Scholar] [CrossRef] [PubMed]
- Palamidas, D.A.; Chatzis, L.; Papadaki, M.; Gissis, I.; Kambas, K.; Andreakos, E.; Goules, A.V.; Tzioufas, A.G. Current Insights into Tissue Injury of Giant Cell Arteritis: From Acute Inflammatory Responses towards Inappropriate Tissue Remodeling. Cells 2024, 13. [Google Scholar] [CrossRef]
- Prieto-Peña, D.; Castañeda, S.; Martínez-Rodríguez, I.; Atienza-Mateo, B.; Blanco, R.; González-Gay, M.A. Imaging Tests in the Early Diagnosis of Giant Cell Arteritis. J Clin Med 2021, 10. [Google Scholar] [CrossRef] [PubMed]
- Slart, R.; Nienhuis, P.H.; Glaudemans, A.; Brouwer, E.; Gheysens, O.; van der Geest, K.S.M. Role of (18)F-FDG PET/CT in Large Vessel Vasculitis and Polymyalgia Rheumatica. J Nucl Med 2023, 64, 515–521. [Google Scholar] [CrossRef] [PubMed]
- Ponte, C.; Grayson, P.C.; Robson, J.C.; Suppiah, R.; Gribbons, K.B.; Judge, A.; Craven, A.; Khalid, S.; Hutchings, A.; Watts, R.A.; et al. 2022 American College of Rheumatology/EULAR Classification Criteria for Giant Cell Arteritis. Arthritis Rheumatol 2022, 74, 1881–1889. [Google Scholar] [CrossRef] [PubMed]
- Stellingwerff, M.D.; Brouwer, E.; Lensen, K.D.F.; Rutgers, A.; Arends, S.; van der Geest, K.S.M.; Glaudemans, A.; Slart, R. Different Scoring Methods of FDG PET/CT in Giant Cell Arteritis: Need for Standardization. Medicine (Baltimore) 2015, 94, e1542. [Google Scholar] [CrossRef] [PubMed]
- Dasgupta, B.; Cimmino, M.A.; Maradit-Kremers, H.; Schmidt, W.A.; Schirmer, M.; Salvarani, C.; Bachta, A.; Dejaco, C.; Duftner, C.; Jensen, H.S.; et al. 2012 provisional classification criteria for polymyalgia rheumatica: a European League Against Rheumatism/American College of Rheumatology collaborative initiative. Ann Rheum Dis 2012, 71, 484–492. [Google Scholar] [CrossRef] [PubMed]
- Hunder, G.G.; Bloch, D.A.; Michel, B.A.; Stevens, M.B.; Arend, W.P.; Calabrese, L.H.; Edworthy, S.M.; Fauci, A.S.; Leavitt, R.Y.; Lie, J.T.; et al. The American College of Rheumatology 1990 criteria for the classification of giant cell arteritis. Arthritis Rheum 1990, 33, 1122–1128. [Google Scholar] [CrossRef] [PubMed]
- Slart, R. FDG-PET/CT(A) imaging in large vessel vasculitis and polymyalgia rheumatica: joint procedural recommendation of the EANM, SNMMI, and the PET Interest Group (PIG), and endorsed by the ASNC. Eur J Nucl Med Mol Imaging 2018, 45, 1250–1269. [Google Scholar] [CrossRef] [PubMed]
- Espitia, O.; Schanus, J.; Agard, C.; Kraeber-Bodéré, F.; Hersant, J.; Serfaty, J.M.; Jamet, B. Specific features to differentiate Giant cell arteritis aortitis from aortic atheroma using FDG-PET/CT. Sci Rep 2021, 11, 17389. [Google Scholar] [CrossRef] [PubMed]
- Iliou, A.; Argyropoulou, O.D.; Palamidas, D.A.; Karagiannakou, M.; Benaki, D.; Tsezou, K.; Vlachoyiannopoulos, P.G.; Mikros, E.; Tzioufas, A.G. NMR-based metabolomics in giant cell arteritis and polymyalgia rheumatica sequential sera differentiates active and inactive disease. Rheumatology (Oxford) 2023. [Google Scholar] [CrossRef]
- Galli, E.; Muratore, F.; Mancuso, P.; Boiardi, L.; Marvisi, C.; Besutti, G.; Spaggiari, L.; Casali, M.; Versari, A.; Giorgi Rossi, P.; et al. The role of PET/CT in disease activity assessment in patients with large vessel vasculitis. Rheumatology (Oxford) 2022, 61, 4809–4816. [Google Scholar] [CrossRef]
- van der Geest, K.S.M.; Sandovici, M.; Nienhuis, P.H.; Slart, R.; Heeringa, P.; Brouwer, E.; Jiemy, W.F. Novel PET Imaging of Inflammatory Targets and Cells for the Diagnosis and Monitoring of Giant Cell Arteritis and Polymyalgia Rheumatica. Front Med (Lausanne) 2022, 9, 902155. [Google Scholar] [CrossRef] [PubMed]
- Jiemy, W.F.; Heeringa, P.; Kamps, J.; van der Laken, C.J.; Slart, R.; Brouwer, E. Positron emission tomography (PET) and single photon emission computed tomography (SPECT) imaging of macrophages in large vessel vasculitis: Current status and future prospects. Autoimmun Rev 2018, 17, 715–726. [Google Scholar] [CrossRef]
- Hicks, R.J.; Roselt, P.J.; Kallur, K.G.; Tothill, R.W.; Mileshkin, L. FAPI PET/CT: Will It End the Hegemony of (18)F-FDG in Oncology? J Nucl Med 2021, 62, 296–302. [Google Scholar] [CrossRef] [PubMed]
- Matter, C.M.; Wyss, M.T.; Meier, P.; Späth, N.; von Lukowicz, T.; Lohmann, C.; Weber, B.; Ramirez de Molina, A.; Lacal, J.C.; Ametamey, S.M.; et al. 18F-choline images murine atherosclerotic plaques ex vivo. Arterioscler Thromb Vasc Biol 2006, 26, 584–589. [Google Scholar] [CrossRef] [PubMed]
- Vöö, S.; Kwee, R.M.; Sluimer, J.C.; Schreuder, F.H.; Wierts, R.; Bauwens, M.; Heeneman, S.; Cleutjens, J.P.; van Oostenbrugge, R.J.; Daemen, J.W.; et al. Imaging Intraplaque Inflammation in Carotid Atherosclerosis With 18F-Fluorocholine Positron Emission Tomography-Computed Tomography: Prospective Study on Vulnerable Atheroma With Immunohistochemical Validation. Circ Cardiovasc Imaging 2016, 9. [Google Scholar] [CrossRef] [PubMed]
- Guasch-Ferré, M.; Hu, F.B.; Ruiz-Canela, M.; Bulló, M.; Toledo, E.; Wang, D.D.; Corella, D.; Gómez-Gracia, E.; Fiol, M.; Estruch, R.; et al. Plasma Metabolites From Choline Pathway and Risk of Cardiovascular Disease in the PREDIMED (Prevention With Mediterranean Diet) Study. J Am Heart Assoc 2017, 6. [Google Scholar] [CrossRef] [PubMed]
- Roe, A.J.; Zhang, S.; Bhadelia, R.A.; Johnson, E.J.; Lichtenstein, A.H.; Rogers, G.T.; Rosenberg, I.H.; Smith, C.E.; Zeisel, S.H.; Scott, T.M. Choline and its metabolites are differently associated with cardiometabolic risk factors, history of cardiovascular disease, and MRI-documented cerebrovascular disease in older adults. Am J Clin Nutr 2017, 105, 1283–1290. [Google Scholar] [CrossRef] [PubMed]
- Guo, F.; Qiu, X.; Zhu, Y.; Tan, Z.; Li, Z.; Ouyang, D. Circulating choline is associated with coronary artery stenosis in patients with hypertension: A cross-sectional study of Chinese adults. J Clin Hypertens (Greenwich) 2020, 22, 2069–2076. [Google Scholar] [CrossRef] [PubMed]
- Tian, Y.; Pate, C.; Andreolotti, A.; Wang, L.; Tuomanen, E.; Boyd, K.; Claro, E.; Jackowski, S. Cytokine secretion requires phosphatidylcholine synthesis. J Cell Biol 2008, 181, 945–957. [Google Scholar] [CrossRef] [PubMed]
- Snider, S.A.; Margison, K.D.; Ghorbani, P.; LeBlond, N.D.; O’Dwyer, C.; Nunes, J.R.C.; Nguyen, T.; Xu, H.; Bennett, S.A.L.; Fullerton, M.D. Choline transport links macrophage phospholipid metabolism and inflammation. J Biol Chem 2018, 293, 11600–11611. [Google Scholar] [CrossRef] [PubMed]
- van der Geest, K.S.; Abdulahad, W.H.; Rutgers, A.; Horst, G.; Bijzet, J.; Arends, S.; Roffel, M.P.; Boots, A.M.; Brouwer, E. Serum markers associated with disease activity in giant cell arteritis and polymyalgia rheumatica. Rheumatology (Oxford) 2015, 54, 1397–1402. [Google Scholar] [CrossRef] [PubMed]
- Pulsatelli, L.; Boiardi, L.; Assirelli, E.; Pazzola, G.; Muratore, F.; Addimanda, O.; Dolzani, P.; Versari, A.; Casali, M.; Magnani, L.; et al. Interleukin-6 and soluble interleukin-6 receptor are elevated in large-vessel vasculitis: a cross-sectional and longitudinal study. Clin Exp Rheumatol 2017, 35 Suppl 103, 102–110. [Google Scholar]
- Jason, J.; Archibald, L.K.; Nwanyanwu, O.C.; Byrd, M.G.; Kazembe, P.N.; Dobbie, H.; Jarvis, W.R. Comparison of serum and cell-specific cytokines in humans. Clin Diagn Lab Immunol 2001, 8, 1097–1103. [Google Scholar] [CrossRef] [PubMed]
- Liu, C.; Chu, D.; Kalantar-Zadeh, K.; George, J.; Young, H.A.; Liu, G. Cytokines: From Clinical Significance to Quantification. Adv Sci (Weinh) 2021, 8, e2004433. [Google Scholar] [CrossRef] [PubMed]
- Tombetti, E.; Hysa, E.; Mason, J.C.; Cimmino, M.A.; Camellino, D. Blood Biomarkers for Monitoring and Prognosis of Large Vessel Vasculitides. Curr Rheumatol Rep 2021, 23, 17. [Google Scholar] [CrossRef]
- Fang, C.; Du, L.; Gao, S.; Chen, Y.; Chen, Z.; Wu, Z.; Li, L.; Li, J.; Zeng, X.; Li, M.; et al. Association between premature vascular smooth muscle cells senescence and vascular inflammation in Takayasu’s arteritis. Ann Rheum Dis 2024. [Google Scholar] [CrossRef]
- Manning, J.E.; Harris, E.; Mathieson, H.; Sorensen, L.; Luqmani, R.; McGettrick, H.M.; Morgan, A.W.; Young, S.P.; Mackie, S.L. Polymyalgia rheumatica shows metabolomic alterations that are further altered by glucocorticoid treatment: Identification of metabolic correlates of fatigue. J Autoimmun 2024, 147, 103260. [Google Scholar] [CrossRef] [PubMed]
Figure 1.
Disease activity and inactivity markers studied in LV-GCA patients. (A) A female patient who underwent FDG-PET/CT showed increased FDG uptake in the descending thoracic aorta (green arrows) at the first scan (left panel) (Average TBR value of 6.08), compared to the uptake in the second scan (right panel) (Average TBR value of 2.39). (B) TBRMDS calculation - i. Global Aorta, and ii. Most Diseased Segment (MDS) analysis. Global Aortic and MDS scores are calculated by summing and averaging each arterial segment’s max FDG-TBR uptake pattern. TBRMDS score is calculated as a sum of 3 sequential slice values. Comparison of (C) TBRMDS values, (D) Global-TBR values, (E) C-reactive protein (CRP) in mg/L., and (F) Erythrocyte Sedimentation Rate (ESR) in mm/h, between active and inactive disease states for 9 LV-GCA patients. The first quartile and the third quartile are shown in the lower and upper horizontal lines. The horizontal line in the boxes represents the median value. The exact p values are shown in each boxplot.
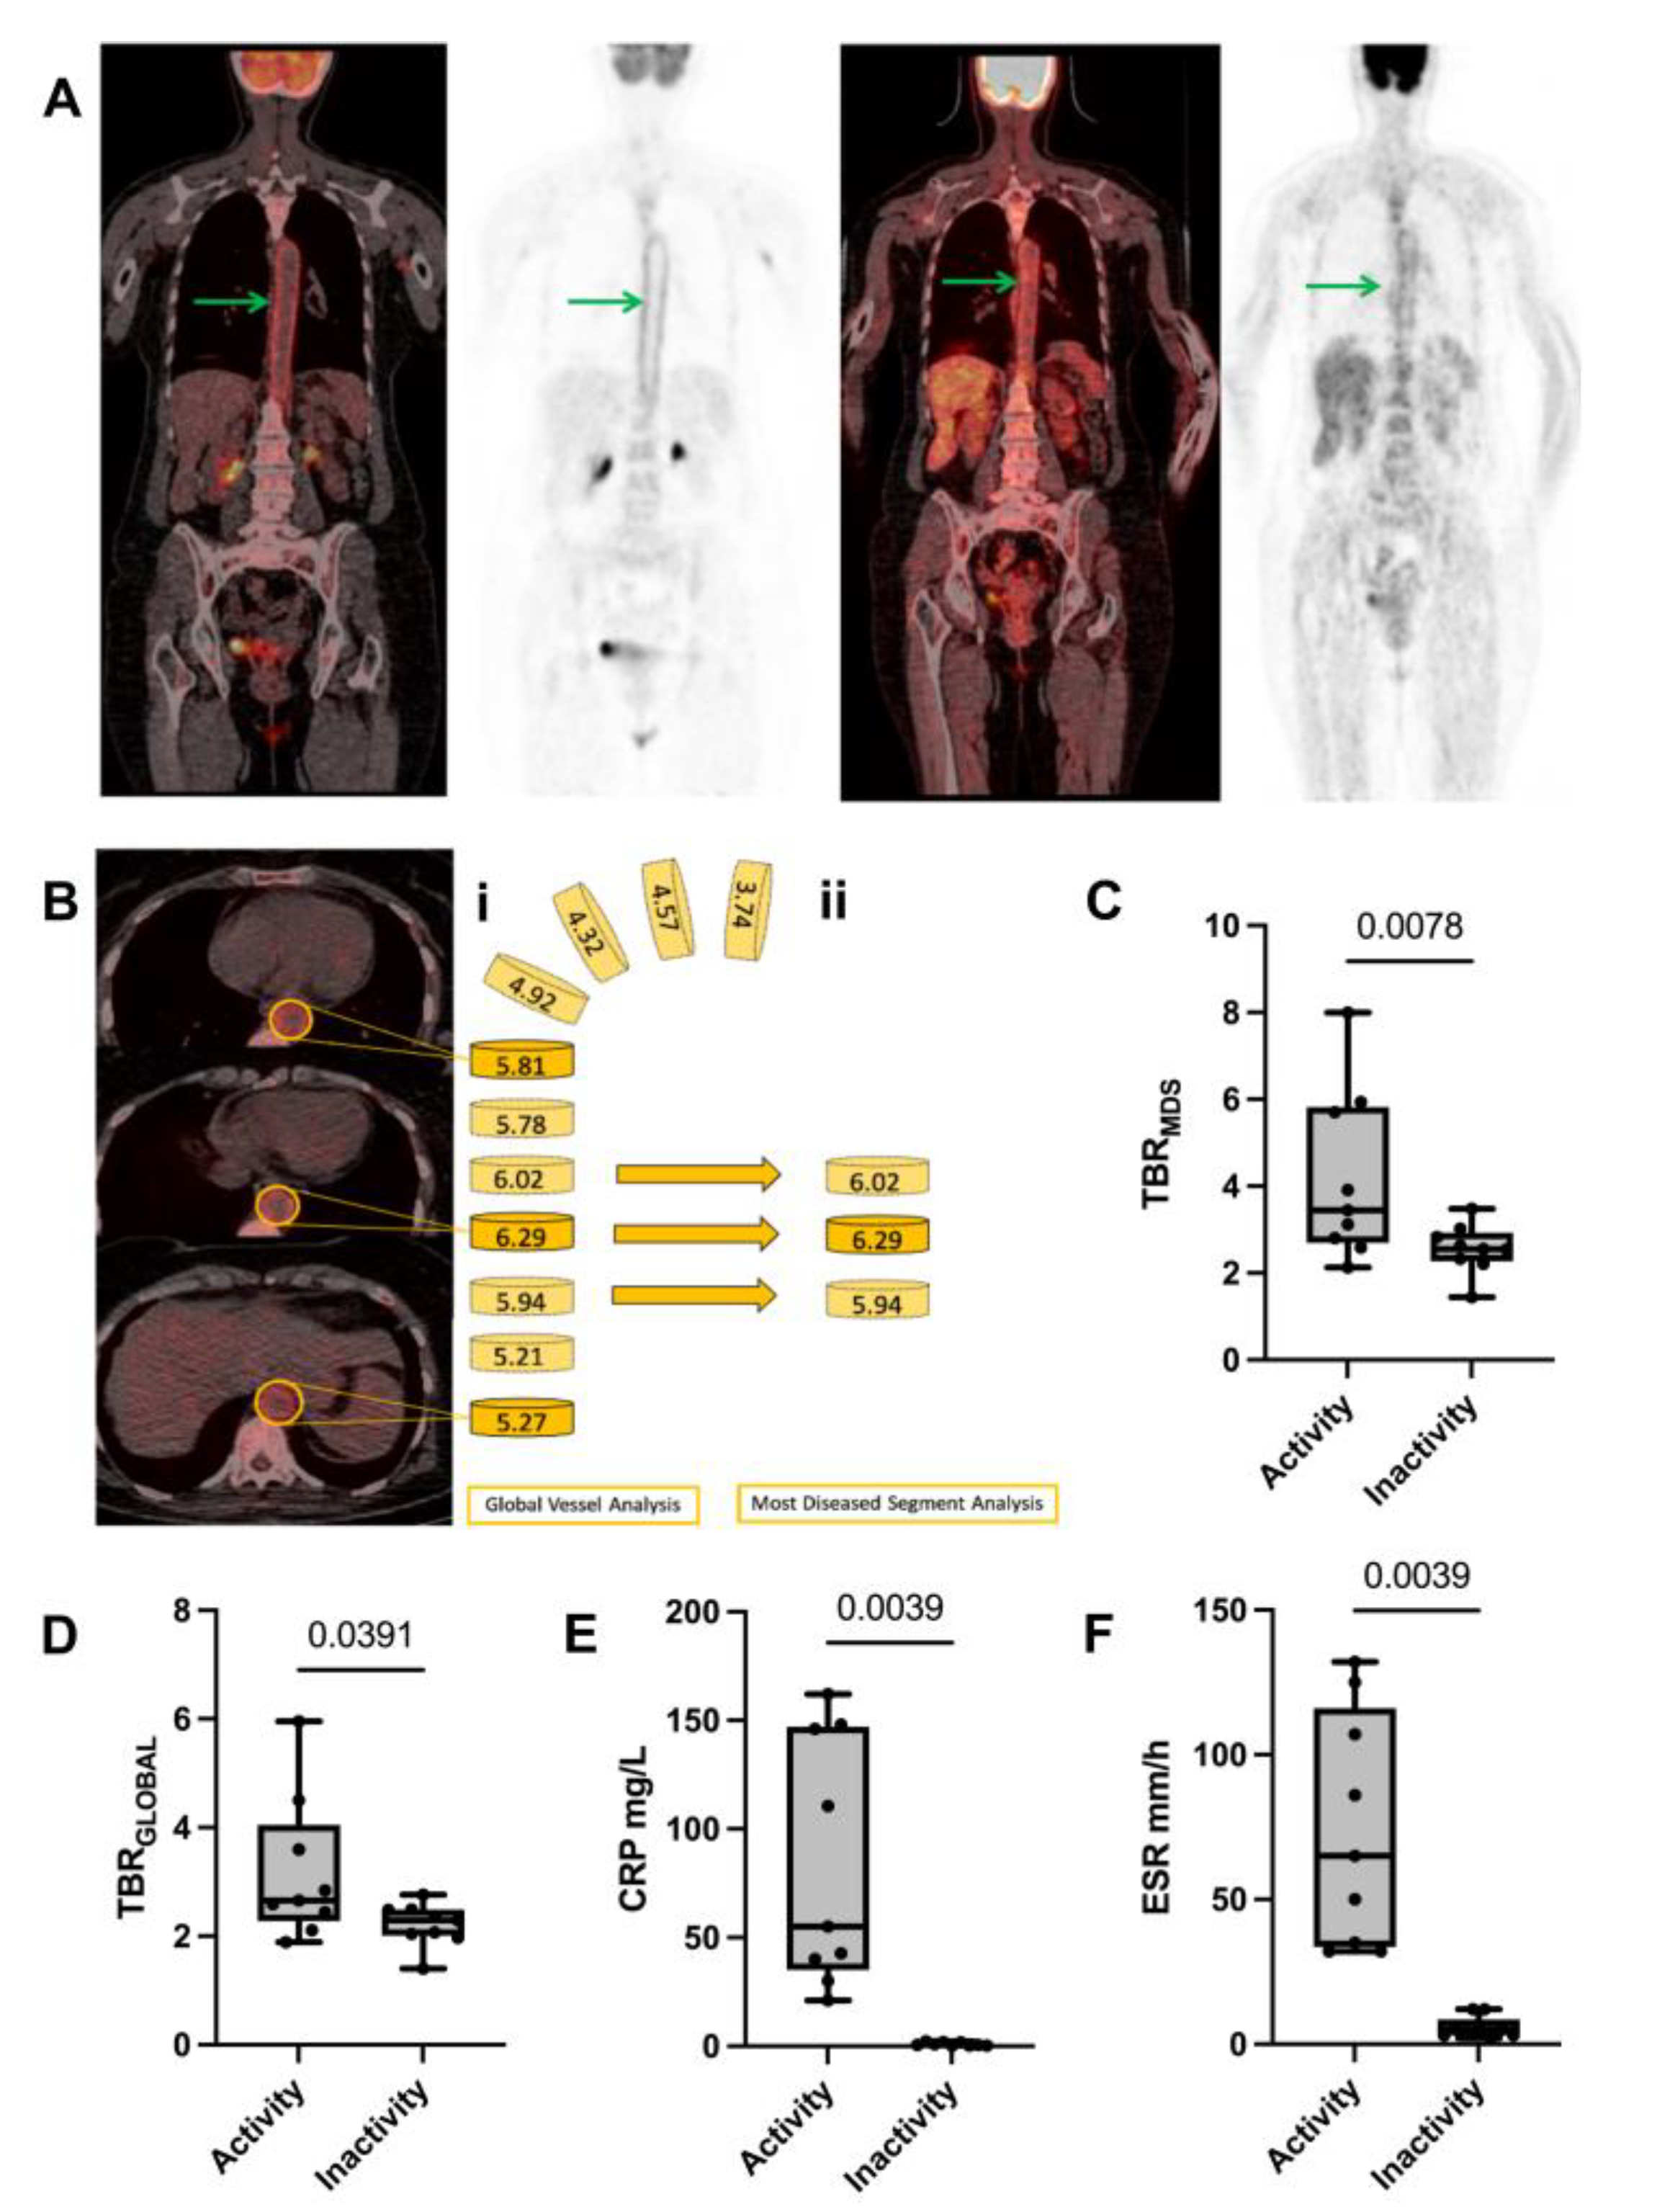
Figure 2.
Significantly altered levels of serum metabolites and lipids during active and inactive disease states in 9 LV-GCA patients. (A) Boxplots of the 6 significantly altered metabolites and lipids in LV-GCA patients. (B) Only 4 out of these 6 metabolites and lipids are significantly altered in cranial-GCA patients. (C) Only 3 out of these 6 metabolites and lipids are significantly altered in PMR patients. (D) Comparison of Δcholine and ΔDimethyl sulfone between the 3 disease groups. The first quartile and the third quartile are shown in the lower and upper horizontal lines, respectively. The horizontal line in the boxes represents the median value. The exact p values are shown in each boxplot. L5, Lipids CH2-; L10, N-acetylglycoproteins (NCH3-) GlycB; L17, Cholesterol, Methine group CH=CH; n.s., non-significant.
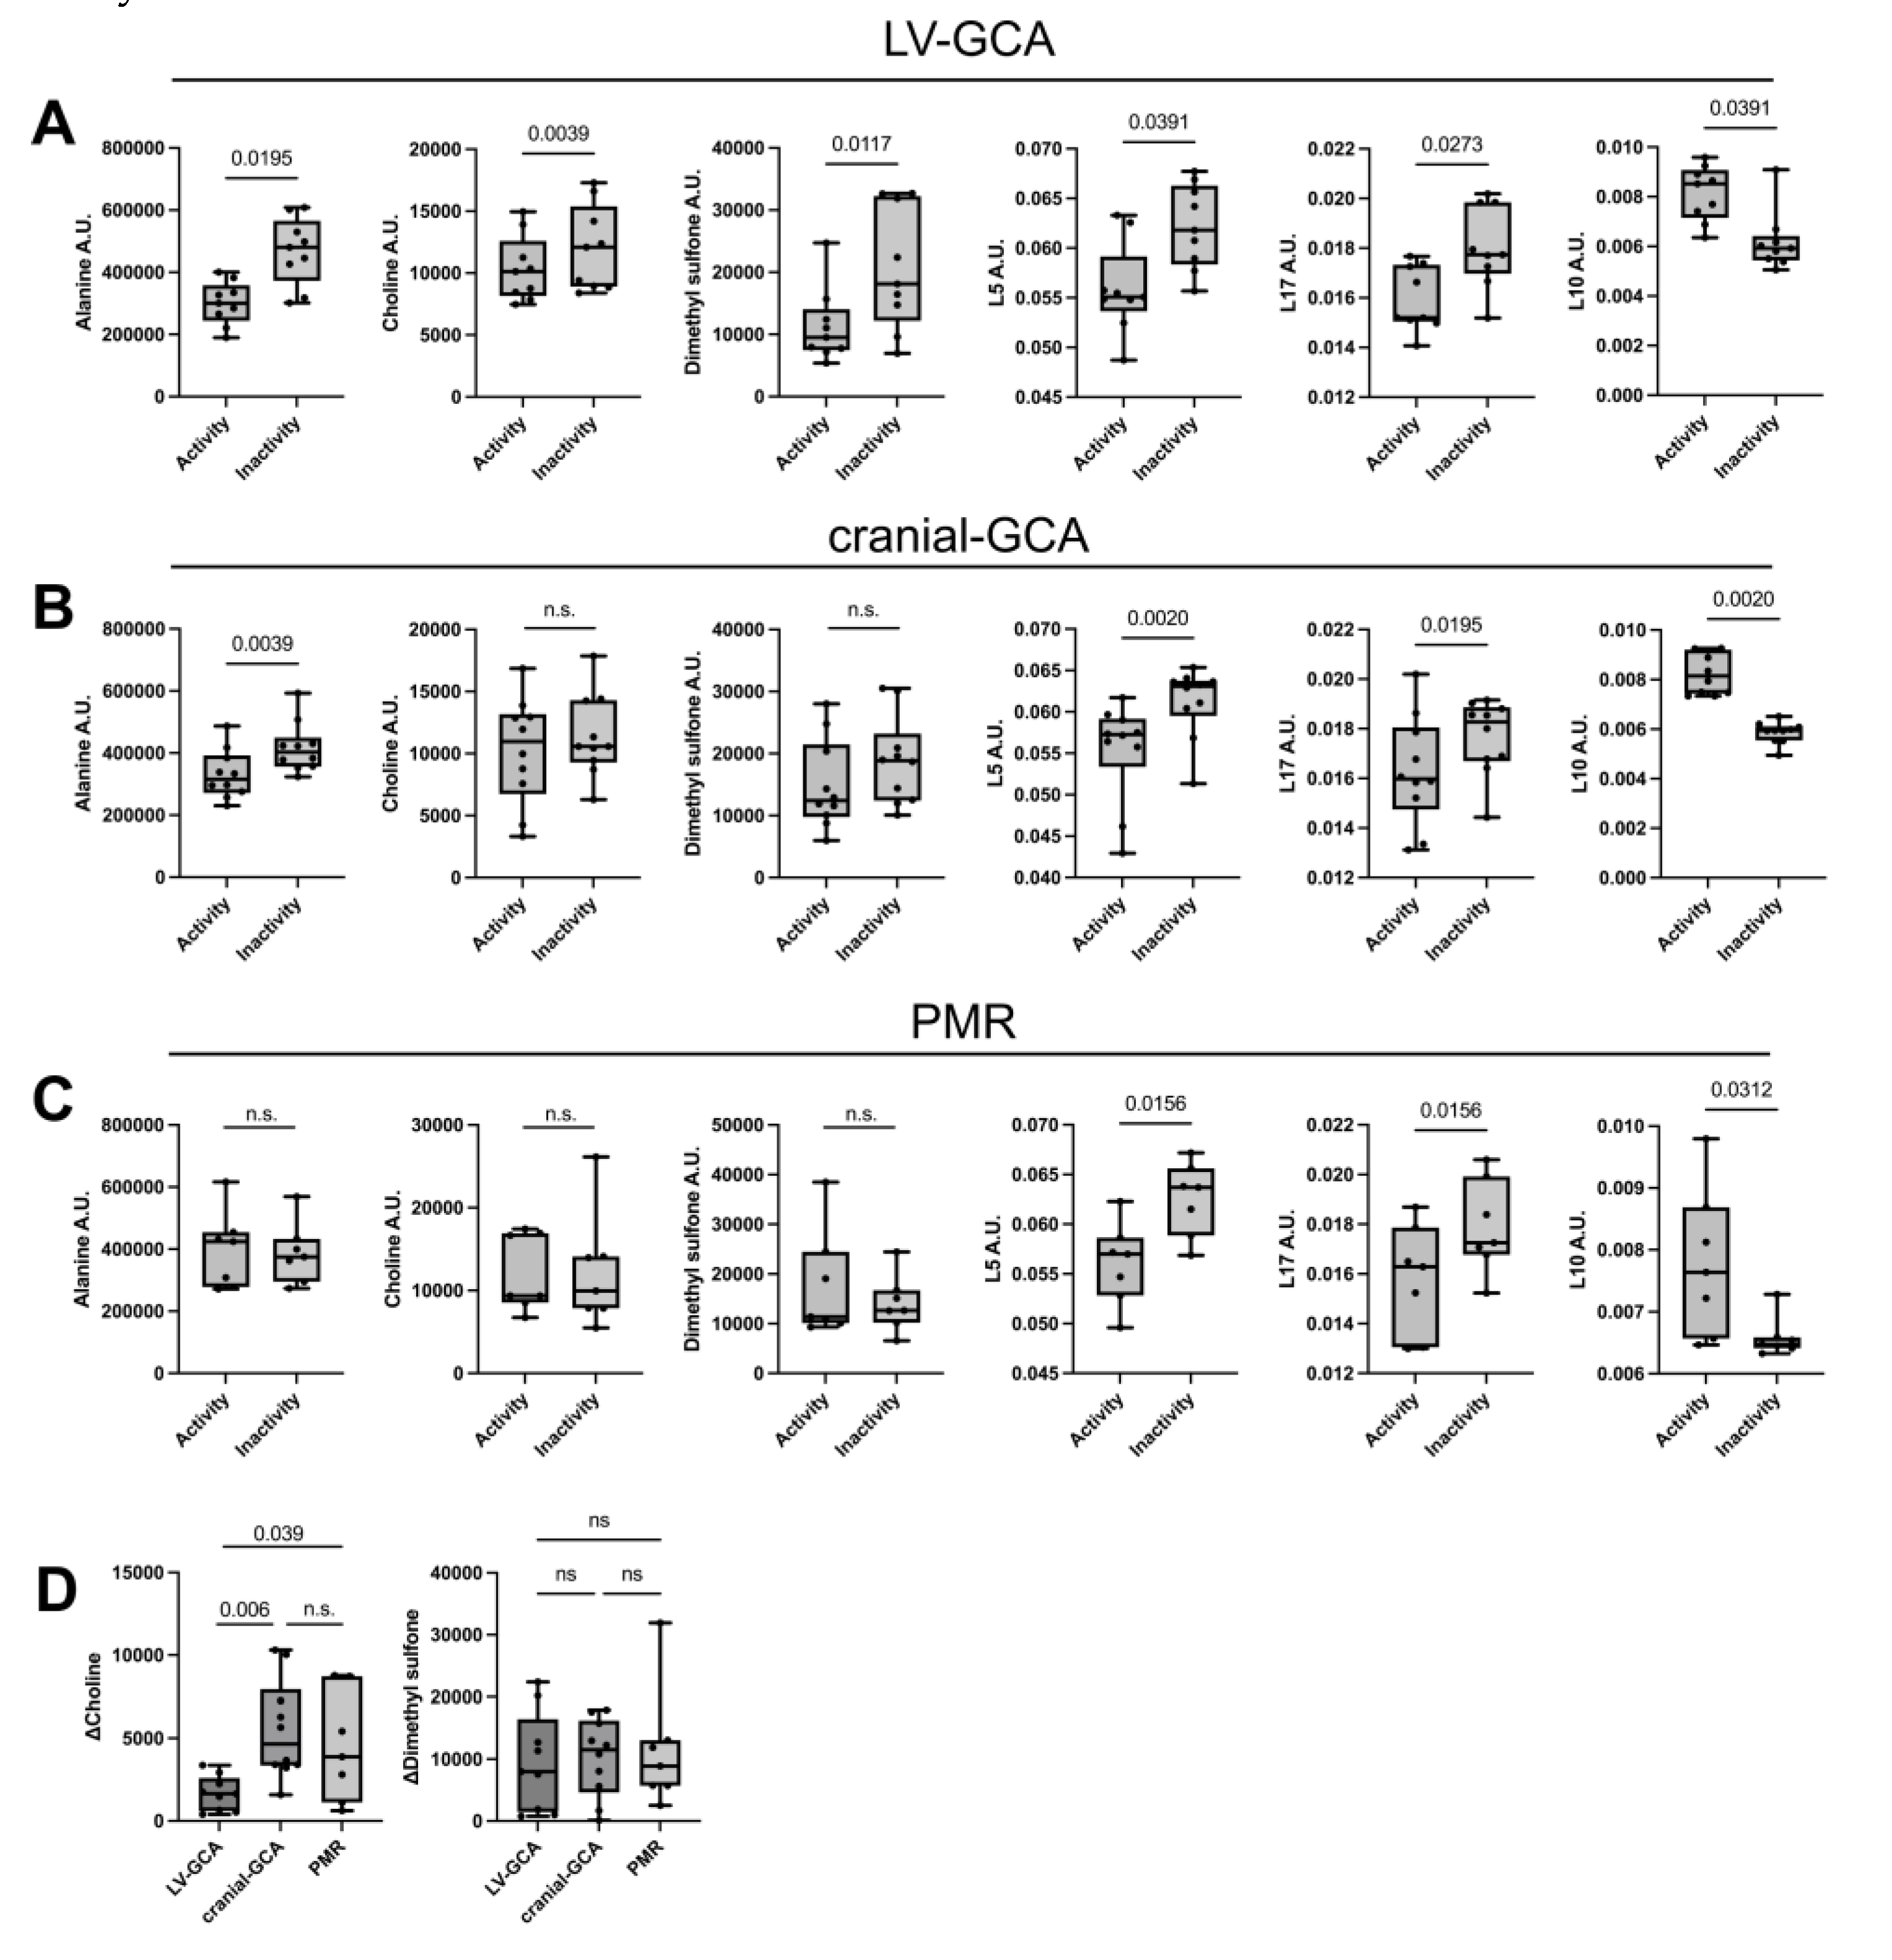
Figure 3.
Principal Component Analysis (PCA) using the statistically significant parameters altered in Large Vessel Vasculitis patients between active and inactive disease states shows discrimination between the two disease states irrespective of the combination of markers used. (A) PCA plots presenting the combination of ESR, CRP, and TBRMDS, (B) PCA plots presenting the combination of ESR, CRP, TBRMDS and Choline, (C) PCA plots presenting the combination of ESR, CRP and Choline, (D) Composite Index 1 generation using ESR, CRP, and TBRMDS, (E) Composite Index 1 generation using ESR, CRP, TBRMDS, and Choline, (F) Composite Index 3 generation using ESR, CRP, and Choline. The first quartile and the third quartile are shown in the lower and upper horizontal lines, respectively. The horizontal line in the boxes represents the median value. The exact p values are shown in each boxplot.
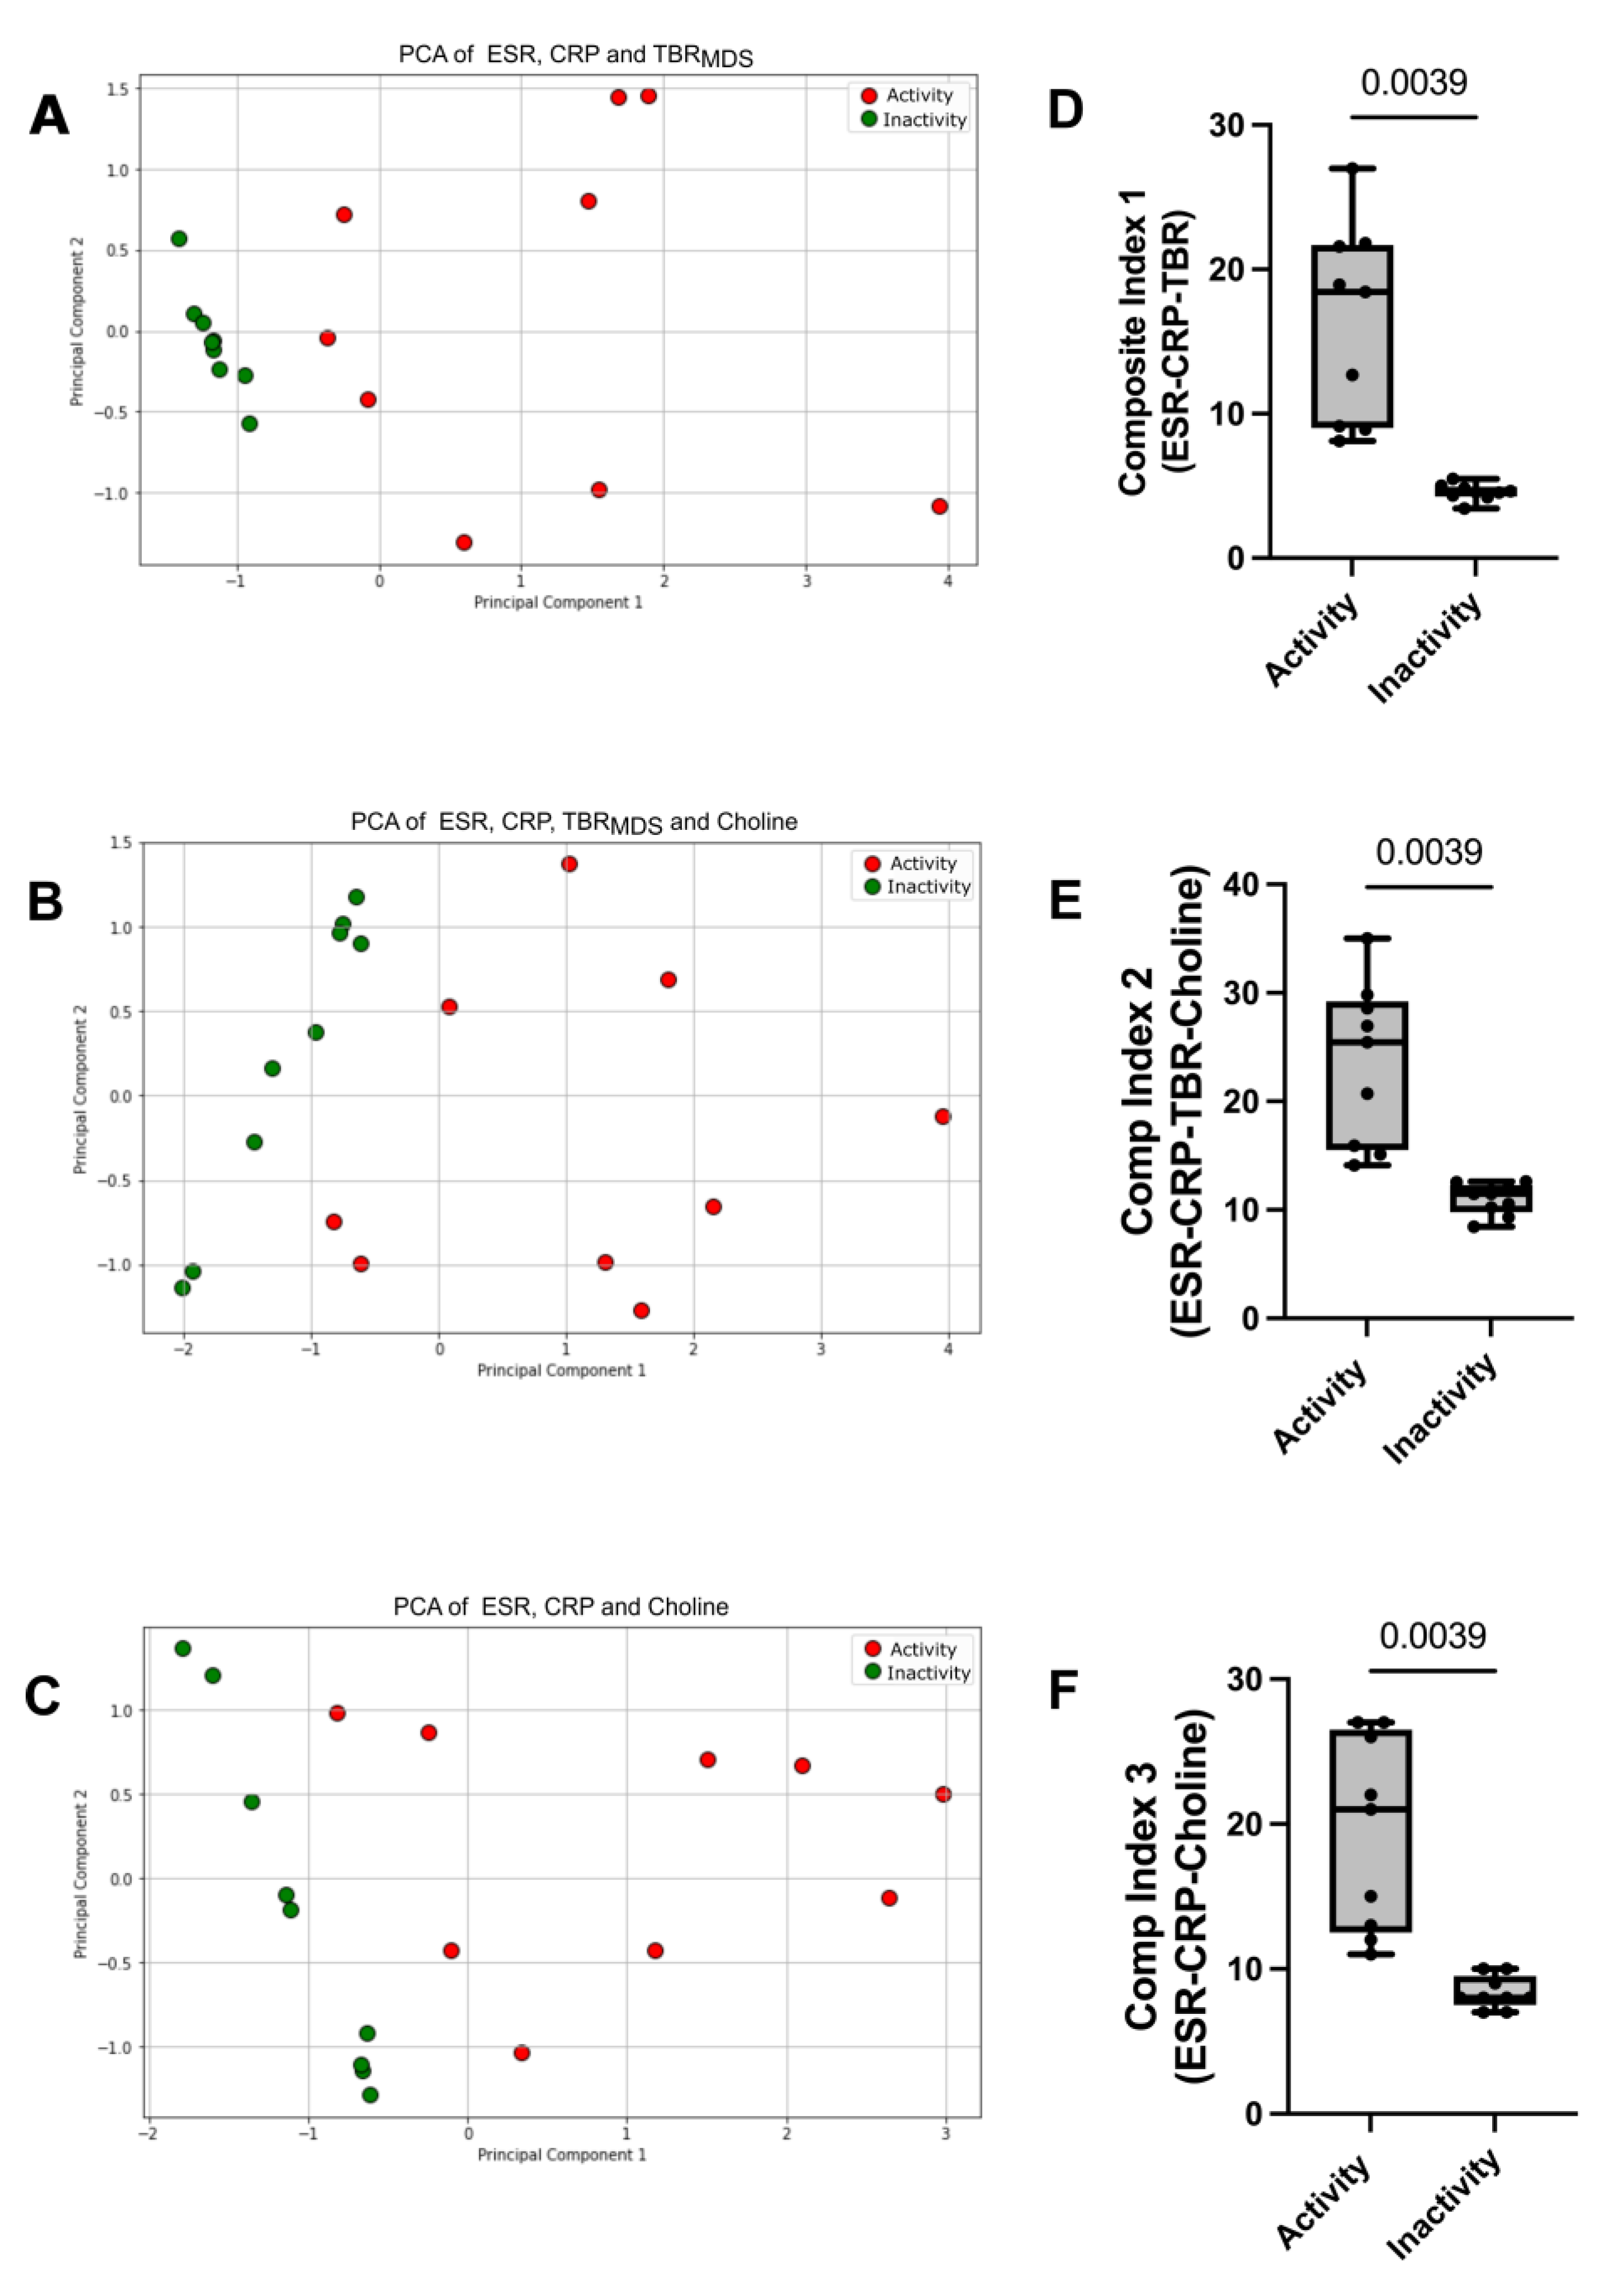

Table 1.
Baseline characteristics of all LV-GCA, cranial-GCA and PMR patients included in the study. In the parenthesis the interquartile range (IQR) is shown.
Table 1.
Baseline characteristics of all LV-GCA, cranial-GCA and PMR patients included in the study. In the parenthesis the interquartile range (IQR) is shown.
| LV-GCA (9) | cranial-GCA (12) | PMR (7) | |
| Age (median, years) | 63 (60-75) | 73 (65-81) | 74 (63-79) |
| Gender (Female%, N) | 77,8% (7/9) | 66,6% (8/12) | 57,1% (4/7) |
| Positive temporal artery biopsy | 44,4% (4/9) | 100% (12/12) | 0% (0/7) |
| ESR active phase (median) (<20mm/h) | 50 (34,25 - 111,5) | 86 (40 - 101) | 56 (43 - 81) |
| ESR inactive phase (median) (<20mm/h) | 5 (3-12) | 10,5 (6,5 - 16) | 12 (4,5 - 18) |
| CRP active phase (median) (0-5mg/l) | 42,8 (37,5 - 146,5) | 51 (11,65 - 92,75) | 22,3 (11,27 - 35,75) |
| CRP inactive phase (median) (0-5mg/l) | 0,5 (0,3-1,82) | 1,55 (0,67 - 6,8) | 1,2 (0,7 - 3,38) |
| Hct active phase (median) (%) | 35,4 (33,05-36,45) | 37,3 (34-39,25) | 37,05 (34,2-40,9) |
| Hct inactive phase (median) (%) | 39,4 (37,45-41,8) | 41,75 (39,98-44,18) | 39 (36,4/44,4) |
| PLTs active phase (median) | 392000 (292000-489500) |
390000 (281500-417250) |
313000 (273000-371500) |
| PLTs inactive phase (median) | 201000 (173000-238000) |
214500 (194750-324500) |
253000 (210000-290000) |
| Median time to inactive disease (months) | 6 | 7 | 5,5 |
| Arterial Hypertension (%, N) | 44,4% (4/9) | 50% (6/12) | 57,1% (4/7) |
| Diabetes Mellitus (%, N) | 11,1% (1/9) | 33,3% (4/12) | 14,3% (1/7) |
| Dyslipidemia (%, N) | 55,6% (5/9) | 33,3% (4/12) | 71,4% (5/7) |
| BP lowering drugs | 33,3% (3/9) | 41,6% (5/12) | 57,1% (4/7) |
ESR, Erythrocyte Sedimentation Rate; CRP, C-reactive protein; Hct, hematocrit; PLTs, platelets; BP, blood pressure.
Disclaimer/Publisher’s Note: The statements, opinions and data contained in all publications are solely those of the individual author(s) and contributor(s) and not of MDPI and/or the editor(s). MDPI and/or the editor(s) disclaim responsibility for any injury to people or property resulting from any ideas, methods, instructions or products referred to in the content. |
© 2024 by the authors. Licensee MDPI, Basel, Switzerland. This article is an open access article distributed under the terms and conditions of the Creative Commons Attribution (CC BY) license (http://creativecommons.org/licenses/by/4.0/).
Copyright: This open access article is published under a Creative Commons CC BY 4.0 license, which permit the free download, distribution, and reuse, provided that the author and preprint are cited in any reuse.


