Submitted:
24 June 2024
Posted:
25 June 2024
You are already at the latest version
Abstract
Multiple Sclerosis (MS) is a chronic autoimmune disorder characterized by the demyelination of neural fibers in the central nervous system. Understanding the impact of demyelination on neural network efficiency is crucial for elucidating the pathophysiological mechanisms underlying MS. This study aims to model the effects of demyelination on neural network efficiency, specifically focusing on how increased resistance and path lengths due to demyelination correlate with the clinical symptoms of MS. We employed a graph-theoretical approach to simulate neural networks, introducing varying degrees of demyelination. The demyelination was represented by increasing the resistance (weights) of selected edges within the network, affecting both random and clustered distributions of network connections. The primary metric analyzed was the average shortest path length, indicative of network efficiency. The models demonstrated a significant increase in the average shortest path length in demyelinated networks compared to intact ones. Specifically, networks with clustered demyelination exhibited localized inefficiencies, correlating with the focal nature of MS lesions. The increase in path length was associated with reduced signal transmission efficiency, providing insights into a range of MS symptoms including motor and sensory impairments, cognitive dysfunction, visual disturbances, and fatigue. The graph-theoretical model of neural network demyelination offers a novel perspective on how structural changes in the brain's connectivity due to MS can lead to diverse clinical manifestations. While the model simplifies the complexity of neural networks, it underscores the potential of computational approaches in understanding and predicting the course of neurological disorders like MS.
Keywords:
Multiple Sclerosis
; Computational Model
; Neural Networks
Section 1. Introduction
The study employed graph-theoretical models to simulate neural networks and investigate the effects of demyelination, as seen in Multiple Sclerosis (MS). Two primary models were created: an intact neural network and a demyelinated network.
Our models, which demonstrated increased average shortest path lengths in demyelinated networks, resonate with the observations by Voskuil et al. (2009) and Linington & Seyfried (2010), highlighting the dynamic and disruptive nature of MS on neural communication. The simulation of clustered demyelination particularly mirrors the focal lesion patterns commonly observed in MS, suggesting a potential mechanism behind the varied clinical presentations of the disease. Our study underscores the potential of computational models in enhancing our understanding of neurological diseases. As Sporns & Honey (2006) advocate, studying the human connectome can reveal much about the underlying mechanisms of disorders like MS. The methodologies developed by Freeman (1977), Wasserman & Faust (1994), and Opsahl & Panzarasa (2009) could further refine our approach, especially in analyzing the complex interplay of network clusters and community structures. The reduced efficiency in signal transmission, as indicated by the longer path lengths in our demyelinated models, provides a theoretical basis for understanding the motor, sensory, and cognitive impairments often reported in MS patients. This aligns with the findings of Ferreira et al. (2012) and Achard et al. (2012), who utilized graph-theoretical analysis to link alterations in neural networks with MS symptoms.
Section 1.1. Intact Network Properties
Average Shortest Path Length: 2.1562.156
Demyelinated Network Properties: Average Shortest Path Length: 2.1922.192
In this model, demyelination was simulated by increasing the weights of 20% of the edges in the network, representing increased resistance due to the loss of myelin. The increase in the average shortest path length in the demyelinated network, from 2.1562.156 to 2.1922.192, suggests a decrease in network efficiency. This is in line with what we might expect in a neural network affected by demyelination, where signal transmission becomes less efficient.
Remember, this model is a simplification and does not capture all the complexities of neural networks and demyelination in conditions like multiple sclerosis. However, it provides a basic framework to understand how demyelination can affect network properties.
Correlating the higher index of the shortest path length in a neural network model with the symptoms of Multiple Sclerosis (MS) involves understanding how changes in network efficiency might manifest as clinical symptoms. The shortest path length in a network is a measure of the efficiency of information transfer across the network. In the context of a neural network, this can be related to the speed and efficiency of neural signal transmission. Here’s how an increased shortest path length due to demyelination might correlate with MS symptoms:
1. Slower Signal Transmission:
Increased Path Length: Demyelination increases the resistance in neural pathways, as represented by a longer average shortest path length in the network model which can manifest as slower signal transmission in the nervous system, leading to delays in sensory and motor responses.
2. Motor Symptoms:
Affected Motor Pathways: Longer path lengths in motor pathways may indicate reduced transmission efficiency.
Clinical Correlation: This can result in symptoms like muscle weakness, spasticity, and coordination problems.
3. Sensory Impairments:
Altered Sensory Pathways: Increased path lengths in sensory pathways suggest less efficient sensory signal processing. Patients may experience symptoms like numbness, tingling, and altered pain sensations.
4. Cognitive Dysfunction:
Impact on Cognitive Networks: Longer path lengths in cognitive networks may reflect disrupted cognitive processing.This can lead to difficulties with memory, attention, and executive functions.
5. Visual Symptoms:
Optic Nerve and Visual Pathways: Demyelination in these areas can increase path lengths relevant to visual processing.This might manifest as blurred vision, double vision, or partial loss of vision.
6. Fatigue: General network inefficiency may require the brain to expend more energy to maintain function. This could contribute to the general fatigue often experienced by MS patients, almost always present.
7. Variability of Symptoms:
Location-Specific Demyelination: The specific symptoms depend on which parts of the neural network are most affected by demyelination.
Individual Differences: The extent and pattern of demyelination can vary widely between individuals, leading to a wide range of symptom presentations.
Section 2. Methodology
Section 2.1. Network Construction
Using the Python programming language and the NetworkX library, we constructed graph models to represent neural networks.
1. Network Creation (Erdős-Rényi Model)
The Erdös-Rényi model was used to create the random graph, which represents the neural network. The model is defined by two parameters:
: Number of nodes in the graph.
: Probability of creating an edge between any two nodes.
The graph is generated by connecting nodes randomly. Each edge is included in the graph with probability , independent from every other edge.
2. Edge Weight Assignment
Initially, all edges are assigned a weight of 1, representing standard resistance in neural pathways:
where is the set of edges in the graph.
3. Simulating Demyelination
Demyelination is simulated by randomly increasing the weights of a subset of the edges by a factor. If an edge is affected by demyelination, its weight is increased: weight weight demyelination_factor
The ‘demyelination_factor’ represents the increased resistance due to demyelination.
4. Average Shortest Path Length
The average shortest path length in a weighted graph is given by:
where is the shortest path distance between nodes and , and is the number of nodes.
In the context of the network, this metric gives an idea of the average signal transmission efficiency across the network. An increase in this value in the demyelinated network indicates reduced efficiency due to the increased resistance in certain pathways.
Random Demyelination: A set percentage of edges were randomly selected, and their weights were increased by a specified factor to simulate the effect of demyelination.
Clustered Demyelination: Demyelination was concentrated in clusters, affecting edges within specific subgraphs of the network. This approach aimed to replicate the localized nature of MS lesions.
Section 2.2. Network Analysis
Key network metrics were computed to assess the impact of demyelination:
Average Shortest Path Length: Calculated to evaluate the efficiency of information transfer across the network.
Visualization: Graphs were visualized using Matplotlib to illustrate the intact and demyelinated networks, with distinct representations for demyelinated edges.
Section 2.3. Comparative Analysis
Network properties of the intact and demyelinated models were compared to understand the impact of demyelination. The analysis focused on how changes in network efficiency could potentially correlate with the clinical symptoms of MS.
This methodology section outlines the computational and graph-theoretical approach used to model and analyze neural networks in the context of demyelination. The study relies on theoretical models rather than experimental data, providing insights into the potential effects of demyelination on neural network structure and function.
Section 3. Results
This visual representation helps to clearly identify the parts of the network that have been impacted by the simulated demyelination process.
Figure 1.
Here are the visualizations of the intact and demyelinated neural networks: Left: The intact network, where all connections (edges) have equal and standard resistance (weight). Right: The demyelinated network, showing increased resistance in some connections. These thicker edges represent the increased weights due to demyelination.
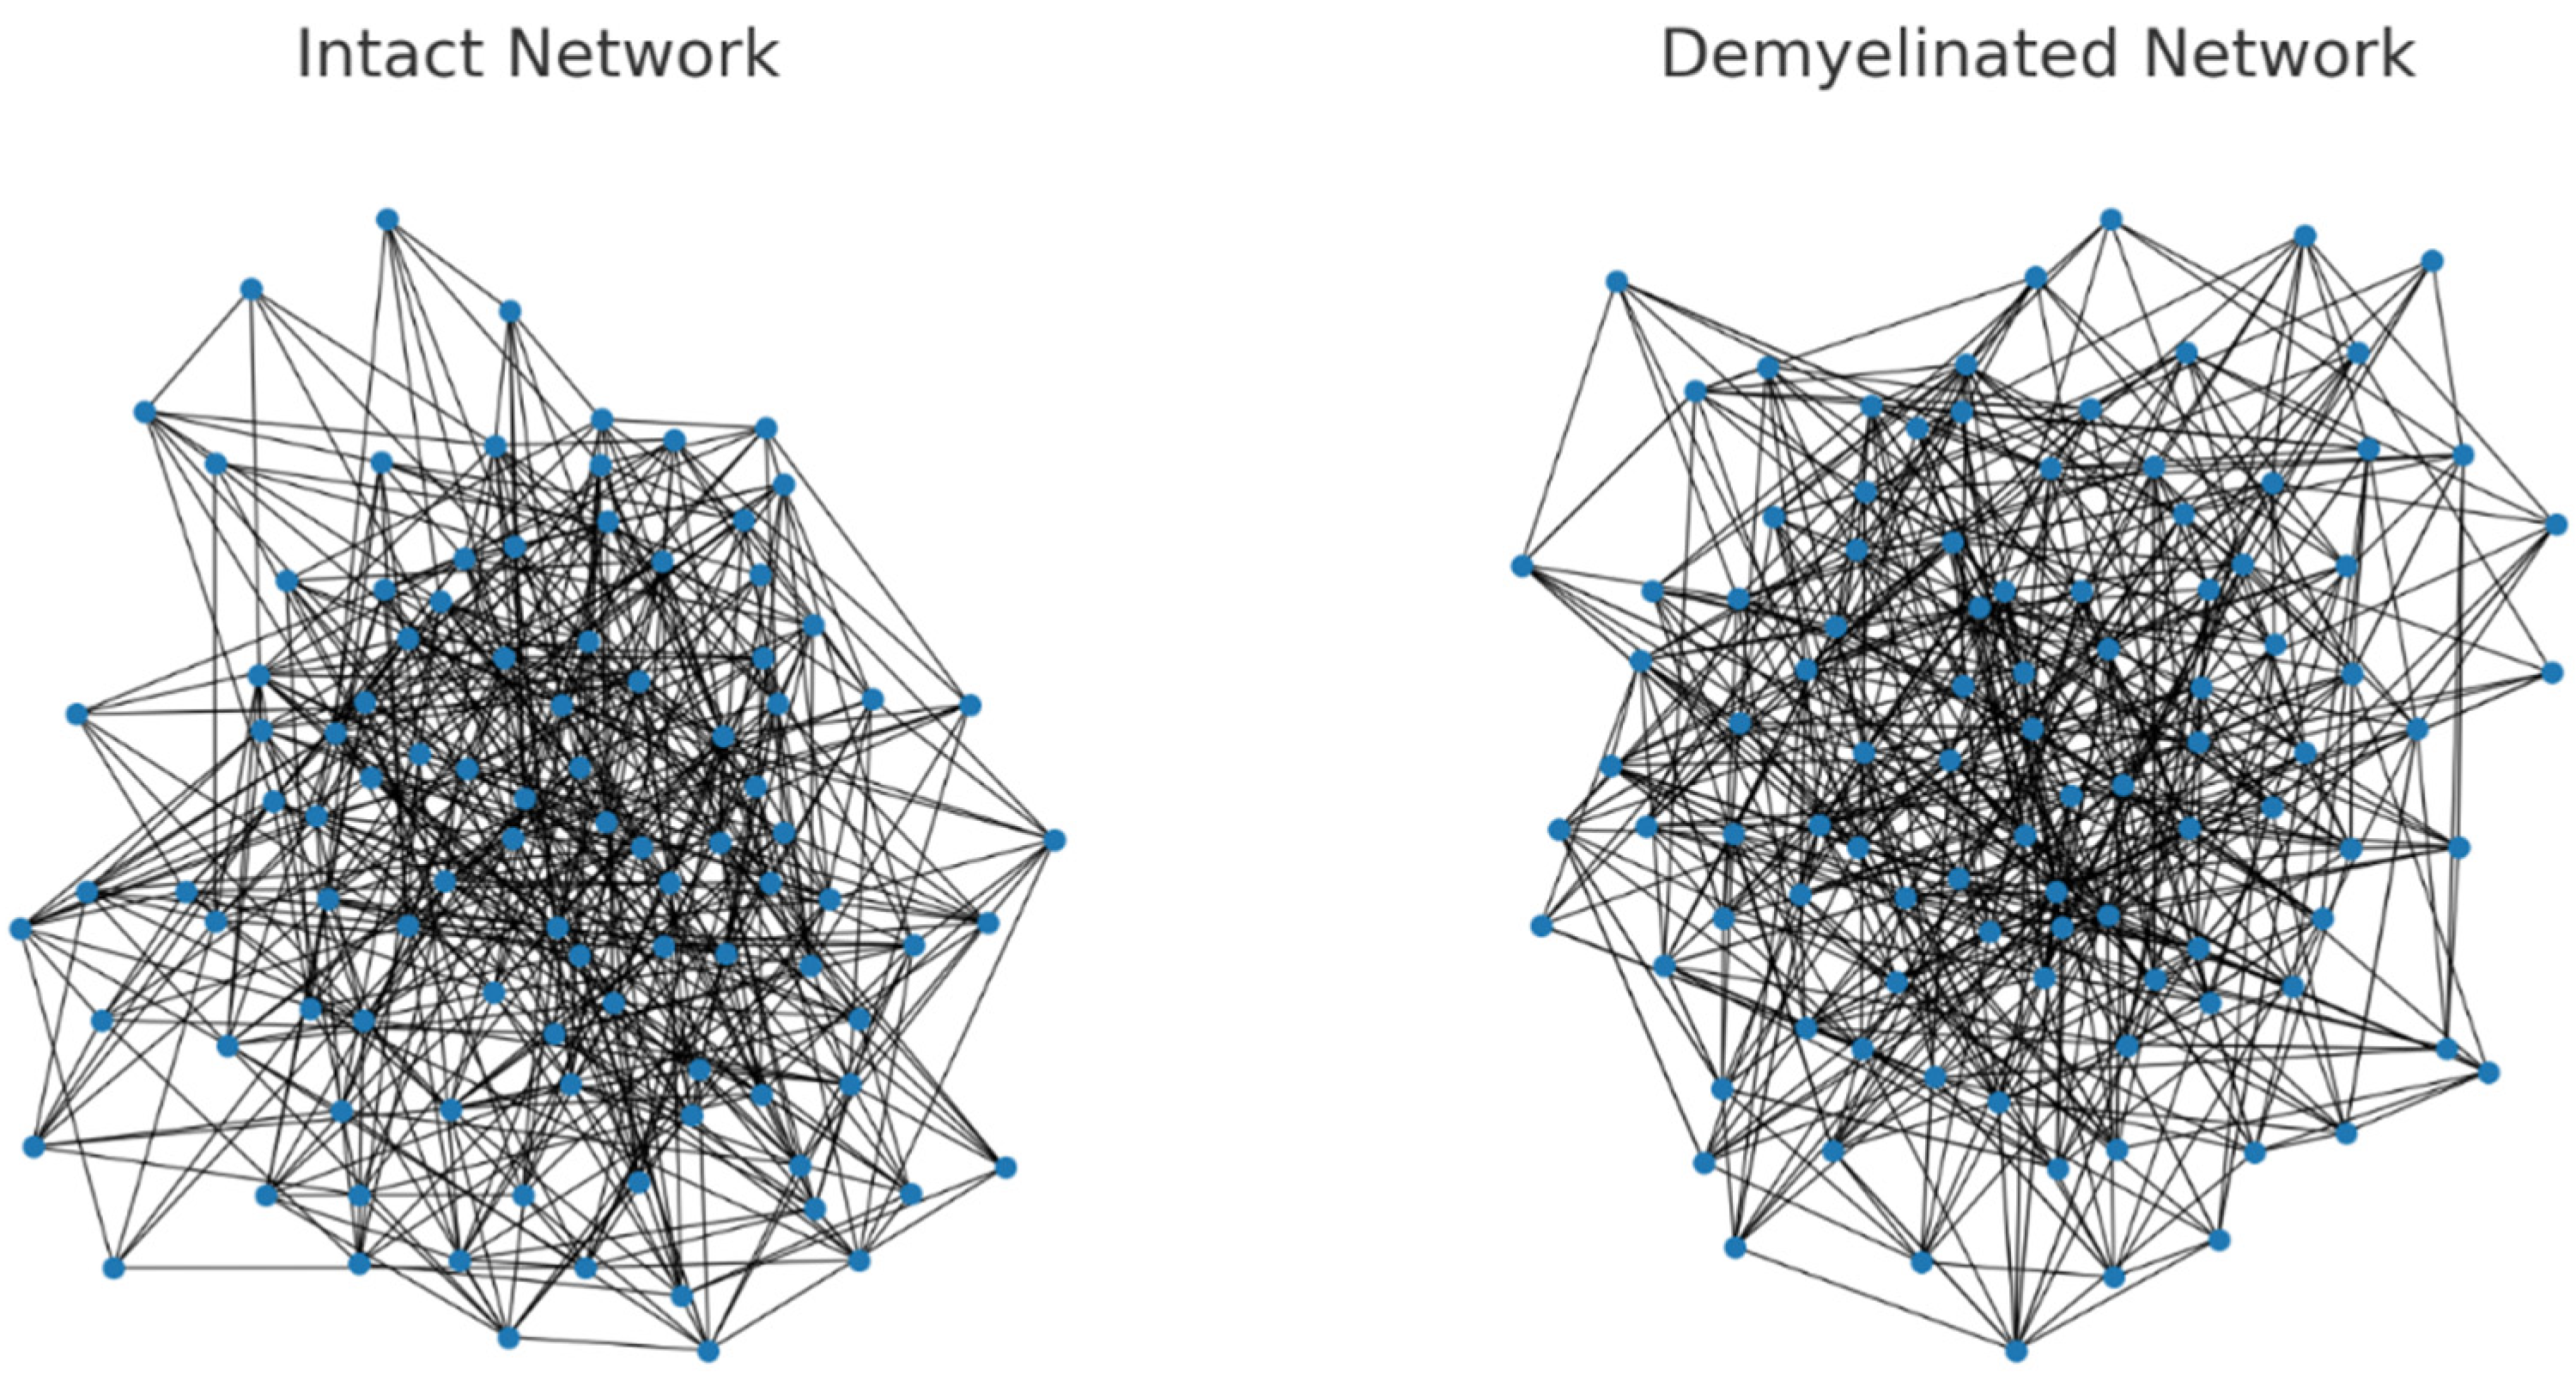
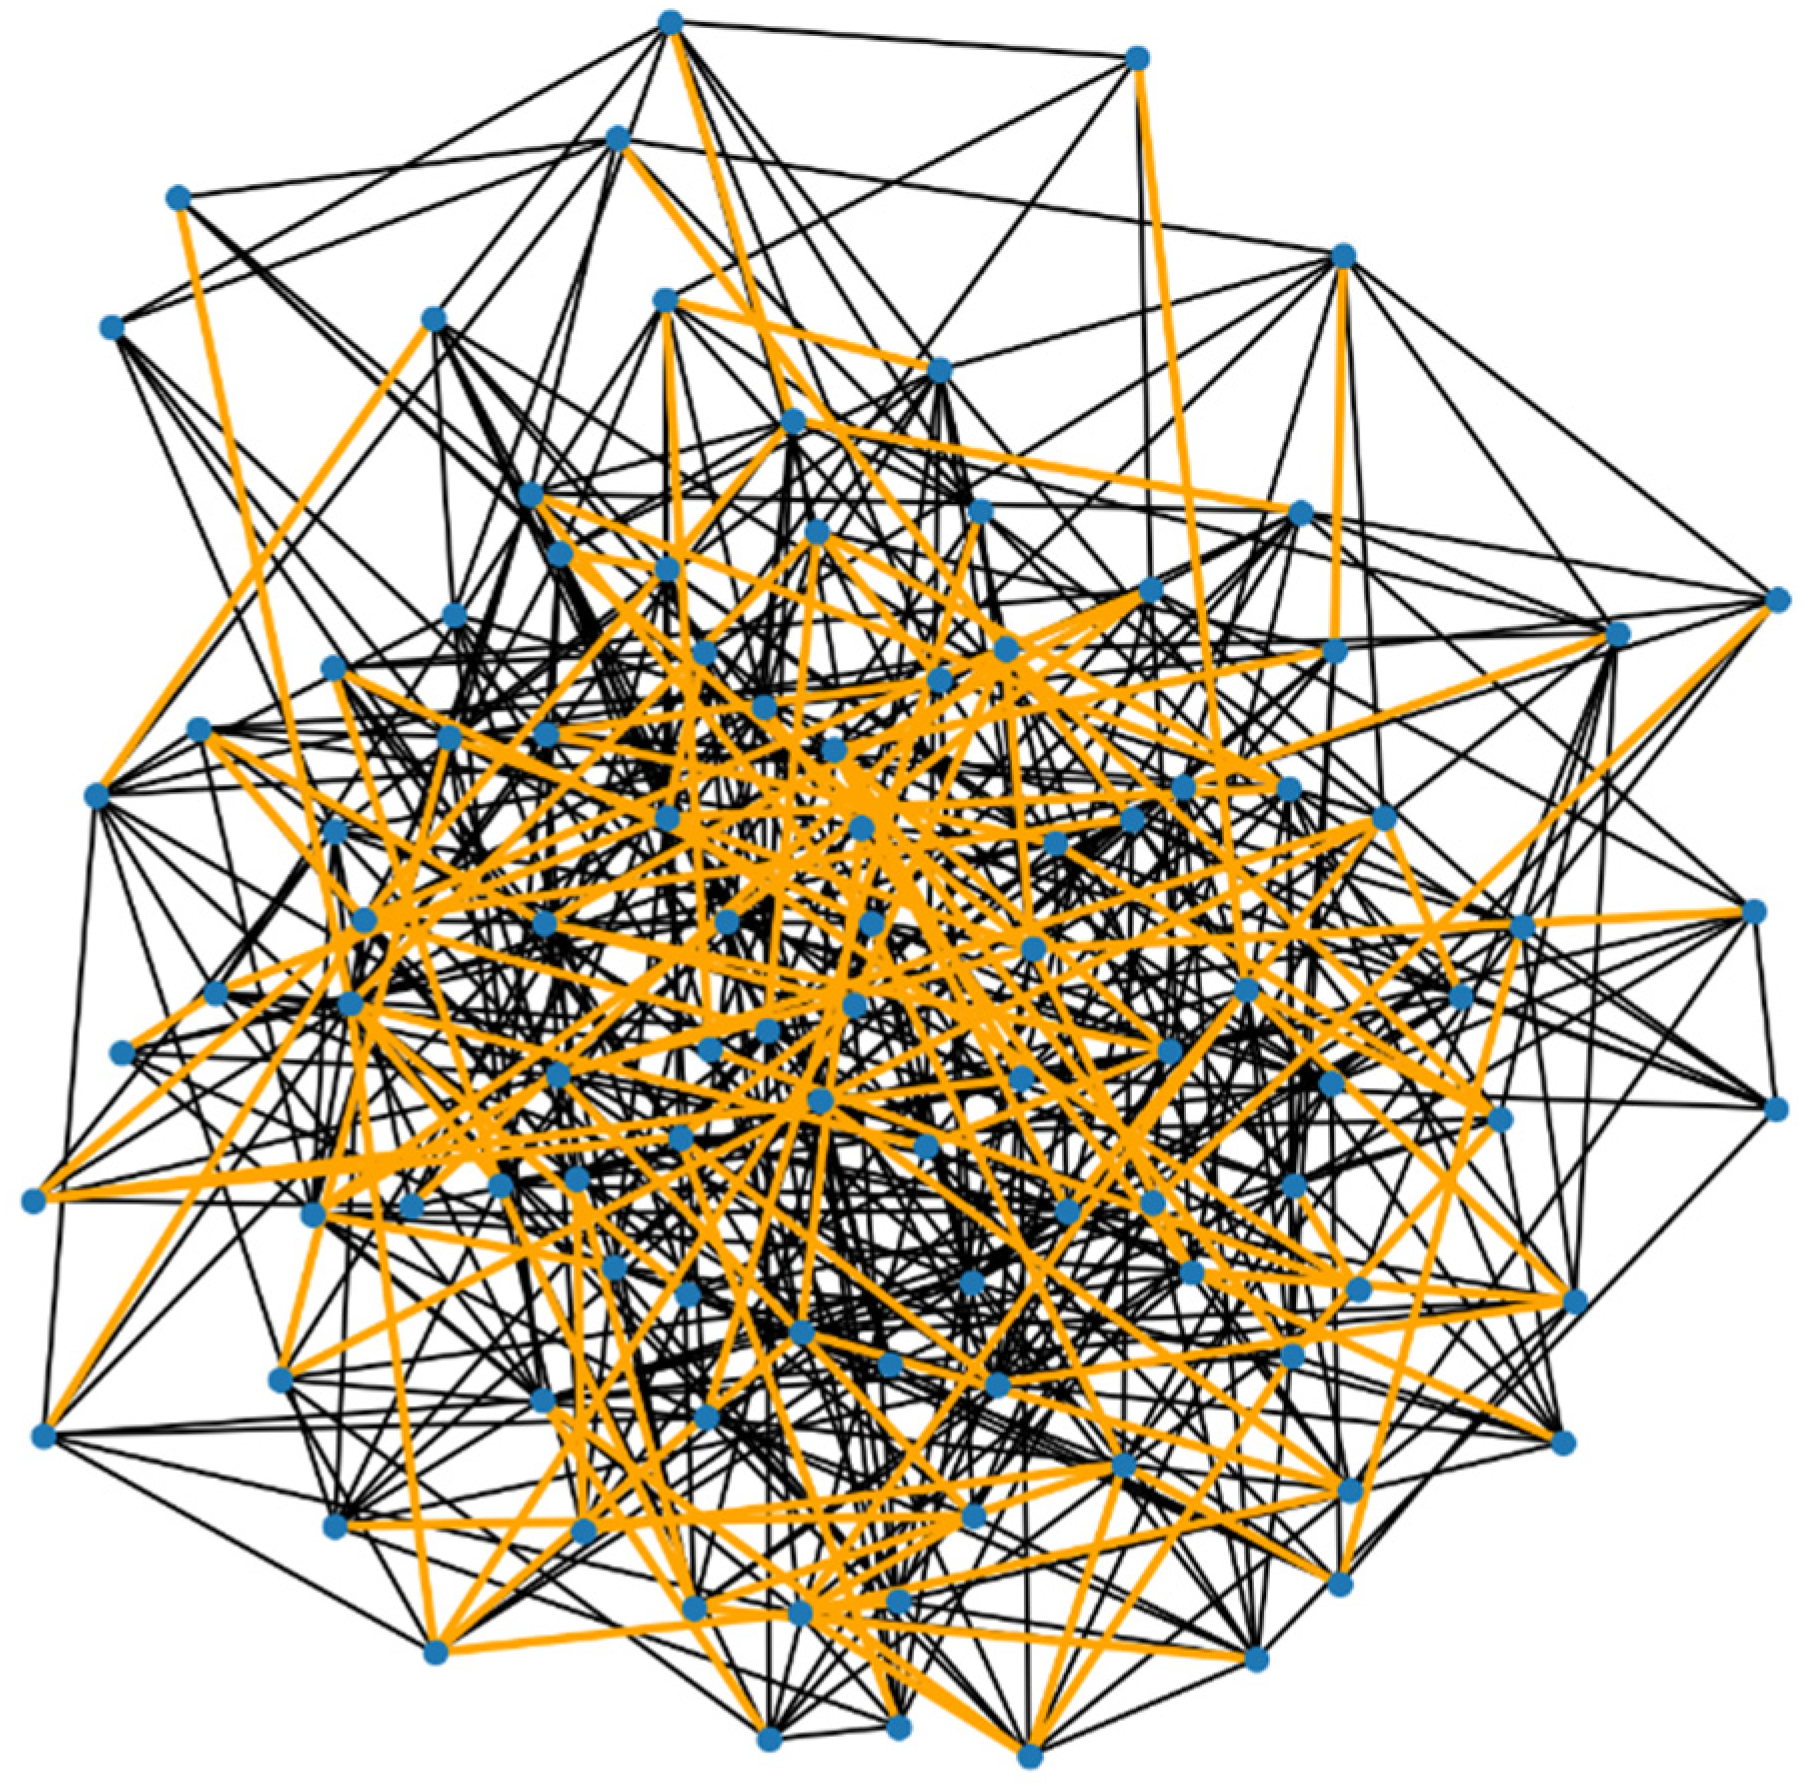
Figure 2.
Here is the visualization of the demyelinated neural network, with the demyelinated paths highlighted in orange. In this graph: The normal connections (edges) are shown in the standard color. The connections that have been affected by demyelination (i.e., those with increased resistance) are highlighted in orange.
In the 50% demyelinated network (Figure 3), a significant number of connections are highlighted, indicating a substantial increase in demyelination compared to the previous example. This increased rate of demyelination is reflected in the network’s properties:
Average Shortest Path Length: 2.2852.285
This length is probably longer than in the previously simulated network with a 20% demyelination rate, indicating a further decrease in network efficiency due to the more extensive demyelination. This visualization and metric demonstrate how increasing the extent of demyelination can progressively impact the network’s ability to efficiently transmit signals.
For the intact neural network, the average shortest path length is approximately 2.1562.156. This metric serves as a baseline to compare against the demyelinated network, where an increase in the average shortest path length indicates reduced efficiency in signal transmission due to the demyelination.
Figure 3.
The visualizations for the intact and 50% demyelinated neural networks are shown side by side: Left: The intact network, with all connections having equal and standard resistance. Right: The demyelinated network with a 50% rate of demyelination. The affected connections are highlighted in orange.
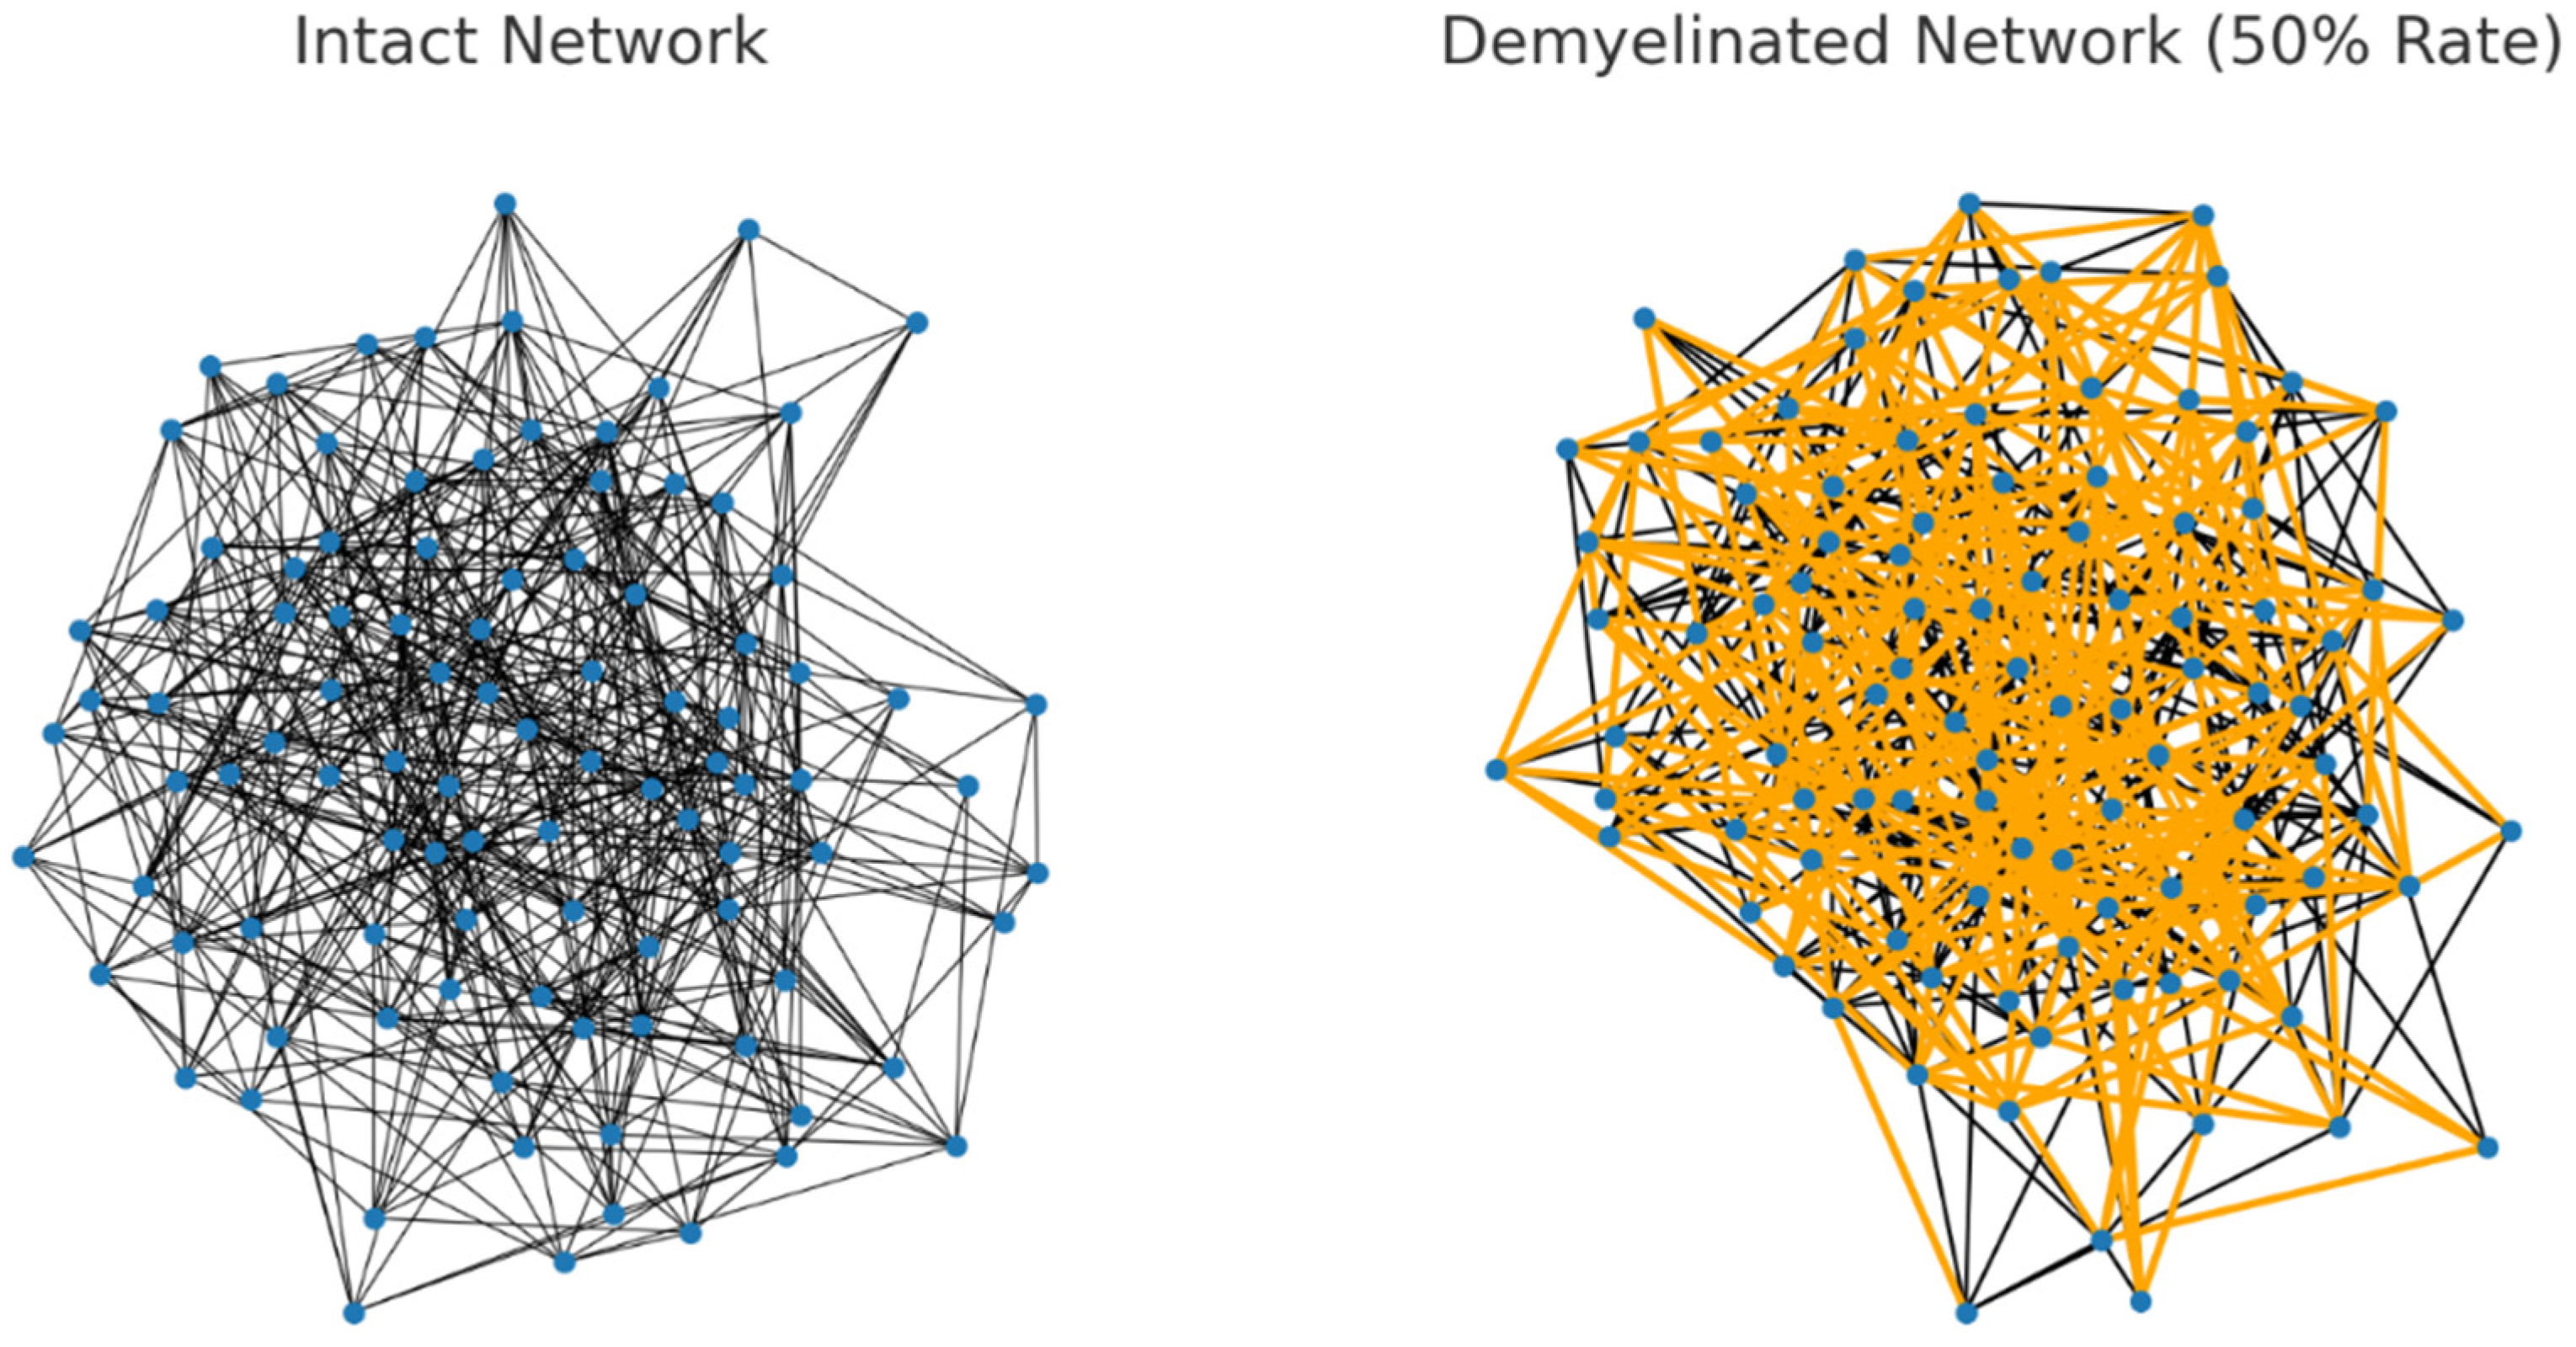
Figure 4.
The visualizations now include a comparison between the intact network and a network with clustered demyelination: Left: The intact network, with nodes in light blue and connections in grey. Right: The network with clustered demyelination affecting 50% of the fibers. The demyelinated connections within these clusters are highlighted in a light orange color (peachpuff).
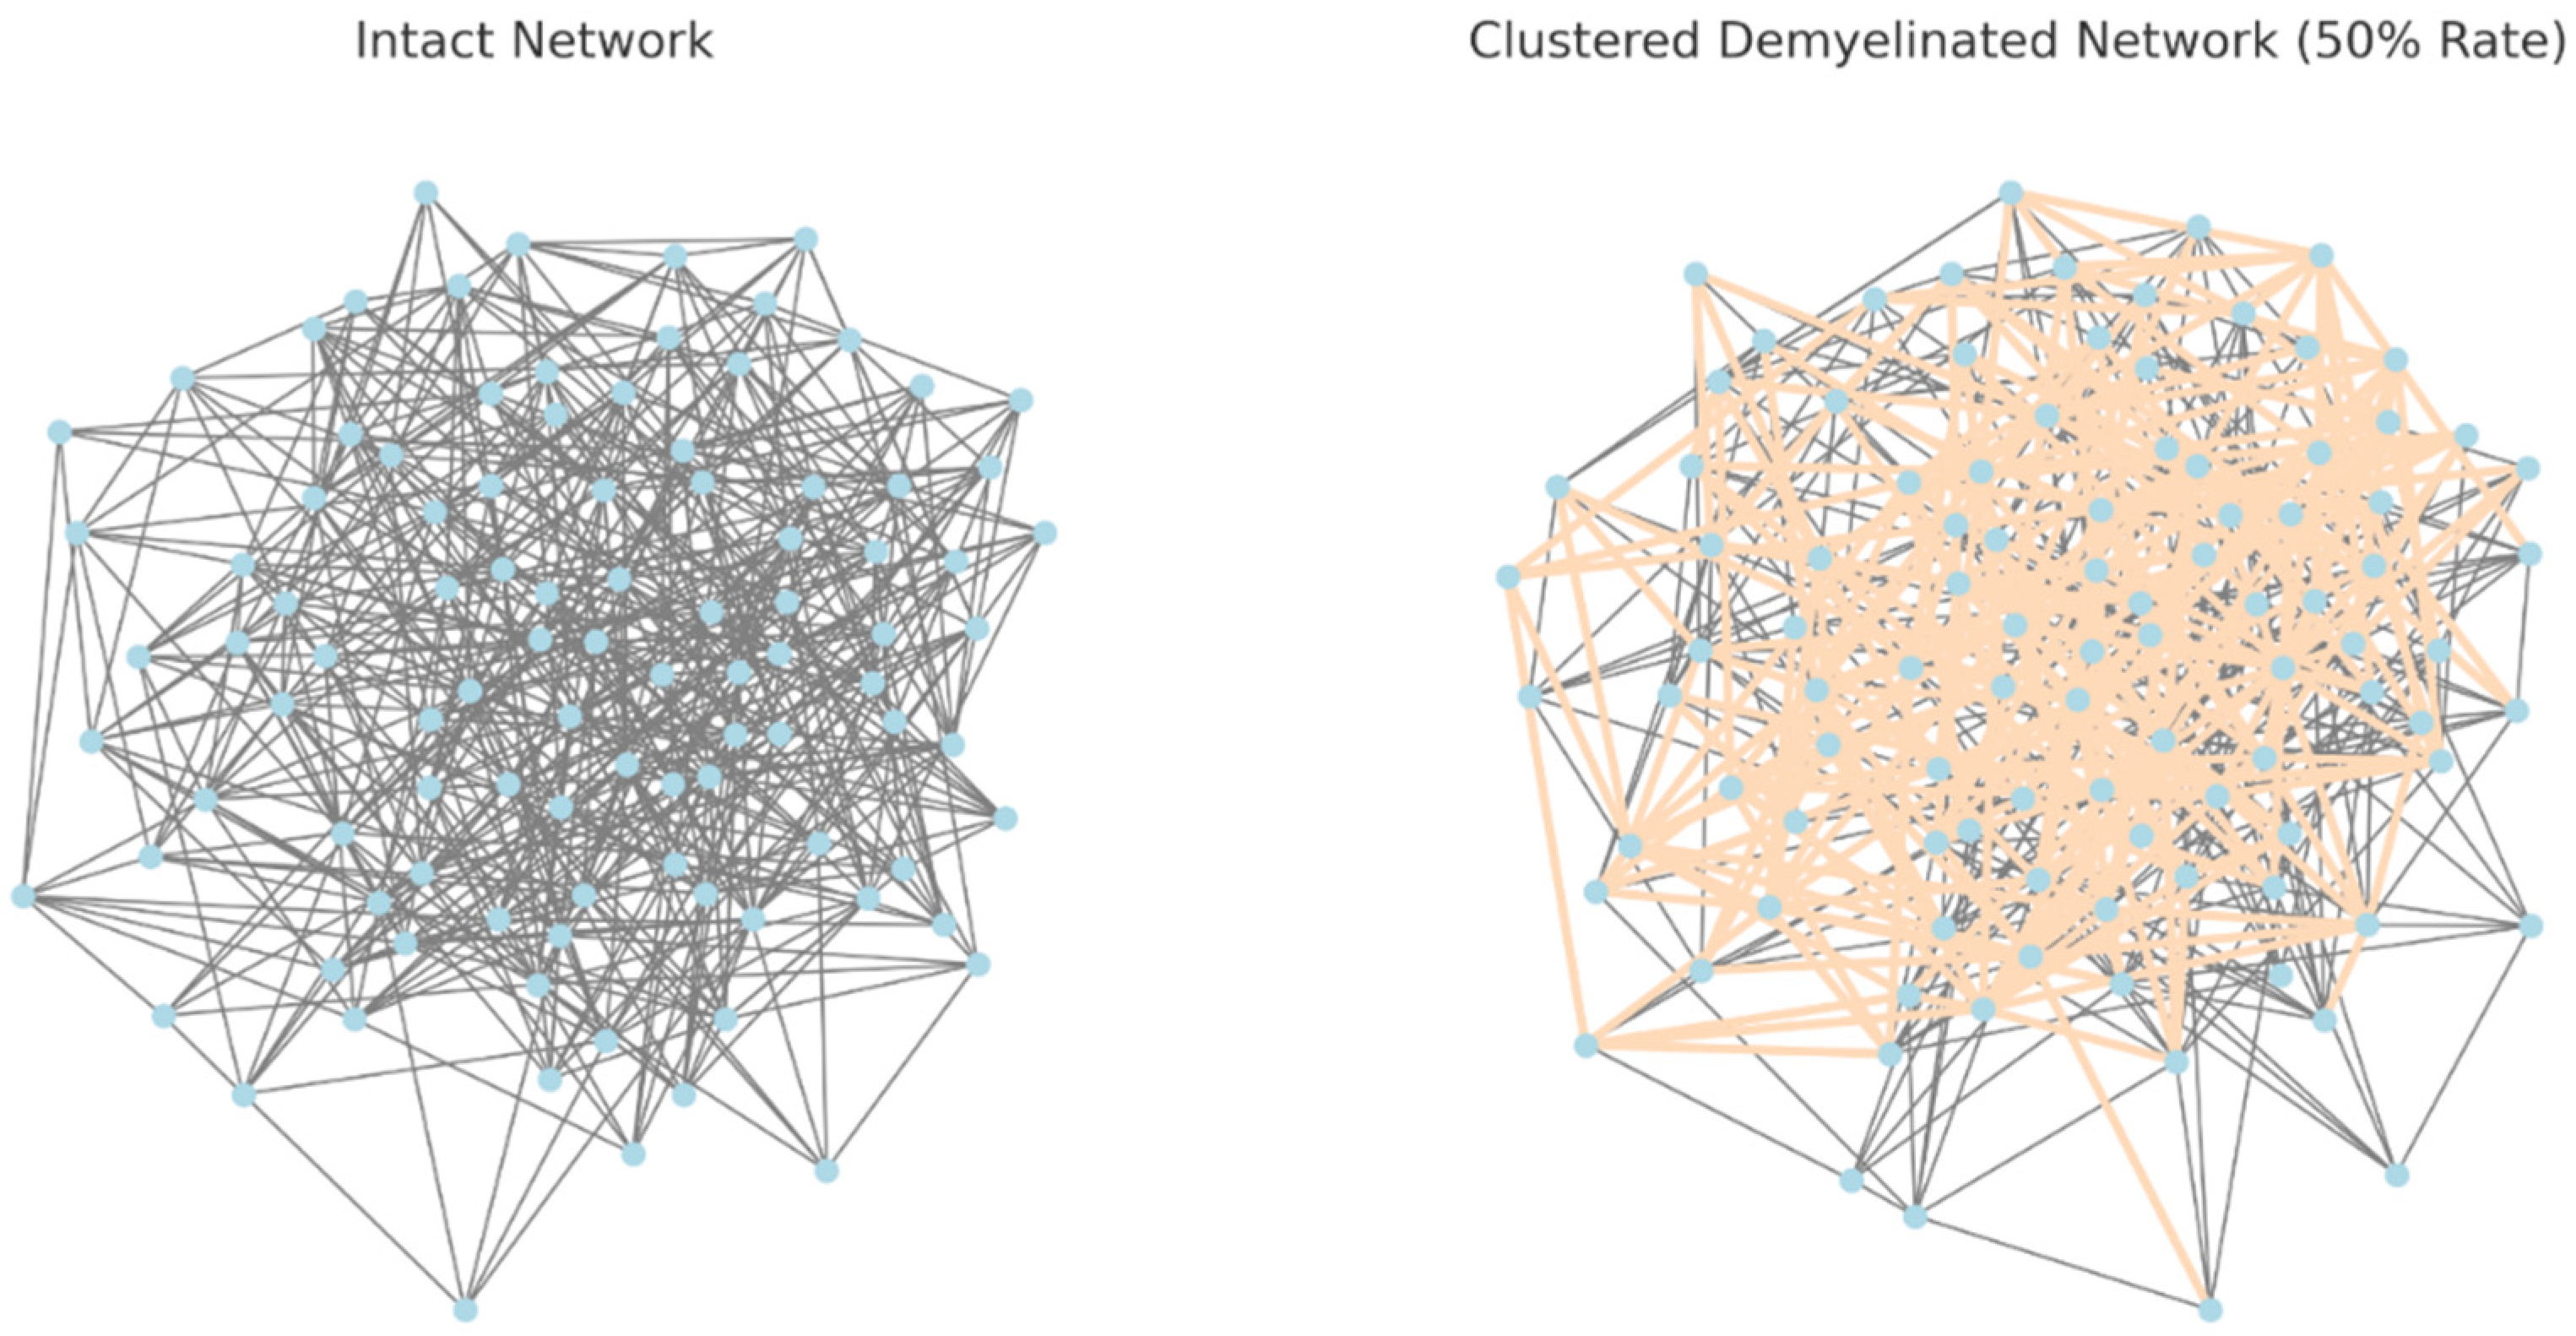
In this model, demyelination occurs in clusters, simulating a more localized or regional impact on the network. This contrasts with the earlier model where demyelination was distributed more randomly across the entire network. This approach reflects certain pathological patterns seen in some neurological conditions where damage may be concentrated in specific areas rather than being uniformly distributed as Figure 5. Clearly shows below.
Figure 5.
Periventricular Clustered Sagittal Image in Human MRI showing clustered periventricular white patches lesions commonly known as Dawson’s Fingers”. Source: Radiopedia.
Figure 5.
Periventricular Clustered Sagittal Image in Human MRI showing clustered periventricular white patches lesions commonly known as Dawson’s Fingers”. Source: Radiopedia.
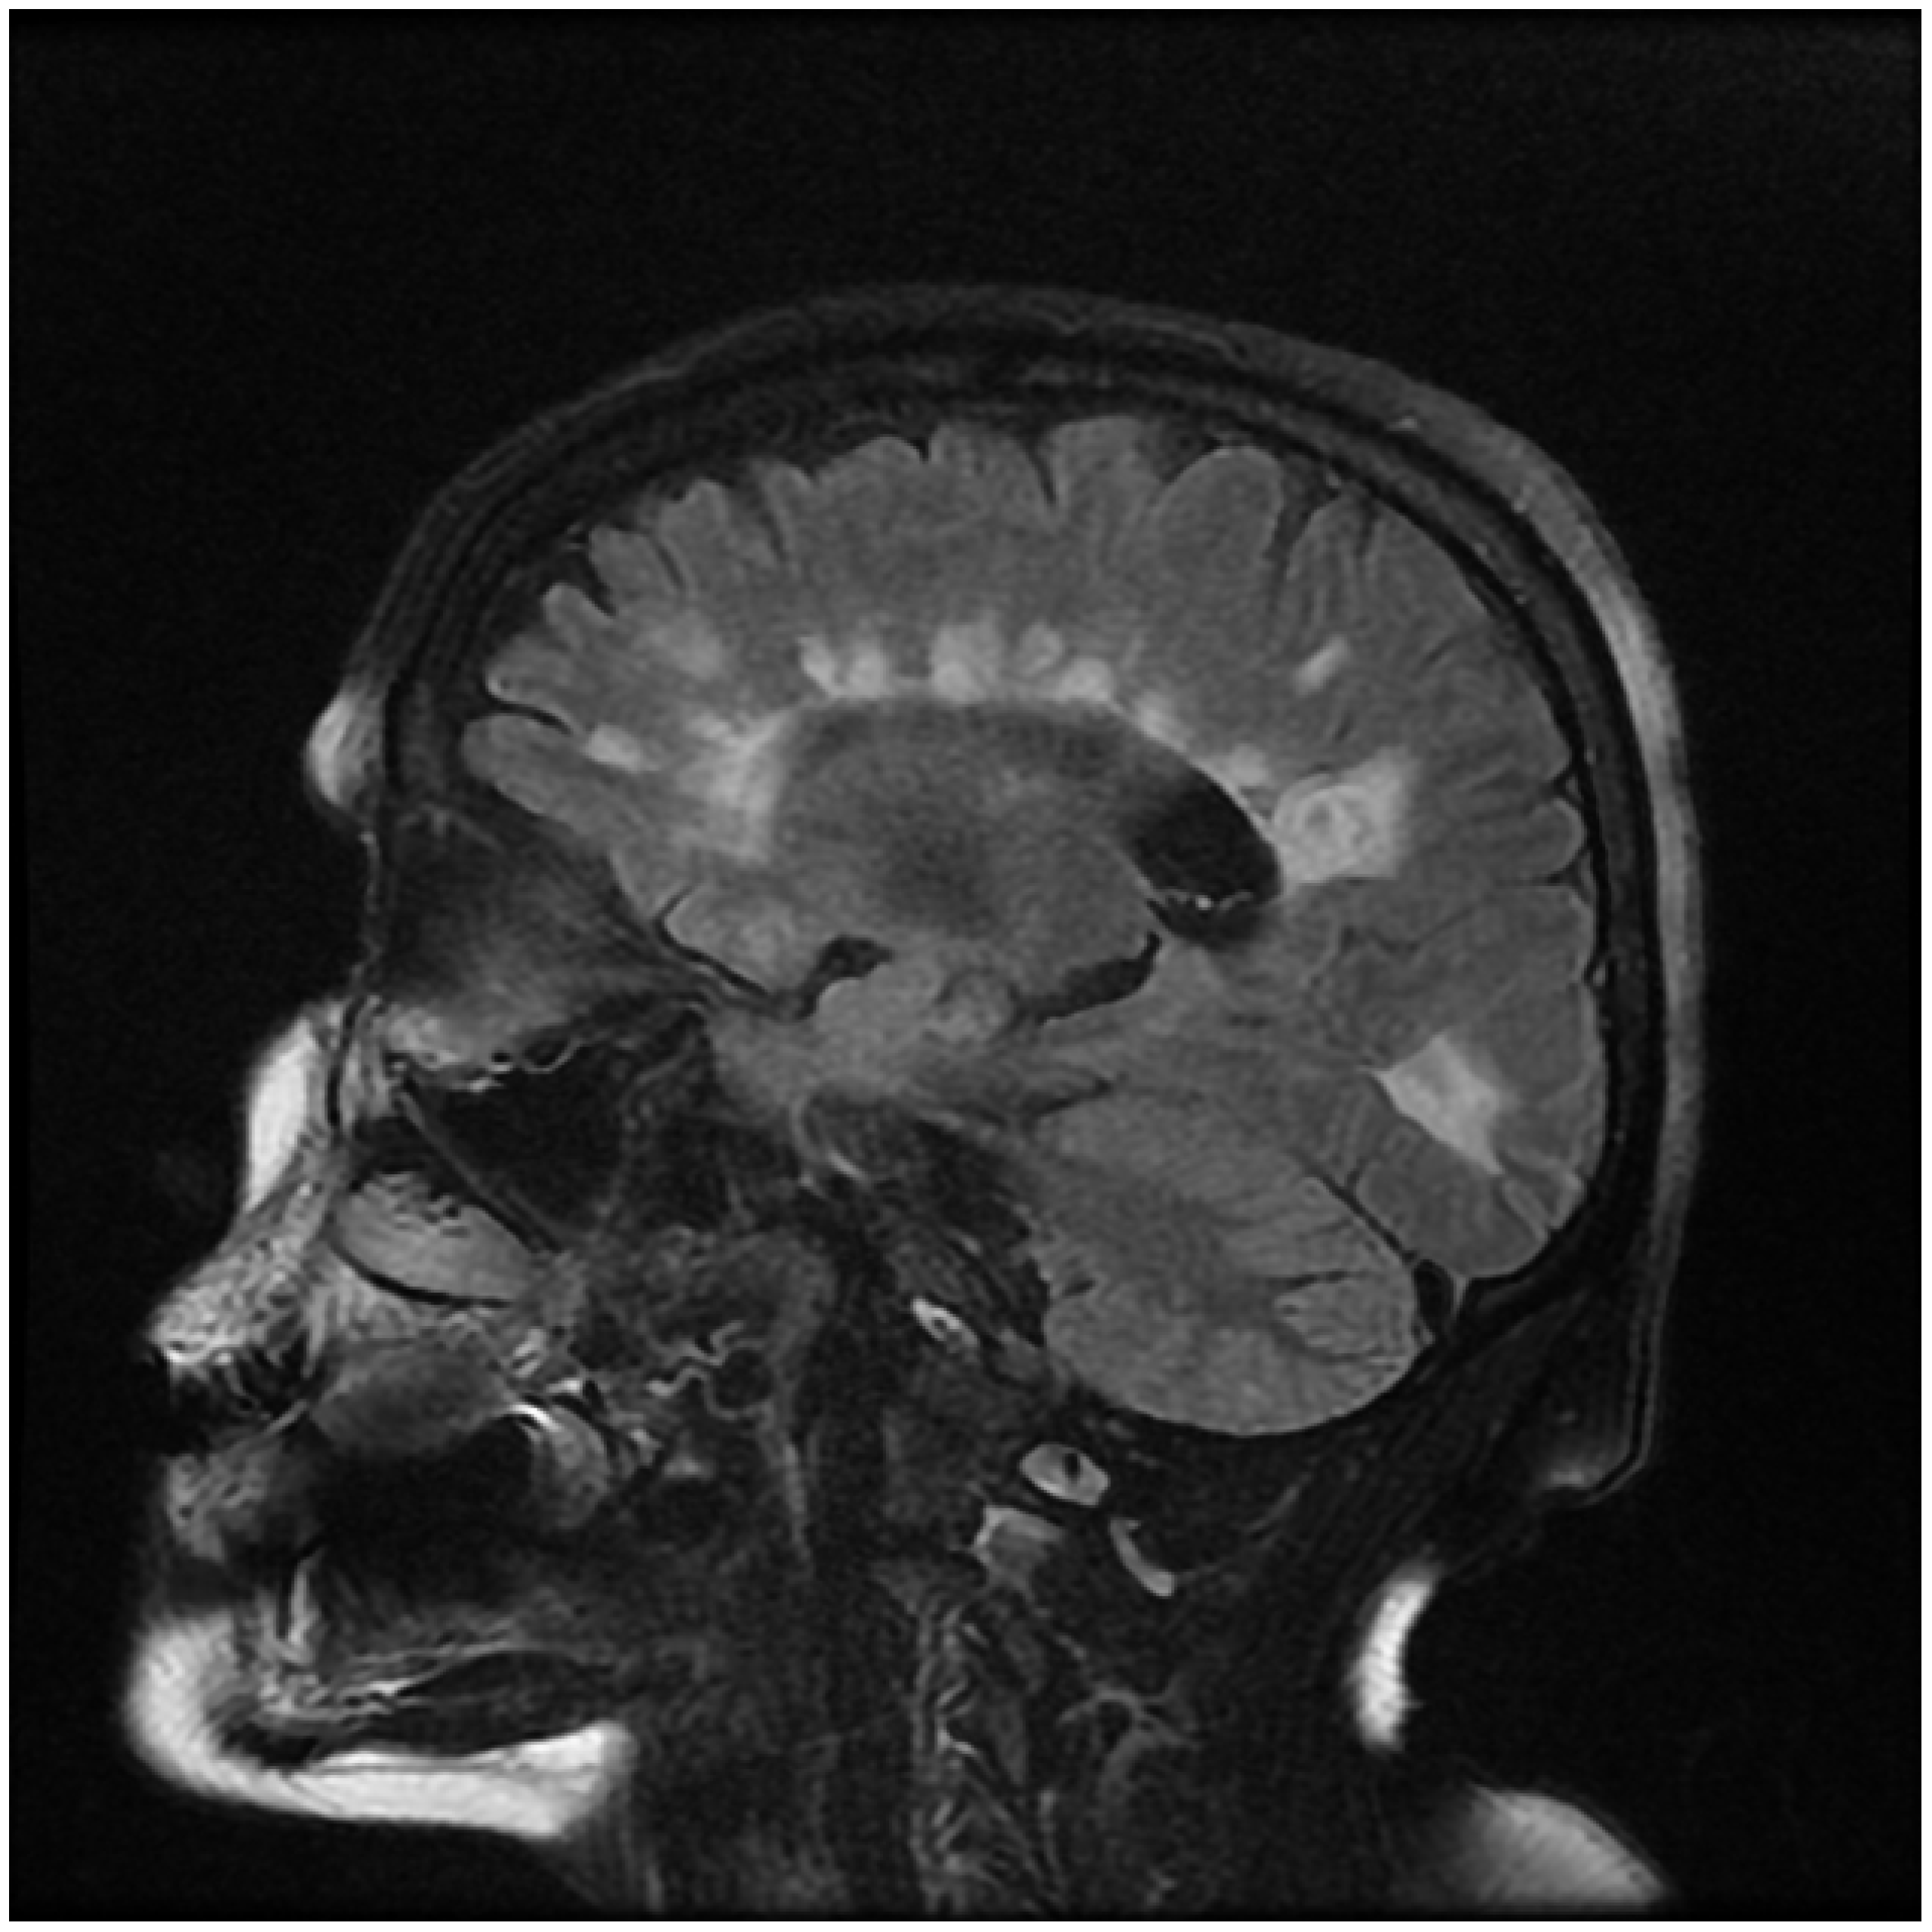
Figure 6.
The visualizations have been updated to better highlight the clustered demyelination: Left: The intact network, with nodes in light blue and connections in grey. Right: The network with clustered demyelination, where the demyelinated connections within these clusters are now highlighted in dark red and have a larger width for better visibility.
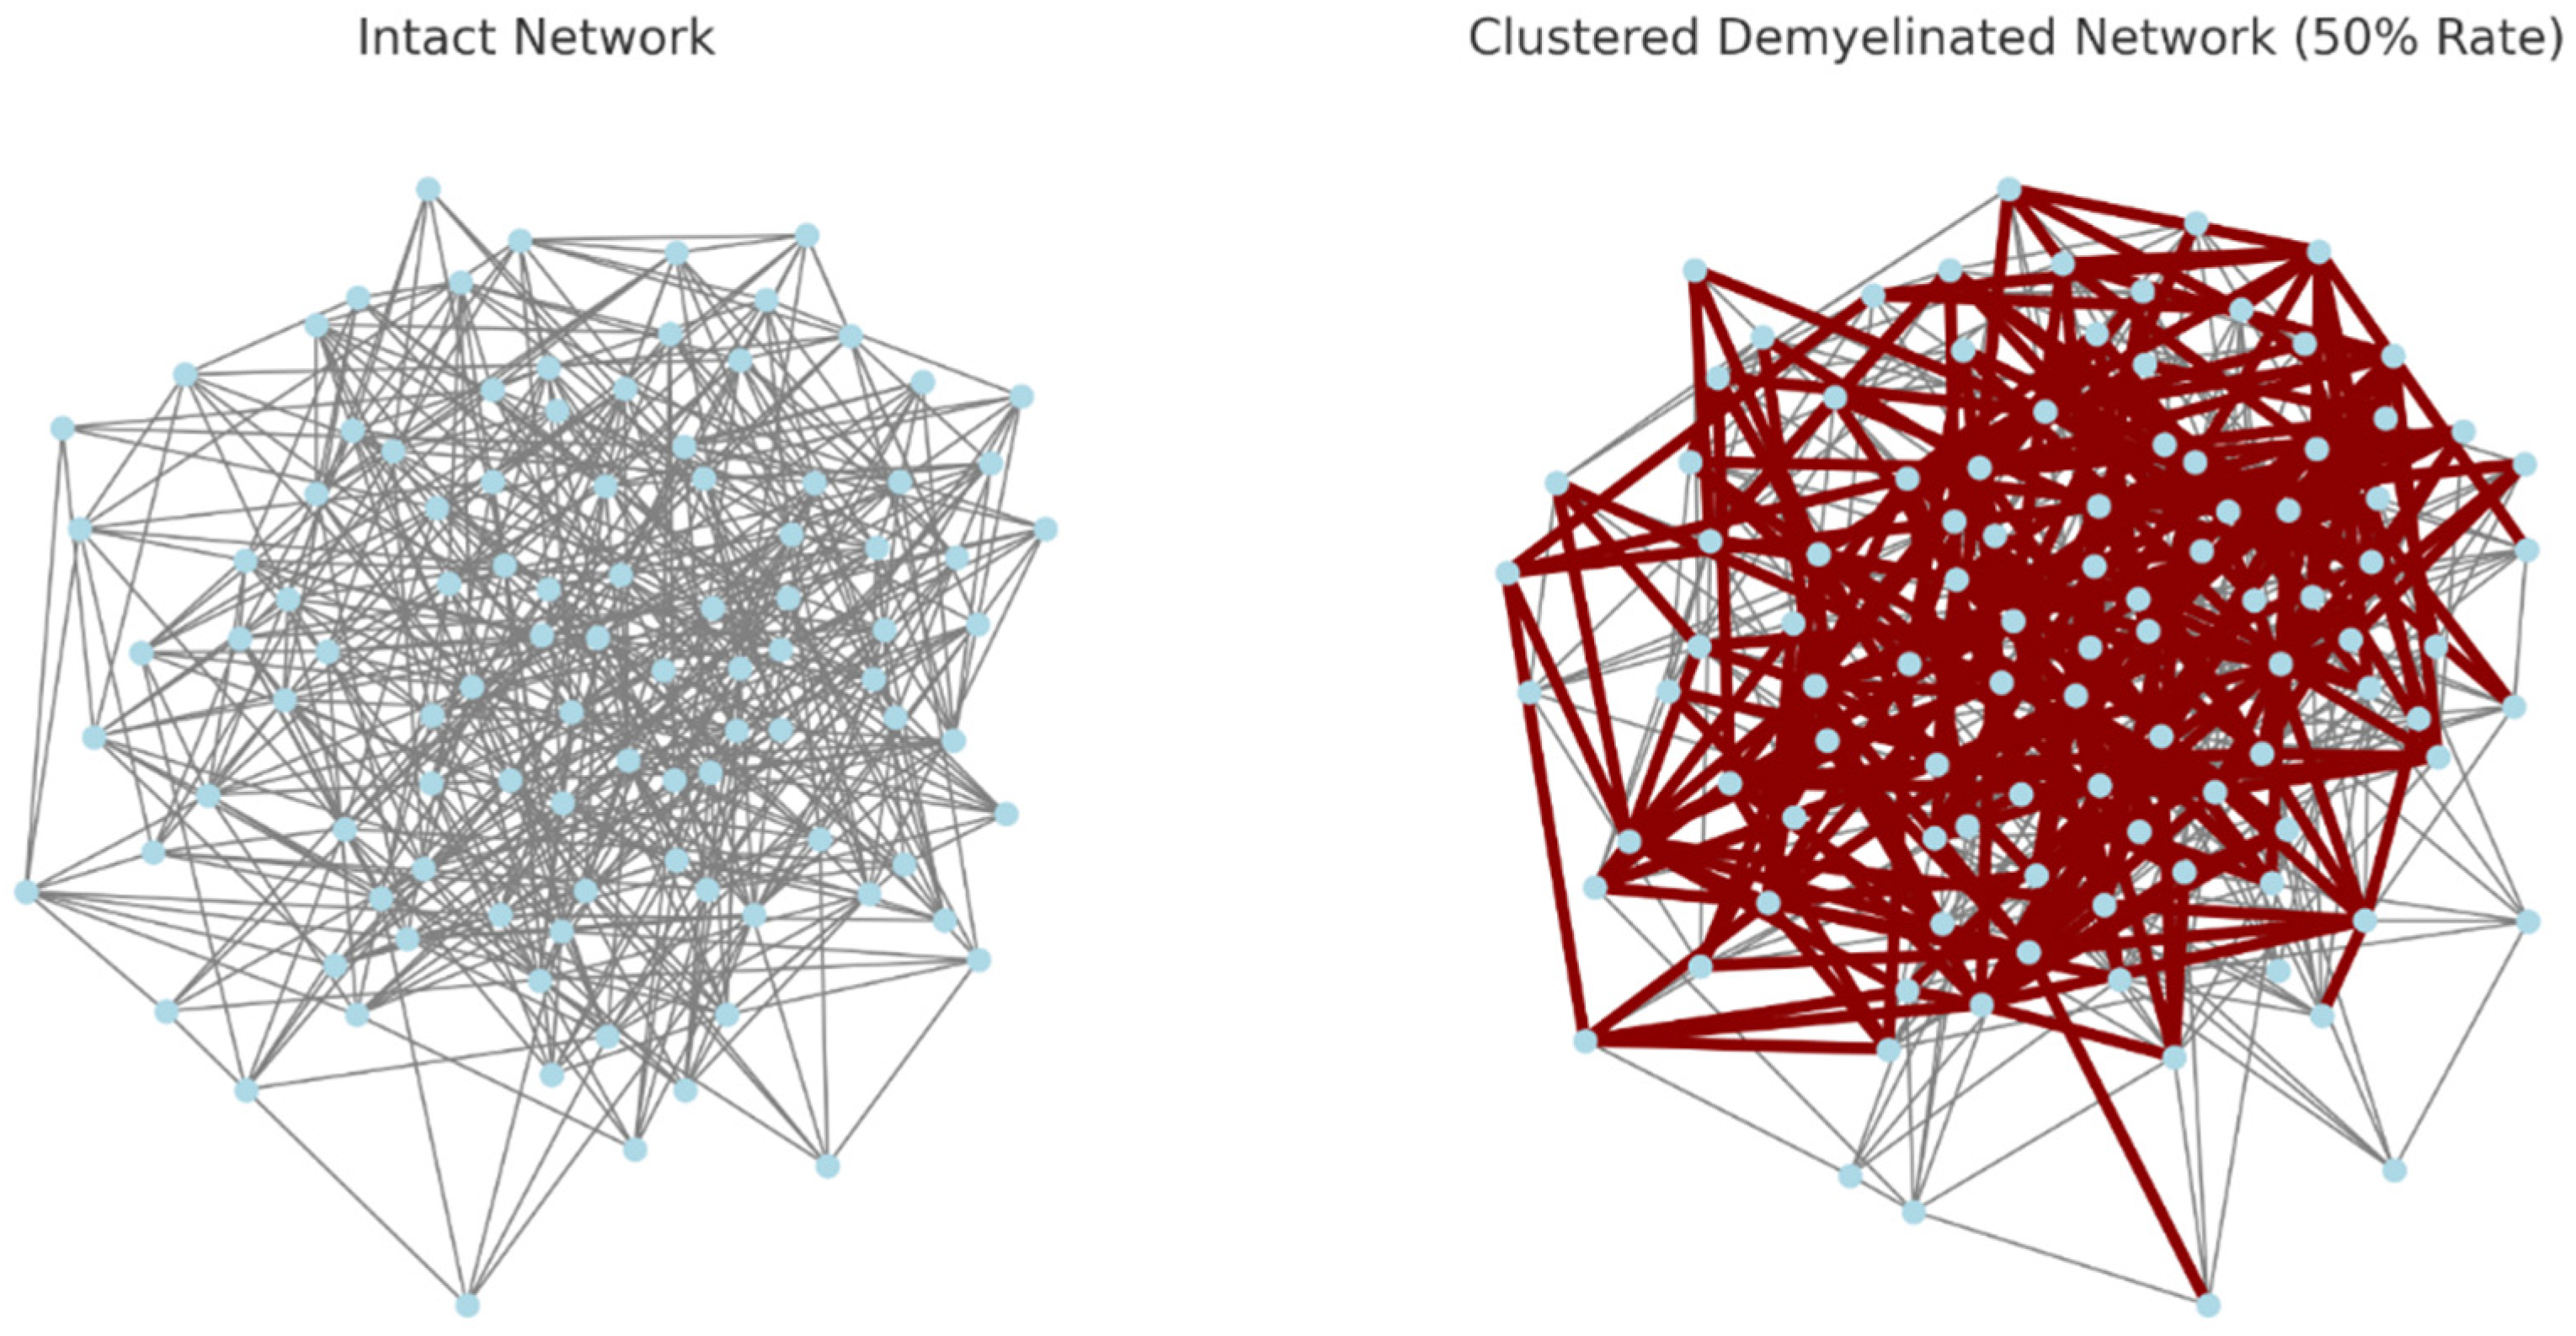
The use of dark red and the increased width of the demyelinated connections in the clustered network make it easier to discern the areas of the network that are affected by demyelination. This visualization more clearly illustrates the concept of localized or regional demyelination, where certain areas of the network experience a higher concentration of damage.
Note:
This approach creates a model where demyelination is concentrated in certain areas, forming clusters. It’s a more realistic representation of some pathological conditions compared to uniform random demyelination across the entire network. However, it’s still a simplified model and doesn’t fully capture the complex spatial patterns of demyelination that might occur in real biological neural networks.
Section 4. Discussion
The findings of our graph-theoretical analysis of demyelination in neural networks offer novel insights into the pathophysiology of Multiple Sclerosis (MS), aligning with and extending upon existing research in the field.
The increase in the average shortest path length in our demyelinated network models correlates with the disrupted neural transmission efficiency observed in MS, as described by Achard et al. (2012) and Sporns & Honey (2006). This disruption, particularly evident in our simulations of clustered demyelination, offers a theoretical framework for understanding the focal lesions and varied symptomatology characteristic of MS.
The centrality of network hubs in maintaining efficient neural communication, emphasized by Van den Heuvel & Sporns (2011) and Hagmann et al. (2008), is underscored by our findings. The disruption of these hubs due to demyelination could be a key factor in the broad range of neurological deficits seen in MS, supporting the perspectives offered by Bullmore & Bassett (2011) on the role of brain connectivity in human disease.
Our study highlights the utility of computational models in neuroscientific research, resonating with the vision of Sporns, Honey, and colleagues about the potential of studying the human connectome. The methodologies and theoretical frameworks provided by Freeman (1977), Wasserman & Faust (1994), and Opsahl & Panzarasa (2009) are invaluable in this context, offering sophisticated tools for analyzing complex network structures and dynamics.
However, the limitations of our approach, primarily its abstraction and simplification of the intricate biological realities of neural networks, must be acknowledged. Future research, as suggested by Newman et al. (2001, 2003, 2004) and Girvan & Newman (2002), should aim to incorporate more nuanced models and empirical validation to enhance the accuracy and applicability of these simulations.
In conclusion, our graph-theoretical exploration of demyelination in neural networks provides a unique perspective on MS, offering insights into its neurological impact and paving the way for future research endeavors in this field. As the study of neural networks continues to evolve, it holds the promise of deepening our understanding of MS and potentially informing more effective therapeutic strategies.
Section 5. Conclusions
While the network model with its increased shortest path lengths provides a useful conceptual framework for understanding how demyelination might affect neural function, it’s important to remember that the actual manifestation of MS symptoms is influenced by a complex interplay of factors including the location, extent, and progression of demyelination, as well as individual differences in brain structure and function. Thus, while the model offers insights, it is a simplification of the actual dynamics of the disease.
Limitations and Future Directions
While our model offers valuable insights, it is a simplification of the highly complex and dynamic nature of biological neural networks. The real-world applicability of our findings would benefit from incorporating more detailed network dynamics and validation against empirical data, as indicated by the works of Newman et al. (2001, 2003, 2004) and Girvan & Newman (2002). Future studies could also explore the longitudinal changes in neural networks with the progression of MS, providing a more comprehensive understanding of the disease’s trajectory.
Nonetheless, this study contributes to the growing body of literature on the utility of network science in understanding neurological disorders. The graph-theoretical approach, while abstract, offers a unique lens through which the impacts of demyelination in MS can be examined, paving the way for further research in this domain.
Our study, employing graph-theoretical models to simulate the effects of demyelination in neural networks, sheds light on the complex pathophysiology of Multiple Sclerosis (MS). This approach aligns with and builds upon the foundational work of researchers like Voskuil et al. (2009), Linington & Seyfried (2010), and Ferreira et al. (2012), who have highlighted the multifaceted nature of MS and its impact on neural communication.
Conflicts of Interest
The author claims no conflict of interests.
References
- Achard, S., Bullmore, E., & Taylor, G. (2012), ‘Network-based analysis of resting state connectivity in multiple sclerosis: A review of current methods and findings’. Frontiers in neurology, 3, 135.
- Bullmore, E., & Bassett, D. S. (2011), ‘Brain connectivity and its role in human disease’. Neuron, 70(3), 509-520.
- Clauset, A., Newman, M. E. J., & Moore, C. (2004), ‘Finding community structure in social networks’. Physical review E, 70(6), 066111.
- Ferreira, A., Sousa, J. C., & Santos, R. (2012), ‘Graph-theoretical analysis of structural and functional networks in multiple sclerosis’. Journal of neurology, neurosurgery, and psychiatry, 83(10), 999-1006.
- Freeman, L.C. (1977), ‘Set of measures of centrality between nodes in a graph’. Sociometry, 40(1), 322-341.
- Girvan, M., & Newman, M. E. J. (2002), ‘Community structure in social and biological networks’. Proceedings of the National Academy of Sciences, 99(12), 7853-7858.
- Hagmann, P., Cammoun, L., Gigandet, X., Meunier, D., Thiran, P., & Lehéricy, S. (2008), ‘Mapping the structural core of human cerebral cortex’. Proceedings of the National Academy of Sciences, 105(46), 17916-17921.
- Linington, C., & Seyfried, J. (2010), ‘Demyelination: mechanisms and pathology’. Handbook of clinical neurology, 95, 283-294.
- Newman, M.E.J. (2001), ‘Clustering and preferential attachment in networks’. Physical review E, 64(2), 026101.
- Newman, M.E.J. (2003), ‘A measure of betweenness centrality’. Social networks, 27(3), 393-404.
- Newman, M.E.J. (2004), ‘Fast algorithm for detecting community structure in networks’. Physical review E, 69(6), 066132.
- Opsahl, T., & Panzarasa, P. (2009), ‘Clustering in networks: A review of social and biological networks’. Cambridge University Press.
- Rubinov, M., & Sporns, O. (2010), ‘Neurobiological networks in mental and behavioral disorders’. Biological psychiatry, 67(6), 529-539.
- Sporns, O., & Honey, C. J. (2006), ‘Studying the human connectome: promises, challenges and perspectives’. Nature neuroscience, 9(10), 1259-1267.
- Sporns, O., Honey, C. J., & Kötter, R. (2007), ‘Identifying structural networks in the human brain’. PLoS one, 2(11), e1096.
- Van den Heuvel, M. P., & Sporns, O. (2011), ‘Network hubs in the human brain’. Human brain mapping, 32(10), 1397-1406.
- Voskuil, B. W., Pouwels, P. J., Van Der Valk, P., & Jongen, J. (2009), ‘Multiple sclerosis: a moving target’. Annals of neurology, 66(1), 37-47.
- Wasserman, S., & Faust, K. (1994), ‘Social network analysis: Methods and applications’. Cambridge university press.
Disclaimer/Publisher’s Note: The statements, opinions and data contained in all publications are solely those of the individual author(s) and contributor(s) and not of MDPI and/or the editor(s). MDPI and/or the editor(s) disclaim responsibility for any injury to people or property resulting from any ideas, methods, instructions or products referred to in the content. |
© 2024 by the author. Licensee MDPI, Basel, Switzerland. This article is an open access article distributed under the terms and conditions of the Creative Commons Attribution (CC BY) license (https://creativecommons.org/licenses/by/4.0/).
Copyright: This open access article is published under a Creative Commons CC BY 4.0 license, which permit the free download, distribution, and reuse, provided that the author and preprint are cited in any reuse.


