Submitted:
20 June 2024
Posted:
20 June 2024
You are already at the latest version
Abstract
Studies have shown that vehicle trajectory data are effective for calibrating microsimulation mod-els. Light Detection and Ranging (LiDAR) technology offers high-resolution 3-D data, allowing for detailed mapping of the surrounding environment, including road geometry, roadside infrastruc-tures, and moving objects such as vehicles, cyclists, and pedestrians. This research presents a comprehensive framework for integrating LiDAR sensor data into simulation models and accu-rately calibrating for proactive safety analysis. Vehicle trajectory data were extracted from LiDAR point cloud collected at six urban signalized intersections in Lubbock, Texas in USA. Each study intersection was modelled with PTV VISSIM and calibrated to replicate the observed field scenarios. The Directed Brute Force method was used to calibrate two car-following and two lane-change parameters of Wiedemann 1999 model in VISSIM, resulting in an average accuracy of 92.7%. Rear-end conflicts extracted from the calibrated models combined with a ten-year historical crash dataset were fitted into a Negative Binomial (NB) model to estimate the model's parameters. In all the six intersections, rear-end conflict count is a statistically significant predictor (p-value < 0.05) of observed rear-end crash frequency. The outcome of this study provides a framework for the com-bined use of LiDAR-based vehicle trajectory data, microsimulation and surrogate safety assessment tools to transportation professionals for proactive safety evaluation.
Keywords:
LiDAR
; VISSIM
; Calibration
; SSAM
; Negative Binomial
; Crash Prediction.
1. Introduction
Microsimulation has gained widespread adoption due to its risk-free nature and cost-effectiveness. It is a powerful tool for modelling traffic operations and conducting safety studies. Simulation models replicate individual driver’s behaviors within a virtual environment by providing detailed representation of car-following and lane-changing behaviors in response to the surrounding traffic [1]. Compared to analytical models, microsimulation models provide individual vehicle movements on a second or sub-second basis [2]. Most microsimulation models including VISSIM, AIMSUN, CORSIM, and SUMO incorporate independent parameters with default values to describe traffic flow characteristics. These default values often yield unreliable results because driver behavior varies significantly depending on the geographical region and driving conditions. Thus, users frequently fine-tune these parameters to accurately represent traffic conditions specific to their case studies. Consequently, calibrating and validating microscopic simulation models is crucial for analyzing transportation alternatives, designing traffic control strategies, predicting future congestion problems, and evaluating advanced vehicle technology impacts, performing safety analysis and so on. Model calibration aims to minimize discrepancies between field measurements and simulation results. The accuracy of microsimulation models heavily relies on how well they are calibrated using available real-world traffic data [3].
Studies have shown that vehicle trajectory data are effective for calibrating microsimulation models [4]. Vehicle trajectory data can be collected from several sources, such as loop detectors [5], microwave radars [6], video cameras [1] or roadside LiDAR infrastructure [7]. To date, video cameras are the most common method of obtaining vehicle trajectory data. However, video cameras have several weaknesses including high computing and processing requirement for real-time applications, sensitivity to weather condition, and video quality is significantly affected by illumination condition [8]. LiDAR (Light Detection and Ranging) technology offers high-resolution 3-D data, allowing for detailed mapping of the surrounding environment, including road geometry, roadside infrastructures, and moving objects such as vehicles, cyclists, and pedestrians. Unlike video cameras which capture detailed images that can reveal Personally Identifiable Information (PII) like facial features or license plates, LiDAR represents objects by point clouds that consist of spatial data points. LiDAR’s high-speed data processing makes it well-suited for applications requiring real-time response, such as autonomous vehicles [9]. They also perform well in bad weather and low light conditions [10]. Additionally, with the continued development of LiDAR technology and their widespread use, the cost has significantly decreased over the past few years [11].
A complete simulation model has complex data requirements and numerous model parameters. There are significant challenges in effectively calibrating and validating these integrated models to ensure their reliability and accuracy in predicting safety outcomes. But past studies suggest that the reliability of microscopic traffic simulations can be substantially improved through rigorous calibration techniques [12]. This research aims to contribute to the ongoing efforts to improve transportation safety by presenting a comprehensive framework for integrating LiDAR sensor data into carefully calibrated simulation models for proactive safety analysis. By leveraging the strengths of LiDAR sensor data, microsimulation models can achieve a higher level of accuracy and realism in representing real-world traffic scenarios. The rest of this paper is organized as follows: The Materials and Methods section provides details on the workflow for extracting vehicle trajectory data from LiDAR sensor point cloud, VISSIM model creation, the sensitivity analysis method, the calibration approach and surrogate safety measures. The Results section presents results of calibration, the surrogate safety measures and Negative Binomial model. The Discussion section explains the results and their implications. Finally, the Conclusion section summarizes this paper.
2. Materials and Methods
This study implements a framework for integrating vehicle trajectory data obtained from LiDAR sensor to VISSIM models, performs a Sensitivity Analysis-based calibration and predicts rear-end crashes obtained from surrogate safety assessment models. Three separate simulation models were developed, including Default Model, Macro Model and Micro Model. For the Default Model, no calibration was performed. Sensitivity Analysis (SA) was performed to determine the significant parameters necessary for Macroscopic & Microscopic calibrations. Based on results of SA, two car-following, and two lane-changing parameters of the Macro Models were calibrated using traffic volume and mean speed as Measures of Effectiveness (MOEs). Similarly, parameters of the Micro Models were calibrated using the distributions of lane, headway, speed, and acceleration as MOEs. Time-based (MTTC), deceleration-based (SDI), and severity-based (CSI) surrogate safety indices were calculated to estimate the Rear-End Conflict Index. Figure 1 illustrates the overall workflow of the methodology. Subsequent sections offer detailed explanations of these procedures.
2.1. LiDAR Sensor
LiDAR sensors capture data by emitting laser pulses, and measuring the time it takes for the reflected light to return. This allows them to create a 3D representation of their surroundings as a point cloud. This 3D representation includes accurate information about objects’ shapes, sizes, and positions [13]. In this study, vehicle trajectory data was collected using a VLP-32 Velodyne LiDAR sensor. The VLP-32 LiDAR is a 32-channel sensor. This means it emits 32 laser beams from a compact, spinning housing to create a 3D point cloud of the surrounding environment. With a range of 100 meters (328 feet) and a rotational frequency set to 10 Hz, it captures 10 frames per second (records data every 0.1 second), each containing 600,000 3-D points. The sensor has a full 360-degree horizontal field of view and a vertical field of view of 30 degrees (ranging from 15 degrees upwards to 15 degrees downwards). The VLP-32C LiDAR sensor components and their physical measurements are shown in Figure 2. Additionally, Table 1 lists several other specifications and characteristics of the sensor.
2.2. Field Data Collection
Six urban signalized intersections in Lubbock, Texas in USA were selected in this study. These intersections include the following: (i) 34th street & Indiana Avenue; (ii) 82nd street & Milwaukee Avenue; (iii) 82nd street & Slide Road; (iv) 50th street & Avenue Q; (v) 50th street & Quaker Avenue; and (vi) 4th street & Frankford Avenue. The LiDAR sensor was mounted on a traffic signal pole at the corner of each intersection to record data. One of the study intersections is shown in Figure 3 (a), with the VLP-32 LiDAR sensor mounted on a pole. Data collection for each intersection lasted 2 hours and was conducted during the evening peak commute period (4:00 pm to 6:00 pm) on different weekdays in March 2024.
2.3. Data Processing, Trajectory Extraction and Smoothing
VeloView is a user application which provides real-time visualization of 3D LiDAR data from Velodyne LiDAR sensors. It is used to acquire, visualize, save, and replay sensor data. VeloView can also playback pre-recorded data stored in “pcap” (Packet Capture) files. Figure 3 (b) shows the raw 3-D point clouds obtained from the Lidar sensor, visualized on Veloview graphical user interface.
A generalized four-step algorithm was developed by Zhao et al. (2019) for processing roadside-Lidar sensor data [14]. The four steps include the following: (i) Background Filtering; (ii) Object Clustering; (iii) Object Classification; and (iv) Object Tracking. The first step employs a filtering technique based on point-density to remove both static and dynamic background points from all frames. Step two involves clustering the remaining points into separate unique objects by means of a modified DBSCAN algorithm with varying parameters depending on their proximity to the LiDAR sensor. In step three, an Artificial Neural Network (ANN) model is developed to classify the clustered objects into their respective road user groups, including vehicles, cyclists, and pedestrians. The parameters of the ANN model include distance to the lidar sensor, number of points in the cluster, and direction of cluster points distribution. Lastly, the Global Nearest Neighbor (GNN) is applied to track the same object across multiple data frames. The method proposed by Zhao et al. (2019) [14] was adopted in this study. Figure 3 (c) shows vehicle trajectories extracted from LiDAR sensor. A vehicle trajectory obtained from the sequence of processing algorithms is raw and frequently contains noise, deviations, and inconsistencies at the microscopic level (0.1 second), which can greatly affect the quality of the trajectory data. Therefore, it is necessary to smooth trajectory data to reduce the noise in the data (x and y-error correction). In this study, the low pass Savitzky–Golay filter was used to denoise the trajectory data and accurately represent the vehicle’s intended path of travel. A detailed explanation of the trajectory data smoothing procedure can be found in the previous works of the authors [15]. Figure 3 (d) shows the result of a smoothed trajectory. A sample of the processed trajectory data is presented in Table 1, showing all the variables used in this study.

Table 1.
Sample of processed vehicle trajectories.
| ID | Frame | Latitude | Longitude | X-Coord | Y-Coord | Link | Lane | Speed (m/s) | Acceleration (m/s2) |
|---|---|---|---|---|---|---|---|---|---|
| 16 | 39 | 33.51976 | -101.95735 | 46.342613 | -12.572023 | 3 | 6 | 0.165073 | -0.011634 |
| 16 | 40 | 33.51976 | -101.95735 | 46.339467 | -12.569802 | 3 | 6 | 0.160306 | -0.004767 |
| 16 | 41 | 33.51976 | -101.95735 | 46.349022 | -12.583051 | 3 | 6 | 0.155536 | -0.00477 |
| 16 | 42 | 33.51976 | -101.95735 | 46.370656 | -12.610098 | 3 | 6 | 0.144197 | -0.011339 |
| 16 | 43 | 33.51976 | -101.95735 | 46.388631 | -12.630805 | 3 | 6 | 0.127497 | -0.0167 |
| 16 | 44 | 33.51976 | -101.95735 | 46.397277 | -12.638322 | 3 | 6 | 0.112026 | -0.015471 |
| 16 | 45 | 33.51976 | -101.95735 | 46.399166 | -12.636619 | 3 | 6 | 0.09962 | -0.012406 |
| 16 | 46 | 33.51976 | -101.95735 | 46.395805 | -12.629402 | 3 | 6 | 0.083923 | -0.015697 |
| 16 | 47 | 33.51976 | -101.95735 | 46.392293 | -12.624131 | 3 | 6 | 0.064301 | -0.019622 |
| 16 | 48 | 33.51976 | -101.95735 | 46.390476 | -12.624897 | 3 | 6 | 0.049202 | -0.015099 |
| 16 | 49 | 33.51976 | -101.95735 | 46.389625 | -12.632144 | 3 | 6 | 0.045827 | -0.003376 |
2.4. Vissim Simulation Models
PTV's Verkehr In Städten - SIMulationsmodell (VISSIM) was used to develop the simulation models for this study. VISSIM is based on a psycho-physical car-following model that incorporates perception thresholds to model driver behavior. The basic concept of the car-following model is that drivers are sensitive to the changes in distance and speed of slower moving vehicles in front of them [16]. PTV VISSIM is by far the most used traffic microsimulation software for simulation-based surrogate safety studies [12]. Researchers cited its high flexibility in simulating real-world traffic conditions and the ease of extracting conflict data without resorting to manual observation. Each of the six study intersections were modeled in VISSIM. The geometry includes lanes, link, design speed, designated turn lanes, vehicle storage lengths, and curb turn radii. These data were obtained from Geographic Information System (GIS) files and Google Maps. The processed vehicle trajectory data were used as vehicle input (volume) and static routing decision (relative flow). Signal timing sheets were obtained from the City of Lubbock for all six intersections. The PM peak day plan was used to code the signal control operation in the VISSIM network model of each study intersection [2]. Three separate simulation models were developed for each study intersection, including Default Model, Macro Model and Micro Model. For the Default Model, no calibration was performed (all the default parameters of the Wiedemann 99 model were retained). And the model was simulated for 2 simulation hours to replicate the duration of field data collection.
2.5. Sensitivity Analysis
Sensitivity Analysis (SA) helps identify which model parameters have the most significant influence on the output. This information is crucial for calibration because it allows traffic engineers to focus their efforts on the most impactful parameters, making the calibration process more efficient and effective. Variance-based sensitivity analysis quantifies the importance of both individual factors (first-order effects) and interactions (total effects) in complex models. By analyzing both first-order effects and total effects, we gain a deeper understanding of how each factor contributes to the overall output variability. Consider a model with multiple factors affecting a single output, given in the form shown in equation 1.
First-order effects represent the influence of a single factor () on , independent of other factors. These are relatively easy to analyze using tools like regression. Interactions, on the other hand, capture the combined, non-additive effects of multiple factors and are more challenging to detect. Sobol, 1976 [17] initially introduced the variance decomposition method, offering both analytical derivation and Monte Carlo implementation. The core concept of Sobol decomposition lies in Sobol indices. These indices quantify the contribution of individual variables and their interactions to the variance of the output. There are two main types of Sobol indices: (1) The main effect (first order) index () which measures the individual contribution of a generic factor to the variance of . (2) The total effect index () which captures main effect of plus its interaction effects with other variables. The latest advancements of Sobol 1976, useful for practical application come from Saltelli et al., 2008 [18]. The expression of and are given in equations 2 and 3.
where A, B and are matrices defined in equations 4 - 6:
For .
A multistep approach for complex traffic simulation models Sensitivity Analysis (SA) is proposed by Ciuffo and Azevedo, 2014 [19]. In the first step, parameters are grouped with respect to the sub-models they are part of, and an SA is carried out considering the different groups rather than the different parameters. Then, the most influential groups on the model outputs are identified, and a new SA on all the parameters of these groups is carried out. Based on results of the SA, two car-following and two lane-changing parameters with significant effect on the output variance of both the Macro Model and Micro Model were selected for calibration.
2.6. Calibration of Simulation Models
Researchers have treated calibration of simulation models as optimization problems consisting of a searching algorithm and an objective function. The goal is to determine the optimal set of parameters that minimize the objective function. Genetic Algorithm (GA) is among the most widely used metaheuristic methods by researchers in calibration/validation problems. This is due to its easy implementation and good performance in calibration and optimization. However, Hale et al., (2015) argued that GA frequently requires thousands of trials to locate an acceptable solution, and the traffic simulations cannot process thousands of trial runs in a reasonable time frame [20]. Yu and Fan, 2017 cited several goodness-of-fit formulas previously used by researchers to calibrate simulation models [3]. Hale et al., (2015) compared SPSA and the ‘‘directed brute force” (DBF) method search [20]. The results showed that although SPSA was faster than the DBF method, results of DBF are more reliable. Multiple random seed number replications are executed for each combination of parameter values to obtain more statistically reliable output. The Macro Models were calibrated based on the method proposed by Hale et al., 2015 using traffic volume and mean speed as Measures of Effectiveness (MOEs) [20]. Similarly, the Micro Models were calibrated using the distributions of lane, headway, speed, and acceleration as MOEs. After calibration, each model was simulated for 2 simulation hours to replicate the duration of field data collection.
2.7. Surrogate Safety Measures (SSMs)
Surrogate safety measures (SSMs) have been extensively used to detect near-crash events. SSMs measure the time and space proximity of a vehicle pair to the point of collision or detect their evasive actions to avoid a collision. SSMs serve as a proactive approach to road safety analysis without relying on historic crash data. Recently, there has been significant interest in SSMs due to the causal relationship between near-crash events identified by SSMs and the actual crashes from field observations. Traffic conflicts have been considered an effective surrogate safety measure. Compared to crashes, conflicts are much more frequent and easier to be captured in the real world [21].
The Surrogate Safety Assessment Model (SSAM) is an automated tool that has been widely used by researchers to extract surrogate measures such as Post Encroachment Time (PET), Time to Collision (TTC) and Modified Time to Collision (MTTC) from simulation models [22]. From the initial positions and velocities of the pair of vehicles, SSAM generates 100 paths for each vehicle using combinations of acceleration and orientation that are independently generated from two triangular distribution functions and detects all collision points between every pair of projected paths. In this study, SSAM-3.0 was used to extract rear-end conflict data from the VISSIM-simulated trajectories files.
Bhattarai et al., 2023 presents a methodology based on three surrogate safety indices to detect rear-end conflicts at signalized intersections [13]. The authors combined Time-based (MTTC), deceleration-based (SDI), and severity-based (CSI) surrogate safety indices to estimate the Rear-End Conflict Index (RECI) at the intersection of Los Altos Parkway and Pyramid Way in Reno, Nevada. The Stopping Distance Index (SDI) is a surrogate measure used to capture rear-end conflicts using equation 7 - 9:
where:
= Stopping Distance Index.
= Stopping Distance of leading vehicle.
= Stopping Distance of following vehicle.
= Velocity of leading vehicle.
= Velocity of following vehicle.
= Perception-reaction time.
= Maximum Available Deceleration Rate.
= Headway between the leading vehicle and the following vehicle.
AASHTO’s A Policy on Geometric Design of Highways and Streets [23] recommends Perception-reaction time () of 2.5 seconds. Maximum Available Deceleration Rate () of as recommended by a previous study [24].
Crash severity index (CSI) is quantified by the expression given in equation 10 [25].
where:
= Modified Time to Collision.
= Acceleration of leading vehicle.
= Acceleration of following vehicle.
MTTC values below a predefined threshold are combined with SDI = 1 (unsafe) to estimate the Risk Exposure (RE) index within each temporal window. Similarly, the MTTC values below the threshold are combined with CSI to estimate Risk Severity (RS) index values within the same temporal window. Equation 11 and 12 show their mathematical relationships.
where:
= Risk Exposure.
= Unsafe instances (count of frames with mTTC < 2s and SDI = 1).
= Total count of instances (frames).
where:
= Risk Severity.
= maximum CSI value for the temporal window.
= maximum possible CSI value.
As each pair of vehicles interact at an intersection, the RE and RS indices constantly assess their conflict risk at every temporal window. This combined effect is the Rear-End Conflict Index (RECI), obtained by normalizing the RE and RS indices with min-max scaling using equations 13 – 15.
where:
= Rear-End Conflict Index.
= Normalized RE.
= Normalized RS.
= Current window.
= Total count of windows.
3. Results
3.1. Field Data & Simulation Results
Field data was collected at each of the six study intersections in Lubbock, Texas USA: (i) 34th street & Indiana Avenue, (ii) 82nd street & Milwaukee Avenue, (iii) 82nd street & Slide Road, (iv) 50th street & Avenue Q, (v) 50th street & Quaker Avenue, and (vi) 4th street & Frankford Avenue. The study period covers the evening peak commute period (4:00 pm to 6:00 pm) on 6 different weekdays in March 2024. The experimental study evaluates the accuracy of traffic volume simulations at various intersections using three different models: Default Model, Macro Model, and Micro Model. Observed volumes (veh/h) are compared with simulated volumes, and the accuracy percentage is calculated for each model. Table 2 and Figure 4 present the results of the observed versus VISSIM simulated traffic volumes.
- Default Model: The Default Model shows varying accuracy, with the highest accuracy of 99.7% at the 82nd Street & Slide Road intersection and the lowest accuracy of 91.6% at the 4th Street & Frankford Avenue intersection.
- Macro Model: The Macro Model consistently provides high accuracy, ranging from 99.3% to 99.9%, demonstrating its reliability across different intersections.
- Micro Model: The Micro Model also demonstrates high accuracy, with the lowest accuracy being 99.5% at the 50th Street & Quaker Avenue intersection and the highest accuracy of 99.9% at multiple intersections.
Similarly, the study evaluates the accuracy of mean speed simulations at various intersections using Default Model, Macro Model, and Micro Model. Observed mean speeds (mi/h) are compared with simulated speeds, and the accuracy percentage is calculated for each model. Results of observed mean speed and simulated mean speeds are presented in Table 3 and Figure 5 respectively.
- Default Model: The Default Model shows moderate accuracy, with the highest accuracy of 88.5% at the 50th Street & Quaker Avenue intersection and the lowest accuracy of 69.2% at the 34th Street & Indiana Avenue intersection.
- Macro Model: The Macro Model improves accuracy over the Default Model, ranging from 75.4% to 92.3%, indicating better performance across different intersections.
- Micro Model: The Micro Model demonstrates the highest accuracy among the models, with the lowest accuracy being 80.8% at the 50th Street & Avenue Q intersection and the highest accuracy of 97.4% at the 82nd Street & Slide Road intersection.
The Default Model shows less consistent accuracy compared to the Macro and Micro Models, indicating room for improvement. The Micro Model consistently provides the highest accuracy of simulated volume and mean speed, making it the most reliable.
3.2. Sensitivity Analysis and Model Calibration Results
The results of Sensitivity Analysis (SA) include the main effect (), which measures the individual contribution of each parameter to the output variance and the total effect (), which captures the main effect plus its interaction with other parameters. () and () were calculated using equations 2 & 3 respectively. A Multistep SA was performed to select parameters of the Wiedemann 99 model with significant effect on the output variance. Based on the results across the six study intersections, the following car-following and lane-change parameters were selected: Standstill Distance (CC0), Gap Time Distribution (CC1), Safety Distance Reduction Factor (SDRF) and Accepted Deceleration (ADT).
The model calibration was treated as optimization problems consisting of a search algorithm and an objective function. The objective function was to minimize the difference between field observed measures and calibrated measures. This can be achieved by identifying the best combination of coefficients of the parameters selected from the sensitivity analysis step. Default values of the VISSIM model were then replaced with the identified coefficients to produce a simulation of the real-world scenario. For the Macro Model, the objective function was to minimize the combined difference between field observed volume/mean speed and simulated volume/mean speed. While the objective function of the Micro Model was to minimize the combined difference in distributions of lane, headway, speed and acceleration between the field observed and simulated model. The calibrated parameters for Macro and Micro Models across all six study intersections are shown in Table 4 and Table 5 respectively.
3.3. Conflicts Extraction
The Surrogate Safety Assessment Model (SSAM) was used to directly extract simulated conflict data from trajectories (.trj) files generated from PTV VISSIM. Generally, SSAM conflicts are classified into only three types: crossing, rear-end and lane change. This study focusses on rear-end crashes at signalized intersections. Therefore, rear-end conflicts were selected for further analysis. Rear-end conflict pairs extracted from each study intersection are presented in Table 6.
3.4. Surrogate Safety Measures
For all rear-end conflict pairs extracted from SSAM, the corresponding MTTC value was used to calculate SDI and CSI. Risk Exposure (RE) index and Risk Severity (RS) index were calculated using equations 11 & 12 for every 1 second temporal window. Only the surrogate safety measures from Micro Models are provided in this paper because they performed much better than the other two models. This is consistent with previous studies [26]. Figure 6 shows the distribution of normalized RS and RE indices obtained using equations 14 & 15 respectively.
Normalized RE and RS indices are shown in the central plot area, while frequency distributions of the observations are shown in the marginal plots. The frequency distribution of the normalized RE index shows heavy volume at the range between 0 and 0.6, with the tail capturing the higher exposure indices above 0.8 to 1. However, the distribution of the normalized RS index shows heavy volume at the lowest range between 0 and 0.45, with the tail capturing the higher severity indices above 0.5 to 1. The 15th percentile from the top of the distributions normalized RE and normalized RS were used to evaluate the Rear-End Conflict Index (RECI) from equation 13.
3.5. Rear-End Crash Prediction
Crash records of the past ten years (2014–2023) were collected from the Crash Records Information System (CRIS). CRIS is a crash database of the Texas Department of Transportation (TxDOT). The annual crash frequencies were extracted from all six intersections at a radius of 328 feet, matching the detection range of the LiDAR sensor. The crash data were filtered based on vehicle travel directions to extract the rear-end crashes. The result was further streamlined based on Hour of Day to obtain only the crashes corresponding to the data collection period (4:00 PM to 6:00 PM). A negative binomial (NB) model was developed to estimate the expected number of crashes based on Rear-End Conflict at hourly time-intervals. The NB model has been used in previous crash-prediction studies because it accounts for the over-dispersion in crash data resulting from unobserved heterogeneity [27]. Negative Binomial models were developed with Rear-End Conflicts identified at 95th percentile values of the RECI index. The ten years historic crash and the Rear-End Conflicts were fitted into a Negative Binomial regression model to analyze the relationship between identified conflicts and crash frequency. Table 7 presents the results of Negative Binomial models across the six study intersections.
Rear-End Conflict Count Coefficient represents the effect of rear-end conflicts on the outcome. Positive coefficients indicate an increase in rear-end conflicts results in an increase in crash frequency. Pseudo R-squared (Cox & Snell) measures the proportion of variation in the dependent variable explained by the model. Higher values indicate better model fit. P-value assesses the significance of the rear-end conflict count coefficient. P-values below 0.05 indicate statistically significant effects. A lower AIC indicates a better model fit, considering the number of predictors.
For intersections 34th/Indiana, 82nd/Milwaukee, 50th/Ave Q, 50th/Quaker, and 4th/Frankford, the rear-end conflict count is a statistically significant predictor (p-value < 0.05). For 82nd/Slide, the p-value is 0.05, indicating marginal significance. The model explains a significant proportion of the variance in the dependent variable for all intersections, with Pseudo R-squared values ranging from 0.2142 to 0.6515. The best model fit is for 34th/Indiana (Pseudo R-squared = 0.6515). The impact of rear-end conflicts varies by location. The coefficient is highest for 50th/Quaker (1.5677), indicating a strong effect, and lowest for 82nd/Slide (0.0165). Based on AIC values, the model for 4th/Frankford has the best fit (AIC = 16.669), suggesting it balances model complexity and goodness-of-fit most effectively.
4. Discussion
Results of the distribution of RE indices indicate that there are a lot of instances with high-risk exposure (up to 0.6) across the six study intersections. But the corresponding RS indices show heavy volume at the lowest range between 0 and 0.45. This explains the scenarios at intersection approaches where exposure is high due to vehicles decelerating or stopping in response to traffic signal, but the risk of such conflict is very low due to reduced or zero speed. Therefore, extreme values of RE and RS were selected to capture instances that represent dangerous driving behaviors. The top 15th percentile values of RE and RS were selected to estimate the Rear-End Conflict Index (RECI) at each 1 second temporal window. Negative Binomial models were developed with Rear-End Conflicts identified at 95th percentile values of the RECI index. The ten years historic crash and the Rear-End Conflicts were fitted into a Negative Binomial regression model to analyze the relationship between identified conflicts and crash frequency.
4.1. 34th Street & Indiana Avenue
The positive coefficient for Rear-End Conflict Count (0.2214) suggests that an increase in Rear-End Conflict Count is associated with an increase in the expected Crash Count. Specifically, for each unit increase in Rear-End Conflict Count, the log of the expected Crash Count increases by 0.2214. The intercept value of -2.2513 indicates the log of the expected Crash Count when Rear-End Conflict Count is zero. The model's pseudo R-squared value of 0.6515 indicates that the model explains approximately 65.15% of the variance in Crash Count. The Rear-End Conflict Count is a highly significant predictor of Crash Count (P-value < 0.001). The AIC value of 28.4242 provides a measure of the model's goodness of fit.
4.2. 82nd Street & Milwaukee Avenue
The coefficient for Rear-End Conflict Count (0.0423) is positive. For each unit increase in Rear-End Conflict Count, the log of the expected Crash Count increases by 0.0423. The intercept value is -2.2524. The model's pseudo R-squared value of 0.5496 indicates that the model explains approximately 54.96% of the variance in Crash Count. The Rear-End Conflict Count is a highly significant predictor of Crash Count (P-value < 0.001).
4.3. 82nd Street & Slide Road
Rear-End Conflict Count (0.0165) suggests a positive relationship with Crash Count, but its statistical significance is marginal (P-value = 0.053). The intercept value is -1.0561. The model's pseudo R-squared value of 0.2142 indicates a relatively weak fit compared to the previous models, suggesting that the model explains only about 21.42% of the variance in Crash Count. While Rear-End Conflict Count shows a positive relationship with Crash Count, its significance level is borderline (P-value = 0.053).
4.4. 50th Street & Avenue Q
The coefficient for Rear-End Conflict Count is (0.6979). The intercept value is -1.7797. The model's pseudo R-squared value of 0.3768 suggests that the model explains approximately 37.68% of the variance in Crash Count. The Rear-End Conflict Count is a highly significant predictor of Crash Count (P-value < 0.001).
4.5. 50th street & Quaker Avenue
Rear-End Conflict Count (1.5677) suggests that an increase in Rear-End Conflict Count is associated with a substantial increase in the expected Crash Count. The intercept value is -0.8329. The model's pseudo R-squared value of 0.3540 suggests that the model explains approximately 35.40% of the variance in Crash Count. The Conflict Count is a statistically significant predictor of Crash Count (P-value = 0.018).
4.6. 4th Street & Frankford Avenue
The coefficient for Rear-End Conflict Count is (0.4993) with an intercept value of -4.7538. The model's pseudo R-squared value of 0.5834 indicates a strong fit, suggesting that the model explains approximately 58.34% of the variance in Crash Count. The Rear-End Conflict Count is a statistically significant predictor of Crash Count (P-value = 0.004).
5. Conclusions
This study implements a framework for integrating vehicle trajectory data obtained from LiDAR sensor to VISSIM models, and surrogate safety assessment models to predict rear-end crashes at urban signalized intersections under heterogenous traffic condition. Three separate simulation models were developed, including Default Model, Macro Model and Micro Model. For the Default Model, no calibration was performed. Sensitivity Analysis (SA) was performed to determine the significant parameters necessary for Macro & Micro calibration. Based on results of SA, two car-following, and two lane-changing parameters of the Macro Models were calibrated using traffic volume and mean speed as Measures of Effectiveness (MOEs). Similarly, parameters of the Micro Models were calibrated using the distributions of lane, headway, speed, and acceleration as MOEs. Time-based (MTTC), deceleration-based (SDI), and severity-based (CSI) surrogate safety indices were calculated to estimate the Rear-End Conflict Index. Negative Binomial models were developed with Rear-End Conflicts identified at 95th percentile values of the RECI index. The ten years historic crash and the Rear-End Conflicts were fitted into a Negative Binomial regression model to analyze the relationship between identified conflicts and crash frequency. The positive coefficient for Rear-End Conflict Count across all six study intersections suggests that an increase in Rear-End Conflict Count is associated with an increase in the expected Crash Count. The Rear-End Conflict Count is a highly significant predictor of Crash Count (P-value < 0.05). The AIC values provide a measure of the model's goodness of fit.
Author Contributions
Conceptualization, Morris Igene; Data curation, Morris Igene, Qiyang Luo, Keshav Jimee, Mohammad Soltanirad and Tamer Bataineh; Formal analysis, Morris Igene and Keshav Jimee; Methodology, Morris Igene; Resources, Hongchao Liu; Software, Morris Igene, Qiyang Luo and Keshav Jimee; Supervision, Hongchao Liu; Validation, Morris Igene, Keshav Jimee, Mohammad Soltanirad and Tamer Bataineh; Visualization, Morris Igene; Writing – original draft, Morris Igene, Keshav Jimee and Mohammad Soltanirad; Writing – review & editing, Morris Igene, Keshav Jimee, Mohammad Soltanirad, Tamer Bataineh and Hongchao Liu.
Funding
This research received no external funding.
Institutional Review Board Statement
Not applicable.
Informed Consent Statement
Not applicable.
Data Availability Statement
Data will be made available on request.
Conflicts of Interest
The authors declare no conflicts of interest.
References
- Hale, D.K.; Ghiasi, A.; Khalighi, F.; Zhao, D.; Li, X. (Shaw); James, R.M. Vehicle Trajectory-Based Calibration Procedure for Microsimulation. Transportation Research Record 2023, 2677, 1764–1781. [Google Scholar] [CrossRef]
- Wunderlich, K.E.; Vasudevan, M.; Wang, P.; United States. Federal Highway Administration. Office of Operations TAT Volume III: Guidelines for Applying Traffic Microsimulation Modeling Software 2019 Update to the 2004 Version; 2019;
- Yu, M.; Fan, W. Calibration of Microscopic Traffic Simulation Models Using Metaheuristic Algorithms. International Journal of Transportation Science and Technology 2017, 6. [Google Scholar] [CrossRef]
- Talebpour, A.; Mahmassani, H.S.; Hamdar, S.H. Modeling Lane-Changing Behavior in a Connected Environment: A Game Theory Approach. Transportation Research Part C: Emerging Technologies 2015, 59, 216–232. [Google Scholar] [CrossRef]
- Dimitriou, L.; Stylianou, K.; Abdel-Aty, M.A. Assessing Rear-End Crash Potential in Urban Locations Based on Vehicle-by-Vehicle Interactions, Geometric Characteristics and Operational Conditions. Accid Anal Prev 2018, 118, 221–235. [Google Scholar] [CrossRef] [PubMed]
- Goehring, D.; Wang, M.; Schnurmacher, M.; Ganjineh, T. Radar/Lidar Sensor Fusion for Car-Following on Highways.; December 1 2011; pp. 407–412.
- Wu, J.; Xu, H.; Zheng, J. Automatic Background Filtering and Lane Identification with Roadside LiDAR Data. 2017 IEEE 20th International Conference on Intelligent Transportation Systems (ITSC) 2017, 1–6. [Google Scholar] [CrossRef]
- Mukhtar, A.; Xia, L.; Tang, T.B. Vehicle Detection Techniques for Collision Avoidance Systems: A Review. IEEE Transactions on Intelligent Transportation Systems 2015, 16, 1–21. [Google Scholar] [CrossRef]
- Sun, Y.; Xu, H.; Wu, J.; Zheng, J.; Dietrich, K. 3-D Data Processing to Extract Vehicle Trajectories from Roadside LiDAR Data. Transportation Research Record: Journal of the Transportation Research Board 2018, 2672, 036119811877583. [Google Scholar] [CrossRef]
- Wu, J.; Xu, H.; Zheng, J.; Zhao, J. Automatic Vehicle Detection With Roadside LiDAR Data Under Rainy and Snowy Conditions. IEEE Intelligent Transportation Systems Magazine 2020, PP, 1–1. [Google Scholar] [CrossRef]
- Zhang, J.; Xiao, W.; Coifman, B.; Mills, J. Vehicle Tracking and Speed Estimation From Roadside Lidar. IEEE Journal of Selected Topics in Applied Earth Observations and Remote Sensing 2020. [Google Scholar] [CrossRef]
- Huang, F.; Liu, P.; Yu, H.; Wang, W. Identifying If VISSIM Simulation Model and SSAM Provide Reasonable Estimates for Field Measured Traffic Conflicts at Signalized Intersections. Accid Anal Prev 2013, 50, 1014–1024. [Google Scholar] [CrossRef] [PubMed]
- Bhattarai, N. Proactive Safety Analysis Using Roadside LiDAR Based Vehicle Trajectory Data. 2023.
- Zhao, J.; Xu, H.; Liu, H.; Wu, J.; Zheng, Y.; Wu, D. Detection and Tracking of Pedestrians and Vehicles Using Roadside LiDAR Sensors. Transportation Research Part C: Emerging Technologies 2019, 100, 68–87. [Google Scholar] [CrossRef]
- Venthuruthiyil, S.P.; Chunchu, M. Vehicle Path Reconstruction Using Recursively Ensembled Low-Pass Filter (RELP) and Adaptive Tri-Cubic Kernel Smoother. Transportation Research Part C: Emerging Technologies 2020, 120, 102847. [Google Scholar] [CrossRef]
- Brackstone, M.; McDonald, M. Car-Following: A Historical Review. Transportation Research Part F: Traffic Psychology and Behaviour 1999, 2, 181. [Google Scholar] [CrossRef]
- Sobol, I.M. Uniformly Distributed Sequences with an Additional Uniform Property. USSR Computational Mathematics and Mathematical Physics 1976, 16, 236–242. [Google Scholar] [CrossRef]
- Saltelli, A.; Ratto, M.; Andres, T.; Campolongo, F.; Cariboni, J.; Gatelli, D.; Saisana, M.; Tarantola, S. Global Sensitivity Analysis. The Primer; 2008; Vol. 304; ISBN 978-0-470-05997-5.
- Ciuffo, B.; Lima Azevedo, C. A Sensitivity-Analysis-Based Approach for the Calibration of Traffic Simulation Models. Intelligent Transportation Systems, IEEE Transactions on 2014, 15, 1298–1309. [Google Scholar] [CrossRef]
- Hale, D.K.; Antoniou, C.; Brackstone, M.; Michalaka, D.; Moreno, A.T.; Parikh, K. Optimization-Based Assisted Calibration of Traffic Simulation Models. Transportation Research Part C: Emerging Technologies 2015, 55, 100–115. [Google Scholar] [CrossRef]
- Tarko, A.; Davis, G.; Saunier, N.; Sayed, T. Surrogate Measures of Safety. 2009.
- Gettman, D.; Pu, L.; Sayed, T.; Shelby, S.G. Surrogate Safety Assessment Model and Validation: Final Report; 2008.
- AASHTO. A Policy on Geometric Design of Highways and Streets; 2018 7th edition.; American Association of State Highway and Transportation Officials: Washington, DC, 2018. ISBN 978-1-56051-676-7.
- Laureshyn, A.; De Ceunynck, T.; Karlsson, C.; Svensson, Å.; Daniels, S. In Search of the Severity Dimension of Traffic Events: Extended Delta-V as a Traffic Conflict Indicator. Accident Analysis & Prevention 2017, 98, 46–56. [Google Scholar] [CrossRef]
- Ozbay, K.; Yang, H.; Bartin, B.; Mudigonda, S. Derivation and Validation of New Simulation-Based Surrogate Safety Measure. Transportation Research Record 2008, 2083, 105–113. [Google Scholar] [CrossRef]
- Wang, C.; Xu, C.; Xia, J.; Qian, Z.; Lu, L. A Combined Use of Microscopic Traffic Simulation and Extreme Value Methods for Traffic Safety Evaluation. Transportation Research Part C Emerging Technologies 2018, 90, 281–291. [Google Scholar] [CrossRef]
- Dong, C.; Clarke, D.B.; Yan, X.; Khattak, A.; Huang, B. Multivariate Random-Parameters Zero-Inflated Negative Binomial Regression Model: An Application to Estimate Crash Frequencies at Intersections. Accid Anal Prev 2014, 70, 320–329. [Google Scholar] [CrossRef] [PubMed]
Figure 1.
Workflow of the methodology.
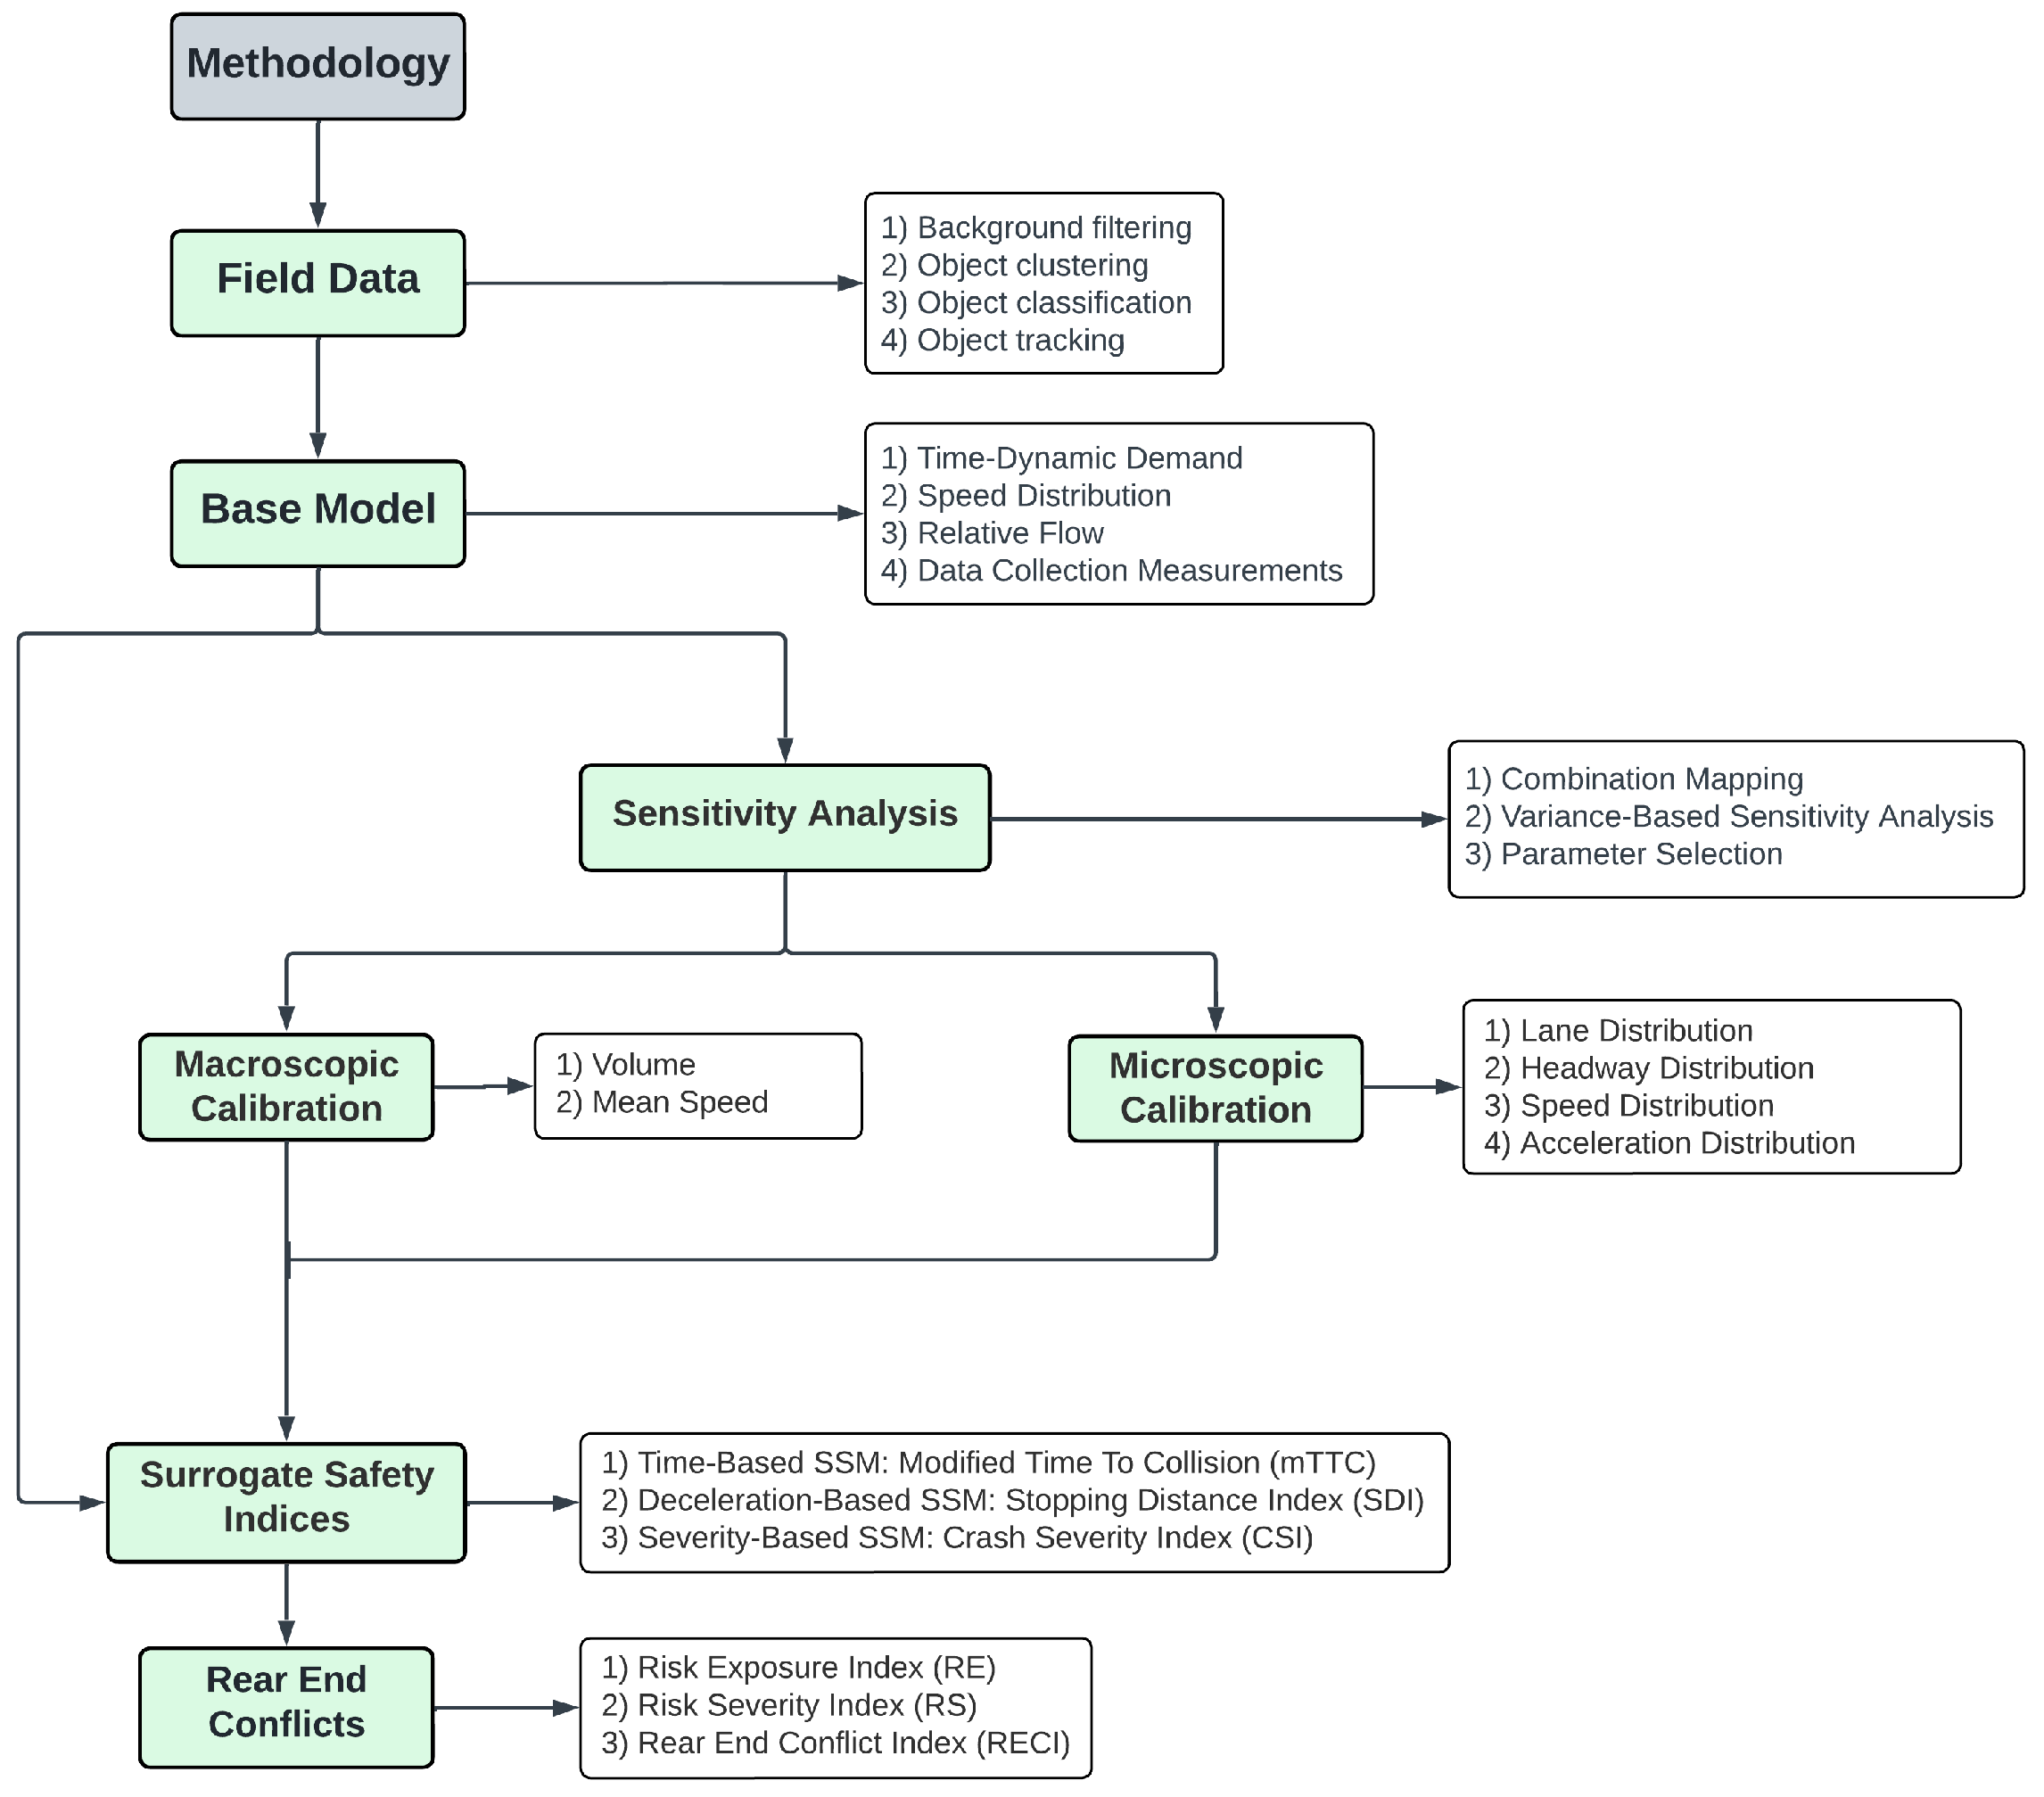
Figure 2.
Parts and dimensions of a Velodyne VLP-32C LiDAR sensor.
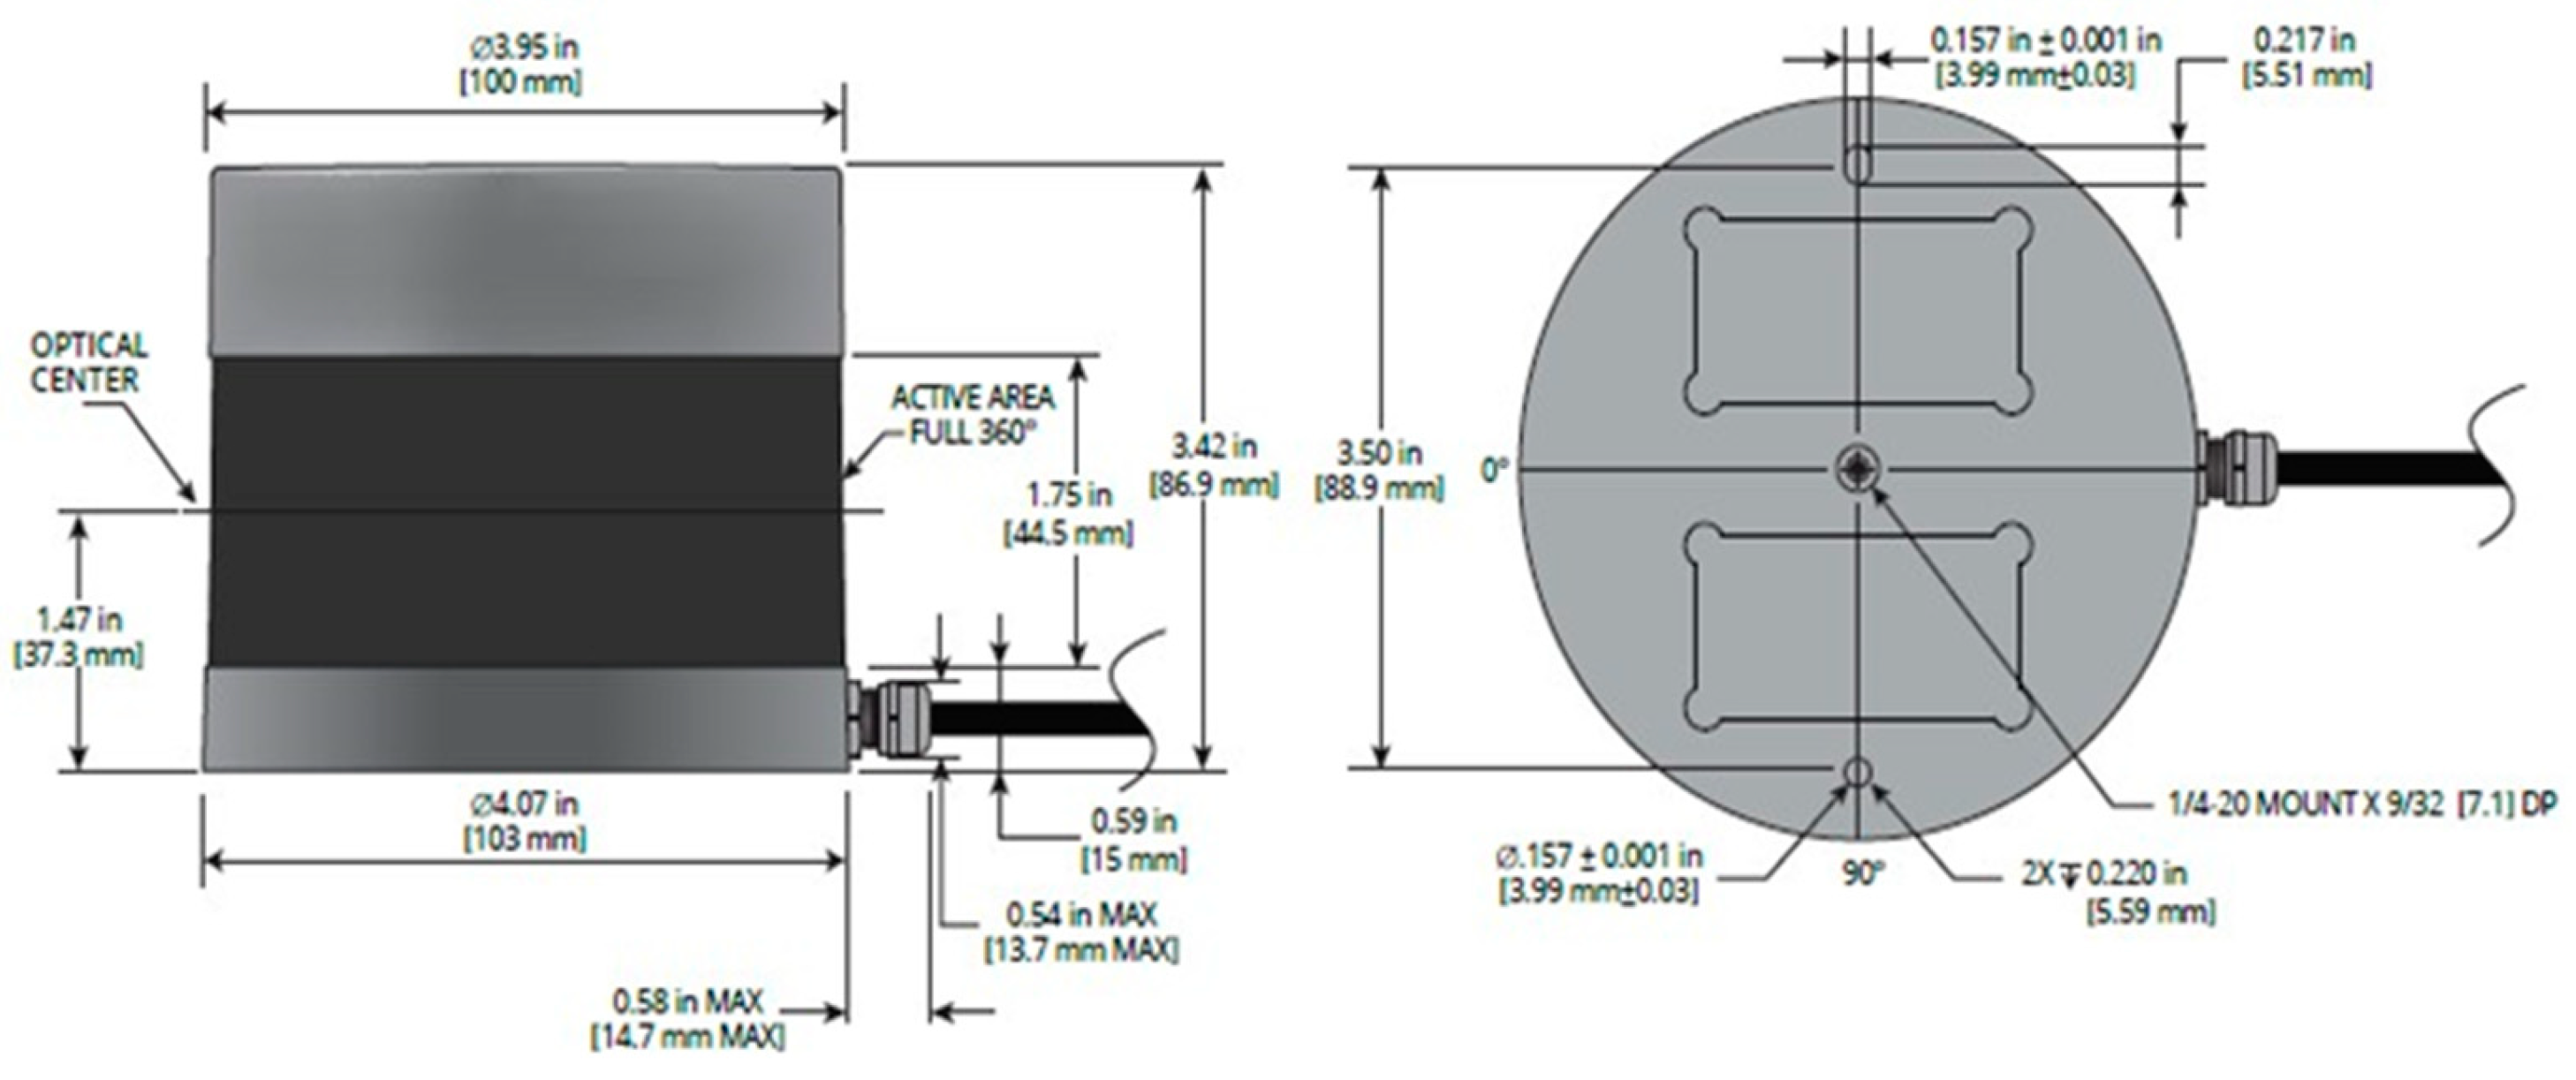
Figure 3.
(a) A VLP-32 LiDAR sensor mounted on a traffic signal pole. (b) Raw 3-D Lidar sensor data visualized using Veloview. (c) Vehicle trajectories extracted from LiDAR sensor data. (d) A smoothed trajectory after removing noise.
Figure 3.
(a) A VLP-32 LiDAR sensor mounted on a traffic signal pole. (b) Raw 3-D Lidar sensor data visualized using Veloview. (c) Vehicle trajectories extracted from LiDAR sensor data. (d) A smoothed trajectory after removing noise.

Figure 4.
Observed versus simulated volumes.
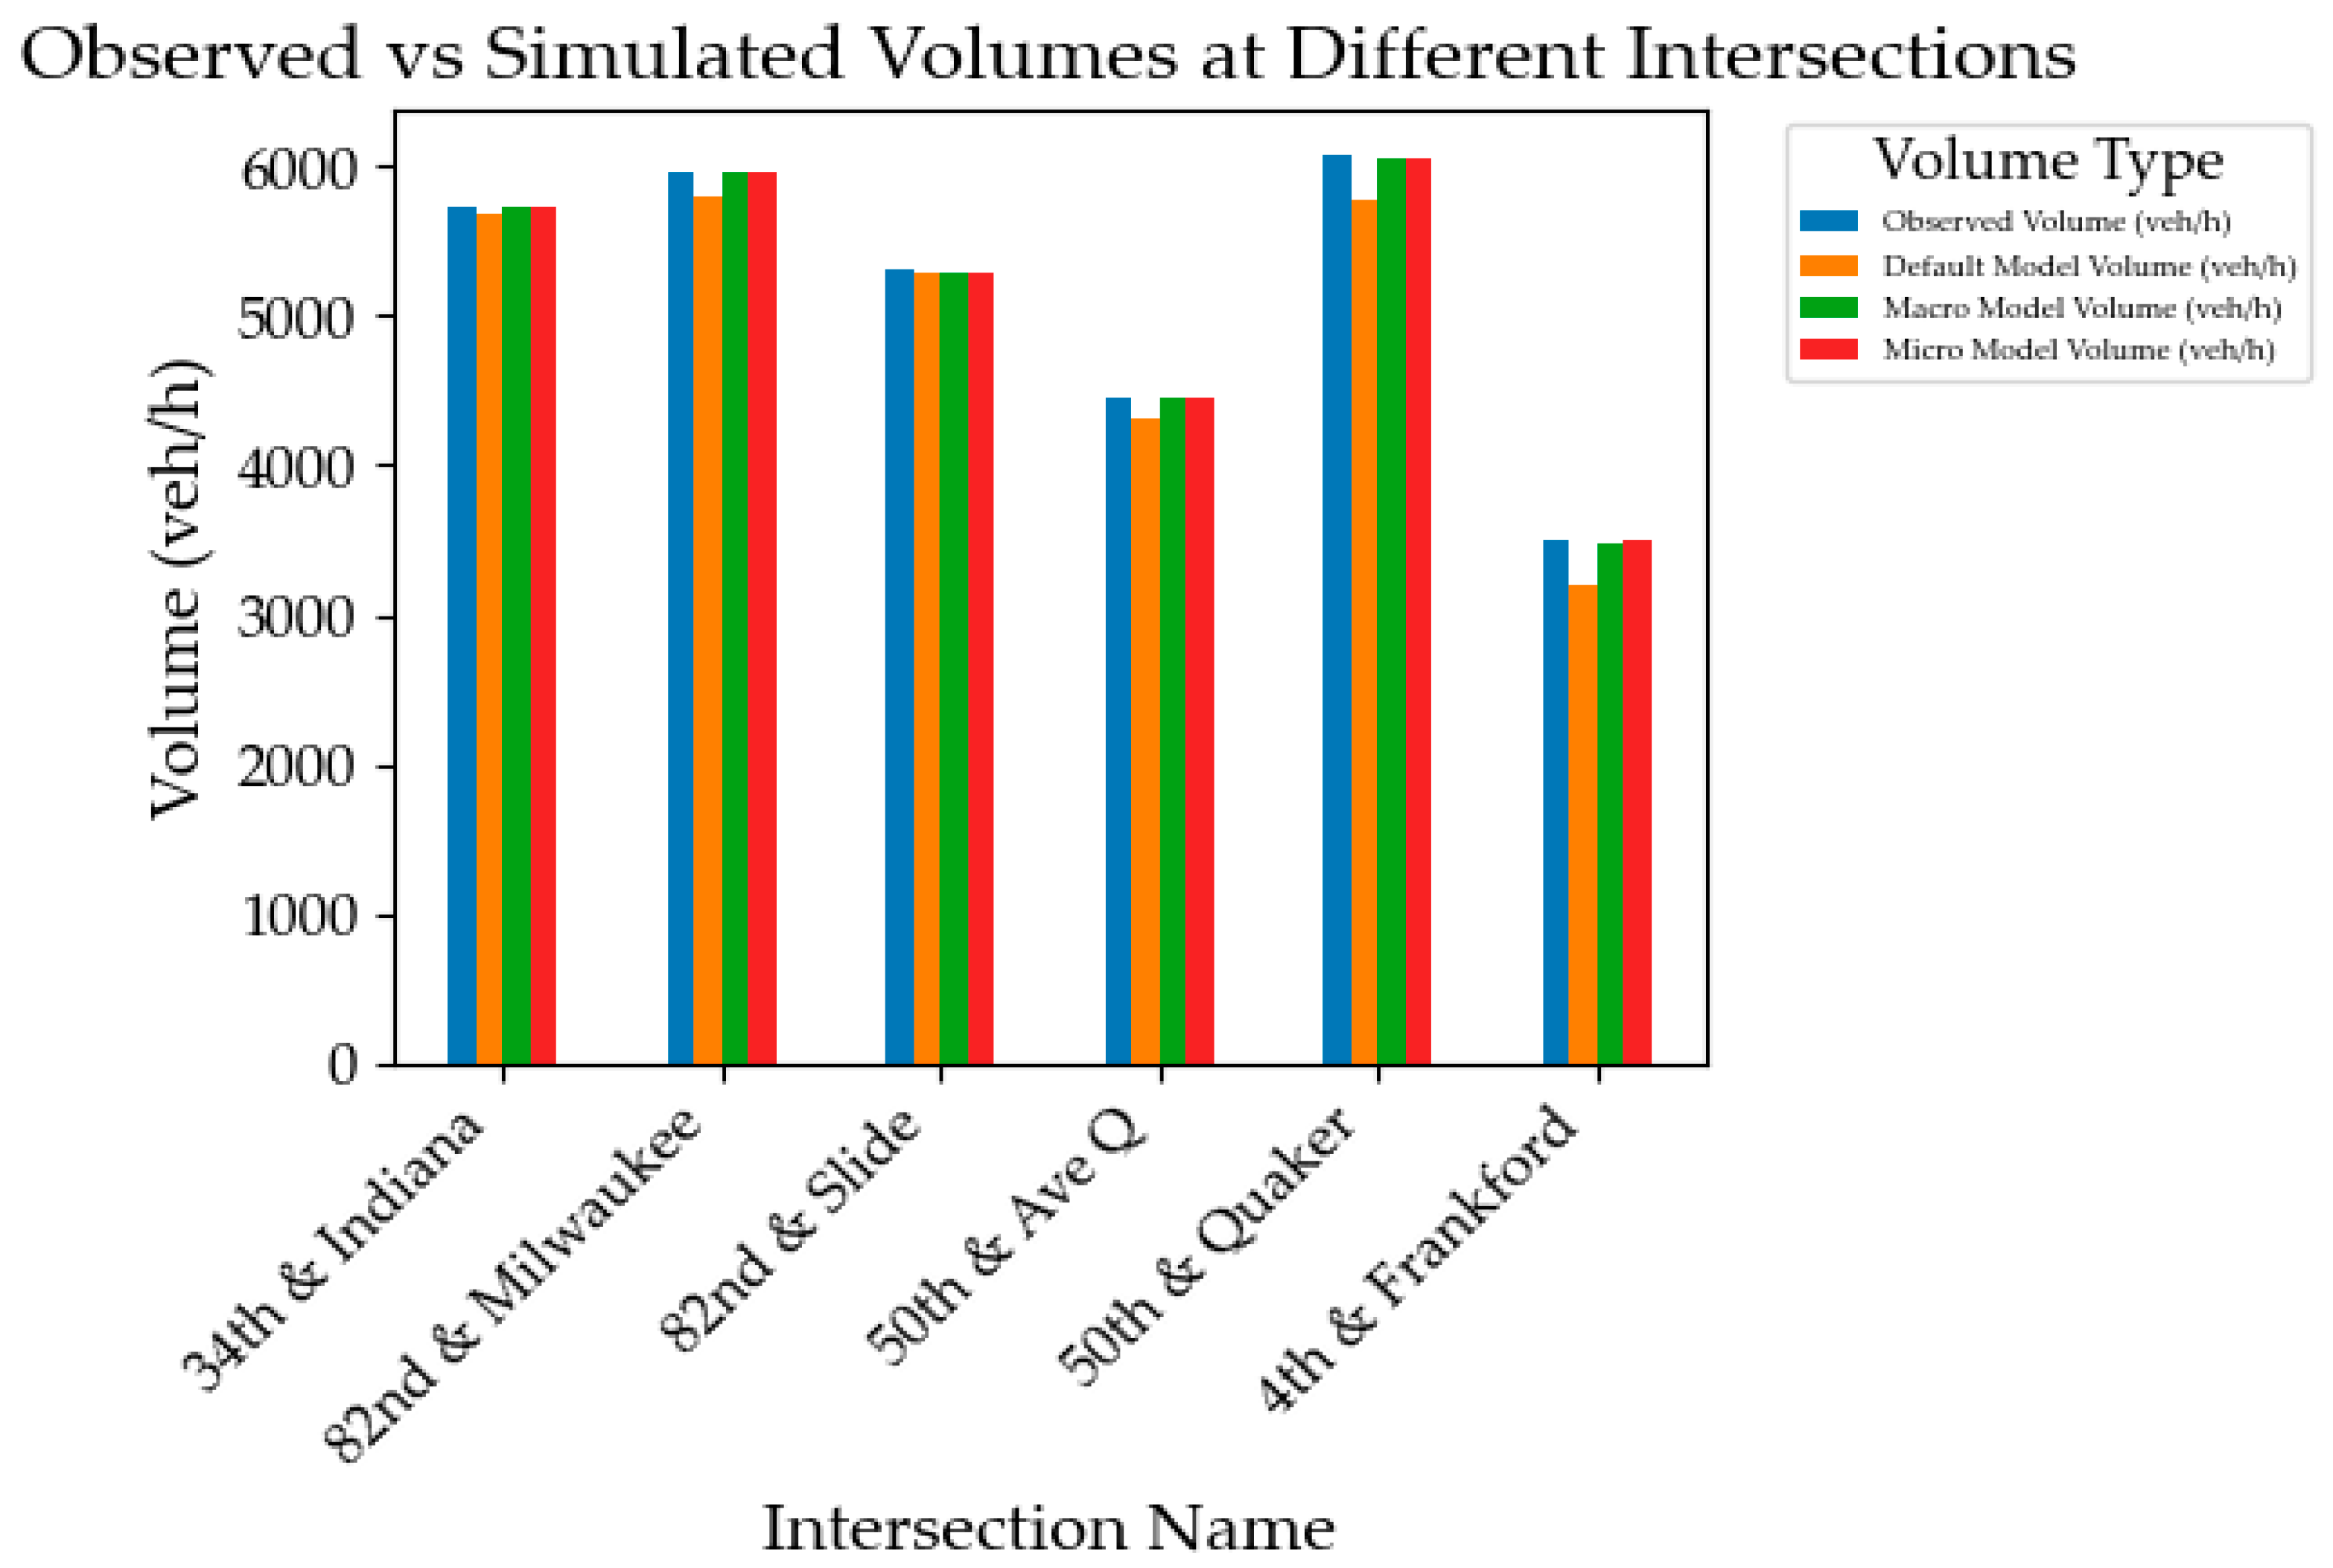
Figure 5.
Observed versus simulated mean speeds.
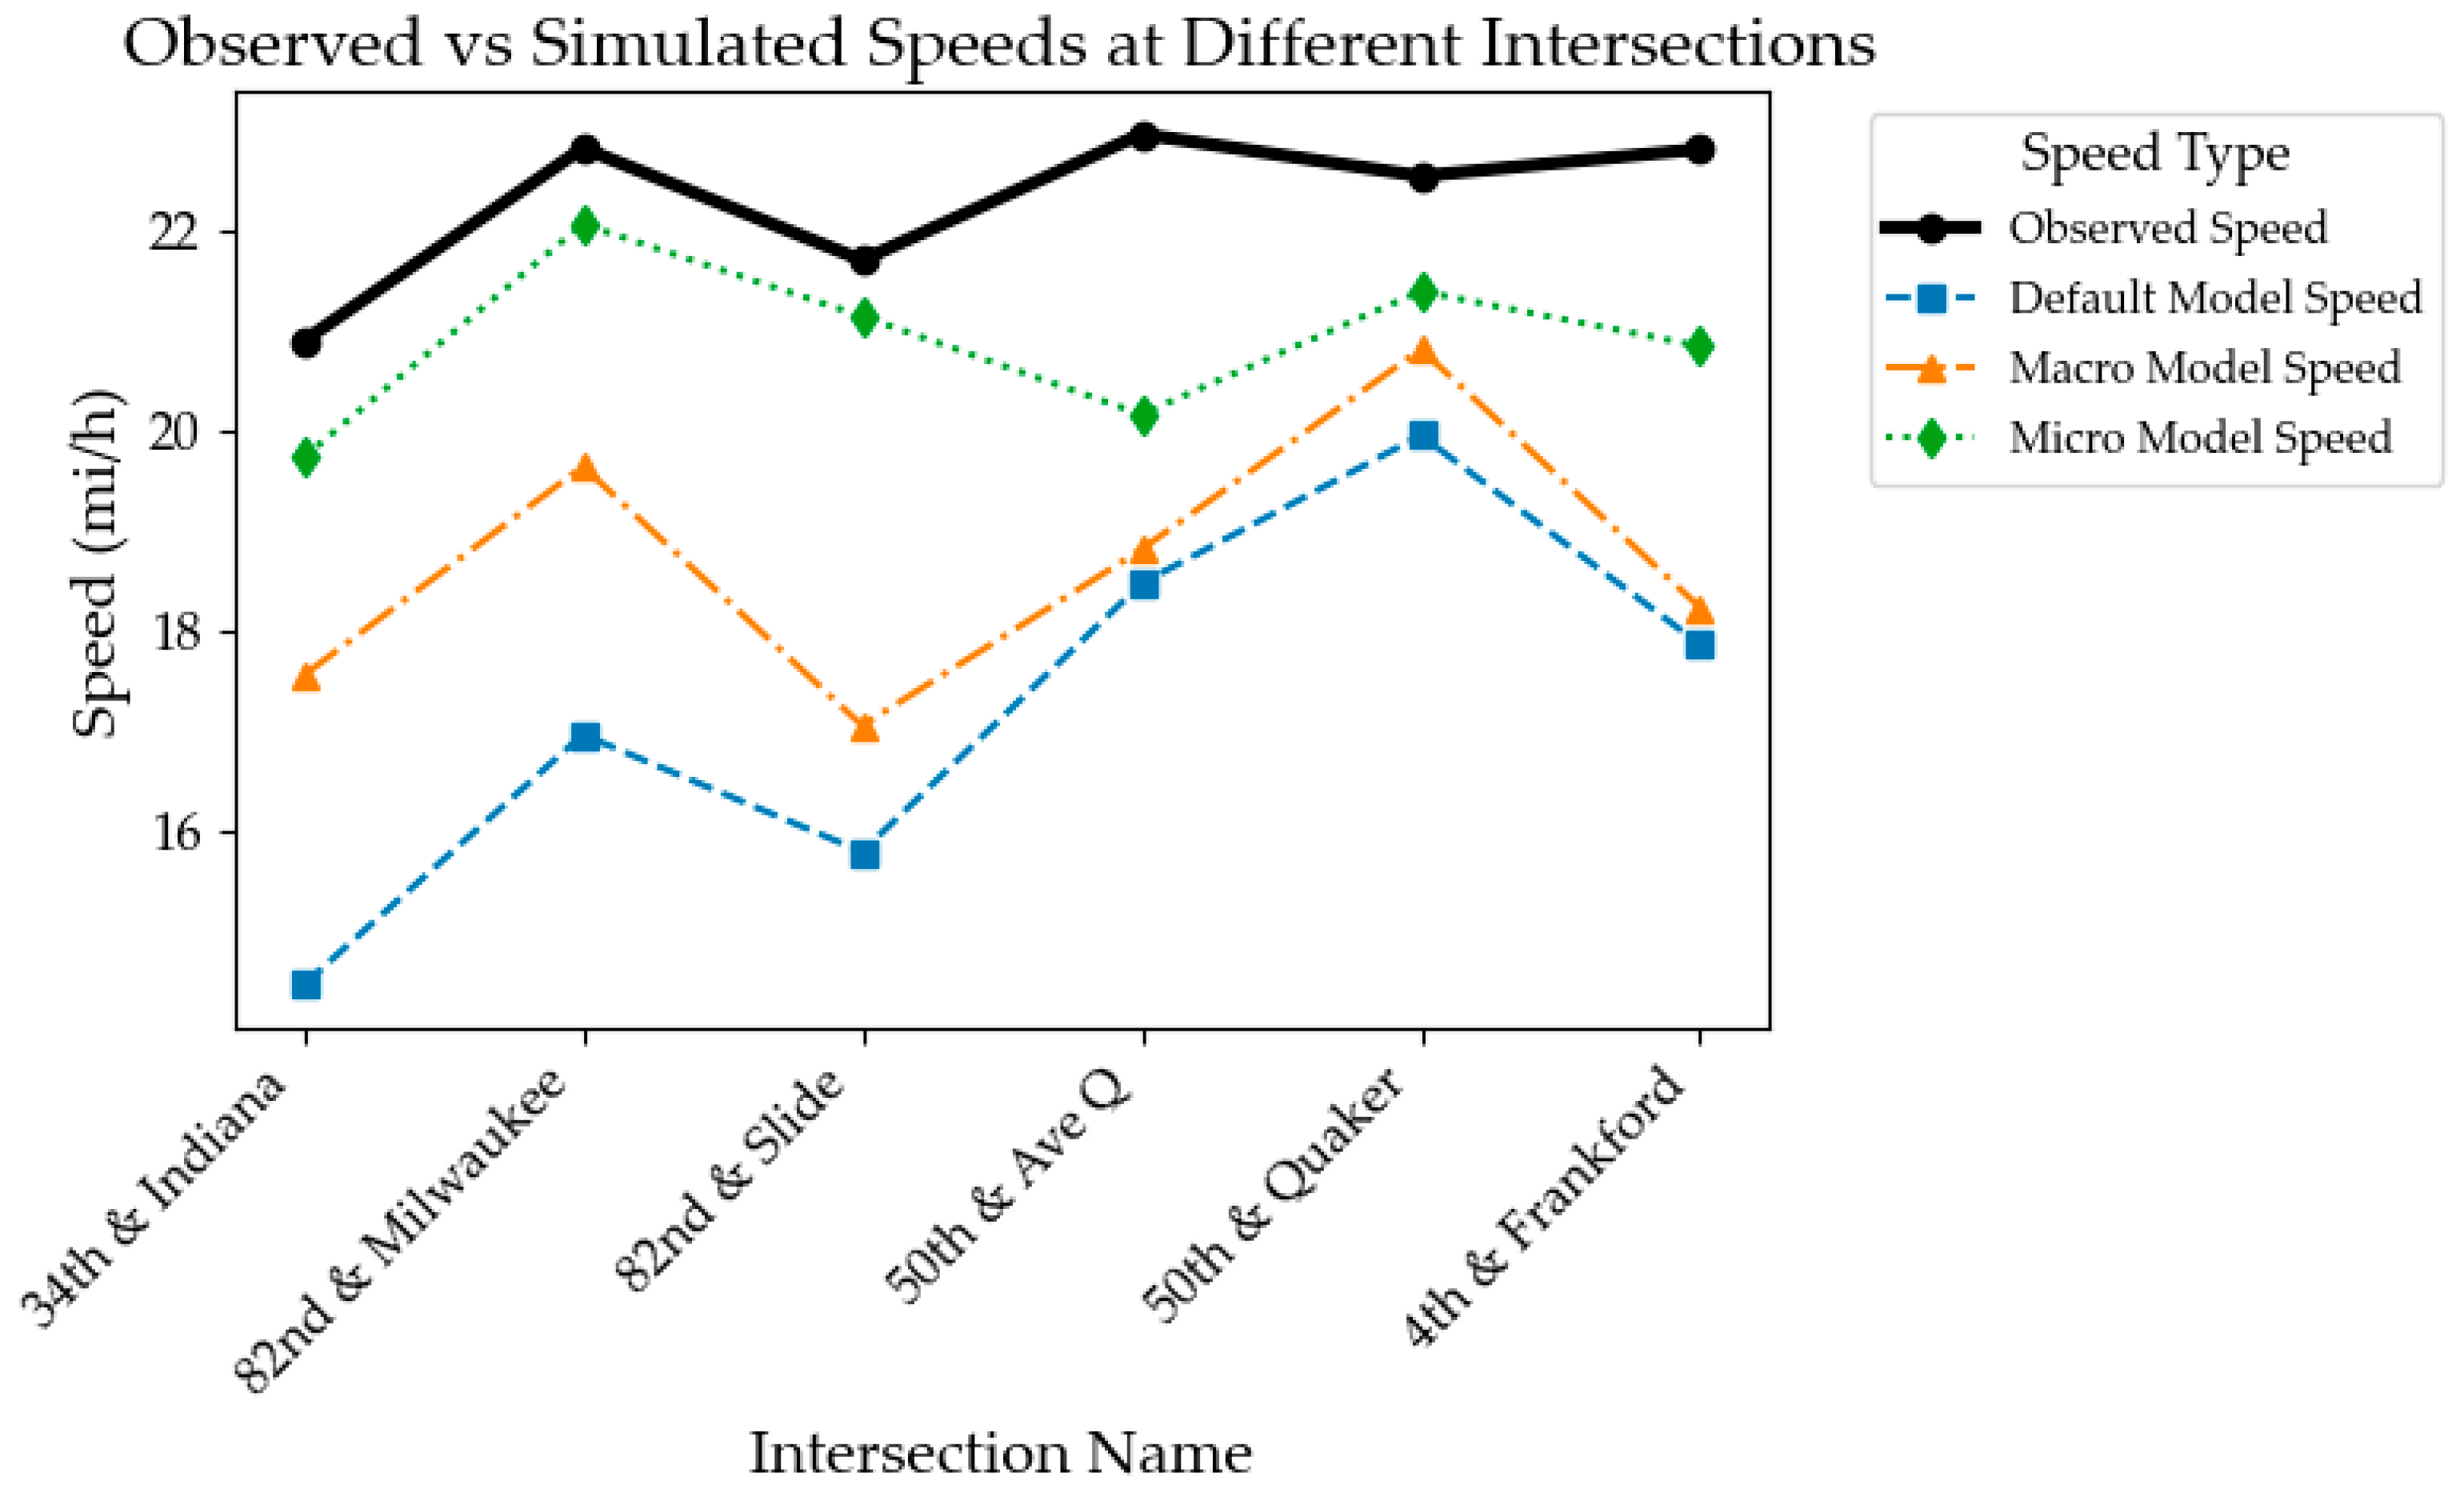
Figure 6.
(a) 34th/Indiana (b) 82nd/Milwaukee (c) 82nd/Slide (d) 50th/Avenue Q (e) 50th/Quaker (f) 4th/Frankford.
Figure 6.
(a) 34th/Indiana (b) 82nd/Milwaukee (c) 82nd/Slide (d) 50th/Avenue Q (e) 50th/Quaker (f) 4th/Frankford.

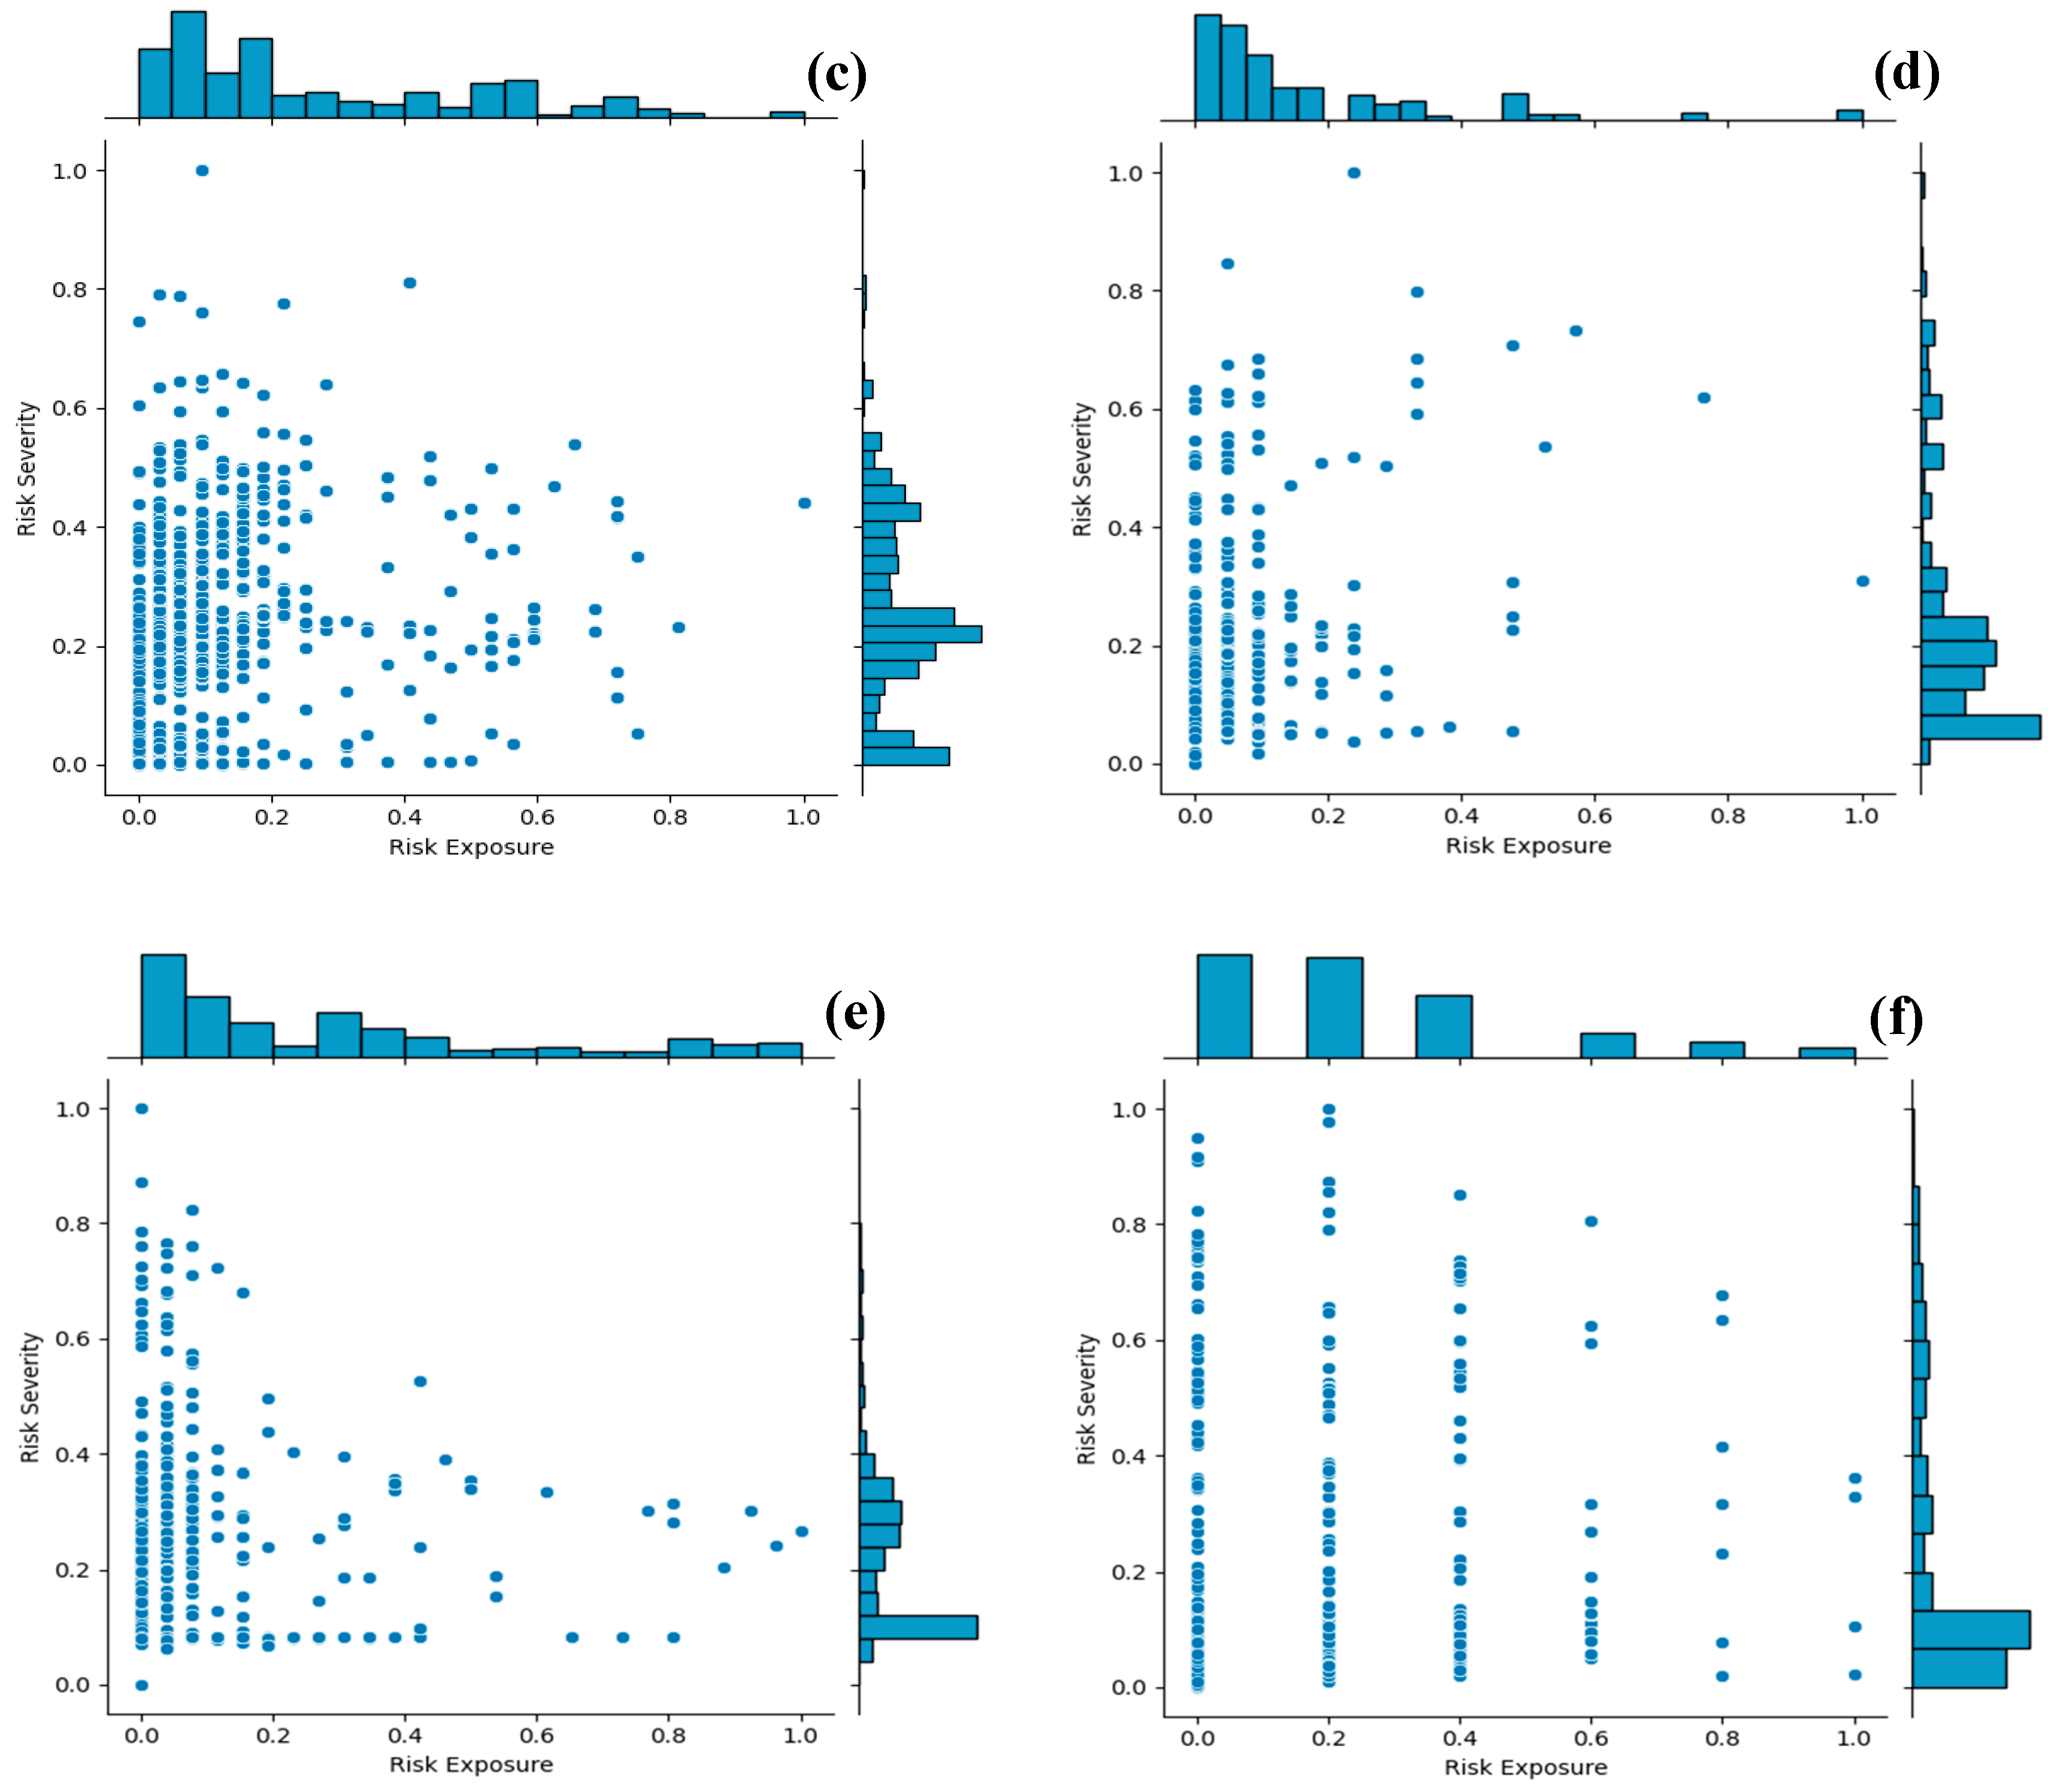
Table 2.
Observed versus Simulated Traffic Volumes for the study intersections.
| S/N | Intersection Name | Observed Volume from LiDAR (veh/h) | Simulated Volume (veh/h) | |||||
|---|---|---|---|---|---|---|---|---|
| Default Model |
Accuracy % |
Macro Model |
Accuracy % |
Micro Model |
Accuracy % |
|||
| 1 | 34th street & Indiana Avenue | 5727 | 5689 | 99.3 | 5717 | 99.8 | 5721 | 99.9 |
| 2 | 82nd street & Milwaukee Avenue | 5967 | 5804 | 97.3 | 5962 | 99.9 | 5962 | 99.9 |
| 3 | 82nd street & Slide Road | 5300 | 5286 | 99.7 | 5291 | 99.8 | 5288 | 99.8 |
| 4 | 50th street & Avenue Q | 4459 | 4309 | 96.6 | 4449 | 99.8 | 4455 | 99.9 |
| 5 | 50th street & Quaker Avenue | 6080 | 5776 | 95.0 | 6055 | 99.6 | 6050 | 99.5 |
| 6 | 4th street & Frankford Avenue | 3500 | 3206 | 91.6 | 3475 | 99.3 | 3489 | 99.7 |
Table 3.
Observed mean speeds versus simulated mean speeds.
| S/N | Intersection Name | Observed Mean Speed from LiDAR (mi/h) | Simulated Speed (mi/h) | |||||
|---|---|---|---|---|---|---|---|---|
| Default Model |
Accuracy % |
Macro Model |
Accuracy % |
Micro Model |
Accuracy % |
|||
| 1 | 34th street & Indiana Avenue | 20.88 | 14.45 | 69.2 | 17.54 | 84.00 | 19.72 | 94.4 |
| 2 | 82nd street & Milwaukee Avenue | 22.81 | 16.95 | 74.3 | 19.63 | 86.1 | 22.05 | 96.7 |
| 3 | 82nd street & Slide Road | 21.69 | 15.78 | 72.8 | 17.04 | 78.6 | 21.13 | 97.4 |
| 4 | 50th street & Avenue Q | 22.95 | 18.46 | 80.4 | 18.80 | 81.9 | 20.15 | 87.8 |
| 5 | 50th street & Quaker Avenue | 22.53 | 19.94 | 88.5 | 20.80 | 92.3 | 21.38 | 94.9 |
| 6 | 4th street & Frankford Avenue | 22.80 | 17.85 | 78.3 | 18.22 | 79.9 | 20.83 | 91.4 |
Table 4.
Calibrated Parameters for Macro Model.
| MACRO | |||||
|---|---|---|---|---|---|
| S/N | Intersection Name | CC0 (Default value = 4.92 ft) | CC1 (Default value = 0.9 s) | SDRF (Default value = 0.6) | ADT (Default value = -3.28 ft/s2) |
| 1 | 34th street & Indiana Avenue | 6.7 | 0.8 | 0.3 | -6.56 |
| 2 | 82nd street & Milwaukee Avenue | 6.7 | 0.9 | 0.4 | -6.56 |
| 3 | 82nd street & Slide Road | 2.6 | 0.9 | 0.1 | -3.28 |
| 4 | 50th street & Avenue Q | 3.7 | 0.9 | 0.1 | -3.28 |
| 5 | 50th street & Quaker Avenue | 4.5 | 0.8 | 0.2 | -3.28 |
| 6 | 4th street & Frankford Avenue | 4.5 | 0.8 | 0.6 | -6.56 |
Table 5.
Calibrated Parameters for Micro Model.
| MICRO | |||||
|---|---|---|---|---|---|
| S/N | Intersection Name | CC0 (Default value = 4.92 ft) | CC1 (Default value = 0.9 s) | SDRF (Default value = 0.6) | ADT (Default value = -3.28 ft/s2) |
| 1 | 34th street & Indiana Avenue | 5.5 | 0.7 | 0.5 | -6.56 |
| 2 | 82nd street & Milwaukee Avenue | 3.1 | 0.9 | 0.4 | -1.64 |
| 3 | 82nd street & Slide Road | 3.5 | 1 | 0.2 | -1.64 |
| 4 | 50th street & Avenue Q | 6.3 | 1 | 0.3 | -3.28 |
| 5 | 50th street & Quaker Avenue | 6.1 | 0.8 | 0.2 | -1.64 |
| 6 | 4th street & Frankford Avenue | 1.9 | 0.7 | 0.3 | -6.56 |
Table 6.
Extracted Rear-end conflicts at the study intersections.
| S/N | Intersection Name | Rear-End Conflict | ||
|---|---|---|---|---|
| Default Model | Macro Model | Micro Model | ||
| 1 | 34th street & Indiana Avenue | 702 | 811 | 993 |
| 2 | 82nd street & Milwaukee Avenue | 615 | 628 | 1194 |
| 3 | 82nd street & Slide Road | 539 | 834 | 1052 |
| 4 | 50th street & Avenue Q | 512 | 618 | 932 |
| 5 | 50th street & Quaker Avenue | 417 | 417 | 623 |
| 6 | 4th street & Frankford Avenue | 474 | 485 | 604 |
Table 7.
Negative Binomial Model results for the study intersections.
| Model Output | 34th/Indiana | 82nd/Milwaukee | 82nd/Slide | 50th/Ave Q | 50th/Quaker | 4th/Frankford |
|---|---|---|---|---|---|---|
| Constant (Intercept) | -2.2513 | -2.2524 | -1.0561 | -1.7797 | -0.8329 | -4.7538 |
| Rear-End Conflict Count | 0.2214 | 0.0423 | 0.0165 | 0.6979 | 1.5677 | 0.4993 |
| Pseudo R-squared (Cox & Snell) | 0.6515 | 0.5496 | 0.2142 | 0.3768 | 0.354 | 0.5834 |
| P-value | 0.000 | 0.000 | 0.050 | 0.000 | 0.018 | 0.004 |
| Akaike Information Criterion (AIC) | 28.4242 | 30.1829 | 41.8509 | 34.5000 | 47.3026 | 16.669 |
Disclaimer/Publisher’s Note: The statements, opinions and data contained in all publications are solely those of the individual author(s) and contributor(s) and not of MDPI and/or the editor(s). MDPI and/or the editor(s) disclaim responsibility for any injury to people or property resulting from any ideas, methods, instructions or products referred to in the content. |
© 2024 by the authors. Licensee MDPI, Basel, Switzerland. This article is an open access article distributed under the terms and conditions of the Creative Commons Attribution (CC BY) license (http://creativecommons.org/licenses/by/4.0/).
Copyright: This open access article is published under a Creative Commons CC BY 4.0 license, which permit the free download, distribution, and reuse, provided that the author and preprint are cited in any reuse.


