Submitted:
18 June 2024
Posted:
19 June 2024
You are already at the latest version
Abstract
We studied the dynamics of stable carbon (δ13C) and nitrogen (δ15N) isotopes in litters from Norway spruce (NSL) (Picea abies) and Scots pine (SPL) (Pinus silvestris) during in situ decomposition over a period of more than 4 years. Relative to initial values, δ13CNSL showed a weak enrichment (0.33‰), whereas δ13CSPL resulted in depletion (-0.74‰) at the end of decomposition. Both litter types experienced a depletion in δ15N during decomposition; δ15NNSL decreased by -1.74‰ and δ15NSPL decreased by -1.99‰. The effect of the selective preservation of or acid unhydrolyzable residue (AUR) in lowering δ13C of the residual litter was evident only in SPL. In the NSL, only in the initial stage C/N had a large effect on the δ13C values. In the later stages, there was a non-linear decrease in δ13CNSL with a simultaneous increase in AUR concentrations , but the effect size was large, suggesting the role of lignin in driving δ13C of residues in later stages. Depletion in 15N of the residual litters concomitant with the increase in N concentration suggests bacterial transformation of the litter over fungal components. A consistent decline in δ15N values further implies that bacterial dominance prompted this by immobilizing nitrate depleted in 15N in the residual litter.
Keywords:
litter decomposition
; carbon isotope
; nitrogen isotope
; scots pine
; norway spruce
; boreal forests
1. Introduction
During the decomposition process, the litter undergoes significant chemical transformations as it transitions from fresh litter to humus [1,2,3,4,5,6]. The stable isotope signatures of carbon (δ13C) and nitrogen (δ15N) and their discrimination during litter decomposition have helped gain insight into different aspects of chemical transformations, including carbon (C) and nitrogen (N) dynamics [7,8,9,10,11,12].
As decomposition proceeds and litter transitions into different phases involving either two or three stages of chemical transformations, the litter becomes imprinted with characteristic isotopic ratios. Such variations in isotopic ratios may arise from a complex interplay of various factors [13,14,15,16,17]. The initial litter is characterized by the dominance of labile compounds over resilient ones [18]. As decomposition progresses and easily and moderately degradable compounds are broken down and leached out of the litter, the concentration of recalcitrant organic matter—referred to as lignin or acid unhydrolyzable residue (AUR)—along with its decay-resistant secondary compounds, increases in the residual litter [3,4,8,18]. This means that in the later stages of decomposition, the ratio of the residual litter’s AUR, including its modified products to the labile fraction is generally higher than in the initial stage. The incorporation of transformed carbon and nitrogen products of bacterial and fungal origin or old transformed stable C and N from underlying layers into the residual litter has the tendency to alter the isotopic ratios of decomposing litter [19]. The nitrogen isotope ratio shows large changes due to various stages of nitrogen transformation, transfer, and assimilation that are linked to isotopic fractionation [20,21]. It has been suggested that loss of 15N-depleted labile N (leaching, nitrification and denitrification) together with the accumulation of 15N-enriched microbial biomass can increase the δ15N of the litter [7,21,22,23]. However, dominance of bacteria during decomposition can decrease 15N signatures because bacteria have a greater potential for immobilizing nitrate depleted in 15N in the residual litter [21,22,24,25]. In contrast, dominance of fungi in decay processes possibly leads to an enrichment of 15N in decomposing litter [26].
As decomposition progresses, the isotopic signature likely becomes more divergent from the initial litter, attributed to the constant transformation along with continued accumulation or loss of transformed compounds from the litter. Among all influencing factors, AUR and AUR/N ratio for 13C and organic-N fractionation for 15N during mineralization are by far the most important ones. AUR is recalcitrant and is depleted in δ13C by 2 to 6‰ compared to easily degradable 13C-enriched compounds like sugar, starch, and cellulose [8,27,28]. Its selective preservation relative to easily degradable compounds in the decomposing litter, especially during the stable fraction stage (late stage), has the tendency to lower the δ13C values of residual litter [29,30]. Studies on δ13C and δ15N ratios during decomposition have shown diverse outcomes: enrichment [28,29], depletion [24,31,32], or negligible shifts in residual litter mass [9,33]. A few other studies [7,8,11] have observed both depletion and enrichment patterns in different litter species within the same region. The difference in the outcome of these studies probably is related to the site conditions, which overall govern the decomposition dynamics, species specific characteristics, and the time for incubation in the field. Various studies have provided important insight into the dynamics of carbon and nitrogen isotopes, still only some of the isotopic changes are known. The isotopic changes described so far are limited to a few litter types in certain ecosystems and generally on shorter timescales. There has not been as much attention given to the specific details of the chemical composition of litter, especially when the decomposition dynamics (accumulated mass loss) has approached a limit value, or specifically when concentrations of AUR or the AUR/N ratio has increased or decreased [7,28]. For most of the foliar litter types and for most ecosystems, further investigations are required, particularly on a long-term temporal scale.
The objectives of this study were to describe the dynamics of carbon (δ13C) and nitrogen (δ15N) isotopes change during long-term (up to 60 months) decomposition of needle litter and to relate the carbon and nitrogen isotope patterns to accumulated mass loss, AUR concentration and AUR/N ratios of the litter. Needle litter belonging to Norway spruce (Picea abies) and Scots pine (Pinus silvestris) were used in the study. The litter decomposition experiment was conducted in paired monocultural stands of Norway spruce and Scots pine, aged 54 and 58 years, respectively in a hemiboreal forest of southeastern Sweden.
2. Materials and Methods
2.1. Study Site
The litter decomposition was conducted in hemiboreal coniferous forest stands (site Grensholm) located in southeastern Sweden (58° 33’ N; 15° 59’ E, 58 m a.s.l.). The experimental site was dominated by paired monocultural stands of Norway spruce and Scots pine. Both stands were growing on Eutric Cambisol, and the humus form was mull. Further details about the site are given elsewhere [34,35].
2.2. Needle Litter Collection, Storage, and Mass-Loss Determination
For this study, we obtained litter samples of Scots pine (SPL) and Norway spruce (NSL) from the repositories developed by late Dr. Maj-Britt Johansson along with Dr. Björn Berg. Local needle litter was collected from both Norway spruce and Scots pine stands. Litter was collected in the autumn 1978 by gently shaking the branches of the trees and collecting the needles on spread-out tarpaulins. Green needles were removed by hand. Litter was air dried and stored dry at room temperature. Before weighing, the needles were equilibrated to a constant moisture level (5-8%±0.5%) by drying them at room temperature for about one month. Exact dry mass was determined by drying samples to a constant mass at 85°C.
Litterbags, measuring 8×8-cm, excluding a 1cm-wide edge, were made of polyester net with a mesh size of about 1.0×1.0-mm for pine needles and about 1.0×0.5mm for spruce needles. We placed 1.0g (3 decimals) of needle litter in each litterbag. The bags were deployed on the top of the litter (L) layer in 25 randomly located 1×1m spots within each plot in early May 1979. In each such spot, 10-14 bags were attached to the ground using pegs pushed through the edge of bags. Litter bags were incubated in situ for 5 and 4 years in the Norway spruce and Scots pine stands, respectively. Litterbags were retrieved from their respective sites after field incubation for 181, 369, 540, 736, 915, 1085, 1462 and 1833 days from the start of the experiment (June 1979 to May 1983). On each occasion, 25 litter bags per litter type were collected from each stand. The litterbags were gently brushed to remove new needles deposited on the bags and cleaned for residue of through-growing plant like moss, grass, and plant roots. The bags were individually packed in brown-paper envelopes and transported to the laboratory. The bags were either stored at -20° C (if storage was needed) or cut open immediately to air-dry the litter sample and clean the litter for any ingrown foreign material (moss, grass, and plant roots). Litter samples were than dried at 85° C until they achieved constant weight (about 2 days). The dried samples were allowed to cool in a desiccator before weighing and the exact litter weight of each bag was recorded with an accuracy of two decimals. Mean values of mass loss were calculated for each sample set of 25 bags and details are given in Berg et al. [36]. Thoroughly dried, ground litter samples were sealed and stored dry at room temperature until retrieved from the storage in April 2021. Ground samples stored in a dark and dry environment have indefinite storage life and samples can be left for any length of time in clean air-tight conditions that maintains sample integrity for follow-up analytical work. Litterbag data (data on accumulated mass loss) and AUR (gravimetric lignin) were taken from Berg et al. [37].
2.3. Sample Preparation and Chemical Analyses
To prepare homogenized samples for determining the concentrations of carbon and nitrogen and their isotope values, the ground litter samples were first freeze-dried at −80°C for 96 h and then ground again into a fine powder using an agate ball mill (MM400; Retsch, Haan, Germany) at Korea Basic Science Institute (KBSI), Korea and stored in glass vials. Litter C and N concentrations were determined by combusting samples at 1,100 °C in a Flash EA Elemental Analyzer (1112 Series, Thermo Electron S.p.A., Rodano, Italy) at the Korea Basic Science Institute, Korea.
To determine the C and N isotope ratios, about 0.1 mg and 8 mg of the samples, respectively were enclosed in different tin containers (3.5 × 1.5 mm; Elemental Microanalysis, Okehampton, UK). Until further analysis, the samples enclosed in tin containers were stored in a desiccator to prevent vapor absorption. C and N isotope ratios were determined using an isotope ratio mass spectrometer (IRMS; VisION, Isoprime Ltd., Manchester, UK) equipped with a vario PyroCube elemental analyzer (Elementar, Hesse, Germany). The elemental analyzer included a combustion tube maintained at 1,150°C, which was operated in continuous flow mode. The encapsulated sample was combusted at 1,150°C in a combustion reactor, and any excess oxides were subsequently removed in a reduction reactor maintained at 850° C. Afterwards, the N2 and CO2 gases generated were separated through chromatography, and the isotope ratios were measured using the IRMS (VisION, Isoprime Ltd., Manchester, UK). Because of varying content of C and N in samples, C and N isotopes were analyzed separately. Stable isotope ratios were reported using the standard delta notation (δ) relative to an international standard unit per mil (‰) as follows: δ (‰) = (Rsample/Rreference − 1) × 1000, where Rsample and Rreference are the molar ratios of the heavy to light isotopes of the sample and standard, respectively, representing 13C/12C or 15N/14N. The resulting δ13C and δ15N values were reported against Vienna Pee Dee Belemnite (VPDB) and atmospheric nitrogen (air), respectively. The analytical precision was within ± 0.1‰ for C and N isotopes. The following standard reference materials were used for the calibration of C and N isotope ratios: NBS-22 (oil, δ13CVPDB = −29.8‰), IAEA-CH-3 (cellulose, δ13CVPDB = −24.73‰), IAEA-CH-6 (sucrose, δ13CVPDB = −10.45‰), IAEA-600 (caffeine, δ13CVPDB = −27.77‰, δ15NAir = +1.0‰), USGS-40 (l-glutamic acid, δ13CVPDB = −26.39‰, δ15NAir = −4.52‰), IAEA-NO3 (potassium nitrate, δ15NAir = +4.7‰).
2.4. Data Analyses
The decomposition patterns and rates were estimated using the accumulated mass loss or remaining amount (or concentrations for elements) of litter using the single exponential model: ln (Mt/M0) = –kt, where M0 is the initial mass at time t0, Mt is the mass at a certain time in the decomposition period, t (year), and k is the decay rate constant (yr−1) [5,38]. We calculated the asymptotic limit values for decomposition and the decomposition rate (kA)according to Wieder and Lang [39] and Berg and Ekbohm [40];
where Lt is the accumulated mass loss (in percent), t is time in days, kA is the decomposition rate at the beginning of the decay, and m represents the asymptotic level that the accumulated mass loss will ultimately reach.
Lt = m(1-e-kAt/m)
The per mil (‰) fractionation factor (Δ) was calculated to estimate the difference in C and N isotopic compositions between the residues at the start (t0 initial) and the end (tf final) of decomposition [41].
To compare the dynamics in the litter types and emphasize temporal differences in concentration and amount against time and accumulated mass loss line plots were used. The trends generated in the plot allowed us to perceive the distinctive pattern of change. We used polynomial regression (linear and quadratic models) to test the relationships between element dynamics and accumulated litter mass loss. Two separate regression analyses were run; one with change in element concentration vs. time and another with percent accumulated mass loss of the decomposing litter to determine the underlying relationship. If a linear relationship was not fitting the data and unable to capture the patterns, a polynomial quadratic regression was used to model the relationship between variables to match the pattern of the data, Y = Pr1 + Pr2X+ Pr3X2, where Y determines the element concentrations, Pr1 is the intercept, and Pr2 and Pr3 are estimates of parameters of quadratic regression for accumulated mass loss (AML). To quantify the strength of the effect that these predictors have on the isotopic composition Cohen’s f2 statistics was conducted: f2=R2/1−R2, where R2 represents the coefficient of determination. Generally, a larger f2 value (>0.35) indicates a large effect size and hence a stronger relationship between the variables. Effect sizes are medium and small when f2 falls between 0.15-0.34 and below 0.02, respectively. Pearson correlation was used to study relationships among various variables recorded during the decomposition. XLSTATpro (v 13.2.1.0) was used for the statistical analyses and graphical visualizations (Addinsoft, New York, NY, USA). Equality of slopes of regression were estimated using LINEST and Slope test syntax in MS excel.
3. Results
3.1. Initial Litter at Time t0
Scots pine needles (SPL) had low concentrations of carbon and AUR compared to Norway spruce needles (NSL). In contrast, nitrogen concentration was slightly higher in the SPL relative to NSL (Figure 1). C/N and AUR/N ratios of NSL were higher in comparison to those of SPL. Relative differences, however, between the two litter types were small. In terms of stable isotope ratios, NSL was depleted in 13C compared to SPL by 0.09‰, whereas NSL was enriched in 15N relative to SPL by 0.27‰ (Figure 1).
3.2. Litter Mass Loss and Decomposition Dynamics
The best approximation of the relationships between percentage accumulated mass loss against time resulted in a good fit with R2 ≥ 0.95 (Figure 2a). Initially (1st year), mass loss was higher for SPL (42%) than for NSL (19%). NSL took more than twice the duration of SPL to achieve an equivalent cumulative mass loss as recorded by SPL within the first year. After one year, the mass-loss rate began to decline (Figure 2b). We may note that the rate decreased faster for SPL than for NSL. This is readily seen by using k values (rate constants) for each sampling (Figure 2b). Overall SPL always had a higher accumulated mass loss than NSL. After about 4 years of in situ decomposition, with about 73% mass loss, SPL began to plateau and asymptotically approach a limit value for the accumulated mass loss., calculated to be 74.4%
Conversely, even after 5 years and 68% mass loss, NSL mass-loss dynamics continued to show a decreasing trend, suggesting that extending the incubation period further would have resulted in additional mass loss for NSL to reach the calculated limit value at 92.2%.
The rates and patterns of decay differed between the two species. The estimated (annual) k (decay constant) suggested that decomposition rates for litter mass, C and AUR, as well as loss rate of N in SPL were higher than for NSL (Table 1). Comparison of the slopes (equality of slopes test) resulted in P <0.05, suggesting significant differences in the decay rates (heterogeneity in slope) of the two litter types. The differences manifested as steeper slopes for SPL up to an accumulated mass loss of c. 75%, but its decay rate decreased less rapidly closer to the limit value as compared to those of NSL. Meanwhile, after the initial stage, NSL maintained a relatively steady decay rate (reaching an asymptote) throughout the observation period. Loss rates of C, N and AUR also differed between the two litter types (Figure 2).
3.3. δ13C Dynamics during Decomposition
Over the course of the experiment, the δ13C values fluctuated within a narrow range, indicating minimal enrichment or depletion, with values ranging from -25.06‰ to -25.78‰ (Figure 3). Despite minor fluctuations, the overall trend in δ13C values for NSL remained relatively stable throughout the experiment (Figure 3a). At the end of the 5-years period of the in situ decomposition, the δ13C value for NSL was indicative of slight enrichment, measured at -25.30‰. In contrast, the initial δ13C value for SPL indicated slight enrichment, recorded at -25.54‰. However, the δ13C values for SPL exhibited more pronounced variability compared to NSL, indicating both enrichment and depletion events. The δ13C values ranged from -25.65‰ to -26.28‰, showcasing a dynamic interplay between enrichment and depletion over time. Notably, the δ13C values for SPL showed a declining trend overall, suggesting a progressive shift towards depletion during the decomposition process. At the end of the 48-month observation period, the lowest δ13C value observed for SPL was indicative of significant depletion, measured at -26.28‰. Comparing the δ13C values between NSL and SPL, it is evident that the SPL experienced more pronounced fluctuations, reflecting a dynamic interplay between enrichment and depletion processes. In contrast, NSL exhibited relatively stable δ13C values, indicating minimal fluctuations between enrichment and depletion events.
The regression fit parameters of δ13C against percent accumulated litter mass loss showed significant relationship only for the SPL (R2 = 0.80; P <0.05) and not for that of NSL (R2 = 0.03; P = ns) (Figure 4a). The same trend was seen for the change in carbon concentration (Figure 4b). In the case of NSL, neither the linear nor quadratic terms for other variables (C, N, C/N, AUR, AUR/C and AUR/N) appeared to be statistically significant predictors of the δ13C dynamics, as all of them had very low R2 (0.01-0.13) with coefficients having non-significant P-values (>0.05). However, the polynomial quadratic regressions showed moderate to high explanatory powers (R2 = 0.67-0.79) of the same predictor variables for change in δ13C in SPL, indicating their role in the variability of carbon isotopic composition in SPL. It can be noted that SPL peaks at approx. 60% accumulated mass loss, a change from increase to decrease (Figure 4g). The indicators N, C/N, AUR, and AUR/C (Supplement Figure SX a-d) indicate their roles in the variability of carbon isotopic composition in SPL. While the model fitted the data reasonably well, N, C/N and AUR are the individual predictors which contributed significantly to explaining the variation in the SPL’s isotopic change
3.4. δ15N dynamics during decomposition
Initially, NSL exhibited a δ15N value of 0.68‰, indicating slight enrichment. However, as the decomposition experiment progressed, the δ15N values decreased steadily, reaching a low of -1.35‰ at the 4-year mark before slightly increasing to -1.07‰ at the end of the 5-year decomposition period (Figure 5b). This decreasing trend in δ15N values suggests a depletion of nitrogen isotopes over time in NSL. In contrast, SPL showed a different pattern of isotopic dynamics. The δ15N values for SPL fluctuated throughout the experiment, starting at 0.95‰ and decreasing to a minimum of -1.45‰ at the 24.1-month mark, before partially recovering to -1.04‰ at the end of the 4-year study period. This fluctuating pattern indicates a dynamic interplay between enrichment and depletion processes in SPL. Comparing the δ15N values between NSL and SPL, it is evident that both the species experienced δ15N depletion over time. However, NSL exhibited a more consistent and pronounced depletion trend compared to SPL, which showed greater variability and intermittent enrichment events.
The percentage accumulated mass loss is a statistically significant predictor of δ15N for both NSL and SPL, as indicated by high R2 (0.90-0.99) and low P value (<0.05) (Figure 5a). Overall, the polynomial regression suggests a non-linear relationship between them, suggesting that as the percentage accumulated mass loss increases, δ15N tends to decrease. With C, N, C/N, AUR, AUR/C and AUR/N as well, the polynomial quadratic regressions generally resulted in statistically strong fits (R2 = 0.76-0.99; P <0.05). The strong fit suggests that these parameters have robust effects on δ15N dynamics of both NSL and SPL (Figure 5b-g).
4. Discussion
4.1. Comparison of Change in δ13C with Previous Studies
The divergence in the dynamics of δ13C signatures between the two litter types is noticeable. Similar to Connin et al. [7], we noticed two different types of isotopic shifts, enrichment and depletion, in two conifer litter types from the same study area. Overall NSL experienced enrichment, similar to previous studies [28,29]. However, its δ13C dynamics was two-phased, initially showing enrichment in the first few months. Subsequently, it underwent depletion in the carbon isotope ratio and depletion became almost consistent and stable, reaching an asymptote after the 16th month. Conversely, in SPL overall, a single-phase decline was observed. Carbon isotope depletion reconciles with the results of other studies [7,8,32]. The decline was faster in the early stages compared to the later stages. Overall, at the end of the study period, NSL experienced enrichment, whereas SPL underwent depletion. Contrary to our observation, other researchers [9,33] reported negligible shifts in the carbon isotope values of the residual litters. This is likely due to the shorter incubation period employed in these studies. Compared to the initial phase, the later phase of both litter types exhibited more stable and consistent isotopic shifts. The differences between early and late decomposition phases suggest that isotopic discrimination is primarily determined during the initial decay phases rather than in later ones [7]. The overall dynamics and asymptote align with the dynamics of δ13C against litter mass loss and decay rate through time, particularly in the later stages. The relationship, however, was significant only in SPL, especially against accumulated mass loss.
4.2. Factors Influencing δ13C Signatures of Decomposing Litter
The different isotopic shifts for the two litters had suggested that different processes are involved in the increase and decrease of carbon isotope values of the residual litter. To check if change in carbon concentrations during the study is related to an increase in δ13C, we regressed both of them. For NSL, this analysis did not yield a significant relationship and resulted in a very low Cohen’s f2 effect sizes (0.01-0.15). At 68.5% mass loss, the change in carbon conc. of NSL was negligible (a 0.01-fold decrease of the initial value). This decrease occurred only in the initial month, and after that, almost no change in the carbon concentration was observed for the rest of the period. Such an infinitesimal change in carbon concentration during 5 years of decomposition cannot account for the observed increase in δ13C during decomposition. The δ13C increase with a shift towards a less negative value over time generally is tied to fungal- or bacteria-mediated transfer of 13C enriched fractions from decaying environment to residual litter, or incorporation of microbial biomass into the decaying litter [28,42]. It was also suggested that the increase may be related to the preferential utilization (by microbes) and subsequent loss of 12C enriched soluble fractions from the decomposing litter during transformation [7]. Moreover, earlier research has revealed that fungal biomass is enriched in 13C compared to intact foliar components [43,44]. The loss of lignin or lignin like compounds, which are depleted in 13C, can increase the isotope signatures of residual litter [8]. We did not find any significant relationship of δ13C with AUR. Besides, AUR in NSL showed a 1.805-fold increase in concentration compared to the initial value, suggesting preservation of lignin or lignin like compounds. We didn’t find significant relationships of NSL (δ13C) with any other parameter (N, C/N, AUR/N) as well, all the parameters resulted in very low Cohen’s f2, demonstrating miniscule to non-existent effect of these parameters on carbon isotope values. The fractionation originating from substrate breakdown and release of CO2 during microbial respiration can also have an effect on the isotopic composition of the residual litter [45,46]. As CO2, which is depleted in 13C, is respired during microbial respiration, the subsequent effect of isotopic fractionation will lead to deviation in the isotopic values of original initial litter [47,48]. The preferential utilization and loss of 12C during microbial respiration can result in the enrichment of residual matter in 13C [49].
SPL exhibited 13C depletion. Seemingly, the isotopic difference between the two litter types is due to site-specific spatial heterogeneity between NSL and SPL stands. For instance, variations in microbial biomass and their succession during decomposition, along with differences in litter fraction utilization and transformation rates, can influence δ13C disparities [11,49]. A decrease in δ13C is attributed to the selective preservation and accumulation of lignin or alike organic molecules in the residual litter [31,50,51]. Lignin, relative to easily degradable labile carbon pools, is -4‰ to -7‰ depleted in 13C [51]. A decrease in δ13CSPL occurred with an increase in the AUR concentration. Both have a significant relationship which strengthens the assertion that lignin decreases δ13C values of litter, especially in the advanced litter decomposition stages. However, NSL as well experienced an increase in AUR concentration, although the relationship between δ13C and AUR was not significant in that case. If AUR overwhelmingly defines the δ13C of litters in the advanced stage of decomposition then both litters must have depleted isotopic values, which was not the case. This suggests that the role of lignin in δ13C values is co-dependent on other factors.
In our case, both AUR concentration and its decay rate (ks) increased continuously until a mass loss of approx. 60%, followed by a limited change afterwards. In the early stages, SNL had fast and higher mass loss and decay rate (ks) relative to the NSL. Overall, the heterogeneity of slopes resulted in significant difference between mass loss and decay rate dynamics of two litter types. This implies that SNL had degradation of polysaccharides at higher rates in the early stages. Furthermore, AUR either was stabilized, and/or its decomposition is lagging and/or limited [52]. The increase in AUR concentration is associated with the increase in carbon concentration, suggesting co-preservation, but only in the case of SPL (R = 0.86; P < 0.05) (Supplementary Figure S1). This probably is the carbon that was tightly bound to highly recalcitrant AUR or lignin–carbohydrate complexes or other organic molecules that are 13C depleted [8,18]. Berg and Staaf [53] reported an overall decrease in cellulose and hemicellulose while lignin and nitrogen increased. So, the selective consumption by microbes and subsequent loss of polysaccharides (cellulose and hemicellulose), especially during the initial stages, shifted the C isotope composition of the residual litter to more negative.
The enrichment of nitrogen leads to an increase in AUR concentration within decomposing residues [18,54,55]. This happens through the effect of N in suppressing or decreasing the formation of fungal lignolytic enzymes, which are responsible for mediating lignin breakdown [52,56,57]. We observed significant negative correlations of nitrogen and lignin concentration increase with the decrease in the decay rate (ks) of SNL (r= -0.90) (Table 2). Additionally, a direct relationship was seen between an increase in the concentrations of nitrogen and lignin (R2 ≥0.98) (Figure S3). This relationship was significant in both the litter types. However, only in the SPL both nitrogen and lignin showed significant relationship with δ13C. Probably, in SPL this is a nonlabile form of nitrogen that is bound to lignin which is retained during litter decomposition [58].
4.3. Comparison of Change in δ15N with Previous Studies
According to ANOVA, δ15N changed significantly during the decomposition relative to the initial isotopic values in NSL and SPL. Comparing the δ15N values between NSL and SPL, it is evident that both species experienced depletion of nitrogen isotopes (lower δ15N values) over time. Norway spruce litter exhibited a more consistent depletion trend compared to Scots pine litter, which showed slight enrichment towards the end of the study. The δ15N depletion of litter with the progression of decomposition is similar to findings in previous studies [6,24]. Bragazza et al. [25] found both depletion and enrichment among various litter species collected from a 2ha Marcesina bog. Various other studies, however, have reported δ15N enrichment during decomposition [7,10,20]. The differences likely stem from variations in litter species and site-specific factors. Overall, both the litters experienced single-phase depletion with accumulated mass loss. The δ15N decline was rapid in SPL relative to NSL. In the initial years, SPL showed a greater magnitude of decrease compared to NSL, i.e., SNL decreased ~250%, while NSL decreased ~62% in the first year of incubation. At the same time, accumulated mass loss of SPL was twice that of NSL. The NSL took an additional 1.5 years of field incubation to match the magnitude of the initial percent decrease of SNL.
4.4. Factors Influencing δ15N Signatures of Decomposing Litter
The negative coefficients of regression analyses for nitrogen concentration indicate an inverse relationship with δ15N, suggesting that higher nitrogen concentration tends to lead to lower nitrogen isotopic ratios. The regression resulted in a high explanatory power (R2 > 0.93). The robustness of the δ15N to N concentration ratio relationships across the litter types suggests that nitrogen concentration plays a crucial role in determining the isotopic composition of nitrogen in litter. Possible explanations for the observed depletion could include complex interactions between nitrogen availability, microbial processing, and isotopic fractionation processes within the litter decomposition continuum [7,19,21,25,59]. Nitrogen concentration differed significantly between the initial and final values. The percentage increase was more than 175% for both the litter types, suggesting immobilization and enrichment of residual litter with nitrogen. Melillo et al. [24] noted a correlation between a decrease in δ15N and nitrogen immobilization. Similar to this study, they too recorded a depletion of δ15N values by 2–3 ‰ during the immobilization phase.
There was a significant relationship between δ15N values and the corresponding accumulated mass loss (R2 >0.90). The depletion of nitrogen isotopic values probably resulted from microbial activity [20,25,60]. Various studies have suggested that changes in bacteria-to-fungi ratios in the decaying environment have the tendency to either increase or decrease the δ15N values [21,22,24,25,26]. Decomposition primarily driven by bacteria can decrease δ15N signatures due to discrimination and biological fractionation during nitrogen transformations [22,24]. Bacteria have a greater potential for immobilizing nitrate depleted in 15N in the residual litter [21,22,25]. Overall, the nitrification of ammonium can lead to a decrease in the δ15N due to discrimination against the heavier nitrogen isotope (15N) by both ammonia-oxidizing bacteria and nitrite-oxidizing bacteria [21]. As well as nitrogen isotopic values are particularly sensitive to the fractionation effects that happen during nitrification; fractionation during nitrification has the tendency to decrease the nitrogen isotopic values [21,22]. Contrarily, dominance of fungi can lead to an enrichment of 15N in decomposing litter [26]. We did not investigate bacterial and fungal biomass in our study, however, a decrease in δ15N of NSL and SPL during decomposition may be largely mediated by bacterial biomass. A similar observation was reported by Bragazza et al. [25] in sedge and grass litter.
We recorded a significant relationship between δ15N and C:N ratio (R2 >0.90) (Figure 5d). In addition to this, C:N ratios were correlated with the accumulated mass loss (R2 >0.92). As accumulated mass loss increased and the nitrogen concentration increased relative to carbon, residual litter became depleted in 15N. The decrease in C:N ratio primarily is governed by increase in nitrogen rather than carbon, which experienced limited increase. Low C:N ratios result in intense bacterial activity and their subsequent biomass increase. Decrease in C:N ratios in the residual litter indicates conditions conducive for bacterial dominance over fungal colonization [25,61]. Bacteria, being selective in their uptake of nutrients, preferentially assimilate δ15N depleted form of nitrogen, possibly resulting in a decrease in the δ15N values of the remaining litter. Indirectly, the dominant role of bacteria can be judged by the dominance of AUR in the residual litter. As discussed above, there was a significant increase in the AUR concentration with accumulated mass loss. Nitrogen availability influences the composition and activity of microbial communities. High nitrogen levels can result in an increase in AUR concentration through its ability to suppress the population and activity of lignin-degrading fungi and/ or inhibit the production of lignolytic enzymes (i.e., peroxidases and laccases) by fungi [35,56,57]. The decrease or no change in δ13C values observed in this study supports that δ15N values are modulated by bacteria rather than fungi in both the NSL and SPL. We noticed significant relationship between δ15N and AUR as well, with high Cohen’s f2 effect (>3.17). Overall, the decrease in δ15N with increasing AUR and nitrogen concentration suggests a complex interplay between nitrogen availability, microbial community dynamics, and isotopic fractionation processes during decomposition.
5. Conclusions
The dynamics of carbon (δ13C) and nitrogen (δ15N) isotopes during litter decomposition in hemi-boreal forest stands reveals complex interactions influenced by litter type, and environmental factors. The δ13C values of NSL and SPL litter exhibited distinct patterns, with NSL experiencing overall enrichment and SPL showing depletion, reflecting the interplay between microbial processes and litter composition. Regression analyses indicated that accumulated mass loss was a significant predictor of δ13C and δ15N dynamics, highlighting the importance of bacterial activity and litter transformation rates in isotopic fractionation. The effect was modulated by AUR concentration along with nitrogen concentration. Similarly, the δ15N values showed depletion over time. The relationship between δ15N and nitrogen concentration, C:N ratio, and accumulated mass loss underscored the influence of microbial community dynamics and nitrogen availability on isotopic fractionation processes during decomposition. Notably, the decrease or no change in δ13C and consistent depletion of δ15N during litter decomposition along with increase in AUR and nitrogen concentrations supports that decomposition rate decreases and its effect in isotopic values was modulated by bacteria rather than fungi in both NSL and SPL litter. Overall, the findings contribute to a better understanding of litter decomposition processes and the underlying mechanisms driving isotopic dynamics in forest ecosystems
Supplementary Materials
The following supporting information can be downloaded at the website of this paper posted on Preprints.org.
Author Contributions
BB collected the data from field explorations. MKG and KL analyzed the samples, MKG, BB and KL processed and analyzed the data. MKG, BB and KL wrote the paper. KL provided analytical and other logistic support for the study. KL provided the funding for the study. All the authors contributed to the article and approved the submitted version.
Funding
This study was supported by the KBSI grant (A425100).
Data Availability Statement
The data can be made available on request to Björn Berg and Mukesh K. Gautam.
Acknowledgments
The authors are thankful to the late Prof. Maj-Britt Johansson who designed the experiment and executed the main part of the experiments. Furthermore, she provided litter samples from her repository for this study.
Conflicts of Interest
The authors declare that the research was conducted in the absence of any commercial or financial relationships that could be construed as a potential conflict of interest.
References
- Berg, B.; Laskowski, R. Litter decomposition, a guide to carbon and nutrient turnover. 2005, Elsevier, New York.
- Balesdent, J.; Girardin, C.; Mariotti, A. Site-related δ13C of tree leaves and soil organic matter in a temperate forest. Ecology 1993, 74, 1713–1721. [Google Scholar] [CrossRef]
- Prescott, C.E.; Vesterdal, L.; Preston, C.M.; Simard, S.W. Influence of initial chemistry on decomposition of foliar litter in contrasting forest types in British Columbia. Can. J. For. Res. 2004, 34, 1714–1729. [Google Scholar] [CrossRef]
- Rubino, M.; Lubritto, C.; D’Onofrio, A.; Terrasi, F.; Gleixner, G.; Cotrufo, M.F. An isotopic method for testing the influence of leaf litter quality on carbon fluxes during decomposition. Oecologia 2007, 154, 155–166. [Google Scholar] [CrossRef] [PubMed]
- Berg, B. Decomposition patterns for foliar litter–a theory for influencing factors. Soil Biol. Biochem. 2014, 78, 222–232. [Google Scholar] [CrossRef]
- Gautam, M.K.; Berg, B.; Lee, K.S.; Nilsson, T.; Shin, H.S. Dynamics of trace and rare earth elements during long-term (over 4 years) decomposition in Scots pine and Norway spruce forest stands, Southern Sweden. Front. Env. Sci. 2023, 11, 1190370. [Google Scholar] [CrossRef]
- Connin, S.L.; Feng, X.; Virginia, R.A. Isotopic discrimination during long–term decomposition in an arid land ecosystem. Soil Biol. Biochem. 2001, 33, 41–51. [Google Scholar] [CrossRef]
- Osono, T.; Takeda, H.; Azuma, J.I. Carbon isotope dynamics during leaf litter decomposition with reference to lignin fractions. Ecol. Res. 2008, 23, 51–55. [Google Scholar] [CrossRef]
- Ngao, J.; Cotrufo, M.F. Carbon isotope discrimination during litter decomposition can be explained by selective use of substrate with differing δ13C. Biogeosciences 2011, 8, 5–82. [Google Scholar]
- Xu, S.; Liu, Y.; Cui, Y.; Pei, Z. Litter decomposition in a subtropical plantation in Qianyanzhou China. J. For. Res. 2011, 16, 8–15. [Google Scholar] [CrossRef]
- Gautam, M.K.; Lee, K.S.; Song, B.Y.; Lee, D.; Bong, Y.S. Early-stage changes in natural 13C and 15N abundance and nutrient dynamics during different litter decomposition. J. Plant Res. 2016, 129, 463–476. [Google Scholar] [CrossRef]
- Hobbie, E.A.; Grandy, A.S.; Harmon, M.E. Isotopic and compositional evidence for carbon and nitrogen dynamics during wood decomposition by saprotrophic fungi. Fungal Ecol. 2020, 45, 100915. [Google Scholar] [CrossRef]
- Hobbie, E.A.; Högberg, P. Nitrogen isotopes link mycorrhizal fungi and plants to nitrogen dynamics. New Phytol. 2012, 196, 36–382. [Google Scholar] [CrossRef] [PubMed]
- Kammer, A.; Hagedorn, F. Mineralisation leaching and stabilisation of 13C labelled leaf and twig litter in a beech forest soil. Biogeosciences 2011, 81. [Google Scholar] [CrossRef]
- Li, S.G.; Tsujimura, M.; Sugimoto, A.; Davaa, G.; Oyunbaatar, D.; Sugita, M. Temporal variation of δ13C of larch leaves from a montane boreal forest in Mongolia. Trees 2007, 1, 479–490. [Google Scholar] [CrossRef]
- Perakis, S.S.; Sinkhorn, E.R.; Compton, J.E. δ15N constraints on long–term nitrogen balances in temperate forests. Oecologia 2011, 167, 793–807. [Google Scholar] [CrossRef] [PubMed]
- Preston, C.; Nault, J.; Trofymow, J. Chemical changes during 6 years of decomposition of 11 litters in some Canadian forest sites Part 2 13C abundance solid-state 13C NMR spectroscopy and the meaning of lignin. Ecosystems 2009, 12, 1078–1102. [Google Scholar] [CrossRef]
- Berg, B.; McClaugherty, C. Plant litter: Decomposition, humus formation, carbon sequestration. Springer: New York, NY, 2020, 4th Edition.
- Dijkstra, P.; LaViolette, C.M.; Coyle, J.S.; Doucett, R.R.; Schwartz, E.; Hart, S.C.; Hungate, B.A. 15N enrichment as an integrator of the effects of C and N on microbial metabolism and ecosystem function. Ecol. Lett. 2008, 11, 389–397. [Google Scholar] [CrossRef]
- Asada, T.; Warner, B.; Aravena, R. Effects of the early stage of decomposition on change in carbon and nitrogen isotopes in Sphagnum litter. J. Plant Interact. 2005, 1, 229–237. [Google Scholar] [CrossRef]
- Nadelhoffer, K.J.; Fry B Nitrogen isotope studies in forest ecosystems. In, Lajtha K, Michener R. (eds.) Stable isotopes in ecology. Blackwell Scientific Publications:Oxford, UK, 1994; pp. 22–44.
- Högberg, P. 15N natural abundance in soil–plant systems. New Phytol. 1997, 137, 179–203. [Google Scholar] [CrossRef]
- Templer, P.H.; Arthur, M.A.; Lovett, G.M.; Weathers, K.C. Plant and soil natural abundance δ15N: indicators of relative rates of nitrogen cycling in temperate forest ecosystems. Oecologia 2007, 153, 399–406. [Google Scholar] [CrossRef]
- Melillo, J.M.; Aber, J.D.; Linkins, A.E.; Ricca, A.; Fry, B.; Nadelhoffer, K.J. Carbon and nitrogen dynamics along the decay continuum: plant litter to soil organic matter. Plant Soil 1989, 115, 189–198. [Google Scholar] [CrossRef]
- Bragazza, L.; Iacuminm, P.; Siffi, C.; Gerdol, R. Seasonal variation in nitrogen isotopic composition of bog plant litter during 3 years of field decomposition. Biol. Fertil. Soils 2010, 46, 877–881. [Google Scholar] [CrossRef]
- Hobbie, E.A.; Hobbie, J.E. Natural abundance of 15N in nitrogen–limited forests and tundra can estimate nitrogen cycling through mycorrhizal fungi, a review. Ecosystems 2008, 11, 815–830. [Google Scholar] [CrossRef]
- Osono, T.; Hobara, S.; Koba, K.; Kameda, K.; Takeda, H. Immobilization of avian excreta–derived nutrients and reduced lignin decomposition in needle and twig litter in a temperate coniferous forest. Soil Biol. Biochem. 2006, 38, 517–525. [Google Scholar] [CrossRef]
- Wedin, D.A.; Tieszen, L.L.; Dewey, B.; Pastor, J. Carbon isotope dynamics during grass decomposition and soil organic matter formation. Ecology 1995, 76, 1383–1392. [Google Scholar] [CrossRef]
- Xu, S.; Liu, Y.; Cui, Y.; Pei, Z. Litter decomposition in a subtropical plantation in Qianyanzhou, China. J. For. Res. 2011, 16, 8–15. [Google Scholar] [CrossRef]
- Benner, R.; Fogel, M.L.; Sprague, E.K. Diagenesis of belowground biomass of Spartina alterniflora in salt-marsh sediments. Limno. Oceano. 1991, 36, 1358–1374. [Google Scholar] [CrossRef]
- Preston, C.M.; Trofymow, J.A.; Flanagan, L.B. Decomposition, d13C, and the ‘‘lignin paradox’’. Can J Soil Sci 2006, 86, 235–45. [Google Scholar] [CrossRef]
- Fernandez, I.; Mahieu, N.; Cadisch, G. Carbon isotopic fractionation during decomposition of plants materials of different quality. Global Biogeochem. Cy. 2003, 17, 1075. [Google Scholar] [CrossRef]
- Schweizer, M.; Fear, J.; Cadisch, G. Isotopic δ13C Fractionation during plant residue decomposition and its implications for soil organic matter studies. Rapid Commun. Mass Spectrom. 1999, 13, 1284–1290. [Google Scholar] [CrossRef]
- Berg, B.; Booltink, H.G.W.; Breymeyer, A.; Ewertsson, A.; Gallardo, A.; Holm, B.; Johansson, M.-B.; Koivuoja, S.; Meentemeyer, V.; Nyman, P.; Olofsson, J.; Pettersson, A.-S.; Reurslag, A.; Staaf, H.; Staaf, I.; Uba, L. Data on needle litter decomposition and soil climate as well as site characteristics for some coniferous forest sites. 2nd ed. Uppsala: Swedish University of Agricultural Sciences. Department of Ecology and Environmental Research. Section 1 Data on site characteristics. Report No 41. 1991.
- Berg, B.; McClaugherty, C.; Johansson, M.B. Chemical changes in decomposing plant litter can be systemized with respect to the litter’s initial chemical composition. Reports from the departments in Forest Ecology and Forest Soils. Uppsala: Swedish University of Agricultural Sciences, 85. Report 74., 1997.
- Berg, B.; Berg, M.P.; Bottner, P.; Box, E.; Breymeyer, A.; Calvo de Anta, R.; Couteaux, M.; Gallardo, A.; Escudero, A.; Kratz, W.; Madeira, M.; Mälkönen, E.; Meentemeyer, V.; Munoz, F.; Piussi, P.; Remacle, J.; Virzo De Santo, A. Litter mass loss rates in pine forests of Europe and eastern United States: Some relationships with climate and litter quality. Biogeochemistry 1993, 20, 127–159. [Google Scholar] [CrossRef]
- Berg, B.; Booltink, H.G.W.; Breymeyer, A.; Ewertsson, A.; Gallardo, A.; Holm, B.; Johansson, M.-B.; Koivuoja, S.; Meentemeyer, V.; Nyman, P.; Olofsson, J.; Pettersson, A.-S.; Reurslag, A.; Staaf, H.; Staaf, I.; Uba, L. Data on needle litter decomposition and soil climate as well as site characteristics for some coniferous forest sites. 2nd ed. Uppsala: Swedish University of Agricultural Sciences. Section 2. Data on needle litter decomposition. Department of Ecology and Environmental Research. Report No 42. REP 43, 1991.
- Olson, J.S. Energy storage and the balance of producers and decomposers in ecological systems. Ecology 1963, 44, 322–331. [Google Scholar] [CrossRef]
- Wieder, R.K.; Lang, G.E. (1982) A critique of the analytical methods used in examining decomposition data obtained from litter bags. Ecology 1982, 63, 1636–1642. [Google Scholar] [CrossRef]
- Berg, B.; Ekbohm, G. Littermass–loss rates and decomposition patterns in some needle and leaf litter types. Long–term decomposition in a Scots pine forest. VII. Can. J. Bot. 1991, 69, 1449–1456. [Google Scholar] [CrossRef]
- Fry, B. Stable isotope ecology. Springer:New York, NY, 2006.
- Fernandez, I.; Cadisch, G. Discrimination against 13C during degradation of simple and complex substrates by two white rot fungi. Rapid Commun. Mass. Spectrom. 2003, 17, 2614–2620. [Google Scholar] [CrossRef]
- Hobbie, E.A.; Macko, S.A.; Shugart, H.H. Insights into nitrogen and carbon dynamics of ectomycorrhizal and saprotrophic fungi from isotopic evidence. Oecologia 1999, 118, 353–60. [Google Scholar] [CrossRef] [PubMed]
- Boström, B.; Comstedt, D.; Ekblad, A. Isotope fractionation and 13 C enrichment in soil profiles during the decomposition of soil organic matter. Oecologia, 2007, 153, 89–98. [Google Scholar] [CrossRef] [PubMed]
- Blair, N.E.A.L.; Leu, A.; Olsen, J.; Kwong, E.; Des Marais, D. Carbon isotopic fractionation in heterotrophic microbial metabolism. App. Env. Microbiol. 1985, 50, 996–1001. [Google Scholar] [CrossRef]
- Werth, M.; Kuzyakov, Y. 13C fractionation at the root–microorganisms–soil interface: a review and outlook for partitioning studies. Soil Biol. Biochem. 2010, 42, 1372–1384. [Google Scholar] [CrossRef]
- Mary, B.; Mariotti, A.; Morel, J.L. Use of 13C variations at natural abundance for studying the biodegradation of root mucilage, roots and glucose in soil. Soil Biol. Biochem 1992, 24, 1065–1072. [Google Scholar] [CrossRef]
- Wu, J.; Zhang, Q.; Yang, F.; Zhang, Q.; Cheng, X. Does short–term litter input manipulation affect soil respiration and its carbon–isotopic signature in a coniferous forest ecosystem of central China? Appl. Soil Ecol. 2017, 113, 45–53. [Google Scholar] [CrossRef]
- Šantrůčková, H.; Bird, M.I.; Lloyd, J. Microbial processes and carbon-isotope fractionation in tropical and temperate grassland soils. Funct. Ecol 2000, 14, 108–114. [Google Scholar] [CrossRef]
- Bragazza, L.; Iacumin, P. Seasonal variation in carbon isotopic composition of bog plant litter during 3 years of field decomposition. Biol. Fertil. Soils 2009, 46, 73–77. [Google Scholar] [CrossRef]
- Benner, R.; Fogel, M.L.; Sprague, E.K.; Hodson, R.E. Depletion of 13C in lignin and its implications for stable carbon isotope studies. Nature 1987, 329, 708–710. [Google Scholar] [CrossRef]
- Hall, S.J.; Huang, W.; Timokhin, V.I.; Hammel, K.E. Lignin lags, leads, or limits the decomposition of litter and soil organic carbon. Ecology 2020, 101, e3113. [Google Scholar] [CrossRef] [PubMed]
- Berg, B.; Staaf, H. Decomposition rate and chemical changes of Scots pine needle litter. II. Influence of chemical composition. Ecol. Bullet. 1980, 373–390. [Google Scholar]
- Hobbie, E.A.; Macko, S.A.; Williams, M. Correlations between foliar δ15N and nitrogen concentrations may indicate plantmycorrhizal interactions. Oecologia 2000, 122, 273–83. [Google Scholar] [CrossRef]
- Knorr, M.; Frey, S.D.; Curtis, P.S. Nitrogen additions and litter decomposition: A meta–analysis. Ecology 2005, 86, 3252–3257. [Google Scholar] [CrossRef]
- Talbot, J.M.; Treseder, K.K. Interactions among lignin, cellulose, and nitrogen drive litter chemistry–decay relationships. Ecology 2012, 93, 345–354. [Google Scholar] [CrossRef]
- Chen, J.; Luo, Y.; van Groenigen, K.J.; Hungate, B.A.; Cao, J.; Zhou, X.; Wang, R. A keystone microbial enzyme for nitrogen control of soil carbon storage. Sci. Adv. 2018; 4, eaaq1689. [Google Scholar]
- Berg, B.; Söderström, B. Fungal biomass and nitrogen in decomposing Scots pine needle litter. Soil Biol. Biochem. 1979, 11, 339–341. [Google Scholar] [CrossRef]
- Myers, R.J.K.; Palm, C.A.; Cuevas, E.; Gunatilleke, I.U.N.; Brossard, M. The synchronization of nutrient mineralization and plant nutrient demand. In, Woomer PL, Swift MJ (eds.) The biological management of tropical soil fertility. John Wiley and Sons, UK, 1994; pp 81–116.
- Kramer, M.G.; Sollins, P.; Sletten, R.S.; Swart, P.K. N isotope fractionation and measures of organic matter alteration during decomposition. Ecology 2003, 84, 2021–2025. [Google Scholar] [CrossRef]
- Hogberg, M.N.; Hogberg, P.; Myrold, D.D. Is microbial community composition in boreal forest soils determined by pH, C–to–N ratio, the trees, or all three? Oecologia 2007, 150, 590–601. [Google Scholar] [CrossRef] [PubMed]
Figure 1.
Initial and final concentrations of C, N, and AUR as well as the ratios for C/N and AUR/N. Their C (δ13C) and N (δ15N) isotopic compositions are given. NSL and SPL are Norway spruce and Scots pine litter types, respectively. The subscript i and f denotes initial and final litters. AML is accumulated mass loss, and AUR is acid unhydrolyzable residue.
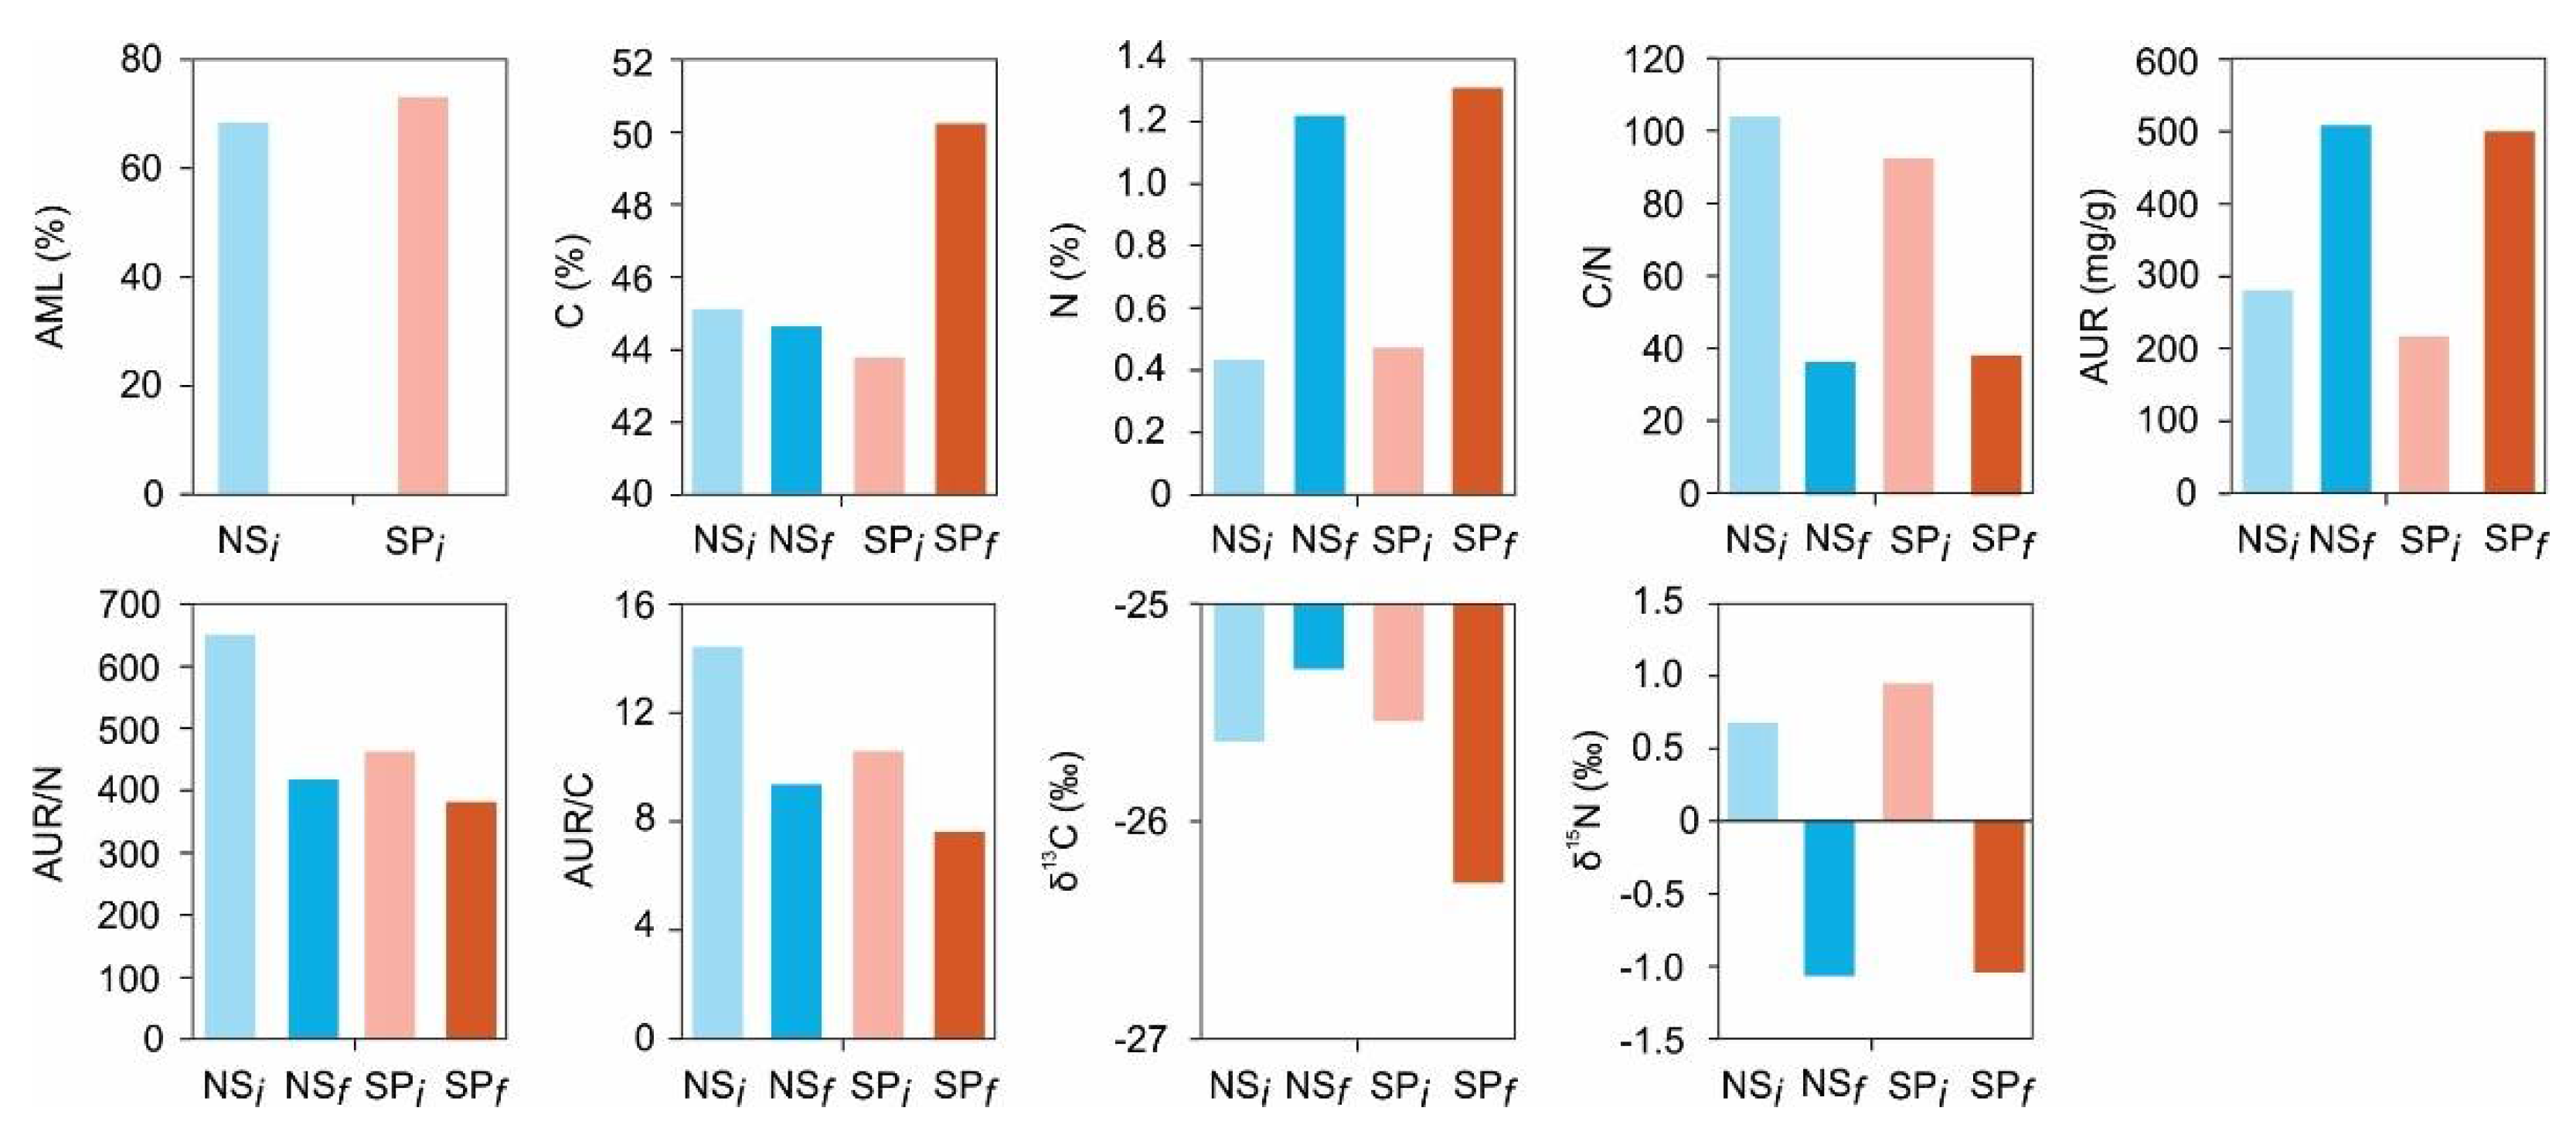
Figure 2.
Accumulated mass loss (%) plotted against time (months) in biplot (a), and decomposition rate constant (ks) vs time in biplot (b). Decomposition rate constants (ks) for carbon vs time (c). Rate constants (ks) for loss of N (d) and rate constants (ks) for loss of AUR. Litters were needle litter of Norway spruce (circle) and Scots pine (square).
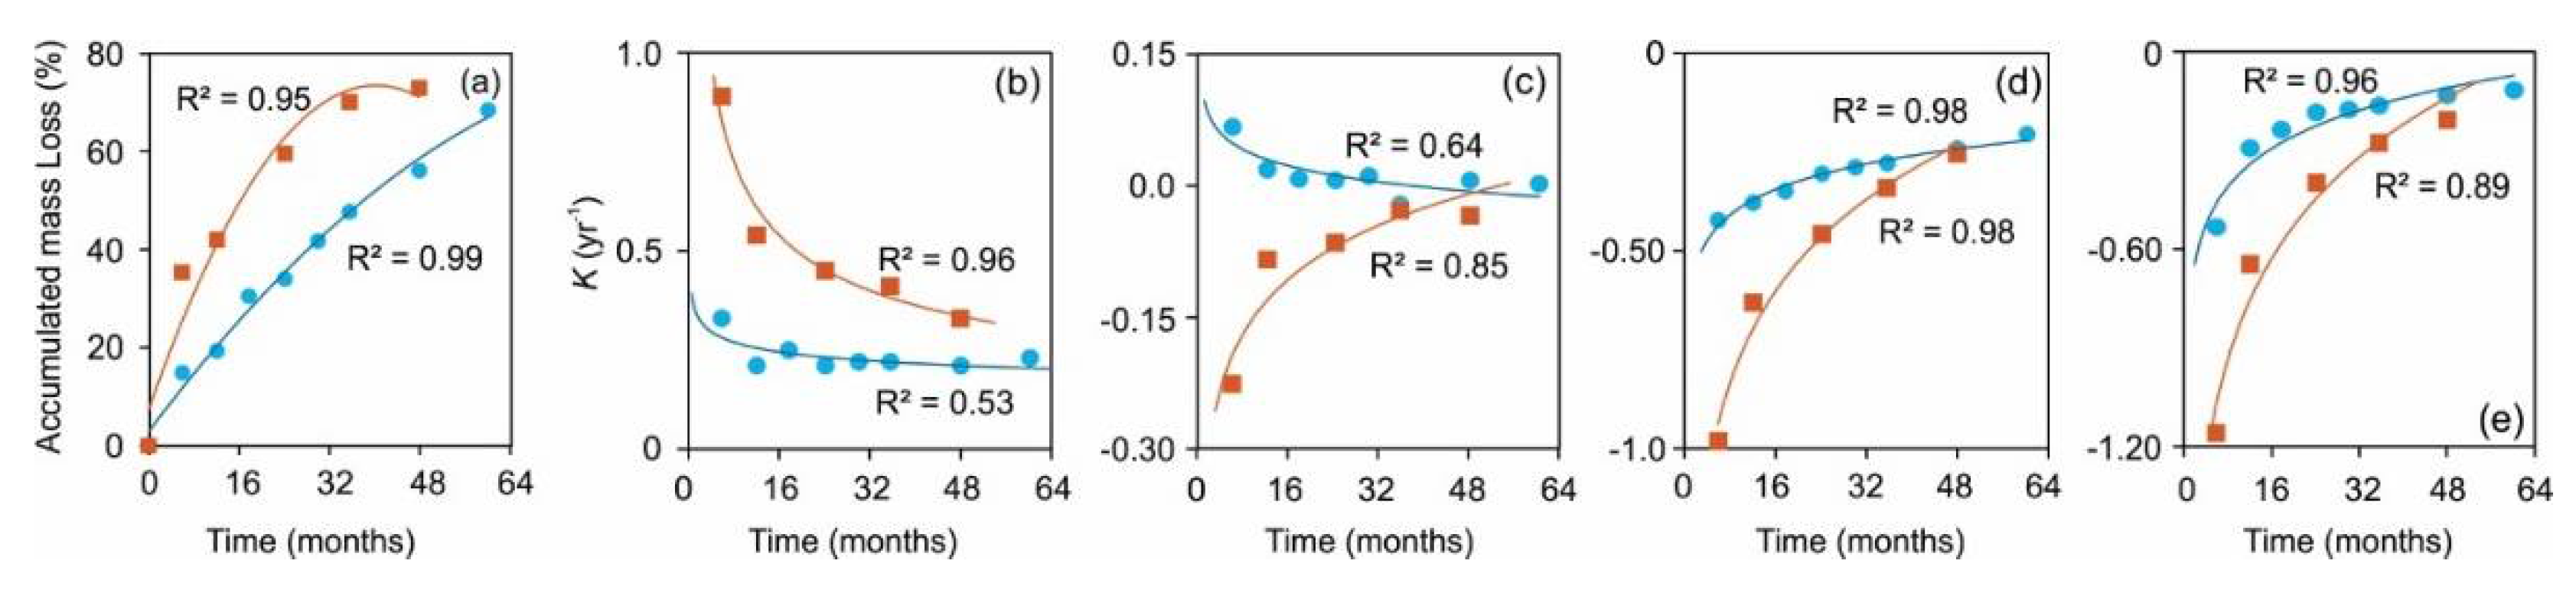
Figure 3.
Carbon (δ13C) (a) and nitrogen δ15N (b) over time and their decay rates (kyr-1) change dynamics through time (c and d), respectively during in situ decomposition of local needle litters of Norway spruce (circle) and Scots pine (square).
Figure 3.
Carbon (δ13C) (a) and nitrogen δ15N (b) over time and their decay rates (kyr-1) change dynamics through time (c and d), respectively during in situ decomposition of local needle litters of Norway spruce (circle) and Scots pine (square).
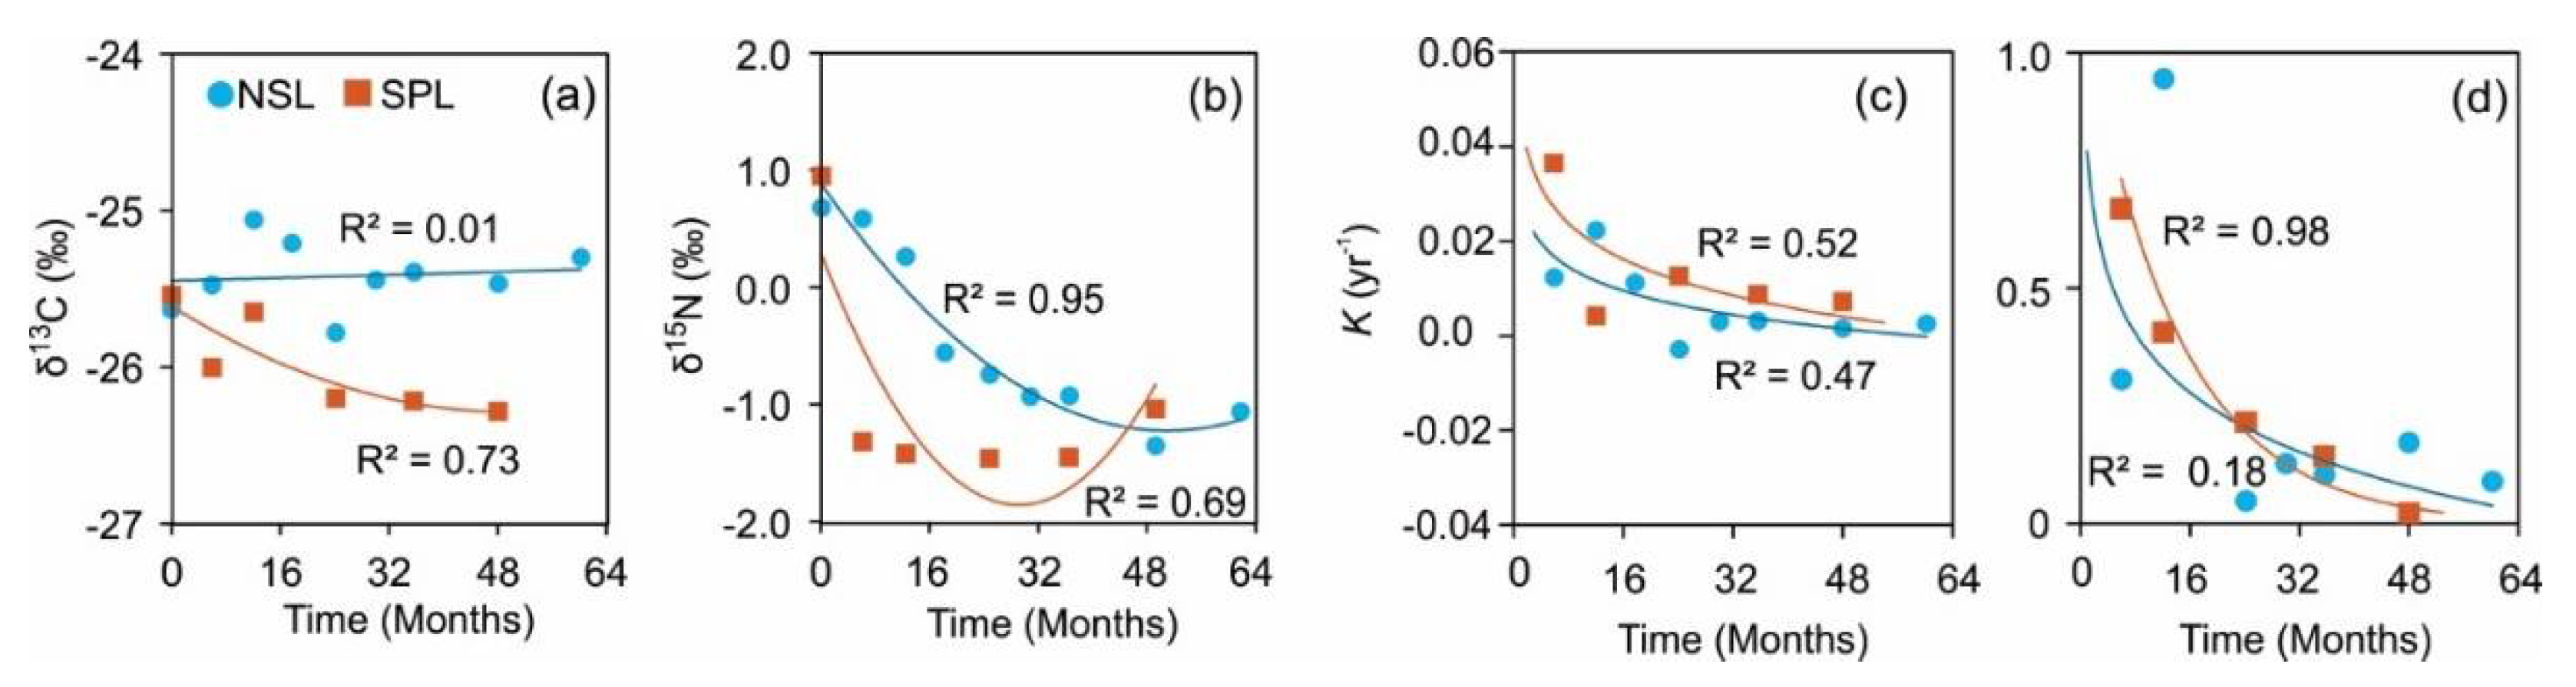
Figure 4.
Fitted regression plots between change in δ13C (‰) with accumulated mass loss (%) and change in C, N and AUR concentrations as well as the ratios C/N, AUR/C and AUR/N as predictor variables for decomposing litter of local Norway spruce (NSL) and Scots pine (SPL) in hemi-boreal forest stands, site Grensholm Castle, Southern Sweden.
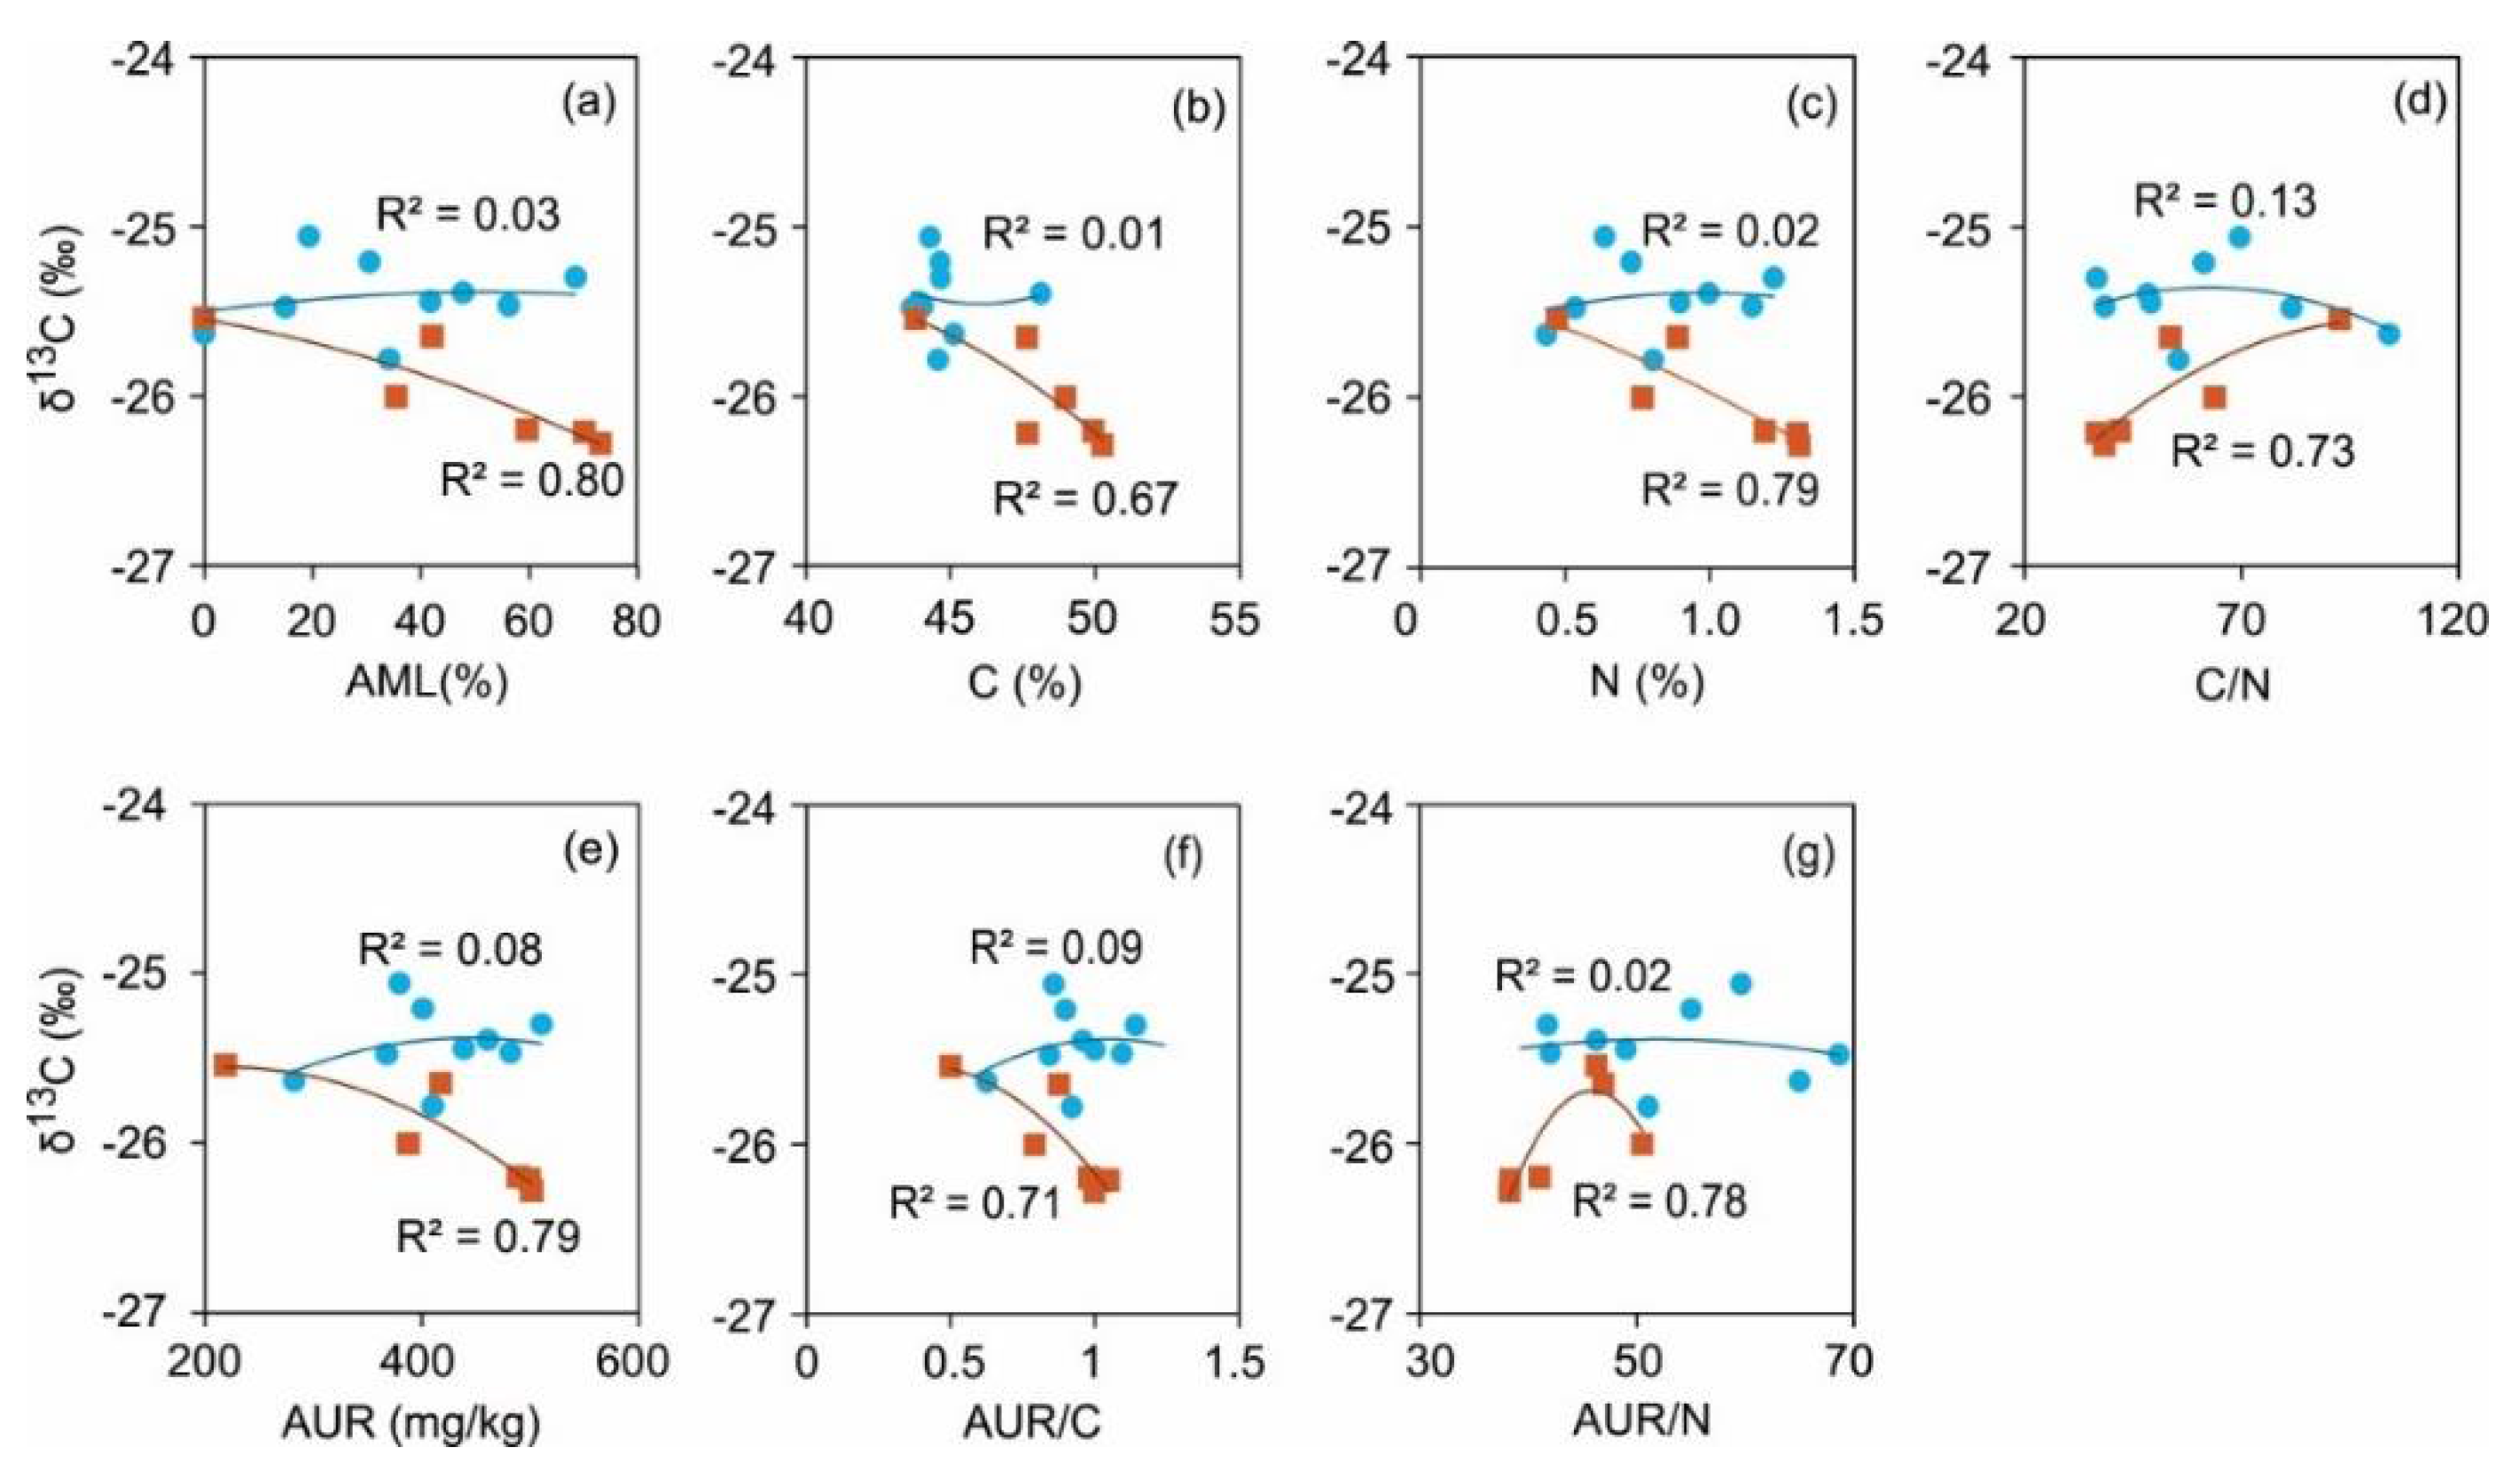
Figure 5.
Fitted plots of regressions between δ15N (‰) change and accumulated mass loss (%) and other predictor variables for decomposing litter of local Norway spruce (NSL) and Scots pine (SPL) in hemi-boreal forest stands, site Grensholm Castle, Southern Sweden.
Figure 5.
Fitted plots of regressions between δ15N (‰) change and accumulated mass loss (%) and other predictor variables for decomposing litter of local Norway spruce (NSL) and Scots pine (SPL) in hemi-boreal forest stands, site Grensholm Castle, Southern Sweden.
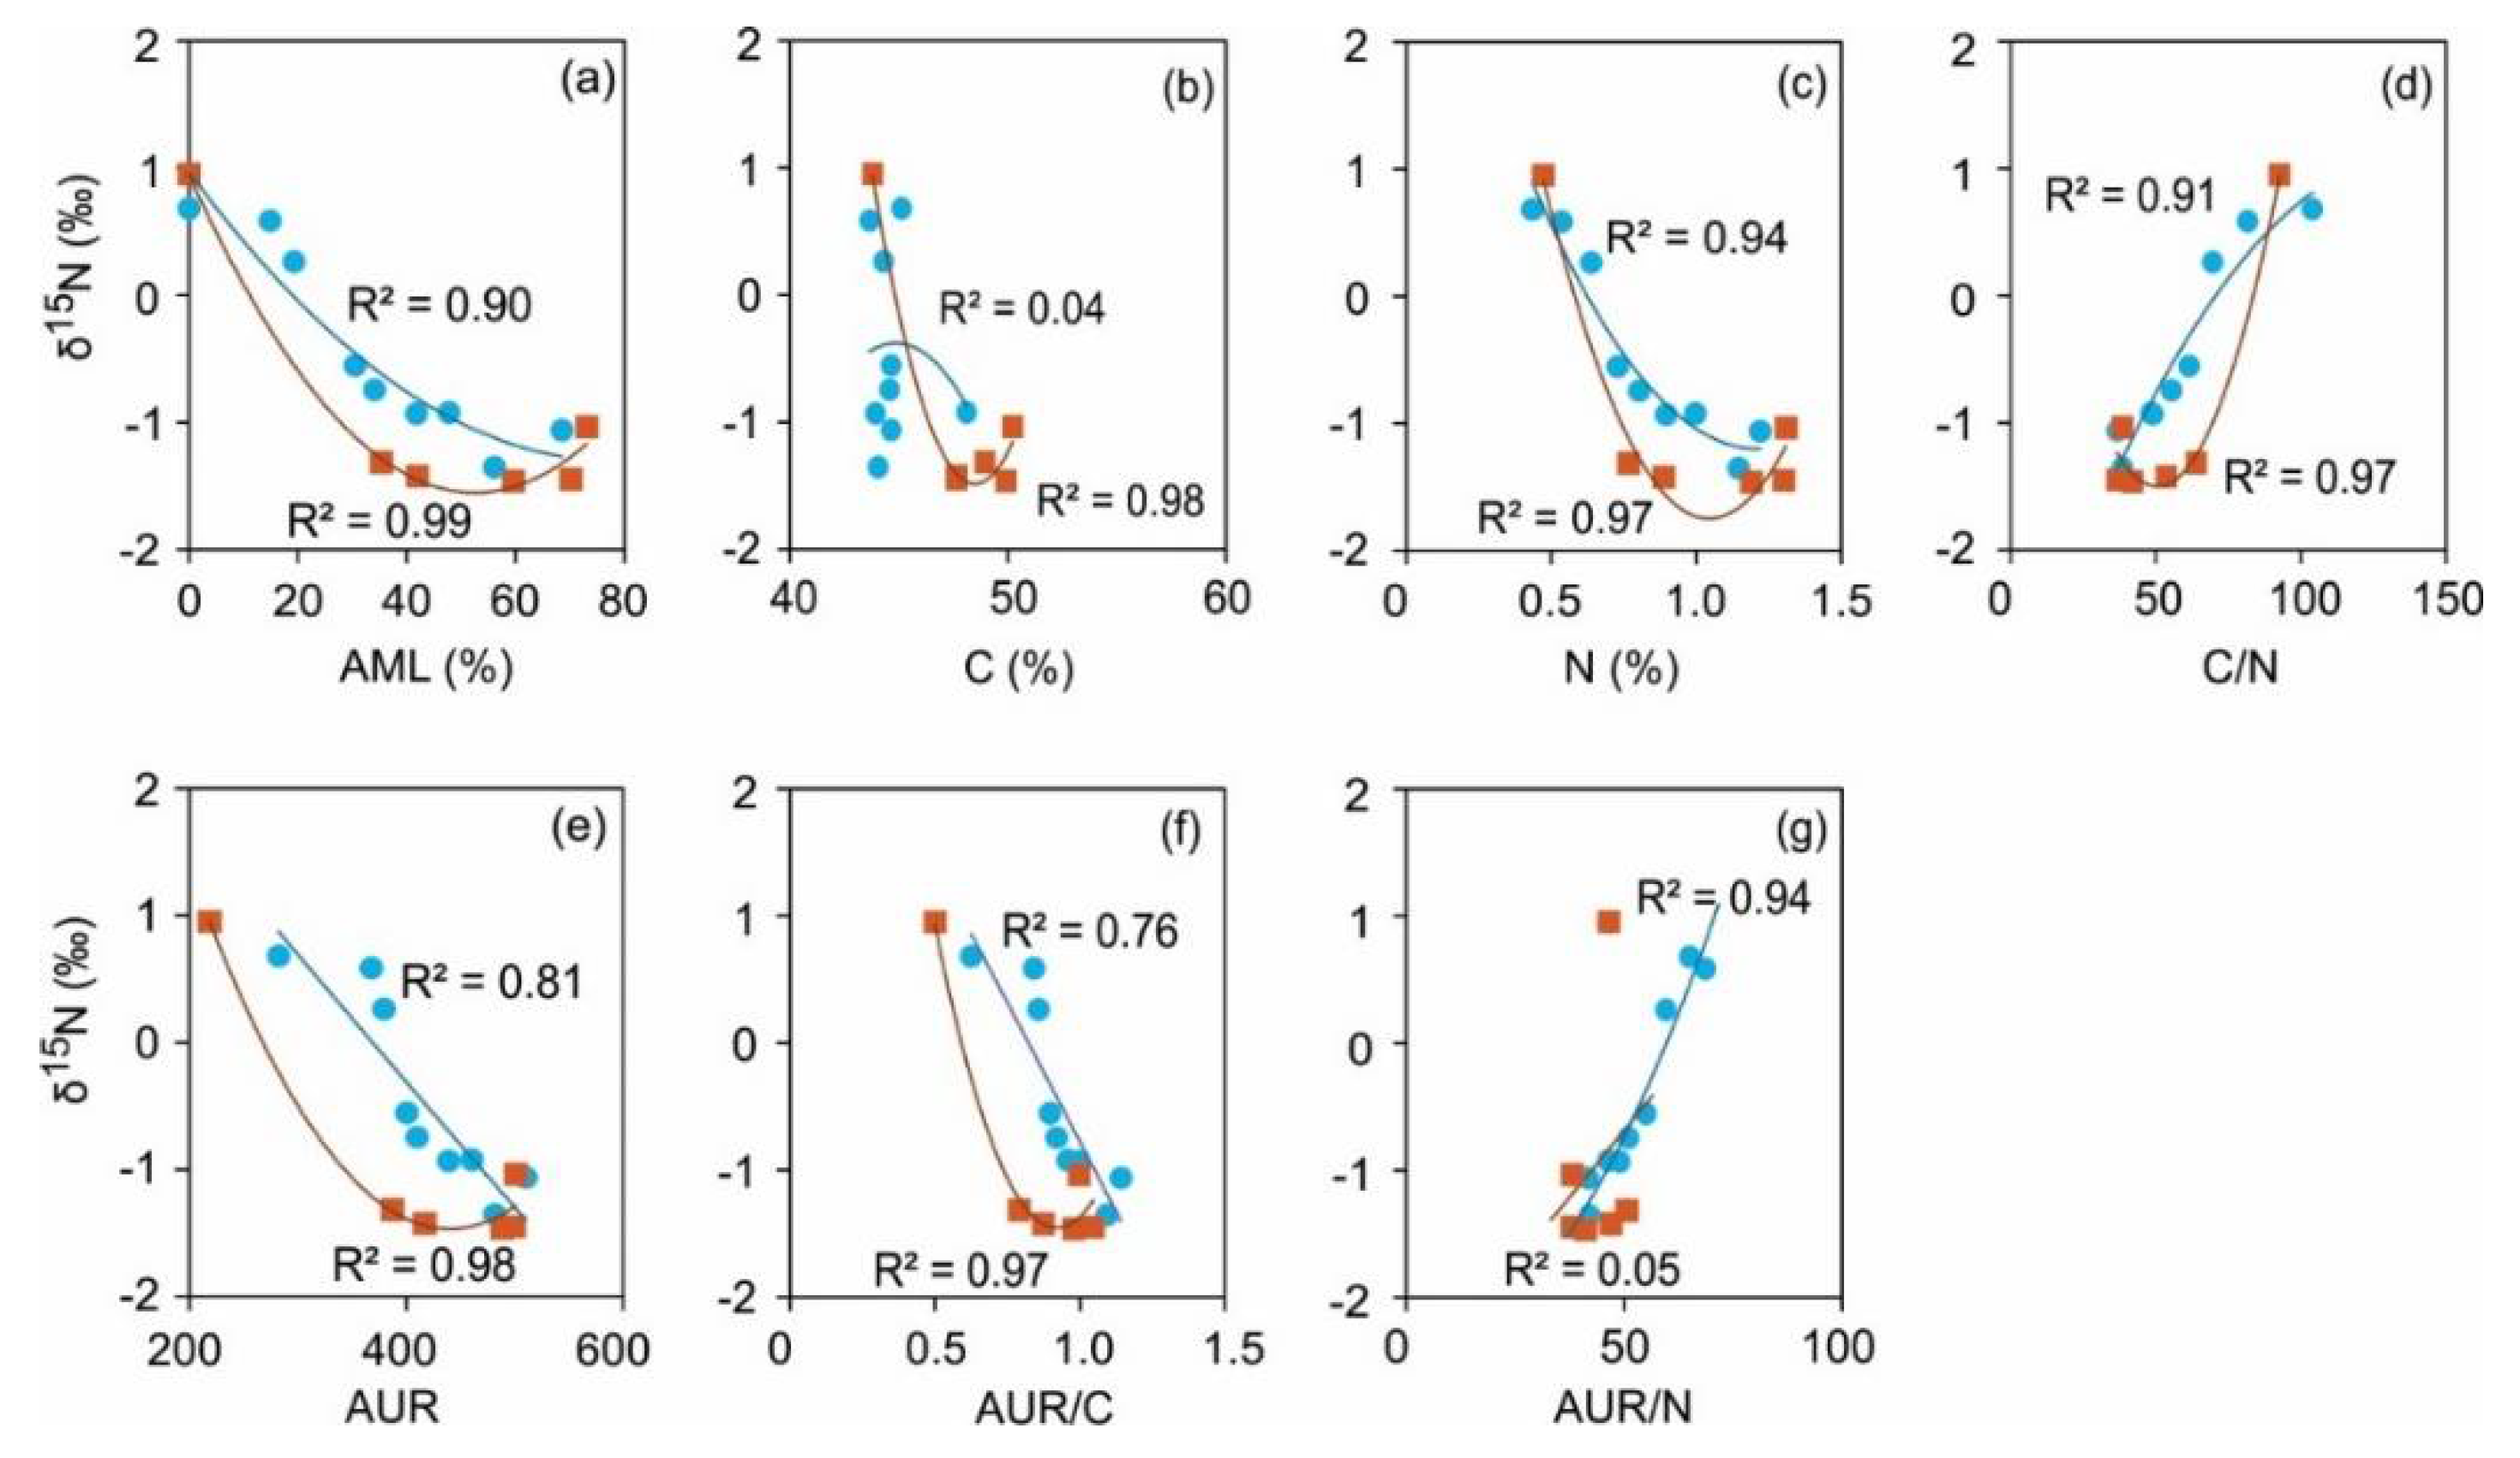

Table 1.
Overall annual decay rate constant (ksyr-1) for needle litters of Norway spruce (NSL) and Scots pine (SPL). The ks was calculated for the whole in situ decomposition period. The Δ is the difference between initial and final litter isotopic ratios (in per mil ‰).
Table 1.
Overall annual decay rate constant (ksyr-1) for needle litters of Norway spruce (NSL) and Scots pine (SPL). The ks was calculated for the whole in situ decomposition period. The Δ is the difference between initial and final litter isotopic ratios (in per mil ‰).
| NSL | SPL | |
| ksyr-1 | ||
| AML | 0.22 | 0.32 |
| C | 0.002 | -0.031 |
| N | -0.21 | -0.25 |
| AUR | -0.12 | -0.21 |
| δ13C | 0.003 | -0.007 |
| δ15N | 0.09 | 0.02 |
| Δ(‰) | ||
| Δ13C (‰) | 0.33 | -0.74 |
| Δ15N (‰) | -1.74 | -1.99 |
Table 2.
Correlation matrix showing Pearson’s correlation coefficients (R) of decay rate (ks) with other variables for decomposing litter of local Norway spruce (NSL) and Scots pine (SPL) in hemi-boreal forest stands, site Grensholm Castle, Southern Sweden. Superscript asterisk (*) next to correlation coefficient show significant correlation at P-value ≤0.05). AML, C, N and AUR are accumulated mass loss, carbon, nitrogen and acid unhydrolyzable residue.
| AML | C | N | AUR | C/N | AUR/N | |
| ksNSL | -0.49 | -0.27 | -0.54 | -0.48 | 0.67* | 0.72* |
| ksSPL | -0.89* | -0.18 | -0.90* | -0.91* | 0.94* | 0.92* |
Disclaimer/Publisher’s Note: The statements, opinions and data contained in all publications are solely those of the individual author(s) and contributor(s) and not of MDPI and/or the editor(s). MDPI and/or the editor(s) disclaim responsibility for any injury to people or property resulting from any ideas, methods, instructions or products referred to in the content. |
© 2024 by the authors. Licensee MDPI, Basel, Switzerland. This article is an open access article distributed under the terms and conditions of the Creative Commons Attribution (CC BY) license (http://creativecommons.org/licenses/by/4.0/).
Copyright: This open access article is published under a Creative Commons CC BY 4.0 license, which permit the free download, distribution, and reuse, provided that the author and preprint are cited in any reuse.


